Geopolitics
What was initially an uncertain rise in U.S.-China trade tension has now become much more significant in both the depth and breadth of the economic battle between these two nations. Since President Trump went forward with his second round of tariffs - 10%…
China's greatest strength in winning friends is that its domestic demand remains relatively robust. China can substitute away from the U.S. by shifting to other developed markets. Emerging markets are becoming more connected with China and less so with the…
Our Geopolitical Strategy service thinks China could respond to the U.S. “show of force” in two ways: directly or through proxies. The direct response would involve confronting the U.S. military openly and forcefully. Our geopolitical strategists believe…
The U.S. holds shows of force fairly frequently. Over recent decades it has been the third most common type of operation for the U.S. military. However, for most of the past several decades, the U.S. conducted very few operations in the Asia Pacific that did…

Highlights This Special Report was written with our colleagues in BCA Research's Geopolitical Strategy, led by Marko Papic. In it, we explore the evolution of Russia's role in European natural gas markets vis-a-vis the fast-growing U.S. natural gas production and Liquefied Natural Gas (LNG) export capabilities. So what? Rise of U.S. LNG exports to Europe will benefit gas producers and LNG merchants with access to U.S. supplies. Russia will grow ever-more dependent on China, while retaining a market share in Europe. Why? Exports of U.S. LNG to Europe are set to surge over the next decade. Russia will not be completely displaced, as American LNG fills the gap in European natural gas production. But U.S. LNG will lead to the end of oil-indexing of long-term natural gas contracts, hurting Russian state coffers on the margin... ... And forcing Russia further into the arms of China. Also... A tighter Trans-Atlantic partnership - soon to involve a deep energy relationship - and a budding Sino-Russian alliance will further divide the world into two camps, producing a Bifurcated Capitalism that may define this century. Feature Russia's obituaries have been written and re-written many times since the end of the Cold War. And yet, Moscow continues to play an outsized role in global affairs that is belied by quantitative measures of its power (Chart 1). Chart 1From Bipolarity To Multipolarity
From Bipolarity To Multipolarity
From Bipolarity To Multipolarity
How so? The fall of the Soviet Union was precipitated by the country's sclerotic managed economy, its failure to escape the middle income trap, and its disastrous military campaign in Afghanistan. But before it died, the Soviet Union sowed the seeds for its resurrection. The $100-130 billion (in 2018 USD) spent on building a natural gas pipeline infrastructure into Western Europe was the elixir that revived Russian power. Just as Russia emerged from its lost decade in the 1990s, it caught a break. Western Europe's natural gas demand rose. At the same time, China's epic industrialization created a once-in-a-century commodity bull market (Chart 2). With demand for its resources buoyed on both sides of the Eurasian landmass, Russia once again saw revenue fill its coffers (Chart 3). With material wealth came the ability to rebuild its hard power and put up a fight against an expansionary Western alliance encroaching on its sphere of influence. Chart 2Chinese Industrialization...
Chinese Industrialization...
Chinese Industrialization...
Chart 3...Filled Russian Coffers
...Filled Russian Coffers
...Filled Russian Coffers
Is there an existential risk to Russia's business model looming in the form of surging U.S. liquefied natural gas (LNG) export capability (Chart 4)? Not yet. Thanks to a massive drop in European domestic production, U.S. LNG exports will fill a growing supply gap, but will not replace Russia's natural gas exports in the medium term. All the same, the once-lucrative European market no longer holds as much promise as it once did with the arrival of the U.S. LNG supplies. Chart 4U.S. LNG Exports Will Surge
American Pipes, Russian Gripes?
American Pipes, Russian Gripes?
In order for Russian natural gas exports to Europe to be permanently displaced, Europe would have to build out new LNG capacity beyond 2020, restart domestic production by incentivizing shale development, or turn to alternative energy sources with large base-load potential, such as nuclear power. None of these are on the horizon. With ~15% of its government revenue sourced from natural gas sales, Russia is as much of a one-trick pony as there is in macroeconomics. While we do not foresee that pony heading off to the glue factory, Russia will face some considerable risks in the future, starting with the shift away from the rigid oil-indexed contracts it favors (which lock the price of natural gas to that of oil). As such, the risk to Russia is not that it loses market share in Europe's energy market, but that this market share yields much smaller income in the future, as gas-on-gas pricing competition increases. The U.S. Shale Revolution Goes Global Our commodity team has presented a compelling case for why investors should expect an increase in U.S. LNG exports beyond the current EIA forecast.1 Increasing volumes of associated natural gas production in the Permian Basin in west Texas, which will have to be transported from the basin so as not to curtail oil production, will drive a large part of the expected growth in LNG exports. Our commodity team expects that a major LNG export center will be developed in south Texas, in Corpus Christi, over the next five years, just as the U.S. surpasses 10 Bcf/d of exports in the middle of the next decade.2 At the same time, global LNG demand is expected to rise at an impressive 1.7% annual rate to 2040 (Chart 5). A few key markets will lead this trend (Chart 6). Based on BCA Commodity & Energy Strategy calculations, world LNG export capacity is expected to go from 48 Bcf/d in 2017 to 61 Bcf/d by 2022 (Chart 7). The majority of the new capacity (53%) will come from the U.S., while 18% will come from Australia and 15% from Russia. Chart 5Global LNG Demand Growth Likely Outpaces Current Expectations
American Pipes, Russian Gripes?
American Pipes, Russian Gripes?
Chart 6Supply - Demand Imbalances Will Fuel LNG Demand Globally
American Pipes, Russian Gripes?
American Pipes, Russian Gripes?
Chart 7LNG Export Capacity Growth
American Pipes, Russian Gripes?
American Pipes, Russian Gripes?
The pickup in Australian export capacity is already impressive. While being a relatively small natural gas producer - the eighth largest, accounting for 3% of world output - it has already become the second largest LNG exporting country in the world with over 7.5 Bcf/d of exports. The bulk of new liquefaction facilities will be operational in 2019. Most of Australia's LNG trade lies with Asia, given its geography. The U.S., whose LNG export terminals will be located in the Gulf of Mexico, only has 3 Bcf/d of liquefaction capacity today. Most of its LNG exports also go to Asia (Table 1), but that may change as the current capacity expansion will see exports rise to just over 9 Bcf/d in 2020.3 Furthermore, American gas will compete with surging Australian LNG exports and a build-up of Russian pipeline export capacity to China, which is set to start delivering gas to the country in 2019. Table 1U.S. LNG Exports By Country
American Pipes, Russian Gripes?
American Pipes, Russian Gripes?
Europe, on the other hand, has massive regasification capacity slack and thus requires only minimal capex to begin importing large volumes of U.S. LNG. Europe has 23 Bcf/d regasification capacity, with a very low utilization rate of just 27%. This means that it has ~ 16 Bcf/d capacity available, more than enough to absorb all of expectant U.S. ~ 6-7 Bcf/d exports in the next couple of years.4 Bottom Line: The U.S. shale revolution is going global, with U.S. LNG exports set to surge over the next 5-10 years. While some of that capacity will find its way to Asia, those markets will also be flooded with Australian LNG and Russian piped natural gas. Europe, on the other hand, is filing just a quarter of its LNG import capacity, making a Trans-Atlantic gas alliance a match made in heaven. From Cold War To Gas War? If half of the currently proposed, pre-FID, LNG export projects were built in the U.S., American capacity would grow to potentially ~26 Bcf/d by 2030. Europe would need only one or two extra LNG import terminals to build over the next two decades to absorb this volume, as its current capacity is able to import nearly every molecule coming out of North America (Chart 8). Chart 8Europe Has Plenty Of Regasification Capacity
American Pipes, Russian Gripes?
American Pipes, Russian Gripes?
Will this new U.S. LNG displace Europe's imports of Russian natural gas? The short answer is no. By 2030, Europe's supply-gap (i.e. domestic supply minus domestic consumption) is estimated to reach 36 Bcf/d. The U.S. could cover a large part of this gap if only half of the proposed pre-FID projects are constructed. However, if Europe's demand remains stable over this period, Europe will still import roughly 20 Bcf/d of Russian natural gas, which in 2017 amounted to 35% of Europe's natural gas consumption. If the U.S. fills 100% of the increase in Europe's supply-gap, it means new Russian natural gas production (the IEA and BP expect Russian production to keep increasing until 2030) will not be sent to Europe. Hence, even if it does not displace old Russian exports, it will limit Russia's ability to export its new natural gas. Europe's demand for natural gas is not likely to be stable. Despite sclerotic growth and generally weak population growth, European governments have tried to incentivize natural gas consumption due to its low emission of CO2 (Table 2). As such, investors should expect further displacement of coal and nuclear power generation in favor of natural gas. Table 2Natgas Emits Less CO2
American Pipes, Russian Gripes?
American Pipes, Russian Gripes?
Thus, U.S. exports will simply replace Europe's domestic production, which is facing considerable declines. The U.K. North Sea production will decrease 5% annually due to the lack of capex and the large number of fields reaching a mature state. Meanwhile, the Netherlands is phasing-out its Groningen field by 2030. Finally, Norwegian gas production is likely to stagnate after reaching record levels in 2017. The second reason that Europe will not be able to sever its relationship with Russia is that its LNG import terminals are largely located in countries that are not massively dependent on Russian imports (Map 1). The two major LNG terminals serving Central and Eastern Europe are the Swinoujscie terminal in Poland - finished in 2015 - and the Adria project in Croatia, to be completed in 2020. Map 1European Natural Gas Geography
American Pipes, Russian Gripes?
American Pipes, Russian Gripes?
The Polish LNG terminal will do little to alleviate the dependency of countries further East - Belarus, Ukraine, Bulgaria, Hungary, and Slovakia - from Russia as it currently satisfies only one third of Poland's natural gas needs, and is projected to reach 50% by 2022 once the expansion is completed. This could significantly cut Russian exports to Poland, but not completely end them.5 The Croatian LNG terminal will likely make a very small dent in the overall reliance of the Balkans on Russian natural gas, as once it satisfied Croatian demand, little will be left over for the rest of the region. Beyond these two terminals, Europe will have to invest in pipeline infrastructure in order to reverse the flow of pipelines currently taking gas from the East to the West. At some point in the distant future, we could see a scenario where American natural gas flows even through Cold War era, Soviet-built pipelines deep into Central and Eastern Europe. But given the steep declines in West European natural gas production, this day will come after 2030. Bottom Line: Dreams of displacing Russian natural gas in Europe with American are overstated. European imports of U.S. LNG are likely to skyrocket, but that will merely replace the massive decline in West European and North Sea production. What does that mean for geopolitics? It means that Russia will continue to have a role to play in Europe, but its share of European imports will decline. As such, Europe will have options. If it builds more LNG import terminals, it could expand those options beyond American LNG imports. However, Russian geopolitical influence will not be displaced completely. Russian Coffers Will Take A Hit Although Russian natural gas will continue to course through Europe's veins, its state coffers are nonetheless going to take a hit. European governments are actively diversifying away from Russia via U.S. LNG imports, and buyers generally are shortening the tenor of contracts as they seek more flexible pricing.6 The growth in the global LNG market, fueled by surging U.S. production, will ultimately allow Asian and European markets to diversify away from oil-indexed pricing - which tends to be priced higher than gas-on-gas pricing - and expand access to U.S. supplies.7 The EU has co-financed or committed to co-finance LNG infrastructure projects valued at ~ 640mm euros to secure U.S. LNG. Ultimately, as more and more U.S. LNG moves toward Europe, markets will move toward short- and long-term contracts priced in USD/MMBtu (indexed to Henry Hub, LA, prices), much like Brent crude oil priced in USD/bbl. European markets have already seen this shift, as illustrated in Chart 9. Chart 9European Gas-On-Gas Pricing Is Rising
American Pipes, Russian Gripes?
American Pipes, Russian Gripes?
The totality of U.S. export prices is determined by gas-on-gas pricing - i.e., gas priced in USD/MMBtu as a function of gas supply-demand fundamentals. These contracts are without the restrictions found in many oil-indexed contracts. In the U.S., the presence of a deep futures market delivering natural gas to Henry Hub, LA, allows flexible long-term financing and short- and long-term contracting that can be hedged by buyers and sellers. According to Royal Dutch Shell, the spot LNG market doubled from 2010 to 2017, accounting for ~ 25% of all transactions, most of it due to the prodigious increase in U.S. LNG supply. While in Europe the share of LNG spot and short-term deals is small relative to the overall market, it is growing (Chart 10). With U.S. LNG volumes becoming increasingly available in Europe, market participants will be inclined to turn to the LNG spot market to buy or sell outside contracted volumes. This will deepen the development of European natgas markets: in any fully developed market, spot trading is followed by forward contracting, then futures trading using contracts settling against a spot price.8 Chart 10Expect More LNG Spot Trading
American Pipes, Russian Gripes?
American Pipes, Russian Gripes?
Russia is a low-cost gas producer in Europe and will be committed to maintaining its market in Europe. However, with U.S. LNG export capacity potentially reaching ~14 Bcf/d by 2025, from ~3 Bcf/d today, it is entirely likely that Russia will find itself in a price war defending existing market share in Europe at lower prices. Its preferred way of doing business, via oil price indexed contracts, will be challenged overnight by a surge in U.S. LNG imports. Bottom line: The EU and its member states are actively diversifying gas supply sources away from Russia via U.S. LNG purchases. This will lower the marginal price of all gas bought and sold in Europe, all else equal, resulting in lower margins for all sellers of gas and better prices for consumers. Ultimately, the European natural gas market will resemble every other fully developed commodity market, operating on razor-thin margins. This means whatever rents were available in this market will be dissipated as competition increases. Investment And Geopolitical Implications The immediate investment implication of these developments is that gas producers and LNG merchants with access to U.S. shale-gas supplies, processing trading, and risk-management capabilities should be favored in this evolving market. Beyond the short term, however, we expect several ongoing geopolitical developments to be ossified by the flood of American LNG steaming towards European shores: Sino-Russian alliance deepens: As Russian natural gas exports to Europe stagnate, its pipeline infrastructure build-out will increase its exports to China to 3.8 Bcf/d by 2019. China will become the growth market for Russian energy producers, deepening the move between the two former Cold War foes to stabilize their relationship. Although it may seem obvious that Russia would retain leverage in such a relationship - given that it can "turn off the lights" to Beijing at whim - we actually think that Beijing will hold all the cards.9 Europe will have an incentive to keep diversifying its natural gas supplies. Meanwhile, Chinese demand is likely to keep growing. As such, China will become Russia's main option for revenue growth. And as the old adage goes, the customer is always right. Trans-Atlantic alliance deepens: Despite the fears that the "Trump Doctrine" would lead to American isolationism - fears that we shared in 2017 - the growing U.S.-European LNG connection will ensure that the Trans-Atlantic alliance - forged 70 years ago in blood - will be saved via brisk energy trade.10 A growing European energy deficit with the U.S. will also resolve - or at least alleviate - the main source of marital problems in the relationship: Europe's trade surplus. Bifurcation of capitalism: A key theme of BCA's Geopolitical Strategy is that the age of globalization will yield to the world's segmentation into spheres of influence.11 A deepening Trans-Atlantic alliance, when combined with a budding Sino-Russian relationship, will lead to a Bifurcated Capitalism system where the Trans-Atlantic West faces off against the Eurasian East. What would such a Bifurcated Capitalism mean for investors? Time will tell. But it may mean that thirty years of global capitalism (1985 to roughly today) may give way to something more common in human history: a world dissected into spheres of influence where flows of capital, goods, and people within spheres are relatively smooth and unencumbered, yet flows between the spheres are heavily impeded. Marko Papic, Senior Vice President Chief Geopolitical Strategist marko@bcaresearch.com Hugo Bélanger, Senior Analyst Commodity & Energy Strategy HugoB@bcaresearch.com Robert P. Ryan, Senior Vice President Commodity & Energy Strategy rryan@bcaresearch.com Pavel Bilyk, Research Associate Commodity & Energy Strategy pavelb@bcaresearch.com 1 Please see "U.S. Set To Disrupt Global LNG Market," published by BCA Research's Commodity & Energy Strategy October 4, 2018. It is available at ces.bcaresearch.com. 2 Please see "The Price of Permian Gas Pipeline Limits," by Stephen Rassenfoss, in the Journal of Petroleum Technology, published July 19, 2018. 3 Following a two-year pause in project Final Investment Decisions (FIDs) from 2016 to 2017, potential FIDs in 2018 and 2019 could increase the U.S. capacity to ~ 14 Bcf/d by 2025. This will make the U.S. the second-largest exporter of LNG in the world, surpassing Australia. This new wave of investment is yet to be finalized. Therefore, final decisions in 2H18 and 2019 will be crucial to determine the medium-term potential of U.S. LNG. 4 Cheniere Energy, the largest U.S. LNG exporter, expects ~ 50% of its exports to go to Europe, according to S&P Global Platts. Please see "US LNG vs Pipeline Gas: European Market Share War?" published April 2017 by Platts. 5 Additionally, if the Baltic Pipe Project, moving gas from Norway to Poland, reaches FID in 2019, this would help Poland diversify its energy supply from Russia, as the country would cover close to all its domestic demand via its production + LNG and new pipeline imports. 6 Please see "US and Russia step up fight to supply Europe's gas," published by the Financial Times August 3, 2017. See also "Russia's gas still a potent weapon," also published by the FT, re the so-called collateral damage suffered by Europe when Russia cut off gas supplies to Ukraine in January 2009. 7 For the EU, supply diversification is a particularly important goal. On July 25, 2018, the European Commission and the U.S. issued a joint statement, in which the EU agreed to import more LNG from the U.S. "to diversify and render its energy supply more secure. The EU and the U.S. will therefore work to facilitate trade in liquefied natural gas," according to a press release issued August 9, 2018, by the Commission. Re Japan's diversification strategy, please see "Feature: US LNG sources fit with Japan's desire for route diversity: minister," published by S&P Global Platts September 27, 2018. 8 Please see Darrell Duffie, Futures Markets (1988), Prentice-Hall; and Jeffrey C. Williams, The Economic Function of Futures Markets (1986), Cambridge University Press. Longer-term deals already are being signed under flexible Henry Hub futures-based indexing terms in the U.S. This is occurring because the U.S. LNG market is able to tap into futures liquidity that supports hedging by natgas producers and consumers. Please see "Vitol-Cheniere Pact Shows Long-Term LNG Deals Aren't Dead," published by bloomberg.com September 17, 2018. 9 Please see BCA Geopolitical Strategy Special Report, "The Embrace Of The Dragon And The Bear," dated April 11, 2014, available at gps.bcaresearch.com. 10 Please see BCA Geopolitical Strategy Weekly Report, "The Trump Doctrine," dated February 1, 2017, available at gps.bcaresearch.com. 11 Please see BCA Geopolitical Strategy Monthly Report, "Multipolarity And Investing," dated April 9, 2014, and Special Report, "The Apex Of Globalization - All Downhill From Here," dated November 12, 2014, available at gps.bcaresearch.com.
Highlights So What? More downside to CNY/USD ahead. Why? The trade war is spilling into political and military arenas, making it harder to de-escalate and negotiate a trade deal. Official U.S. and Chinese rhetoric is increasingly antagonistic, reflecting once-in-a-generation policy shifts toward a new Cold War. Tensions will not subside after the U.S. midterm election - neither the U.S.-Mexico-Canada agreement nor any quick deals with Japan and the EU will speed up U.S.-China negotiations. Feature Clients know that BCA's Geopolitical Strategy has been alarmist on U.S.-China relations since we started as a service in 2012.1 This structural view is based on the long-term decline of U.S. power relative to China and the emergence of global multipolarity.2 However, the rise of General Secretary Xi Jinping in 2012 and President Donald Trump in 2016 have reinforced our view that "Sino-American conflict is more likely than you think."3 This includes military as well as economic conflict. Setting aside the risk of war, a geopolitical "incident" of some kind is becoming increasingly likely. As the two sides engage in brinkmanship, the probability of a miscalculation or provocation rises, and the probability of a grand new compromise falls. For investors, the takeaway is supportive of Geopolitical Strategy's current stance: long U.S. dollar, long U.S. stocks relative to DM, and long DM stocks relative to EM. We expect CNY/USD to fall further as markets question the ability to discount trade uncertainties via tariff rates alone (Chart 1). We continue to recommend a "safe haven" hedge of Swiss bonds and gold. Chart 1CNY/USD Has More Downside
CNY/USD Has More Downside
CNY/USD Has More Downside
The risk is that China could respond to U.S. pressure by stimulating its economy aggressively. So far, the "China Play Index," devised by our Foreign Exchange Strategy, does not signal reflation. Nor do Chinese domestic infrastructure stocks relative to global, which our China Investment Strategy watches closely (Chart 2). Chart 2Small Stimulus Thus Far
Small Stimulus Thus Far
Small Stimulus Thus Far
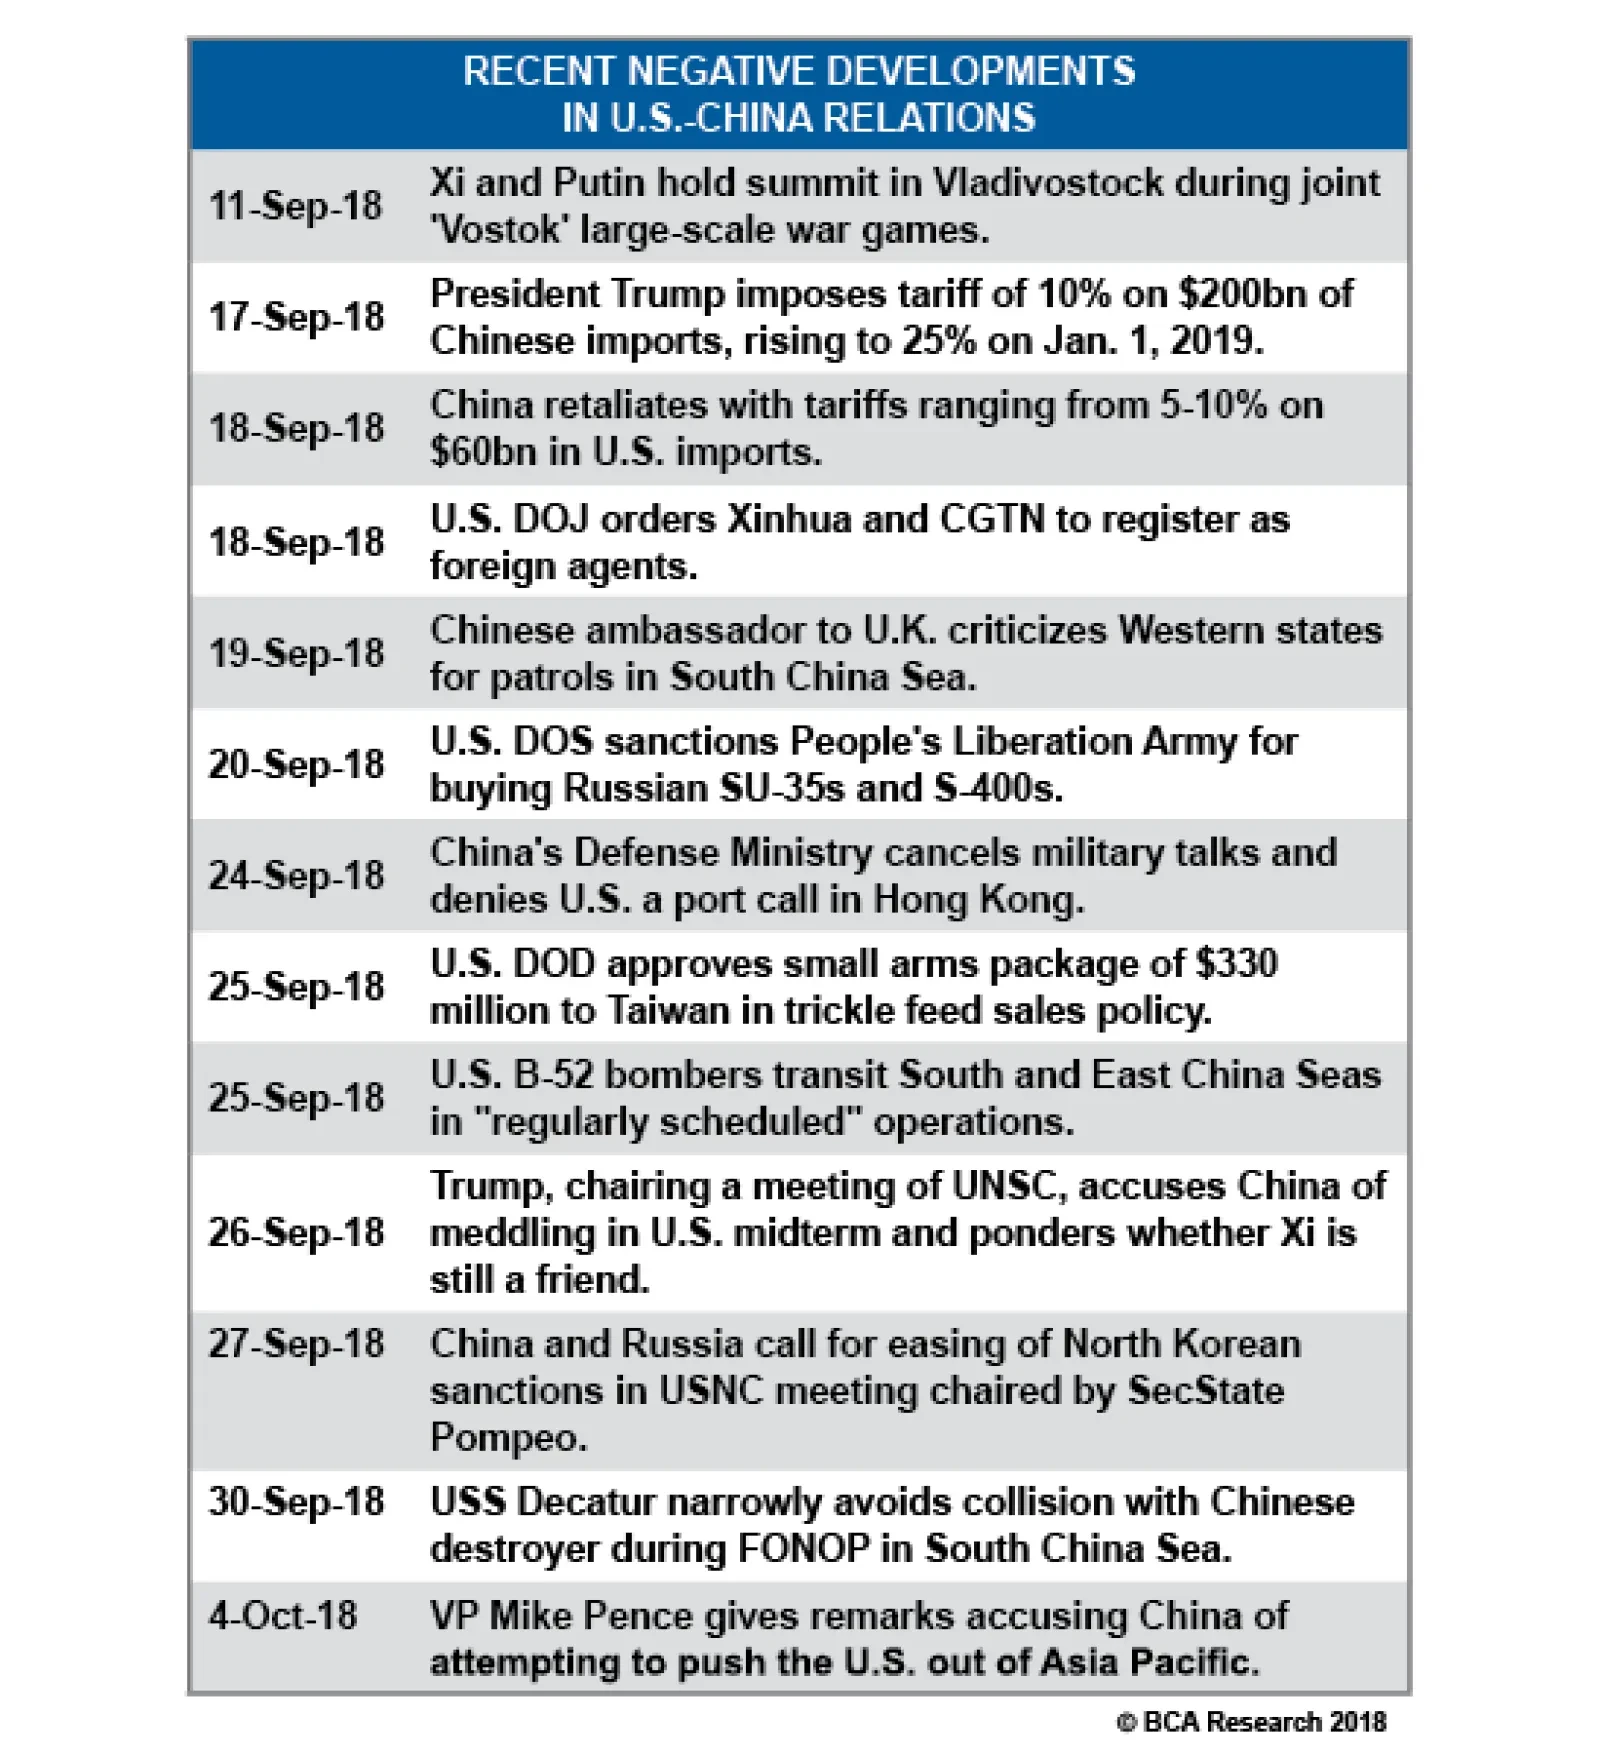
Trade Tensions Are Spilling Over A corollary of our view that U.S.-China tensions are secular and strategic in nature - i.e., not limited to the U.S. trade deficit - is the view that trade tensions will spill over into strategic areas, exacerbating those tensions and generating negative outcomes for investors exposed to the U.S.-China economic partnership.4 This strategic spillover is now taking shape. Since President Trump went forward with the second round of tariffs - 10% on $200 billion worth of imports, to ratchet up to 25% on January 1, 2019 - a series of negative events have taken place in U.S.-China relations (Table 1), culminating in the USS Decatur incident on September 30. Table 1Trade War Spills Into Strategic Areas
A Global Show Of Force?
A Global Show Of Force?
The Decatur, an Arleigh Burke-class guided-missile destroyer, was conducting operations in the Spratly Islands in the South China Sea when it sailed within 12 nautical miles of Gaven and Johnson Reefs, which China claims as sovereign islands. At around 8:30am that Sunday morning, a Luyang-class destroyer from China's People's Liberation Army Navy "approached within 45 yards of Decatur's bow, after which Decatur maneuvered to prevent a collision," according to the U.S. Pacific Fleet spokesman. This was not an unprecedented incident in itself, but it came very close to a collision that could easily have resulted in a shipwreck, a full-blown U.S.-China crisis, and a global risk-off event in financial markets. The Decatur sailed close to the Chinese-claimed reefs because it was conducting a "Freedom of Navigation Operation" (FONOP) to assert the international right of free passage. A major point of contention between China and the U.S. (and between China and most of its neighbors and the western world) is that China claims outright sovereignty over about 80% of the South China Sea, including the Spratly Islands. In July 2016, the International Court of Arbitration ruled that none of the contested rocks and reefs in the sea qualify as islands and hence that they are not entitled to 12 nautical miles of "territorial" sea. China rejects this ruling and asserts sovereignty over the maritime features and much of the sea itself.5 In Diagram 1 we illustrate how a FONOP works based on a similar operation last year. The U.S. has conducted these operations for decades, but in late 2015 it began a series of FONOPs focusing on countering China's excessive claims in the South China Sea.6 This was also a way of opposing China's construction, reclamation, and "militarization" of the reefs under its possession. Diagram 1What Is A 'Freedom Of Navigation Operation'?
A Global Show Of Force?
A Global Show Of Force?
It is not remotely a surprise that this year's trade tensions came close to exploding in the South China Sea. It is the premier geographic location of U.S.-China strategic friction: a hub for international trade; a vital supply route for all major Asian economies; and the primary focus of China's attempt to rewrite global rules (Diagram 2).7 The Appendix updates our list of clashes in this area. Diagram 2South China Sea As Traffic Roundabout
A Global Show Of Force?
A Global Show Of Force?
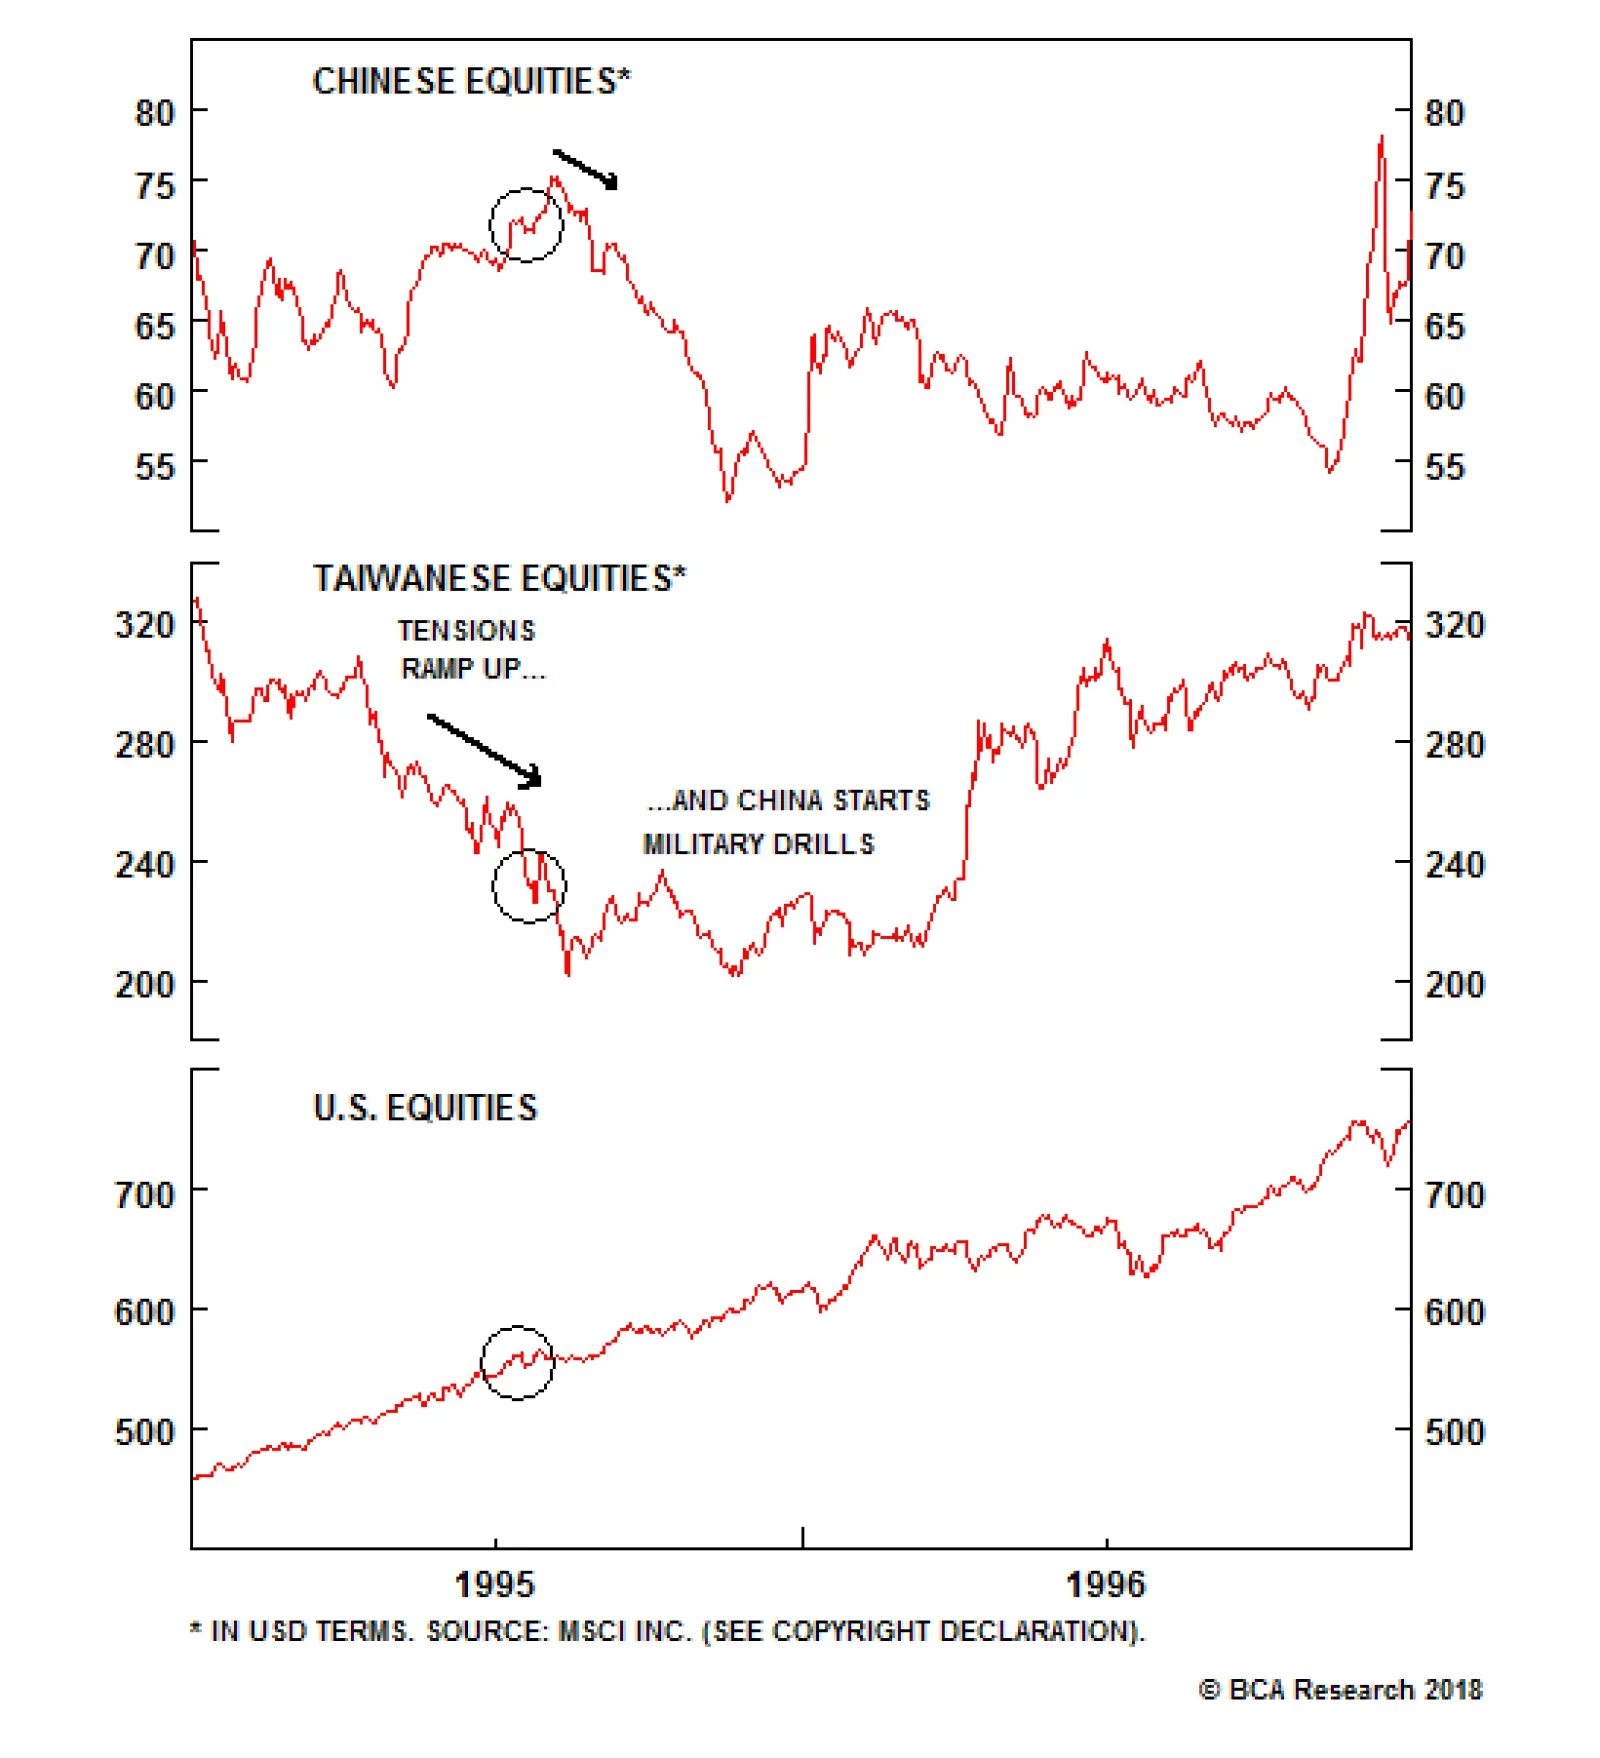
The takeaway is that, far from capitulating to the Trump administration's trade demands, China is taking a more aggressive stance - and it is doing so outside the trade context. The U.S., for its part, has not diminished the significance of this incident, as it has often done on similar occasions.8 Instead, Vice President Mike Pence gave a remarkable speech at the Hudson Institute on October 4 in which he highlighted the Decatur, among a range of other "predatory" Chinese state-backed actions, to make a comprehensive case that China is a geopolitical rival seeking to undermine the United States and specifically the Trump administration.9 Pence's comments reflect a decision to "go public" with a shift in national strategy that has been developing in recent years, beginning - albeit tepidly - even in the Obama administration. A similar shift is underway in China - and has accelerated with the U.S.'s implementation of tariffs. Official Communist Party rhetoric increasingly characterizes the U.S. as an enemy whose real intention is to "contain" China's rise and has recently called for Chinese "self-reliance" in the face of U.S. sanctions.10 The two sides are bracing for conflict and are now seeking to mold public opinion more actively. Bottom Line: Investors should take note: markets were 45 yards away from a significant correction! The U.S.-China trade tensions are spilling outside of economic relations into political and military domains, as we expected. The South China Sea remains a hot zone that could be the setting of a geopolitical incident as tensions mount. What Is A Show Of Force? Notably, the U.S. military is said to be considering a "global show of force" during an unspecified week in November in order to deter China from its current policy trajectory. If this occurs, it will be market-relevant as it will be seen as a provocation by China and other U.S. rivals. A "show of force" is a formal military operation conducted by a nation with the purpose of demonstrating that it has both the will and the ability to use force in defense of its interests. It is fundamentally a political action, even though it utilizes military resources. The declared intention is to demonstrate resolve and prevent or deter an undesirable course of action by a rival state.11 Nevertheless, it is the equivalent of a dog baring its teeth and should not be taken lightly, especially when conducted by one major power against another. The U.S. holds shows of force fairly frequently. Over recent decades it has been the third most common type of operation for U.S. forces.12 However, for most of the past several decades, the U.S. conducted very few operations in the Asia Pacific not pertaining to the Vietnam War, and these were usually of limited length and intensity. They were often shows of force to deter North Korea from various acts of terrorism and sabotage. China was rarely involved - there was, for example, no U.S. deployment during the Tiananmen crisis. Nevertheless there are a few highly relevant precedents: By far the most important exception is the Third Taiwan Strait Crisis in 1996. This was a major show of force - and one whose shadow still hangs over the Taiwan Strait. In July 1995, Beijing launched a series of missile tests and military exercises, hoping to discourage pro-independence sentiment and dissuade the Taiwanese people from voting for President Lee Teng-hui - who was rightly suspected of favoring independence - ahead of the 1996 elections. The United States responded on March 1, 1996 by deploying two aircraft carriers, USS Nimitz and USS Independence, and various warships to the area. The Nimitz even sailed through the strait. Tensions peaked ahead of the Taiwanese election on March 23, 1996 - in which voters went against China's wishes - and the show of force concluded after 48 days on April 17. Of course, tensions simmered for years afterwards. The Taiwan incident was the only operation involving China in the 1990s, and the first to do so since a minor contingency operation upon the Chinese invasion of Vietnam in 1979. It is generally deemed successful in demonstrating U.S. commitment to Taiwan's security - but it also spurred a revolution in Chinese military affairs, such that China is today in a far better position to attack Taiwan than ever before.13 The market effects were pronounced: Chinese and Taiwanese equities sold off. American stocks were unaffected (Chart 3). Chart 3Naval Shows Of Force Can Rattle Markets
Naval Shows Of Force Can Rattle Markets
Naval Shows Of Force Can Rattle Markets
The second major exception was the Hainan Island Incident, or EP-3 Incident. On April 1, 2001 a Chinese jet struck a U.S. EP-3 ARIES II signals reconnaissance plane in the skies over the South China Sea. The U.S. plane landed on China's island province of Hainan, where its crew was detained and interrogated for 10 days while their aircraft was meticulously disassembled. Ultimately the U.S. issued a half-hearted apology and the crew was released. This was a much smaller show of force than the third Taiwan crisis. The U.S. Navy positioned three destroyers in the area for two days. Chart 4A South China Sea Incident Helped Kill The Bull Market
A South China Sea Incident Helped Kill The Bull Market
A South China Sea Incident Helped Kill The Bull Market
This incident marked the peak of the cycle in U.S. equities ex-tech (Chart 4). In China, both A-shares and H-shares experienced volatility before selling off in subsequent months (Chart 5, top panel). Chart 5Volatility And Selloffs Amid Asian Shows Of Force
Volatility And Selloffs Amid Asian Shows Of Force
Volatility And Selloffs Amid Asian Shows Of Force
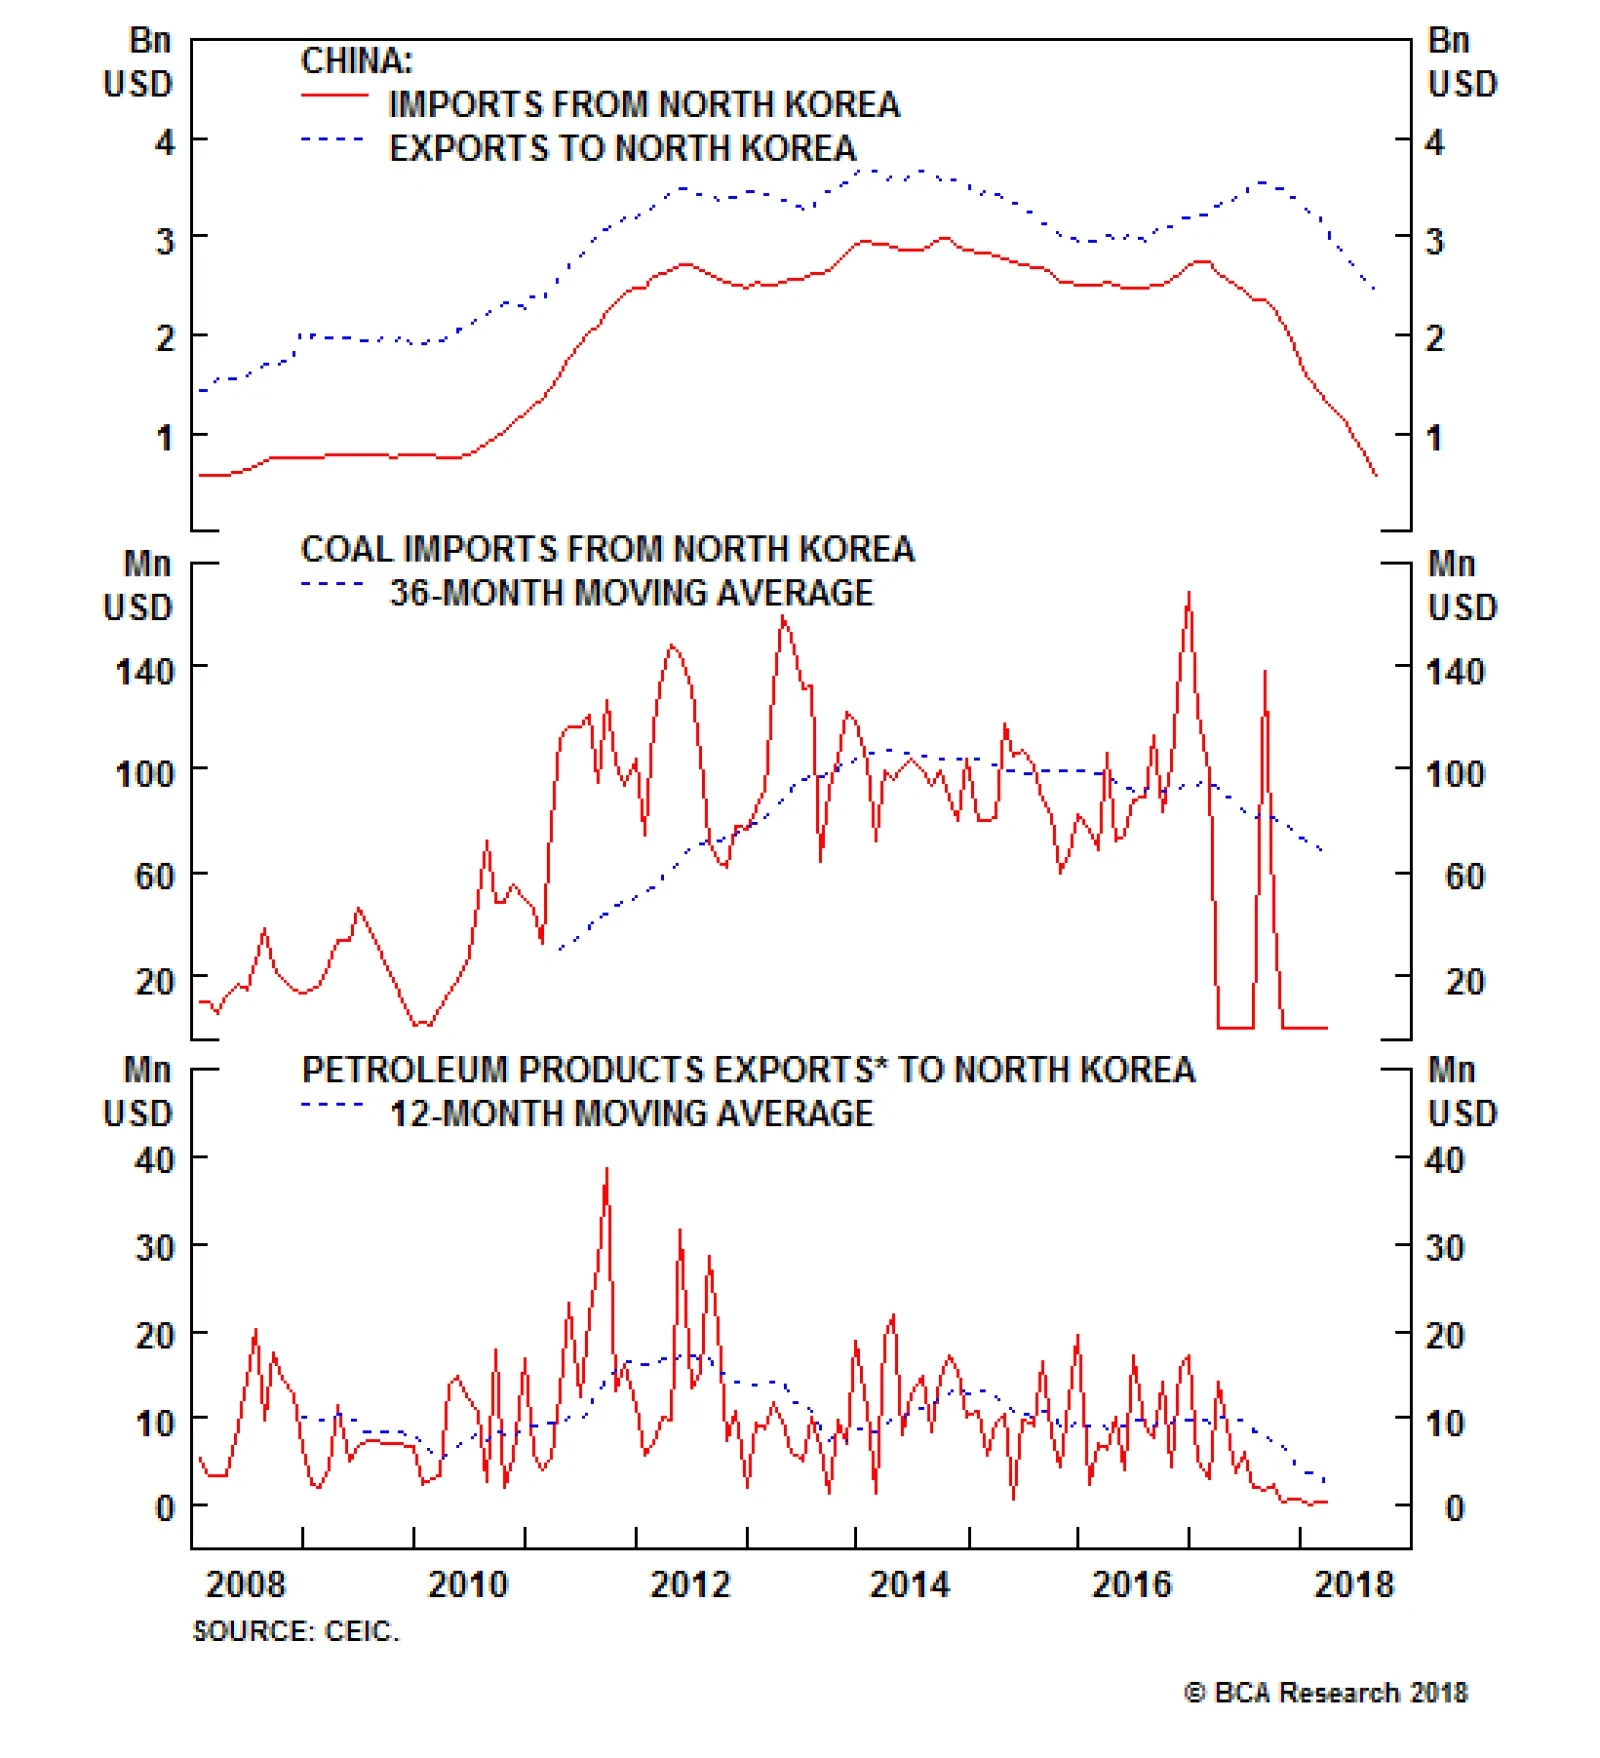
The Cheonan and Yeonpyeong Island incidents occasioned a show of force. On March 26, 2010 a North Korean miniature submarine conducted a surprise torpedo attack against the Cheonan, a South Korean Corvette, sinking it and killing 46 sailors. The U.S. intended to respond by positioning the USS George Washington in the Yellow Sea, but was intimidated from doing so by China's fiercely negative diplomatic reaction. Instead it deployed the carrier to the Sea of Japan. Later that year, however, after North Korea shelled Yeonpyeong Island and killed four South Koreans, the U.S. responded with a beefed up version of regular military drills, including the George Washington, for four days in the Yellow Sea. This incident is significant in showing how aggressively China will oppose demonstrations of American naval power in its near abroad. Unlike in 1996, China is today much better positioned to react to U.S. naval action in its neighborhood. If Beijing was so resistant to a U.S. show of force against North Korea in the wake of a North Korean attack, it will be even more resistant to a U.S. display of might in China's nearby waters aimed at China in response to what China views as a defense of maritime-territorial sovereignty. Chinese A-shares sold off, while H-shares were somewhat more resilient, during this episode (Chart 5, second panel). Fire and Fury: The United States' latest significant show of force occurred in 2017 when the navy positioned three aircraft carrier strike groups in the region to deter North Korean nuclear and missile tests and belligerent rhetoric against the United States. This action ultimately led to Chinese enforcement of sanctions and North Korean capitulation to U.S. demands. Chinese stocks only briefly sold off during this episode (Chart 5, third panel). However, the U.S. 10-year Treasury yield fell during the peak of tensions in the summer. So what about the global show of force that the U.S. is considering in November? Details on the specific operation under consideration are scant because they fall under a "classified proposal," written by members of the U.S. Navy's Pacific Command and only partially leaked to the press (apparently to coincide with Vice President Pence's speech).14 The proposal is still being discussed by the Joint Chiefs of Staff and the Intelligence Community, so nothing is final. From the information that is publicly available, it is highly significant that the proposed show of force is supposed to be "global" in range. It would reportedly involve a "series" of military missions on "several fronts," including the South China Sea, the Taiwan Strait, an unspecified area near Russia, and the west coast of South America. It would also involve multiple military services - the navy, the air force, the marines, and potentially cyber and space capabilities. While the various missions would reportedly be "concentrated" and "focused," implying that the U.S. wants to manage the escalation of tensions carefully, the locations that have been named are extremely sensitive. A show of force in the Taiwan Strait and South China Sea would be provocative enough. A simultaneous show of force against both China and Russia in today's context would be truly extraordinary.15 In short, if the report is accurate, the U.S. is contemplating a rare and provocative display of its global power projection capabilities. Why would the U.S. stage such a grand demonstration merely because of a taunt by a Chinese ship? The Decatur incident is only the proximate cause. Washington is in the midst of attempting a very dangerous "two-front war" against China and Iran, the latter of whom faces oil sanctions from November 4.16 Moreover, this is a "three-front war" if today's historically bad relations with Russia are taken into account. Indeed, the U.S. may well be responding to the joint show of force by Russian President Vladimir Putin and Chinese President Xi in their own large-scale military exercises in September, in which Chinese soldiers participated in a Russian drill outside the auspices of the Shanghai Cooperation Organization for the first time.17 As such, we would not put any stock in the idea that a sudden drop-off in geopolitical tensions, with China or anyone else, will occur after the U.S. midterm election on November 6. Rather, investors should expect an increase in geopolitical risk. There is no combination of midterm election results in which Trump will be forced to pull back on his "Maximum Pressure" doctrine. The proposal is not final, and the idea alone is a low-level threat that could be used in negotiations. But under the circumstances, we think it more likely than not that the U.S. will go forward with it. Ultimately, the U.S. proposal epitomizes our mega-theme of multipolarity. The U.S. is in relative decline and is reasserting itself with a muscular national security policy, particularly against China and Iran but also against Russia. However, its actions are highly unlikely to cause a change in China's behavior now that Beijing has determined that the U.S. is seeking Cold War-style strategic containment. Instead, China will hasten its efforts to become self-reliant and to deter U.S. aggression in its near abroad. Global economic policy uncertainty, and trade policy uncertainty, are likely to increase, not decrease, in such an environment. Saber-rattling and supply-chain risk will weigh on EM Asia in particular. Bottom Line: The U.S. government is contemplating an extraordinary "global show of force" that could involve a series of joint military operations across the globe. The chief focus is China, but the unknown array of operations could also target Russia or Iran. We think such operations are plausible and will increase global economic uncertainty. We would expect them to create volatility in global markets, adding to jitters over China tariffs (supply-chain risks) and Iranian sanctions (oil prices). How Will China Retaliate? China does not have the ability to respond proportionately to the U.S. - it cannot hold a global show of force of its own. Because its own shows of force will appear diminutive next to American fireworks, it may not react immediately. Beijing is more likely to respond by changing its policies to address the underlying increase in antagonism with the United States and improve its national security. We would classify its potential responses into two main groups: the low road and the high road. The low road consists of policies meant to confront the U.S. directly and forcefully. In our view, these policies bring significant costs that will make China reluctant to embrace them fully: Raise the stakes in the South China Sea: China could go for broke and deploy the full range of military assets in the islands that it has repurposed. This would provoke an even larger international naval response from the U.S. and its allies.18 Remove sanctions on North Korea: China could reverse sanctions enforcement on North Korea (Chart 6) and undermine President Trump's signature foreign policy overture. The problem is that China would then provide the U.S. with a pretext for an even greater military presence in Northeast Asia. Chart 6China Could Reverse Sanctions Enforcement
China Could Reverse Sanctions Enforcement
China Could Reverse Sanctions Enforcement
Flout sanctions on Iran: China could subsidize Iran (Chart 7) in the hopes of helping to create a huge American distraction comparable to the second Iraq war. But this confrontation would threaten China with an oil shock and economic dislocation, an even greater conflict with the U.S., and the risk of regime change in Iran.19 Chart 7China Could Flout Iran Sanctions
China Could Flout Iran Sanctions
China Could Flout Iran Sanctions
Punish U.S. companies: China could raise the pressure on U.S. companies doing business on its territory. The problem is that the U.S. has already demonstrated, through the ZTE affair this year, that it can inflict devastating reprisals against the tech champions on whom China's economic future depends (Chart 8). Chart 8U.S. Could Punish Chinese Tech Firms
U.S. Could Punish Chinese Tech Firms
U.S. Could Punish Chinese Tech Firms
Thus China is most likely to take the "high road," i.e. seeking alternatives to the United States throughout the rest of the world: Chart 9China's Market Is Its Biggest Advantage
China's Market Is Its Biggest Advantage
China's Market Is Its Biggest Advantage
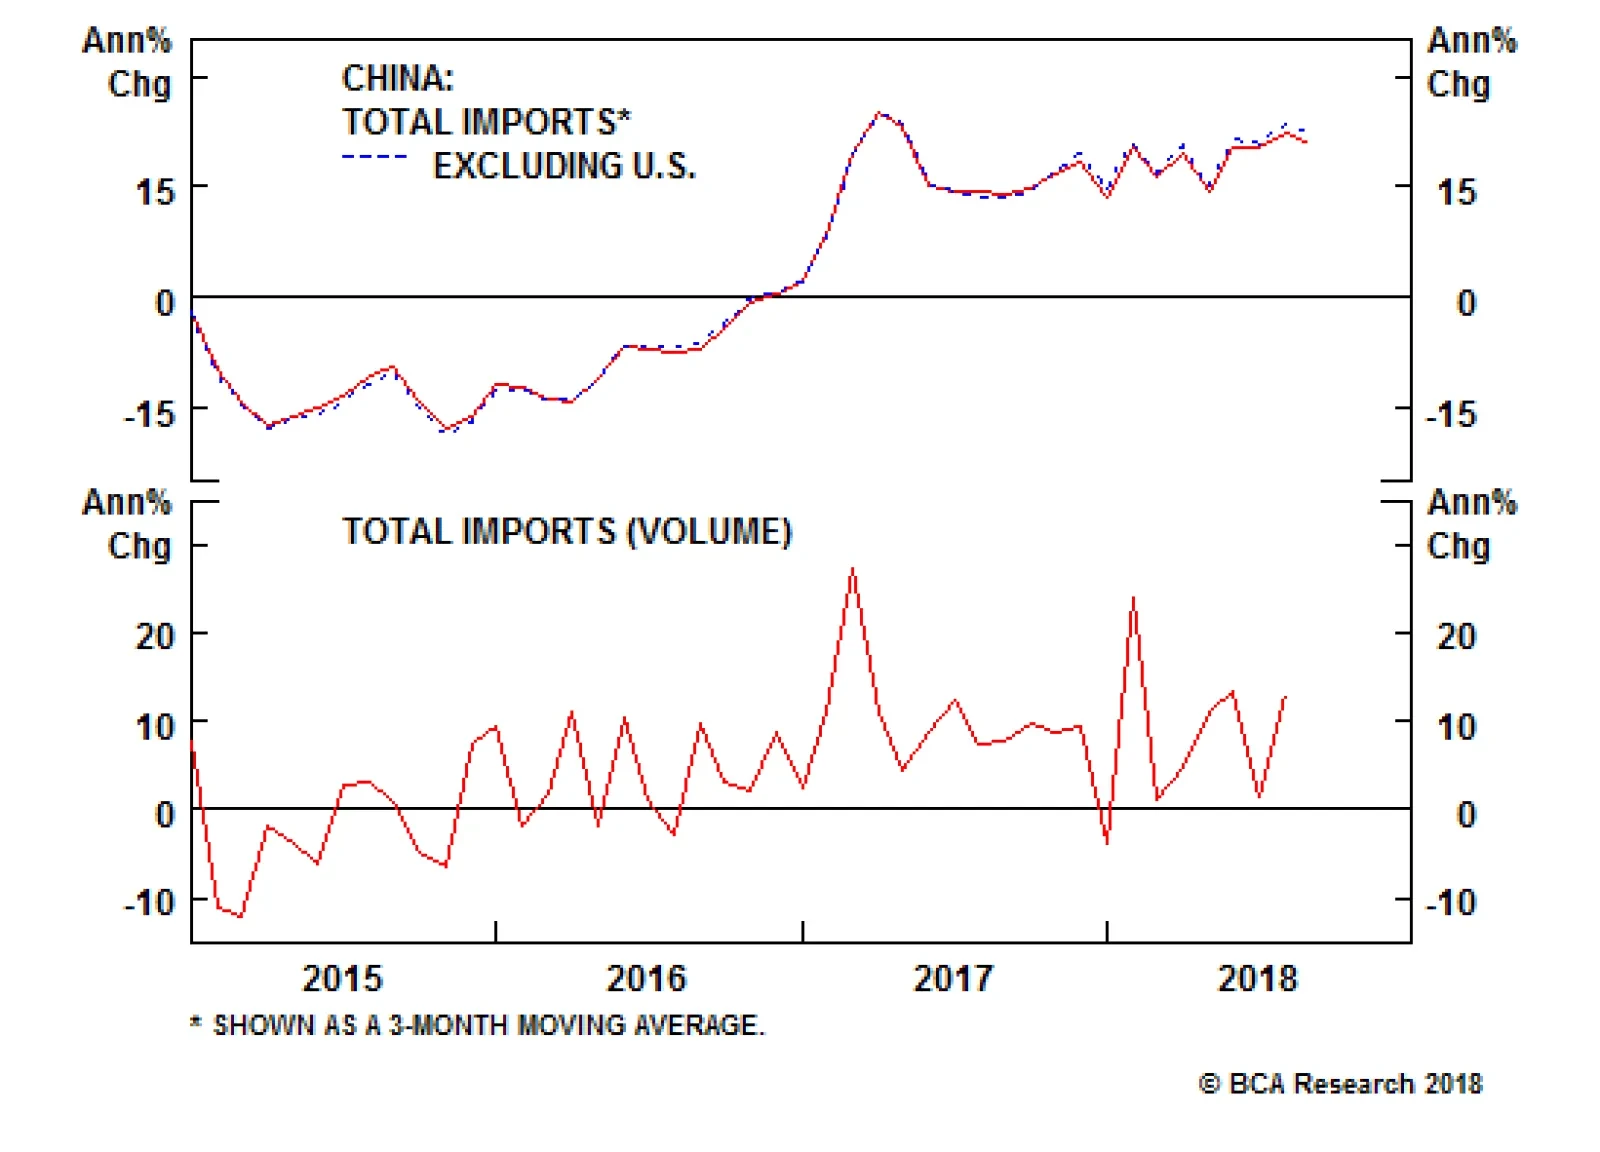
Import more goods: China's greatest strength in winning friends is that its domestic demand remains relatively robust (Chart 9). China can substitute away from the U.S. by shifting to other developed markets. Emerging markets are becoming more connected with China and less so with the U.S. (Chart 10). Chart 10China's Trade Ties Grow, Ex-U.S.
China's Trade Ties Grow, Ex-U.S.
China's Trade Ties Grow, Ex-U.S.
Maintain outward investment: China's outward investment profile is expanding rapidly (Chart 11), but there is potential for a negative political backlash - as has occurred in Malaysia.20 China will need to focus on improving relations with those countries where it expands investment, including in the Belt and Road Initiative (BRI).21 Chart 11China's Outward Investment Strategy: Priorities Over The Past Decade
A Global Show Of Force?
A Global Show Of Force?
Court U.S. regional allies: Relations with South Korea have already improved; Shinzo Abe of Japan is soon to make a rare state visit to China; and trilateral trade talks between these three have revived for the first time since 2015 (Chart 12). Both the Philippines and Thailand currently have governments that are friendly to China. Beijing will need to ensure that its growing trade surpluses do not get out of whack. Chart 12Can China Court U.S. Allies?
Can China Court U.S. Allies?
Can China Court U.S. Allies?
Sign multilateral trade pacts: China is trying to position itself as a leader of free trade. This is a tough sell, but a successful completion of negotiations on the Regional Comprehensive Economic Partnership (RCEP) will generate some momentum. This Asia Pacific trade grouping is far larger in terms of total imports than its more sophisticated rival, the Comprehensive and Progressive Trans-Pacific Partnership (CPTPP), the latter being shorn of U.S. participation (Chart 13). Chart 13RCEP Is Bigger Than CPTPP
RCEP Is Bigger Than CPTPP
RCEP Is Bigger Than CPTPP
Play nice in the South China Sea: Now that the U.S. is proposing to push back against Chinese militarization of the islands, it makes sense for China to take a conciliatory approach. It is proposing joint energy exploration with the Philippines and others at least as long as offshore activity is depressed (Chart 14). China might also try to settle a diplomatic "Code of Conduct" for the sea with its neighbors. Chart 14A Reason For China To Play Nice
A Reason For China To Play Nice
A Reason For China To Play Nice
The most important consequence is an alliance with Russia, whether formal or not. The security agenda of these two powers is increasingly aligned with their robust economic partnership (Chart 15).22 The differences and distrust between them cannot override their need to guard themselves against a more assertive United States. Chart 15Embrace Of Dragon And Bear
Embrace Of Dragon And Bear
Embrace Of Dragon And Bear
Bottom Line: China's "high road" strategies are its best options when more aggressive options have higher risks of undermining China's own long-term interests. But an alliance with Russia is quickly becoming inevitable. Investment Implications A global show of force targeting China's "core interests" in Taiwan and the South China Sea will make trade negotiations even more difficult. China is not going to offer concessions when facing U.S. military intimidation in addition to tariffs.23 Investors should watch closely for any signs that nationalist protests and boycotts of U.S. goods are developing in China. Such a movement would not be allowed to continue for long without the Communist Party condoning it. A boycott would mark a form of retaliation that is much more impactful than tariffs. A deterioration in cultural ties is also in the cards. The United States is reported to be considering restrictions on Chinese student visas after intelligence assessments of non-traditional technological and intellectual property theft via graduate students in advanced programs such as artificial intelligence and quantum computing.24 U.S. markets remain insulated today, as in the last big rupture in U.S.-China relations in 1989, so we continue to expect U.S. equities to outperform Chinese (and global) stocks amid trade tensions and saber-rattling. Chart 16Last U.S.-China Crisis Prompted Stimulus...
Last U.S.-China Crisis Prompted Stimulus...
Last U.S.-China Crisis Prompted Stimulus...
However, an important takeaway from the 1989 episode is that China stimulated the economy (Chart 16). This time we think stimulus will remain lackluster, reflecting Xi's need to keep overall leverage contained (Chart 17). But conflict escalation with the U.S. is clearly the biggest risk to this view. Chart 17...But Stimulus Muted Thus Far
...But Stimulus Muted Thus Far
...But Stimulus Muted Thus Far
One oft-discussed retaliatory option is that China could sell off its vast $1.17 trillion holdings of U.S. treasuries. Rapidly dumping them is not effective, but slowly tapering is precisely what China has been doing since 2011 (Chart 18). This will accelerate its need to invest in real assets abroad and to purchase alternative reserve currencies, such as the euro, pound, and yen. Chart 18China Weans Itself Off Treasuries
China Weans Itself Off Treasuries
China Weans Itself Off Treasuries
Ultimately, the significance of Vice President Pence's speech is that the U.S. now views China as both a great power and a threat to U.S. supremacy. This raises the potential for a large share of the $33 billion in cumulative U.S. direct investment in China since 2006 to become, effectively, stranded capital (Chart 19). If that is indeed the case, it would mean that investors in S&P 500 China-exposed companies would have to take note and re-rate their investments. Companies with significant investment in China may have to make capital investments in alternative supply-chain options, leading to a significant hit to their profit margin. Chart 19Stranded Capital In China?
A Global Show Of Force?
A Global Show Of Force?
Other countries in Europe and the rest of Asia stand to benefit from the U.S. getting squeezed out of China's market, unless and until the new Cold War forces them to choose sides. Their choice is by no means a foregone conclusion, underscoring that China's policy response will be to seek better bonds with its neighbors and non-U.S. partners. Over the longer term, we think that our mega-theme of multipolarity will produce the bifurcation of capitalism. Within each sphere of influence globalization will continue to operate, but between spheres, or in the border areas, it will become a much less tidy affair. In addition to our recommendations above on page 2, we are reinitiating our short U.S. S&P 500 China-exposed stocks relative to the broad market. These companies have sold off heavily in recent months but the negative backdrop suggests that there is farther to go. Housekeeping On a separate note, BCA's Geopolitical Strategy is closing our long U.S. high-tax rate basket relative to S&P 500 trade for a gain of 8.26%. This was a play on the Trump tax cuts that we initiated in April 2017. Matt Gertken, Vice President Geopolitical Strategy mattg@bcaresearch.com Marko Papic, Senior Vice President Chief Geopolitical Strategist marko@bcaresearch.com 1 Please see BCA Geopolitical Strategy Special Report, "Power And Politics In East Asia: Cold War 2.0?" dated September 25, 2012, available at gps.bcaresearch.com. 2 Please see BCA Geopolitical Strategy Monthly Report, "Multipolarity And Investing," dated April 9, 2014, available at gps.bcaresearch.com. 3 Please see BCA Geopolitical Strategy Special Report, "Sino-American Conflict: More Likely Than You Think," dated October 4, 2013, available at gps.bcaresearch.com. 4 Please see BCA Geopolitical Strategy Weekly Report, "Trump, Day One: Let The Trade War Begin," dated January 18, 2017, available at gps.bcaresearch.com. 5 Please see BCA Geopolitical Strategy Monthly Report, "Throwing The Baby (Globalization) Out With The Bath Water (Deflation)," dated July 13, 2016, available at gps.bcaresearch.com. 6 Please see BCA Geopolitical Strategy and Global Investment Strategy Special Report, "Underestimating Sino-American Tensions," dated November 6, 2015, available at gis.bcaresearch.com. 7 Please see BCA Geopolitical Strategy Special Report, "The South China Sea: Smooth Sailing?" dated March 28, 2017, and "The Looming Conflict In The South China Sea," May 29, 2012, available at gps.bcaresearch.com. 8 Comparable incidents in December 2013, August 2014, May 2016, December 2016, August 2017, and March 2018 did not receive such a high-level response from U.S. leaders, reflecting both the seriousness of the Decatur incident and the administration's sense of political expediency amidst the trade conflict and midterm election cycle. 9 Pence criticized Chinese President Xi by name for allegedly breaking his word on the militarization of the Spratly Islands. He suggested that China's outward investment should be understood in strategic rather than economic terms, implying that the Belt and Road Initiative is a Soviet-style plan to organize a "bloc" of nations under Chinese hegemony. And he hinted at a new defense of the Monroe Doctrine in his criticism of China's recent assistance to the collapsing socialist regime in Venezuela. Please see the White House, "Remarks by Vice President Pence on the Administration's Policy Toward China," dated October 4, 2018, available at www.whitehouse.gov. 10 The Trump administration's key document is Secretary of Defense James Mattis, "Summary of the 2018 National Defense Strategy of the United States of America," Department of Defense, 2018, available at dod.defense.gov. For the Xi administration, see Orange Wang and Zhou Xin, "Xi Jinping says trade war pushes China to rely on itself and 'that's not a bad thing,'" South China Morning Post, dated September 26, 2018, available at www.scmp.com; and the Information Office of the State Council, "The Facts and China's Position on China-US Trade Friction," September 2018, available at www.chinadaily.com. 11 For this discussion of shows of force please see W. Eugene Cobble, H. H. Gaffney, and Dmitry Gorenburg, "For the Record: All U.S. Forces' Responses to Situations, 1970-2000 (with additions covering 2000-2003)," Center for Strategic Studies, May 2005, available at www.dtic.mil. 12 See footnote 11 above. 13 Please see William S. Murray, "Asymmetric Options for Taiwan's Defense," Testimony before the U.S.-China Economic and Security Review Commission, June 5, 2014, available at www.uscc.gov. 14 Please see Barbara Starr, "US Navy proposing major show of force to warn China," dated October 4, 2018, available at www.cnn.com. 15 Even the South American location implies that Chinese, Russian, and Iranian influence on that continent is now deemed meaningful enough to require a reassertion of the Monroe Doctrine. Over the past decade, the U.S. has tended to regard these activities as limited, but now that may be changing. 16 Please see BCA Geopolitical Strategy Special Report, "2019: The Geopolitical Recession?" dated October 3, 2018, available at gps.bcaresearch.com. 17 Please see "Russia Holds Massive War Games, As Putin And Xi Tout Ties," Radio Free Europe, Radio Liberty, September 11, 2018, available at www.rferl.org. 18 Australia, Japan, and the U.K. have already begun enforcing freedom of navigation alongside the U.S. 19 The U.S. could also impose secondary sanctions on China for non-compliance. State-owned energy firm Sinopec, for instance, was said to be reducing imports of crude from Iran by half in the month of September. Our Commodity & Energy Strategy notes that Chinese refiners, like other Asian refiners, are preparing to run more light-sweet crude from the U.S. in the future, which gives a good yield in high-value-added products like gasoline. So far China has not imposed retaliatory tariffs on these imports from the U.S. Please see Chen Aizhu and Florence Tan, "China's Sinopec halves Iran oil loadings under U.S. pressure: sources," Reuters, dated September 28, 2018, available at uk.reuters.com. 20 Please see BCA Geopolitical Strategy Weekly Report, "Are You Ready For 'Maximum Pressure?'," dated May 16, 2018, available at gps.bcaresearch.com. 21 Please see BCA Emerging Markets Strategy Special Report, "China's Belt And Road Initiative: Can It Offset A Mainland Slowdown?" dated September 13, 2017, available at ems.bcaresearch.com. 22 Please see BCA Geopolitical Strategy Special Report, "Can Russia Import Productivity From China?" dated June 29, 2016, and "The Embrace Of The Dragon And The Bear," dated April 11, 2014, available at gps.bcaresearch.com. 23 Xi Jinping's refusal to meet with Secretary of State Mike Pompeo over the past weekend, and decision to visit North Korea for the first time in his term, underscores this point. 24 Please see Demetri Sevastopulo and Tom Mitchell, "US considered ban on student visas for Chinese nationals," Financial Times, dated October 2, 2018, available at www.ft.com. Appendix Notable Clashes In The South China Sea (2010-18)
A Global Show Of Force?
A Global Show Of Force?
Notable Clashes In The South China Sea (2010-18) (Continued)
A Global Show Of Force?
A Global Show Of Force?
Notable Clashes In The South China Sea (2010-18) (Continued)
A Global Show Of Force?
A Global Show Of Force?
Jair Bolsonaro, an ex-army captain and a right-leaning, law-and-order candidate has won a surprising victory in the first round of the Brazilian presidential election (Chart I-1). Bolsonaro came within striking distance of 50%, but did not cross that threshold, which means that the second round will go ahead on October 28. Given that he only needs another 4% to gain a majority of votes, his victory in the second round is now the most likely outcome by far. Importantly, the results of the congressional election similarly saw a swing to the right in both legislative houses. Chart I-1Bolsonaro Outperformed In The First Round
Brazil: A Regime Shift? (Special Report)
Brazil: A Regime Shift? (Special Report)
What are the prospects for pro-market structural reforms amid this apparent regime shift in Brazilian politics? How should investors be positioned over the coming months? In the short term, a Bolsonaro presidency will boost business and market sentiment. This is mainly due to the right-leaning balance of parties in Congress and hence Bolsonaro's ability to form a majority coalition. This should lead to an outperformance of Brazilian assets relative to EM on expectations of reforms being passed and implemented. BCA's Emerging Markets Strategy service recommends upgrading Brazil to an overweight within EM equity, credit, and local fixed-income portfolios. However, in the longer term, we expect that Bolsonaro's presidency will still be constrained on social security reforms. It is still not clear if Brazil's median voter is demanding the kind of policies touted by Bolsonaro's economic advisors. Given Bolsonaro's populism, he may not be willing to expend his political capital on painful and unpopular reforms. In light of this, investors with a 2-5 year horizon should be wary of increasing their absolute exposure to Brazilian assets. Private investors looking for long-term exposure to Brazil should be especially concerned about Bolsonaro's anti-democratic, pro-military inclinations. A New Political Regime... Bolsonaro outperformed expectations in the first round by winning 46% of the popular vote, soundly beating his main rival Fernando Haddad of the left-wing Worker's Party. Polls over the past few weeks had seen him pegged at around 30%. Yet, Sunday night's results showed Bolsonaro beating all pollsters' expectations and nearly gaining the victory in the first round. Table I-1First Round Turnout Was Low In Contrast To Pass Elections
Brazil: A Regime Shift? (Special Report)
Brazil: A Regime Shift? (Special Report)
Notably, and in contrast to previous elections, overall turnout for the first round was low, standing at just 79% (Table I-1). This played into Bolsonaro's hands. Even though there will be strategic voting in the second round - and our expectation is that most left-leaning voters will switch to Haddad, the remaining left-wing candidate - Haddad's chances look slim. He needs a mass wave of Lula supporters to turn out for the vote. The fact that they did not in the first round bodes ill for him. Thus, Bolsonaro stands at strong odds of becoming Brazil's next president. Attention will turn to the mandate that Bolsonaro will receive over the next four years. In our view, the factors below will be key: Short-term constraints have fallen off: The surprising surge in right-leaning parties at the congressional level suggests that President Bolsonaro will have no immediate legislative constraints to his agenda. He will be free to pursue his policy preferences relatively unimpeded. Chart I-2Chamber Of Deputies Results
Brazil: A Regime Shift? (Special Report)
Brazil: A Regime Shift? (Special Report)
This is due to both legislative houses shifting towards the right, giving Bolsonaro a mandate to form a majority right-wing government for the first time since 1998 (Chart I-2). So far, 63% of seats in the lower house have gone to center-right and right-wing parties (according to our back-of-the-envelope calculation). If all of these parties joined into a coalition it would represent a historically strong mandate. Markets will surely interpret this as a positive development. However, not all of these parties will necessarily join Bolsonaro. Moreover, reforms requiring a constitutional amendment, such as the all-important reform of Brazil's unsustainable pension system, would require a supermajority of 308 out of 513 seats (60%) in the lower house. Historically, this has proven difficult, and it will be especially tricky for a president with no executive experience, little legislative record, and who denounces the use of pork-barrel spending.1 Otherwise, Congress can ultimately be cajoled into following Bolsonaro. As such, for the first time since Lula's first election (2002 to 2006), the Brazilian president is well-positioned to pursue his agenda. Bolsonaro will likely initiate some easy supply-side policies like cutting corporate taxes and red tape for businesses. Besides, business sentiment could surge due to the emergence of a business-friendly government. Hence, Bolsonaro has some short-term, easy "boosters" before the long-term challenges resurface. Long-term constraints uncertain: Despite the above, the pace of reforms will be slow given that Bolsonaro is, in the end, a populist who will want to maintain power above all. We continue to doubt Bolsonaro's willingness and ability to pursue social security reforms. We suspect that the vast majority of his voters chose to cast their ballot due to his law-and-order agenda that included a focus on battling crime and corruption. His economic advisor, Paulo Guedes, spent more time touting his reformist credentials in foreign financial publications than on the campaign trail. As such, it is difficult to conclude that Bolsonaro actually has a strong mandate for painful pension reforms. Polls ahead of the election suggest that only 4% of the public wants pension reforms (Chart I-3). Chart I-3Brazil's Population Is Not Open To Fiscal Austerity
Brazil: A Regime Shift? (Special Report)
Brazil: A Regime Shift? (Special Report)
Chart I-4The J-Curve Of Structural Reform
Brazil: A Regime Shift? (Special Report)
Brazil: A Regime Shift? (Special Report)
That said, we are open-minded and willing to be proved wrong. If Bolsonaro supports very dramatic reforms in his first 12 months in office, when his political capital is strongest, he could pull through despite the likely opposition from the median voter. As our J-Curve Of Structural Reform suggests, Bolsonaro can survive the "danger zone" if he pushes ahead with painful reforms right away (Chart I-4). He will start with sufficient political capital to do so. For long-term investors, the chief question is this: Is Bolsonaro a Brazilian Ronald Reagan or merely a Brazilian Rodrigo Duterte? Judging from everything he himself - not his advisors - has said in the past and on the campaign trail, we would bet on the latter. ...But The Same Economic Problems Brazil is getting a new government, but the macro economic challenges remain the same. Namely, ballooning public debt, still high interest rates and an unsustainable pension system (Chart I-5). As discussed above, it is not evident that Bolsonaro will strive to enact major cuts in the social security system that would be very unpopular. Apart from pensions and privatization, other choices to tackle the unsustainable public debt dynamics include reducing interest rates and boosting nominal growth (Chart I-6). Bolsonaro's economic team has repeatedly discussed the need to reduce high interest rates. Chart I-5Much Needed Pension Reform!
Much Needed Pension Reform!
Much Needed Pension Reform!
Chart I-6Brazil's Macro Distortions
Brazil's Macro Distortions
Brazil's Macro Distortions
Chart I-7The Real Is Still At Risk Of Depreciation
The Real Is Still At Risk Of Depreciation
The Real Is Still At Risk Of Depreciation
Rapid and large interest rate cuts by the central bank will help to service the public debt given that 96% of public debt is in local currency. Yet, lower interest rates could put pressure on the currency to depreciate - the interest rate differential between Brazil and the U.S. is at all-time lows (Chart I-7). Meanwhile, a weaker currency is needed to increase nominal growth. Notably, extremely low inflation and weak nominal growth have worsened the nation's public debt dynamics in recent years. Overall, lower policy rates and currency devaluation are required to reflate Brazil out of a public debt trap. If the exchange rate stabilizes in the short run as foreign investors come back to Brazil, the central bank will reduce interest rates considerably. Lower borrowing costs in combination with a sharp rise in business confidence and existing pent-up investment demand will propel capital spending, employment and overall growth. In short, these are necessary conditions for Brazilian markets to outperform their EM peers, i.e., for relative outperformance. As to absolute performance, it also depends on the outlook for global markets. In a complete global risk-off mode (the odds of which are considerable at the moment) - in which EM currencies and risk assets continue rioting and U.S. share prices drop - it will be difficult for Brazilian risk assets to rally meaningfully. That said, they will still outperform their EM peers. In the long run, pursuing policies of lower-than-needed interest rates and, hence, of chronic currency depreciation appears to be more palatable to Bolsonaro's populist credentials than difficult structural reforms. Therefore, investors who look to commit long-term capital to Brazil should mind the exchange rate. Populist policies favoring nominal growth in the long run lead to chronic currency depreciation. Bottom Line: Bolsonaro's election and his initial policies will be cheered by markets and will help Brazilian markets to outperform their EM peers for now. However, Bolsonaro is a populist and in the long term will choose economic policies that favor high nominal growth and, thereby, warrant chronic currency depreciation. Investment Recommendations Chart I-8Overweight Brazilian Assets Relative To EM
Overweight Brazilian Assets Relative To EM
Overweight Brazilian Assets Relative To EM
In terms of market recommendations, we have the following: For EM dedicated portfolios, we recommend upgrading Brazil to overweight within the equity, credit, and local currency bonds universes (Chart I-8). BCA's Emerging Market Strategy service is taking a 14% profit on its structural short BRL versus USD position. Also, we are closing the short BRLMXN and short BRLARS trades with a 12% gain and a 5.7% loss, respectively. We also recommend closing the short Brazilian bank stocks trade initiated on May 16, 2018, as its return is now flat due to the recent rebound over the past few days. Absolute performance of Brazilian risk assets is contingent on global financial markets sentiment and at the moment odds of global risk off are considerable. This could cap the rally in Brazilian risk assets for now. Long-term investors should realize that timing Brazilian markets in general, and the exchange rate in particular, will be critical to protect gains. We believe that the path of least resistance for Bolsonaro and his team will be to depreciate the currency and engender nominal GDP growth in order to inflate away the country's public debt. This is a smart strategy for which they have a political mandate. But it will be a death-knell for foreign investors with major positions in the country. Andrija Vesic, Research Analyst andrijav@bcaresearch.com Arthur Budaghyan, Senior Vice President Emerging Markets Strategy arthurb@bcaresearch.com Marko Papic, Senior Vice President Chief Geopolitical Strategist marko@bcaresearch.com Matt Gertken, Vice President Geopolitical Strategy mattg@bcaresearch.com Footnotes 1 In late 1998, for instance, even President Cardoso's own PSDB party deprived him of the votes needed to seal a painstakingly negotiated deal with the IMF, which led to a loss of confidence among creditors and a sharp devaluation of the real in January 1999.
There are three reasons why investors holding this view are likely mistaken. First, in the U.S., the actual implementation of tariffs lies within the control of the White House. Congress has already delegated substantial authority on trade negotiation to…
Highlights So What? Go long Brent / short S&P 500. The risk of a recession in 2019 is underappreciated. Why? The likelihood is increasing of a geopolitically-induced supply-side shock that pushes crude prices above $100 per barrel in the coming 6-12 months. Oil supply disruptions in Iran, Iraq, and Venezuela represent the primary source of risk. Historically, the combination of Fed rates hike and an oil price spike has preceded 8 out of the last 9 recessions. Also... A recession in 2019, ahead of the 2020 election, would set the stage for a confrontation between Trump and the Fed, adding fuel to market volatility. Feature Geopolitical tensions are brewing from the Strait of Hormuz to the Strait of Malacca. As we go to press, news is breaking that a Chinese naval vessel almost collided with the USS Decatur as the latter conducted "freedom of navigation" operations within 12 nautical miles of Gaven and Johnson reefs in the Spratly Islands. Given the trade tensions between China and the U.S., this alleged maneuver by the Chinese vessel suggests that Beijing is not backing off from a confrontation. Our view remains that Sino-American trade tensions can get a lot worse before they get better. The latest incident, which builds on a series of negative gestures recently in the South China Sea, suggests that both sides are combining longstanding geopolitical tensions with the trade war. This will likely encourage brinkmanship and further degrade U.S.-China relations. Yet China-U.S. tensions are not the only concern for investors in 2019. Another crisis is brewing in the Middle East, with the potential to significantly increase oil prices over the next 12 months. U.S. households may have to deal with a double-whammy next year: higher costs of imported goods as the U.S.-China trade war rages on and a significant increase in gasoline prices. In this report, we discuss this dire outlook. The Folly Of Recession Forecasting In mid-2017, BCA Research published two reports, one titled "Beware The 2019 Trump Recession" and another titled "The Timing Of The Next Recession."1 Both argued that if the Federal Reserve kept raising rates in line with the FOMC dots, then monetary policy would move into restrictive territory by early 2019 and increase the likelihood of recession thereafter. We subsequently adjusted the timing of our recession forecast to 2020 or beyond, based on a more positive assessment of the U.S. economy. In this report, we explore a risk to the BCA House View on the timing of the next recession. As BCA's long-time Chief Economist Martin Barnes has said, predicting recessions is a mug's game. There have been eight recessions in the past 60 years (excluding the brief 1980-81 downturn) and the Fed failed to forecast all of them (Table 1). Table 1Fed Economic Forecasts Versus Outcomes
2019: The Geopolitical Recession?
2019: The Geopolitical Recession?
The Atlanta Fed produces a recession indicator index which is designed to highlight the odds of recession based on trends in recent GDP data. At the moment, the indicator is at a historically sanguine 2.4%. Unfortunately, low readings are not a reliable cause for optimism. The 1974-75, 1981-82, and 2007-09 recessions were all severe and the Atlanta Fed's recession indicator had a low reading of 10%, 1.6%, and 7.7%, respectively - just as the recession was about to begin (Chart 1). Chart 1The Market Is Not Expecting A Recession
The Market Is Not Expecting A Recession
The Market Is Not Expecting A Recession
The 1974-75 recession is instructive, given the numerous parallels with the current environment: Energy Geopolitics: The 1973 oil crisis caused a massive spike in crude prices. This point is especially pertinent since the 1973 oil embargo is widely viewed as an important contributor to the 1974-75 recession. Real short rates had risen and the yield curve had inverted long before oil prices spiked, so recession was almost inevitable even without the oil price move. But the oil spike made the recession much deeper than otherwise. Protectionism: President Nixon imposed a 10% across-the-board tariff on all imports into the U.S. in 1971 to try to force trade partners to devalue the U.S. dollar. Dislocation: Competition from newly industrialized countries - Japan and the East Asian tigers in particular - laid waste to the steel industry in the developed world. Polarization: President Nixon polarized the nation with both his policies and behavior, leading to his resignation in 1974. Given the exogenous and geopolitical nature of oil supply shocks, today's recession indicators are missing a critical potential headwind to the economy. A geopolitically induced oil-price shock could create more pain than the economy is able to handle. Why An Oil Price Shock? America's renewed foray into the politics of the Middle East will unravel the tenuous equilibrium that was just recently established between Iran and its regional rivals. The U.S.-Iran détente that produced the signing of the 2015 Joint Comprehensive Plan of Action (JCPA) created conditions for a precarious balance of power between Israel and Saudi Arabia on one side, and Iran and its allies on the other side. This equilibrium led to a meaningful change in Tehran's behavior, particularly on the following fronts: The Strait of Hormuz: Tehran ceased to rhetorically threaten the Strait as soon as negotiations began with the U.S. (Chart 2). Since then, Iran's capabilities to threaten the Strait have grown, while the West's anti-mine capabilities remain unchanged.2 Iraq: Iran directly participated in the anti-U.S. insurgency in Iraq. Tehran changed tack after 2013 and cooperated closely with the U.S. in the fight against the Islamic State. In 2014, Iran acquiesced to the removal of the deeply sectarian, and pro-Iranian, Prime Minister Nouri al-Maliki. Bahrain and the Saudi Eastern Province: Iran's material and rhetorical support was instrumental in the Shia uprisings in Bahrain and Saudi Arabia's Eastern Province in 2011 (Map 1). Saudi Arabia had to resort to military force to quell both. Since the détente with the U.S. in 2015, Iranian support for Shia uprisings in these critical areas of the Persian Gulf has stopped. Chart 2Geopolitical Crises And Global Peak Supply Losses
2019: The Geopolitical Recession?
2019: The Geopolitical Recession?
Map 1Saudi Arabia's Eastern Province Is A Crucial Piece Of Real Estate
2019: The Geopolitical Recession?
2019: The Geopolitical Recession?
Put simply, the 2015 nuclear deal traded American acquiescence toward Iranian nuclear development in exchange for Iran's cooperation on a number of strategically vital regional issues. By unraveling that détente, President Trump is upending the balance of power in the Middle East and increasing the probability that Iran retaliates. Since penning our latest net assessment of the U.S.-Iran tensions in May, Iran has already retaliated.3 Our checklist for "kinetic" conflict has now risen from zero to at least 15%, if not higher (Table 2). We expect the probability to rise once the U.S. starts implementing the oil embargo in November. This will dovetail our Iran-U.S. decision tree, which sets the subjective probability of kinetic action by the U.S. against Iran at a baseline of 20% (Diagram 1). Table 2Will The U.S. Attack Iran?
2019: The Geopolitical Recession?
2019: The Geopolitical Recession?
Diagram 1Iran-U.S. Tensions Decision Tree
2019: The Geopolitical Recession?
2019: The Geopolitical Recession?
Bottom Line: The premier geopolitical risk to investors in 2019 is that President Trump's maximum pressure tactic on Iran spills over into Iraq, causing a loss of supply from the world's fifth-largest crude producer.4 We expect the U.S. oil embargo against Iran to remove between 1 million and 1.5 million barrels per day from the market. In addition, the loss of Iraqi production due to sabotage could be anywhere between 500,000 and 3.5 million barrels per day. Added to this total is the potential loss of Venezuelan exports due to the deteriorating situation there. When our commodity team combines all of these factors, they generate a worst-case scenario where the price of crude rises to $110 per barrel in 2019 or higher (Chart 3). And this scenario assumes that EMs do not reinstitute energy subsidies (and therefore their consumption falls faster than if they do reinstitute them). Chart 3Worst-Case Scenario Propels Oil Price Toward 0/Barrel
Worst-Case Scenario Propels Oil Price Toward $110/Barrel
Worst-Case Scenario Propels Oil Price Toward $110/Barrel
The Ayatollah Recession We believe that the midterm election is a dud from an investment perspective, no matter the outcome. However, the election does matter as a hurdle that, once cleared, will allow President Trump to renew his "maximum pressure" tactic against China, Iran, and perhaps domestic tech corporations.5 Iran is a critical risk in this strategy. If President Trump applies maximum pressure on Iran, then a reduction in crude exports from Iran, Iranian retaliation in Iraq, and the simultaneous loss of Venezuelan supplies could combine to increase the likelihood of U.S. recession in 2019. Readers might recall that no sitting president has gotten re-elected during a recession. Why would Trump pursue a policy that risks his re-election chances in 2020? Surely he would deviate from his maximum pressure tactic if faced with the prospect of a recession. However, it is folly to assume that policymakers are perfectly rational, or fully informed. American presidents are some of the most unconstrained policymakers in the world, given both the hard power of the United States and the constitutional lack of constraints on the president when it comes to national security. Trump may believe, for instance, that the 660 million barrels of crude in America's Strategic Petroleum Reserve can offset the impact of sanctions against Iran.6 Or he may believe that he can force OPEC to supply enough oil to offset the Iranian losses. The problem for President Trump is that Iran is not led by idiots. Iranian policymakers understand that the best way to reduce American pressure is to induce an oil price spike in the summer of 2019 that hurts President Trump's re-election chances, forcing him to back off. As such, sabotaging Iraqi oil exports, which mainly transit through the port of Basra - a city highly vulnerable to Shia-on-Shia violence that is already a risk to the country's stability - would be an obvious target. An oil price spike would serve as a negotiating tool against the U.S., and the additional revenue would help replace what Iran loses due to the embargo. Tehran and Washington will therefore play a game of chicken throughout 2019, and there is a fair probability that neither side will swerve. President Trump may be making the same mistake as many predecessors have made, assuming that the Iranian regime is teetering at a precipice and that a mere nudge will force the leadership to negotiate. Oil price shocks and recessions have a historical connection. In a recent report, our commodity strategists highlighted that a spike in oil prices preceded 10 out of the past 11 recessions in the U.S. since 1945 (Table 3). Admittedly, not all spikes were followed by recession. The combination of an oil price spike and Fed rate hikes has produced a recession 8 out of 9 times.7 If oil prices rose to $100 per barrel in the coming 6-12 months, there will be several negative macro consequences. In particular, gasoline prices will rise back toward $4 per gallon (Chart 4). Retail gasoline prices have already increased by more than 50% since they bottomed in February 2016. So how much more upside can the U.S. private sector take? Table 3History Of Oil Supply Shocks
2019: The Geopolitical Recession?
2019: The Geopolitical Recession?
Chart 4A Source Of Pressure For Consumers
A Source Of Pressure For Consumers
A Source Of Pressure For Consumers
The Household Sector Consumer confidence is currently near all-time highs, which tends to signal that the path of least resistance is flat or down (Chart 5). Household gasoline consumption has already declined in response to higher oil prices since the middle of 2017. Given that gasoline demand is relatively inelastic, consumers may already be near their minimum consumption level. Chart 5Nearing All-Time Highs
Nearing All-Time Highs
Nearing All-Time Highs
Instead, households will experience a decline in their disposable income. This will come on the back of both higher gasoline prices and an increase in the prices of other goods and services, as the oil spike spills across sectors. U.S. households - and most likely those in other markets - are stretched to the limit already. A recent Fed survey found that 40% of U.S. households do not have the funds needed to meet an unexpected $400 cost in any given month.8 Such an unexpected expense would require them to either sell possessions, borrow, or cut back on other purchases. Chart 6Most Americans Cannot Cut Saving To Spend
Most Americans Cannot Cut Saving To Spend
Most Americans Cannot Cut Saving To Spend
Left with few other options, households would react to their lower disposable income by reducing demand for other goods and services. This dent in consumer spending would bring down aggregate demand, leading to slower employment growth and even less income and spending. Households could save less to maintain their current purchasing levels, given the recent rise in the savings rate (Chart 6). But this is unlikely. Although the household savings rate has increased in recent years, we have previously argued that a material part of the increase was driven by small business-owner profits. These owners have much higher levels of income than the median consumer. For Americans living paycheck-to-paycheck, it would be difficult to reduce a savings rate that is already close to, or below, zero. Higher oil prices will also hurt growth in Europe and Japan, economies that are already struggling to gain economic momentum after grappling with a weaker growth impulse from China. In addition, EM economies that took the opportunity to reform their oil subsidies amid lower oil prices post-2014 will have to grapple with a much larger shock to consumers than usual. The Corporate Sector In theory, what consumers lose from rising oil prices, producers of crude can gain in stronger revenue. This is especially important in the U.S. as domestic energy production has increased significantly over the past 10 years. Nonetheless, the oil and gas extraction sector accounts for just 1.1% of GDP and 0.1% of total employment. The marginal propensity to spend out of every dollar of income is lower for producers than consumers. Moreover, if consumer confidence fell and consumer spending weakened, non-energy capex would decline as businesses reassessed household demand and held off from making investment decisions. Small business confidence is at record highs, and as with consumer confidence, vulnerable to downward revisions (Chart 7). Chart 7Dizzying Heights
Dizzying Heights
Dizzying Heights
Chart 8Only One Way To Go (Down)
Only One Way To Go (Down)
Only One Way To Go (Down)
Profit margins remain at a highly elevated level and also have only one way to go (Chart 8). If high oil prices should combine with rising borrowing costs and upward pressure on wages (which could develop in this macro environment) the result would be a triple hit to margins (Chart 9). Of course, rising wages would give consumers some offset to higher oil prices, so the question will be the net effect of all variables. And if the dollar bull market continues, as our FX team believes it will, the combination of higher oil prices and a strong USD would hurt U.S. companies with international exposure. The debt load held by the U.S. corporate sector would turn this bad dream into a nightmare. Many American companies have spent the past 10 years increasing leverage to buy back equity (Chart 10). Companies with high debt would need to revise down their profit expectations, with potentially devastating consequences. Elevated debt levels also increase the likelihood of financial market stress if bond investors get worried and spreads begin to widen significantly. Chart 9Rising Pressures On Earnings?
Rising Cost Pressures On Earnings
Rising Cost Pressures On Earnings
Chart 10Large Corporate Debts
Large Corporate Debts
Large Corporate Debts
According to all measures, U.S. stocks are at or near their all-time valuation peaks. Investors have also priced in a significant amount of optimism for profit growth (Chart 11). These expectations would be subject to quick revision if our oil shock scenario plays out. In other words, investor expectations for profit margins are not sufficiently factoring the triple hit of higher oil prices, higher interest rates, and higher wages. Chart 11The Market Has High Hopes
The Market Has High Hopes
The Market Has High Hopes
An additional geopolitical risk on the horizon for 2019 is the creeping "stroke of pen" risk from potential regulation of technology enterprises. This is unrelated to an oil price spike (other than that it would be an effect of U.S. policy) but could nonetheless combine with rising energy prices to sour investors' mood.9 Bottom Line: An oil price spike above $100 would produce negative consequences for the U.S. household and corporate sectors. Given the supply-side nature of the price shock, it would not be accompanied by the usual decline in USD, and could therefore hurt the foreign profits of U.S. corporations as well. If investors must also deal with mounting regulatory pressures on FAANG stocks, they could face a perfect storm. Given the high probability of such an oil price shock, why isn't a 2019 recession BCA's House View, rather than merely a risk to it? Because it is difficult to say how high oil prices need to rise to cause a recession. For example, 1973 both marked a permanent move up in oil prices and saw oil prices triple. In 2019 terms, that would mean an oil price above $200, a far less probable scenario than $100-$110. Nevertheless, the combination of elevated oil prices and the price impact on consumer goods of the U.S.-China trade war could combine to create a nightmare scenario for consumers. But it is impossible to gauge the level of both required to push the U.S. into a recession. Second, there are many ways in which today's macro environment is different from that in 1974. In the 1970s the inventory cycle was a key factor in the business cycle, with excesses building up ahead of recessions, forcing output cutbacks as demand weakened. That is no longer the case in today's world of just-in-time inventory management. Also, inflation was a much bigger problem back then, requiring tougher Fed action. On the other hand, debt burdens were much lower. Investment Implications To be clear, none of the usual recession indicators that BCA Research uses are flashing red at this time. The point of this analysis is to illustrate a credible, exogenous scenario that cannot be revealed through the usual data-driven recession forecasting methods. What happens if a recession does occur ahead of the 2020 election? How would President Trump react to a recession induced by his foreign policy adventurism in the Middle East? By doing what every other president would do: finding someone else to blame. In this case, we would put high odds on the Federal Reserve becoming the target of President Trump's fury. Ahead of 2020, the Fed and its independence may very well become an election issue.10 This could spell serious trouble for the Fed, which is at a massive disadvantage when it comes to explaining to voters why central bank independence is so important. The Fed had great difficulty managing public opinion regarding its extraordinary measures to combat the Great Recession - its attempts at public outreach largely failed. Compare the number of Trump's Twitter followers to that of the Fed's (Chart 12). Chart 12The Fed's PR Abilities Are Limited
2019: The Geopolitical Recession?
2019: The Geopolitical Recession?
Though most of our clients and colleagues will probably disagree, we do not see central bank independence as a static quality. It was bestowed upon central banks by politicians following widespread inflation fears throughout the 1970s and 1980s, although in the U.S. the current tradition goes back to the 1951 Treasury Accord that restored the independence of the Fed. Our colleague Martin Barnes penned a report on the politicization of monetary policy in 2013.11 His conclusion is that political meddling in monetary affairs is less pernicious than economic performance. The Fed will incur Trump's ire, in other words, but it will be its failure to generate economic growth that causes a break in independence. We are not so sure. The next recession is likely to be a mild one for Main Street given the lack of real economic bubbles. But given the slow recovery in real wages over the past decade and the general angst of the populace towards governing elites, even a mild recession that merely reminds voters of 2008-2009 could produce deep anxiety and significant public reactions. Further, the idea of "independent," non-politically accountable institutions is going out of style. President Trump - and other policymakers in the developed world - have specifically targeted the "so-called experts" and "institutions." President Trump has attacked America's foreign policy architecture, NATO, the WTO, and a slew of supposedly outdated norms and practices for being "out of touch" with the electorate. This policy has served him well thus far. If our nightmare scenario of an oil price-induced recession plays out, the immediate implication for investors will be a sharp downturn in risk assets. As such, we are recommending that investors hedge their portfolios with a long Brent / short S&P 500 trade. Alternatively we would recommend going long U.S. energy / short technology stocks. A longer-term, and perhaps even more pernicious implication, would be the end of the era of central bank independence and a full politicization of the economy. Laissez-faire capitalist system would give way to dirigisme. In the process, the U.S. dollar and Treasuries would be doomed. Jim Mylonas, Global Strategist Daily Insights & BCA Academy jim@bcaresearch.com Marko Papic, Senior Vice President Chief Geopolitical Strategist marko@bcaresearch.com 1 Please see BCA Research Special Report, "Beware The 2019 Trump Recession," dated March 7, 2017, and Global Investment Strategy Weekly Report, "The Timing Of The Next Recession," dated June 16, 2017, available at gis.bcaresearch.com. 2 Please see BCA Research Geopolitical Strategy and Commodity & Energy Strategy Special Report, "U.S., OPEC Talk Oil Prices Down; Gulf Tensions Could Become Kinetic," dated July 19, 2018, available at gps.bcaresearch.com. 3 Please see BCA Research Geopolitical Strategy Special Report, "Why Conflict With Iran Is A Big Deal - And Why Iraq Is The Prize," dated May 30, 2018, available at gps.bcaresearch.com. 4 Please see BCA Geopolitical Strategy Weekly Report, "Fade The Midterms, Not Iraq Or Brexit," dated September 12, 2018 and "Iraq: The Fulcrum Of Middle East Geopolitics And Global Oil Supply," dated September 5, 2018, available at gps.bcaresearch.com. 5 Please see BCA Research Geopolitical Strategy Weekly Report, "A Story Told Through Charts: The U.S. Midterm Election," dated September 19, 2018, available at gps.bcaresearch.com. 6 The Strategic Petroleum Reserve currently covers 100 days of net crude imports, or 200 days of net petroleum imports, and can be tapped for reasons of political timing as well as international emergencies. 7 Please see BCA Commodity & Energy Strategy Weekly Report, "Oil-Supply Shock, Rising U.S. Rates Favor Gold As A Portfolio Hedge," dated September 13, 2018, available at bcaresearch.com. 8 Please see the U.S. Federal Reserve, "Report on the Economic Well-Being of U.S. Households in 2017," May 2018, available at federalreserve.gov. 9 Please see BCA Geopolitical Strategy and U.S. Equity Strategy Special Report, "Is The Stock Rally Long In The FAANG?" dated August 1, 2018, available at gps.bcaresearch.com. 10 Please see BCA Daily Insights, "Politics And Monetary Policy," dated August 22, 2018, and "The Battle Of The Press Conferences: Trump Versus Powell," dated September 27, 2018, available at dailyinsights.bcaresearch.com. 11 Please see BCA Special Report, "The Politicization Of Monetary Policy: Should We Care?" dated April 15, 2013, available at bca.bcaresearch.com. Geopolitical Calendar
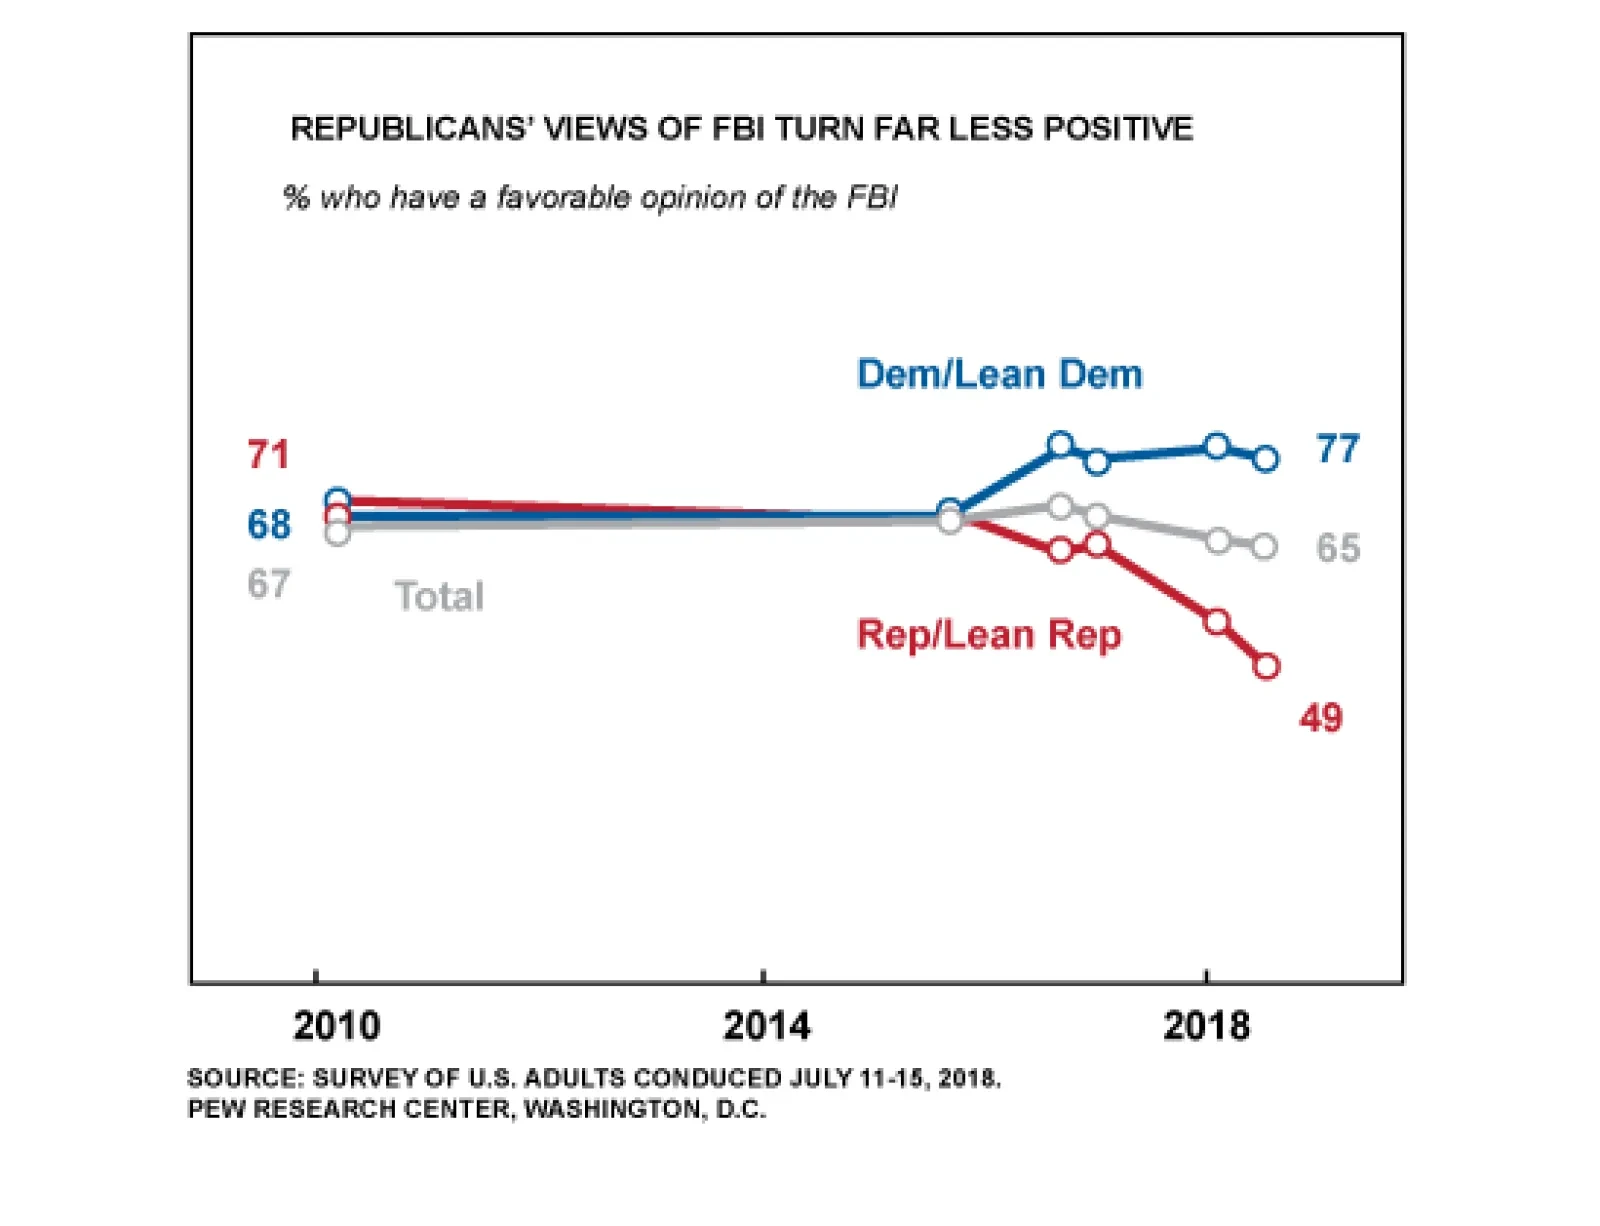
In response to the Fed’s expected rate hike earlier this week, President Trump re-engaged with the Fed by criticizing its decision to move rates higher and further tighten monetary conditions. Several of our strategists have highlighted that monetary…