Global vs Domestic
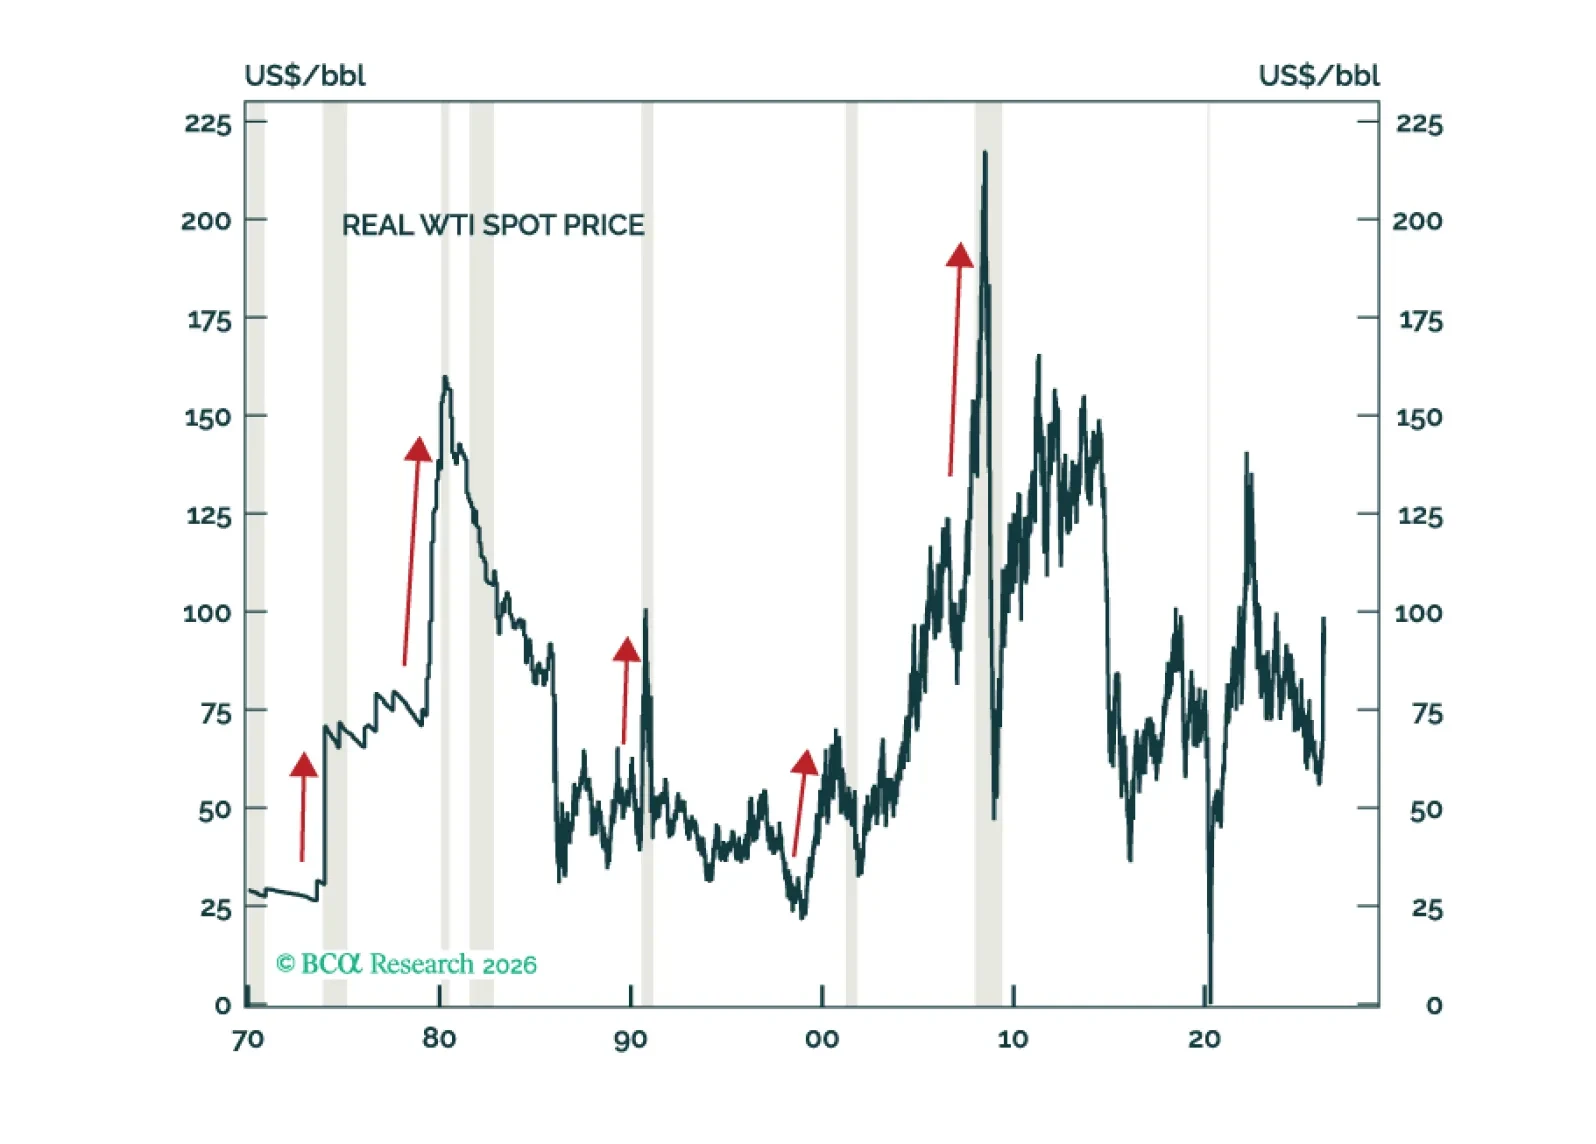
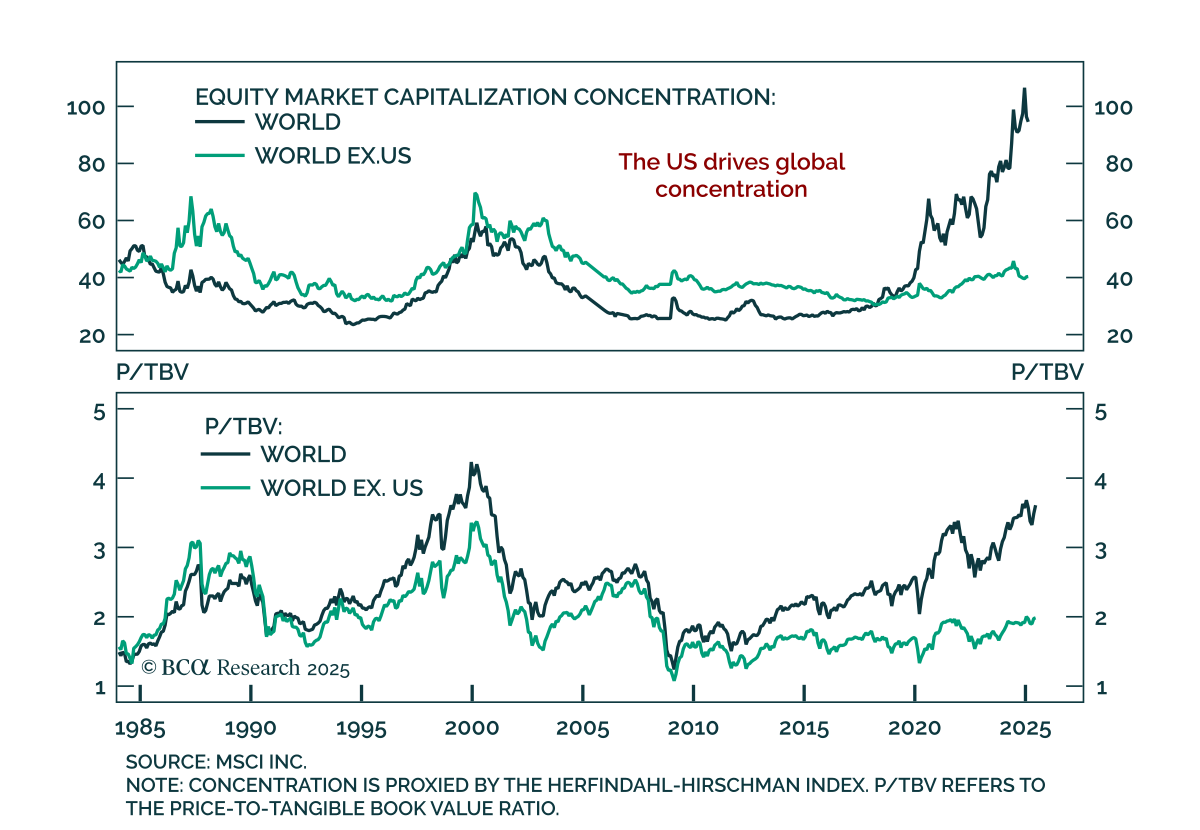
The current macro environment is a toxic brew of many of the same vulnerabilities that haunted the global economy in the lead-up to past recessions: Rising oil prices, an unsustainable tech capex boom, elevated equity valuations, excessively high homes prices, and brewing stresses in private credit and other parts of the financial system. While global equities look increasingly oversold in the very near term, they will still finish the year below current levels.
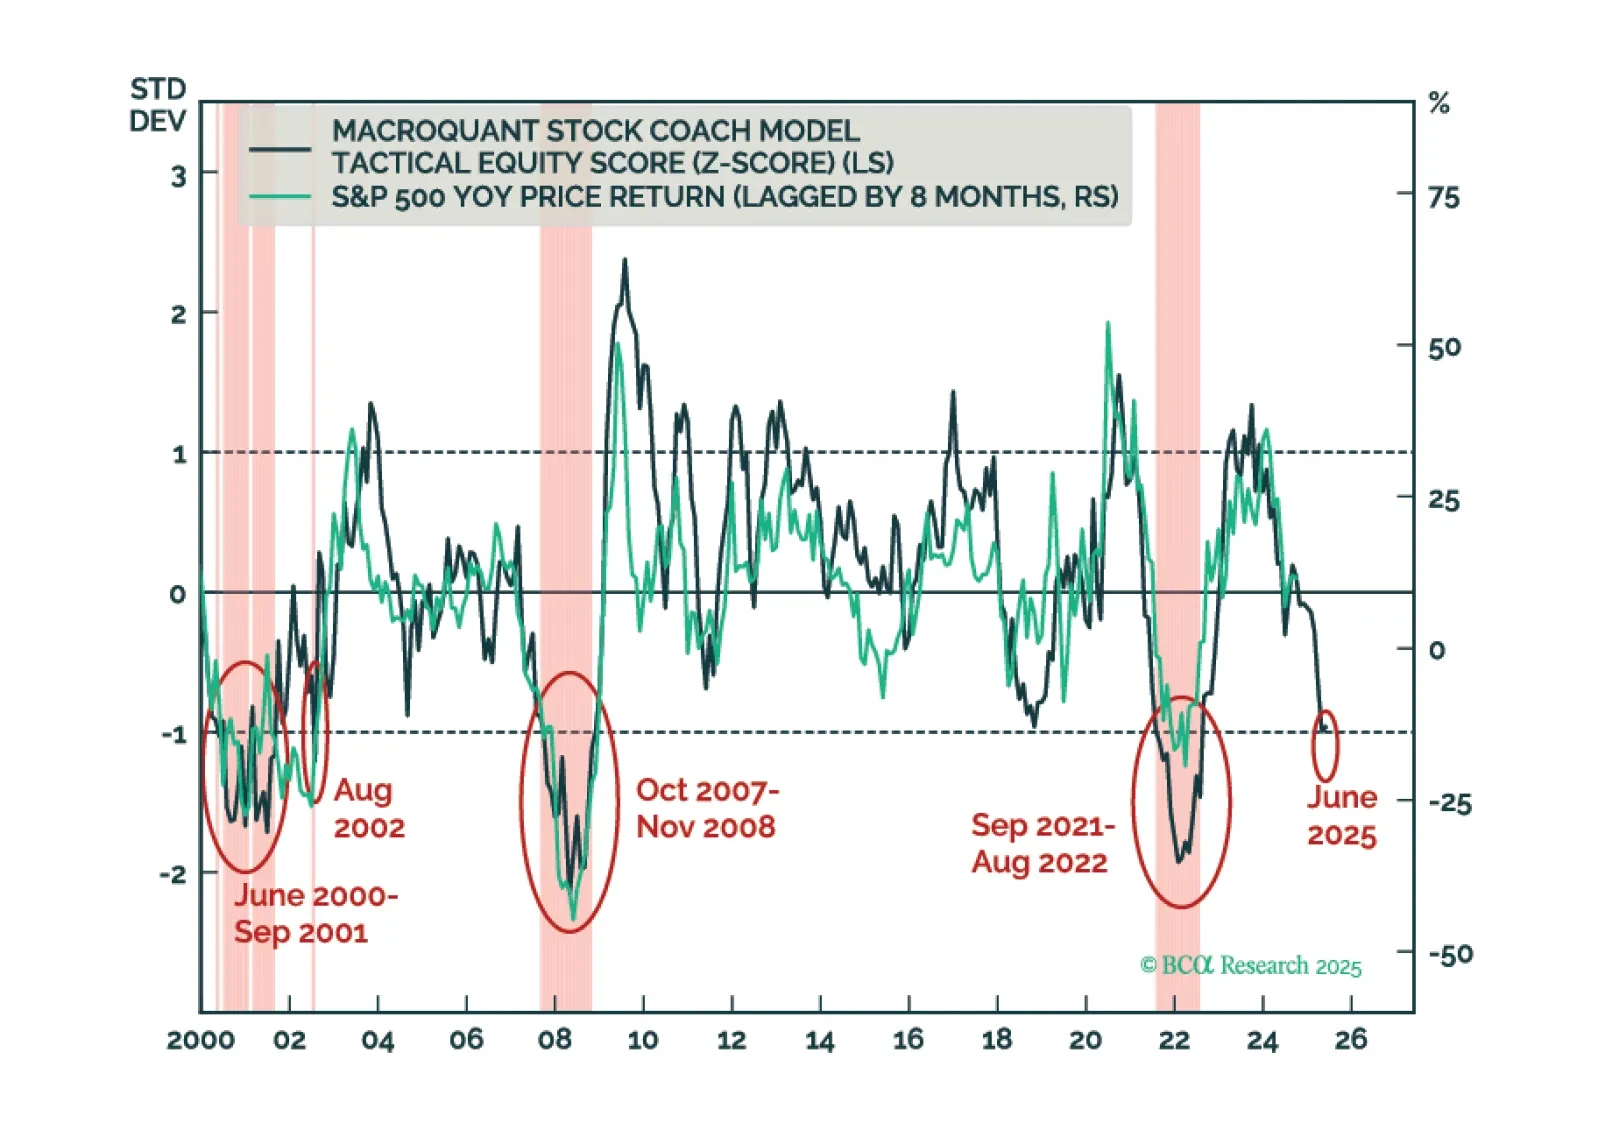
Investors should modestly underweight equities in their portfolios and look to turn more aggressively defensive once the whites of the recession’s eyes are visible. We think that will happen within the next few months.
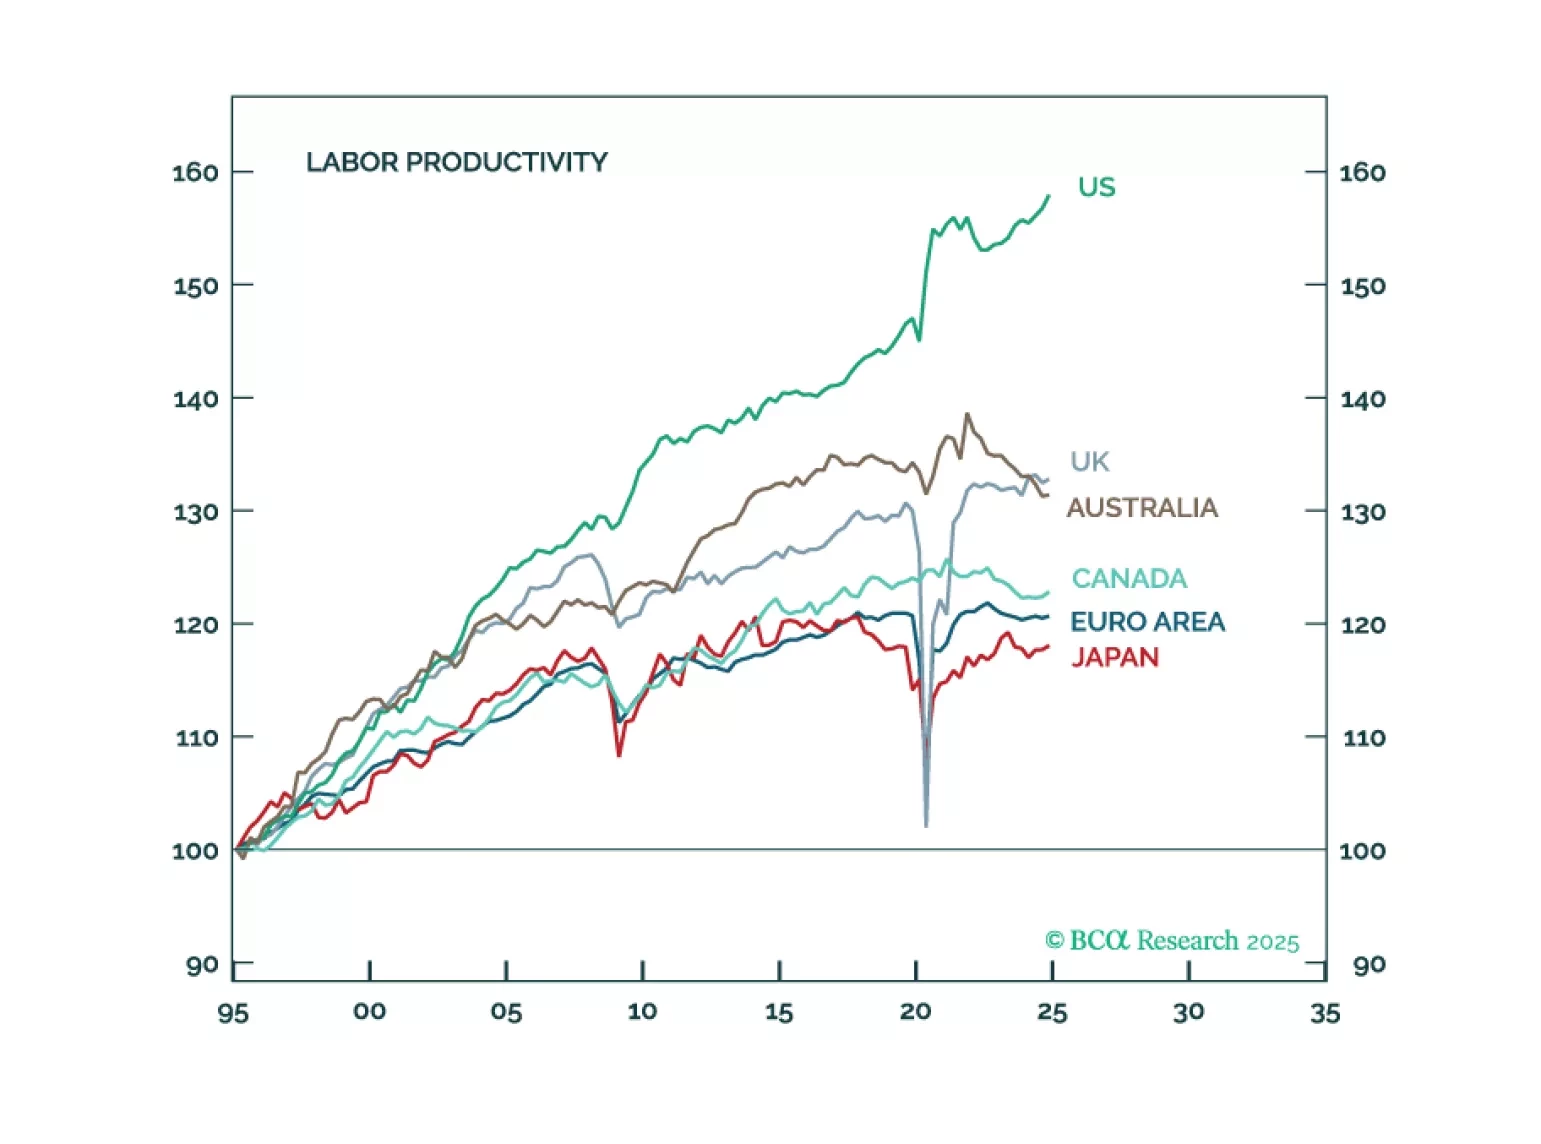
Although the sell-off in the US dollar and relative outperformance of non-US stocks will pause over the coming months as a global recession begins, the fading of US exceptionalism will still cause the dollar to weaken and US stocks to underperform over a multi-year horizon.
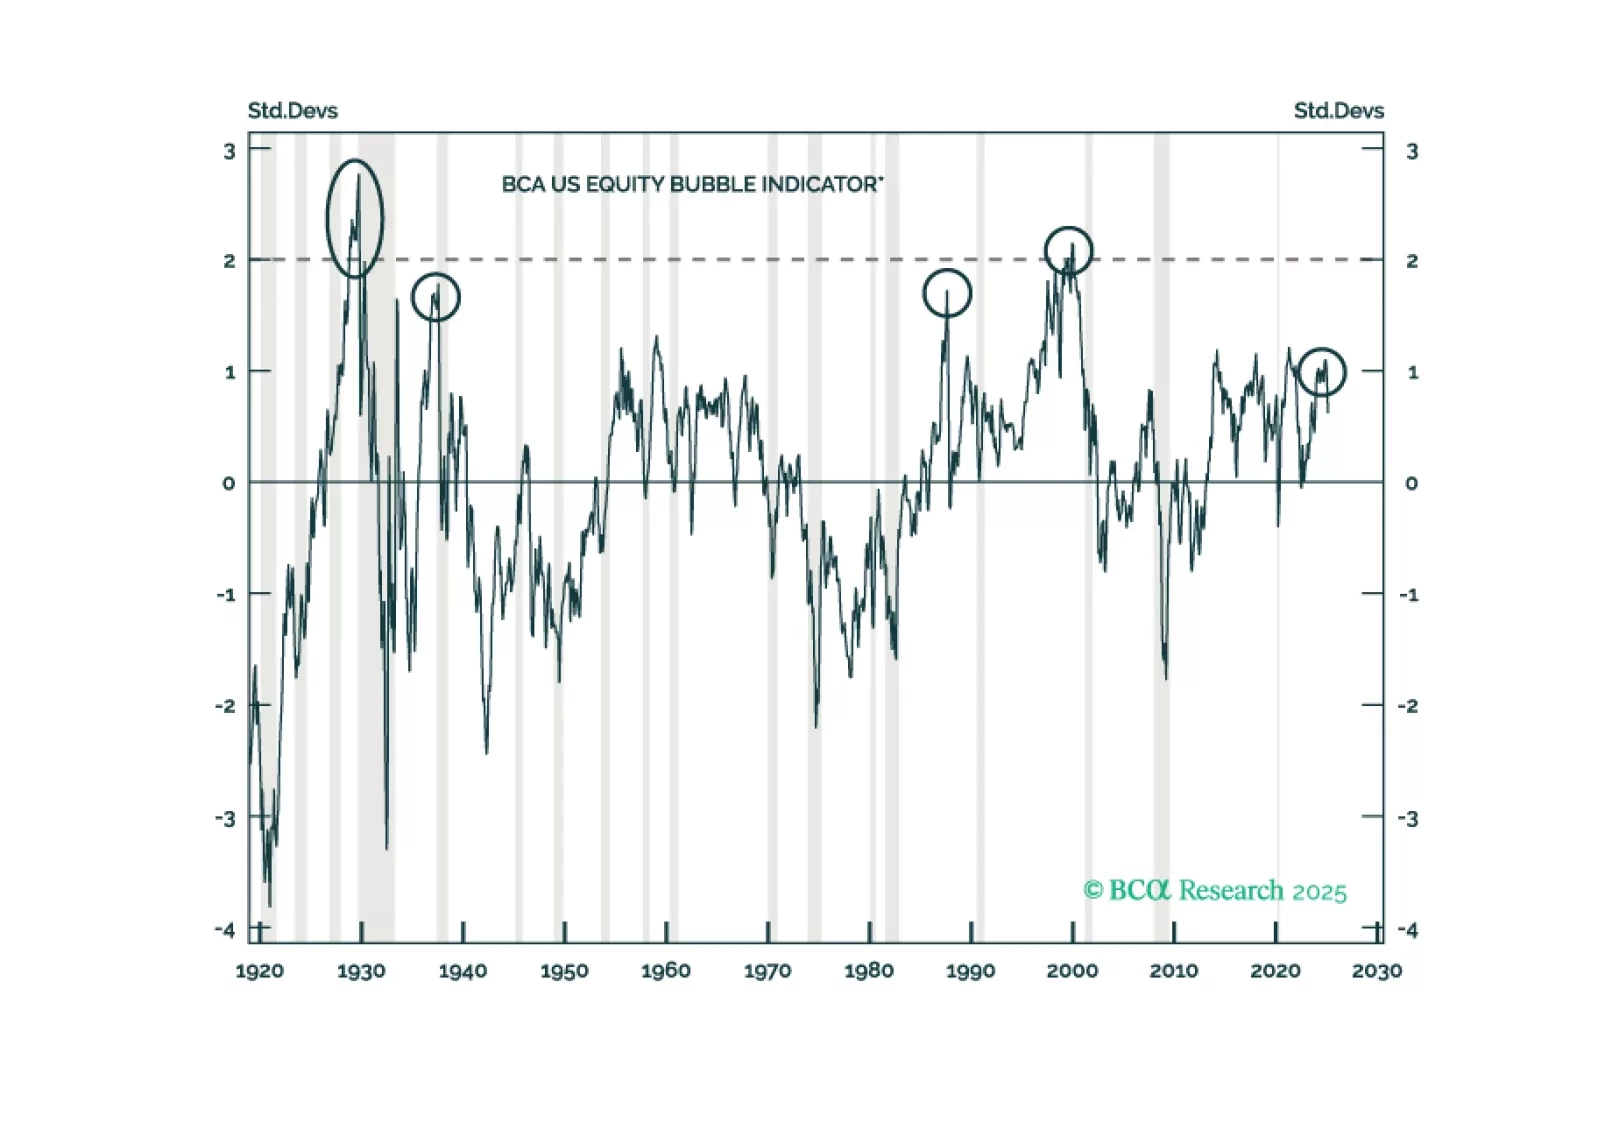
In Section II, Jonathan presents a new indicator that investors can use to track the odds of bubble formation in real time and shows how it fits into a larger framework that accurately explains US bear market severity over the past century. The US equity market is not in a bubble today, but it is meaningfully overvalued. Investors should expect a relatively severe cumulative loss from equities in a recession scenario.
In Section I, Doug notes that weak US consumer sentiment is beginning to manifest. A wide sweep of consumer-facing companies have lowered guidance, and monoline credit card lenders shed nearly 20% over just three weeks across late February and early March. If the US enters a recession sometime this year as we expect, it will likely lead to a global recession and a global equity bear market. Investors should remain defensively positioned. In Section II, Jonathan presents a new indicator that investors can use to track the odds of bubble formation in real time and shows how it fits into a larger framework that accurately explains US bear market severity over the past century. The US equity market is not in a bubble today, but it is meaningfully overvalued. Investors should expect a relatively severe cumulative loss from equities in a recession scenario.
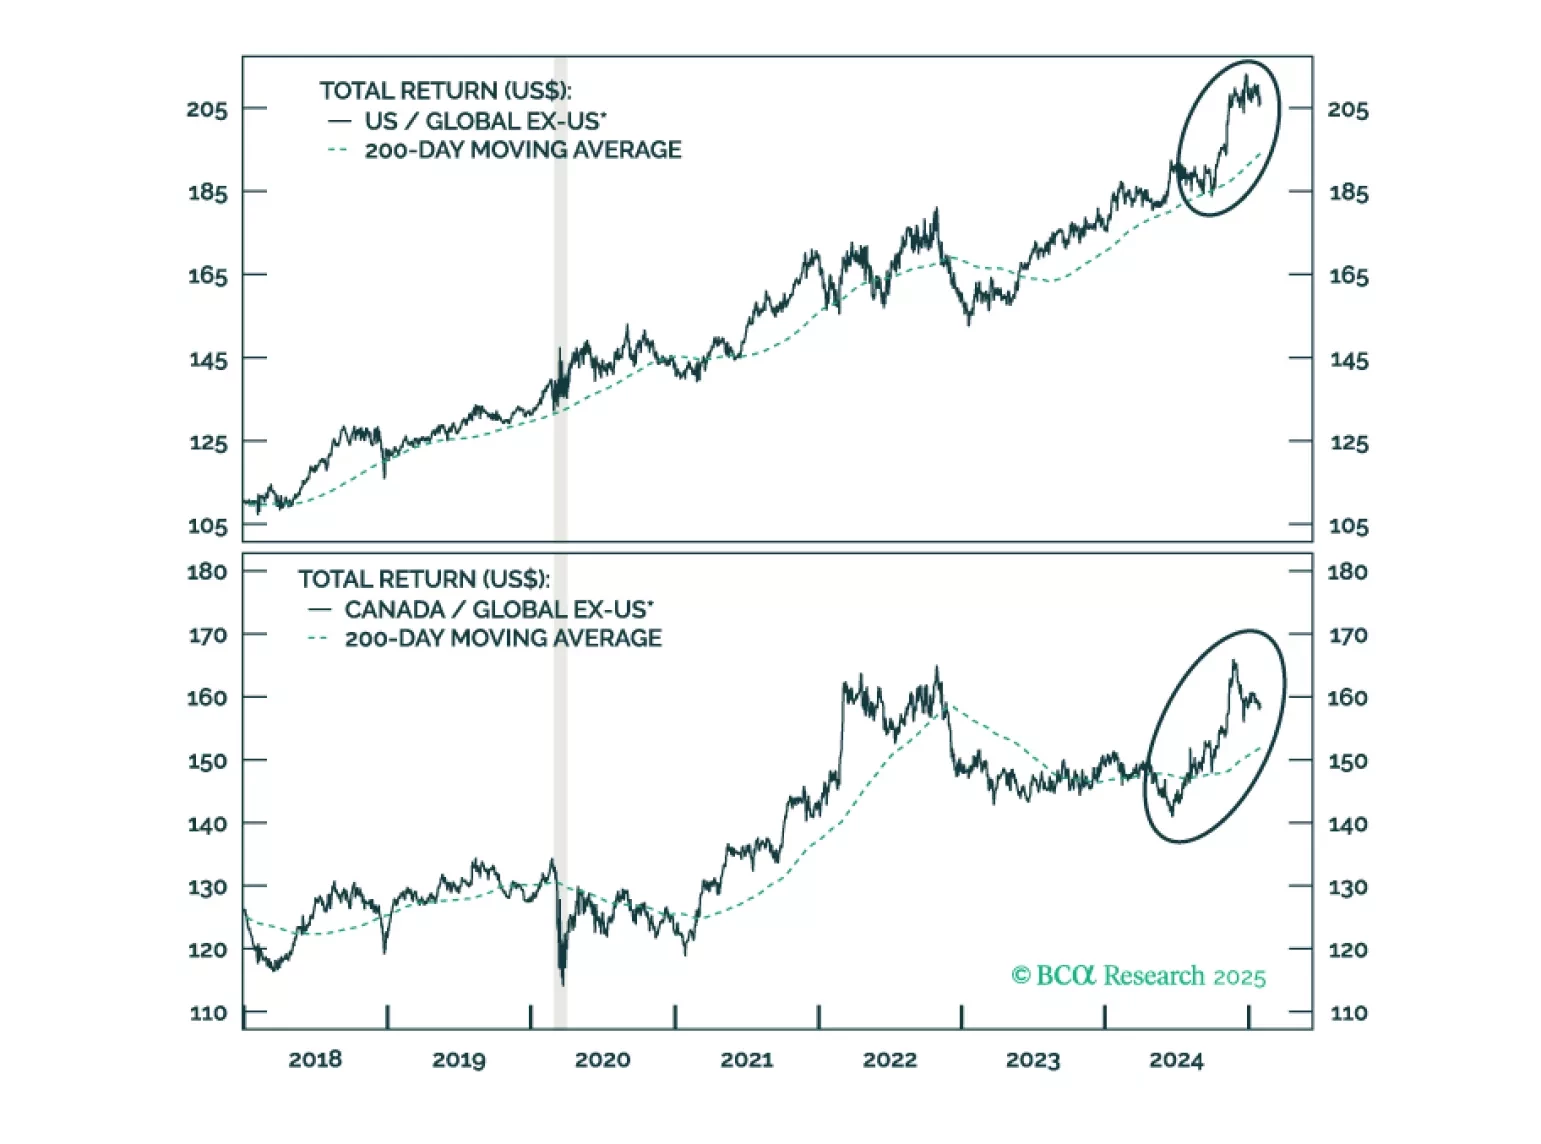
Jonathan provides an update on Canada following strong performance from Canadian stocks last year. On a tactical basis, underweight Canada versus global ex-US on the expectation of tariffs targeting Canada and Mexico. Following a sell off, or if a trade war is avoided, investors should place Canadian stocks on upgrade watch with the goal of moving to a modest overweight versus global ex-US.
Paradoxically, raging optimism on the US economy is making a reacceleration in growth less likely in 2025. The reaction of the bond market has made the Fed rethink its cutting campaign. Markets are also constraining Trump’s agenda. US manufacturing will not recover with a surging dollar. Fears of inflation and debt sustainability have made moderate House Republicans push back against the President Elect’s wishes. Given the sky-high optimism embedded in asset prices, we believe a defensive portfolio stance is warranted on a 12-month horizon. Overweight gold to hedge the risk of a fiscal crisis.
This is the time of the year when strategists are busy sending out their annual outlooks. Here on the Global Investment Strategy team, we decided to go one step further. Rather than pontificating about what could happen in 2025, we decided to harness the power of the multiverse to tell you what did happen (in at least one highly representative timeline).
Next week, please join me for a Webcast on Tuesday, December 17 at 10:30 AM EST (3:30 PM GMT, 4:30 PM CET) to discuss the economy and financial markets.
And with that, I will sign off for the year. I wish you and your loved ones a very happy and healthy 2025. We will be back in the first week of January with our MacroQuant Model Update.