Gov Sovereigns/Treasurys

Feature Since the end of the first quarter, the decline in Treasury yields has been the most important trend in global financial markets. It has contributed to the return of the outperformance of growth stocks relative to value stocks, the underperformance of Eurozone equities relative to the S&P 500, and the tepid results of cyclicals relative to defensive equities. This decline in yields is a temporary phenomenon, because the global economy continues to re-open and inventory levels remain so low that further restocking is in the cards. The cyclical picture is not without blemish; COVID-19 variants remain a concern. However, if these risks were to materialize into another delayed re-opening, then further reflationary efforts by both monetary and fiscal authorities would buoy financial markets. The greatest near-term worry for the global economy and markets comes from China. The Chinese credit impulse is slowing markedly and fiscal support has yet to come to the rescue. This phenomenon is the main reason why this publication maintains a cautious tactical stance on Eurozone cyclical stocks, even if we believe these sectors have ample scope to outperform over the remainder of the business cycle. As a corollary, we believe that yields will likely remain within range this summer and Eurozone benchmarks will lag behind the US. This week, we review key charts, organized by theme, highlighting some of these key concepts. As an aside, none covers inflation. Even if the balance of evidence suggests that any sharp increase in Eurozone inflation will be temporary, the proof will only become more visible by early 2022. The Opening Is On Track… The pace of vaccination across the major Eurozone economies has picked up meaningfully since the spring. Consequently, the number of doses distributed per capita is rapidly approaching that of the US, even as it still lags behind that of the UK (Chart 1). As a result of this improvement, the stringency of lockdown measures is declining, which is allowing European mobility to recover (Chart 2). While this phenomenon is evident around the world, EM still lag in terms of vaccination rates. However, the Global Health Innovation Center at Duke University expects 10 billion vaccine doses to be produced by the year’s end, which will be enough to inoculate most (if not all) the vulnerable people in the world by early 2022. Consequently, the re-opening of the economy will remain a potent tailwind behind global growth for three or four more quarters. Chart 1Vaccination Progress...
Vaccination Progress...
Vaccination Progress...
Chart 2...Leads To Greater Activity
...Leads To Greater Activity
...Leads To Greater Activity
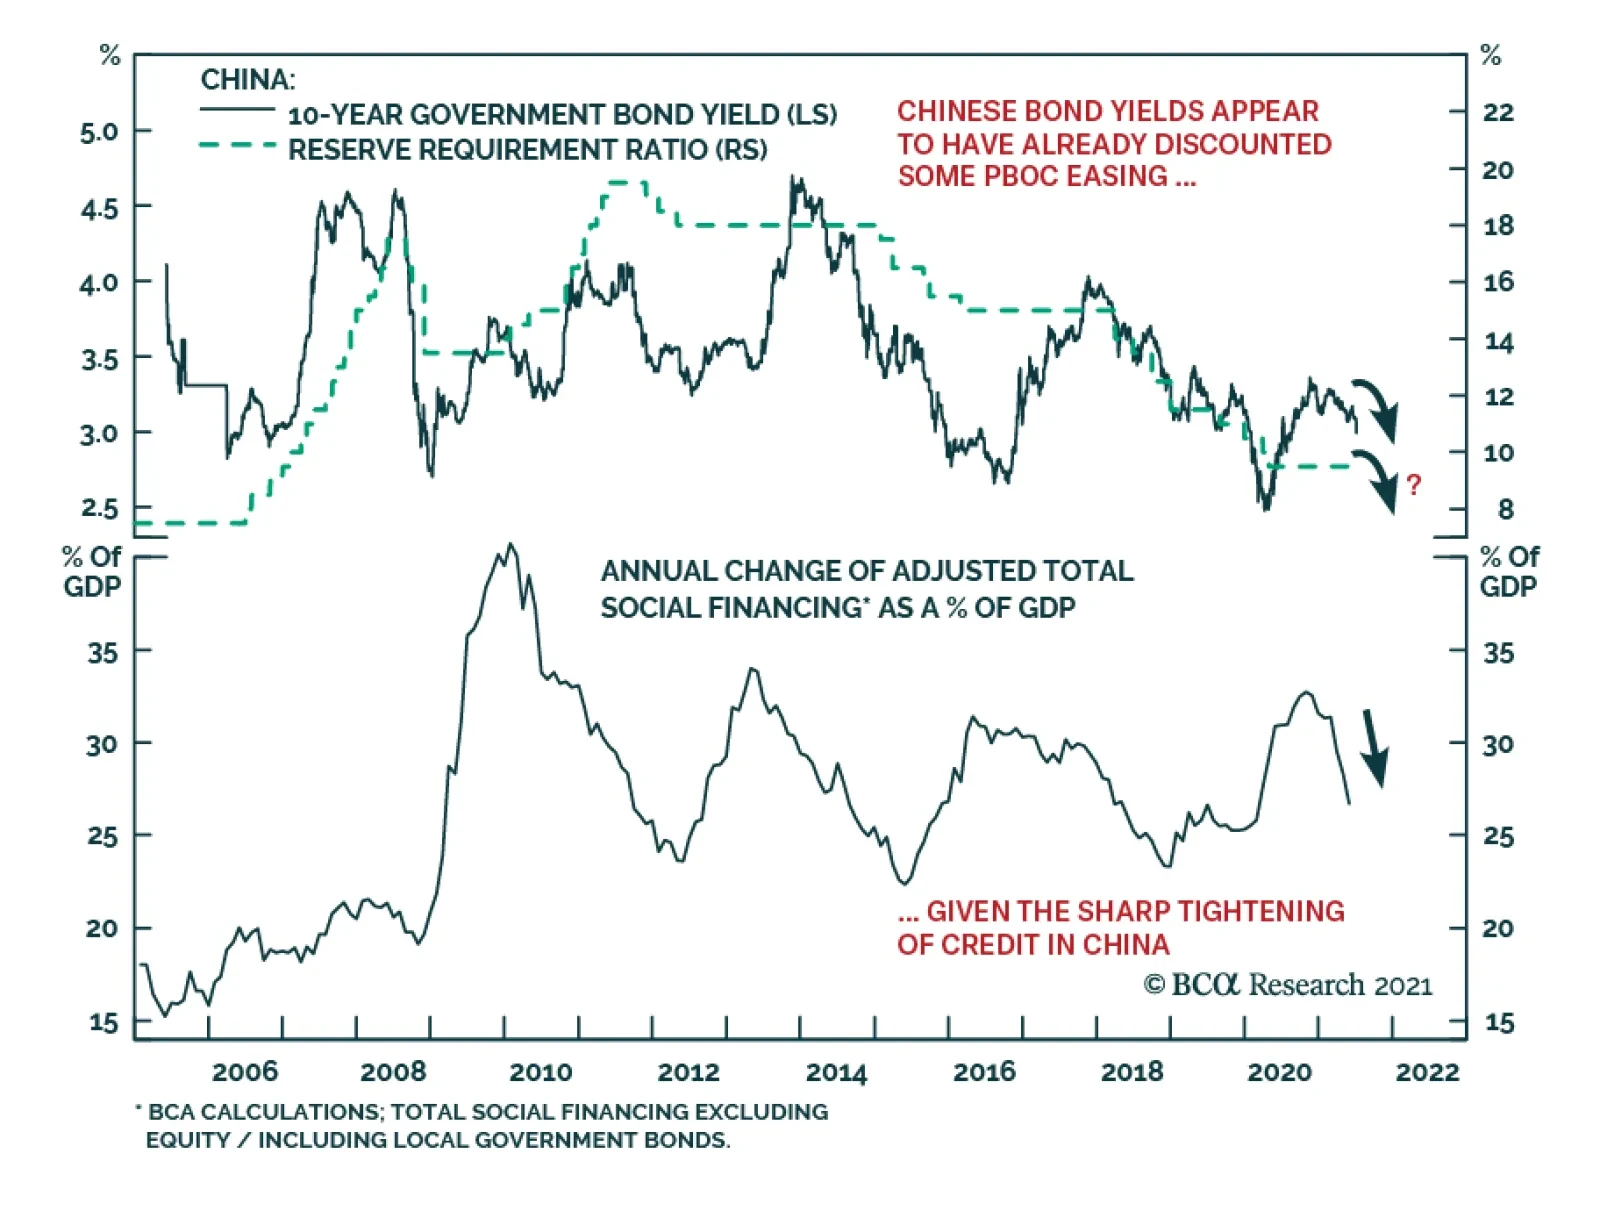
… But Near-Term Headwinds Remain The re-opening of the global economy will allow growth to stay well above trend for the upcoming 12 months, at least. Global industrial activity could nonetheless decelerate this summer. Input costs have risen. The two most important ones, oil and interest rates, are already consistent with a peak in the US ISM manufacturing and the global PMI (Chart 3). In this context, the decelerating Chinese credit impulse is concerning (Chart 4) because it portends a hit to global trade and industrial activity. The effect of this slowdown should be most evident in the third and fourth quarters of 2021. However, it will be temporary because Beijing only wants credit to grow in line with GDP, rather than an outright deleveraging. Thus, the credit impulse will stabilize before the year’s end, which will allow the positive effect of the global re-opening to be fully experienced once again. Chart 3Rising Input Costs...
Rising Input Costs...
Rising Input Costs...
Chart 4...And China's Credit Slowdown Matter
...And China's Credit Slowdown Matter
...And China's Credit Slowdown Matter
Domestic Tailwind In Europe Despite the extreme sensitivity of the European economy to the global business cycle, Europe should continue to produce positive surprises. The supports to the domestic economy are strong. The NGEU funds means that Europe will suffer one of the smallest fiscal drag among G-10 nations next year. Moreover, the re-opening will support household income and allow the positive effect of the increase in the money supply to buoy consumption (Chart 5). Finally, rising consumer confidence, and the ebbing propensity to save will reinforce the tailwinds behind consumption (Chart 6). Chart 5Europe's Domestic Activity
Europe's Domestic Activity
Europe's Domestic Activity
Chart 6...Will Improve Further
...Will Improve Further
...Will Improve Further
Higher Bond Yields Are Coming… The environment continues to support higher yields. Our BCA Pipeline Inflation Indicator is surging, which historically translates into higher global borrowing costs (Chart 7). Most importantly, our Nominal Cyclical Spending Proxy remains very robust, which normally leads to rising yields (Chart 8). While US inflation expectations at the short end of the curve already fully reflect current inflationary pressures, the 5-year/5-year forward inflation breakeven rates will have additional upside. Moreover, the term premium and real rates remain depressed, and policy normalization will cause these variables to climb higher over time. Chart 7Higher Yields Will Come...
Higher Yields Will Come...
Higher Yields Will Come...
Chart 8...Later This Year
...Later This Year
...Later This Year
… But Not This Summer It could take some time before the bearish backdrop for bonds results in higher bond yields. First, bonds have yet to purge fully their oversold status created by the 125 basis-point surge that took place between August 2020 and March 2021 (Chart 9). This vulnerability is even more salient in an environment in which the Chinese credit impulse is decelerating. As Chart 10 illustrates, a slowing total social financing number reliably leads to bond rallies. While the chart looks dire for bond bears, it must be placed in context, in which global fiscal policy remains accommodative considering the decline in the private sector savings rate and in which Advanced Economies’ capex will stay strong. Thus, instead of betting on a large swoon in yields in the coming quarters, we expect US yields to remain stuck between 1.20% and 1.70% for a few more months before they resume their upward path once the Chinese economy stabilizes. Chart 9But Bonds Are Still Oversold...
But Bonds Are Still Oversold...
But Bonds Are Still Oversold...
Chart 10...And Fundamentals Cap Yields For Now
...And Fundamentals Cap Yields For Now
...And Fundamentals Cap Yields For Now
A Positive Cyclical Backdrop For The Euro The near-term forces suggest that the euro will remain range bound over the summer, between 1.16 and 1.23. EUR/USD is a pro-cyclical pair, and so the near-term lack of upside to global growth will act as a temporary ceiling on this currency. Nonetheless, the 18-month outlook continues to favor the common currency. Investors have shed Eurozone exposure for more than 10 years and are structurally underweight this region (Chart 11). Hence, EUR/USD should benefit from any positive reassessment of the growth path in the Euro Area compared to that of the US. Additionally, the euro benefits from a structural current account surplus compared to the USD, which translates into a positive basic balance of payments (Chart 12). In an environment in which US real interest rates are low in relation to foreign ones and in which the Fed wants to maintain accommodative monetary conditions to achieve maximum employment, the capital account balance is unlikely to come to the rescue of the dollar. In this context, EUR/USD still possesses significant cyclical upside and is likely to move back above 1.30 by the year’s end of 2022. Chart 11Investors Underweight Eurozone Assets...
Investors Underweight Eurozone Assets...
Investors Underweight Eurozone Assets...
Chart 12...And The BoP Favors The Euro
...And The BoP Favors The Euro
...And The BoP Favors The Euro
The Bull Market In Global Stocks Is Not Over The cyclical outlook for equities remains supportive. To begin with, in most years, equities eke out positive returns, as long as a recession is not around the corner; we do not expect a recession anytime soon. Moreover, while the balance of valuation risk and monetary accommodation is not as supportive of stocks as it was last year, it is not pointing to an imminent deep pullback either (Chart 13). The equity risk premium echoes this message. Our ERP measure adjusts for the expected growth rate of earnings as well as the lack of stationarity of the ERP. According to this indicator, equities are not an urgent buy, but they are not at risk of a bear market either (Chart 14). This combination does not prevent corrections, but it suggests that pullbacks of 10% are to be bought. Chart 13Equities Are Not A Screaming Buy...
Equities Are Not A Screaming Buy...
Equities Are Not A Screaming Buy...
Chart 14...Nor A Screaming Sell
...Nor A Screaming Sell
...Nor A Screaming Sell
Europe’s Structural Underperformance Is Intact… Eurozone stocks have been underperforming their US counterparts since the GFC. As Chart 15 highlights, this subpar performance reflects the decline in European EPS relative to US ones. There is very little case to be made for this underperformance to end on a structural basis. Europe remains saddled with an excessive capital stock and ageing assets. This combination is weighing on European profit margins and RoE (Chart 16). To put an end to this structural underperformance, either European firms will have to consolidate within each industry (allowing cuts to the excess capital stock, to increase concentration, and to boost profit margins) or the regulatory burden must rise in the US to curtail rates of returns in relation to European levels. Chart 15Europe's Underperformance...
Europe's Underperformance...
Europe's Underperformance...
Chart 16...Reflects Profitability Problems
...Reflects Profitability Problems
...Reflects Profitability Problems
…But The Window For A Cyclical Outperformance Remains Open Despite a challenging structural backdrop, European equities have a window to outperform US stocks, similar to the outperformance of Japan from 1999 to 2006, which only marked a pause within a prolonged relative bear market. European stocks beat their US counterparts when global yields rise (Chart 17). This is because European benchmarks underweight growth stocks relative to US markets. The effect of higher yields on the relative performance of the Euro Area is not limited to the impact of higher discount rates. Yields rise when global economic activity is above trend. As Chart 18 highlights, robust readings of our Global Growth Indicator correlate with an outperformance of the EPS of value stocks compared to growth equities. Thus, when rates rise, Europe should enjoy both a period of re-rating relative to the US and stronger profits. Chart 17Yields Drive European Stocks...
Yields Drive European Stocks...
Yields Drive European Stocks...
Chart 18...And So Does Global Growth
...And So Does Global Growth
...And So Does Global Growth
Positives For Euro Area Financials Like the broad European market, the financials’ fluctuations are linked to interest rates. Moreover, Euro Area banks also move in line with EUR/USD (Chart 19). As a result, our positive view on both yields and the euro for the next 18 months or so should translate into an outperformance of financials in Europe. Additionally, European banks are inexpensive, embedding not just depressed long-term growth expectations, but also a wide risk premium. Europe’s structural problems mean that investors are correct to expect poor earnings growth from the region’s banks. However, the risk premium is overdone. Eurozone banks are much safer than they were 10 years ago. Banks now sport significantly higher Tier 1 capital adequacy ratios and NPLs have shrunk considerably (Chart 20). Moreover, governmental supports and credit guarantees implemented during the pandemic should limit the upside to NPL in the coming quarters. Finally, the so-called doom-loop that used to bind government and bank solvency together is not as problematic as it once was, because the ECB is a willing buyer of government paper and the NGEU programs create the embryo of fiscal risk sharing that limit these dynamics. As a result, investors should overweight this sector for the next 18 months. Chart 19Financials Have A Window To Shine...
Financials Have A Window To Shine...
Financials Have A Window To Shine...
Chart 20...And Are Less Risky
...And Are Less Risky
...And Are Less Risky
A Tactical Hedge Our worries about the impact on the global economy of the Chinese credit slowdown are likely to prompt some downside in European cyclical equities relative to defensive ones. Moreover, cyclicals are still significantly overbought relative to defensives, while our relative Combined Mechanical Valuation Indicator confirms the near-term threat (Chart 21). A high-octane vehicle to play this tactical underperformance of cyclicals relative to defensives is to buy Euro Area telecom stocks relative to consumer discretionary equities. Not only are the discretionary stocks massively overbought and expensive relative to telecoms (Chart 22), they also offer a lower RoE. This backdrop makes the short discretionary / long telecoms bet a great hedge for portfolios with a pro-cyclical bias over one- to two-year horizons. Chart 21Cyclicals Are Tactically Vulnerable...
Cyclicals Are Tactically Vulnerable...
Cyclicals Are Tactically Vulnerable...
Chart 22...But This Risk Can Be Hedged Away
...But This Risk Can Be Hedged Away
...But This Risk Can Be Hedged Away
Currency Performance Currency Performance
Summer Charts
Summer Charts
Fixed Income Performance Government Bonds
Summer Charts
Summer Charts
Corporate Bonds
Summer Charts
Summer Charts
Equity Performance Major Stock Indices
Summer Charts
Summer Charts
Geographic Performance
Summer Charts
Summer Charts
Sector Performance
Summer Charts
Summer Charts
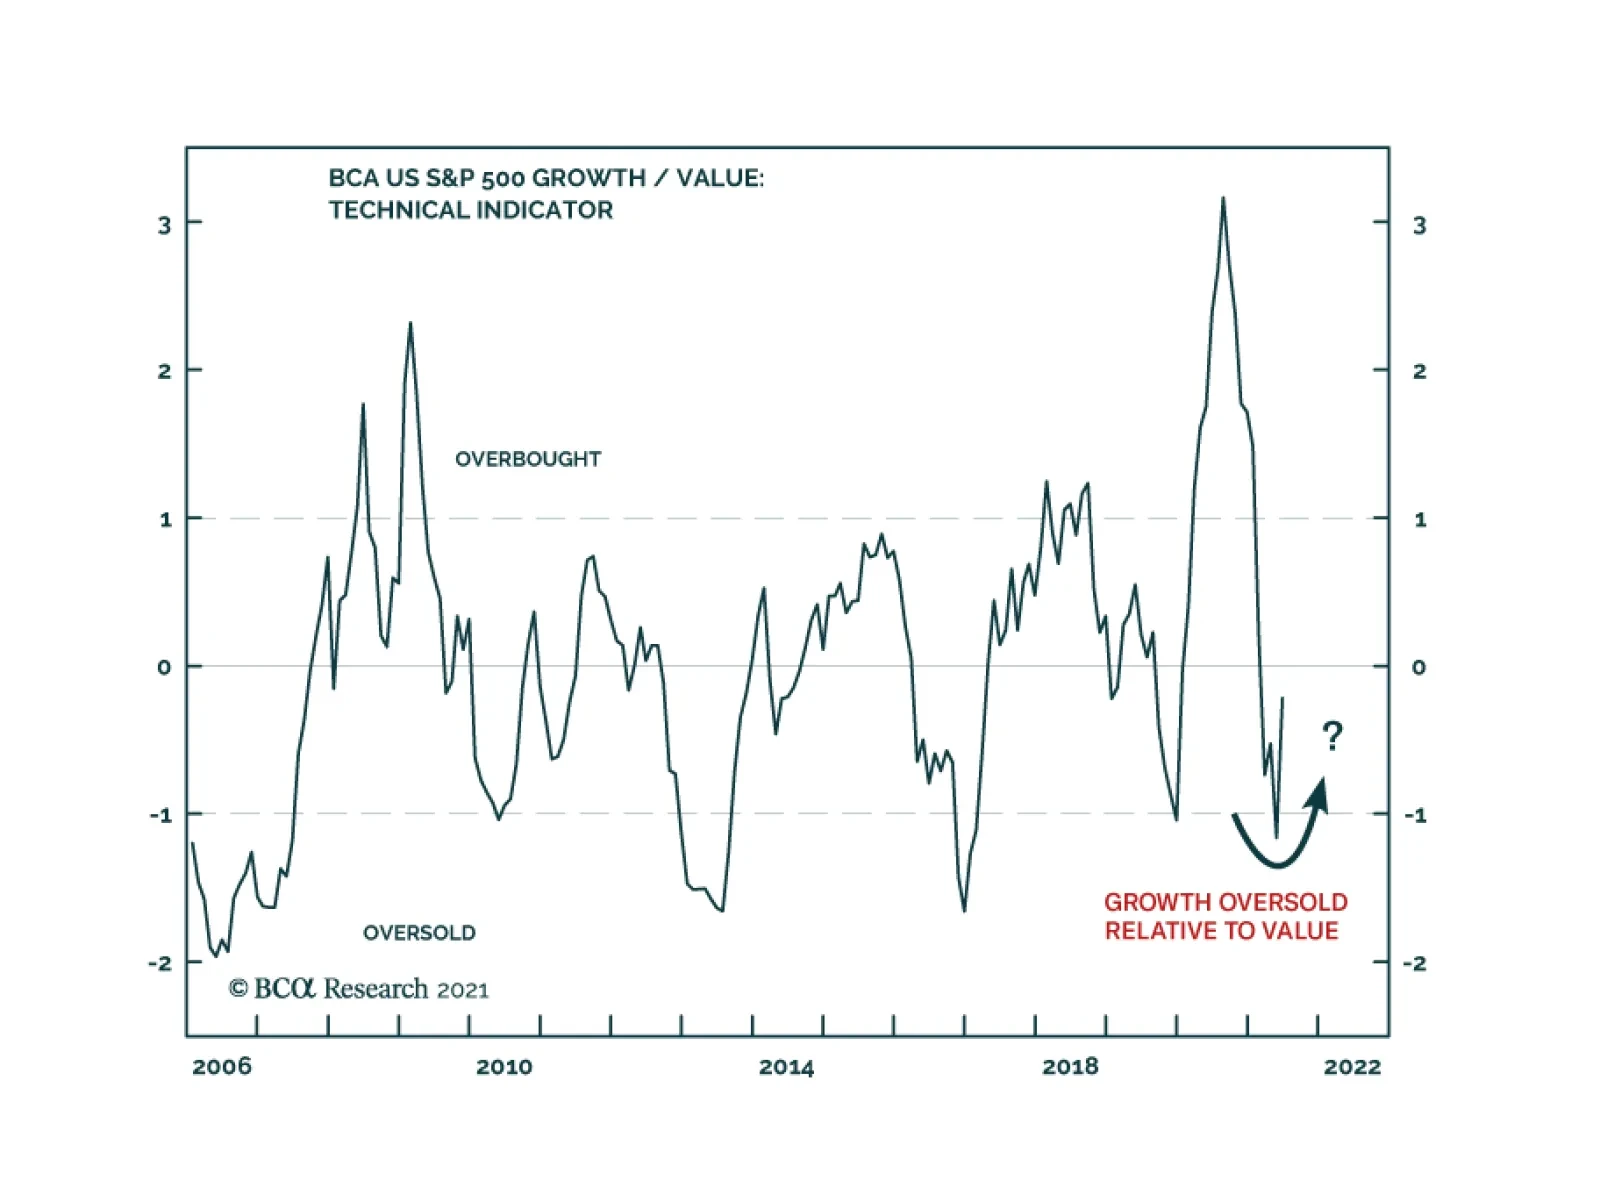
As economies started to reopen, and long-term bond yields began to rise, global Value stocks outperformed global Growth stocks by almost 20% from November to May. However, over the past couple of months this trend has reversed. Our US Equity Strategists…
Highlights Our sense remains that the dollar is undergoing a countertrend bounce, rather than entering a new bull market. The litmus test for this view is if the DXY fails to break above the 93-94 level that marked the March highs. Stay short USD/JPY. The drop in global bond yields should give this trade a welcome fillip. Short GBP/JPY positions also make sense. We are long CHF/NZD as a play on a potential increase in currency volatility. Look to rebuy a basket of Scandinavian currencies versus the USD and EUR at a trigger point of -2% from today’s levels. Remain long silver both in absolute terms and relative to gold. Our limit buy on EUR/USD was triggered at 1.18. Place tight stops given the potential for the dollar rally to continue for the next few weeks. We also believe the change in the ECB’s framework portends another bullish tailwind for the euro beyond the near term. Feature In our webcast last week, we made the case that the recent FOMC meeting (perceived as hawkish by market participants) has not altered the longer-term downtrend in the US dollar. This week, we are revisiting some of the sentiment and technical indicators that could help gauge how high the dollar can rise in the interim. Our view remains that three fundamental forces will continue to dictate currency market trends into the year end and beyond. First, the Federal Reserve will lag other central banks in raising rates amidst a shift in economic momentum from the US towards the rest of the world. This will boost short-term interest rates outside the US and provide a floor for procyclical currencies. Second, US inflation will prove stickier compared to other countries such as the eurozone or Japan. This will depress real interest rates in the US relative to the rest of the world, and curb bond inflows. And finally, an equity market rotation towards non-US stocks will improve flows into cyclical currencies. The transition could prove volatile in the coming month or so. Equity markets remain overbought, bond yields are falling, PMIs have stopped rising, and cyclical stocks are lagging growth stocks. More widespread infection from the Delta variant of Covid-19 will continue to reprice risk to the downside. As a countercyclical currency, the dollar will be a critical variable to watch. Sentiment and technical indicators make up an important component of our currency framework and are usually good at gauging significant shifts in financial markets. Our sense remains that the dollar is undergoing a countertrend bounce, rather than entering a new bull market. The litmus test for this view is if the DXY fails to break above the 93-94 level that marked the March highs. Momentum Indicators Our momentum indicators suggest that while the dollar is very oversold, the bear market remains very much intact. The dollar advance/decline line is sitting below its 200-day moving average (Chart I-1). Historically, bull markets in the dollar have been characterized by our advance/decline line breaking both above its 200-day and 400-day moving averages. This suggests a rally towards these critical resistance levels is in play but will constitute more of a countertrend bounce. Speculators are only neutral the dollar while, admittedly, leveraged funds are very short (Chart I-2). Historically, whenever the percentage of leveraged funds that are short the dollar has dipped near 40%, a meaningful rally has ensued. There are two important offsets to this. First, as Chart I-1 suggests, the dollar is a momentum currency. As such, during the bull market of the last decade, speculators were either neutral or long the dollar. If indeed the paradigm has shifted to a decade-long bear market, we expect speculators to be either short or neutral. Meanwhile, leveraged funds are a small subset of overall open interest, suggesting they are not the elephant in the room when it comes to dictating dollar movements. Leveraged funds were short the dollar during most of the bull market run last decade. Chart I-1The US Dollar Downtrend Is Intact
The US Dollar Downtrend Is Intact
The US Dollar Downtrend Is Intact
Chart I-2Leveraged Funds Are Short The Dollar
Leveraged Funds Are Short The Dollar
Leveraged Funds Are Short The Dollar
Carry trades are relapsing anew, suggesting the environment may be becoming unfavorable for high-yielding developed and emerging market currencies. The dollar has been negatively correlated with the Deutsche Bank carry ETF, DBV, since investors ultimately dump carry trades and fly to the safety of Treasurys on any market turbulence (Chart I-3). High-beta carry currencies such as the RUB, ZAR, MXN, and BRL have been consolidating recent gains. These currencies are usually good at sniffing out a change in the investment landscape, specifically one becoming precarious for carry trades. Our carry index tends to do well when the yield spread between US Treasuries and the indexes’ constituents’ is low. As such, there is some more adjustment underway, but one of limited amplitude (Chart I-4). Chart I-3The Carry Trade Rally Is Relapsing
The Carry Trade Rally Is Relapsing
The Carry Trade Rally Is Relapsing
Chart I-4Carry Trades Have Hit An Air Pocket
Carry Trades Have Hit An Air Pocket
Carry Trades Have Hit An Air Pocket
Chart I-5Currency Volatility Is Very Low
Currency Volatility Is Very Low
Currency Volatility Is Very Low
Both expected and actual currency volatility are extremely depressed. Whenever currency volatility has been this low, the dollar has staged a meaningful rally. For example, the most significant episodes were the lows of 1996-1997, 2007-2008, and 2014-2015, and early 2020 (Chart I-5). Usually, low currency volatility is a sign of complacency, while higher volatility allows for a more balanced and healthy market rotation. The nature in which currency volatility adjusts higher this time around might be the same playbook as in previous episodes. The Asian crisis of the late 90s set the stage for the dollar bear market of the 2000s. The adjustment higher in the dollar during the Global Financial crisis jumpstarted the bull market the following decade. This time around, the Covid-19 crisis might have commenced a renewed dollar bear market. If this analogy is correct, then we should be selling the dollar on strength rather than buying on weakness. It is important to remember that the policy environment remains bearish for the dollar. These include deeply negative real rates, quantitative easing (which, admittedly, will soon end), generous liquidity swap lines to assuage any dollar funding pressures abroad (Chart I-6), and a global economy on the cusp of a renewed cycle. In our portfolio, we are long CHF/NZD since this cross has historically been a good hedge against rising currency volatility (Chart I-7). So is being short AUD/JPY. Being short the GBP/JPY cross might prove even more profitable, given that the UK has been a pandemic winner this year. Chart I-6The Fed Extended Its Swap Lines
The Fed Extended Its Swap Lines
The Fed Extended Its Swap Lines
Chart I-7Buy CHF/NZD As Insurance
Buy CHF/NZD As Insurance
Buy CHF/NZD As Insurance
Bottom Line: The message from our momentum indicators is that the bounce in the dollar was to be expected. We remain in the camp that believes the rally will be short-lived but are opportunistically playing what could be a more volatile environment. Equity Markets Signals A potential catalyst that could trigger further upside in the dollar is an equity market correction. Both the dollar and equities tend to be inversely correlated (Chart I-8). On this front, a few equity market indicators continue to flag that the rally in the dollar has a bit further to go. Chart I-8The Dollar And Equities Move Opposite Ways
The Dollar And Equities Move Opposite Ways
The Dollar And Equities Move Opposite Ways
Chart I-9Global Industrials Are Relapsing Anew
Global Industrials Are Relapsing Anew
Global Industrials Are Relapsing Anew
The underperformance of cyclical stocks, especially global industrials, suggests equity markets could be entering a more volatile phase (Chart I-9). The dollar tends to strengthen when cyclical stocks are underperforming defensive ones. This is because non-US equity markets have a much higher concentration of cyclical stocks in their bourses. In more general terms, non-US markets are underperforming the US, a clear sign that the marginal dollar is rotating back towards the US (Chart I-10A and I-10B). Technology stocks have also been well bid in recent weeks, on the back of lower bond yields. These are all temporary headwinds for dollar weakness. Chart I-10ANon-US Stock Markets Are Underperforming
Non-US Stock Markets Are Underperforming
Non-US Stock Markets Are Underperforming
Chart I-10BNon-US Stock Markets Are Underperforming
Non-US Stock Markets Are Underperforming
Non-US Stock Markets Are Underperforming
Chart I-11US Relative Earnings Revisions Are High, But Rolling Over
US Relative Earnings Revisions Are High, But Rolling Over
US Relative Earnings Revisions Are High, But Rolling Over
Earnings revisions continue to head higher across most markets, but US profit expectations are still higher compared to other countries (Chart I-11). Non-US bourses will need much higher earnings revisions to stimulate portfolio inflows, and for the dollar bear market to resume. On this front, both the euro area and emerging markets are showing only tentative improvement. The character of any selloff in equity markets will be worth monitoring. Cyclicals and value stocks are at historically bombed-out levels and could start to outperform high-flying stocks on any market reset. Bottom Line: Whether a correction ensues, or the bull market continues, requires a change in equity market leadership from defensives to cyclicals. This is a necessary condition for the dollar bear market to resume. Commodities, Bonds, And The Dollar Commodity and bond prices give important cues about the health of the global economy. For example, rising copper prices and rising yields are a sign that industrial activity is humming, which in turn points to accelerating global growth. As a counter-cyclical currency, the dollar usually weakens in this scenario. Rising gold prices are generally a sign that policy settings remain ultra-accommodative, which also points to a weaker dollar. At the FX strategy service, we tend to focus more on the internal dynamics of commodity and bond markets, which can provide early warning signs. Chart I-12The Copper-To-Gold Ratio Is Consolidating Gains
The Copper-To-Gold Ratio Is Consolidating Gains
The Copper-To-Gold Ratio Is Consolidating Gains
The copper-to-gold ratio is important since it indicates whether the liquidity-to-growth transmission mechanism is working. A rising ratio suggests policy settings are stimulating growth, while a falling ratio is a warning shot that the environment might be becoming deflationary. Correspondingly, this ratio has tended to track the dollar closely (Chart I-12). The copper-to-gold ratio is consolidating at very high levels. This is consistent with a healthy reset, rather than a reversal in the dollar bear market. The gold/silver ratio (GSR) tends to track the US dollar, and its recent price action also appears to be a welcome reset (Chart I-13). Like copper, silver benefits from rising industrial demand, especially in the electronics and renewable energy space. A falling GSR will be a sign that the manufacturing cycle is still humming. We are short the GSR with a target of 50, and a stop-loss at 71. The bond-to-gold ratio has bounced from very oversold levels. Both US Treasurys and gold are safe-haven assets and thus are competing assets. Remarkably, the ratio of the total return in US government bonds-to-gold prices has tracked the dollar pretty well since the end of the Bretton Woods system in the early ‘70s (Chart I-14). Gold has always been considered the perfect anti-fiat asset vis-à-vis the dollar, making the bond-to-gold ratio both a good short-term and long-term sentiment indicator. For now, the bounce in the ratio is not yet worrisome. We have noticed that inflows into US government bonds have risen sharply, while those into gold are falling. This should soon reverse with the fall in US rates, and the correction in gold prices. Chart I-13The Gold-To-Silver Ratio Is Consolidating Losses
The Gold-To-Silver Ratio Is Consolidating Losses
The Gold-To-Silver Ratio Is Consolidating Losses
Chart I-14Competing Assets And The Dollar
Competing Assets And The Dollar
Competing Assets And The Dollar
Bottom Line: The US is ultimately generating the most inflation in the G10, which is dampening real rates, and should curtail investor enthusiasm for gold relative to US Treasurys. The underperformance of Treasurys relative to gold will be a bearish development for the dollar. A Final Word On The Euro The strategic review from the European Central Bank had three key changes. The ECB now has a symmetric 2% inflation target. This is not a game changer, since it brings it in line with other global central banks, including the Bank of Japan. House prices will meaningfully begin to impact monetary policy, as the committee eventually includes owner’s equivalent rent (OER) in the HICP index (the ECB’s preferred inflation measure) for the euro area. This could be a game changer for the ECB’s price objective. Climate change was reiterated as important for price stability. Financial stability was also repeated as an important objective. As FX strategists, the second change was the most important. Shelter constitutes 17.7% of the euro area CPI basket, but it is 32.9% of the US CPI basket (Table I-1). Meanwhile, the shelter component of both the CPI basket in the US and euro area have tracked each other (Chart I-15). Table I-1Euro Area CPI Weights
An Update On Dollar Sentiment And Technical Indicators
An Update On Dollar Sentiment And Technical Indicators
Chart I-15What Will Happen To Eurozone Inflation?
What Will Happen To Eurozone Inflation?
What Will Happen To Eurozone Inflation?
An adjustment in the weight of the shelter component in the euro area will boost the European CPI relative to the US and could trigger a major policy shift from the ECB in the coming years. This will especially be the in case if the current environment generates an inflationary shock. Bottom Line: The ECB will stay very accommodative in the next 1-2 years, but the change in its mandate could portend a bullish tailwind for the euro beyond the near term. Investment Implications We expect the current dollar rebound to be short-lived. As such, our strategy is as follows: Stay long other safe-haven currencies. Our preferred vehicle is the Japanese yen, which sports an attractive real rate relative to the US. Investors can also short GBP/JPY from current levels. Chart I-16The Euro, Yen And Real Rates
The Euro, Yen And Real Rates
The Euro, Yen And Real Rates
Our limit-buy on EUR/USD was triggered at 1.18. Given our expectation that the dollar could rally in the near term, we are setting the stop-loss at the same level. However, the improvement in real rates in the euro area relative to the US could cushion any downside (Chart I-16). We are also long CHF/NZD, as a bet on rising currency volatility. Correspondingly, we are setting a limit buy on Scandinavian currencies relative to the euro and USD at a trigger level of -2%. Both gold and silver benefit from the current environment, but we prefer silver to gold, due to the former’s call option on continued improvement in global growth. We are short the gold/silver ratio from the 68 level. Overall, we expect the dollar to weaken towards the end of the year, as has been the case since the 1970s (Chart I-17). Chart I-17The Yen And Swiss Franc Are Usually Winners In H2
An Update On Dollar Sentiment And Technical Indicators
An Update On Dollar Sentiment And Technical Indicators
Chester Ntonifor Foreign Exchange Strategist chestern@bcaresearch.com Currencies US Dollar USD Technicals 1
USD Technicals 1
USD Technicals 1
USD Technicals 2
USD Technicals 2
USD Technicals 2
The recent data out of the US have been robust: June non-farm payrolls showed an increase of 850K jobs, versus expectations of a 700K increase. The unemployment rate was relatively flat at 5.9% in June. Factory orders came in at 1.7% year-on-year in May, in line with expectations. The US dollar DXY index is relatively flat this week, but with tremendous volatility. It was a relatively quiet week in the US, due to Independence Day, but the key theme remained a drop in US yields, with the 10-year yield moving from a high of near 1.8% this year to 1.3% currently. This move has catalyzed rallies in lower beta currencies, such as the yen and Swiss franc. The FOMC minutes released this week continue to suggest a Fed that will remain very patient in both tapering asset purchases and lifting interest rates. Report Links: Arbitrating Between Dollar Bulls And Bears - March 19, 2021 The Dollar Bull Case Will Soon Fade - March 5, 2021 Are Rising Bond Yields Bullish For The Dollar? - February 19, 2021 The Euro EUR Technicals 1
EUR Technicals 1
EUR Technicals 1
EUR Technicals 2
EUR Technicals 2
EUR Technicals 2
Recent data from the euro area were mixed: The PPI print for May came in at 9.6%, in line with expectations. Both the services and composite PMI were revised higher by 0.3 in June. At 59.2, the composite PMI is the highest in over a decade. ZEW expectations for the euro area fell sharply from 81.3 to 61.2. In Germany, there was a big decline in automotive surveys. The euro was flat this week against the dollar, despite gains overnight. The big news was the change in the ECB’s monetary policy objectives, which we discussed briefly in the front section of this report. The euro rallied on the news of three fundamental drivers in our view – real rate differentials are improving in favor of Europe, the ECB’s consideration for house price inflation could allow its price stability objective to be achieved sooner, and consideration for financial stability will be less favorable for negative interest rates. Report Links: Relative Growth, The Euro, And The Loonie - April 16, 2021 The Euro Dance: One Step Back, Two Steps Forward - April 2, 2021 On Japanese Inflation And The Yen - January 29, 2021 The Yen JPY Technicals 1
JPY Technicals 1
JPY Technicals 1
JPY Technicals 2
JPY Technicals 2
JPY Technicals 2
Recent data from Japan remains subpar, but is improving: Labor cash earnings rose 1.9% in May, in line with expectations. Household spending rose 11.6% in May, in line with expectations. The Eco Watchers Survey for June came in at 47.6 from a May reading of 38.1. The outlook component rose from 47.6 to 52.4. The yen was up by 1.6% against the USD this week, the best performer. We argued a month ago that the yen is the most underappreciated G10 currency today. The catalyst that triggered yen gains were a drop in US real rates, that favored other safe-haven currencies. Going forward, further yen gains should materialize on the back of Japan successfully overcoming the pandemic like its Western counterparts. Report Links: The Case For Japan - June 11, 2021 The Dollar Bull Case Will Soon Fade - March 5, 2021 On Japanese Inflation And The Yen - January 29, 2021 British Pound GBP Technicals 1
GBP Technicals 1
GBP Technicals 1
GBP Technicals 2
GBP Technicals 2
GBP Technicals 2
There was scant data out of the UK this week: The construction PMI rose from 64.2 to 66.3 in June. House prices remain robust, with the RICS house price balance printing an elevated 83% in June. The pound was flat this week against the USD. The new delta variant of the COVID-19 virus is gaining momentum in the UK and will likely erode some of the dividends GBP had priced in from a fast vaccine rollout. As such, short GBP positions may pay off in the near term. Shorting GBP/CHF could be an attractive near-term hedge. Report Links: Why Are UK Interest Rates Still So Low? - March 10, 2021 Portfolio And Model Review - February 5, 2021 Thoughts On The British Pound - December 18, 2020 Australian Dollar AUD Technicals 1
AUD Technicals 1
AUD Technicals 1
AUD Technicals 2
AUD Technicals 2
AUD Technicals 2
There was scant data out of Australia this week: The Melbourne Institute of Inflation survey came it at 3% year on year in June, from 3.3%. The RBA kept interest rates unchanged at 0.1%, reiterating its commitment to stay accommodative until inflation and wages pick up meaningfully. The AUD was down by 0.4% this week against the USD. The RBA is decisively lagging other central banks in communicating less monetary accommodation in the coming years. This will create a coiled spring response for the AUD, because the RBA will have to eventually play catchup as the global economic cycle gains momentum. Report Links: The Dollar Bull Case Will Soon Fade - March 5, 2021 Portfolio And Model Review - February 5, 2021 Australia: Regime Change For Bond Yields & The Currency? - January 20, 2021 New Zealand Dollar NZD Technicals 1
NZD Technicals 1
NZD Technicals 1
NZD Technicals 2
NZD Technicals 2
NZD Technicals 2
The was scant data out of New Zealand this week: ANZ commodity price index rose by 0.8% in June. The NZD was down 0.3% against the dollar this week. Our long CHF/NZD position paid off handsomely in this environment. We recommend holding onto this trade, as a reset in global rates hurts the hawkish pricing in the NZD forward curve. Report Links: How High Can The Kiwi Rise? - April 30, 2021 Portfolio And Model Review - February 5, 2021 Currencies And The Value-Versus-Growth Debate - July 10, 2020 Canadian Dollar CAD Technicals 1
CAD Technicals 1
CAD Technicals 1
CAD Technicals 2
CAD Technicals 2
CAD Technicals 2
Canadian data softened but remained robust: Building permits fell by 14.8% month on month in May. The Markit manufacturing PMI fell from 57 to 56.5 in June. The Canadian trade balance deteriorated from C$0.6bn to a deficit of -C$1.4bn in May. Business Outlook Survey indicator hit the highest level on record. As the Bank of Canada put it, improving business sentiment is broadening. The CAD fell by 0.8% against USD this week. The results of the BoC survey highlight that a reopening phase is categorically bullish for economic activity in general and financial prices. Until recently, the CAD was one of the best performing currencies in the G10. This is a sea change from a country that was previously a laggard in vaccination efforts. CAD should hold up well once the dollar rally fades, but other currency laggards such as SEK and JPY could do even better. Report Links: Relative Growth, The Euro, And The Loonie - April 16, 2021 Will The Canadian Recovery Lead Or Lag The Global Cycle? - February 12, 2021 The Outlook For The Canadian Dollar - October 9, 2020 Swiss Franc CHF Technicals 1
CHF Technicals 1
CHF Technicals 1
CHF Technicals 2
CHF Technicals 2
CHF Technicals 2
The was scant data out of Switzerland this week: The unemployment rate was near unchanged at 3.1% in June, from 3.0%. Total sight deposits were unchanged at CHF 712 bn on the week of July 2. The Swiss franc was up by 1.1% this week against the USD. Falling yields improved the relative appeal of the franc that has bombed out interest rates. The franc is also benefiting from the rising bout of volatility as a safe-haven currency. On this basis, we are long CHF/NZD cross, which performed well this week. Report Links: An Update On The Swiss Franc - April 9, 2021 Portfolio And Model Review - February 5, 2021 The Dollar Conundrum And Protection - November 6, 2020 Norwegian Krone NOK Technicals 1
NOK Technicals 1
NOK Technicals 1
NOK Technicals 2
NOK Technicals 2
NOK Technicals 2
Data out of Norway is improving: The unemployment rate fell from 3.3% to 2.9% in July. Industrial production growth came in at 2.1% year-on-year in May. Mainland GDP rose by 1.8% month on month in May. The NOK was down by 1.8% this week against the dollar, the worst performing G10 currency. The NOK is bearing the brunt of a reset in the US dollar, but our bias is that we are nearing a buy zone. NOK is cheap, would benefit from high oil prices and the economy is on the mend. We are looking to sell EUR/NOK and USD/NOK on further strength. Report Links: The Norwegian Method - June 4, 2021 Portfolio And Model Review - February 5, 2021 Revisiting Our High-Conviction Trades - September 11, 2020 Swedish Krona SEK Technicals 1
SEK Technicals 1
SEK Technicals 1
SEK Technicals 2
SEK Technicals 2
SEK Technicals 2
Recent data from Sweden have been mildly positive: The Swedbank/Silf composite PMI fell from 70.2 to 66.9 in June. Industrial production came in at 24.4% year on year in May, after a rise of 26.4% in April. Household consumption jumped 8.8% year on year in April. The SEK was also up this week against the USD. Bombed-out interest rates in Sweden have also improved the appeal of the franc, given falling global bond yields. Meanwhile, the SEK remains one of the cheapest currencies in our models. Report Links: Revisiting Our High-Conviction Trades - September 11, 2020 More On Competitive Devaluations, The CAD And The SEK - May 1, 2020 Sweden Beyond The Pandemic: Poised To Re-leverage - March 19, 2020 Trades & Forecasts Forecast Summary Core Portfolio Tactical Trades Limit Orders Closed Trades

In their Q2/2021 model bond portfolio performance review, BCA Research’s Global Fixed Income Strategy team updated their recommended positioning for the next six months. Firstly, the team changed its US Treasury curve exposure to have more of a flattening…
The China State Council meeting on July 7, chaired by Premier Li Keqiang, sent a somewhat ambiguous message on the direction of China’s monetary policy. The press release from the meeting stated that the country will “use monetary policy tools in a timely…
GFIS Model Bond Portfolio Q2/2021 Performance Review & Current Allocations: Hitting A Few Roadblocks
Highlights Q2/2021 Performance Breakdown: Our recommended model bond portfolio underperformed the custom benchmark index by -6bps during the second quarter of the year. Winners & Losers: The government bond side of the portfolio underperformed by -21bps, led overwhelmingly by our underweight to US Treasuries (-18bps). Spread product allocations outperformed by +15bps, primarily due to overweights on US high-yield (+11bps) and US CMBS (+3bps). Portfolio Positioning For The Next Six Months: We are maintaining an overall below-benchmark portfolio duration stance, against a backdrop of persistent above-trend global growth and a highly stimulative fiscal/monetary policy mix. We are maintaining a moderate overweight to global spread product versus government debt, concentrated on an overweight to US high-yield where valuations look the least stretched. We are making two changes to the portfolio allocations heading into Q3: shifting the Treasury curve exposure to have more of a flattening bias, while downgrading EM USD-denominated corporates to neutral. Feature The trend in global bond yields so far in 2021 has been a tale of two quarters. The first three months of the year saw a surge in yields worldwide on the back of rapidly improving economic data, the rollout of COVID-19 vaccines and supply squeezes triggering rapid increases in inflation. During the second three months of the year, however, global yields drifted a bit lower in response to more mixed economic data, the spread of the Delta variant and slightly hawkish shifts from a few key central banks – most notably, the Fed – even with economic confidence measures remaining upbeat across the developed economies. The decline in yields has not been seen across the maturity spectrum, though. The yield-to-maturity of the Bloomberg Barclays Global and US Treasury 10+ year indices fell by -12bps and -30bps, respectively, from recent peaks. At the same time, shorter term bond yields have been relatively stable as central banks continue to signal that interest rate hikes are still well off into the future. In contrast to government bonds, credit markets have remained calm with spreads tight for developed market corporates and emerging market (EM) debt. With that in mind, we present our quarterly review of the BCA Research Global Fixed Income Strategy (GFIS) model bond portfolio during the second quarter of 2021. We also present our recommended positioning for the portfolio for the next six months (Table 1), as well as portfolio return expectations for our base case and alternative investment scenarios. The latter half of 2021 should prove to be even more challenging for bond investors, who must disentangle less consistent messages across countries on the Delta variant, vaccinations, inflation and the outlook for both monetary and fiscal policy. Table 1GFIS Model Bond Portfolio Recommended Positioning For The Next Six Months
GFIS Model Bond Portfolio Q2/2021 Performance Review & Current Allocations: Hitting A Few Roadblocks
GFIS Model Bond Portfolio Q2/2021 Performance Review & Current Allocations: Hitting A Few Roadblocks
As a reminder to existing readers (and to new clients), the model portfolio is a part of our service that complements the usual macro analysis of global fixed income markets. The portfolio is how we communicate our opinion on the relative attractiveness between government bond and spread product sectors. We do this by applying actual percentage weightings to each of our recommendations within a fully invested hypothetical bond portfolio. Q2/2021 Model Bond Portfolio Performance: Mixed Returns Chart 1Q2/2021 Performance: Credit Gains & Duration Losses
Q2/2021 Performance: Credit Gains & Duration Losses
Q2/2021 Performance: Credit Gains & Duration Losses
The total return for the GFIS model portfolio (hedged into US dollars) in the second quarter was +1.13%, slightly underperformed the custom benchmark index by -6bps (Chart 1).1 In terms of the specific breakdown between the government bond and spread product allocations in our model portfolio, the former generated -21bps of underperformance versus our custom benchmark index while the latter outperformed by +15bps. We have remained significantly underweight US Treasuries and positioned for a bearish steepening of the US Treasury curve since just before last year's US presidential election. That tilt was a big contributor to the excess return of the portfolio in Q1 (+63bps) that was partially given back (-18bps) in Q2 as longer maturity Treasury yields fell during the quarter. Our inflation-linked bond allocations in the US and Europe (+5bps) helped mitigate the loss on the government bond side from our below-benchmark duration stance and general curve steepening bias in most countries in the portfolio (Table 2). Table 2GFIS Model Bond Portfolio Q2/2021 Overall Return Attribution
GFIS Model Bond Portfolio Q2/2021 Performance Review & Current Allocations: Hitting A Few Roadblocks
GFIS Model Bond Portfolio Q2/2021 Performance Review & Current Allocations: Hitting A Few Roadblocks
The sum of excess returns during the quarter from countries that we overweighted (Germany, France, Italy, Spain, and Japan) was zero. Improving growth momentum and stronger economic confidence helped push yields higher in those countries. Therefore, those positions could not offset the losses from the underweight to US Treasuries. We did make two shifts in the country allocation within the government bond portion of the portfolio during Q2, downgrading Canada to underweight on April 20 and upgrading Australia to overweight on June 9. Neither change meaningfully contributed to the return of the portfolio. Meanwhile, our moderate overall overweight tilt on spread product versus government bonds fueled the outperformance from the credit side of the portfolio, led by US high-yield (+11bps) and US CMBS (+3bps). Overall gains from spread product were impressive in both USD-hedged total return terms (+95bps) and relative to our custom benchmark (+15bps), despite spreads entering Q2 at fairly tight levels. In the second quarter, improving economic confidence and easing credit conditions allowed spreads to narrow even further for corporate debt in the US and Europe, as well as for EM USD-denominated credit. The bar charts showing the total and relative returns for each individual government bond market and spread product sector are presented in Charts 2 & 3. Chart 2GFIS Model Bond Portfolio Q2/2021 Government Bond Performance Attribution
GFIS Model Bond Portfolio Q2/2021 Performance Review & Current Allocations: Hitting A Few Roadblocks
GFIS Model Bond Portfolio Q2/2021 Performance Review & Current Allocations: Hitting A Few Roadblocks
Chart 3GFIS Model Bond Portfolio Q2/2021 Spread Product Performance Attribution By Sector
GFIS Model Bond Portfolio Q2/2021 Performance Review & Current Allocations: Hitting A Few Roadblocks
GFIS Model Bond Portfolio Q2/2021 Performance Review & Current Allocations: Hitting A Few Roadblocks
Biggest Outperformers: Overweight US high-yield: Ba-rated (+5bps), B-rated (+4bps), and Caa-rated (+3bps) Overweight US TIPS (+4bps) Overweight US CMBS (+3bps) Overweight Euro Area high-yield (+1bps) Biggest Underperformers: Underweight US Treasuries with a maturity greater than 10 years (-17bps), Underweight US Treasuries with a maturity between 7 and 10 years (-3bps) Underweight US Treasuries with a maturity between 5 and 7 years (-2bps) Underweight EM USD sovereigns (-1bps) Underweight UK GIlts with a maturity greater than 10 years (-1bps) Chart 4 presents the ranked benchmark index returns of the individual countries and spread product sectors in the GFIS model bond portfolio for Q2/2021. Returns are hedged into US dollars (we do not take active currency risk in this portfolio) and adjusted to reflect duration differences between each country/sector and the overall custom benchmark index for the model portfolio. We have also color coded the bars in each chart to reflect our recommended investment stance for each market during Q2 (red for underweight, dark green for overweight, gray for neutral). Chart 4Ranking The Winners & Losers From The GFIS Model Bond Portfolio Universe In Q2/2021
GFIS Model Bond Portfolio Q2/2021 Performance Review & Current Allocations: Hitting A Few Roadblocks
GFIS Model Bond Portfolio Q2/2021 Performance Review & Current Allocations: Hitting A Few Roadblocks
Ideally, we would look to see more green bars on the left side of the chart where market returns are highest, and more red bars on the right side of the chart were returns are lowest. In Q2, the picture on that front was mixed. We were only neutral some of the biggest outperformers like UK Gilts (+312bps in USD-hedged duration-matched total return terms) and investment grade credit in the US (+430bps) and UK (+231bps). Our relative value allocation within EM, overweight corporates (+430bps) versus sovereigns (+527bps), also underperformed during Q2. We remained overweight government debt markets in the euro area which were the worst performers during the quarter (Germany: -25bps, Spain: -59bps, Italy: -67bps, and France: -83bps). The news was better on the credit side, where our significant overweight to US high-yield (+146bps) was a big positive contributor, as were overweights to US CMBS (+137bps) and euro area high-yield (+92bps). Bottom Line: Our model bond portfolio slightly underperformed its benchmark index in the second quarter of the year by -6bps – a negative result mainly driven by our underweight allocation to the US Treasury market but with an overweight to US high-yield providing a meaningful offset. Future Drivers Of Portfolio Returns & Scenario Analysis Looking ahead, the performance of the model bond portfolio will continue to be driven primarily by swings in global government bond yields, most notably US Treasuries. Our most favored cyclical indicators for global bond yields are still, in aggregate, signaling more upside potential over at least the next six months, although the nature of the signal is changing (Chart 5). Our Global Duration Indicator, comprised of leading economic indicators and measures of future economic sentiment, remains elevated but appears to have peaked. At the same time, the global manufacturing PMI, which typically leads global real bond yields by around six months, continues to climb to new cyclical highs. This suggests that the recent downdraft in global real bond yields could prove to be short-lived. Our Global Central Bank Monitor is climbing steadily, indicating greater upward pressure on bond yields from the combination of strong growth, rising inflation and loose financial conditions. Admittedly, bond yields are lagging the upward trajectory implied by the Monitor with central banks deliberately responding far more slowly to the cyclical pressures that would have triggered bond-bearish monetary tightening in the past. Nonetheless, the Monitor, the Global Duration Indicator and the global manufacturing PMI and all sending the same message – global bond yields remain too low, suggesting a below-benchmark overall portfolio duration stance remains appropriate. With regards to country allocation within the government bond side of our model portfolio, we continue to overweight countries where central banks are less likely to begin normalizing pandemic-era monetary policy quickly (Germany, France, Italy, Spain, Japan, Australia), while underweighting countries where normalization is expected to begin within the next 6-12 months (the US and Canada). We remain neutral the UK, although we have them on “downgrade watch” until there is greater clarity on how severely the spread of the Delta variant is impacting UK growth. The US remains the biggest underweight. The modestly hawkish turn by the Fed at the June FOMC meeting likely marked the end of the cyclical bear-steepening trend of the US Treasury curve. A full-blown turn to a bear-flattening of the US curve will be slow to develop, but we fully expect the cyclical pressures that drove the underperformance of longer-maturity US Treasuries over the past year to begin leaking into shorter-maturity bonds. That trend already appears to be underway with 5-year US yields starting to drift upward at a faster pace compared to other developed market peers (Chart 6). Chart 5Cyclical Indicators Suggest Global Yields Still Have More Upside
Cyclical Indicators Suggest Global Yields Still Have More Upside
Cyclical Indicators Suggest Global Yields Still Have More Upside
Chart 6UST Underperformance Will Shift To Shorter Maturities
UST Underperformance Will Shift To Shorter Maturities
UST Underperformance Will Shift To Shorter Maturities
This leads us to make a change to our model portfolio allocations this week, reducing the exposure to the belly of the US Treasury curve (the 3-5 year and 5-7 year maturity buckets), while modestly increasing the allocation to the 7-10 year bucket. To neutralize the duration-extending implication of that marginal shift, we added a new allocation to US Treasury bills, thus turning this US Treasury shift into a “butterfly” trade, essentially selling the 5-year bullet for a cash/10-year barbell. Longer-term Treasury yields, however, are still in the process of working off an oversold condition that developed in Q1 (Chart 7). Duration positioning remains quite short, according to the JP Morgan survey of bond investors, while speculators are still working off a huge net short position in 30-year Treasury futures according to data from the CFTC. We anticipate that it will take another month or two to work off such an extreme oversold condition for US Treasuries, based on similar episodes over the past two decades. After that, longer-maturity Treasury yields will begin to begin climbing again, to the benefit of the US underweight (and below-benchmark duration stance) in our model portfolio. Chart 7Longer-Maturity USTs Working Off Oversold Condition
Longer-Maturity USTs Working Off Oversold Condition
Longer-Maturity USTs Working Off Oversold Condition
Chart 8A Sharply Diminished Impulse From Global QE
A Sharply Diminished Impulse From Global QE
A Sharply Diminished Impulse From Global QE
Outside the US, the bond-friendly impact of quantitative easing programs is fading, on the margin, with the growth of central bank balance sheets slowing (Chart 8). While outright tapering of bond buying has only occurred in Canada and the UK (within our model bond portfolio universe), we expect the Fed to begin tapering in early 2022. Financial stability concerns are expected to play an increasingly important role in future tapering decisions, with house prices booming in many countries, most notably Canada which supports our underweight stance on Canadian government debt. Australia is the notable exception to this trend towards slowing balance sheet growth, with the Reserve Bank of Australia (RBA) maintaining a healthy pace of bond buying given underwhelming realized inflation. The recent wave of COVID-19 cases, which has left half of Australia under lockdowns that were largely avoided in 2020, will ensure that the RBA stays dovish for longer, to the benefit of our overweight stance on Australian government bonds. We continue to see the overall dovish stance of global central bankers as being conducive to the outperformance of inflation-linked bonds versus nominal government debt. However, inflation breakevens in most countries have largely completed the rebound from the depressed levels reached during the 2020 COVID-19 global recession. Our Comprehensive Breakeven Indicators combine three measures to determine the upside potential for 10-year inflation breakevens: the distance from fair value based on our models, the spread between headline inflation and central bank target inflation, and the gap between market-based and survey-based measures of inflation expectations. Those indicators suggest that the most attractive markets to position for further upside potential for breakevens are in Italy and France, with breakevens looking more stretched in the US, Canada and Australia (Chart 9). On the back of this, we are maintaining our allocations to inflation-linked bonds in the euro area in our model portfolio. Chart 9Less Scope For Wider Global Inflation Breakevens
Less Scope For Wider Global Inflation Breakevens
Less Scope For Wider Global Inflation Breakevens
Chart 10Fading Support For Credit Markets From Global QE
Fading Support For Credit Markets From Global QE
Fading Support For Credit Markets From Global QE
Moving our attention to the credit side of our model portfolio, we feel that a moderate overweight stance on overall global corporates versus governments remains appropriate. However, the slowing trend in developed market central bank balance sheets, as an indicator of the incremental shift away from the COVID-era monetary policies from 2020, is flashing a warning sign for the performance of global spread product. The annual growth rate of the combined balance sheets of the Fed, ECB, Bank of Japan and Bank of England has been an excellent leading indicator of the excess returns of both global investment grade and high-yield corporates over the past decade (Chart 10). That growth rate peaked back in February of this year, suggesting a peak of global corporate bond excess returns around February 2022 Although given the current tight level of global corporate bond spreads, both for investment grade and high-yield, we expect future return outperformance from corporates versus government debt to come from carry rather than spread compression. Our preferred measure of the attractiveness of credit spreads is the historical percentile ranking of 12-month breakeven spreads, which measure how much spreads would need to widen to eliminate the carry advantage over duration-matched government bonds on a one-year horizon. Currently, only the lower-rated high-yield credit tiers in the US and euro area offer 12-month breakeven spreads above the bottom quartile of their history, within the credit sectors of our model portfolio (Chart 11). Chart 11Lower-Rated High-Yield Offers Relatively Attractive Spreads
GFIS Model Bond Portfolio Q2/2021 Performance Review & Current Allocations: Hitting A Few Roadblocks
GFIS Model Bond Portfolio Q2/2021 Performance Review & Current Allocations: Hitting A Few Roadblocks
Given the sharply reduced default risks on both sides of the Atlantic, and with nominal growth in good shape amid low borrowing rates, we are maintaining our overweights to high-yield bonds in both the US and euro area. At the same time, we are sticking with only a neutral stance on investment grade corporates in the US, euro area and the UK. We do anticipate starting to reduce the overall corporate bond exposure later this year, however, based on the ominous leading signal from the growth of central bank balance sheets – and what that signals about the future path for global monetary policy. Within the euro area, we continue to prefer owning Italian government bonds (and to a lesser extent, Spanish government debt) over investment grade corporates, given the more explicit support for the sovereigns through ECB quantitative easing (Chart 12). We expect the ECB to be the most accommodative central bank within our model portfolio universe over at least the next year, with even tapering of any kind unlikely in 2022. Chart 12Favor Italian BTPs Over Euro Area Investment Grade
Favor Italian BTPs Over Euro Area Investment Grade
Favor Italian BTPs Over Euro Area Investment Grade
One area of the spread product universe where we are starting to reduce risk in the model portfolio is EM USD-denominated credit. EM debt has benefited from a bullish combination of global policy stimulus, a weakening US dollar and rising commodity prices over the past year. We have positioned for that in our model portfolio through an overall overweight stance on EM USD-denominated debt, but one that favors investment grade corporates over sovereigns. Now, all of those supportive factors for EM credit are fading. Chinese policymakers have reigned in both credit stimulus and fiscal stimulus this year, with the combined impulse suggesting a slower pace of Chinese economic growth in the latter half of 2021 (Chart 13). Given China’s huge share of the global consumption of industrial commodities, slowing Chinese growth should cool the momentum of commodity prices over the next few quarters. A slowing liquidity impulse from global central bank asset purchases is also a negative for EM debt performance, on the margin. The same can be said for the US dollar, which is no longer depreciating as markets start to pull forward the expected future path for US interest rates (Chart 14). A stronger US dollar typically correlates with softer commodity prices and wider EM credit spreads. Chart 13Major EM Risks: China Tightening & Global QE Tapering
Major EM Risks: China Tightening & Global QE Tapering
Major EM Risks: China Tightening & Global QE Tapering
Chart 14EM Supportive USD Weakness Is Fading
EM Supportive USD Weakness Is Fading
EM Supportive USD Weakness Is Fading
In response to these growing risks to the bullish EM backdrop - including the rapid spread of the Delta variant made worse by the less-effective vaccines available in those countries - we are downgrading our overall EM USD credit exposure in the model bond portfolio to underweight from neutral. We are doing this by cutting the EM corporate exposure from overweight to neutral, while maintaining an underweight tilt on EM USD sovereigns. We expect to further cut the EM exposure in the coming months by moving to a full underweight on EM corporates. Summing it all up, our overall allocations and risks in our model portfolio leading into Q3/2021 look like this: An overall below-benchmark stance on global duration, equal to nearly one full year versus the custom index (Chart 15) A moderate overweight stance on global spread product versus government debt, equal to five percentage points of the portfolio (Chart 16). This overweight comes almost entirely from overweight allocations to US and euro area high-yield corporate debt. Chart 15Overall Portfolio Duration: Stay Below Benchmark
Overall Portfolio Duration: Stay Below Benchmark
Overall Portfolio Duration: Stay Below Benchmark
Chart 16Overall Portfolio Allocation: Small Spread Product Overweight
GFIS Model Bond Portfolio Q2/2021 Performance Review & Current Allocations: Hitting A Few Roadblocks
GFIS Model Bond Portfolio Q2/2021 Performance Review & Current Allocations: Hitting A Few Roadblocks
After the changes made to our US Treasury and EM positions, the tracking error of the portfolio, or its expected volatility versus that of the benchmark index, is quite low at 34bps (Chart 17). The main reason for this is that our positioning remains focused heavily on the US (Treasury underweight, high-yield overweight), with much of the other positioning close to neutral or largely offsetting other positions in a relative value sense (overweight Australia vs underweight Canada, overweight US CMBS versus underweight US Agency MBS). This fits with our desire to maintain only a moderate level of overall portfolio risk. The yield of the portfolio is now slightly higher than that of the benchmark, with a small “positive carry”, hedged into USD, of 13bps (Chart 18). Chart 17Overall Portfolio Risk: Moderate
Overall Portfolio Risk: Moderate
Overall Portfolio Risk: Moderate
Chart 18Overall Portfolio Yield: Small Positive Carry Vs. Benchmark
Overall Portfolio Yield: Small Positive Carry Vs. Benchmark
Overall Portfolio Yield: Small Positive Carry Vs. Benchmark
Scenario Analysis & Return Forecasts After making the shifts to our model bond portfolio allocations in the US and EM, we now turn to scenario analysis to determine the return expectations for the portfolio for the next six months. On the credit side of the portfolio, we use risk-factor-based regression models to forecast future yield changes for global spread product sectors as a function of four major factors - the VIX, oil prices, the US dollar and the fed funds rate (Table 2A). For the government bond side of the portfolio, we avoid using regression models and instead use a yield-beta driven framework, taking forecasts for changes in US Treasury yields and translating those in changes in non-US bond yields by applying a historical yield beta (Table 2B). For our scenario analysis over the next six months, we use a base case scenario plus two alternate “tail risk” scenarios. We see global growth momentum and the Fed monetary policy outlook as the two most important factors for fixed income markets in the second half of 2021, thus our scenarios are defined along those lines. Table 2AFactor Regressions Used To Estimate Spread Product Yield Changes
GFIS Model Bond Portfolio Q2/2021 Performance Review & Current Allocations: Hitting A Few Roadblocks
GFIS Model Bond Portfolio Q2/2021 Performance Review & Current Allocations: Hitting A Few Roadblocks
Table 2BEstimated Government Bond Yield Betas To US Treasuries
GFIS Model Bond Portfolio Q2/2021 Performance Review & Current Allocations: Hitting A Few Roadblocks
GFIS Model Bond Portfolio Q2/2021 Performance Review & Current Allocations: Hitting A Few Roadblocks
Base Case Global growth stays above-trend in both Q3 and Q4, putting downward pressure on unemployment rates and keeping realized inflation elevated. Ongoing global vaccinations lead to more of the global economy fully reopening, with the Delta variant not having serious widespread impact on economic confidence outside of parts of the emerging world. Excess savings built up during the pandemic are run down by both consumers and businesses as optimism stays ebullient within the developed economies. China credit tightening slows growth enough to cool off upward commodity price momentum. At the same time, falling US unemployment and surprisingly “sticky” domestic US realized inflation embolden the Fed to signal a move to begin tapering its bond purchases starting in January 2022. Real bond yields globally bottom out, while inflation expectations recover some of the pullback seen in Q2/2021. The entire US Treasury curve shifts higher, led by the 10-year reaching 1.65% and a modest bear-flattening of the 5-year/30-year curve. The VIX stays near 15, the US dollar rises +3%, the Brent oil price goes nowhere and the fed funds rate is unchanged at 0% Upside Growth Surprise The Delta variant proves to be far less deadly than feared. A rapid pace of global vaccinations leads to booming growth led by the US but including a fully reopened euro area. Chinese policymakers begin to reverse some of the H1/2021 credit tightening. Unemployment rates rapidly fall worldwide, while supply bottlenecks persist, keeping upward pressure on realized inflation. Markets pull forward the timing and pace of future central bank interest rate hikes, most notably in the US when the Fed begins tapering bond purchases sooner than expected before year-end. Real bond yields drift higher globally, but inflation breakevens stay elevated with the earlier surge in realized inflation proving not to be “transitory”. The US Treasury curve modestly bear-flattens, with the 10-year reaching 1.9% and the 5-year/30-year spread narrowing by 25bps. The VIX rises to 25 as risk assets struggle in response to rising bond yields even with faster growth. The US dollar falls -5% on the back of improving global growth expectations, the Brent oil price climbs +5% and the fed funds rate stays unchanged. Downside Growth Surprise The global economy gets hit on multiple fronts: the rapid spread of the Delta variant overwhelms the positive momentum on vaccinations, most notably in EM countries; Europe struggles to fully reopen; China policy tightening results in a larger-than-expected drag on global growth; and US households are reluctant to draw down on excess savings after government income support measures expire in September. Diminished economic optimism leads to a pullback in global equity values, lower government bond yields and wider global credit spreads. The US Treasury curve bull flattens as longer-maturity yields fall in a risk-off move, with the 10-year yield moving back down to 1.25% alongside lower inflation breakevens. The VIX rises to 30, the safe-haven US dollar rises +5%, the Brent oil price falls -10% and the fed funds rate stays at 0%. Chart 19Risk Factor Assumptions For The Scenario Analysis
Risk Factor Assumptions For The Scenario Analysis
Risk Factor Assumptions For The Scenario Analysis
Chart 20US Treasury Yield Assumptions For The Scenario Analysis
US Treasury Yield Assumptions For The Scenario Analysis
US Treasury Yield Assumptions For The Scenario Analysis
The inputs into the scenario analysis are shown in Chart 19 (for the USD, VIX, oil and the fed funds rate), while the US Treasury yield scenarios are in Chart 20. The excess return scenarios for the model bond portfolio, using the above inputs in our simple quantitative return forecast framework, are shown in Table 3A (the scenarios for the changes in US Treasury yields are shown in Table 3B). Table 3AGFIS Model Bond Portfolio Scenario Analysis For The Next Six Months
GFIS Model Bond Portfolio Q2/2021 Performance Review & Current Allocations: Hitting A Few Roadblocks
GFIS Model Bond Portfolio Q2/2021 Performance Review & Current Allocations: Hitting A Few Roadblocks
Table 3BUS Treasury Yield Assumptions For The 6-Month Forward Scenario Analysis
GFIS Model Bond Portfolio Q2/2021 Performance Review & Current Allocations: Hitting A Few Roadblocks
GFIS Model Bond Portfolio Q2/2021 Performance Review & Current Allocations: Hitting A Few Roadblocks
The model bond portfolio is expected to deliver a positive excess return over the next six months of +46bps in the base case scenario and +28bps in the optimistic growth scenario, but is projected to underperform by -36bps in the pessimistic growth scenario. Bottom Line: We are maintaining an overall below-benchmark portfolio duration stance, against a backdrop of persistent above-trend global growth and a highly stimulative fiscal/monetary policy mix. We are maintaining a moderate overweight to global spread product versus government debt, concentrated on an overweight to US high-yield where valuations look the least stretched. We are making two changes to the portfolio allocations heading into Q3: shifting the Treasury curve exposure to have more of a flattening bias, while downgrading EM USD-denominated corporates to neutral. Robert Robis, CFA Chief Fixed Income Strategist rrobis@bcaresearch.com Ray Park, CFA Research Analyst ray@bcaresearch.com Footnotes 1 The GFIS model bond portfolio custom benchmark index is the Bloomberg Barclays Global Aggregate Index, but with allocations to global high-yield corporate debt replacing very high-quality spread product (i.e. AA-rated). We believe this to be more indicative of the typical internal benchmark used by global multi-sector fixed income managers. Recommendations The GFIS Recommended Portfolio Vs. The Custom Benchmark Index
GFIS Model Bond Portfolio Q2/2021 Performance Review & Current Allocations: Hitting A Few Roadblocks
GFIS Model Bond Portfolio Q2/2021 Performance Review & Current Allocations: Hitting A Few Roadblocks
Duration Regional Allocation Spread Product Tactical Trades Yields & Returns Global Bond Yields Historical Returns
Highlights Chart 1Employment Growth
Employment Growth
Employment Growth
June’s employment report revealed that 850 thousand jobs were added to nonfarm payrolls during the month. This is well above the 416k to 505k threshold that is required to hit the Fed’s “maximum employment” target in time for a rate hike in 2022 (Chart 1). The bond market, however, didn’t see things this way. Treasury yields fell across the entire curve following the report’s release on Friday. This is likely because, in contrast to the establishment survey’s strong +850k print, the household employment survey showed a decline of 18k jobs and an uptick in the unemployment rate from 5.8% to 5.9%. Importantly, the household survey tends to be more volatile than the establishment survey, and we expect it will catch up in the coming months. We see the bond market as overly complacent in the face of what is shaping up to be a rapid labor market recovery that will only accelerate once schools re-open and expanded unemployment benefits lapse in September. US bond investors should maintain below-benchmark portfolio duration. Feature Table 1Recommended Portfolio Specification
On Track For 2022 Liftoff
On Track For 2022 Liftoff
Table 2Fixed Income Sector Performance
On Track For 2022 Liftoff
On Track For 2022 Liftoff
Investment Grade: Neutral Chart 2Investment Grade Market Overview
Investment Grade Market Overview
Investment Grade Market Overview
Investment grade corporate bonds outperformed the duration-equivalent Treasury index by 50 basis points in June, bringing year-to-date excess returns up to +209 bps. The combination of above-trend economic growth and accommodative monetary policy supports continued positive excess returns for spread product versus Treasuries. At 99 bps, the 3/10 Treasury slope remains very steep and the 5-year/5-year forward TIPS breakeven inflation rate is below the Fed’s 2.3% to 2.5% target range. The message from these two indicators is that the Fed is not yet ready for monetary conditions to turn restrictive. Despite the positive macro back-drop, investment grade valuations are extremely tight. The investment grade corporate index’s 12-month breakeven spread is at its lowest since 1995 (Chart 2). Last week’s report looked at what different combinations of Treasury slope and corporate spreads have historically signaled about corporate bond excess returns.1 We found that tight corporate spreads only correlate with negative excess returns once the 3/10 Treasury slope is below 50 bps. Though we retain a positive view of spread product as a whole, better value can be found outside of the investment grade corporate sector. Specifically, we recommend favoring high-yield over investment grade. We also prefer municipal bonds, USD-denominated EM sovereigns and USD-denominated EM corporates over investment grade US corporates with the same credit rating and duration. Table 3ACorporate Sector Relative Valuation And Recommended Allocation*
On Track For 2022 Liftoff
On Track For 2022 Liftoff
Table 3BCorporate Sector Risk Vs. Reward*
On Track For 2022 Liftoff
On Track For 2022 Liftoff
High-Yield: Overweight Chart 3High-Yield Market Overview
High-Yield Market Overview
High-Yield Market Overview
High-Yield outperformed the duration-equivalent Treasury index by 122 basis points in June, bringing year-to-date excess returns up to +468 bps. Last week’s report looked at the default expectations that are currently priced into the junk index and considered whether they are likely to be met.2 If we demand an excess spread of 100 bps and assume a 40% recovery rate on defaulted debt, then the High-Yield index embeds an expected default rate of 2.8% (Chart 3). Using a model of the 12-month trailing speculative grade default rate that is based on gross corporate leverage (pre-tax profits over total debt) and C&I lending standards, we estimate that the 12-month default rate will fall to between 2.3% and 2.8%, slightly below what the market currently discounts. This estimate assumes 7% real GDP growth (an input we use to forecast corporate profit growth) and corporate debt growth of between 0% and 8%. Notably, the corporate default rate is tracking at an annualized rate of roughly 1.8% through the first five months of the year, below the estimate generated by our macro model. At 267 bps, the average option-adjusted spread on the High-Yield index is at its lowest since 2007. However, our above analysis suggests that these spread levels are still consistent with earning positive excess returns versus duration-matched Treasuries because default losses will also be low. High-yield spreads also look relatively attractive compared to investment grade spreads. Investors still receive an additional 97 bps of spread as compensation for moving out of the Baa credit tier and into the Ba tier (panel 2). Given the accommodative macro environment, we advise investors to grab this extra spread. MBS: Underweight Chart 4MBS Market Overview
MBS Market Overview
MBS Market Overview
Mortgage-Backed Securities underperformed the duration-equivalent Treasury index by 36 basis points in June, dragging year-to-date excess returns down to -45 bps. The nominal spread between conventional 30-year MBS and equivalent-duration Treasuries tightened 8 bps in June. The spread remains wide compared to recent history, but it is still tight compared to the pace of mortgage refinancings (Chart 4). The conventional 30-year MBS option-adjusted spread (OAS) widened 13 bps in June (panel 3), and it is now starting to look more competitive compared to other similarly risky spread sectors. The conventional 30-year MBS OAS sits at 34 bps, below the 49 bps offered by Aa-rated corporate bonds but above the 17 bps offered by Aaa-rated consumer ABS and the 30 bps offered by Agency CMBS. In a recent report we looked at MBS performance and valuation across the coupon stack.3 We noted that the higher convexity of high-coupon MBS makes them likely to outperform lower-coupon MBS in a rising yield environment. Higher coupon MBS also have greater OAS than lower coupons. This makes the high-coupon MBS more likely to outperform in a flat bond yield environment as well. Given our view that bond yields will rise during the next 6-12 months, we recommend favoring high coupons (4%, 4.5%) over low coupons (2%, 2.5%, 3%) within an overall underweight allocation to Agency MBS. Government-Related: Neutral Chart 5Government-Related Market Overview
Government-Related Market Overview
Government-Related Market Overview
The Government-Related index outperformed the duration-equivalent Treasury index by 4 basis points in June, bringing year-to-date excess returns up to +91 bps (Chart 5). Sovereign debt underperformed duration-equivalent Treasuries by 16 bps in June, dragging year-to-date excess returns down to +36 bps. Foreign Agencies outperformed the Treasury benchmark by 10 bps on the month, bringing year-to-date excess returns up to +46 bps. Local Authority bonds outperformed by 31 bps in June, bringing year-to-date excess returns up to +392 bps. Domestic Agency bonds underperformed by 1 bp, dragging year-to-date excess returns down to +26 bps. Supranationals outperformed by 3 bps, bringing year-to-date excess returns up to +26 bps. USD-denominated Emerging Market (EM) Sovereign bonds continue to offer an attractive spread pick-up versus investment grade US corporate bonds with the same credit rating and duration. Attractive countries include: Qatar, UAE, Saudi Arabia, Mexico and Russia. Last week’s report looked at valuation within the investment grade USD-denominated EM corporate space.4 We found that EM corporates are attractively priced relative to US corporate bonds across the entire investment grade credit spectrum. We also found that EM corporates are attractive relative to EM sovereigns within the A and Baa credit tiers. EM sovereigns have the edge in the Aa credit tier. Municipal Bonds: Overweight Chart 6Municipal Market Overview
Municipal Market Overview
Municipal Market Overview
Municipal bonds outperformed the duration-equivalent Treasury index by 22 basis points in June, bringing year-to-date excess returns up to +309 bps (before adjusting for the tax advantage). We took a detailed look at municipal bond performance and valuation in a recent report and come to the following conclusions.5 First, the economic and policy back-drop is favorable for municipal bond performance. The recently enacted American Rescue Plan includes $350 billion of funding for state & local governments, a bailout that came after state & local government revenues already exceeded expenditures in 2020 (Chart 6). Second, Aaa-rated municipal bonds look expensive relative to Treasuries (top panel). Muni investors should move down in quality to pick up additional yield. Third, General Obligation (GO) and Revenue munis offer better value than investment grade corporates with the same credit rating and duration, particularly at the long-end of the curve. Revenue munis in the 12-17 year maturity bucket offer a before-tax yield pick-up versus corporates. GO munis offer a breakeven tax of just 6% (panel 2). Fourth, taxable munis offer a yield advantage over credit rating and duration-matched investment grade corporates that investors should grab (panel 3). Finally, high-yield muni spreads are reasonably attractive relative to high-yield corporates, offering a breakeven tax rate of 20% (panel 4). But despite the attractive spread, we recommend only a neutral allocation to high-yield munis versus high-yield corporates as the deep negative convexity of high-yield munis makes them susceptible to extension risk if bond yields rise. Treasury Curve: Buy 2/10 Barbell Versus 5-Year Bullet Chart 7Treasury Yield Curve Overview
Treasury Yield Curve Overview
Treasury Yield Curve Overview
The Treasury curve underwent a massive re-shaping in June. Yields at the front-end of the curve rose significantly after the June FOMC meeting while longer-maturity yields declined. All told, the yield curve flattened dramatically on the month. The 2/10 slope flattened 24 bps to end the month at 120 bps. The 5/30 slope flattened 28 bps to end the month at 119 bps. As we wrote in a recent report, we believe that the June FOMC meeting marks an inflection point for the yield curve.6 Prior to the meeting, the yield curve up to the 10-year maturity point had generally been in a bear-steepening/bull-flattening regime, where the slope of the yield curve was positively correlated with the average level of yields (Chart 7). But bond investors appear to have left the June FOMC meeting with a sense that we are now marching toward a Fed rate hike cycle. In that new world, it makes more sense for the yield curve to be negatively correlated with the average level of yields: a bear-flattening/bull-steepening regime. Given that we expect the Fed to lift rates before the end of 2022, we are now sufficiently close to a tightening cycle that the yield curve should bear-flatten between now and then. We therefore recommend that investors short the 5-year bullet and go long a duration-matched barbell consisting of the 2-year and 10-year notes. This position offers a negative yield pick-up, but it looks modestly cheap on our fair value model (see Appendix A) and it will earn capital gains as the 2/10 slope flattens. TIPS: Neutral Chart 8TIPS Market Overview
TIPS Market Overview
TIPS Market Overview
TIPS underperformed the duration-equivalent nominal Treasury index by 22 basis points in June, dragging year-to-date excess returns down to +461 bps. The 10-year and 5-year/5-year forward TIPS breakeven inflation rates both fell 10 bps on the month. At 2.35%, the 10-year TIPS breakeven inflation rate is just within the 2.3% to 2.5% range that is consistent with inflation expectations being well anchored around the Fed’s target (Chart 8). Meanwhile, at 2.18%, the 5-year/5-year forward TIPS breakeven inflation rate is below where the Fed would like it to be (panel 3). We see some upside in long-maturity TIPS breakeven inflation rates during the next 6-12 months, as we expect that the 5-year/5-year forward breakeven will find its way back into the Fed’s target range before the first rate hike. However, once the Fed starts tightening it will have a strong incentive to keep long-maturity breakevens below 2.5%. This means that a long position in TIPS versus nominal Treasuries has limited upside. We also see the cost of short-maturity inflation protection falling somewhat during the next few months, as realized inflation is likely at its peak. This will lead to some modest steepening of the inflation curve (panel 4). We do expect, however, that the inflation curve will remain inverted. An inverted inflation curve is simply more consistent with the Fed’s Average Inflation Target than a positively sloped one, as the Fed will be attacking its inflation target from above rather than from below. ABS: Overweight Chart 9ABS Market Overview
ABS Market Overview
ABS Market Overview
Asset-Backed Securities outperformed the duration-equivalent Treasury index by 6 basis points in June, bringing year-to-date excess returns up to +39 bps. Aaa-rated ABS outperformed by 5 bps on the month, bringing year-to-date excess returns up to +31 bps. Non-Aaa ABS outperformed by 14 bps on the month, bringing year-to-date excess returns up to +84 bps. The stimulus from last year’s CARES act led to a significant increase in household savings when individual checks were mailed in April 2020. That excess savings has still not been spent and the most recent round of stimulus checks has only added to the stockpile by pushing the savings rate higher yet again (Chart 9). The extraordinarily large stock of household savings means that the collateral quality of consumer ABS is also extraordinarily high. Indeed, many households have been using their windfalls to pay down consumer debt (bottom panel). Investors should remain overweight consumer ABS and should also take advantage of the high quality of household balance sheets by moving down the quality spectrum. Non-Agency CMBS: Neutral Chart 10CMBS Market Overview
CMBS Market Overview
CMBS Market Overview
Non-Agency Commercial Mortgage-Backed Securities outperformed the duration-equivalent Treasury index by 20 basis points in June, bringing year-to-date excess returns up to +183 bps. Aaa Non-Agency CMBS outperformed Treasuries by 4 basis points in June, bringing year-to-date excess returns up to +82 bps. Non-Aaa Non-Agency CMBS outperformed Treasuries by 66 bps in June, bringing year-to-date excess returns up to a whopping +522 bps (Chart 10). Though returns have been strong and spreads remain attractive, particularly for lower-rated CMBS, we continue to recommend only a neutral allocation to the sector because of the structurally challenging environment for commercial real estate. Even with the economic recovery well underway, commercial real estate loan demand continues to contract and banks are not making lending standards more accommodative (panels 3 & 4). Agency CMBS: Overweight Agency CMBS underperformed the duration-equivalent Treasury index by 9 basis points in June, dragging year-to-date excess returns down to +116 bps. The average index option-adjusted spread widened 3 bps on the month and it currently sits at 30 bps (bottom panel). Though Agency CMBS spreads have recovered to well below pre-COVID levels, they still look attractive compared to other similarly risky spread products. Stay overweight. Appendix A: Butterfly Strategy Valuations The following tables present the current read-outs from our butterfly spread models. We use these models to identify opportunities to take duration-neutral positions across the Treasury curve. The following two Special Reports explain the models in more detail: US Bond Strategy Special Report, “Bullets, Barbells And Butterflies”, dated July 25, 2017, available at usbs.bcaresearch.com US Bond Strategy Special Report, “More Bullets, Barbells And Butterflies”, dated May 15, 2018, available at usbs.bcaresearch.com Table 4 shows the raw residuals from each model. A positive value indicates that the bullet is cheap relative to the duration-matched barbell. A negative value indicates that the barbell is cheap relative to the bullet. Table 4Butterfly Strategy Valuation: Raw Residuals In Basis Points (As Of June 30TH, 2021)
On Track For 2022 Liftoff
On Track For 2022 Liftoff
Table 5 scales the raw residuals in Table 4 by their historical means and standard deviations. This facilitates comparison between the different butterfly spreads. Table 5Butterfly Strategy Valuation: Standardized Residuals (As Of June 30TH, 2021)
On Track For 2022 Liftoff
On Track For 2022 Liftoff
Table 6 flips the models on their heads. It shows the change in the slope between the two barbell maturities that must be realized during the next six months to make returns between the bullet and barbell equal. For example, a reading of 9 bps in the 5 over 2/10 cell means that we would only expect the 5-year to outperform the 2/10 if the 2/10 slope steepens by more than 9 bps during the next six months. Otherwise, we would expect the 2/10 barbell to outperform the 5-year bullet. Table 6Discounted Slope Change During Next 6 Months (BPs)
On Track For 2022 Liftoff
On Track For 2022 Liftoff
Appendix B: Excess Return Bond Map The Excess Return Bond Map is used to assess the relative risk/reward trade-off between different sectors of the US bond market. It is a purely computational exercise and does not impose any macroeconomic view. The Map’s vertical axis shows 12-month expected excess returns. These are proxied by each sector’s option-adjusted spread. Sectors plotting further toward the top of the Map have higher expected returns and vice-versa. Our novel risk measure called the “Risk Of Losing 100 bps” is shown on the Map’s horizontal axis. To calculate it, we first compute the spread widening required on a 12-month horizon for each sector to lose 100 bps or more relative to a duration-matched position in Treasury securities. Then, we divide that amount of spread widening by each sector’s historical spread volatility. The end result is the number of standard deviations of 12-month spread widening required for each sector to lose 100 bps or more versus a position in Treasuries. Lower risk sectors plot further to the right of the Map, and higher risk sectors plot further to the left. Chart 11Excess Return Bond Map (As Of June 30TH, 2021)
On Track For 2022 Liftoff
On Track For 2022 Liftoff
Ryan Swift US Bond Strategist rswift@bcaresearch.com Footnotes 1 Please see US Bond Strategy Weekly Report, “The Post-FOMC Credit Environment”, dated June 29, 2021. 2 Please see US Bond Strategy Weekly Report, “The Post-FOMC Credit Environment”, dated June 29, 2021. 3 Please see US Bond Strategy Weekly Report, “A New Conundrum”, dated April 20, 2021. 4 Please see US Bond Strategy Weekly Report, “The Post-FOMC Credit Environment”, dated June 29, 2021. 5 Please see US Bond Strategy Weekly Report, “Making Money In Municipal Bonds”, dated April 27, 2021. 6 Please see US Bond Strategy / Global Fixed Income Strategy Weekly Report, “How To Re-Shape The Yield Curve Without Really Trying”, dated June 22, 2021.
Highlights Barring major surprises, President Macron will be re-elected in 2022. Any dramatic reversal in the pandemic that leads to a new recession would benefit the opposition candidate. Otherwise, Macron will remain the frontrunner. A second term for President Macron would see a continuation of the structural reforms started in 2017, but with a longer process for coalition-building in the National Assembly. This is bullish for France. Reducing the size of the state will go a long way to improve France’s economic competitiveness over the long run. Tactically, favor the more defensive Spanish market over the highly cyclical French market. Underweight French consumer discretionary equities relative to their European and global peers. Longer term, overweight French industrials equities relative to German ones, and overweight French tech equities relative to European ones. Ahead of the election, buy the dip on any euro weakness and French OAT/German bund spread widening. Feature The French presidential election is nine months away, and it is already starting to catch investors’ attention as one of the main political events in Europe in 2022. In talks with clients, we’ve been asked repeatedly about the odds we assign to a Marine Le Pen victory and the market implications. Those concerns are understandable but overrated. Le Pen’s personal approval rating is on the rise, and, in most polls, the far-right candidate beats President Emmanuel Macron in the first round vote, although not the critical second round. Although the same polls see Macron being re-elected, the gap between the two has narrowed considerably since the 2017 election, which Macron won by 66 percent of the vote. Still, Macron is favored for re-election. He has several strong advantages over Le Pen, and it is unlikely she will be able to close the gap further before the election. Macron’s first term has been eventful. Neoliberal structural reforms started with drums beating in the first 18 months of his term. But the pace and breadth of reform eventually became too ambitious or painful for France to bear, and protests erupted in 2018. First came the “Yellow Vest Movement,” and then came protests against pension reform. Macron tried to compromise and continue with his agenda, but COVID-19 forced his hand. Since then, Macron has focused on crisis management, benefiting from the large state sector’s role as an automatic stabilizer amid the downturn. A second term under President Macron would see a reboot of the structural reforms started in 2017, albeit without single-party rule in the National Assembly. Reforms aimed at reducing the size of the state, and its cost, would go a long way to improve France’s economic competitiveness over the long run. Therefore, the prospect of Macron’s reelection is bullish for France, even though the reality of his second term would be more complex. 2017 All Over Again? Yes And No At first glance, the 2022 election seems to be a repeat of 2017. Le Pen and Macron are likely to face off in the second round and the latter, the Europhile centrist candidate, is likely to win once more. However, everything surrounding this election has changed. The Incumbency Effect One of the major changes is favorable for Macron: he is the incumbent running for re-election. Macron had been part of President Francois Hollande’s government since 2014, so he was still viewed in 2017 as a political neophyte and dark horse candidate. His rapid rise to power, along with that of his upstart party, La République En Marche (LREM), was astounding. Chart 1Pro-Incumbency Effect Favors Macron
France: More Than Just A Déjà-Vu
France: More Than Just A Déjà-Vu
There is a strong pro-incumbency effect in French presidential elections, especially in the first round (Chart 1). Since 1965, five incumbents have run for re-election, and all have made it to the second round. Importantly, four won first place in the first round, with a six percentage-point margin on average. The chief exception is Nicolas Sarkozy in 2012. The reason for Sarkozy’s loss, however, is well known: he attempted to pass an unpopular pension reform in the teeth of the Euro debt crisis, 12 months before facing re-election. The only other incumbent who failed at re-election was Valerie Giscard d’Estaing, who lost to Francois Mitterrand in 1981, when the whole world was in stagflation and upheaval. The incumbency effect is not as pronounced in the second round (Chart 1, bottom panel). However, when facing a far-right candidate, incumbents win by a wide margin. This was the case in 2002 and 2017. Today, Macron still has a 12-point lead on Le Pen. Macron compares well to his predecessors. Chart 2 shows the approval rating for all presidents sitting in office over the past 40 years. The number of people who intend to vote for Macron has increased, the first time this has happened for an incumbent president since 1988. Only three presidents had a higher approval rating at this stage of their term, albeit from a higher starting point. Macron’s approval rating has increased by 10% since February 2020, when the COVID-19 pandemic hit Europe. Chart 2Macron Compares Well To His Predecessors
France: More Than Just A Déjà-Vu
France: More Than Just A Déjà-Vu
Table 1Incumbency And Recessions Under The Fifth Republic
France: More Than Just A Déjà-Vu
France: More Than Just A Déjà-Vu
The shock of the pandemic and recession is the greatest change since 2017, and the biggest challenge facing Macron. Four incumbents have made a bid for re-election that was preceded by a recession within 12-24 months (Table 1). The results are mixed, and it is hard to establish a clear anti-incumbency effect. If anything, the timing and nature of this crisis are likely to help Macron rather than hurt him, since the vaccination campaign and easing of lockdown measures will enable the economy to normalize and improve ahead of April 10-24, 2022, when voters cast their first ballots. Nonetheless, another major shock (of any kind) could undermine the incumbent advantage. Economic Recovery Is The Top Priority While the Macron administration’s handling of the pandemic was questioned, public opinion was never aggressively hostile toward his handling of the economy. Macron was instrumental in securing a major European fiscal stimulus package (and joint debt issuance) with the German Chancellor, Angela Merkel. He enthusiastically adopted the crisis mentality of “whatever it takes” to wage war against COVID-19, enabling the oversized French state to deploy the most generous furlough scheme in Europe, shielding millions of workers and preventing businesses from going under. This will be one of his winning cards. Chart 3The Handling Of The Pandemic Dictates Macron's Popularity
The Handling Of The Pandemic Dictates Macron's Popularity
The Handling Of The Pandemic Dictates Macron's Popularity
His approval rating began to rebound following the end of lockdowns (Chart 3). This trend should strengthen as the French economy reopens, supported by a government that will play an accommodative and reflationary economic role until the election. Public opinion wants him to focus on the labor market and the economic recovery in the months to come, and he will be happy to oblige. Public opinion also views Macron as the most qualified candidate when it comes to economic matters (Table 2). 42% of respondents think that Le Pen is not qualified “at all” on economic matters, her Achilles’ heel, a perception that was already entrenched when Macron crushed her in a televised debate before the second round of the 2017 election. Table 2Macron Is Perceived As The Most Qualified To Oversee The Economic Recovery
France: More Than Just A Déjà-Vu
France: More Than Just A Déjà-Vu
Europhile Versus Eurosceptic? The central issue of the 2017 election was Europe and France’s role in it. Following the UK’s disruptive Brexit referendum in 2016, and a long tradition of Euroscepticism within her party, Le Pen campaigned on “Frexit” and the abandonment of the euro. Conversely, Macron embraced the EU and the monetary union as he ran for president and committed to having France play a more important role within the bloc if he won. Chart 4Le Pen And The EU: Not The Divorce We Expected
Le Pen And The EU: Not The Divorce We Expected
Le Pen And The EU: Not The Divorce We Expected
Since then, Le Pen has drastically shifted her stance on the EU. She now claims that the benefits of the common currency and single market outweigh the costs. After all, 70% of the French public support the euro and EU membership (Chart 4). Like clockwork, her personal approval ratings have steadily gone up. This strategic shift aligns her with the median voter, and combined with the Covid crisis, it is the only reason to take her candidacy remotely seriously in 2022, despite Macron’s clear advantages. Nevertheless, Le Pen has not yet risen above her 2012 peak in popular support. She failed to do so between 2014 and 2015, when the lingering European debt crisis, the Syrian refugee crisis, multiple terrorist attacks in France, and sluggish economic growth should have boosted her popularity. Her shifting perspective on the euro was therefore necessary and might be just what she needs to break through her 37% ceiling of popular support. Le Pen’s policy agenda is now focusing on protectionism, immigration, and national security. It is a Trumpian mix. However, while her new stance is more mainstream, it also differentiates her less from the other center-right politicians in France, namely Xavier Bertrand, who recently made local electoral gains in Le Pen’s northern industrial base. Macron is as strong an advocate for Europe as ever. He convinced Germany to break the taboo on joint fiscal policy during the pandemic. Now, he is also mounting a bid to become the natural leader of Europe, given that Merkel is stepping down, and her party is likely to lose standing in the German election in September. France is set to take over the rotating EU Council Presidency in the first half of 2022, under the theme “Recovery, power, belonging,” which provides Macron with a golden opportunity to pitch himself as Europe’s premier statesman and economic steward in the final months of the election campaign. One Thing Hasn’t Changed: The Outcome Of A Macron/Le Pen Duel Most opinion polls give Macron a 10-12 point lead on Le Pen in the second round of the election. This gap is wide enough to reassure investors that it is not a polling error. However, in 2017, Macron’s average lead over Le Pen was 22%, and he won the election with 66% of votes. It is the narrowing of that gap that raises eyebrows among investors. Table 3Ideological Blocs Also Favor Macron
France: More Than Just A Déjà-Vu
France: More Than Just A Déjà-Vu
Still, Le Pen’s chances at closing the gap are overrated. She is not a political “unknown” anymore and has very little ability to “surprise” voters into rallying around her next year. She will have trouble persuading those who know all about her. Grouping French voters according to ideological blocs, that is, presidential preference by party affiliation, suggests that the biggest threat to Macron is a strong center-right candidate who can beat Le Pen, especially if this should coincide with a revival of the center-left (Table 3). Otherwise, as in 2017, Macron will be able to count on voters from other parties in the second round of the election (Table 4). While both candidates appeal to right-wing constituents and would have to share their ballots, Macron can count on the green EELV party, as well as left-wing voters, to join center-right voters to elect him. Macron has made environmental issues a part of his mandate, which should help him confront a green neophyte such as Le Pen. Table 4Voting Against Le Pen Implies Voting For Macron
France: More Than Just A Déjà-Vu
France: More Than Just A Déjà-Vu
The results of the regional elections held last month confirm this analysis. The motivation to keep Le Pen and her Rassemblement National (National Rally) party out of power is still strong (see Box 1). The poor showing of the National Rally means she won’t be able to maintain her current momentum in her personal approval ratings. Box 1 2021 Regional Elections: Bad Omen For Marine Le Pen In Revival Of The Center-Right? The regional elections took place on June 20 and 27. While limited in relevance for the 2022 presidential race, the result of extremely low voter turnout, regional elections offer a gauge of how constituents feel about the political offerings from anti-establishment parties. Le Pen’s party suffered a heavy blow. It had hoped to consolidate power and build momentum ahead of the presidential election, but it failed even to win in its stronghold of Southern France. Meanwhile, Macron’s party (La République En Marche!) also disappointed. This outcome is not surprising; the local elections last year yielded similar results, highlighting the lack of presence at the local and regional levels for the four-year-old party. The surprise came from the center-right. It managed to win seven of the thirteen regions, beating far-right candidates by wide margins. Importantly, Xavier Bertand, Valérie Pécresse, and Laurent Wauquiez, all predicted to run for president next year, held onto their seats. Chart 5Strong Demographic Base In The Second Round
France: More Than Just A Déjà-Vu
France: More Than Just A Déjà-Vu
Both candidates’ demographic bases have remained the same. Macron is still popular among Millennials, white collar workers, and the elderly (Chart 5). He also has a strong base in Paris (and the suburbs) as opposed to Le Pen, and he still outperforms Le Pen among rural voters in today’s polls. Macron also scores high among the employees of the public sector—even though he is in favor of a smaller public sector. Furthermore, the unemployed mostly favor him, which reinforces the perception that he is the best candidate to improve the French economy and cut the unemployment rate. What if Le Pen fails to make it into the second round of the election? We discuss this possibility in the next section. Risks To The Base Case Scenario The greatest risks to our view are a setback in the economic recovery, an outperformance from the center-right, and the emergence of a dark horse. The latest developments in the UK and Israel, where a large share of the population is fully vaccinated, suggest that the “Delta” variant of COVID-19 remains a threat, with the potential to send economies back into lockdowns. The consequences would be dire for Macron. His chances at re-election would likely evaporate if his government imposed new lockdown measures. What about presidential candidates other than Le Pen? Our base case scenario that Macron will win is based on two assumptions: (1) the center-left Socialist Party will remain in shambles, and (2) the center-right remains scattered under different banners and will therefore lack unity. There is very little chance that the center-left will make a comeback in time, but the results from the regional elections suggest that the center-right could surprise to the upside (see Box 1), especially if it decides to rally behind a single candidate ahead of the first round. Could this candidate be a dark horse? Former Prime Minister Edouard Philippe or outsider candidate Xavier Bertrand could make formidable opponents to both Macron and Le Pen. Philippe’s personal approval rating currently stands at 50%, the highest among French politicians. He also appeals to constituents of all political leanings (Chart 6). This scenario could reshuffle the likely outcomes of both the first and second round of the election. Both Bertand and Philippe could win over voters who decided to side with Le Pen in 2017, while Philippe can compete with Macron over LREM voters. Additionally, Xavier Bertrand cuts into Le Pen’s support since he has made blue collar workers and the middle-class a priority. However, Macron and Le Pen each enjoy a strong voters’ base. It is necessary to monitor whether Valérie Pécresse (Soyons libres) and Laurent Wauquiez (Les Républicains) can be brought to endorse Xavier Bertrand ahead of the first round in 2022. Chart 6Edouard Philippe: From Ally To Outcast To Challenger?
France: More Than Just A Déjà-Vu
France: More Than Just A Déjà-Vu
Beyond The Election Aside from the presidency, the outstanding question is the makeup of the National Assembly in 2022. Macron is not likely to enjoy the strong single-party legislative majority of his first term or to gain control of the Senate. Consequently, he will be more constrained in the legislature in a second term. Nonetheless, the demand for a better economy and a healthier job market requires pro-productivity reforms, which the public knows, and Macron has made reform his banner. Other conventional parties will come under pressure to support Macron’s reform agenda, even though that agenda will be less ambitious than it was in his first term. Chart 7Strong Presence Of Right-Leaning Forces
Strong Presence Of Right-Leaning Forces
Strong Presence Of Right-Leaning Forces
Efforts at cutting back the size of the state are still likely, even though the pandemic has helped rather than hurt statism. This is because the French median voter, who never witnessed the degree of neoliberal reform that took place in the Anglo-Saxon world, has grown weary of the economy’s inefficiencies, just as the Anglo-Saxons have grown weary of laissez-faire neoliberalism. Before the pandemic, the French people understood the need to reduce the size of the state. After all, a larger state implies a larger cost burden borne by both households and corporations. When faced with the choice between paying the bill for the government’s fiscal response to COVID-19 (through higher taxes), or undertaking reforms aiming at reducing the size of the state, the French people will pick the former. Moreover, centrist forces will hold sway in the legislature (Chart 7); hence, some kind of budget normalization is expected in 2023 or thereafter. Other structural reforms If Macron wins would include pension reforms. We should also expect measures to push French companies to bring activities back to France, as well as a greater focus on leading France on the green path. Bottom Line: Barring major surprises, President Macron will be re-elected in 2022. There is a risk to our view if a center-right candidate defeats Le Pen to make it to the second round of the election. Either Macron or a center-right presidency would see a continuation of the structural reforms started in 2017, but with a longer process for coalition-building in the National Assembly. Investment Implications The French economy is currently experiencing an economic upswing. Three factors explain this pick-up: ultra-accommodative monetary conditions in Europe, fiscal largesse, and considerable pent-up demand. In 2021, GDP is projected to expand by 5.75% in annual average terms, higher than the Euro Area average of 4.6%. It should then grow by 4% in 2022 and by 2% in 2023. We remain bullish on French equities on a secular basis, as long as the elections result in further incremental structural reforms over time. As the election draws nearer, investors should treat any French OAT/German Bund spread widening as a buying opportunity and purchase the euro on any election-related dip. French Equities The CAC40 and French equities have had a good run since the beginning of the year. In absolute terms, the CAC40 is one of the best performers year-to-date, up +17%, driven by the outperformance of French consumer discretionary and financials equities, both in absolute and relative terms. However, a period of turbulence is appearing on the horizon; the shift in global growth drivers, the beginning of the global liquidity withdrawal, and lingering COVID worries are creating headwinds for the cyclicals-to-defensives ratio this summer. As such, we recently recommended investors downgrade cyclical equities tactically in Europe from overweight to neutral. With 66% in cyclicals, the French MSCI equity index will underperform in this environment, especially relative to the more defensive Spanish market (Table 5). Table 5Cyclicals Versus Defensives In European Markets
France: More Than Just A Déjà-Vu
France: More Than Just A Déjà-Vu
Chart 8Three Trade Ideas
Three Trade Ideas
Three Trade Ideas
In fact, our Combined Mechanical Valuation Indicator (CMVI) shows that French consumer discretionary equities are expensive relative to both their European and global peers (Chart 8). Regarding the reform theme, we stick with our long French industrial equities / short German industrial equities on a long-term horizon (Chart 8, second and third panel). The idea is that French reforms should suppress unit labor costs and make French exports more competitive vis-à-vis their main competitor, Germany. The latter faces a leftward shift in policy in elections this September. Finally, we recommend investors go long French tech stocks relative to their European counterparts. This sector is cheap (Chart 8, bottom panel), and the French tech sector will be supported by additional government spending of EUR7 billion on digital investments over the next two years. Bond Markets & FX A dovish ECB is consistent with a continued overweight in European peripheral bonds and an underweight stance on French government bonds. Chart 9Just Buy The Dip
Just Buy The Dip
Just Buy The Dip
What is more relevant with respect to the French election is the OAT/Bund spread. In the past, unusually wide spreads between the two represented a euro breakup premium. In early 2017, spreads widened when the approval rating of Le Pen increased (Chart 9). However, since “Frexit” and the abandonment of the euro are no longer part of Le Pen’s agenda, investors should view spread widening as a buying opportunity. Similarly, investors should buy the euro on any election-related dip, particularly following the first round. “Frexit” has been removed from the equation, hence the euro should not weaken on breakup risk this time around. Bottom Line: We remain bullish on French equities within a European portfolio on a secular basis. If our views on the cyclicals-to-defensives ratio materialize in the near-term, highly cyclical French equities will temporarily underperform, unlike the more defensive Spanish market. On a 3- to 12-month horizon, investors should short French consumer discretionary equities relative to both their European and global counterparts. Current valuations suggest that betting on the booming French tech sector at the expense of its European neighbors will be profitable. Once the election draws nearer, investors should treat any French OAT/German Bund spread widening as a buying opportunity and purchase the euro on any election-related dip. Jeremie Peloso, Associate Editor JeremieP@bcaresearch.com
Dear Client, We are sending you our Strategy Outlook today, where we outline our thoughts on the macro landscape and the direction of financial markets for the rest of 2021 and beyond. Next week, please join me for a webcast on Thursday, July 8 at 10:00 AM EDT (3:00 PM BST, 4:00 PM CEST, 10:00 PM HKT) where I will discuss the outlook. Best regards, Peter Berezin, Chief Global Strategist Highlights Macroeconomic Outlook: Global growth is peaking but will remain solidly above trend. While the proliferation of the Delta strain is likely to trigger another wave of Covid cases this summer, the economic impact will be far smaller than during past waves. Global Asset Allocation: The risk-reward profile for stocks has deteriorated since the start of the year. Nevertheless, with few signs that the global economy is heading towards another major downturn, investors should maintain a modest equity overweight on a 12-month horizon. Equities: Favor cyclicals, value-oriented, and non-US equities. Emerging markets should spring back to life in the autumn once vaccine supplies increase and Chinese fiscal policy turns more stimulative. Fixed Income: Maintain below average interest-rate duration exposure. The 10-year US Treasury yield will finish the year at 1.9%. Spread product will continue to outperform high quality government bonds. Currencies: The US dollar will resume its weakening trend as growth momentum rotates from the US to the rest of the world. EUR/USD will finish the year at 1.25. Commodities: Brent will rise to $79/bbl by end-2021, 9% above current market expectations. While the lagged effects from the slowdown in Chinese credit growth earlier this year will weigh on base metals during the summer months, the long-term outlook for metals is positive. Favor gold over cryptos as an inflation hedge. I. Macroeconomic Outlook Global Vaccination Campaign Kicks Into High Gear Nearly 18 months after the pandemic began, the global economy is on the mend. In its latest round of forecasts released on May 31st, the OECD projects that the global economy will expand by 5.8% this year, up from its March projection of 5.6%. The OECD also bumped up its growth forecast for 2022 from 4% to 4.4%. After a rough start, the vaccination campaign is progressing well in most advanced economies (Chart 1). The US and the UK were the first major developed economies to roll out the vaccines, followed by Canada and the EU. While Japan has lagged behind, the pace of vaccinations has picked up lately. Twenty percent of the Japanese population has now received at least one dose. Developing economies are still struggling to secure enough vaccines. Fortunately, this problem should abate over the next six months. The Global Health Innovation Center at Duke University estimates that pharmaceutical companies are on track to produce more than 10 billion vaccine doses this year (Chart 2). While perhaps not enough to inoculate everyone who wants a jab, it will suffice in providing protection to the most vulnerable members of society – the elderly and those with pre-existing medical conditions. Chart 1The Vaccination Campaign Is Progressing Well In Most Developed Economies
The Vaccination Campaign Is Progressing Well In Most Developed Economies
The Vaccination Campaign Is Progressing Well In Most Developed Economies
Chart 2Vaccine Makers Are On Track To Produce Over 10 Billion Doses In 2021
2021 Third Quarter Strategy Outlook: The Path To Normal
2021 Third Quarter Strategy Outlook: The Path To Normal
New Variants And Vaccine Hesitancy Are Risks Novel strains of the virus remain a concern. First identified in India, the so-called “Delta variant” is spreading around the world. The number of new cases in the UK, where the Delta variant accounts for over 90% of all new infections, is rising again (Chart 3). The latest outbreak has forced the government to postpone “Freedom Day” from June 21st to July 19th (Chart 4). Chart 3The Number Of New Cases In The UK Is Rising Anew
2021 Third Quarter Strategy Outlook: The Path To Normal
2021 Third Quarter Strategy Outlook: The Path To Normal
Chart 4Dismantling Of Lockdown Measures Occurring At Varying Pace
2021 Third Quarter Strategy Outlook: The Path To Normal
2021 Third Quarter Strategy Outlook: The Path To Normal
It is highly likely that the Delta variant will produce another wave of cases in the US this summer. Despite ample availability, one-third of Americans over the age of 18 have yet to receive a single dose of a vaccine. As is the case with most everything in the United States, the question of whether to be inoculated has become politicized. In many Republican-leaning states, more than half the population remains unvaccinated (Chart 5). Chart 5The US Politicization Of Vaccines Raises The Risk From COVID-19 Variants
2021 Third Quarter Strategy Outlook: The Path To Normal
2021 Third Quarter Strategy Outlook: The Path To Normal
Vaccine hesitancy will likely diminish as the evidence of their effectiveness continues to mount. According to analysis by the Associated Press using CDC data, fully vaccinated people accounted for less than 1% of the 18,000 COVID-19 deaths in the US in May. A study out of the UK showed that two doses of the Pfizer-BioNTech vaccine was 96% effective against hospitalization from the Delta variant, while the Oxford-AstraZeneca vaccine was 92% effective. While another wave of the pandemic will curb growth this summer, the economic impact will be far smaller than in the past. At this point, the initial terror of the pandemic has faded. Politically, it will be more difficult to justify lockdowns in countries such as the US where almost everyone who wants a vaccine has already been able to get one. Macro Policy Outlook: Tighter But Not Tight After cranking the fire hose to full blast during the pandemic, policymakers are looking to scale back support. On the fiscal side, governments are slowly starting to rein in budget deficits. The IMF expects the fiscal impulse in advanced economies to average -4% of GDP in 2022, implying an incrementally tighter fiscal stance (Chart 6). Chart 6Budget Deficits Set To Decline, But Remain High By Historic Standards
2021 Third Quarter Strategy Outlook: The Path To Normal
2021 Third Quarter Strategy Outlook: The Path To Normal
Tighter does not necessarily mean tight, however. The IMF sees advanced economies running an average cyclically-adjusted primary budget deficit of 2.6% of GDP between 2022 and 2026, compared to an average deficit of 1.1% of GDP between 2014 and 2019. In the US, Congress is debating an infrastructure bill, a key element of President Biden’s “Build Back Better” agenda. If the bill fails to move out of the Senate, our geopolitical strategists expect Congress to use the reconciliation process to pass most of Biden’s legislative program. This should result in an additional 1.3% of GDP in federal spending per year over the next 8 years, offset only partly by higher taxes. Chart 7EU Fiscal Policy: Allocations To Southern European Countries Are Relatively Large
EU Fiscal Policy: Allocations To Southern European Countries Are Relatively Large
EU Fiscal Policy: Allocations To Southern European Countries Are Relatively Large
Chart 8Japanese PMIs Stuck In The Mud
Japanese PMIs Stuck In The Mud
Japanese PMIs Stuck In The Mud
In the euro area, the IMF expects fiscal policy to remain structurally looser by nearly 2% of GDP in the post-pandemic period. After six months of parliamentary debates, all 27 EU countries ratified the €750 billion Next Generation fund on May 28th. The allocations from the fund for southern European countries are relatively large (Chart 7). Most of the money will be spent on public investment projects with high fiscal multipliers. Japan has a habit of tightening fiscal policy at exactly the wrong moment, with the October 2019 hike in the sales tax from 8% to 10% being no exception. Unlike in other developed economies, both the Japanese manufacturing and services PMI remain stuck in the mud (Chart 8). The odds are rising that Prime Minister Yoshihide Suga will announce a major stimulus package after the Olympic Games and ahead of the general election due by October 22nd. China: Normalization Not Deleveraging Chart 9China: Weak Infrastructure Spending Should Pick Up
China: Weak Infrastructure Spending Should Pick Up
China: Weak Infrastructure Spending Should Pick Up
In China, strong export growth, propelled by the shift in global spending towards manufactured goods during the pandemic, allowed the government to tighten fiscal policy modestly in the first half of the year. Looking out, fiscal policy should turn more stimulative. Local governments used only 16% of their bond issuance allocation between January and May, compared with 59% over the same period last year and 40% in 2019. Proceeds should benefit infrastructure spending, which has been on the weak side in recent years (Chart 9). After a sharp decline, Chinese credit growth should stabilize in the second half of the year. The current pace of credit growth of 11% is near its 2018 lows and is broadly in line with nominal GDP growth (Chart 10). Given that the authorities have stated their desire to stabilize the ratio of credit-to-GDP, they are unlikely to proactively suppress credit growth further. The recent decline in the 3-month SHIBOR, which usually moves in the opposite direction of credit growth, is evidence to this effect (Chart 11). Chart 10Chinese Credit Growth Should Stabilize In The Second Half Of The Year
Chinese Credit Growth Should Stabilize In The Second Half Of The Year
Chinese Credit Growth Should Stabilize In The Second Half Of The Year
Chart 11China: Easing Off The Brakes?
China: Easing Off The Brakes?
China: Easing Off The Brakes?
Nevertheless, changes in fiscal and credit policy tend to affect the Chinese economy with a lag (Chart 12). Thus, the tightening in fiscal policy and the deceleration in credit growth that occurred early this year could still weigh on economic activity during the summer months. Chart 12China: Changes In Fiscal And Credit Policy Affect The Economy With A Lag
China: Changes In Fiscal And Credit Policy Affect The Economy With A Lag
China: Changes In Fiscal And Credit Policy Affect The Economy With A Lag
Don’t Sweat The Dot Plot Markets interpreted the June FOMC meeting in a hawkish light. Both the 2-year and 5-year yield jumped 10 basis points following the meeting (Table 1). The US dollar, which is quite sensitive to changes in short-term rate expectations, strengthened by nearly 2%. In contrast, long-term bond yields declined following the meeting, with the 10-year and 30-year bond yield falling by 6 and 19 basis points, respectively. Table 1Change In Yields Following June FOMC Meeting
2021 Third Quarter Strategy Outlook: The Path To Normal
2021 Third Quarter Strategy Outlook: The Path To Normal
As long duration assets, stocks take their cues more from long-term yields than short-term rates. Hence, it was not surprising that equities held their ground, and that growth stocks reversed some of their underperformance against value stocks this year. Chart 13Markets Interpreted The June FOMC Meeting In A Hawkish Light
Markets Interpreted The June FOMC Meeting In A Hawkish Light
Markets Interpreted The June FOMC Meeting In A Hawkish Light
This publication agrees with BCA’s bond strategists that the market overreacted to the changes in the Fed’s projections (aka “the dots”). As Chair Powell himself noted during the press conference, the dot plot is “not a great forecaster of future rate moves,” before adding that “Lift-off is well into the future.” The market is currently pricing in 105 basis points of tightening by the end of 2023. Prior to the meeting, investors were expecting 85 basis points in rate hikes (Chart 13). The regional Fed presidents tend to be more hawkish than the Board of Governors. Our guess is that Jay Powell himself only penciled in one hike for 2023. Lael Brainard, who may be replacing Powell next year, likely projects no hikes for 2023. The Path To Full Employment Chart 14The Divergence Of Goods And Services Spending
The Divergence Of Goods And Services Spending
The Divergence Of Goods And Services Spending
Rather than obsessing over the dots, investors should focus on the questions that will actually drive Fed policy, namely how long it takes the US economy to return to full employment and what happens to inflation in the interim and beyond. There is a lot of uncertainty over these questions – both on the demand side (how fast will spending recover?) and the supply side (how much labor market slack is there and how quickly can firms ramp up hiring?). On the demand side, the pandemic led to unprecedented changes in household spending and saving behavior. As Chart 14 shows, goods spending surged while services spending collapsed. Overall spending declined, and together with increased transfer payments, savings ballooned. As of May, US households were sitting on $2.5 trillion in excess savings. Looking at disaggregated bank deposit data as a proxy for the distribution of household savings, the wealthiest 10% of households accounted for about 70% of the increase in savings between Q1 of 2020 and Q1 of 2021 (Chart 15). Given that richer households have relatively low marginal propensities to spend, this suggests that a large fraction of these excess savings will remain unspent. Nevertheless, $2.5 trillion is a lot of money – it’s equal to almost 17% of annual consumption. Hence, even if a third of this cash hoard were to make its way into the economy, it could buoy aggregate demand significantly. Chart 15Excess Savings Have Mostly Flowed To The Rich
2021 Third Quarter Strategy Outlook: The Path To Normal
2021 Third Quarter Strategy Outlook: The Path To Normal
A Labor Market Puzzle Turning to the supply side, there were over 4% fewer people employed in the US in May than in January 2020 (Chart 16). On the face of it, this would suggest the presence of a significant amount of labor market slack. Chart 16US Employment Still More Than 4% Below Pre-Pandemic Levels
2021 Third Quarter Strategy Outlook: The Path To Normal
2021 Third Quarter Strategy Outlook: The Path To Normal
Yet, the NFIB small business survey tells a different story. It revealed that 48% of firms reported difficulty in filling vacant positions in May, the highest percentage of respondents in the 46-year history of the survey (Chart 17). Chart 17US Labor Market Shortages (I)
US Labor Market Shortages (I)
US Labor Market Shortages (I)
Chart 18US Labor Market Shortages (II)
US Labor Market Shortages (II)
US Labor Market Shortages (II)
Along the same lines, the nationwide job openings rate reached a record high of 6% in April, up from 4.5% in January 2020. The quits rate, a good proxy for worker confidence, is also at a record high (Chart 18). How does one reconcile the low level of employment with other data pointing to a tight labor market? As we discussed in a report two weeks ago, four explanations stand out: Generous unemployment benefits, which have depressed labor force participation among low-wage workers (Chart 19). Chart 19Labor Scarcity Prevalent In Low-Wage Sectors
2021 Third Quarter Strategy Outlook: The Path To Normal
2021 Third Quarter Strategy Outlook: The Path To Normal
Chart 20School Closures Have Curbed Labor Supply
2021 Third Quarter Strategy Outlook: The Path To Normal
2021 Third Quarter Strategy Outlook: The Path To Normal
Pandemic-related school closures. As Chart 20 shows, they have had a noticeable impact on labor force participation among women with young children. Reduced immigration. At one point during the pandemic, visa issuance was down 99% from pre-pandemic levels (Chart 21). An increase in early retirements. We estimate that about 1.5 million more workers retired during the pandemic than would have been expected based solely on demographic trends (Chart 22). Chart 21US Migrant Worker Supply Is Depressed
2021 Third Quarter Strategy Outlook: The Path To Normal
2021 Third Quarter Strategy Outlook: The Path To Normal
Chart 22The Pandemic Accelerated Early Retirement
The Pandemic Accelerated Early Retirement
The Pandemic Accelerated Early Retirement
All but the last effect is likely to be fleeting. Enhanced unemployment benefits expire in September; President Biden has reversed President Trump’s ban on most worker visas; and schools should fully reopen by the fall. And even for the retirement effect, most recent retirees were approaching retirement age anyway. Thus, there will likely be fewer incremental retirements over the next few years. A Speed Limit To Hiring? Assuming that a large fraction of sidelined workers return to the labor market in the fall, how fast will firms be able to hire them? In general, we are skeptical of arguments claiming that there is much of a speed limit to the pace of hiring. Chart 23There Is A Lot Of Churn In The Labor Market
There Is A Lot Of Churn In The Labor Market
There Is A Lot Of Churn In The Labor Market
There is a lot of churn in the labor market. Gross job flows are much larger than net flows. Between 2015 and 2019, 66.1 million people were hired on average per year compared with 59.6 million who quit or were discharged. Churn is especially strong in the retail and hospitality sectors, the two segments that account for the bulk of today’s shortfall in jobs. In April of this year, retailers hired nearly 800,000 workers. An additional 1.42 million workers found jobs in the leisure and hospitality sectors. This is equivalent to 5.3% and 10.1% of total employment in those sectors, respectively (Chart 23). And remember, we are talking about only one month’s worth of hiring. During past V-shaped recoveries, employment growth often surpassed 5% on a year-over-year basis (Chart 24). Such a growth rate would produce net 670K new jobs per month, enough to restore full employment by mid-2022. Chart 24V-Shaped Recoveries Are Generally Followed By Strong Labor Market Recoveries
V-Shaped Recoveries Are Generally Followed By Strong Labor Market Recoveries
V-Shaped Recoveries Are Generally Followed By Strong Labor Market Recoveries
The Fed’s Three Criteria For Lift-Off In August of 2020, the Fed formally adopted a “flexible average inflation targeting” framework. It seeks to offset periods of below-target inflation with periods of above-target inflation. The goal is to better anchor long-term inflation expectations, while giving households and firms more clarity over where the price level will be many years out. In the spirit of this new framework, the Fed has made it clear that it needs to see three things before it considers raising rates: The labor market must be at “maximum employment” 12-month PCE inflation must be above 2% The FOMC must expect inflation to remain above 2% for some time If the US economy achieves full employment by the middle of next year, the first criterion will be satisfied. PCE inflation clocked in at 3.9% in May, so at least for now, the second criterion is satisfied as well. The big question concerns the third criterion. How Transitory Is US Inflation Likely To Be? As Chart 25 shows, more than half of the increase in the CPI in April and May can be explained by higher vehicle prices, along with a rebound in pandemic-affected service prices (airfares, hotels, and event admissions). Outside those sectors, the level of the CPI still remains below its pre-pandemic trend, while the level of the PCE deflator is barely above it (Chart 26). Aside from a few low-wage sectors such as retail and hospitality, overall wage growth remains contained. Neither the Atlanta Fed Wage Growth Tracker nor the Employment Cost Index – the two cleanest measures of US wage inflation – is signaling a brewing wage-price spiral (Chart 27). Chart 25Rebounding Pandemic-Affected Services Prices Are Pushing Up Overall CPI
2021 Third Quarter Strategy Outlook: The Path To Normal
2021 Third Quarter Strategy Outlook: The Path To Normal
Chart 26AUnwinding Of "Base Effects" (I)
Unwinding Of "Base Effects" (I)
Unwinding Of "Base Effects" (I)
Chart 26BUnwinding Of "Base Effects" (II)
Unwinding Of "Base Effects" (II)
Unwinding Of "Base Effects" (II)
Chart 27No Sign Of A Wage-Price Spiral... For Now
No Sign Of A Wage-Price Spiral... For Now
No Sign Of A Wage-Price Spiral... For Now
Chart 28Rising Oil Prices Have Fueled The Jump In Inflation Expectations
2021 Third Quarter Strategy Outlook: The Path To Normal
2021 Third Quarter Strategy Outlook: The Path To Normal
Chart 29Inflation Expectations Back Below The Fed's Target Zone
Inflation Expectations Back Below The Fed's Target Zone
Inflation Expectations Back Below The Fed's Target Zone
Chart 30A Top In Inflation Expectations?
A Top In Inflation Expectations?
A Top In Inflation Expectations?
While inflation expectations have risen, they should fall in the second half of the year as gasoline prices descend from their seasonal highs (Chart 28). Market expectations of inflation have already dipped back below the Fed’s comfort zone (Chart 29). Inflation expectations 5-to-10 years out in the University of Michigan’s Survey of Consumers also dropped from 3% in May to 2.8% in June (Chart 30). Overall producer price inflation should decline. Chart 31 shows that lumber prices, steel prices, agriculture prices, and memory chip prices have all peaked. Taken together, all this suggests that the recent surge in inflation is indeed likely to be “transitory.” Chart 31Input Prices Have Rolled Over
Input Prices Have Rolled Over
Input Prices Have Rolled Over
Risk-Management Considerations Favor A “Go Slow” Approach Chart 32Market Participants See An Even Lower Terminal Rate Than The Fed
Market Participants See An Even Lower Terminal Rate Than The Fed
Market Participants See An Even Lower Terminal Rate Than The Fed
The financial press often characterizes the Fed’s monetary policy as ultra-accommodative. With policy rates near zero, one would be forgiven for agreeing. However, the reality is that neither the Fed nor, for that matter, most market participants think that monetary policy is all that easy. Using expectations for the terminal Fed funds rate as a proxy for the neutral rate of interest, the Fed’s estimate of the terminal rate has fallen from 4.3% in 2012 to 2.5% at present (Chart 32). Surveys of primary dealers and other market participants suggest that investors think the terminal rate is even lower than what the Fed believes it to be. It is an open question as to whether the neutral rate really is as low as widely believed. But if it is, raising rates prematurely would be a grave mistake. Given the zero lower bound constraint on nominal policy rates, the Fed would be hard-pressed to ease monetary policy by enough to respond to any future deflationary shock. In contrast, if inflation proves to be more persistent, raising rates to cool the economy would be relatively straightforward. All this suggests that the Fed is likely to maintain its “go slow” approach. This publication expects tapering of QE to begin early next year, with no rate hike until December 2022 or early 2023. Other Central Banks Constrained By The Fed Chart 33Long-Term Inflation Expectations Remain Subdued
Long-Term Inflation Expectations Remain Subdued
Long-Term Inflation Expectations Remain Subdued
The Fed’s dovish bias limits the ability of other developed economy central banks to tighten monetary policy. For some central banks, such as the ECB and BoJ, raising rates is the last thing they want to do. In both the euro area and Japan, long-term inflation expectations remain well below target (Chart 33). The Bank of England is in a better position to tighten monetary policy than the ECB. Inflation expectations are relatively high in the UK and a frothy housing market poses a long-term threat to economic stability. Nevertheless, the need to maintain a competitive currency to facilitate post-Brexit economic adjustments will limit the BoE’s ability to raise rates. Moreover, the departure of BoE Chief Economist, Andy Haldane, from the MPC will silence the sole voice sounding the alarm over rising inflation. Among the G7 economies, the Bank of Canada is the closest to raising rates. After a slow start, the vaccination campaign is now progressing well there. Property prices have gone through the roof. The Western Canada Select oil price has reached the highest level since 2014. The discount to WTI has shrunk from a peak over 50% in November 2018 to about 20% in recent weeks. The Bank of Canada has already begun tapering asset purchases. While concerns about a stronger loonie will tie the BoC’s hands to some extent, the first rate hike is still likely in mid-2022. II. Financial Markets A. Portfolio Strategy The Golden Rule embraced by this publication is “remain bullish on stocks as long as growth is likely to remain strong for the foreseeable future.” Historically, bear markets rarely occur outside of recessions (Chart 34). With both fiscal and monetary policy still supportive, and households in many countries sitting on plenty of dry powder, the odds that the global economy will experience a major downturn in the next 12 months are low. Chart 34Recessions And Bear Markets Tend To Overlap
2021 Third Quarter Strategy Outlook: The Path To Normal
2021 Third Quarter Strategy Outlook: The Path To Normal
That said, we do acknowledge that the risk-reward profile for equities has deteriorated since the start of the year. Global stocks have risen 12% year-to-date, implying that investors have priced in an increasingly optimistic economic outlook. Our equity valuation indicator points to very poor long-term future returns, particularly in the US (Chart 35). Chart 35ALong-Term Expected Returns Are Nothing To Write Home About (I)
Long-Term Expected Returns Are Nothing To Write Home About (I)
Long-Term Expected Returns Are Nothing To Write Home About (I)
Chart 35BLong-Term Expected Returns Are Nothing To Write Home About (II)
Long-Term Expected Returns Are Nothing To Write Home About (II)
Long-Term Expected Returns Are Nothing To Write Home About (II)
Democrats in Congress will likely use the reconciliation process to raise corporate taxes. While this is unlikely to cause major problems for the economy, it could weigh on stocks. As we discussed in a past report, neither analyst earnings estimates nor market expectations are baking in much impact from higher tax rates. Meanwhile, economic growth has peaked in the US and China, and will peak in the other major economies over the balance of 2021. Slower growth is usually associated with lower overall equity returns (Table 2). Stocks are also likely to face headwinds as spending shifts back from goods to services. Goods producers are overrepresented in stock market indices compared to the broader economy. Table 2The Economic Cycle And Financial Assets
2021 Third Quarter Strategy Outlook: The Path To Normal
2021 Third Quarter Strategy Outlook: The Path To Normal
The fact that global growth is peaking at exceptionally high levels will soften the blow for stocks. Likewise, the need to rebuild inventories and satisfy pent-up demand for some manufactured goods that have been in short supply will keep goods production from falling too drastically. Nevertheless, investors who have been maximally overweight stocks should consider paring exposure by raising cash. Only a modest equity overweight is appropriate going into the second half of this year. B. Equity Sectors, Regions, And Styles While we continue to favor cyclical equity sectors over defensives, non-US over the US, and value over growth, our conviction is lower than it was at the start of the year. In the near term, the lagged effects from the slowdown in Chinese credit growth could weigh on global cyclicals. Cyclicals could also stumble as the Delta variant rolls through the US and other countries. In addition, the US dollar could sustain recent gains as investors continue to fret that the Fed is turning hawkish. A stronger dollar is usually bad for cyclicals and non-US stocks (Chart 36). Chart 36Cyclical And Non-US Stocks Tend To Outperform Defensives When The Dollar Is Weakening
Cyclical And Non-US Stocks Tend To Outperform Defensives When The Dollar Is Weakening
Cyclical And Non-US Stocks Tend To Outperform Defensives When The Dollar Is Weakening
Chart 37Bank Shares Thrive in A Rising Yield Environment
Bank Shares Thrive in A Rising Yield Environment
Bank Shares Thrive in A Rising Yield Environment
Ultimately, as discussed earlier in this report, the Fed is likely to push back against the market’s hawkish interpretation of its dot plot. The resulting reflationary impulse should cause the dollar to weaken over a 12-month horizon while allowing for a re-steepening of the yield curve. Higher long-term bond yields tend to benefit banks, which are overrepresented in value indices (Chart 37). A stabilization in credit growth and more stimulative Chinese policy later this year should temper concerns about EM growth. Greater access to vaccines will also allow more EM economies to partake in reopening euphoria, thus benefiting local EM stock markets and global cyclicals. C. Fixed Income If stocks are pricey, government bonds are even more dear. Real yields are negative in most G10 economies. And while persistently higher inflation is not an imminent threat, it is a longer-term risk that bond valuations are not discounting. We expect the 10-year US Treasury yield to rise to 1.9% by the end of the year, above current market expectations of 1.61%. As of today, we are expressing this view by going short the 10-year Treasury note in our trade table. US Treasuries have a higher beta than most other government bond markets (Chart 38). Treasury yields tend to rise more when global bond yields are moving higher and vice versa. Given our expectation that global growth will remain solidly above trend over the next 12 months, fixed-income investors should underweight high-beta bond markets such as the US and Canada, while overweighting the euro area and Japan. Chart 38US Treasuries Have A Higher Beta Than Most Other Government Bond Markets
US Treasuries Have A Higher Beta Than Most Other Government Bond Markets
US Treasuries Have A Higher Beta Than Most Other Government Bond Markets
BCA’s bond strategists see more upside from high-yield bonds than for investment grade. While high-yield spreads are quite tight, they are still pricing in a default rate of 2.9%. This is more than their fair-value default estimate of 2.3%-to-2.8% (Chart 39). It is also above the year-to-date realized default rate of 1.8%. Chart 39Spread-Implied Default Rate
Spread-Implied Default Rate
Spread-Implied Default Rate
Our bond team sees USD-denominated EM corporate bonds as being attractively priced relative to domestic investment-grade corporate bonds with the same duration and credit rating. They prefer EM corporates to EM sovereigns in the A and Baa credit tiers, while preferring EM sovereigns over EM corporates in the Aa credit tier. Investors willing to take on foreign-exchange risk should consider EM local-currency bonds. As we discuss next, a weaker US dollar over the next 12 months should translate into stronger EM currencies. D. Currencies Four forces tend to drive the US dollar over cyclical horizons of about 12 months: Growth: As a countercyclical currency, the dollar typically does poorly when global growth is strong. This is especially the case when growth is rotating away from the US to other countries (Chart 40). Bloomberg consensus estimates imply that the US economy will transition from leader to laggard over the coming months, which is dollar bearish (Table 3). Chart 40The Dollar Is A Countercyclical Currency
The Dollar Is A Countercyclical Currency
The Dollar Is A Countercyclical Currency
Table 3Growth Is Peaking, But At A Very High Level
2021 Third Quarter Strategy Outlook: The Path To Normal
2021 Third Quarter Strategy Outlook: The Path To Normal
Interest Rate Differentials: The trade-weighted dollar tends to track the real 2-year spread between the US and its trading partners (Chart 41). It is unlikely that US real rates will fall much from current levels. However, the current level of spreads is already consistent with a meaningfully weaker dollar. Chart 41Rate Differentials Are A Headwind For The Dollar
Rate Differentials Are A Headwind For The Dollar
Rate Differentials Are A Headwind For The Dollar
Balance Of Payments: The US trade deficit has increased significantly over the past year (Chart 42). Equity inflows have been helping to finance the trade deficit (Chart 43). However, if stronger growth abroad causes equity flows to move out of the US, the dollar will suffer. Chart 42The US Trade Deficit Has Increased Significantly
The US Trade Deficit Has Increased Significantly
The US Trade Deficit Has Increased Significantly
Chart 43Equity Inflows Have Helped Finance The Trade Deficit
Equity Inflows Have Helped Finance The Trade Deficit
Equity Inflows Have Helped Finance The Trade Deficit
Momentum: Being a contrarian is a losing strategy when it comes to trading the dollar. This is because the US dollar is a high momentum currency (Chart 44). The dollar usually continues to weaken when it is trading below its various moving averages and sentiment is bearish (Chart 45). At present, while the dollar is near its short-term moving averages, it is still below its long-term moving averages. Sentiment is bearish, but has come off its lows. On balance, the technical picture for the dollar is slightly negative. Chart 44The Dollar Is A High Momentum Currency
2021 Third Quarter Strategy Outlook: The Path To Normal
2021 Third Quarter Strategy Outlook: The Path To Normal
Chart 45ABeing A Contrarian Doesn't Pay When It Comes To Trading The Dollar (I)
Being A Contrarian Doesn't Pay When It Comes To Trading The Dollar (I)
Being A Contrarian Doesn't Pay When It Comes To Trading The Dollar (I)
Chart 45BBeing A Contrarian Doesn't Pay When It Comes To Trading The Dollar (II)
Being A Contrarian Doesn't Pay When It Comes To Trading The Dollar (II)
Being A Contrarian Doesn't Pay When It Comes To Trading The Dollar (II)
Adding it all up, we expect the dollar to weaken over a 12-month horizon. The dollar’s downdraft will likely begin in earnest during the fall when Chinese policy turns more stimulative and fears that the Fed has turned hawkish subside. We expect EUR/USD to finish the year at 1.25. GBP/USD should hit 1.50. Both EM and commodity currencies should also do better. The lone laggard among “fiat currencies” will be the yen. As a highly defensive currency, the yen usually struggles when global growth is firm. Chart 46To This Day, Most Crypto Payments Are Made To Criminals
2021 Third Quarter Strategy Outlook: The Path To Normal
2021 Third Quarter Strategy Outlook: The Path To Normal
What about cryptocurrencies? I debated the topic with my colleague, Dhaval Joshi, in early June. To make a long story short, I think it is highly unlikely that cryptos will ever thrive. More than 13 years since Bitcoin was created, cryptos continue to be mainly used to facilitate illicit transactions. According to Chainalysis, there were fewer cryptocurrency payments processed by merchants in 2020 than in 2017 (Chart 46). Meanwhile, Bitcoin mining continues to produce significant environmental damage (Chart 47). And if there is any place where there is hyperinflation, it is in the creation of new cryptocurrencies. There are over 5000 cryptocurrencies at last count, double the number at this time last year (Chart 48). We are currently short Bitcoin in our trade table. Chart 47Bitcoin And Ethereum: How Dare You!
2021 Third Quarter Strategy Outlook: The Path To Normal
2021 Third Quarter Strategy Outlook: The Path To Normal
Chart 48Hyperinflation In New Cryptocurrency Creation
2021 Third Quarter Strategy Outlook: The Path To Normal
2021 Third Quarter Strategy Outlook: The Path To Normal
E. Commodities Structurally, oil faces a bleak future. Transport accounts for about 60% of global oil consumption. The shift to electric vehicles will undermine this key source of oil demand. Cyclically, however, crude prices could still rise as the global economic recovery unfolds. Supply remains quite tight, reflecting both OPEC vigilance and the steep drop in oil and gas capex of recent years (Chart 49). Bob Ryan, BCA’s chief commodity strategist, expects Brent to rise to $79/bbl by the end of the year, which is 9% above current market expectations (Chart 50). Chart 49Oil And Gas Companies Curtailed Capex In Recent Years
2021 Third Quarter Strategy Outlook: The Path To Normal
2021 Third Quarter Strategy Outlook: The Path To Normal
Chart 50Oil Prices Still Have Room To Run
Oil Prices Still Have Room To Run
Oil Prices Still Have Room To Run
Chart 51Chinese Metal Consumption Up 5-Fold Since The 2000s Commodity Boom
Chinese Metal Consumption Up 5-Fold Since The 2000s Commodity Boom
Chinese Metal Consumption Up 5-Fold Since The 2000s Commodity Boom
In contrast to oil, the long-term outlook for base metals is favorable. A typical electric vehicle requires four times as much copper as a typical gasoline-propelled vehicle. By 2030, the demand from EVs alone should amount to close to 4mm tonnes of copper per year, representing about 15% of current annual copper production. Strong demand for metals from China should also buoy metals prices. While trend GDP growth in China has slowed, the economy is much bigger in absolute terms than it was in the 2000s. China’s annual aggregate consumption of metals is five times as high as it was back then (Chart 51). In the near term, however, base metals have to grapple with the lagged effects of slower Chinese credit growth (Chart 52). We downgraded base metals to neutral on May 28 and are currently long global energy stocks via the IXC ETF versus global copper miners via the COPX ETF. We expect to reverse this trade by the fall. We are generally positive on gold. Since peaking last August, the price of gold has fallen more than one might have expected based on movements in real bond yields (Chart 53). Gold will also benefit from a weaker dollar later this year. Lastly, and importantly, gold should retain its standing as a good inflation hedge. Chart 52Tighter Chinese Credit Will Be A Headwind For Base Metals Over The Summer Months
Tighter Chinese Credit Will Be A Headwind For Base Metals Over The Summer Months
Tighter Chinese Credit Will Be A Headwind For Base Metals Over The Summer Months
Chart 53Gold Prices Tend To Track Real Rates
Gold Prices Tend To Track Real Rates
Gold Prices Tend To Track Real Rates
Peter Berezin Chief Global Strategist pberezin@bcaresearch.com Global Investment Strategy View Matrix
2021 Third Quarter Strategy Outlook: The Path To Normal
2021 Third Quarter Strategy Outlook: The Path To Normal
Special Trade Recommendations
2021 Third Quarter Strategy Outlook: The Path To Normal
2021 Third Quarter Strategy Outlook: The Path To Normal
Current MacroQuant Model Scores
2021 Third Quarter Strategy Outlook: The Path To Normal
2021 Third Quarter Strategy Outlook: The Path To Normal
Dear Client, China Investment Strategy will take a summer break next week. We will resume our publication on July 14th. Best regards and we wish you a happy and healthy summer. Jing Sima, China Strategist Highlights A USD rebound and higher domestic bond yields pose near-term challenges to Chinese risk assets. A sharp deceleration in credit growth in the past seven months will lead to weaker-than-expected data from China’s old-economy sectors in the second half of the year. Robust global trade has propelled Chinese exports, allowing the country to pursue financial deleverage and structural reforms. However, next year policymakers will face increased pressure to support the domestic economy as the global economic recovery peaks and demand slows. Investors should maintain an underweight stance towards Chinese stocks in 2H21, but remain alert to any improvements in China’s policy tone. An easing monetary policy may signal a potential upgrade catalyst in 1H22. Feature Most recent macro figures confirm that China’s impressive economic upcycle has peaked. We expect that the official manufacturing and non-manufacturing PMIs, which will be released as this report is published, will come in modestly down. We maintain the view that a major relapse in economic activity is unlikely, but the strong tailwinds that have propelled China's recovery since Q2 last year have since abated and will lead to softer growth. Meanwhile, the rate of economic and export expansions has given Chinese policymakers confidence to scale back leverage and continue with market reforms. In the second half of the year, investors' sentiment towards Chinese stocks will be tested based on three risks: A rebound in the US dollar index. A tighter liquidity environment and higher interest rates. A weakening in macro indicators beyond market expectations. As the global economic recovery peaks into 2022, pressures to support the domestic economy will become more urgent if policymakers want to maintain an average rate of 5% real GDP growth in 2020 - 2022. The current policy settings are not yet favorable to overweight Chinese risk assets. Major equity indexes remain richly valued and the market could easily correct if domestic rates move higher. However, signs of policy easing may emerge by yearend, which would prompt us to shift our view to overweight Chinese stocks in both absolute and relative terms. The Case For A Dollar Rebound On a tactical basis (next three months), a rebound in the US dollar index may curb investors’ enthusiasm for Chinese stocks. A stronger dollar will give the RMB’s appreciation some breathing room and will be reflationary for China’s economy. However, in the short term a stronger USD will also lead to weaker foreign inflows to China’s equity markets. Chinese stock prices have become more closely and negatively correlated with the dollar index since early 2020 (Chart 1). A weaker dollar is usually accompanied by a global economic upturn and a higher risk appetite from investors, propelling more foreign portfolio flows to emerging markets (which includes Chinese risk assets). Although foreign inflows account for a small portion of the Chinese A-share market cap, global institutional investors’ sentiment has become more influential and has led fluctuations in Chinese onshore stock prices (Chart 2). Chart 1Closer Correlations Between Chinese Stocks And The Dollar Index
Closer Correlations Between Chinese Stocks And The Dollar Index
Closer Correlations Between Chinese Stocks And The Dollar Index
Chart 2Foreign Investors Matter To Chinese Onshore Stock Prices
Foreign Investors Matter To Chinese Onshore Stock Prices
Foreign Investors Matter To Chinese Onshore Stock Prices
Chart 3Rising Market Expectations For The Fed's Rate Liftoff
Rising Market Expectations For The Fed's Rate Liftoff
Rising Market Expectations For The Fed's Rate Liftoff
The US Federal Reserve delivered a slightly more hawkish surprise at its June FOMC meeting with the message that it will move the projected timing of its first fed fund rate liftoff from 2024 to 2023. Since then, market expectations have shifted from growth and inflation to focusing on the next monetary policy tightening phase, with the short end of the US yield curve rising sharply (Chart 3). Given that currency markets trade off the short end of the yield curve, higher US interest rate expectations will at least temporarily lift the US dollar. The timing and pace of the Fed’s tapering of asset purchases and rate hikes will be determined by how rapidly the US economy approaches the US central bank’s definition of “maximum employment.” BCA’s US Bond Investment strategist anticipates that sizeable and positive non-farm payroll surprises will start in late summer/early fall, which will catalyze a move higher in bond yields. As such, we expect additional upside risks in the dollar index in the coming months, which will discourage foreign investors’ appetite for Chinese equities. Bottom Line: A rebound in the dollar index will be a near-term downside risk to Chinese stocks. Risk Of Higher Chinese Interest Rates Another near-term risk to Chinese stock prices is a tightening in domestic liquidity conditions and a rebound in interest rates, particularly in Q3. Chart 4The PBoC Has Managed To Keep Domestic Rates Low While Pulling Back Overall Stimulus
The PBoC Has Managed To Keep Domestic Rates Low While Pulling Back Overall Stimulus
The PBoC Has Managed To Keep Domestic Rates Low While Pulling Back Overall Stimulus
So far this year the PBoC has kept liquidity conditions accommodative to avoid massive debt defaults, while allowing a faster deceleration in the pace of credit expansion and a sharp contraction in shadow banking (Chart 4). In the coming months, however, the trend may reverse. Even though we do not think China’s current inflation and growth dynamics warrant meaningful and sustainable monetary policy tightening, there is still room for rates to normalize to their pre-pandemic levels in the next few months. Our view is based on the following: First, there was a major delay in local government bond issuance in the first five months of the year. The supply of government bonds will pick up meaningfully in Q3 to meet the annual quota for 2021. An increase in government bond issuance will remove some liquidity from the banking system because the majority of these local government bonds are purchased by commercial banks. Adding to the liquidity gap is a large number of one-year, medium-term lending facility (MLF) loans that will be due in 2H21. Secondly, the PBoC may shift its policy tightening from reducing the volume of total credit creation (measured by total social financing) to raising the price of money. Credit growth (on year-over-year basis) in the first five months of 2021 dropped by three percentage points from its peak in Q4 last year, much faster than the 13-month peak-to-trough deceleration during the 2017/18 policy tightening cycle. As the rate of credit creation approaches the government’s target for the year, which we expect around 11%, the pressure to further compress credit expansion has eased into 2H21. China’s policy agenda is still focused on de-risking in the financial and real estate sectors, therefore, we expect policymakers to keep overall monetary conditions restrictive by raising the price of money. Furthermore, we do not rule out the possibility of a hike in mortgage rates. Chart 5Rising Risk For A Bear Flattening In Domestic Yield Curve In Q3
Rising Risk For A Bear Flattening In Domestic Yield Curve In Q3
Rising Risk For A Bear Flattening In Domestic Yield Curve In Q3
Lastly, as the Fed prepares market expectations for its rate liftoff and China’s domestic economy is still relatively solid, the PBoC may seize the opportunity to guide market-based interest rates towards their pre-pandemic levels. Thus, the market will likely price in tighter liquidity conditions while lowering expectations for the economy and inflation. The short end of the yield curve will rise faster than the longer end, resulting in a flattening of the curve (Chart 5). There is a nontrivial risk that the market will react negatively to tighter liquidity conditions and rising bonds yields, particularly when the economy is slowing. We mentioned in previous reports that rising policy rates and bond yields do not necessarily lead to lower stock prices, if rates are rising while credit keeps expanding and corporate profit growth accelerates. However, currently credit impulse has decelerated sharply, and corporate profit growth has most likely peaked in Q2. Therefore, even a small increase in bond yields or market expectations of higher rates will likely trigger risk asset selloffs. Bottom Line: Bond yields will move higher in Q3, risking market selloffs. Chinese Economy Standing On One Leg China’s economic fundamentals also pose downside risks to Chinese stock prices. Macro indicators on a year-over-year comparison will soften further in 2H21 when low base effects wane, although they will weaken from very high levels. This year’s sharp credit growth deceleration will start to drag down domestic demand, with the risk of corporate profits disappointing the market. A positive tailwind from global trade prevented China's old economy from decelerating more in the first half of the year. It is reflected in the nominal imports and manufacturing orders components in the BCA Activity Index (Chart 6). However, while rising commodity prices boosted the value of Chinese imports, the volume of imports has been moving sideways of late (Chart 7). Chart 6Our BCA Activity Index Is Still Rising...
Our BCA Activity Index Is Still Rising...
Our BCA Activity Index Is Still Rising...
Chart 7...But The Volume Of The Import Component Has Rolled Over
...But The Volume Of The Import Component Has Rolled Over
...But The Volume Of The Import Component Has Rolled Over
Chart 8Export Growth Is Moderating From Current Level
Export Growth Is Moderating From Current Level
Export Growth Is Moderating From Current Level
Moreover, China’s export volume is peaking as the reopening in other countries shifts consumer demand from goods to services. Strong export growth would likely decelerate and converge to global industrial production growth in the coming 12 months, even though a regression-based approach suggests that export growth will stay above trend-growth if global economic activity remains robust (Chart 8). All three components of the official Li Keqiang Index, which measures China’s industrial sector activity and incorporates electricity consumption, railway transportation and bank lending, have rolled over (Chart 9). Among the three components in BCA’s Li Keqiang Leading Indicator, only the monetary conditions index improved on the back of lower real rates. Contributions from the money supply and credit expansion components to the overall indicator have been negative (Chart 10). Chart 9The Official Li Keqiang Index Is Weakening...
The Official Li Keqiang Index Is Weakening...
The Official Li Keqiang Index Is Weakening...
Chart 10...So Is Our BCA Li Keqiang Leading Indicator
...So Is Our BCA Li Keqiang Leading Indicator
...So Is Our BCA Li Keqiang Leading Indicator
Chart 11Household Consumption Recovery Remains A Laggard
Household Consumption Recovery Remains A Laggard
Household Consumption Recovery Remains A Laggard
The recovery in household consumption remains well behind the industrial sector in the current cycle (Chart 11). We expect consumption and services to continue recovering very gradually. Apart from China’s long-standing structural issues, such as sliding household income growth and a high propensity to save, the cyclical recovery in consumption is dependent on China’s domestic COVID-19 situation. The country is on track to fully vaccinate 40% of its population by the end of June and 80% by year-end (Chart 12). However, hiccups in the service sector recovery are expected through 2H21, given China’s “zero tolerance” policy on confirmed COVID cases, which could trigger sporadic local lockdowns (Chart 13). Chart 12China Is Racing To Reach “Full Inoculation Rate” By Yearend
China Outlook: A Mid-Year Recap
China Outlook: A Mid-Year Recap
Chart 13Expect Some Hiccups In Service Sector Recovery In 2H21
Expect Some Hiccups In Service Sector Recovery In 2H21
Expect Some Hiccups In Service Sector Recovery In 2H21
Bottom Line: Any moderation in exports in the rest of 2021 may add to the slowdown in China’s economic activity. Don’t Count On Fiscal Support Chart 14Fiscal Spending Has Been Disappointing In 1H21
Fiscal Spending Has Been Disappointing In 1H21
Fiscal Spending Has Been Disappointing In 1H21
During the first five months of the year, fiscal spending has downshifted (Chart 14). The amount of local government special-purpose bonds (SPBs) issued was far less than in the same period of the past two years, and below this year’s approved annual quota. Although we expect fiscal support to increase into 2H21, backloading SPBs would qualify, at best, as a remedial measure rather than a meaningful boost to economic activity. The RMB3 trillion SPBs to be issued in 2H21 represent only about 10% of this year’s total credit expansion. To substantially boost credit impulse and economic activity, the pickup in SPB issuance will need to be accompanied by looser monetary policy and an acceleration in bank loans (Chart 15). We do not expect that liquidity conditions will remain as lax as in 1H21. Additionally, given that the central government’s focus is to rein in the leverage of local governments and their affiliated financial vehicles (LGFV), provincial officers have little incentive to take on more bank loans against a restrictive policy backdrop. Historically, a stronger fiscal impulse linked to hefty increases in local government bond issuance has not necessarily led to meaningful improvements in infrastructure investment, which has been on a structural downshift since 2017 (Chart 16). Following a V-shaped recovery in 2H20, the growth in infrastructure investment will likely continue to slide in 2H21 due to sluggish government spending. Chart 15Bank Loans Still Hold The Key To Stimulus Impulse
Bank Loans Still Hold The Key To Stimulus Impulse
Bank Loans Still Hold The Key To Stimulus Impulse
Chart 16Don't Count On SPBs To Meaningfully Boost Infrastructure Investment
Don't Count On SPBs To Meaningfully Boost Infrastructure Investment
Don't Count On SPBs To Meaningfully Boost Infrastructure Investment
Bottom Line: There are no signs that the overall policy stance is easing to facilitate a higher fiscal multiplier from an upturn in local government bond issuance. As such, fiscal support for infrastructure spending and economic activity will disappoint in 2H21 despite more SPB issuance. Investment Conclusions Monetary conditions may tighten in Q3 although credit growth will decelerate at a slower pace. Pressures to support domestic demand will be more pronounced next year as tailwinds abate from the global recovery and domestic massive stimulus. Our view is that Chinese authorities will likely ease on the policy tightening brake towards the end of this year and perhaps even signal some reflationary measures in early 2022. Therefore, while we maintain an underweight stance on Chinese stocks for the time being, investors should remain alert to any improvements in China's policy direction. In particular, any monetary policy easing by end this year/early 2022 may signal a potential catalyst to upgrade Chinese stocks to overweight in absolute terms. Although both Chinese onshore and investable equities are currently traded at a discount relative to global stocks, they are richly valuated compared with their 2017/18 highs (Chart 17). China's economy is slowing and the corporate sector has substantially increased its leverage in the past decade. We believe that the current discount in Chinese equities relative to global stocks is warranted. Chart 18 presents a forecast for A-share earnings growth in US dollars, based on earnings’ relationship with the official Li Keqiang index. The chart shows that while an earnings contraction is not probable, without more stimulus the growth rate may fall sharply in the next 12 months from its current elevated level. This aspect, combined with only a minor valuation discount relative to global stocks, paints an uninspiring outlook for Chinese onshore stocks. Chart 17Chinese Onshore Stocks Are Traded At A Slight Discount To Global Equities
Chinese Onshore Stocks Are Traded At A Slight Discount To Global Equities
Chinese Onshore Stocks Are Traded At A Slight Discount To Global Equities
Chart 18An Uninspiring Domestic Equity Earnings Outlook
An Uninspiring Domestic Equity Earnings Outlook
An Uninspiring Domestic Equity Earnings Outlook
Our baseline view is that Chinese authorities will be more willing to step up policy supports into 2022. Fiscal impulse will likely turn negative for most major economies next year and global economic recovery will have peaked. In this scenario, both China’s economy and stocks will have the potential to outperform their global peers next year. Jing Sima China Strategist jings@bcaresearch.com Cyclical Investment Stance Equity Sector Recommendations