Gov Sovereigns/Treasurys

Highlights Incoming economic data suggests that China’s economy is in the process of bottoming, but also that the intensity of a recovery is likely to be more muted than it has been during past economic cycles. Recent Chinese equity market performance is consistent with a bottoming in the economy: cyclicals are outperforming defensives, and both the investable and domestic markets have broken above their respective 200-day moving averages versus global stocks. We continue to recommend that investors cyclically overweight Chinese domestic and investable stocks relative to the global benchmark. However, there is more potential upside for investable than domestic stocks, and the gains in both markets may be front loaded in the first half of the year. Feature Tables 1 and 2 on pages 2 and 3 highlight key developments in China’s economy and its financial markets over the past month. On the growth front, several indicators now suggest that China’s economy is in the process of bottoming, but these indicators also imply that the intensity of a recovery in economic activity is likely to be more muted than it has been during past economic cycles. We see this as consistent with the views presented in our December 11 Weekly Report,1 which laid out four key themes for China and its financial markets for 2020. Table 1China Macro Data Summary
China Macro And Market Review
China Macro And Market Review
Table 2China Financial Market Performance Summary
China Macro And Market Review
China Macro And Market Review
Within financial markets, recent developments are also consistent with the view that Chinese economic activity will modestly accelerate and that a Sino-American trade truce will last until the US presidential election in November 2020. Chinese stocks have rallied both in absolute terms and relative to global equities over the past month, and cyclical stocks are clearly outperforming defensives on an equally-weighted basis in both markets. The RMB has also appreciated modestly, with USD-CNY having now durably fallen back below the 7 mark. We continue to recommend that investors cyclically overweight Chinese domestic and investable stocks relative to the global benchmark, with the caveat that we expect more potential upside for investable than domestic stocks and the gains in both markets may be front loaded in the first half of the year. We expect modest further gains in the RMB over the coming few months, as we see the PBoC is unwilling to allow rapid appreciation. In reference to Tables 1 and 2, we provide several detailed observations below concerning developments in China’s macro and financial market data: Chart 1A Bottoming In China's Economic Growth Is Now Likely Underway
A Bottoming In China's Economic Growth Is Now Likely Underway
A Bottoming In China's Economic Growth Is Now Likely Underway
On a smoothed basis, the Bloomberg Li Keqiang index (LKI) rose in November, driven largely by an improvement in electricity output (Chart 1). While our alternative LKI is weaker than Bloomberg’s measure, we see the improvement in the latter as a sign of a bottoming process for growth that is now underway (Bottom panel, Chart 1). Our leading indicator for the Li Keqiang index was essentially flat in November, with the large gap that has persisted between the degree of monetary accommodation and money & credit growth still present. There was a notable improvement in the Bloomberg Monetary Conditions Index (MCI) in November, but this can be attributed to a surge in headline inflation (which depressed real interest rates). This underscores that the ongoing uptrend in our LKI leading indicator is modest, and that an improvement in economic activity this year is thus unlikely to be sharp or intense. With the pace of pledged supplementary lending (PSL) injections and Tier 1 housing price appreciation as exceptions, all of the housing market data series that we track in Table 1 deteriorated in November. On a smoothed basis, residential housing sales rose at a slower pace and the previous surge in housing construction waned, in line with our expectation (Chart 2). House prices have continued to deviate from housing sales; deteriorating affordability and tight housing regulations have contributed to this divergence. Although funding from the PBoC’s PSL program improved in November, even further funding assistance is likely necessary in order to expect a strong uptrend in housing sales given the affordability and regulatory headwinds (Bottom panel, Chart 2). Both China’s Caixin and official manufacturing PMIs continue to signal positive signs for Chinese economic activity. While the Caixin PMI fell slightly in December, it stayed in expansionary territory for the fifth consecutive month. The official PMI also provided positive signs: the overall index remained above 50 for the second month, the production component rose further into expansionary territory, and the new export orders moved above the 50 mark. All told, China’s PMI data now clearly suggests that a bottoming in China’s economic growth is underway. Although the overall PMI data is sending a positive signal, Chart 3 highlights two series that are somewhat less positive. First, while the import component of the official PMI is rising, it is lagging other key sub-components and remains below 50. In addition, the PMI for small enterprises, which led the early phase of the 2016 recovery in the official PMI, has not meaningfully changed over the past few months. For now, these series suggest that a recovery in growth is likely to be muted compared with previous episodes over the past decade. Chart 2More Accommodative Funding Is Needed For Stronger Housing Sales
More Accommodative Funding Is Needed For Stronger Housing Sales
More Accommodative Funding Is Needed For Stronger Housing Sales
Chart 3Weaker PMI Sub-Components Suggest A More Muted Recovery
Weaker PMI Sub-Components Suggest A More Muted Recovery
Weaker PMI Sub-Components Suggest A More Muted Recovery
In USD terms, China’s equity markets (both investable and domestic) have rallied more than 8%-9% in absolute terms over the past month. In relative terms, both investable and A-share markets have also outperformed the global benchmark. It is notable that the relative performance trend of Chinese investable stocks has broken clearly above its 200-day moving average, which is the first time since the trade talks collapsed in May of last year (Chart 4A). The strong rally in China’s stock prices over the past month, particularly in the investable market, largely reflect the likely signing of a trade truce between the US and China. In our view, more accommodative monetary and fiscal support in 2020, as well as an ongoing truce, provide a sound basis to overweight China’s stocks within a global equity portfolio over both a tactical and cyclical horizon. However, we expect that China’s investable market has more upside potential than its domestic peer, given how much further the former fell in 2019. From an equity sector perspective, the most notable development over the past month is that cyclical sectors have outperformed defensives in both the investable and domestic markets and have broken above their respective 200-day moving averages (Chart 4B). Among cyclical sectors, industrials, energy, consumer discretionary, especially materials and telecommunication services, have all contributed to cyclical outperformance over the past month. The outperformance of cyclical sectors is strongly consistent with continued outperformance of Chinese stocks versus the global average, and strengthens our conviction that investors should be overweight Chinese markets within a regional equity portfolio. China’s 3-month repo rate fell meaningfully over the past week, in response to a 50 bps cut in the reserve requirement ratio (RRR). The decline has merely returned the repo rate back to the level that prevailed on average in 2019, but it does underscore the PBoC’s desire to modestly ease liquidity on a net basis. We will be presenting a Special Report on China’s government bond market later this month, but for now, our view remains that easier monetary policy is unlikely to materially impact Chinese government bond yields this year, unless the PBoC decides to target sharply lower interbank repo rates (which is not our expectation). Chart 4AThe Meaningful Rally In China's Equity Markets Sends A Positive Signal
The Meaningful Rally In China's Equity Markets Sends A Positive Signal
The Meaningful Rally In China's Equity Markets Sends A Positive Signal
Chart 4BThe Outperformance Of Cyclicals Over Defensives Is Consistent With An Economic Recovery
The Outperformance Of Cyclicals Over Defensives Is Consistent With An Economic Recovery
The Outperformance Of Cyclicals Over Defensives Is Consistent With An Economic Recovery
China’s onshore corporate bond spread has risen slightly over the past month alongside falling corporate yields. Despite persistent concerns of rising defaults on China’s onshore corporate bonds, the overall default rate remains quite low compared with those in developed economies, and China’s corporate bond market will benefit from even a modest improvement in economic growth this year. As such, we expect a continued uptrend in China’s onshore corporate bond total return index, and would favor onshore corporate over duration-matched Chinese government bonds. Chart 5A Modest Further Downtrend In USD-CNY This Year Is Likely
A Modest Further Downtrend In USD-CNY This Year Is Likely
A Modest Further Downtrend In USD-CNY This Year Is Likely
The RMB has gained more than 1.35% versus the U.S. dollar over the last month, which caused USD-CNY to durably break below 7 (Chart 5). The rise was clearly in response to news that the US and China will agree to a trade truce, and we expect a further modest downtrend in USD-CNY as China’s economy continues to improve. Investors should note that we are likely to close our long USD-CNH trade (currently registering a gain of 1%) following the signing of the Phase One deal on Jan 15, given that we opened the trade as a currency hedge for our overweight towards Chinese stocks (denominated in USD terms). As such, upon the signing of the deal, we would recommend that investors favor Chinese stocks versus the global benchmark in unhedged terms. Qingyun Xu, CFA Senior Analyst qingyunx@bcaresearch.com Jing Sima China Strategist jings@bcaresearch.com Footnotes 1 Please see China Investment Strategy Weekly Report "2020 Key Views: Four Themes For China In The Coming Year," dated December 11, 2019, available at cis.bcaresearch.com Cyclical Investment Stance Equity Sector Recommendations
Highlights Stock markets begin 2020 with fragile short-term fractal structures, which means there is a two in three chance of a tactical reversal. The bond yield impulse is now a strong headwind, which reliably predicts that bond yields are not far from a near-term peak. The oil price tailwind impulse is fading. German and European growth will lose some momentum in the first and/or second quarters of 2020. Tactically underweight equities versus bonds. But on a longer-term horizon, the low level of bond yields justifies and underpins exponentially elevated equity market valuations. Markets Are Fractally Fragile Stock markets begin 2020 with fragile short-term fractal structures. In plain English, this means that usually cautious value investors have become momentum traders, and their buy orders have fuelled a strong short-term trend. But the danger is that when everybody becomes a momentum trader, liquidity evaporates and the market loses its stability. After all, when everybody agrees, who will take the other side of the trade without destabilising the price? When everybody becomes a momentum trader, liquidity evaporates and the market loses its stability. When a fractal structure is fragile the tiniest of straws can break the camel’s back. But the straw is simply the catalyst for a potential market reversal. The straw could be, say, US/Iran geopolitical tensions escalating, or it could be something else, or there might be no straw needed at all. The underlying cause of the potential reversal is the market’s fragile fractal structure and its associated illiquidity and instability (Chart of the Week). Chart of the WeekStock Markets Are Fractally Fragile
Stock Markets Are Fractally Fragile
Stock Markets Are Fractally Fragile
Investment presents no certainties, only probabilities. Successful investing is about identifying and playing those probabilities right. When the market’s fractal structure is at its limit of fragility, the probability that the short-term trend reverses by a third rises to two in three, while the probability that the short-term trend continues uninterrupted drops to one in three. Hence, a fractal warning of a reversal will be right two times out of three, but it will be wrong one time out of three. Still, we can accept being wrong one time out of three if it means we are right the other two times! For further details please revisit our recent Special Report ‘Fractals: The Competitive Advantage In Investing’.1 Translating all of this into current index levels, there is a two in three probability that over the next three months the Euro Stoxx 600 sees 405 before it sees 435. Across the Atlantic, there is a two in three probability that the S&P500 sees 3150 before it sees 3400 (Chart I-2). Nevertheless, a better tactical trade might be to play a short-term reversal in stocks in relative terms versus bonds. Chart I-2Stock Markets Are Fractally Fragile
Stock Markets Are Fractally Fragile
Stock Markets Are Fractally Fragile
The Bond Yield Impulse Is Now A Strong Headwind A commonly held belief is that a decline in bond yields causes economic growth to accelerate. For example, we frequently hear bold claims such as: financial conditions have eased, so economic growth is likely to pick up. Unfortunately, the commonly held belief is wrong. What causes growth to accelerate or decelerate is not the change in financial conditions but rather the change in the change – the impulse. If the decline in the bond yield is the same in two successive periods, growth will not accelerate. For example, a 0.5 percent decline in the bond yield will trigger new borrowing through an increase in credit demand. The new borrowing will add to spending, meaning it will generate growth. But in the following period, all else being equal, a further 0.5 percent decline in the bond yield will generate the same additional new borrowing and thereby exactly the same growth rate. Therefore, what matters for a growth acceleration or deceleration is whether the bond yield change in the second period is greater or less than that in the first period. In other words, what matters is the bond yield impulse. A bond yield impulse at +1 percent constitutes a strong headwind to short-term growth. Now look at the actual numbers. The euro area 10-year bond yield stands at a lowly 0.45 percent and the 6-month change is a seemingly benign +0.2 percent. Nothing to worry about, right? Wrong. The crucial 6-month impulse equals a severe +1 percent, because the +0.2 percent rise in yields followed a sharp -0.8 percent drop in the preceding period (Chart I-3). A similar story holds in the US, where the bond yield 6-month impulse now equals +0.5 percent, the highest level in two years (Chart I-4). Chart I-3The Euro Area Bond Yield Impulse Is Now A Strong Headwind
The Euro Area Bond Yield Impulse Is Now A Strong Headwind
The Euro Area Bond Yield Impulse Is Now A Strong Headwind
Chart I-4The US Bond Yield Impulse Is A Headwind Too
The US Bond Yield Impulse Is A Headwind Too
The US Bond Yield Impulse Is A Headwind Too
A bond yield impulse at +1 percent constitutes a strong headwind to short-term growth. Hence, through the past decade, this impulse level has reliably predicted that bond yields are not far from a near-term peak (Chart I-5). Combined with fractally fragile stock markets, there is a two in three chance that equities underperform bonds by about 4 percent on a three month tactical horizon. Chart I-5When The Bond Yield Impulse Is A Strong Headwind, Bond Yields Are Near A Local Peak
When The Bond Yield Impulse Is A Strong Headwind, Bond Yields Are Near A Local Peak
When The Bond Yield Impulse Is A Strong Headwind, Bond Yields Are Near A Local Peak
Yet on a longer horizon, the low level of bond yields also provides comfort to equity investors by underpinning elevated valuations. At ultra-low yields, bonds become a risky ‘lose-lose’ proposition: prices can no longer rise much, but they can fall a lot. As bonds become riskier, the much higher return required on formerly riskier assets – such as equities – collapses to the feeble return offered on equally-risky bonds (Chart I-6). Meaning that the valuation of equities resets at an exponentially higher level. Chart I-6Ultra-Low Bond Yields Justify Ultra-Low Returns From Equities
When The Bond Yield Impulse Is A Strong Headwind, Bond Yields Are Near A Local Peak
When The Bond Yield Impulse Is A Strong Headwind, Bond Yields Are Near A Local Peak
As long as bond yields stay near current levels, long-term investors should prefer equities over bonds. The Oil Price Tailwind Impulse Is Fading The preceding discussion on the bond yield impulse applies equally to how the oil price can catalyse growth accelerations and decelerations. For the impact on inflation, what matters is the oil price change. But for the impact on growth accelerations and decelerations what matters is the oil price impulse. The German economy is especially sensitive to the oil price impulse. The German economy is especially sensitive to the oil price impulse. This is because its decentralized ‘hub and spoke’ structure requires a lot of criss-crossing of road traffic that relies on imported oil. Hence, when the oil price falls it subtracts from imports and thereby adds to Germany’s net exports, and vice versa (Chart I-7). But just as for the bond yield, what matters for a growth acceleration or deceleration is whether the oil price change in a given 6-month period is greater or less than that in the preceding 6-month period. In other words, the evolution of the oil price 6-month impulse. Chart I-7The Oil Price Explains Swings In Germany's Net Exports
The Oil Price Explains Swings In Germany's Net Exports
The Oil Price Explains Swings In Germany's Net Exports
Oscillations in the oil price 6-month impulse have explained the oscillations in Germany’s 6-month economic growth with an uncanny precision. The first half of 2019 constituted a severe headwind impulse, because a 30 percent increase in the oil price followed a 40 percent decline in the previous period, equating to a severe headwind impulse of 70 percent.2 But as the oil price stabilized in the second half of 2019, this flipped into a tailwind impulse of 30 percent (Chart I-8). Chart I-8The Oil Price Tailwind Impulse Is Fading
The Oil Price Tailwind Impulse Is Fading
The Oil Price Tailwind Impulse Is Fading
Allowing for typical lags of a few months, this severe headwind impulse followed by a tailwind impulse explains why Germany experienced a sharp slowdown in the middle of 2019 followed by a healthy rebound which continued through the fourth quarter (Chart I-9). Chart I-9The Oil Price Impulse Explains Oscillations In German Growth
The Oil Price Impulse Explains Oscillations In German Growth
The Oil Price Impulse Explains Oscillations In German Growth
However, even without any escalation of US/Iran tensions, the oil price 6-month impulse is now fading. Combined with the headwind from the bond yield 6-month impulse it is highly likely that German and European growth will lose some momentum in the first and/or second quarters of 2020. Next week, we will explain what all of this means for sector, country, and regional equity allocation in the first half of 2020. Stay tuned. Fractal Trading System* To repeat the main theme of the week, all of the major stock markets are fractally fragile. Play this by going tactically short stocks versus bonds. Our preferred expression of this is short the S&P500 versus the 10-year T-bond. Set the profit target at 5 percent with a symmetrical stop-loss. Chart I-10EUROSTOXX 600
EUROSTOXX 600
EUROSTOXX 600
In other trades, short GBP/NOK achieved its 2.5 percent profit target at which it was closed. The rolling 1-year win ratio now stands at 62 percent comprising 19.7 wins and 12.0 losses. When the fractal dimension approaches the lower limit after an investment has been in an established trend it is a potential trigger for a liquidity-triggered trend reversal. Therefore, open a countertrend position. The profit target is a one-third reversal of the preceding 13-week move. Apply a symmetrical stop-loss. Close the position at the profit target or stop-loss. Otherwise close the position after 13 weeks. * For more details please see the European Investment Strategy Special Report “Fractals, Liquidity & A Trading Model,” dated December 11, 2014, available at eis.bcaresearch.com. Dhaval Joshi Chief European Investment Strategist dhaval@bcaresearch.com Footnotes 1 Please see the European Investment Strategy Special Report ‘Fractals: The Competitive Advantage In Investing’, October 10, 2019 available at eis.bcaresearch.com. 2 The 6-month steps in the WTI crude oil price were $74.15, $45.21, and $58.24. The first change equated to a 40 percent decrease and the second change equated to a 30 percent increase. So the 6-month impulse was 70 percent. Fractal Trading System
Markets Are Fractally Fragile
Markets Are Fractally Fragile
Markets Are Fractally Fragile
Markets Are Fractally Fragile
Cyclical Recommendations Structural Recommendations
Markets Are Fractally Fragile
Markets Are Fractally Fragile
Markets Are Fractally Fragile
Markets Are Fractally Fragile
Markets Are Fractally Fragile
Markets Are Fractally Fragile
Markets Are Fractally Fragile
Markets Are Fractally Fragile
Trades Closed Trades Asset Performance Currency & Bond Equity Sector Country Equity Indicators Bond Yields Chart II-1Indicators To Watch - Bond Yields
Indicators To Watch - Bond Yields
Indicators To Watch - Bond Yields
Chart II-2Indicators To Watch - Bond Yields
Indicators To Watch - Bond Yields
Indicators To Watch - Bond Yields
Chart II-3Indicators To Watch - Bond Yields
Indicators To Watch - Bond Yields
Indicators To Watch - Bond Yields
Chart II-4Indicators To Watch - Bond Yields
Indicators To Watch - Bond Yields
Indicators To Watch - Bond Yields
Interest Rate Chart II-5Indicators To Watch - Interest Rate Expectations
Indicators To Watch - Interest Rate Expectations
Indicators To Watch - Interest Rate Expectations
Chart II-6Indicators To Watch - Interest Rate Expectations
Indicators To Watch - Interest Rate Expectations
Indicators To Watch - Interest Rate Expectations
Chart II-7Indicators To Watch - Interest Rate Expectations
Indicators To Watch - Interest Rate Expectations
Indicators To Watch - Interest Rate Expectations
Chart II-8Indicators To Watch - Interest Rate Expectations
Indicators To Watch - Interest Rate Expectations
Indicators To Watch - Interest Rate Expectations
Highlights 2020 Model Bond Portfolio Positioning: Translating our 2020 global fixed income Key Views into recommended positioning within our model bond portfolio comes up with the following conclusions: target a moderately aggressive level of overall portfolio risk, with below-benchmark duration exposure alongside meaningful overweight allocations to global corporate credit. Country Allocations: The cyclical improvement in global growth heralded by leading indicators should put upward pressure on overall global bond yields in 2020. With central banks likely to maintain accommodative policy settings to try and boost depressed inflation expectations, government bond allocations should reflect each country’s “beta” to global yield changes. That means favoring lower-beta countries (Japan, Germany, Spain, Australia, the UK) over higher-beta countries (the US, Canada, Italy). Spread Product: Better global growth, combined with stimulative monetary conditions, will provide an ideal backdrop for growth-sensitive spread product like corporate bonds to outperform government debt this year. We are maintaining an overweight stance on US high-yield credit, while increasing overweights to euro area corporates (both investment grade and high-yield). With the US dollar likely to soften as 2020 evolves, emerging market hard currency debt, both sovereign and corporate, is poised to outperform – we are upgrading both to overweight. Feature Welcome to our first report of the New Year. Just before our holiday break last month, we published our 2020 “Key Views” report, outlining the thematic implications of the BCA 2020 Outlook for global bond markets.1 In this follow-up report, we turn those themes into specific investment recommendations for the next twelve months. We will also make any necessary changes to the allocations in the Global Fixed Income Strategy (GFIS) model bond portfolio to reflect our themes. The main takeaway is that 2020 will be a much different year than 2019, when virtually all global fixed income classes delivered solid absolute returns. The unusual combination of rapidly falling government bond yields and stable-to-narrowing spreads on the majority of credit products – especially in developed market corporate debt – will not be repeated in 2020. Absolute returns from fixed income will be far lower than in 2019, forcing bond investors to focus on relative returns across maturities, countries and credit sectors to generate outperformance. With global monetary policy to remain stimulative, alongside improved global growth, market volatility should remain subdued over the next 6-12 months. Being more aggressive on overall levels of portfolio risk, particularly through higher allocations to markets like high-yield corporates and emerging market (EM) credit, is a solid strategy in a world of low risk-free interest rates and tame volatility. Top-Down Bond Market Implications Of Our Key Views As a reminder, the main fixed income investment themes from our 2020 Key Views report were the following: Global growth will rebound in 2020, led by the US and China, putting upward pressure on global bond yields. Central banks will stay dovish until policy reflation has clearly turned into inflation, limiting how high bond yields can climb in 2020 but sowing the seeds for a far more bond-bearish backdrop in 2021. Accommodative monetary policy and faster growth will delay the peak in the aging global credit cycle. Returns on global fixed income will be far lower in 2020 than in 2019, given rich valuation starting points. Country and sector selection will be more important in driving fixed income outperformance. We now present the specific fixed income investment recommendations that derive from those themes, described along the following lines: overall portfolio risk, overall duration exposure, country allocations within government bonds, yield curve allocations within countries, and corporate credit allocations by country and credit rating. Overall Portfolio Risk: MODERATELY AGGRESSIVE Global growth is in the process of bottoming out after the sharp manufacturing-driven slowdown in 2019. The cumulative lagged impact of monetary easing by central banks last year, led by the US Federal Reserve cutting rates and the European Central Bank (ECB) restarting its Asset Purchase Program, is a main reason why growth is set to rebound. Reduced trade uncertainty between the US and China should augment the impact of easier monetary policy through improved business confidence. Our global leading economic indicator (LEI), which has increased for nine consecutive months, is already heralding this improvement in the global economy. Our global LEI diffusion index – which measures the number of countries with a rising LEI and is itself a leading indicator of the LEI – suggests more gains ahead as 2020 progresses. The LEI diffusion index is also a reliable leading indicator of bond market volatility, with the former signaling that the latter will remain quiescent in 2020 (Chart 1). At the same time, cross-asset correlations across fixed income sectors should drift a bit higher alongside a more broad-based upturn in global economic growth and expanding monetary liquidity via central bank asset purchases (Chart 2). This pickup in correlations suggests that there is scope for markets that lagged the 2019 global credit rally, like EM USD-denominated sovereign debt, to make up for that underperformance in 2020. Chart 1Improving Global Growth Will Keep Volatility Subdued
Improving Global Growth Will Keep Volatility Subdued
Improving Global Growth Will Keep Volatility Subdued
Chart 2Cross-Asset Correlations Should Increase In 2020
Cross-Asset Correlations Should Increase In 2020
Cross-Asset Correlations Should Increase In 2020
The combination of better growth, stable volatility – but with only a mild rise in correlations – is a good backdrop to take a somewhat more aggressive investment stance in fixed income portfolios in 2020. The combination of better growth, stable volatility – but with only a mild rise in correlations – is a good backdrop to take a somewhat more aggressive investment stance in fixed income portfolios in 2020. We prefer to take that additional risk by adding to our recommended overweight to global credit, rather than further reducing our below-benchmark overall duration exposure. Overall Portfolio Duration Exposure: BELOW BENCHMARK Chart 3Global Bond Yields Poised To Move Higher
Global Bond Yields Poised To Move Higher
Global Bond Yields Poised To Move Higher
The improvement in global growth that we are anticipating in 2020 would normally be expected to put upward pressure on the real component of global government bond yields (Chart 3, top panel). This would initially manifest itself through asset allocation shifts out of bonds into equities and, later, through expectations of rate hikes and tighter monetary policy. However, with all major developed market central banks now expressing a desire to keep policy as easy as possible to try and boost inflation expectations, the cyclical move higher in real yields is likely to be more muted in 2020. However, given our expectation that the US dollar is likely to see a moderate decline, as global capital flows move into more growth-sensitive markets in EM and Europe, there is scope for global bond yields to rise via higher inflation expectations – especially with global oil prices likely to move a bit higher, as our commodity strategists expect (bottom two panels). We recommend only a moderate below-benchmark overall duration exposure in global fixed income portfolios in 2020, given that real yields will likely stay relatively muted. Investors should maintain core allocations to inflation-linked bonds, however, to benefit from the pickup in inflation expectations that is likely to occur this year. We recommend only a moderate below-benchmark overall duration exposure in global fixed income portfolios in 2020, given that real yields will likely stay relatively muted. Investors should maintain core allocations to inflation-linked bonds, however, to benefit from the pickup in inflation expectations that is likely to occur this year. Government Bond Country Allocation: UNDERWEIGHT HIGHER-BETA MARKETS, OVERWEIGHT LOWER-BETA MARKETS At the country level, we would typically let our expectations of monetary policy changes guide our recommended allocations. Yet in 2020, we see very little potential for any change in monetary policy outside of Australia (where rate cuts can happen early in the year) and Canada (where a rate hike may be possible later in the year). Thus, we think that a more useful framework for making fixed income country allocation decisions in 2020 is to rely on the “yield betas” of each country to changes in the overall level of global bond yields. Chart 4 shows the three-year trailing yield betas for 10-year government bonds of the major developed markets. Changes in the 10-year yields are compared to the yield of the 7-10 year maturity bucket of the Bloomberg Barclays Global Treasury Index (as a proxy for the unobservable “global bond yield”). On that basis, the higher-beta markets are the US, Canada and Italy, while the lower-beta markets are Japan, Germany, France, Spain, Australia and the UK. Thus, we want to maintain underweight positions in the former group and overweight positions in the latter group. At the moment, we already have most of those tilts within our model bond portfolio, with two exceptions: we are currently neutral (benchmark index weight) in the UK and Canada. For the UK, Brexit uncertainty has made it difficult to take a strong view on the direction of Gilt yields - a problem now compounded further with Andrew Bailey set to take over from Mark Carney as the new Governor of the Bank of England. Staying neutral, for now, still seems like the best strategy until all the policy uncertainties are fully resolved. Canadian bond yields are more likely to maintain their “higher-beta” status as global yields rise, as we discussed in a recent report.2 Thus, this week, we move our recommended allocation for Canadian government bonds to underweight from neutral. For Canada, the growth and inflation data continue to print strong enough to keep the Bank of Canada on a relatively more hawkish path than the other developed market central banks. This suggests that Canadian bond yields are more likely to maintain their “higher-beta” status as global yields rise, as we discussed in a recent report.2 Thus, this week, we move our recommended allocation for Canadian government bonds to underweight from neutral. Applying Our Global Golden Rule To Government Bond Allocations In September 2018, we published a Special Report introducing a government bond return forecasting methodology called the “Global Golden Rule.”3 This is an extension of a framework introduced by our sister service, US Bond Strategy, that links US Treasury returns (versus cash) to changes in the fed funds rate not already discounted in the US Overnight Index Swap (OIS) curve. That relationship also holds in other developed market countries, where there is a clear correlation between the level of bond yields and our 12-month discounters, which measure the change in policy rates over the next year priced into OIS curves (Chart 5). Chart 4Favor Lower-Beta Government Bond Markets In 2020
Favor Lower-Beta Government Bond Markets In 2020
Favor Lower-Beta Government Bond Markets In 2020
In Table 1, we show the expected returns generated by the Global Golden Rule (shown hedged into US dollars) for the countries in our model bond portfolio universe, based on monetary policy scenarios that we deem to be most plausible for 2020. Chart 5Monetary Policy Expectations Will Remain Critical For Bond Yields
Monetary Policy Expectations Will Remain Critical For Bond Yields
Monetary Policy Expectations Will Remain Critical For Bond Yields
In Table 2, we show the returns on a duration-adjusted basis (expected total return divided by duration). We then rank the return scenarios for overall country indices, aggregating the returns of the individual yield curve maturity buckets shown in those two tables, in Table 3. Table 1Global Golden Rule Forecasts For 2020
Our Model Bond Portfolio Strategy For 2020: Selectively Aggressive
Our Model Bond Portfolio Strategy For 2020: Selectively Aggressive
The results in Table 1 show that expected returns are still expected to be positive across most countries, although this is largely due to the gains from hedging into higher-yielding US dollars. The duration-adjusted returns shown in Table 2 look most attractive at the front-end of yield curves across all the countries. This is somewhat consistent with our view, discussed in the 2020 Key Views report, that investors should expect some “bear-steepening” of global yield curves over the course of this year as inflation expectations drift higher (Chart 6). Table 2Global Golden Rule Duration-Adjusted Forecasts For 2020
Our Model Bond Portfolio Strategy For 2020: Selectively Aggressive
Our Model Bond Portfolio Strategy For 2020: Selectively Aggressive
Chart 6Expect A Mild Reflationary Bear Steepening Of Global Yield Curves
Expect A Mild Reflationary Bear Steepening Of Global Yield Curves
Expect A Mild Reflationary Bear Steepening Of Global Yield Curves
Table 3Ranking The 2020 Return Scenarios
Our Model Bond Portfolio Strategy For 2020: Selectively Aggressive
Our Model Bond Portfolio Strategy For 2020: Selectively Aggressive
The results in Table 3 show that the best expected returns would come in rate cutting scenarios – an unsurprising outcome given that there is very little change in policy rates currently discounted in OIS curves in all countries in our model bond portfolio universe. We see rates more likely to remain stable across all countries, however, making the “rates flat” scenarios in the middle of Table 3 more likely in 2020. After our downgrade of Canada this week, our recommended country allocations now reflect both yield betas and the results of our Global Golden Rule. Spread Product Allocation: OVERWEIGHT GLOBAL CORPORATES VERSUS GOVERNMENT BONDS, IN THE US, EURO AREA AND EM Chart 7Stay Overweight US High-Yield
Stay Overweight US High-Yield
Stay Overweight US High-Yield
Turning to credit markets, the shift of global central banks to a more accommodative stance – with global growth improving – has opened a window for another year of outperformance versus sovereign bonds in 2020. With market volatility likely to remain low, as discussed earlier, there is a strong case to increase credit allocations relative to government debt as 2020 begins. Turning to credit markets, the shift of global central banks to a more accommodative stance – with global growth improving – has opened a window for another year of outperformance versus sovereign bonds in 2020. We already have a recommended overweight allocation to US high-yield corporate debt within our model bond portfolio. As we discussed in a recent report, the conditions that would lead us to become more cautious on US junk bonds – deteriorating corporate health, restrictive Fed policy and tightening bank lending standards – are currently not in place (Chart 7).4 If US economic growth starts to rebound in the first half of 2020, as we expect, then the case for US junk bond outperformance is even stronger. We are maintaining only a neutral allocation to US investment grade corporates, however, but this is part of a relative value view versus US Agency mortgage backed securities, which look more attractive on a volatility-adjusted basis.5 We are comfortable with our US credit views, but we are making the following changes this week to raise the credit allocation in our model bond portfolio: Upgrade EM USD-denominated sovereign and corporate debt to overweight. The two conditions that typically must be in place before EM hard currency debt can outperform – a softer US dollar and improving global growth – are now both in place. The two conditions that typically must be in place before EM hard currency debt can outperform – a softer US dollar and improving global growth – are now both in place (Chart 8). The momentum in the US dollar has clearly rolled over and even in level terms, the trade-weighted dollar is peaking. Add in the improvement in both our global LEI and the global manufacturing PMI (and the China PMI, most importantly) and the case for upgrading EM hard currency debt for 2020 is a strong one. Increase the size of overweights to euro area investment grade and high-yield corporate debt. We already have a modest overweight stance on euro area corporate bonds in our model bond portfolio, based on our expectations that the ECB will maintain a highly-accommodative stance – which could include buying more corporate debt in its Asset Purchase Program. Yet with an increasing body of evidence highlighting that the sharp downturn in European growth seen in 2019 is bottoming out, the argument for raising euro area corporate bond allocations for this year is compelling. This is especially true for euro area high-yield, where the backdrop looks even more constructive (Chart 9) compared to US junk bonds using the same metrics described above – corporate health (not deteriorating), monetary policy (not restrictive) and lending standards (not tightening). Chart 8Upgrade EM Credit To Overweight
Upgrade EM Credit To Overweight
Upgrade EM Credit To Overweight
Chart 9Increase Overweights To European Credit
Increase Overweights To European Credit
Increase Overweights To European Credit
Summing It All Up: Our Model Bond Portfolio Adjustments To Begin 2019 The outlook described in our 2020 Key Views report, and in this week’s report, lead us to make several adjustments to our model bond portfolio weightings seen in the table on Pages 15 and 16. The results of those changes are the following: Duration: We are maintaining an overall portfolio duration of 6.5 years, which is 0.5 years below that of our custom benchmark portfolio index (Chart 10). Credit Allocation: We are increasing the allocation to EM USD-denominated debt, funded by reducing exposure to US Treasuries. We are also increasing the size of the overweight positions in euro area investment grade and high-yield corporate debt, funded by cutting allocations to German and French government bonds. The net effect of these changes is to increase our total spread product weighting to 57% of the portfolio (Chart 11), which represents an overweight tilt versus the benchmark of +15% (versus a +8% overweight prior to this week’s changes). Chart 10Stay Below-Benchmark On Duration Exposure
Stay Below-Benchmark On Duration Exposure
Stay Below-Benchmark On Duration Exposure
Chart 11A Larger Recommended Allocation To Spread Product For 2020
Our Model Bond Portfolio Strategy For 2020: Selectively Aggressive
Our Model Bond Portfolio Strategy For 2020: Selectively Aggressive
Country Allocation: We are cutting the Canadian government bond allocation to underweight, while making additional modest adjustments to yield curve positioning in the US, Japan, and the UK to reflect the output from our Global Golden Rule. The net result of these changes, combined with the increased allocation to corporate bonds, is to boost the overall portfolio yield to 3%, which represents a positive carry of +43bps versus our benchmark index (Chart 12). Chart 12Greater Portfolio Yield To Begin 2020
Greater Portfolio Yield To Begin 2020
Greater Portfolio Yield To Begin 2020
Chart 13Move To A Moderately Aggressive Level Of Portfolio Risk
Move To A Moderately Aggressive Level Of Portfolio Risk
Move To A Moderately Aggressive Level Of Portfolio Risk
Overall Portfolio Risk: All of the above changes represent an increase in the usage of the “risk budget” of our model bond portfolio, which is now running a tracking error (or excess volatility versus that of the benchmark) of 73bps (Chart 13). This is higher than the 58bps prior to this week’s changes, but is still below the maximum allowable tracking error of 100bps that we have imposed on the model portfolio since its inception. This is consistent with our view that investors should maintain a “moderately aggressive” level of risk in fixed income portfolios in 2020. Robert Robis, CFA Chief Fixed Income Strategist rrobis@bcaresearch.com Footnotes 1 Please see BCA Global Fixed Income Strategy Weekly Report, “2020 Key Views: Delay Of Reckoning”, dated December 12th 2019, available at gfis.bcarsearch.com. 2 Please see BCA Research Global Fixed Income Strategy Weekly Report, “How Sweet It Is”, dated November 6, 2019, available at gfis.bcaresearch.com. 3 Please see BCA Research Global Fixed Income Strategy Special Report, “The Global Golden Rule Of Bond Investing”, dated September 25th 2018, available at gfis.bcaresearch.com. 4 Please see BCA Research Global Fixed Income Strategy Weekly Report, “The Lowdown On Low-Rated High-Yield”, dated November 27, 2019, available at gfis.bcaresearch.com. 5 Please see BCA Research Global Fixed Income Strategy Weekly Report, “Big Mo(mentum) Is Turning Positive”, dated October 29, 2019, available at gfis.bcaresearch.com. Recommendations The GFIS Recommended Portfolio Vs. The Custom Benchmark Index
Our Model Bond Portfolio Strategy For 2020: Selectively Aggressive
Our Model Bond Portfolio Strategy For 2020: Selectively Aggressive
Duration Regional Allocation Spread Product Tactical Trades Yields & Returns Global Bond Yields Historical Returns
Highlights Chart 1Softer PMIs In December
Softer PMIs In December
Softer PMIs In December
A bond bear market looked to be underway in December, with the 10-year Treasury yield reaching as high as 1.93% just before Christmas. But two developments during the past week drove it back down to 1.80%, and could prevent yields from rising during the next month or two. Five macro factors are important for US bond yields (global growth, the output gap, the US dollar, policy uncertainty and sentiment). Two of those factors flipped from sending bond-bearish to bond-bullish signals during the past week. First, policy uncertainty had been ebbing due to the US/China phase 1 trade deal, but it ramped up again due to US military conflict with Iran. Second, our preferred global growth indicators had been showing tentative signs of bottoming, but reversed course in December. The Global Manufacturing PMI fell from 50.3 to 50.1 in December, and the US ISM Manufacturing PMI fell from 48.1 to 47.2 (Chart 1). We continue to forecast higher bond yields in 2020, but recent events have likely postponed any significant sell-off. Stay tuned. Feature Investment Grade: Neutral Chart 2Investment Grade Market Overview
Investment Grade Market Overview
Investment Grade Market Overview
Investment grade corporate bonds outperformed the duration-equivalent Treasury index by 119 basis points in December and by 619 bps in 2019. In our 2020 Key Views report, we argued that the credit cycle will remain supportive for corporate bonds this year, but that we prefer to take credit risk in the high-yield space where valuation is more attractive.1 With inflation expectations still depressed, the Fed can maintain its “easy money” policy for some time yet. This accommodative stance will encourage banks to keep the credit taps running, leading to tight spreads. The third quarter’s tightening of C&I lending standards is a risk to our view (Chart 2), especially if this month’s survey reveals that the tightening continued into Q4. We don’t think that will be the case, given that the yield curve – another indicator of monetary conditions – steepened sharply in the fourth quarter. As stated above, valuation is the main hurdle for investment grade corporates. Spreads for all credit tiers are below our targets (panels 2 & 3).2 As a result, we advise only a neutral allocation to investment grade corporate bonds. We also recommend increasing exposure to Agency MBS in place of corporate bonds rated A or higher. Table 3ACorporate Sector Relative Valuation And Recommended Allocation*
Setbacks
Setbacks
Table 3BCorporate Sector Risk Vs. Reward*
Setbacks
Setbacks
High-Yield Overweight Chart 3High-Yield Market Overview
High-Yield Market Overview
High-Yield Market Overview
High-Yield outperformed the duration-equivalent Treasury index by 202 basis points in December, and by 886 bps in 2019. The index option-adjusted spread tightened 34 bps on the month and currently sits at 335 bps, 102 bps above our target (Chart 3). With attractive valuation, accommodative monetary conditions and a looming recovery in global economic growth, we expect junk spreads to tighten during the next 6-12 months. One notable development from last year is that the Ba and B credit tiers outperformed the Caa credit tier. This is unusual in an environment of positive excess junk returns. We analyzed the divergence between Caa and the rest of the junk index in a recent report and came to two conclusions.3 First, the historical data show that 12-month periods of overall junk bond outperformance are more likely to be followed by underperformance if Caa is the worst performing credit tier. Second, we can identify several reasons for 2019’s Caa spread widening that make us inclined to downplay any negative signal. Specifically, we note that the Caa credit tier’s exposure to the shale oil sector is responsible for the bulk of 2019’s underperformance (bottom panel). The conflict between the US and Iran should boost oil prices during the next few months, benefiting the US shale sector and causing some of this divergence to unwind. MBS: Overweight Chart 4MBS Market Overview
MBS Market Overview
MBS Market Overview
Mortgage-Backed Securities outperformed the duration-equivalent Treasury index by 34 basis points in December, and by 56 basis points in 2019. The conventional 30-year zero-volatility spread tightened 10 bps on the month, driven by an 8 bps tightening of the option-adjusted spread (OAS) and a 2 bps decline in expected prepayment losses (aka option cost). We recommend an overweight allocation to Agency MBS, particularly relative to corporate bonds rated A or higher, for three reasons.4 First, expected compensation is competitive. The conventional 30-year MBS OAS is 45 bps (Chart 4). This is only 7 bps below the spread offered by Aa-rated corporate bonds (panel 4). Also, spreads for all investment grade corporate bond credit tiers are below our targets. Second, risk-adjusted compensation heavily favors MBS. The Excess Return Bond Map in Appendix C shows that Agency MBS plot well to the right of investment grade corporates. This means that the sector is less likely to see losses versus Treasuries on a 12-month horizon. Finally, the macro environment for MBS remains supportive. Mortgage lending standards have barely eased since the financial crisis (bottom panel), and most homeowners have already had at least one opportunity to refinance. This burnout will keep refi activity low, and MBS spreads tight. Government-Related: Underweight Chart 5Government-Related Market Overview
Government-Related Market Overview
Government-Related Market Overview
The Government-Related index outperformed the duration-equivalent Treasury index by 54 basis points in December, and by 252 bps in 2019. Sovereign debt outperformed duration-equivalent Treasuries by 175 bps on the month, and by 697 bps in 2019. Local Authority and Foreign Agency bonds outperformed the Treasury benchmark by 41 bps and 73 bps, respectively, in December, and by 287 bps and 341 bps, respectively, in 2019. Domestic Agency bonds and Supranationals both performed in line with Treasuries in December, but outperformed by 51 bps and 36 bps, respectively, in 2019. We continue to recommend an underweight allocation to USD-denominated sovereign bonds, given that spreads remain expensive compared to US corporate credit (Chart 5). However, we noted in a recent report that Mexican and Saudi Arabian sovereigns look attractive on a risk/reward basis.5 This is also true for Local Authorities and Foreign Agencies, as shown in the Bond Map in Appendix C. Our Emerging Markets Strategy service also thinks that worries about Mexico’s fiscal position are overblown, and that bond yields embed too high of a risk premium (bottom panel).6 Municipal Bonds: Overweight Chart 6Municipal Market Overview
Municipal Market Overview
Municipal Market Overview
Municipal bonds outperformed the duration-equivalent Treasury index by 51 basis points in December, and by 57 bps in 2019 (before adjusting for the tax advantage). The average Aaa-rated Municipal / Treasury (M/T) yield ratio fell 6% in December, and currently sits at 78% (Chart 6). We upgraded municipal bonds in early October, as yield ratios had become significantly more attractive, especially at the long-end of the Aaa curve (panel 2).7 Yield ratios have tightened a lot since then, but value remains at long maturities. Specifically, 2-year, 5-year and 10-year M/T yield ratios are all below average pre-crisis levels at 66%, 68% and 78%, respectively. But 20-year and 30-year yield ratios stand at 87% and 91%, respectively, above average pre-crisis levels. Fundamentally, state and local government balance sheets remain solid. Our Municipal Health Monitor remains in “improving health” territory and state & local government interest coverage has improved considerably in recent quarters (bottom panel). Both of these trends are consistent with muni ratings upgrades continuing to outpace downgrades going forward. Treasury Curve: Maintain A Barbell Curve Positioning Chart 7Treasury Yield Curve Overview
Treasury Yield Curve Overview
Treasury Yield Curve Overview
Long-dated Treasury yields rose in December, while the Fed’s forward guidance kept short-maturity yields low. The result is that the 2/10 slope steepened 17 bps in December and the 5/30 slope steepened 11 bps (Chart 7). Looking back on 2019 we find that, despite August’s curve inversion scare, the 2/10 slope steepened 13 bps on the year and the 5/30 slope steepened 19 bps. In our 2020 Key Views report, we argued that the 2/10 Treasury slope will stay positive in 2020, in a range between 0 bps and 50 bps.8 We also expect further modest steepening during the next few months as the Fed continues to hold down the front-end of the curve in an effort to re-anchor inflation expectations, even as improving global growth pushes long-dated yields higher. Despite our outlook for modest curve steepening, we continue to recommend holding a barbelled Treasury portfolio. Specifically, we favor holding a 2/30 barbell versus the 5-year bullet, in duration-matched terms. This position offers positive carry (bottom panel), due to the extreme overvaluation of the 5-year note. It also looks attractive on our yield curve models (see Appendix B). TIPS: Overweight Chart 8Inflation Compensation
Inflation Compensation
Inflation Compensation
TIPS outperformed the duration-equivalent nominal Treasury index by 112 basis points in December, and by 42 bps in 2019. The 10-year TIPS breakeven inflation rate rose 16 bps on the month and currently sits at 1.78%. The 5-year/5-year forward TIPS breakeven inflation rate rose 14 bps on the month and currently sits at 1.86%. Both rates remain well below the 2.3%-2.5% range consistent with the Fed’s target. The divergence between the actual inflation data and inflation expectations remains stark. Trimmed mean PCE inflation has been fluctuating around the Fed’s target since mid-2018 (Chart 8). However, long-maturity TIPS breakeven inflation rates remain stubbornly low. It takes time for expectations to adapt to a changing macro environment, but even accounting for those long lags, our Adaptive Expectations Model pegs the 10-year TIPS breakeven inflation rate as 16 bps too low (panel 4).9 It is highly likely that the Fed will have to tolerate some overshoot of its 2% inflation target in order to re-anchor long-term inflation expectations. As a result, the actual inflation data will lead expectations higher, causing the TIPS breakeven inflation curve to flatten.10 Any politically-driven increase in oil prices will only exacerbate TIPS breakeven curve flattening. ABS: Underweight Chart 9ABS Market Overview
ABS Market Overview
ABS Market Overview
Asset-Backed Securities underperformed the duration-equivalent Treasury index by 5 basis points in December, but outperformed the benchmark by 69 bps in 2019. The index option-adjusted spread for Aaa-rated ABS widened 6 bps on the month. It currently sits at 37 bps, 3 bps above its minimum pre-crisis level (Chart 9). Our Excess Return Bond Map (see Appendix C) shows that Aaa-rated consumer ABS ranks among the most defensive US spread products, and also offers more expected return than other low-risk sectors such as Domestic Agency bonds and Supranationals. However, we remain wary of allocating too much to consumer ABS because credit trends continue to shift in the wrong direction. The consumer credit delinquency rate remains low, but has put in a clear bottom. This is also true for the household interest expense ratio (panel 3). Senior Loan Officers also continue to tighten lending standards for both credit cards and auto loans. Tighter lending standards usually coincide with rising delinquencies (bottom panel). All in all, our favorable outlook for global growth causes us to shy away from defensive spread products, and deteriorating credit metrics make consumer ABS even less appealing. Stay underweight. Non-Agency CMBS: Neutral Chart 10CMBS Market Overview
CMBS Market Overview
CMBS Market Overview
Non-Agency Commercial Mortgage-Backed Securities outperformed the duration-equivalent Treasury index by 11 basis points in December, and by 233 bps in 2019. The index option-adjusted spread for non-agency Aaa-rated CMBS widened 1 bp on the month. It currently sits at 71 bps, below its average pre-crisis level but somewhat above levels seen during the past two years (Chart 10). The macro outlook for commercial real estate (CRE) is somewhat unfavorable, with lenders tightening loan standards (panel 4) in an environment of tepid demand. The Fed’s Senior Loan Officer Survey shows that banks saw slightly stronger demand for nonfarm nonresidential CRE loans in Q3, after four consecutive quarters of falling demand (bottom panel). Despite the poor fundamental picture, our Excess Return Bond Map shows that CMBS offer a reasonably attractive risk/reward trade-off compared to other bond sectors (see Appendix C). Agency CMBS: Overweight Agency CMBS underperformed the duration-equivalent Treasury index by 16 basis points in December, but outperformed the benchmark by 91 bps in 2019. The index option-adjusted spread widened 4 bps on the month, and currently sits at 57 bps. The Excess Return Bond Map in Appendix C shows that Agency CMBS offer a compelling risk/reward trade-off. An overweight allocation to this high-rated sector remains appropriate. Appendix A: The Golden Rule Of Bond Investing We follow a two-step process to formulate recommendations for bond portfolio duration. First, we determine the change in the federal funds rate that is priced into the yield curve for the next 12 months. Second, we decide – based on our assessments of the economy and Fed policy – whether the change in the fed funds rate will exceed or fall short of what is priced into the curve. Most of the time, a correct answer to this question leads to the appropriate duration call. We call this framework the Golden Rule Of Bond Investing, and we demonstrated its effectiveness in the US Bond Strategy Special Report, “The Golden Rule Of Bond Investing”, dated July 24, 2018, available at usbs.bcaresearch.com. Chart 11 illustrates the Golden Rule’s track record by showing that the Bloomberg Barclays Treasury Master Index tends to outperform cash when rate hikes fall short of 12-month expectations, and vice-versa. Chart 11The Golden Rule's Track Record
The Golden Rule's Track Record
The Golden Rule's Track Record
At present, the market is priced for 22 basis points of cuts during the next 12 months. We anticipate a flat fed funds rate over that time horizon, and therefore anticipate that below-benchmark portfolio duration positions will profit. We can also use our Golden Rule framework to make 12-month total return and excess return forecasts for the Bloomberg Barclays Treasury index under different scenarios for the fed funds rate. Excess returns are relative to the Bloomberg Barclays Cash index. To forecast total returns we first calculate the 12-month fed funds rate surprise in each scenario by comparing the assumed change in the fed funds rate to the current value of our 12-month discounter. This rate hike surprise is then mapped to an expected change in the Treasury index yield using a regression based on the historical relationship between those two variables. Finally, we apply the expected change in index yield to the current characteristics (yield, duration and convexity) of the Treasury index to estimate total returns on a 12-month horizon. The below tables present those results, along with 95% confidence intervals. Excess returns are calculated by subtracting assumed cash returns in each scenario from our total return projections.
Setbacks
Setbacks
Setbacks
Setbacks
Appendix B: Butterfly Strategy Valuations The following tables present the current read-outs from our butterfly spread models. We use these models to identify opportunities to take duration-neutral positions across the Treasury curve. The following two Special Reports explain the models in more detail: US Bond Strategy Special Report, “Bullets, Barbells And Butterflies”, dated July 25, 2017, available at usbs.bcaresearch.com US Bond Strategy Special Report, “More Bullets, Barbells And Butterflies”, dated May 15, 2018, available at usbs.bcaresearch.com Table 4 shows the raw residuals from each model. A positive value indicates that the bullet is cheap relative to the duration-matched barbell. A negative value indicates that the barbell is cheap relative to the bullet. Table 4Butterfly Strategy Valuation: Raw Residuals In Basis Points (As Of January 3, 2020)
Setbacks
Setbacks
Table 5 scales the raw residuals in Table 4 by their historical means and standard deviations. This facilitates comparison between the different butterfly spreads. Table 5Butterfly Strategy Valuation: Standardized Residuals (As Of January 3, 2020)
Setbacks
Setbacks
Table 6 flips the models on their heads. It shows the change in the slope between the two barbell maturities that must be realized during the next six months to make returns between the bullet and barbell equal. For example, a reading of 33 bps in the 5 over 2/10 cell means that we would only expect the 5-year to outperform the 2/10 if the 2/10 slope steepens by more than 33 bps during the next six months. Otherwise, we would expect the 2/10 barbell to outperform the 5-year bullet. Table 6Discounted Slope Change During Next 6 Months (BPs)
Setbacks
Setbacks
Appendix C: Excess Return Bond Map The Excess Return Bond Map is used to assess the relative risk/reward trade-off between different sectors of the US bond market. It is a purely computational exercise and does not impose any macroeconomic view. The Map’s vertical axis shows 12-month expected excess returns. These are proxied by each sector’s option-adjusted spread. Sectors plotting further toward the top of the Map have higher expected returns and vice-versa. Our novel risk measure called the “Risk Of Losing 100 bps” is shown on the Map’s horizontal axis. To calculate it, we first compute the spread widening required on a 12-month horizon for each sector to lose 100 bps or more relative to a duration-matched position in Treasury securities. Then, we divide that amount of spread widening by each sector’s historical spread volatility. The end result is the number of standard deviations of 12-month spread widening required for each sector to lose 100 bps or more versus a position in Treasuries. Lower risk sectors plot further to the right of the Map, and higher risk sectors plot further to the left. Chart 12Excess Return Bond Map (As Of January 3, 2020)
Setbacks
Setbacks
Ryan Swift US Bond Strategist rswift@bcaresearch.com Footnotes 1 Please see US Bond Strategy Special Report, “2020 Key Views: US Fixed Income”, dated December 10, 2019, available at usbs.bcaresearch.com 2 For details on how we arrive at our spread targets please see US Bond Strategy Weekly Report, “The Value In Corporate Bonds”, dated February 19, 2019, available at usbs.bcaresearch.com 3 Please see US Bond Strategy Weekly Report, “Caa-Rated Bonds: Warning Sign Or Buying Opportunity?”, dated November 26, 2019, available at usbs.bcaresearch.com 4 Please see US Bond Strategy Weekly Report, “Two Themes And Two Trades”, dated October 1, 2019, available at usbs.bcaresearch.com 5 Please see US Bond Strategy Weekly Report, “A Perspective On Risk And Reward”, dated October 15, 2019, available at usbs.bcaresearch.com 6 Please see Emerging Markets Strategy Weekly Report, “Country Insights: Malaysia, Mexico & Central Europe”, dated October 31, 2019, available at ems.bcaresearch.com 7 Please see US Bond Strategy Weekly Report, “Two Themes And Two Trades”, dated October 1, 2019, available at usbs.bcaresearch.com 8 Please see US Bond Strategy Special Report, “2020 Key Views: US Fixed Income”, dated December 10, 2019, available at usbs.bcaresearch.com 9 For further details on our Adaptive Expectations Model please see US Bond Strategy Weekly Report, “Adaptive Expectations In The TIPS Market”, dated November 20, 2018, available at usbs.bcaresearch.com 10 Please see US Bond Strategy Special Report, “2020 Key Views: US Fixed Income”, dated December 10, 2019, available at usbs.bcaresearch.com Fixed Income Sector Performance Recommended Portfolio Specification Corporate Sector Relative Valuation And Recommended Allocation
Dear Client, In lieu of our regular report next week, I will be hosting a webcast on Wednesday, December 18th at 10:00 AM EST, where I will discuss the major investment themes and views I see playing out for 2020. This will be the last Global Investment Strategy report of 2019, with publication resuming early next year. On behalf of the entire Global Investment Strategy team, I would like to wish you a Merry Christmas, Happy Holidays, and a Healthy New Year! Best regards, Peter Berezin, Chief Global Strategist Overall Investment Strategy: Global growth should accelerate in 2020. Favor stocks over bonds. A more defensive stance will be appropriate starting in late 2021. Equities: Upgrade non-US equities to overweight at the expense of their US peers. Cyclical stocks, including financials, will outperform defensives. Fixed Income: Central banks will stay dovish, but bond yields will nevertheless rise modestly thanks to stronger global growth. Favor high-yield corporate credit over investment grade and sovereigns. Currencies: The US dollar will weaken in 2020 against EUR, GBP, CAD, AUD, and most EM currencies. The dollar will be flat against the yen and the Swiss franc. Commodities: Oil and industrial metals prices will move higher. Gold prices will be range-bound next year, but should rally in 2021 once inflation finally breaks out. GIS View Matrix
Strategy Outlook – 2020 Key Views: Full Speed Ahead
Strategy Outlook – 2020 Key Views: Full Speed Ahead
I. Global Macro Outlook Stronger Global Growth Ahead We turned bullish on global equities last December after temporarily moving to the sidelines in the summer of 2018. Last month, we increased our procyclical bias by upgrading non-US stocks within our recommended equity allocation at the expense of their US peers. The decision to upgrade non-US equities stems from our expectation that global growth will strengthen in 2020. Global financial conditions have eased sharply this year, largely due to the dovish pivot by many central banks. Monetary policy affects the economy with a lag. This is one reason why the net number of central banks cutting rates has historically led global growth by about 6-to-9 months (Chart 1). Chart 1The Effects Of Easing Monetary Policy Should Soon Trickle Down To The Economy
The Effects Of Easing Monetary Policy Should Soon Trickle Down To The Economy
The Effects Of Easing Monetary Policy Should Soon Trickle Down To The Economy
In addition, there is mounting evidence that the global manufacturing cycle is bottoming out (Chart 2). The “official” Chinese PMI produced by the National Bureau of Statistics rose above 50 in November for the first time since May. The private sector Caixin manufacturing PMI has been improving for five consecutive months. The euro area manufacturing PMI increased over the prior month, led by gains in Germany and France. Chart 2A Fairly Regular Three-Year Manufacturing Cycle
A Fairly Regular Three-Year Manufacturing Cycle
A Fairly Regular Three-Year Manufacturing Cycle
Chart 3The Auto Sector Is Showing Signs Of Life (I)
The Auto Sector Is Showing Signs Of Life (I)
The Auto Sector Is Showing Signs Of Life (I)
The PMI data for the US has been mixed. The ISM manufacturing index weakened in November. In contrast, the Markit PMI rose to a seven-month high. Despite its shorter history, we tend to give the Markit PMI more credence. It is based on a larger sample of companies and has sector weights that closely match the actual composition of US output. As such, the Markit PMI is better correlated with hard data on manufacturing production, employment, and factory orders. The auto sector has been particularly hard hit during this manufacturing downturn. Fortunately, the industry is showing signs of life. The Markit euro area auto sector PMI has rebounded, with the new orders-to-inventory ratio moving back into positive territory for the first time since the autumn of 2018. US banks stopped tightening lending standards for auto loans in the third quarter. They are also reporting stronger demand for vehicle financing (Chart 3). In China, vehicle production and sales are improving on a rate-of-change basis (Chart 4). Both automobile ownership and vehicle sales in China are still a fraction of what they are in most other economies, suggesting further upside for sales (Chart 5). Chart 4The Auto Sector Is Showing Signs Of Life (II)
The Auto Sector Is Showing Signs Of Life (II)
The Auto Sector Is Showing Signs Of Life (II)
Chart 5China: Structural Outlook For Autos Is Bright
China: Structural Outlook For Autos Is Bright
China: Structural Outlook For Autos Is Bright
Trade War Uncertainty The trade war remains the biggest risk to our sanguine view on global growth. As we go to press, rumors are swirling that the US and China have reached a “Phase One” trade deal that would cancel the scheduled December 15th tariff hike and roll back as much as half of the existing tariffs. If this were to occur, it would be consistent with our expectation of a trade truce. Nevertheless, it is impossible to be certain about how things will unfold from here. The best we can do is think through the incentives that both sides face and assume they will act in their own self-interest. For President Trump, the key priority is to get re-elected next year. Trump generally gets poor grades from voters on most issues. The one exception is the economy. Rightly or wrongly, the majority of voters approve of his handling of the economy (Chart 6). An escalation of the trade war would hurt the US economy, especially in a number of Midwestern states that Trump needs to win to remain president (Chart 7). Chart 6Trump Gets Reasonably High Marks On His Handling Of The Economy, But Not Much Else
Strategy Outlook – 2020 Key Views: Full Speed Ahead
Strategy Outlook – 2020 Key Views: Full Speed Ahead
Chart 7Economic Health Of The US Midwest Matters For Trump
Economic Health Of The US Midwest Matters For Trump
Economic Health Of The US Midwest Matters For Trump
A resurgence in the trade war would also hurt Trump’s credibility. The point of the tariffs was not simply to raise revenue; it was to get China to the negotiating table. As a self-described master negotiator, President Trump now has to produce a “great” deal for the American people. If he had finalized an agreement with China a year or two ago, he would currently be on the hook for showing that it resulted in a smaller trade deficit. But with the presidential election only a year away, he can semi-credibly claim that the trade balance will only improve after he is re-elected. For their part, the Chinese would rather grapple with Trump now than face him after the election when he will no longer be constrained by re-election pressures. China would also like to avoid facing someone like Elizabeth Warren or Bernie Sanders, who may insist on including stringent environmental and human rights provisions in any trade deal. At least with Trump, the Chinese know that they are getting someone who is focused on commercial issues. Contrary to most media reports, there is a fair amount of overlap between what Trump wants and what the Chinese themselves would like to achieve. For example, as China has moved up the technological ladder, many Chinese companies have begun to complain about intellectual theft by their domestic rivals. Thus, strengthening intellectual property protection has become a priority for Chinese officials. Along the same vein, China aspires to transform the RMB into a reserve currency. A country cannot have a reserve currency unless it also has an open capital account. Hence, financial market liberalization must be part of China’s long-term reform strategy. These mutual interests between the US and China could provide the basis for a trade truce. The Changing Nature Of Chinese Stimulus Chart 8China: Credit Growth Is Only A Few Percentage Points Above Nominal GDP Growth
China: Credit Growth Is Only A Few Percentage Points Above Nominal GDP Growth
China: Credit Growth Is Only A Few Percentage Points Above Nominal GDP Growth
If a détente in the trade war is reached, will this prompt China to go back to its deleveraging campaign? We do not think so. For one thing, there can be no assurance that a trade truce will last. Thus, China will want to maintain enough stimulus as an insurance policy. In addition, credit growth is currently running only a few percentage points above nominal GDP growth (Chart 8). With the ratio of credit-to-GDP barely rising, there is little need to bring credit growth down much from current levels. This does not mean that the Chinese authorities will allow credit growth to increase significantly further. Instead, the authorities will continue shifting the composition of credit growth from the riskier shadow banking sector to the safer formal banking sector, while increasingly leaning on fiscal policy to buttress growth. One of the developments that has gone largely unnoticed by investors this year is that China’s general government deficit has climbed from around 3% of GDP in mid-2018 to 6.5% of GDP at present (Chart 9). Some of this stimulus has been used to finance tax cuts for households. Some of it has also been used to finance infrastructure spending, which requires imports of raw materials and capital goods. As a result of this fiscal easing, the combined Chinese credit/fiscal impulse has risen to a two-year high. It leads global growth by about nine months (Chart 10). Chart 9China Has Been Stimulating, Fiscally
China Has Been Stimulating, Fiscally
China Has Been Stimulating, Fiscally
Chart 10Chinese Stimulus Should Boost Global Growth
Chinese Stimulus Should Boost Global Growth
Chinese Stimulus Should Boost Global Growth
Europe On The Upswing Chart 11Euro Area Growth: The Good, The Bad, And The Ugly
Euro Area Growth: The Good, The Bad, And The Ugly
Euro Area Growth: The Good, The Bad, And The Ugly
Chart 12German Economy: Some Green Shoots
German Economy: Some Green Shoots
German Economy: Some Green Shoots
The weakness in euro area growth this year has been concentrated in Germany and Italy. France and Spain have actually grown at a trend-like pace (Chart 11). Germany should benefit from stronger global growth and a recovery in automobile production next year. The recent rebound in the German PMI, as well as improvements in the expectations components of the IFO, ZEW, and Sentix surveys are all encouraging in this regard (Chart 12). Italy should also gain from an easing in financial conditions and receding political risks (Chart 13). The Italian 10-year government bond yield has fallen from a high of 3.69% in October 2018 to 1.23% at present. Chart 13Easing Financial Conditions And Less Political Uncertainty Will Help Italy
Easing Financial Conditions And Less Political Uncertainty Will Help Italy
Easing Financial Conditions And Less Political Uncertainty Will Help Italy
Chart 14Euro Area Fiscal Thrust
Euro Area Fiscal Thrust
Euro Area Fiscal Thrust
Fiscal policy across the euro area is also turning more stimulative. The fiscal thrust in the euro area rose to 0.4% of GDP this year mainly due to a somewhat larger budget deficit in France (Chart 14). The thrust should remain positive in 2020. Even in Germany, fiscal policy should loosen. Faster wage growth in Germany is eroding competitiveness relative to the rest of the euro area (Chart 15). That could force German policymakers to ratchet up fiscal stimulus in order to support demand. Already, the Social Democrats are responding to poor electoral performance by adopting a more proactive fiscal policy, hoping to stop the loss of votes to the big spending Greens. Chart 15Germany: Faster Wage Growth Eroding Competitiveness Relative To The Rest Of The Euro Area
Germany: Faster Wage Growth Eroding Competitiveness Relative To The Rest Of The Euro Area
Germany: Faster Wage Growth Eroding Competitiveness Relative To The Rest Of The Euro Area
Chart 16Boris Johnson Won't Pursue A No-Deal Brexit
Boris Johnson Won't Pursue A No-Deal Brexit
Boris Johnson Won't Pursue A No-Deal Brexit
The UK economy should start to recover next year as Brexit uncertainty fades and fiscal policy turns more stimulative. Exit polls suggest that the Conservatives will command a majority government following today's election. There is not enough appetite within the Conservative party for a no-deal Brexit (Chart 16). As such, today's victory will allow Prime Minister Boris Johnson to push his proposed deal through Parliament. It will also allow him to fulfill his pledge to pass a budget that boosts spending. Japan: Own Goal Japan has been hard hit by the global growth slowdown, given its close ties to its Asian neighbors, namely China. Add on a completely unnecessary consumption tax hike, and it is no wonder the economy has been faltering. Despite widespread weakness, there have been some very preliminary signs of improvement of late: The manufacturing PMI ticked up in November, while the services PMI rose back above 50. Consumer confidence also moved up to the highest level since June. Furthermore, Prime Minister Abe announced a multi-year fiscal package worth approximately 26 trillion yen. The headline number grossly overstates the size of the stimulus because it includes previously announced measures as well as items such as land acquisition costs that will not directly benefit GDP. Nevertheless, the package should still boost growth by about 0.5% next year, offsetting part of the drag from higher consumption taxes. US: Chugging Along Despite the slowdown in global growth, a stronger dollar, and the trade war, US real final demand is on track to grow by 2.5% this year (Chart 17). This is above the pace of potential GDP growth of 1.7%-to-2%. Chart 17Underlying US Growth Remains Above Trend
Strategy Outlook – 2020 Key Views: Full Speed Ahead
Strategy Outlook – 2020 Key Views: Full Speed Ahead
The Fed’s 75 basis points of rate cuts has moved monetary policy even further into accommodative territory. Not surprisingly, residential housing – the most interest rate-sensitive part of the economy – has responded favorably (Chart 18). While the tailwind from lower mortgage rates will dissipate by next summer, we do not anticipate much weakness in the housing market. This is because the inventory levels and vacancy rates remain near record-low levels (Chart 19). The shortage of homes should buttress both construction and prices. Chart 18US Housing: On Solid Ground (I)
US Housing: On Solid Ground (I)
US Housing: On Solid Ground (I)
Chart 19US Housing: On Solid Ground (II)
US Housing: On Solid Ground (II)
US Housing: On Solid Ground (II)
Strong labor and housing markets will support consumer spending, which represents nearly 70% of the economy. Business capital spending should also benefit from lower rates, receding trade tensions, and rising wages which are making firms increasingly eager to automate. II. Financial Markets Global Asset Allocation We argued in the section above that global growth should rebound next year thanks to easier financial conditions, an upturn in the global manufacturing cycle, a detente in the trade war, and modest Chinese stimulus. Chart 20 shows that stocks usually outperform bonds when global growth is accelerating. This occurs partly because corporate earnings tend to rise when growth picks up. BCA’s US equity strategy team expects S&P 500 EPS to increase by 5% next year if global growth merely stabilizes. An acceleration in global growth would surely lead to even stronger earnings growth. On the flipside, investors also tend to price out rate cuts (or price in rate hikes) when growth is on the upswing, resulting in lower bond prices (Chart 21). Chart 20Stocks Usually Outperform Bonds When Global Growth Is Accelerating
Stocks Usually Outperform Bonds When Global Growth Is Accelerating
Stocks Usually Outperform Bonds When Global Growth Is Accelerating
Chart 21Improving Global Growth Boosts Earnings Growth...And Expectations Of Rate Hikes
Improving Global Growth Boosts Earnings Growth...And Expectations Of Rate Hikes
Improving Global Growth Boosts Earnings Growth...And Expectations Of Rate Hikes
Relative valuations also favor stocks over bonds. Despite the stock market rally this year, the MSCI All-Country World Index currently trades at a reasonable 15.8-times forward earnings. This is below the forward PE ratio of 16.7 reached in January 2018 and even below the forward PE ratio of 16.4 hit in May 2015. Analysts expect global EPS to increase by 10% next year, below the historic 12-month expectation of 15% (Chart 22). In contrast to most years when analyst forecasts prove to be wildly overoptimistic, the current EPS forecast is likely to be met. Chart 22Analyst Expectations Are Not Wildly Optimistic
Analyst Expectations Are Not Wildly Optimistic
Analyst Expectations Are Not Wildly Optimistic
Chart 23Equity Risk Premium Remains Quite Elevated
Equity Risk Premium Remains Quite Elevated
Equity Risk Premium Remains Quite Elevated
If one inverts the PE ratio, one can calculate an earnings yield for global equities of 6.3%. One can then calculate the implied equity risk premium (ERP) by subtracting the real long-term bond yield from the earnings yield. As Chart 23 illustrates, the ERP remains quite elevated by historic standards. Some observers might protest that the ERP is elevated mainly because bond yields are so low. If low bond yields are discounting very poor economic growth prospects, perhaps today’s PE ratio should be lower than it actually is? The problem with this argument is that growth prospects are not so bad. The IMF estimates that global growth will be slightly above its post-1980 average over the next five years (Chart 24). While trend growth is falling in both developed and emerging economies, the rising share of faster-growing emerging markets in global GDP is helping to prop up overall growth. Chart 24The Trend In Global Growth Has Remained Steady Thanks To Faster-Growing EM
The Trend In Global Growth Has Remained Steady Thanks To Faster-Growing EM
The Trend In Global Growth Has Remained Steady Thanks To Faster-Growing EM
Sector And Regional Equity Allocation US stocks have outperformed their overseas peers by 10% year-to-date and by 137% since 2008. About half of the outperformance of US equities since the Great Recession was due to faster sales-per-share growth, a third was due to stronger margin growth, and the rest was due to relative PE expansion (Chart 25). Chart 25Faster Sales Growth, Rising Margins, And Relative PE Expansion Helped Drive US Outperformance Over The Past Decade
Strategy Outlook – 2020 Key Views: Full Speed Ahead
Strategy Outlook – 2020 Key Views: Full Speed Ahead
It is worth noting that the outperformance of US stocks is a fairly recent phenomenon. Between 1970 and 2008, European equity prices and EPS actually rose slightly faster than in the US (Chart 26). EM stocks also outperformed the US in the decade leading up to the Global Financial Crisis. Chart 26US Earnings Have Not Always Outpaced Their Peers
US Earnings Have Not Always Outpaced Their Peers
US Earnings Have Not Always Outpaced Their Peers
We expect US stocks to rise in 2020 by about 5%-to-10%, but to lag their foreign peers in common-currency terms. There are four reasons for this: Sector skews favor non-US equities. Cyclical stocks tend to outperform defensives when global growth is strengthening and the US dollar is weakening (Chart 27). Cyclical sectors are overrepresented outside the US. We would include financials in our definition of cyclicals. Faster global growth next year will lift long-term bond yields. Since central banks are unlikely to raise rates, yield curves will steepen. Steeper yield curves will boost net interest margins, thus helping bank shares (Chart 28). European banks are more dependent on the spread between lending and borrowing rates than US banks, since the latter derive more of their profits from fees. Non-US stocks are quite a bit cheaper than their US peers. The forward PE for US equities currently stands at 18.1, well above the forward PE of 13.6 for non-US equities. Other valuation measures reveal an even bigger premium on US stocks (Chart 29). Differences in sector weights account for about a quarter of the valuation gap between the US and the rest of the world. The rest of the gap is due to cheaper valuations within sectors. Financials, for example, are notably less expensive in the rest of the world, particularly in Europe (Chart 30). The valuation gap between the US and the rest of the world is even starker if we compare earnings yields with bond yields. Since bond yields are lower outside the US, the implied equity risk premium is significantly higher for non-US stocks. Profit margins have less scope to rise in the US than in the rest of the world. According to MSCI data, net operating margins currently stand at 10.3% in the US compared to 7.9% abroad. Unlike in the US, margins in Europe and EM are still well below their pre-recession peaks (Chart 31). While US margins are unlikely to fall next year thanks to stronger global growth, rising wage growth will negatively impact profits in some labor-intensive industries. Labor slack is generally greater abroad, which should limit cost pressures. Uncertainty over the US election is likely to limit the gains to US equities. All of the Democratic frontrunners have pledged to roll back the 2017 Tax Cuts and Jobs Act to one degree or another. A full repeal of the Act would reduce S&P 500 EPS by about 10%. While such a dramatic move is far from guaranteed – for starters, it would require that the Democrats gain control of both the White House and the Senate – it does pose a risk to investors. The same goes for increased regulatory actions, which Senators Sanders and Warren have both vocally championed. Chart 27Cyclicals Do Well Versus Defensives When Global Growth Is Strengthening And The US Dollar Is Weakening
Cyclicals Do Well Versus Defensives When Global Growth Is Strengthening And The US Dollar Is Weakening
Cyclicals Do Well Versus Defensives When Global Growth Is Strengthening And The US Dollar Is Weakening
Chart 28Steeper Yield Curves Help Financials
Steeper Yield Curves Help Financials
Steeper Yield Curves Help Financials
Chart 29US Equities Are More Expensive Than Stocks Abroad
US Equities Are More Expensive Than Stocks Abroad
US Equities Are More Expensive Than Stocks Abroad
Chart 30European Financials Trade At A Substantial Discount To Their US Peers
European Financials Trade At A Substantial Discount To Their US Peers
European Financials Trade At A Substantial Discount To Their US Peers
Chart 31Profit Margins Have Less Scope To Rise In The US Than In The Rest Of The World
Profit Margins Have Less Scope To Rise In The US Than In The Rest Of The World
Profit Margins Have Less Scope To Rise In The US Than In The Rest Of The World
Within the non-US universe, euro area stocks have the most upside potential. In contrast, we see less scope for Japanese stocks to outperform the global benchmark because of uncertainties over the impact of the consumption tax hike on domestic demand. In addition, a weaker trade-weighted yen next year will annul the currency translation gains that unhedged equity investors can expect to receive from other non-US stock markets. Lastly, the passage of a new investment law that requires investors wishing to “influence management” to receive prior government approval could cast a pall over recent efforts to improve corporate governance in Japan. Fixed Income Chart 32Inflation Excluding Shelter Has Been Muted
Inflation Excluding Shelter Has Been Muted
Inflation Excluding Shelter Has Been Muted
Chart 33Long-Term Bond Yields Will Move Higher As Faster Growth Pushes Up Estimates Of The Neutral Rate
Long-Term Bond Yields Will Move Higher As Faster Growth Pushes Up Estimates Of The Neutral Rate
Long-Term Bond Yields Will Move Higher As Faster Growth Pushes Up Estimates Of The Neutral Rate
Central banks will remain on the sidelines next year. Inflation is still running well below target in most economies. Even in the US, where slack has largely been absorbed and wage growth has risen, core inflation excluding housing has averaged only 1.2% over the past five years (Chart 32). Nevertheless, long-term bond yields will still move higher next year as investors revise up their estimate of the neutral rate in response to faster growth (Chart 33). On a regional basis, BCA’s fixed-income experts favor low-beta bond markets (Chart 34). Japanese bonds have a very low beta to the overall Barclays Global Treasury index because inflation expectations are quite depressed and the Bank of Japan will actively intervene to prevent yields from rising. On a USD currency-hedged basis, the Japanese 10-year yield stands at a relatively decent 2.38%, above the yield of 1.79% on comparable maturity US Treasurys (Table 1). Chart 34Favor Lower-Beta Government Bond Markets In 2020
Favor Lower-Beta Government Bond Markets In 2020
Favor Lower-Beta Government Bond Markets In 2020
Table 1Bond Markets Across The Developed World
Strategy Outlook – 2020 Key Views: Full Speed Ahead
Strategy Outlook – 2020 Key Views: Full Speed Ahead
In contrast to Japan, the beta of US Treasurys to the overall global bond index is relatively high, implying that Treasurys will underperform other sovereign bond markets in a rising yield environment. The beta for Germany, UK, Australia, and Canada lie somewhere between Japan and the US. Consistent with our bullish view on global equities, we expect corporate bonds to outperform sovereign debt in 2020 (Chart 35). Despite the weakness in manufacturing, US banks further eased terms on commercial and industrial loans in Q3, according to the Fed’s Senior Loan Officer Survey. Chart 35Stronger Growth Causes Corporate Spreads To Tighten
Stronger Growth Causes Corporate Spreads To Tighten
Stronger Growth Causes Corporate Spreads To Tighten
At the US economy-wide level, neither interest coverage nor debt-to-asset ratios are particularly stretched (Chart 36). Admittedly, the picture looks less flattering if we focus solely on high-yield issuers (Chart 37). That said, a wave of defaults is very unlikely to occur in 2020, so long as the Fed is on hold and economic growth is on the upswing. Chart 36Corporate Debt: A Benign Top-Down View
Corporate Debt: A Benign Top-Down View
Corporate Debt: A Benign Top-Down View
Chart 37Corporate Debt: More Concerning Picture Among High-Yield Issuers
Corporate Debt: More Concerning Picture Among High-Yield Issuers
Corporate Debt: More Concerning Picture Among High-Yield Issuers
Chart 38US Corporates: Focus On High-Yield Credit
HY Spread Targets US Corporates: Focus On High-Yield Credit
HY Spread Targets US Corporates: Focus On High-Yield Credit
Moreover, despite narrowing this year, high-yield spreads still remain above our fixed-income team’s estimate of fair value (Chart 38). They recommend moving down the credit curve and increasing the weight in Caa-rated bonds. These have underperformed this year largely because of technical factors such as their large exposure to the energy sector and relatively short duration. As oil prices rise next year, energy sector issuers will feel some relief. Moreover, unlike this year, rising long-term government bond yields in 2020 should also make shorter-duration credit more attractive. In contrast to high-yield spreads, investment-grade spreads have gotten quite tight. Investors seeking high-quality bond exposure should shift towards Agency MBS, which still carry an attractive spread relative to Aa- and A-rated corporate bonds. European IG bonds should also outperform their US peers thanks to faster growth in Europe next year and ongoing support from the ECB’s asset purchase program. Looking beyond the next 12-to-18 months, there is a strong chance that inflation will increase materially from current levels. The unemployment rate across the G7 has fallen to a multi-decade low, while the share of developed economies reaching full employment has hit a new cycle high (Chart 39). Chart 39ADeveloped Markets: Unemployment Rates Keep Trending Lower... And Full Employment Reaching New Cycle Highs
Developed Markets: Unemployment Rates Keep Trending Lower... And Full Employment Reaching New Cycle Highs
Developed Markets: Unemployment Rates Keep Trending Lower... And Full Employment Reaching New Cycle Highs
Chart 39BDeveloped Markets: Unemployment Rates Keep Trending Lower... And Full Employment Reaching New Cycle Highs
Developed Markets: Unemployment Rates Keep Trending Lower... And Full Employment Reaching New Cycle Highs
Developed Markets: Unemployment Rates Keep Trending Lower... And Full Employment Reaching New Cycle Highs
Chart 40The Phillips Curve Is Alive And Well
The Phillips Curve Is Alive And Well
The Phillips Curve Is Alive And Well
For all the talk about how the Phillips curve is dead, wage growth remains well correlated with labor market slack (Chart 40). Rising wages will boost real disposable incomes, leading to more spending. If economies cannot increase supply to meet higher demand, prices will rise. It simply does not make sense to argue that the price of apples will increase if the demand for apples exceeds the supply of apples, but that overall prices will not increase if the demand for all goods and services exceeds the supply of all goods and services. It will take at least until mid-2021 for inflation to rise above the Fed’s comfort zone. It will take even longer for rates to reach restrictive territory, and longer still for tighter monetary policy to make its way through the economy. However, at some point in 2022, the interest-rate sensitive sectors of the US economy will buckle, setting off a global economic downturn and a deep bear market in equities and credit. Enjoy it while it lasts. Currencies And Commodities The US dollar is a countercyclical currency, meaning that it usually moves in the opposite direction of the global business cycle (Chart 41). This countercyclicality stems from the fact that the US, with its large service sector and relatively small manufacturing base, is a “low beta economy.” Strong global growth does help the US, but it benefits the rest of the world even more. Thus, capital tends to flow out of the US when global growth strengthens, which puts downward pressure on the dollar. As global growth picks up in 2020, the dollar will weaken. EUR/USD should increase to around 1.15 by end-2020. GBP/USD will rise to 1.40. USD/CNY will move to 6.8. The Australian and Canadian dollars, along with most EM currencies, will strengthen as well. However, the Japanese yen and Swiss franc are likely to be flat-to-down against the dollar, reflecting the defensive nature of both currencies. Today's rally in the pound has raised the return on our short EUR/GBP trade to 10.5%. For now, we would stick with this position. Chart 42 shows that the pound should be trading near 1.30 against the euro based on real interest rate differentials, which is still well above the current level of 1.20. Chart 41The Dollar Is A Countercyclical Currency
The Dollar Is A Countercyclical Currency
The Dollar Is A Countercyclical Currency
Chart 42Interest Rate Differentials Suggest More Upside For The Pound
Interest Rate Differentials Suggest More Upside For The Pound
Interest Rate Differentials Suggest More Upside For The Pound
The trade-weighted dollar will continue to depreciate until late-2021, and then begin to strengthen again as the Fed turns more hawkish and global growth starts to falter. Commodity prices tend to closely track the global growth/dollar cycle (Chart 43). Industrial metal prices will fare well next year. Oil prices will also move up. Globally, the last of the big projects sanctioned prior to the oil-price collapse in late 2014 are coming online in Norway, Brazil, Guyana, and the US Gulf. Our commodity strategists expect incremental oil supply growth to slow in 2020, just as demand reaccelerates. Gold is likely to be range-bound for most of next year reflecting the crosswinds from a weaker dollar on the one hand (bullish for bullion), and receding trade war risks and rising bond yields on the other hand. Gold will have its day in the sun starting in 2021 when inflation finally breaks out. Our key market charts are shown on the following page. Peter Berezin Chief Global Strategist peterb@bcaresearch.com Chart 43Dollar Weakness Is A Boon For Commodities
Dollar Weakness Is A Boon For Commodities
Dollar Weakness Is A Boon For Commodities
Key Financial Market Forecasts
Strategy Outlook – 2020 Key Views: Full Speed Ahead
Strategy Outlook – 2020 Key Views: Full Speed Ahead
MacroQuant Model And Current Subjective Scores
Strategy Outlook – 2020 Key Views: Full Speed Ahead
Strategy Outlook – 2020 Key Views: Full Speed Ahead
Strategic Recommendations Closed Trades
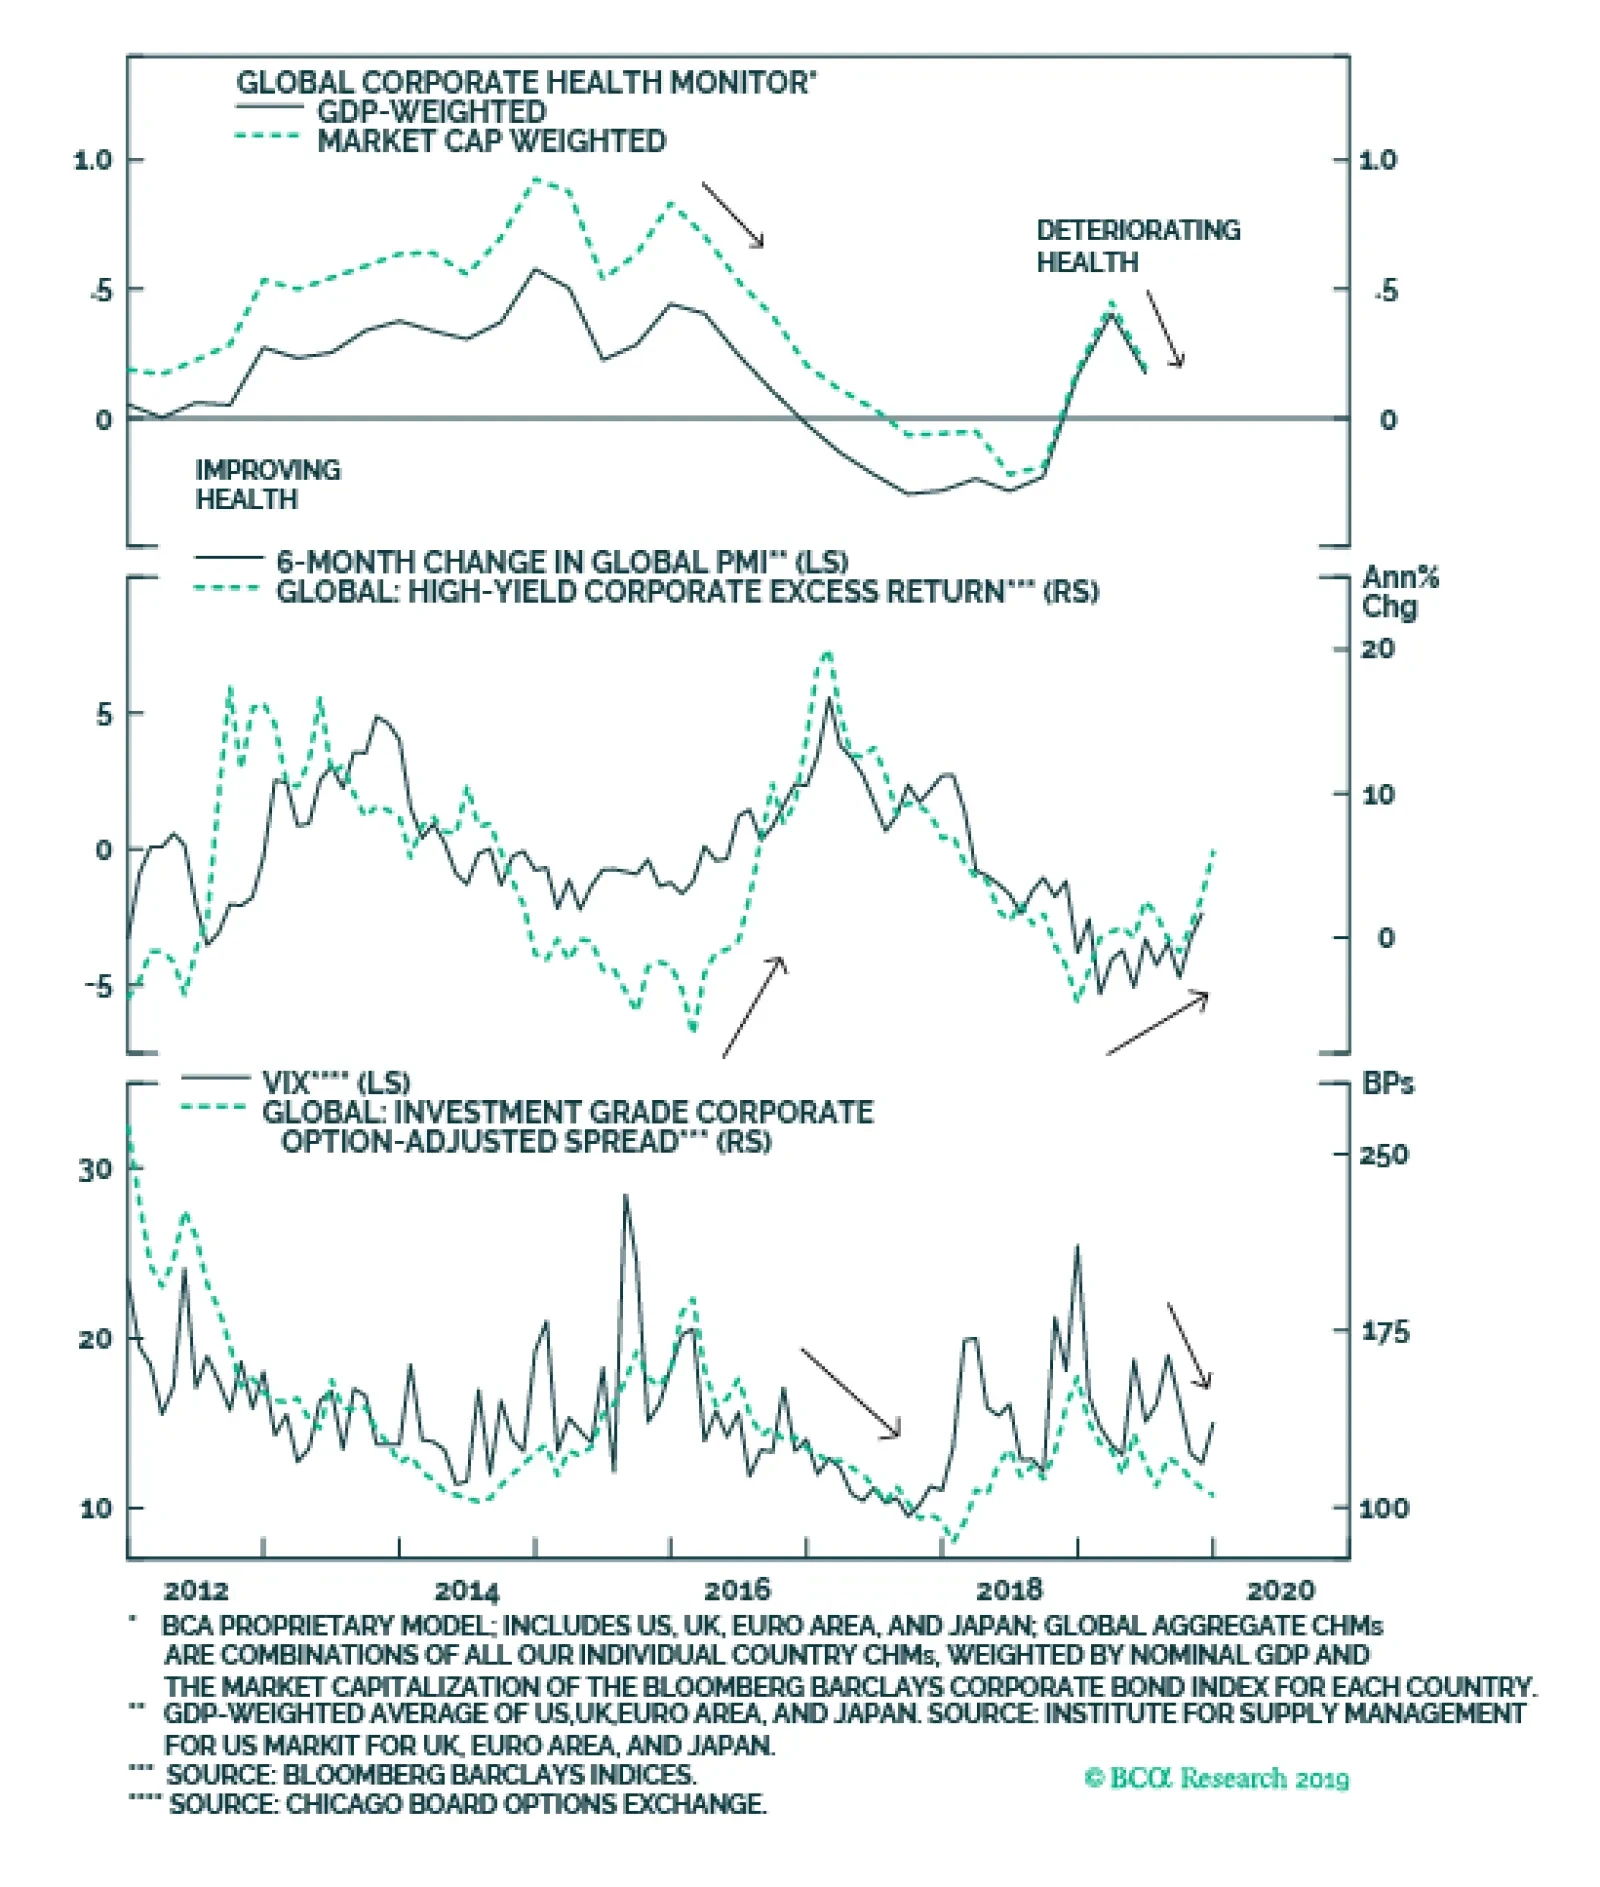
The combination of faster global growth and accommodative monetary policies laid out in the BCA Outlook 2020 report will delay the peak of the global credit cycle. This means investors should expect another year of corporate bond outperformance versus…
Highlights Global growth will rebound in 2020, led by the US and China, putting upward pressure on global bond yields. Maintain below-benchmark overall duration exposure. Central banks will stay dovish until policy reflation has clearly turned into inflation, limiting how high bond yields can climb in 2020 but sowing the seeds for a far more bond-bearish backdrop in 2021. Expect mild bear-steepening pressure on global yield curves, led by rising inflation expectations. Accommodative monetary policy and faster growth will delay the peak in the aging global credit cycle. Stay overweight global corporate debt versus sovereign bonds. Returns on global fixed income will be far lower in 2020 than in 2019, given rich valuation starting points. Country and sector selection will be more important in driving fixed income outperformance. For sovereign bonds, favor countries where yields are less sensitive to change in overall global yields; for credit, favor sectors with lower interest rate durations and lower spread volatility. Feature BCA Research’s Outlook 2020 report, outlining the main investment themes for next year from the collective mind of our strategists, was sent to all clients in late November.1 In this report, we discuss the broad implications of those themes for the direction of global fixed income markets in 2020. In a follow-up report to be published in the first week of the new year, we will translate those themes into specific recommended allocations and weightings within our model bond portfolio framework. A Summary Of The 2020 Outlook Chart 1Expect A Cyclical Rise In Global Yields In 2020
Expect A Cyclical Rise In Global Yields In 2020
Expect A Cyclical Rise In Global Yields In 2020
The main conclusions from the Outlook 2020 report were cyclically bullish looking out over the next twelve months, but more cautious beyond that. The downturn in global growth seen in 2019 is projected to end in response to several headwinds that have become tailwinds: a small wave of Chinese stimulus and reflation; more stimulative global monetary policies; the substantial easing of global financial conditions as risk assets have rallied worldwide; a fading drag on global manufacturing from inventory destocking; both China (weak growth) and the US (the 2020 US election) have good reasons to de-escalate the trade war in 2020. This backdrop should push global bond yields moderately higher in 2020, while maintaining a backdrop that is once again favorable for risk assets on a relative basis versus government debt (Chart 1). A critical element to this story is the supportive monetary policy backdrop. Central banks worldwide, led by interest rate cuts from the US Federal Reserve and a resumption of asset purchases from the European Central Bank (ECB), are now running more stimulative policies in response to this year’s global manufacturing slump and elevated level of political uncertainty. Policymakers will maintain accommodative monetary policy through 2020 to try and bring depressed inflation expectations back up to central bank targets. This will create a “sweet spot” for global risk assets, with improving economic growth and accommodative monetary policy. A repeat of the spectacular total return numbers seen across the majority of asset classes in 2019 is unlikely, but global equity and credit markets should solidly outperform government bonds. Yet all that monetary stimulus does not come without a price. Policymakers will maintain accommodative monetary policy through 2020 to try and bring depressed inflation expectations back up to central bank targets. This will create a “sweet spot” for global risk assets, with improving economic growth and accommodative monetary policy. A revival of inflationary pressures in 2021 will force central banks to raise rates much more aggressively. Combined with a China that remains wary of promoting excess leverage, this will drive the current prolonged global business cycle expansion to its recessionary endgame, taking equity and credit markets down with it. This will eventually trigger a new decline in global bond yields as policymakers shift back to easing mode, but from much higher levels than today. Our Four Main Key Views For Global Fixed Income Markets In 2020 The following are the main implications for global fixed income investment strategy based off the conclusions from the 2020 BCA Outlook: Key View #1: Maintain below-benchmark overall duration exposure. The pickup in global growth that we expect in 2020 has its roots in two locations: China and the US. For China, policymakers are keenly aware that the current growth slowdown cannot continue, as it has already pushed nominal GDP growth below 8% (Chart 2). For an economy as highly leveraged as China, slowing nominal growth is lethal and must be avoided to prevent a surge in private sector defaults and rising unemployment. Already, China has delivered significant policy stimulus in 2019: the reserve requirement ratio has been cut by 400bps; taxes have been cut by 2.8% of GDP; capital spending at state-owned enterprises has increased; the currency has depreciated; and, more recently, monetary policy has been eased via traditional interest rate cuts. These measures have eased our index of Chinese monetary conditions and triggered a surge in the China credit impulse, which leads Chinese import growth (i.e. China’s most direct impact on the global economy) by nine months. There are signs that Chinese growth is already bottoming out, as evidenced by the recent pickup in the China manufacturing PMI. Expect more signs of improvement in the first half of 2020. The BCA global leading economic indicator (LEI) has been rising since January of this year, and the global LEI diffusion index is signaling that the upturn will continue in 2020 (Chart 3). With global financial conditions at highly stimulative levels thanks to the robust performance of risk assets in 2019, the backdrop is already conducive to faster global growth. BCA’s geopolitical strategists are of the view that a “détente” in the US-China trade war is still the most likely base case scenario, which would go a long way in reducing the growth-inhibiting effects of elevated uncertainty (bottom panel). Chart 2A Boost To Global Growth From China In 2020
A Boost To Global Growth From China In 2020
A Boost To Global Growth From China In 2020
Chart 3Lower Uncertainty + Easy Financial Conditions = Faster Growth
Lower Uncertainty + Easy Financial Conditions = Faster Growth
Lower Uncertainty + Easy Financial Conditions = Faster Growth
As for the US, the lagged impact of the Fed’s 75bps of rate cuts this year has boosted domestic liquidity conditions in a pro-growth fashion. The BCA US Financial Liquidity Indicator, which leads not only US growth but also leads the BCA global LEI and commodity prices by 18 months, is already signaling that US economic momentum is set to bottom out in early 2020 (Chart 4). This signal is in addition to the leading properties of US financial conditions (middle panel), which suggests a reacceleration of real GDP growth back above trend is about to unfold. Chinese policy reflation has typically been a good leading indicator for US capex and is heralding a rebound in investment spending (bottom panel). The pickup in global growth would also help revive the dormant euro zone economy, which has been hit hard though plunging export demand and overall weakness in the manufacturing sector. The entire slump in euro area real GDP growth since the start of 2018 can be attributed to plunging net exports, while domestic demand has held steady (Chart 5). The increase in the China credit impulse and our global LEI diffusion index – both leading indicators of euro area export growth – are signaling that euro area export demand is already in the process of bottoming out (bottom two panels) and should gain momentum in the first half of 2020. Chart 4US Growth Is Poised To Accelerate
US Growth Is Poised To Accelerate
US Growth Is Poised To Accelerate
Chart 5The Drag On European Growth From Trade Will Soon End
The Drag On European Growth From Trade Will Soon End
The Drag On European Growth From Trade Will Soon End
This better growth backdrop will put moderate upward pressure on global bond yields in 2020. This better growth backdrop will put moderate upward pressure on global bond yields in 2020. Key View #2: Expect mild bear-steepening pressure on global yield curves, led by rising inflation expectations. While we expect bond yields to drift higher in the next 6-12 months, the upside will be capped with central banks likely to stay dovish until policy reflation has clearly turned into higher inflation. Interest rate markets will not begin to price in expectations of tighter monetary policy without evidence of actual inflation picking up. The Fed, ECB, Bank of Japan and other central banks have all stated publicly that they will maintain current accommodative policy settings until realized inflation has sustainably returned to target levels, typically around 2%. This would be a major change in the modus operandi of these policymakers, who have typically signaled rate hikes based simply on forecasts of higher inflation. The implication is that interest rate markets will not begin to price in expectations of tighter monetary policy without evidence of actual inflation picking up (Chart 6). Chart 6Central Banks Will Stay Dovish Until Inflation Sustainably Accelerates
Central Banks Will Stay Dovish Until Inflation Sustainably Accelerates
Central Banks Will Stay Dovish Until Inflation Sustainably Accelerates
A critical ingredient for global inflation to begin moving higher again is a softer US dollar (USD). The year-over-year growth rate of the trade-weighted USD is correlated to global export price inflation and commodity price inflation, more generally (Chart 7). The typical drivers of the USD are all pointing in a more bearish direction: Chart 7The USD Is Critical For Global Reflation
The USD Is Critical For Global Reflation
The USD Is Critical For Global Reflation
Chart 8Global Real Yields & Inflation Expectations Will Drift Higher In 2020
Global Real Yields & Inflation Expectations Will Drift Higher In 2020
Global Real Yields & Inflation Expectations Will Drift Higher In 2020
the Fed has cut interest rates multiple times since the summer and is expanding its balance sheet via repo operations and treasury bill purchases; global (non-US) growth is bottoming out, and capital tends to flow out of the USD into more cyclical currencies in Europe and EM when global growth is accelerating; elevated policy uncertainty, which tends to attract inflows into the safety of the USD, is starting to diminish. The combination of improving global growth and a softer USD would normally be enough to generate a significant increase in global bond yields. Yet we do not expect the sort of move higher in the real component of bond yields signaled by our global LEI diffusion index in 2020 (Chart 8, top panel). While real yields should move higher alongside faster growth, if there is no expected tightening of monetary policy as well, the move in real yields will be more limited. The grind higher in global bond yields that we expect in 2020 will come first through faster inflation expectations and, much later in the year, higher real bond yields when central bankers (starting with the Fed) begin to signal a need to turn more hawkish. The grind higher in global bond yields that we expect in 2020 will come first through faster inflation expectations and, much later in the year, higher real bond yields when central bankers (starting with the Fed) begin to signal a need to turn more hawkish. This suggests that inflation-linked bonds should perform reasonably well in countries where inflation is likely to accelerate the fastest, like the US. Faster inflation expectations will also result in some bear-steepening of global government bond yield curves in the first half of 2020 (Chart 9). There is very little curve steepening discounted in bond forward rates in the developed markets – a consequence of the general flatness of yield curves – which suggests that yield curve steepening trades could prove to be profitable in 2020. Chart 9Expect A Mild Bear-Steepening Of Global Yield Curves
Expect A Mild Bear-Steepening Of Global Yield Curves
Expect A Mild Bear-Steepening Of Global Yield Curves
Chart 10The Fed Has Dis-Inverted The Treasury Curve
The Fed Has Dis-Inverted The Treasury Curve
The Fed Has Dis-Inverted The Treasury Curve
In the case of the US, the Fed’s recent easing actions have pushed short-term interest rates below longer-term Treasury yields, removing the yield curve inversion that sparked recession fears among investors during the summer of 2019 (Chart 10). With the Fed likely to sit on its hands for most of next year, even as US growth and inflation are likely to improve, this will put additional bear-steepening pressure on the US Treasury curve. In Europe, bond markets have already discounted a very significant impact from the ECB restarting its Asset Purchase Program, which only began last month. Investment grade corporate bond spreads, as well as Italy-Germany government bond spreads, have narrowed substantially despite a weak euro area economy (Chart 11, bottom panel). Meanwhile, the term premium on 10-year German bunds is back to the deeply negative levels middle panel) seen when the ECB was expanding its balance sheet at a 30-40% pace, rather than the 5% pace implied by the current announced pace of purchases of 20 billion euros per month (top panel). This potentially leaves longer-term European yields exposed to the same bear-steepening pressures seen in other bond markets, even within the context of a renewed ECB bond-buying program. Chart 11European Bonds Already Discount A Very Dovish ECB
European Bonds Already Discount A Very Dovish ECB
European Bonds Already Discount A Very Dovish ECB
Chart 12The Wild Card For Bonds Markets In 2020: Fiscal Policy
The Wild Card For Bonds Markets In 2020: Fiscal Policy
The Wild Card For Bonds Markets In 2020: Fiscal Policy
A potentially big wild card for global bond markets next year will be fiscal policy, which can also exacerbate yield curve steepening pressures. Any sign of a push toward more government spending, particularly in Europe where there has been such reluctance to open the fiscal taps, would result in a sharper upward move in global bond yields than we are expecting. This is not because of a supply effect related to more government bond issuance that would require higher yields to attract buyers. It is because fiscal stimulus (Chart 12) would push growth to an even faster pace that would bring forward the date when inflation returns to policymaker targets and tighter monetary policy could commence. This would follow a similar path to the curve steepening dynamics described earlier, with a fiscal boost to growth pushing up longer-term inflation expectations before starting to push up short-term interest rate expectations. Key View #3: Stay overweight global corporate debt versus sovereign bonds. Investors should expect another year of corporate bond outperformance versus sovereign debt in the developed economies. The combination of faster global growth, somewhat higher inflation and accommodative monetary policies laid out in the BCA Outlook 2020 report will delay the peak in the aging global credit cycle. This means investors should expect another year of corporate bond outperformance versus sovereign debt in the developed economies. Low borrowing rates are already helping to extend the credit cycle by making it easier for highly indebted borrowers to service their debts. This can be seen in the US, where interest coverage ratios (using top-down data for the non-financial corporate sector) remain above the levels that have preceded previous recessions (Chart 13). Low borrowing rates are also helping indebted borrowers in Europe, particularly in Italy and Spain where the banking system is now far less exposed to non-performing loans than during the peak years of the 2011-12 European Debt Crisis (Chart 14). Chart 13Low Rates Helping Extend The US Credit Cycle
Low Rates Helping Extend The US Credit Cycle
Low Rates Helping Extend The US Credit Cycle
Chart 14Low Rates Helping Ease Stress In European Banks Declining Non-Performing Loans Are A Positive For The European Periphery
Low Rates Helping Ease Stress In European Banks Declining Non-Performing Loans Are A Positive For The European Periphery
Low Rates Helping Ease Stress In European Banks Declining Non-Performing Loans Are A Positive For The European Periphery
Chart 15A Cyclically Positive Backdrop For Global Corporates
A Cyclically Positive Backdrop For Global Corporates
A Cyclically Positive Backdrop For Global Corporates
According to our checklist of indicators to watch for an end of the corporate credit cycle in the US – tight monetary policy, deteriorating corporate sector financial health, and tightening bank lending standards – only corporate financial health is flashing a warning signal according to our Corporate Health Monitor as we discussed in a recent report.2 In fact, our global Corporate Health Monitor is rolling over – a trend that should continue as growth improves in 2020 – which should support global corporate bond outperformance versus government debt next year (Chart 15). Key View #4: Returns on global fixed income will be far lower in 2020 than in 2019. Country and sector selection will be more important in driving fixed income outperformance in 2020. The start of 2020 looks far different in terms of fixed income valuations compared to the beginning of 2019. For example, the 10yr US Treasury yield started the year at 2.72% and is now 1.83%, while the 10yr German bund yield started this year at 0.24% and is now MINUS-0.31%. These lower yields reflect the slower pace of global economic growth and monetary policy easing delivered by the Fed and ECB. Yet at the same time, corporate credit spreads have narrowed in both the US (the high-yield index OAS is down from 526bps to 360bps) and the euro area (the investment grade index OAS is down from 152bps to 100bps). These massive rallies in global bond markets this year resulted in both lower government bond yields and tighter credit spreads - even with slower global growth that would normally be a trigger for wider spreads/higher risk premiums. Looking at the current valuation of government bond yields in the major developed markets from a long-run perspective, it is difficult to make the case that it is attractive. Medium-term real bond yields remain well below potential GDP growth rates, a consequence of central banks keeping policy rates well below neutral levels suggested by measures like the Taylor Rule (Chart 16). Chart 16Global Government Bonds Are Expensive
2020 Key Views: Delay Of Reckoning
2020 Key Views: Delay Of Reckoning
Without the initial starting point of cheap valuations, fixed income return expectations for 2020 should be tempered. This means that rather than loading up on maximum duration risk and/or credit risk to capture big yield and spread moves, bond investors should be more selective in country, maturity and credit exposure to generate outperformance in 2020. Chart 17Favor Lower-Beta Government Bond Markets In 2020
Favor Lower-Beta Government Bond Markets In 2020
Favor Lower-Beta Government Bond Markets In 2020
For government bonds, that means focusing country exposures on lower-beta markets where yields are less correlated to moves in the overall level of global bond yields. Our preferred way to measure this is to look at the beta of monthly yield changes for the benchmark 10-year government yields of the major developed market countries to the overall Bloomberg Barclays Global Treasury index yield for the 7-10 year maturity bucket, over a rolling three-year window. We define a “high-beta” bond market as having a yield beta of 1.25 or higher, and a “low-beta” bond market as having a yield beta of 0.75 or lower. Under that definition, global bond investors should underweight higher-beta Canada, the US and Italy, and overweight low-beta Japan and Spain (Chart 17). Bond markets with betas between 1.25 and 0.75 (Germany, Australia, Sweden, the UK) can also be considered on their own fundamental merits. Of that list, we see Germany and Australia having a better chance of outperforming the UK and Sweden, given the greater odds that the Bank of England or Riksbank could signal a need to hike rates in 2020 compared to the ECB or Reserve Bank of Australia. Chart 18Stay Overweight Global Spread Product In 2020, But Be Selective
2020 Key Views: Delay Of Reckoning
2020 Key Views: Delay Of Reckoning
For spread product, that means focusing exposure on sectors that are less risky, either defined by interest rate duration or spread volatility (i.e. spread duration). With credit spreads remaining near the low end of long-run historical ranges for nearly all major markets (Chart 18), it is hard to find examples of spread product being cheap in absolute terms. On a risk-adjusted basis, however, negatively-convex spread product like US and euro area high-yield debt and US agency MBS actually look more interesting in the rising yield environment we expect in 2020, since the interest rate durations of those fixed income sectors fell as bond yields declined in 2019. Thus, we recommend owning high-yield corporates over higher-duration investment grade corporates in the US and euro area, while also favoring US agency MBS over higher-quality credit tiers of US investment grade corporate credit. Robert Robis, CFA Chief Fixed Income Strategist rrobis@bcaresearch.com Footnotes 1 Please see The Bank Credit Analyst, “Outlook 2020: Heading Into The End Game”, dated November 22, 2019, available at bca.bcaresearch.com. 2 Please see BCA Research Global Fixed Income Strategy Weekly Report, “The Lowdown On Low-Rated High-Yield”, dated November 27, 2019, available at gfis.bcaresearch.com. Recommendations The GFIS Recommended Portfolio Vs. The Custom Benchmark Index
2020 Key Views: Delay Of Reckoning
2020 Key Views: Delay Of Reckoning
Duration Regional Allocation Spread Product Tactical Trades Yields & Returns Global Bond Yields Historical Returns
Highlights Below-Benchmark Duration In 2020 H1. Improving global growth and the de-escalation of US/China trade tensions will put upward pressure on bond yields in the first half of 2020, making below-benchmark portfolio duration appropriate. US political risks could re-assert themselves as we head into 2020 H2, leading to a risk-off environment that causes bond yields to fall. We will likely recommend increasing portfolio duration in mid-2020 if the political situation plays out as we expect, or if the 5-year/5-year forward Treasury yield and 12-month Fed Funds Discounter reach our targets. Barbell Your Treasury Portfolio. The 2/10 Treasury slope will steepen modestly in the coming months, but will remain in a range between 0 bps and 50 bps in 2020. Any steepening will be concentrated in the real yield curve. The TIPS breakeven inflation curve is likely to flatten. Our valuation models suggest that a barbelled Treasury portfolio is the best way to position for this environment. Specifically, we recommend shorting the 5-year bullet and buying a duration-matched barbell consisting of the 2-year note and 30-year bond. Overweight Spread Product. Low inflation expectations will keep the Fed on hold in 2020. This accommodative monetary environment will keep defaults low and credit spreads tight. Spread product will outperform Treasuries in duration-matched terms. Favor High-Yield Versus Investment Grade. Appropriate valuation measures show that high-yield corporate spreads are very attractive in the current environment, while investment grade corporate spreads are tight compared to our fair value estimates. Overweight Mortgage-Backed Securities. Agency MBS look attractive compared to investment grade corporate bonds, especially in risk-adjusted terms. The risk of a refinancing surge in 2020 is minimal and mortgage lending standards are more likely to ease than tighten. MBS spreads have room to tighten in 2020. Overweight TIPS Versus Nominal Treasuries. TIPS breakeven inflation rates are well below our target range of 2.3%-2.5%. It will take some time, and likely an overshoot of the Fed’s 2% inflation target, for them to reach that range as expectations adapt only slowly to rising core inflation. But even if they don’t make it back to target, breakevens should still grind higher as the economy recovers in 2020. Feature BCA published its 2020 Outlook on November 22. That report lays out the main macroeconomic themes that our strategists see driving markets next year. This Special Report explains how investors can profit from those themes in US fixed income markets. Specifically, we offer six key US fixed income views for 2020. This report is limited to the six key investment views listed on page 1, and only discusses Fed policy in the context of how it influences those views. Next week we will publish a more comprehensive “Fed In 2020” report that will delve into our outlook for the Fed next year. Outlook Summary First, a brief summary of the main economic views presented in BCA’s 2020 outlook:1 The global manufacturing downturn that persisted throughout 2019 is quickly coming to an end. The following factors will cause global growth to rebound in early 2020: China eased economic policy significantly in 2019. Policymakers cut the reserve requirement ratio by 400 basis points, cut taxes by 2.8% of GDP, increased issuance of local government bonds to finance public infrastructure projects, and boosted capex at state-owned enterprises. The Fed cut rates by 75 bps, and other central banks also eased monetary policy in 2019. The global inventory purge that magnified the industrial sector’s pain in 2019 is exhausted. Both the US and China have incentives to de-escalate the trade war in the first half of 2020. Investors should remain invested in risk assets to take advantage of this favorable global macro environment. But 2020 is likely to be the last year of risk asset outperformance. Today’s accommodative monetary policy will revive inflationary pressures in 2021, and central banks will then be forced to lift rates much more aggressively. China will also continue to resist excess leverage. Neither the business cycle nor the equity bull market will withstand those final assaults in 2021. Key View #1: Below-Benchmark Duration In 2020 H1 Improving global growth and the de-escalation of US/China trade tensions will put upward pressure on bond yields in the first half of 2020, making below-benchmark portfolio duration appropriate. US political risks could re-assert themselves as we head into 2020 H2, leading to a risk-off environment that causes bond yields to fall. We will likely recommend increasing portfolio duration in mid-2020 if the political situation plays out as we expect, or if the 5-year/5-year forward Treasury yield and 12-month Fed Funds Discounter reach our targets. In prior research we identified the five macroeconomic factors that determine trends in US bond yields.2 They are: (i) global growth, (ii) the output gap, (iii) the US dollar, (iv) policy uncertainty and (v) sentiment. On global growth, the three measures that correlate most strongly with the 10-year Treasury yield are the Global Manufacturing PMI, the US ISM Manufacturing PMI and the CRB Raw Industrials index. As mentioned above, we expect all three of these indicators to move higher in the first half of 2020, but so far we have seen only tentative signs of a rebound. The Global PMI is back above 50 after bottoming at 49.3 in July, but the US ISM remains in contractionary territory and the CRB Raw Industrials index is in a downtrend (Chart 1). All three of these indicators will have to increase for our call to play out. The global manufacturing downturn that persisted throughout 2019 is quickly coming to an end. The same amount of economic growth is more inflationary when the output gap is small than when it is wide. For this reason, we also need some sense of the output gap to make a call on Treasury yields. We have found wage growth to be a useful indicator of the output gap, as evidenced by its strong correlation with the fed funds rate (Chart 2). As long as recession is avoided, strong wage growth will make it difficult for the Fed to aggressively cut rates. The upshot is that Treasury yields will not re-visit their mid-2016 lows until the next recession hits and wage pressures wane. For now, all leading wage growth indicators continue to point up (Chart 2, bottom 2 panels). Chart 1Factor 1: Global Growth
Factor 1: Global Growth
Factor 1: Global Growth
Chart 2Factor 2: The Output Gap
Factor 2: The Output Gap
Factor 2: The Output Gap
The US dollar is the third important macro factor we consider. A strengthening dollar signals that US yields are de-coupling too far from yields in the rest of the world, making them more likely to fall back down. Conversely, an uptrend in US bond yields is likely to last longer in an environment of dollar weakness. The trade-weighted dollar has been rangebound during the past few months and bullish sentiment toward the dollar has declined significantly (Chart 3). This suggests that US yields have room to move higher. However, we will watch the dollar closely as bond yields rise in 2020 H1. A rapidly appreciating dollar would make us more inclined to fade any increase in US bond yields. The fourth factor we consider is policy uncertainty. It’s no secret that US Treasury securities benefit from flight to safety flows in times of heightened political stress. The tight correlation between the 10-year Treasury yield and the Global Economic Policy Uncertainty index demonstrates this nicely (Chart 4). In fact, it is now clear that uncertainty about the US/China trade war caused US yields to reach lower levels this year than was implied by the economic fundamentals alone. Chart 3Factor 3: The US Dollar
Factor 3: The US Dollar
Factor 3: The US Dollar
Chart 4Factor 4: Policy Uncertainty
Factor 4: Policy Uncertainty
Factor 4: Policy Uncertainty
We see trade tensions continuing to die down as we head into the New Year. President Trump faces an election in November 2020, and he no doubt realizes that an incumbent President with a strong economy has a good chance of winning re-election. He therefore has a strong incentive to support economic growth. However, by the second half of next year, we see two potential political risks that could flare, causing bond yields to fall. First, if Trump finds himself behind in the polls by mid-summer, then he may change his strategy and re-escalate tensions with China or some other foreign policy target. Second, if one of the progressive candidates – Elizabeth Warren or Bernie Sanders – secures the Democratic nomination, stocks will likely sell off, precipitating a flight-to-quality into US bonds. All in all, we see the ebbing of policy uncertainty in the first half of 2020 helping to push bond yields higher. But risks could flare again in the 2020 H2, sending yields back down. Chart 5Factor 5: Sentiment
Factor 5: Sentiment
Factor 5: Sentiment
The final factor we consider when forecasting bond yields is sentiment, and we find the Economic Surprise Index to be the most useful sentiment measure. Chart 5 shows that positive data surprises tend to coincide with rising Treasury yields and vice-versa. We also know that long periods of positive data surprises are more likely to be followed by disappointments, and vice-versa. Though the Surprise Index’s message can change quickly, it is currently close to neutral, sending no strong signal for bond yields. Considering our five macro factors together, we conclude that a rebound in global growth and waning political uncertainty will send bond yields higher in the first half of 2020. Investors should keep portfolio duration low in this environment. We may recommend increasing portfolio duration as we approach mid-year if political uncertainty looks set to rise, or if the dollar is appreciating strongly, or if yields reach the targets outlined below. Yield Target #1: The Golden Rule Of Bond Investing Our Golden Rule of Bond Investing asserts that you should keep portfolio duration low if you expect the Fed to be more hawkish than market expectations, and high if you expect the Fed to be more dovish.3 At present, the overnight index swap (OIS) curve is priced for 22 basis points of rate cuts over the next 12 months. While economic growth is poised to improve in 2020, the Fed is in no rush to tighten monetary policy with inflation expectations still low. We therefore expect the fed funds rate to stay flat next year. With the market still priced for cuts, this forecast implies that we should maintain below-benchmark portfolio duration, at least until our 12-month Fed Funds Discounter – the change in the fed funds rate priced into the OIS curve for the next 12 months – rises to zero or above. A rebound in global growth and waning political uncertainty will send bond yields higher in the first half of 2020. Investors should keep portfolio duration low in this environment. Table 1 uses our Golden Rule framework to forecast Treasury index returns in different monetary policy scenarios. Our base case of a flat fed funds rate is consistent with Treasury index total returns of +0.67% to +0.88% in 2020, and excess returns versus cash of between -0.91% and -0.70%. The Appendix at the end of this report discusses how our Golden Rule framework performed in 2019 and in years past. Table 1Treasury Return Projections
2020 Key Views: US Fixed Income
2020 Key Views: US Fixed Income
Yield Target #2: Long-Run Fed Funds Rate Expectations Chart 6Target 2.25% To 2.5%
Target 2.25% To 2.5%
Target 2.25% To 2.5%
A second catalyst for increasing portfolio duration would be if the 5-year/5-year forward Treasury yield converged with estimates of the longer-run neutral fed funds rate. Once recessionary risks move to the backburner, it would be logical for long-dated forward rates to converge to levels that are consistent with market expectations for the long-run neutral fed funds rate. Indeed, this is precisely what happened in 2014 and 2017/18, the last two periods of strong global growth (Chart 6). At present, the Fed’s median long-run neutral rate estimate is 2.5%. The New York Fed’s Survey of Market Participants estimates a range of 2.19% to 2.50% and its Survey of Primary Dealers estimates a range of 2.25% to 2.56%. A 5-year/5-year forward Treasury yield in the range of 2.25% to 2.5% would be a second catalyst for us to increase recommended portfolio duration. For Treasury yields to move sustainably above 2.5% in this cycle, it will be necessary for investors to revise their long-run neutral rate estimates higher. This could very well occur, but probably not within the next six months. Nonetheless, investors should pay close attention to the price of gold and the US housing market for signals that neutral rate estimates might undergo upward revisions. The gold price tends to rise when investors view monetary policy as becoming increasingly accommodative. This can occur because the Fed is cutting rates while neutral rate estimates are unchanged, or because neutral rate estimates are rising and the fed funds rate is unchanged. Chart 7 shows that a drop in the gold price foreshadowed downward revisions to the neutral rate in 2013. A further breakout in gold in 2020 could signal that the neutral rate needs to be revised higher again. The housing market will also provide important clues about the neutral fed funds rate. Last year, housing activity slowed considerably once the 30-year mortgage rate rose about 4% (Chart 8). Activity bounced back this year after rates fell, but it will be important to see what happens to housing once the mortgage rate rises back to 4% and above. If an above-4% mortgage rate leads to another downdraft in housing, it would send a strong signal that current neutral rate estimates are roughly correct. However, if housing activity continues to improve with a mortgage rate above 4%, it would suggest that upward neutral rate revisions are required. Chart 7Gold Leads The Neutral Rate...
Gold Leads The Neutral Rate...
Gold Leads The Neutral Rate...
Chart 8...And So Does Housing
...And So Does Housing
...And So Does Housing
There is at least one good reason to think that housing activity might not slow once the mortgage rate rises above 4%. There is currently an excess of supply at the upper-end of the housing market, and a lack of supply at the low-end. This has resulted in price deceleration for new homes, as homebuilders shift construction to the lower-end of the market where demand is stronger (Chart 8, bottom panel). This supply side re-adjustment could make the housing market more resilient to higher mortgage rates in 2020. Key View #2: Barbell Your Treasury Portfolio The 2/10 Treasury slope will steepen modestly in the coming months, but will remain in a range between 0 bps and 50 bps in 2020. Any steepening will be concentrated in the real yield curve. The TIPS breakeven inflation curve is likely to flatten. Our valuation models suggest that a barbelled Treasury portfolio is the best way to position for this environment. Specifically, we recommend shorting the 5-year bullet and buying a duration-matched barbell consisting of the 2-year note and 30-year bond. In thinking about how the slope of the Treasury curve will respond as global growth improves in 2020, it’s useful to look at what happened in two recent episodes of strengthening global growth – 2012/13 and 2016/17. Charts 9A, 9B and 9C illustrate how the 2/10 slope responded in those periods, and show the breakdown between changes in the real and inflation components of yields. The actual slope changes are provided in Table 2. In 2012/13, the 2/10 slope steepened dramatically as global growth rebounded, with almost all of the steepening coming from the real yield curve. It’s not difficult to understand why. The economic outlook was improving, but the Fed was still two years away from lifting interest rates. As such, the Fed’s dovish forward guidance kept a firm lid on short-maturity yields even as long-dated yields rose. In contrast, we can look at the 2016/17 episode. The 2/10 slope steepened somewhat early in the 2016/17 global growth recovery, but ended up 45 bps flatter by the time that the Global PMI peaked. This time, both the real and inflation components contributed to curve flattening. The key difference in this episode was that the Fed was quick to turn more hawkish as growth improved. It lifted the funds rate four times, and short-dated yields rose more quickly than those at the long-end. If housing activity continues to improve with a mortgage rate above 4%, it would suggest that upward neutral rate revisions are required. What can be applied from these two episodes to today? One thing that’s clear is that the Fed will not be as quick to tighten policy as it was in 2016/17. As will be discussed in more detail in next week’s report, the Fed wants to keep policy accommodative until inflation expectations are firmly re-anchored around its target. We think the 5-year/5-year forward TIPS breakeven inflation rate needs to rise from its current 1.8% to above 2.3% before that goal is met. However, it’s also conceivable that inflationary pressures will emerge as soon as late-2020, necessitating rate hikes in 2021. If that’s the case, then short-dated yields will sniff that out in advance, imparting some flattening pressure to the curve. All in all, we’re looking for modest curve steepening in the first half of 2020. But with the Fed not completely out of the picture – as was the case in 2012/13 – the 2/10 slope will not rise above 50 bps. We would also recommend positioning for curve steepening via real yields. The cost of 2-year inflation protection is currently below the cost of 10-year inflation protection (Chart 9C), but will probably lead the 10-year higher as inflation expectations slowly adapt to the incoming data. We recommend TIPS breakeven curve flatteners. Chart 9ANominal 2/10 Slope
Nominal 2/10 Slope
Nominal 2/10 Slope
Chart 9BReal 2/10 Slope
Real 2/10 Slope
Real 2/10 Slope
Chart 9CInflation Compensation: 2/10 Slope
Inflation Compensation: 2/10 Slope
Inflation Compensation: 2/10 Slope
Table 22/10 Slope Changes During Two Recent Global Growth Upturns
2020 Key Views: US Fixed Income
2020 Key Views: US Fixed Income
Interestingly, we also do not recommend the typical 2/10 steepening trade of going long the 5-year bullet against a duration-matched 2/10 barbell. This is because the 2/5/10 butterfly already discounts a huge amount of 2/10 steepening. The 5-year bullet appears 6 bps expensive on our model, meaning that the 2/10 slope needs to steepen by 26 bps during the next six months for a long 5-year, short 2/10 trade to profit (Chart 10).4 Chart 102/5/10 Butterfly Valuation Model
2/5/10 Butterfly Valuation Model
2/5/10 Butterfly Valuation Model
Against this valuation backdrop, we recommend owning a duration-matched barbell consisting of the 2-year note and the 30-year bond, while shorting the 5-year note. This heavily barbelled Treasury allocation adds positive carry to a bond portfolio, and will earn positive returns as long as the 5/30 slope steepens by less than 61 bps during the next six months.5 Further, recent correlations suggest that the 5-year yield will rise by more than either the 2-year or 30-year yields if the market starts to price-in fewer Fed rate cuts, as we expect. Table 3 shows that there has been a positive correlation between changes in the 2/5 Treasury slope and our 12-month discounter during the past six months, and a negative correlation between our discounter and the 5/30 slope. Table 3Correlation Of Monthly Changes In 12-Month Discounter With Monthly Changes In Treasury Curve Slopes
2020 Key Views: US Fixed Income
2020 Key Views: US Fixed Income
Key View #3: Overweight Spread Product Low inflation expectations will keep the Fed on hold in 2020. This accommodative monetary environment will keep defaults low and credit spreads tight. Spread product will outperform Treasuries in duration-matched terms. In last year’s Key Views report, we presented a method for splitting the economic cycle into three phases based on the slope of the yield curve.6 We observed that spread product excess returns versus Treasuries tend to be highest in Phase 1 of the cycle, when the 3-year/10-year Treasury slope is above 50 bps. Spread product excess returns tend to be low, but still positive, in Phase 2 of the cycle when the slope is between 0 bps and 50 bps, and only turn negative in Phase 3 after the 3-year/10-year slope inverts. By our criteria, we remained in Phase 2 of the cycle throughout all of 2019 and spread product did in fact deliver small, but positive, excess returns relative to Treasuries. We expect to remain in Phase 2 throughout most (if not all) of 2020, and therefore advise investors to maintain overweight allocations to spread product versus duration-matched Treasuries. We are looking for modest curve steepening in the first half of 2020. The principal rationale for our call is that accommodative Fed policy will keep the yield curve positively sloped in 2020. It will also give banks the confidence to continue extending credit. And as long as lending standards are sufficiently easy, defaults will remain low and spreads will stay tight. Yes, there are some early indications that we might be transitioning into a Phase 3 environment, an environment that would merit a more defensive stance. For one thing, some parts of the Treasury curve inverted in August, though the specific measure we use in our credit cycle analysis – the monthly average of daily closes of the 3-year/10-year Treasury slope – remained above zero (Chart 11). Also, commercial & industrial (C&I) lending standards tightened in the third quarter. Chart 11Still In Phase 2
Still In Phase 2
Still In Phase 2
However, we expect both of these warning signs to dissipate in the near future. The yield curve has already re-steepened, and while loan officers indicated that they had tightened overall standards on C&I loans in Q3, they continued to loosen the terms on those loans (Chart 11, panel 3). But most importantly, we continue to observe inflation expectations that are far below the Fed’s comfort zone (Chart 11, bottom panel). As long as this is the case, the Fed will do its best to keep interest rates low and monetary conditions accommodative. In that environment, the yield curve should stay upward sloping and banks will keep the credit taps open. Phase 2 will stay in place and spread product will outperform Treasuries. The poor health of nonfinancial corporate balance sheets is another risk to our positive spread product view. We track corporate balance sheet health using both aggregate top-down data from the US Financial Accounts (Chart 12A) and by looking at the median firm in our own bottom-up sample of high-yield issuers (Chart 12B). In both cases, we see that debt-to-profit and debt-to-asset ratios are elevated, indicating that firms are carrying a lot of debt on their balance sheets relative to history. However, both samples also show that interest coverage ratios are strong. Solid interest coverage is the result of low interest rates and the Fed’s accommodative monetary policy. It tells us that defaults won’t occur until inflation expectations rise and the Fed turns more restrictive. That may not happen until 2021. Chart 12ACorporate Health: Top-Down
Corporate Health: Top-Down
Corporate Health: Top-Down
Chart 12BCorporate Health: Bottom-Up
Corporate Health: Bottom-Up
Corporate Health: Bottom-Up
The downside is that an extended period of accommodative monetary policy and few defaults means that firms will continue to build up debt and whittle away the equity cushion in corporate capital structures. The end result will be greater losses during the next default cycle. Our Preferred Spread Sectors Within US spread product, we recommend an overweight allocation to high-yield corporate bonds to take advantage of the favorable macro environment. Within investment grade sectors, we advise only a neutral allocation to corporate bonds (see Key View #4), but recommend overweighting Agency Mortgage-Backed Securities (see Key View #5), Agency Commercial Mortgage-Backed Securities, Local Authority and Foreign Agency debt. Chart 13 shows a snapshot of the risk/reward trade-off between investment grade spread products. The vertical axis displays the option-adjusted spread as a simple proxy for 12-month expected excess returns. The horizontal axis displays our own risk measure called the Risk Of Losing 100 bps.7 This measure calculates the spread widening required for each sector to lose 100 bps or more versus duration-matched Treasuries, then adjusts for each sector’s historical spread volatility. Chart 13Excess Return Bond Map: Main Investment Grade Sectors
2020 Key Views: US Fixed Income
2020 Key Views: US Fixed Income
Chart 13 imposes no macro view, but it does reveal that Foreign Agency debt offers an attractive expected return for its level of risk. Agency CMBS and Agency MBS also offer attractive expected returns for their respective risk levels. USD-denominated Sovereign bonds offer high expected returns, but are also the riskiest of the sectors in Chart 13. We recommend an underweight allocation to USD-denominated Sovereigns with the exception of Mexican and Saudi Arabian bonds, which look attractive on a risk/reward basis. Chart 14 replicates Chart 13 but with the USD-denominated Sovereign bonds of different countries. Only Mexico and Saudi Arabia stand out as being attractively priced. Chart 14Excess Return Bond Map: USD-Denominated EM Sovereigns
2020 Key Views: US Fixed Income
2020 Key Views: US Fixed Income
Chart 15Favor Long-Maturity Munis
Favor Long-Maturity Munis
Favor Long-Maturity Munis
We also maintain a positive outlook on Municipal bonds, particularly at the long-end of the Aaa-rated curve. Municipal / Treasury yield ratios look attractive compared to history, especially at long maturities (Chart 15). While many state and local governments face long-run problems related to underfunded pensions, these issues won’t be exposed until revenue growth falters in the next downturn. For now, state & local government balance sheets are healthy enough to keep muni upgrades outpacing downgrades (Chart 15, bottom 2 panels). Key View #4: Favor High-Yield Over Investment Grade Appropriate valuation measures show that high-yield corporate spreads are very attractive in the current environment, while investment grade corporate spreads are tight compared to our fair value estimates. We noted above that, despite the favorable macro environment for spread product, we recommend an overweight allocation to high-yield corporate bonds but only a neutral allocation to investment grade corporates. The reason for the disparity is valuation. Our preferred valuation measure is the 12-month breakeven spread. This is the spread widening required for the sector to lose money versus Treasuries on a 12-month horizon. This measure is superior to the simple index option-adjusted spread because it controls for time-varying index duration. We also re-calculate the investment grade and high-yield bond indexes so that they have constant distribution between the different credit tiers over time. Charts 16A and 16Bshow 12-month breakeven spreads for our re-constituted investment grade and high-yield indexes as percentile ranks versus history. The investment grade spread has been tighter only 11% of the time since 1995, while the high-yield spread has been tighter 67% of the time. Chart 16AIG Valuation
IG Valuation
IG Valuation
Chart 16BHY Valuation
HY Valuation
HY Valuation
From our analysis of the three phases of the cycle, we also know that spreads tend to tighter in Phase 2 of the cycle than in Phases 1 or 3. Since we are currently in Phase 2, we would expect spreads to be near the bottom of their historical distributions. With this knowledge, we derive spread targets for each corporate credit tier based on the median breakeven spreads witnessed in prior Phase 2 periods. We then use current index duration to calculate option-adjusted spread targets for each credit tier and the overall investment grade and high-yield indexes (Charts 17A and 17B). Notice that all investment grade spreads are below their Phase 2 targets, while high-yield spreads are well above. Chart 17AIG Spread Targets
IG Spread Targets
IG Spread Targets
Chart 17BHY Spread Targets
HY Spread Targets
HY Spread Targets
We also observe that Caa-rated spreads are extremely cheap relative to target, and have been widening rapidly. We are more inclined to view this as an opportunity to buy Caa-rated bonds than as a warning sign for overall corporate bond performance, as we discussed in a recent report.8 Key View #5: Overweight Mortgage-Backed Securities Agency MBS look attractive compared to investment grade corporate bonds, especially in risk-adjusted terms. The risk of a refinancing surge in 2020 is minimal and mortgage lending standards are more likely to ease than tighten. MBS spreads have room to tighten in 2020. We noted above that Agency MBS offer an attractive trade-off between risk and expected return. Specifically, Chart 13 shows that MBS offer expected returns that are similar to Aa and Aaa corporates, but with less risk of losing 100 bps versus Treasuries. For further evidence of the attractiveness of MBS spreads, we note that while the zero-volatility spread for conventional 30-year Agency MBS is not all that elevated compared to history, it is being held down by very low expected prepayment losses (aka option costs) (Chart 18). The OAS, the best proxy for MBS expected return, stands at 48 bps. This is reasonably elevated compared to history and very close to the spread offered by Aa-rated corporate bonds. Past periods when the MBS OAS was close to the Aa-rated corporate bond spread were followed by MBS outperformance (Chart 18, bottom panel). We recommend an overweight allocation to high-yield corporate bonds but only a neutral allocation to investment grade corporates. The reason for the disparity is valuation. We noted that expected prepayment losses are low, and this is for good reason. Mortgage refinancing activity will remain depressed throughout 2020. First, with the Fed likely to go on hold for 2020 and then lift rates in 2021, the mortgage rate is more likely to rise than fall. Higher mortgage rates will keep refis down. Second, most homeowners have already had multiple opportunities to refinance their mortgages during the past few years, as evidenced by the fact that the MBA Refinance Index didn’t rise that much in 2019, even as the mortgage rate declined 106 bps (Chart 19). Chart 18MBS Spreads
MBS Spreads
MBS Spreads
Chart 19Refi Risk Is Minimal
Refi Risk Is Minimal
Refi Risk Is Minimal
Tightening bank lending standards for residential mortgages can also lead to wider MBS spreads, but lending standards are more likely to ease than tighten in 2020. FICO scores for approved mortgages have not come down at all since the financial crisis (Chart 19, panel 3), and loan officers consistently claim that lending standards are tighter than the average since 2005 (Chart 19, bottom panel). With standards already so tight, modest easing is more likely than rapid tightening. Key View #6: Overweight TIPS Versus Nominal Treasuries TIPS breakeven inflation rates are well below our target range of 2.3%-2.5%. It will take some time, and likely an overshoot of the Fed’s 2% inflation target, for them to reach that range as expectations adapt only slowly to rising core inflation. But even if they don’t make it back to target, breakevens should still grind higher as the economy recovers in 2020. Our target range for both the 10-year and 5-year/5-year forward TIPS breakeven inflation rates remains 2.3%-2.5%. But it could take quite some time for that target to be met. The reason is that inflation expectations adapt only slowly to changes in the actual inflation data. We explained this dynamic in a report from last year, and also created a fair value model for the 10-year TIPS breakeven inflation rate based on long-run trends in the actual inflation data.9 At present, our Adaptive Expectations Model pegs fair value for the 10-year breakeven rate at 1.9%, 20 bps above the current level of 1.7%, but well short of our end-of-cycle 2.3%-2.5% target (Chart 20). We could see the 10-year breakeven reaching 1.9% in the coming months as global growth recovers, but it will take a more sustained uptrend in the actual inflation data to move higher than that. A more sustained uptrend in actual inflation could take some time to develop. This year’s increase in core CPI inflation has been concentrated in the core goods component (Chart 21). This component of core inflation tracks import prices with a lag, and it is very likely to fall back down in 2020. Any sustained breakout in core inflation will require more strength from the core services (ex. Shelter and medical care) component (Chart 21, panel 3), something that hasn’t happened yet this cycle. Chart 20Adaptive Expectations Model
Adaptive Expectations Model
Adaptive Expectations Model
Chart 21The Components Of Core CPI
The Components Of Core CPI
The Components Of Core CPI
Ryan Swift US Bond Strategist rswift@bcaresearch.com Appendix: The Golden Rule Of Bond Investing Our Golden Rule of Bond Investing says that we should determine what change in the fed funds rate is priced into the overnight index swap curve for the next 12 months, and then decide whether the Fed will deliver a hawkish or dovish surprise relative to that expectation. We contend that if the Fed delivers a hawkish surprise, then a below-benchmark portfolio duration positioning will pay off. Conversely, if the Fed delivers a dovish surprise, then an above-benchmark portfolio duration positioning will profit. Chart A1 shows how the Golden Rule has performed in every calendar year going back to 1990. We include year-to-date performance for 2019. In 30 years of historical data, our Golden Rule performed well in 22. It provided the wrong recommendation in 8 years, though 3 of those years were during the zero-lower-bound period between 2009 and 2015 when 12-month rate expectations were essentially pinned at zero.10 At the beginning of this year, the market was priced for 7 bps of rate cuts in 2019. The funds rate actually fell by 84 bps, leading to a dovish surprise of 77 bps. Based on a historical regression, we would expect a dovish surprise of 77 bps to coincide with a Treasury index yield that falls by 52 bps. In actuality, the index yield fell by 81 bps, more than our Golden Rule predicted. Chart A2 shows how close changes in the Treasury index yield have been to our Golden Rule’s prediction in each of the past 30 years. This regression between the change in Treasury index yield and the monetary policy surprise is the main source of error in our Treasury return forecasts. Based on our expected -52 bps index yield change, we would have expected the Treasury index to deliver 5.9% of total return in 2019 and to outperform cash by 3.4%. In actuality, the index earned 7.9% of total return and outperformed cash by 5.6%. Charts A3 and A4 show how index total and excess returns have performed relative to our Golden Rule’s expectations in each of the past 30 years. Chart A1The Golden Rule’s Track Record
The Golden Rule's Track Record
The Golden Rule's Track Record
Chart A2Treasury Index Yield Changes Versus Fed Funds Surprises
2020 Key Views: US Fixed Income
2020 Key Views: US Fixed Income
Chart A3Treasury Index Total Returns Versus The Golden Rule’s Predictions
2020 Key Views: US Fixed Income
2020 Key Views: US Fixed Income
Chart A4Treasury Index Excess Returns Versus The Golden Rule’s Predictions
2020 Key Views: US Fixed Income
2020 Key Views: US Fixed Income
Footnotes 1 Please see The Bank Credit Analyst, “Outlook 2020: Heading Into The End Game”, dated November 22, 2019, available at bca.bcaresearch.com 2 Please see US Bond Strategy Weekly Report, “Bond Kitchen”, dated April 9, 2019, available at usbs.bcaresearch.com 3 Please see US Bond Strategy Special Report, “The Golden Rule Of Bond Investing”, dated July 24, 2018, available at usbs.bcaresearch.com 4 For more details on our butterfly spread valuation models please see US Bond Strategy Special Report, “Bullets, Barbells And Butterflies”, dated July 25, 2017, available at usbs.bcaresearch.com 5 The 2/5/30 valuation model is not shown in this report. Please see US Bond Strategy Portfolio Allocation Summary, “Mixed Messages”, dated December 3, 2019, for a recent update of all our yield curve models. 6 Please see US Bond Strategy Special Report, “2019 Key Views: Implications For US Fixed Income”, dated December 11, 2018, available at usbs.bcaresearch.com 7 For further details on how this measure is calculated please see US Bond Strategy Weekly Report, “A Perspective On Risk And Reward”, dated October 15, 2019, available at usbs.bcaresearch.com 8 Please see US Bond Strategy Weekly Report, “Caa-Rated Bonds: Warning Sign Or Buying Opportunity?”, dated November 26, 2019, available at usbs.bcaresearch.com 9 For further details on our Adaptive Expectations Model please see US Bond Strategy Weekly Report, “Adaptive Expectations In The TIPS Market”, dated November 20, 2018, available at usbs.bcaresearch.com 10 We say the Golden Rule “worked” if a dovish surprise coincided with positive Treasury index excess returns versus cash, or if a hawkish surprise coincided with negative Treasury excess returns versus cash.
Highlights Our take on the key macro drivers of financial markets is quite similar to last year’s, … : Monetary policy is still accommodative; lenders are ready, willing and able; and the expansion remains intact. ... because the Fed and other central banks have reset the monetary policy clock, … : At this time last year, we projected that the Fed would be on the cusp of tightening monetary policy enough to induce a recession by the middle of 2020. Three rate cuts later, we now expect that policy won’t become restrictive until 2021. … pushing the inflection points investors care about further out into the future: The next recession won’t begin before monetary policy settings are tight, and stocks won’t peak until about six months before the recession starts. We are keeping close tabs on the trade negotiations and potential election outcomes, but we expect that 2020 will be another rewarding year for riskier assets: The equity bull market is likely to last for all of next year, and spread product will keep cranking out excess returns over Treasuries and cash for a while longer, too. Overweight equities and spread product. Feature Mr. and Ms. X made their annual visit to BCA last month, giving us an opportunity to gather our thoughts for 2020, while reviewing how our calls turned out in 2019. Both BCA and US Investment Strategy got the asset allocation conclusion right – overweight equities and spread product, while underweighting Treasuries – but the Fed did the opposite of what we expected heading into 2019, putting us on the wrong side of the Treasury duration call for most of the year. We still think investors are overly complacent about the potential for future inflation, but we concede that the future remains further off than we initially expected. Monetary policy settings got more accommodative nearly everywhere in the world in 2019, ... Our Outlook 2020 theme, as detailed in the year-end edition of The Bank Credit Analyst, is Heading into the End Game,1 and it is clear that the expansion is in its latter stages. We do not think that the end of the expansion, the equity bull market, or credit’s extended stretch of positive excess returns is at hand, however. The full-employment/low-inflation sweet spot is still in place, and the Fed has no plans to get in the expansion’s way, even if inflation begins to gain some traction. Its biggest policy priority is trying to get inflation expectations back to the 2.3 – 2.5% range consistent with its inflation target. Chart 1Globalization Hits A Wall
Globalization Hits A Wall
Globalization Hits A Wall
Central banks around the world followed the Fed’s lead this year, cutting their policy rates in an attempt to shield their economies from potentially worsening trade tensions. Though no central banker would say it out loud, joining the rate-cutting parade also helped to defend against currency appreciation, as no one wants a strong currency when growth is in such short supply. The upshot is that global central banks are deliberately promoting reflation. That’s a supportive policy backdrop for risk assets, and while it may well lead to a bigger hangover down the road, it will ramp up the party now. Exogenous challenges remain. Trade tensions are a thorn in businesses’, consumers’ and investors’ sides. Even if US-China tensions die down, a belligerent US administration appears bent on using tariffs and other trade barriers as a cudgel to force concessions from other nations. The trade tailwind that boosted economic growth and investment returns across the last two decades has been stilled (Chart 1). Saber rattling by the US, or mischief from the usual rogue-state and non-state suspects, could also keep markets on edge. The looming election could give investors heartburn, and clients around the world remain anxious about the prospects of a Warren administration. Exogenous risks abound, but it is not our base case that a critical mass will coalesce to disrupt our view that generous-to-indulgent monetary policy settings will delay the day of reckoning, and keep the bull market going all the way through the coming year. As The Cycles Turn From our perspective, the practice of investment strategy is properly founded on the study of cycles. The key cycles – the business cycle, the credit cycle, and the monetary policy cycle – determine how receptive the macroeconomic backdrop is for taking investment risk. Investments made when the backdrop supports risk taking have a much better likelihood of generating excess returns over Treasuries and cash than investments made against an unfriendly macro backdrop. We therefore start every investment decision with an assessment of the key cycles. Determining whether the economy is expanding or contracting may seem like an academic debate with little practical application when the official business cycle arbiters don’t even determine the beginning and ending dates of recessions until well after the fact.2 Equity bear markets reliably coincide with recessions, however, and over the last 50 years, they have begun an average of six months before their onset (Chart 2). An investor who recognizes that a recession is at hand has a good chance of outperforming his/her competitors as long as s/he aggressively adjusts portfolio allocations in line with that recognition. Chart 2Bear Markets Rarely Occur Outside Of Recessions, ...
Bear Markets Rarely Occur Outside Of Recessions, ...
Bear Markets Rarely Occur Outside Of Recessions, ...
Our key view, then, is that the start of the next recession is at least 18 to 24 months away. Tight monetary policy is a necessary, albeit not sufficient, condition for a recession (Chart 3), and we consider the Fed’s current monetary policy settings to be easy, especially after this year’s three rate cuts. A recession can’t begin until the Fed reverses those three cuts and, per our estimate of the equilibrium rate, tacks on at least three additional hikes. Tightening along those lines is decidedly not on the Fed’s 2020 agenda. Chart 3... And Recessions Only Occur When Monetary Conditions Are Tight
... And Recessions Only Occur When Monetary Conditions Are Tight
... And Recessions Only Occur When Monetary Conditions Are Tight
Our recession judgment compels us to be overweight equities. Even if the next recession begins exactly halfway through 2021, history suggests that 2020 returns will be robust. Over the last 50 years, the S&P 500 has peaked an average of six months before the start of a recession, and returns heading into the peak have been quite strong, especially in the last four expansions (Table 1). Those results are consistent with bull markets’ tendency to sprint to the finish line (Chart 4). Table 1Stocks Don't Quit Until A Recession Is Near
2020 Key Views: No Inflection Yet
2020 Key Views: No Inflection Yet
Chart 4Bull Markets End In Stampedes
2020 Key Views: No Inflection Yet
2020 Key Views: No Inflection Yet
The Fed Funds Rate Cycle We estimate that the equilibrium fed funds rate is currently around 3¼%, and project it will approach 3½% by the end of next year. If we are correct that the Fed’s main policy aim is to prod inflation expectations higher, it follows that it will remain on hold at 1.75% well into 2020. A desire to avoid even the appearance of meddling in the election may well keep the FOMC sidelined until its November and December meetings. The implication is that monetary policy will have no chance to cross into restrictive territory before the first half of 2021. The bottom line for investors is that the day when the economy and markets will have to confront tight monetary conditions has been indefinitely postponed. The Fed has effectively deferred the inflections in the business cycle and the equity market to some point beyond 2020. A longer stretch of accommodation would also continue to fuel the equity bull market, as Phases I and IV of the fed funds rate cycle, in which the fed funds rate is below our estimate of equilibrium (Chart 5), have been equities’ historical sweet spot. Over the last 60 years, the S&P 500 has accrued all of its real returns when policy was easy (Table 2), while Treasuries have shined when it’s tight (Table 3). Chart 5The Fed Funds Rate Cycle
2020 Key Views: No Inflection Yet
2020 Key Views: No Inflection Yet
Table 2Equities Love Easy Policy, …
2020 Key Views: No Inflection Yet
2020 Key Views: No Inflection Yet
Table 3… When They Leave Treasuries Far Behind
2020 Key Views: No Inflection Yet
2020 Key Views: No Inflection Yet
The Credit Cycle Our 30,000-foot view of the credit cycle is based on the banking mantra that bad loans are made in good times. When an expansion has been going on for a while, loan officers focus more on maintaining market share than lending standards, while managers of credit funds attract more assets, pushing them to find a home for their new inflows. Banks and bond managers are thereby pro-cyclical at the margin, keeping the good times going by lending to increasingly marginal borrowers and/or relaxing the terms on which they will lend. (They’re conversely stingy when real-time conditions are bad.) Lenders’ lagging/coincident focus keeps lending standards and borrower performance closely aligned in real time (Chart 6). Chart 6Standards Are Coincident In Real Time, ...
Standards Are Coincident In Real Time, ...
Standards Are Coincident In Real Time, ...
Standards are a contrarian indicator over longer periods, though, because shoddily underwritten loans eventually show their true colors. We find a solid fit between corporate bond default rates and lending standards in the preceding 20 quarters (Chart 7). Lending standards tightened slightly in 2015, but were still quite easy in an absolute sense. A majority of banks tightened standards in 2016 amidst the oil rout, which could point to marginally better 2020-21 performance, but post-2010 standards have hardly been stringent. Chart 7... And Leading Over Five-Year Periods
... And Leading Over Five-Year Periods
... And Leading Over Five-Year Periods
The stock of outstanding loans and bonds is therefore vulnerable. The relaxation of corporate bond covenants so soon after the financial crisis has not escaped the notice of bearish investors and reporters. It is not enough for an investor to identify a vulnerability, however; s/he also has to identify the catalyst that is going to cause a rupture. The challenge is that ultra-accommodative monetary policy delays the formation of negative catalysts. To the utter torment of an observer with an attraction to the Austrian School of Economics’ survival-of-the-fittest ethic, it is not at all easy to default in a ZIRP/NIRP world. The stock of $12 trillion of bonds with negative nominal yields (down from August’s $17 trillion peak) has ginned up a fervent search for yield among large institutional investor constituencies that have to meet a fixed distribution schedule, like life insurers and pension funds. These income-starved investors help explain why nearly any borrower, no matter how sketchy, can draw a crowd of would-be lenders simply by offering an incremental 50 or 75 basis points of yield. Borrowers default when no one is willing to roll over their maturing obligations; they get even more leveraged when lenders are climbing over each other to lend to them. It is also hard to default when central banks are deliberately pursuing reflation. Inflation makes debt service easier, and central banks are all-in for reflation as a means to bolster inflation expectations, defend against further trade tensions, and to ensure currency strength doesn’t undermine exports. The credit cycle is well advanced, and the Austrians may be at least partially vindicated when the ensuing selloff is worse than it would otherwise have been for having been delayed, but it looks to us like it has more room to run. The rapture remains out of reach for Austrian School devotees, who slot between Tantalus and New York Knicks fans on the cosmic persecution scale. Bonds We remain bearish on Treasuries and reiterate our below-benchmark duration recommendation, though we recognize that the 10-year Treasury yield is unlikely to rise beyond the 2.25-2.5% range in the next year. There’s only one more rate cut to price out of the OIS curve, and neither inflation expectations nor the term premium will return to normal levels quickly. The intermediate- and long-term outlook for the Federal budget is grim, given the size of the deficit while unemployment is at a 50-year low (Chart 8), but Dick Cheney will maintain the upper hand over deficit hawks for 2020 and several years beyond. We do think investors are complacent about inflation’s eventual return, though, and continue to advocate for TIPS over nominal Treasuries. It is tough to default in a ZIRP/NIRP world, when several institutional investor constituencies have a voracious appetite for yield. Chart 8The Budget Outlook Is Grim
The Budget Outlook Is Grim
The Budget Outlook Is Grim
Chart 9IG Spreads Are Wafer Thin
IG Spreads Are Wafer Thin
IG Spreads Are Wafer Thin
Our benign near-term view of the credit cycle makes us comfortable continuing to overweight spread product, subject to our US Bond Strategy colleagues’ preferences. They are only neutral on investment-grade corporates, given their scant duration-adjusted spread over Treasuries (Chart 9). They recommend overweighting high-yield corporate bonds instead, given that high-yield spreads still offer ample positive carry. They also recommend agency mortgage-backed securities as a high-quality alternative to investment-grade corporates, noting that their low duration (three years versus nearly eight for corporates) offers better protection against rising rates. Equities With monetary policy still accommodative, and the expansion still intact, the cyclical backdrop is equity-friendly. If we’re correct that policy won’t turn restrictive until early to mid-2021 at the earliest, the bull market should be able to continue through all of 2020. We do not foresee a return to double-digit earnings growth, but the upward turn in leading indicators across a wide swath of countries outside of the US suggests that a revival in the rest of the world could help S&P 500 constituents grow earnings by mid-single digits, via a pickup in non-US demand and some softening in the dollar. Net share retirements could even nudge earnings growth into the high single digits. If earnings multiples hold up (they’ve expanded at a 5.5% annual rate in Phase IV of the fed funds rate cycle, and don’t typically contract until Phase II), S&P 500 total returns could reach the high single digits, easily putting them ahead of prospective Treasury returns. Multiple expansion isn’t required to support an overweight equities recommendation, but we would not be at all surprised if it occurred. Bull markets often get silly as they sprint to the finish line, and it would be unusual if some froth didn’t bubble up before this bull market, the longest of the postwar era, calls it quits. The Dollar We expect the dollar to weaken against other major currencies in 2020. As the rest of the world finds its footing and begins to accelerate, the growth differential between the US and other major economies will narrow. The dollar will attract less safe-haven flows as the rest of the world’s major economies escape stall speed. Though we expect the countercyclical dollar will rally again when the next recession hits, weakening in 2020 is consistent with our constructive global growth view. Putting It All Together We are sanguine about the US economy, which continued to trundle along at a trend pace in 2019 despite a series of headwinds. It withstood 4Q18’s sharp equity selloff and bond-spread blowout that tightened financial conditions and made corporate and investor confidence wobble. It withstood the 35-day federal government shutdown that lasted nearly all of January. It kept marching forward despite the trade war with China, and it overcame, at least for now, the angst over the inverted yield curve. If the economy continued to expand at roughly its trend pace despite those obstacles, it may not really have needed 25-basis-point rate cuts in July, September and October. The thread connecting our macro views and investment recommendations is the idea that monetary policy settings are highly accommodative and are likely to stay that way until the 2020 election. We expect that risk assets will outperform against an accommodating monetary backdrop. The naysayers are as likely to be confounded by central banks in 2020 as they have been throughout the entire ZIRP/NIRP era. The scolds scouring the data to try to find signs of excesses, and the Chicken Littles who have been frightened by clickbait headlines and strategists deliberately pursuing pessimistic outlier strategies, get one thing right. The market selloffs when the equity and credit bull markets end will be worse than they would have been if the Fed and other central banks were not deliberately attempting to reflate their economies. But their timing is likely to be as bad now as it has been all throughout 2019 (and for the entire post-crisis period for card-carrying, sandwich-board-wearing Austrians). You can’t fight the Fed, much less the ECB, the Bank of Japan, the Bank of England, the Swiss National Bank, the Reserve Banks of Australia and New Zealand, and a broad swath of all of the rest of the world’s central banks. Doug Peta, CFA Chief US Investment Strategist dougp@bcaresearch.com Footnotes 1 Please see the December 2019 Bank Credit Analyst, “Outlook 2020: Heading Into The End Game,” available at www.bcaresearch.com. 2 The NBER’s Business Cycle Dating Committee announced in December 2008 that the last recession began in December 2007. It announced in September 2010 that it had ended in June 2009.
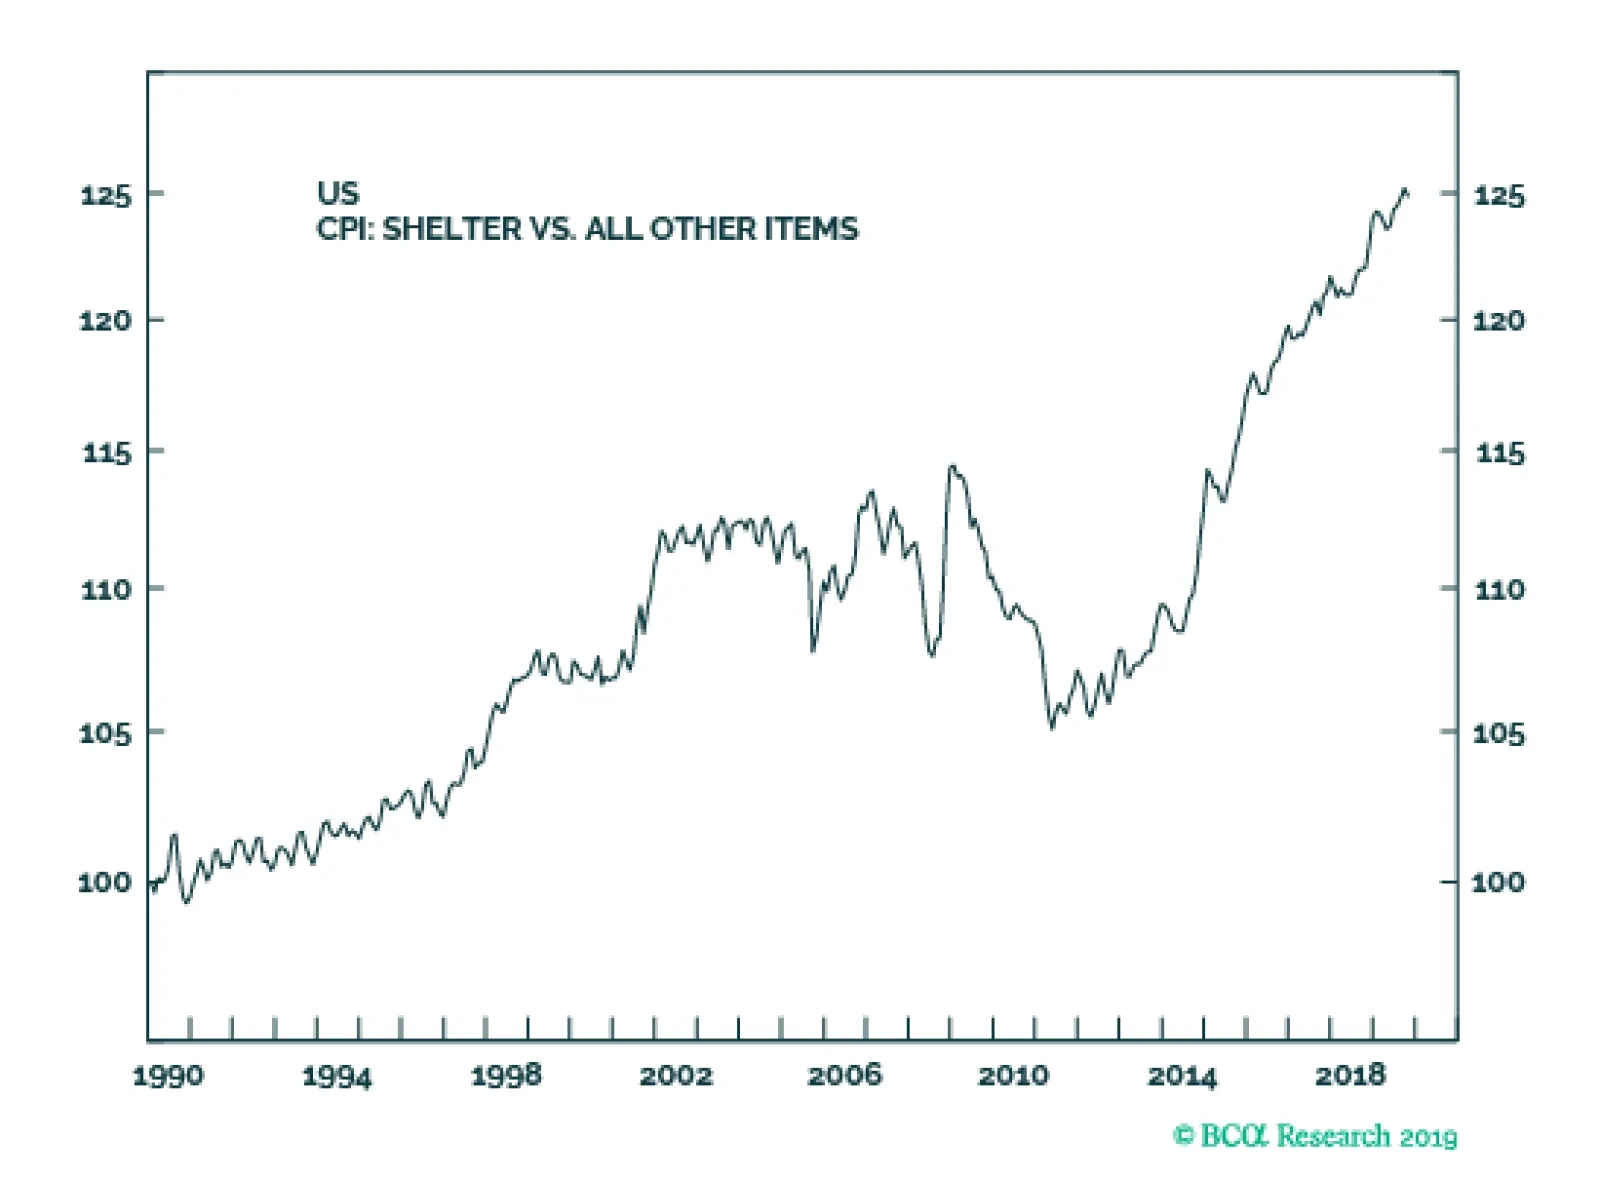
Since 2015, American inflation has outperformed European inflation for one reason: owner equivalent rents have surged by almost 20 percent relative to other prices. The historic evidence suggests that such a pace of outperformance is unsustainable…