Homebuilding
This report revisits China’s property market through both cyclical and structural lenses, assesses the likely policy responses, and evaluates their investment implications.

Stocks are a forward discounting mechanism and routinely top before recessions begin, even if they typically do not swoon until the recession has taken hold. According to BCA Research’s US Investment Strategy service, if consumers were losing momentum and a…

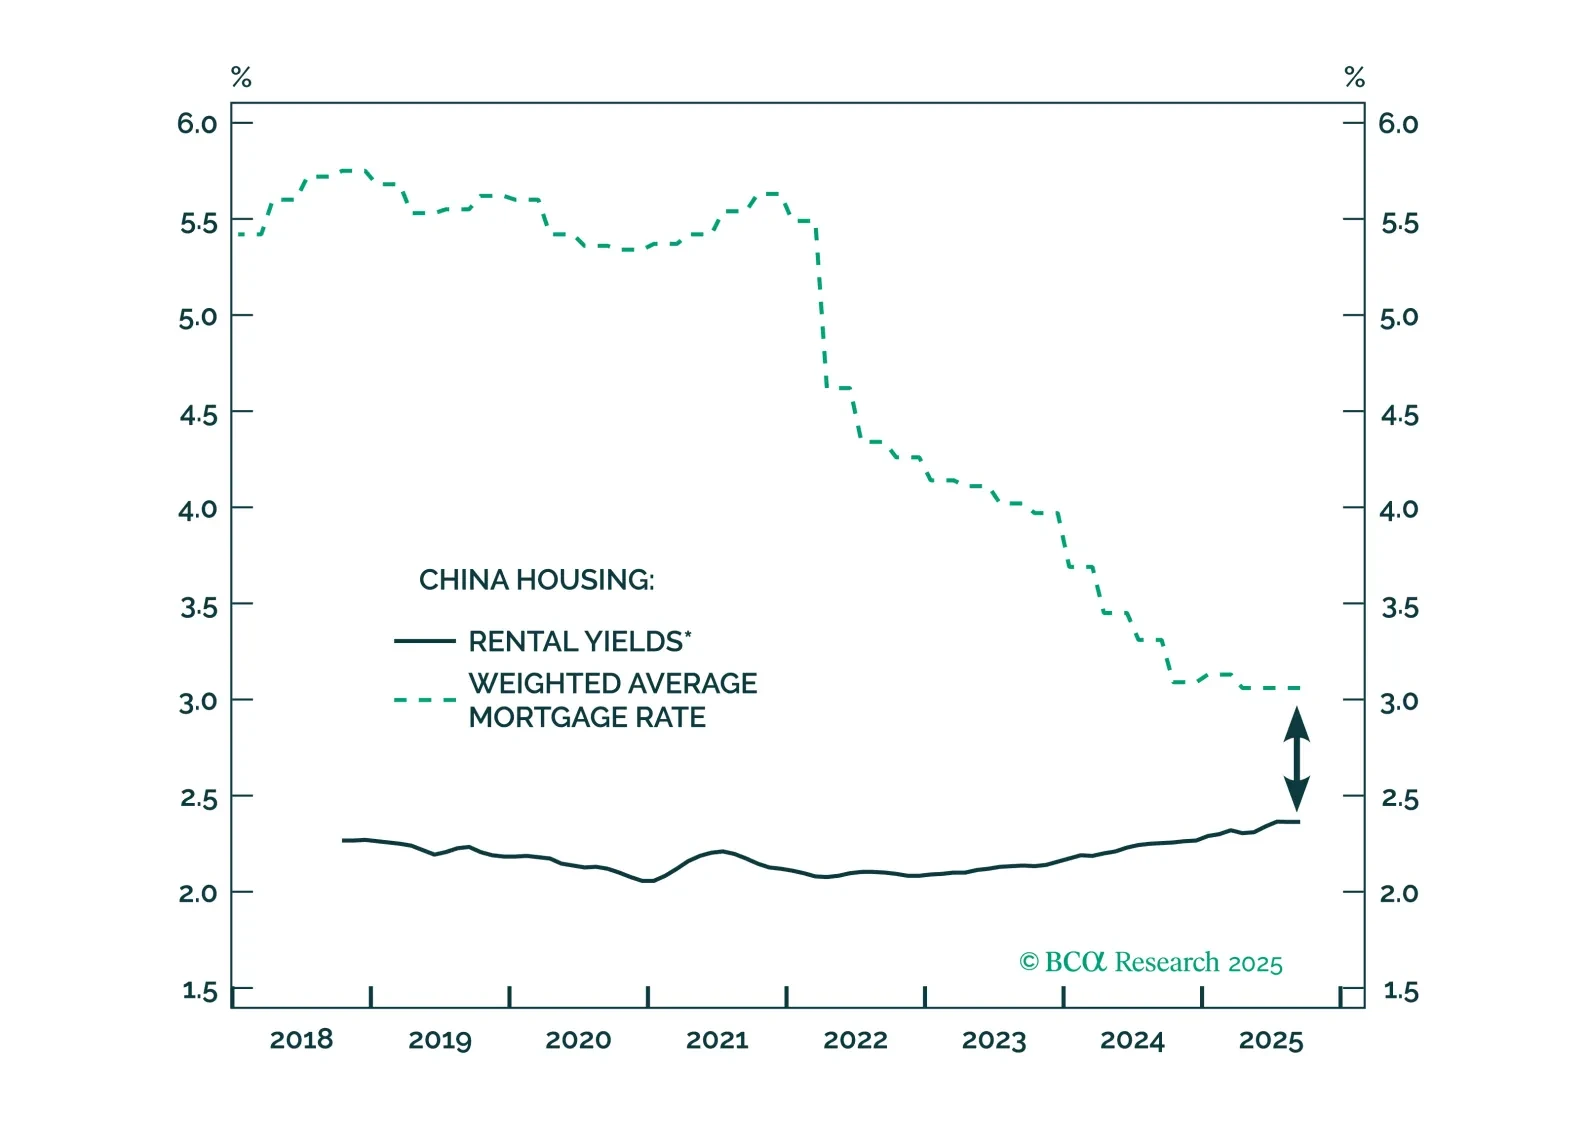
Executive Summary The structural downtrend in Chinese bond yields has a lot further to go, because it is helping to let the air out gently of stratospheric valuations in the real estate sector, and thereby preventing a hard landing for the Chinese economy. In the US, flagging mortgage and housing market activity is weighing on an already slowing economy. Buy US T-bonds. The long T-bond yield is close to a peak. Switch equity exposure into long-duration sectors such as healthcare and biotech. Go overweight US homebuilders versus US insurers. The peak in bond yields will also take pressure off US homebuilder shares whose recent collapse has been the mirror-image of the surge in the 30-year mortgage rate. Fractal trading watchlist: Basic resources; Switzerland versus Germany; and USD/EUR. The Collapse In US Homebuilder Shares Is The Mirror-Image Of The Surge In The Mortgage Rate Bottom Line: The global bond yield cannot rise much further before it destabilises the $350 trillion global real estate market and thereby destabilises the global economy. Feature Quietly and largely unnoticed, Chinese long-dated bond yields have been drifting lower (Chart I-1 and Chart I-2). At a time that surging bond yields elsewhere in the world have grabbed all the attention, the largely unnoticed contrarian move in Chinese bond yields through the past year is significant because of something else that has gone largely unnoticed: Chinese real estate has become by far the largest asset-class in the world, worth $100 trillion.1 Chart I-1The Contrarian Downdrift In The Chinese 30-Year Bond Yield Chart I-2The Contrarian Downdrift In The Chinese 10-Year Bond Yield Chinese Real Estate Is Trading On A Stratospheric Valuation The $100 trillion valuation of Chinese real estate market is greater than the $90 trillion global economy, is more than twice the size of the $45 trillion US real estate market and the $45 trillion US stock market, and dwarfs the $18 trillion Chinese economy. Suffice to say, Chinese real estate’s pre-eminence as the world’s largest asset-class is mostly due to its stratospheric valuation. Prime residential rental yields in Guangzhou, Shanghai, Hangzhou, Shenzhen and Beijing have collapsed to 1.5 percent, the lowest rental yields in the world and less than half the global average of 3 percent. Versus rents therefore, Chinese real estate is now twice as expensive as in the rest of the world (Chart I-3). Chart I-3Versus Rents, Chinese Real Estate Is The Most Expensive In The World To corroborate this point, while the US real asset market is worth around two times US annual GDP, the Chinese real estate market is worth more than five times China’s annual GDP! The structural downtrend in Chinese bond yields has a lot further to go. Crucially, the downward drift in Chinese bond yields is alleviating some of the pressure on the extremely highly valued Chinese real estate market – as it helps to let the air out gently of the stratospheric valuations, and thereby avoid a hard landing for the Chinese economy. Hence, the structural downtrend in Chinese bond yields has a lot further to go. The Surge In US Mortgage Rates Is Taking Its Toll Meanwhile, in the rest of the world, the surge in bond yields poses a major threat to the decade long housing boom. Versus rents, US house prices are the most expensive ever – more expensive even than during the early 2000s so-called ‘housing bubble’. For the first time since 2008, the US 30-year mortgage rate is higher than the prime residential rental yield. Until recently, the historically low rental yield on US real estate was justified by an extremely low bond yield. But the recent surge in the bond yield has changed all that. For the first time since 2008, the US 30-year mortgage rate is higher than the prime residential rental yield2 (Chart I-4). Chart I-4The US 30-Year Mortgage Rate Is Now Higher Than The Prime Residential Rental Yield The surge in US mortgage rates is taking its toll. Since the end of January, US mortgage applications for home purchase have fallen by almost a fifth (Chart I-5), and the lower demand for home purchase mortgages is starting to weigh on home construction (Chart I-6). Building permits for new private housing units were already falling in February, but a more up-to-date sign of the pain is the 35 percent collapse in US homebuilder shares. Chart I-5US Mortgage Applications For Home Purchase Have Fallen By Almost A Fifth Chart I-6The Lower Demand For Home Purchase Mortgages Is Starting To Weigh On Home Construction $350 Trillion Of Global Real Estate Can’t Swallow Higher Bond Yields Mortgage rates drive real estate rental yields because of the arbitrage between buying versus renting a similar home. Given a fixed annual budget for housing, I must choose between how much home I can buy – which depends on the mortgage rate, versus how much home I can rent – which depends on the rental yield. The arbitrage should make me indifferent between the two options. As a simple example of this arbitrage, let’s assume my annual budget for housing is $10k, and both the mortgage rate and rental yield are 4 percent. I will be indifferent between spending the $10k on interest on a $250k mortgage loan to buy the home, or spending the $10k to rent a similar $250k home. If the mortgage rate rises to 5 percent, then the maximum loan that my $10k of interest payment will afford me falls to $200k, reducing my maximum bid to buy the home. If I am the marginal bidder, then the home price will fall to $200k, so that the $10k rent on the similar valued home will also equate to a higher rental yield of 5 percent. In practice, the simple arbitrage described above is complicated by several factors: the maximum loan-to-value that a lender will offer on the home; the different transaction costs of buying versus renting; and the fact that people prefer to buy than to rent because buying a home is an investment which also provides a consumption service – shelter, whereas renting a home only provides the consumption service. Nevertheless, these complications do not diminish the overarching connection between mortgage rates and rental yields. The lion’s share of the real estate boom has come from a massive valuation uplift, which in turn has come from structurally lower bond yields. All of which brings us to the decade long global real estate boom that has doubled the value of global real estate market to an eye-watering $350 trillion, four times the size of the $90 trillion global economy. During this unprecedented boom, global rents have risen by 40 percent, tracking world nominal GDP, as they should. This means that the lion’s share of the real estate boom has come from a massive valuation uplift, which in turn has come from structurally lower bond yields (Chart I-7). Chart I-7The Lion's Share Of The Global Real Estate Boom Has Come From A Massive Uplift In Valuations Since the global financial crisis, there has been an excellent empirical relationship between the global long-dated bond yield (US/China average) and the global rental yield. The important takeaway is that the global bond yield cannot rise much further before it destabilises the $350 trillion global real estate market and thereby destabilises the global economy (Chart I-8). Chart I-8The Global Bond Yield Cannot Rise Much Further Before It Destabilises The $350 Trillion Global Real Estate Market Some Investment Conclusions The good news is that the recent rise in the global bond yield has been limited by the downdrift in Chinese bond yields. Given the massive overvaluation of Chinese real estate, the structural downtrend in Chinese bond yields has a lot further to go. Meanwhile in the US, unless bond yields back down quickly, flagging mortgage and housing market activity will weigh on an already slowing economy. If US bond yields don’t back down quickly, the feedback from consequent slowdown in the economy will ultimately bring yields down anyway. As I explained last week in Fat-Tailed Inflation Signals A Peak In Bond Yields I do expect the long T-bond yield to back down relatively quickly. The sharp drop in US core inflation to just 0.3 percent month-on-month in March signals that inflation is peaking. Hence, medium to long term investors should be buying US T-bonds, and switching equity exposure into long-duration sectors such as healthcare and biotech. Finally, a peak in bond yields will also take pressure off US homebuilder shares whose recent collapse has been the mirror-image of the surge in the 30-year mortgage rate (Chart I-9). Hence, go overweight US homebuilders versus US insurers. Chart I-9The Collapse In US Homebuilder Shares Is The Mirror-Image Of The Surge In The Mortgage Rate Fractal Trading Watchlist Given that inflation hedging investment demand has driven at least part of the strong rally in basic resources, a peak in inflation and bond yields threatens to unwind the recent outperformance of basic resources shares. This is corroborated by the extremely fragile 130-day fractal structure (Chart I-10). Accordingly, the recommended trade is to short basic resources (GNR) versus the broad market, setting the profit target and symmetrical stop-loss at 11.5 percent. This week we are also adding to our watchlist: Switzerland versus Germany; and USD/EUR. The full list of 20 investments that are experiencing or approaching turning points is available on our website: cpt.bcaresearch.com Chart I-10The Outperformance Of Basic Resources Is Vulnerable To Reversal Switzerland's Outperformance Vs. Germany Could End The Rally In USD/EUR Could End Chart 1The Strong Trend In The 18-Month-Out US Interest Rate Future Is Fragile Chart 2The Strong Trend In The 3 Year T-Bond Is Fragile Chart 3AUD/KRW Is Vulnerable To Reversal Chart 4Canada Versus Japan Is Vulnerable To Reversal Chart 5Canada's TSX-60's Outperformance Might Be Over Chart 6US Healthcare Providers Vs. Software At Risk of Reversal Chart 7Bitcoin's 65-Day Fractal Support Is Holding For Now Chart 8A Potential Switching Point From Tobacco Into Cannabis Chart 9Biotech Is A Major Buy Chart 10CAD/SEK Reversal Has Started Chart 11Financials Versus Industrials To Reverse Chart 12Norway's Outperformance Could End Chart 13Greece's Brief Outperformance To End Chart 14BRL/NZD At A Resistance Point Chart 15The Outperformance Of Resources Versus Healthcare Is Vulnerable To Reversal Chart 16The Outperformance Of Resources Versus Biotech Is Vulnerable To Reversal Chart 17Cotton's Outperformance Is Vulnerable To Reversal Chart 18US Homebuilders' Underperformance Is At A Potential Turning Point Chart 19Fractal Trading Watch List Chart 20Fractal Trading Watch List Dhaval Joshi Chief Strategist dhaval@bcaresearch.com Footnotes 1 We estimate the value of Chinese real estate at the end of 2021 to be $97 trillion, comprising residential $85 trillion, commercial $6 trillion, and agricultural $6 trillion. The source is: the Savills September 2021 report ‘The total value of global real estate’, which valued the global real estate market to the end of 2020; and the February 2022 report ‘Savills Prime Residential Index: World Cities’ which allowed us to update the valuations to the end of 2021. 2 The US prime residential rental yield is the simple average of the prime residential rental yields in New York, Miami, Los Angeles and San Francisco. Source: Savills. Fractal Trading System Fractal Trades 6-Month Recommendations Structural Recommendations Closed Fractal Trades Indicators To Watch - Bond Yields Chart II-1Indicators To Watch - Bond Yields - Euro Area Chart II-2Indicators To Watch - Bond Yields - Europe Ex Euro Area Chart II-3Indicators To Watch - Bond Yields - Asia Chart II-5Indicators To Watch - Bond Yields - Other Developed Indicators To Watch - Interest Rate Expectations Indicators To Watch - Interest Rate Expectations Chart II-6Indicators To Watch - Interest Rate Expectations Chart II-7Indicators To Watch - Interest Rate Expectations Chart II-8Indicators To Watch - Interest Rate Expectations
Underweight Housing stocks have been resilient to rising interest rates for the most part of the year, but now macro headwinds are taking over this consumer discretionary sub-sector and we recommend a below benchmark allocation. Rising mortgage rates (up 35 bps YTD), and skyrocketing housing prices (up 15% YoY), are starting to hurt housing affordability, suppressing demand, and putting downward pressure on homebuilders’ revenue. To make things worse, oriented strand board prices remain on the ascent despite the outright bear market in lumber futures. The cost of labor is on the rise, too, increasing homebuilders’ expenses. Falling revenue and rising costs are a poisonous cocktail bound to hurt homebuilders’ profitability, putting a halt to what has been a strong run and making them an excellent candidate for an underweight allocation. Looking beyond this macro soft patch, once headwinds dissipate, we will be adding to homebuilders as the industry has compelling long-term prospects: US consumers are facing a housing shortage to the tune of five million units as construction was running under the trend over the past decade. Bottom Line: We are underweight the S&P homebuilding index. The ticker symbols for the stocks in this index are: BLBG: S5HOME – LEN, PHM, DHI, NVR.
Underweight High-Conviction While our underweight homebuilders call has been offside of late, we are sticking with it given the recent turn in some crucial data series. Interest and mortgage rates are a key determinant for the industry’s relative performance, and given the sell-off in the bond market, it is only a question of when, not if, US building permits will play catch up to the downside (mortgage rates shown inverted, middle panel). If rising mortgage rates (although from a low base) is not enough to cool down the US housing market, then an astronomical rise in lumber prices will likely weigh on it soon. As a reminder, framing lumber accounts for 15-20% of the total cost of building a home (bottom panel). Before long, this input cost inflation will eat into homebuilders’ margins and thus cut into profits. Bottom Line: We reiterate our cyclical and high-conviction underweight stance in the S&P homebuilding index. The ticker symbols for the stocks in this index are: BLBG: S5HOME – LEN, PHM, DHI, NVR.
Today we close two high-conviction trades and place a stop buy order for the June 2021 expiry VIX futures as a hedge to the remaining positions. Homebuilders have proven to be more resilient than we expected, especially given the selloff in the bond market. Clearly the US consumer is not concerned about a rebound in rates, at least not yet. Moreover, the looming fiscal stimulus will only facilitate more excesses, even in the residential housing market, as a fresh wave of liquidity will likely more than offset the tightening in monetary conditions. Thus, we have lost confidence in our high-conviction underweight stance in this niche consumer discretionary group and are taking a loss of 11% since inception. The S&P consumer staples sector was a natural high-conviction underweight given our end-2021 4,000 SPX target that we arrived at on the November 9 Special Report. Now that the market is within spitting distance of our target, the risk reward is no longer as favorable as it used to be for this defensive sector. Thus, we are closing this high-conviction trade today for a gain of 8% since inception. Finally, we successfully capitalized on our long VIX futures hedge to the tune of 19% recently, but given that volatility is settling down, it pays to institute a stop buy order for the June 2021 expiry VIX futures near the 25 mark. Bottom Line: Close the S&P consumer staples and the S&P homebuilding high-conviction underweights for 8% and -11% returns, respectively since the December 7 inception; and place a stop buy order for the June 2021 VIX futures at the 25 level.
In the January 19th Special Report we instituted a long S&P REITs / short S&P homebuilders pair trade with a 10% stop loss. Yesterday, our stop was triggered and we are obeying it and closing this pair trade. Among other reasons, one of the macro drivers that compelled us to put this pair trade on was the 10-year US Treasury yield: historically the correlation between the relative share price ratio and interest rates would snap positive especially following a recession. Hence, a pullback in yields was also a key risk we highlighted for this pair trade. The 10-year US Treasury yield peaked near 1.19% and has continued to correct breaking below 1.04%, which at the margin boosts the allure of homebuilding stocks and consequently put our pair trade offside. While the original reasoning for putting this pair trade on remains intact, we refrain from fighting the trend and opt to move to the sidelines for the time being. We will be on the lookout for a better-timed entry point in the near future. Bottom Line: Obey the trailing stop and close the long S&P REITs / short S&P homebuilders pair trade for a loss of 10%.
Underweight We deem that most, if not all, of the good news (low mortgage rates, low inventories, high demand, work-from-home reality, all-time highs on the overall NAHB housing sentiment survey) is already priced in galloping homebuilders stock prices and exuberant expectations. If our economic reopening thesis proves accurate next year, then the COVID-19 winners – homebuilders included – will take the back seat. Historically, interest rates and relative share prices have been inversely correlated and a steep selloff in the bond market is bad news for homebuilding stocks (top panel). On the operating housing front, some cracks are forming. New home sales, while brisk in absolute terms, are losing out to existing housing sales and homebuilders have resorted to price concessions in order to drive volumes (second & third panels). Profit margins are at the highest level since the subprime crisis and are vulnerable to a squeeze courtesy of rising input costs. Framing lumber comprises roughly 15% of a new home’s commodity related costs and lumber prices have been expanding all year long (bottom panel). Bottom Line: Put the S&P homebuilding index to the high-conviction underweight call list. The ticker symbols for the stocks in this index are: BLBG: S5HOME – LEN, PHM, DHI, NVR.
Dear client, Next Monday December 14, 2020 we will be hosting our last webcasts for the year “From Alpha To Omega With Anastasios”, one at 10am EST for our US, European and Middle Eastern clients and one at 8pm EST for our Asia Pacific, Australia and New Zealand clients; our final weekly publication for 2020 will be on Monday December 21, 2020 where we will highlight our top charts of the past year. Kind Regards, Anastasios Highlights Portfolio Strategy Our high-conviction overweight calls comprise four “Back-To Work” beneficiaries, and a hedge. In marked contrast, all of our high-conviction underweights are focused on “COVID-19 Winners” that should lose some of their luster next year. Recent Changes Upgrade the S&P real estate sector to overweight, today. Feature Favorable Macro Backdrop Easy monetary and loose fiscal policies will remain intact and sustain flush liquidity conditions next year. As a result, the global economy will continue to gain traction. Importantly, early-August marked a critical economic inflection point. Gold prices peaked and 10-year real and nominal yields troughed (yields shown inverted, top & middle panels, Chart 1). The bullion and bond markets corroborated the economic recovery that equities and the ISM manufacturing surveys sniffed out in late-spring. This is important for cementing the bull market in equities which is predicated on a durable economic recovery. In other words, the rise in real yields serves as a green light for further stock gains as it signals that the economy is on the recovery path. The bottom panel of Chart 1 also highlights that non-US equity markets started sporting accelerating profit growth expectations in August. Eurozone and other ex-US bourses zoomed past the US EPS growth trajectory as the latter reached a plateau. Chart 1Inflection Point This gives us confidence that 2021 will be a bumper year for SPX profits and help carry the market higher near our 4,000 target. As a reminder, on November 9 in a Special Report, we lifted our EPS estimate to $168 for calendar 2021 and introduced an end-2021 SPX target of 4,000 (Chart 2). Chart 2Earnings Will Do The Heavy Lifting In 2021 Two Risks To Monitor Nevertheless, the bond market represents a risk to our sanguine equity market view. Simply put, if the 10-year US Treasury yield stalls, then it will also stop the rotation trade in its tracks. The budding improvement in the Chinese and EM economic cycles will likely be sustainable next year, consistent with the Chinese four-year cycles of the past twenty years (Chart 3). Each up-cycle has typically been driven by credit expansion and capital spending, on the back of fiscal and monetary easing. These conditions are in place once again. Chart 3Follow The Chinese Four-year Cycle We recently showed that China’s fiscal easing will likely continue to grease the wheels of global trade into mid-2021 and thus debase the greenback (Chart 4), but will likely run out of steam in the back half of next year. Thus, China’s reflation going on hiatus is another key risk we will monitor in 2021 that could serve as a growth scare catalyst and reset stocks. Chart 4Laggard Deep Cyclicals Have The Upper Hand Year In Review 2020 is a year to forget as far as the coronavirus human toll is concerned; the economic and EPS recessions, while short lived, were deep. The COVID-19-inflicted wounds, especially to services industries the world over, were deep and there will be severe scarring. Early in the year, equities felt the COVID-19 tremor and collapsed 35% from the February 19 highs, but extremely aggressive monetary and fiscal policy responses filled the void and were the dominant themes in the ensuing recovery that saw the SPX vault to all-time highs. Our portfolio was resilient and was able to absorb the COVID-19 shock as we were bulletproofing it in the back half of 2019 and early-2020 for a recession owing largely to the yield curve inversion. Importantly, we were not dogmatic and on March 16 we turned cyclically bullish. This eventually culminated into the March 23 Strategy Report where we penned 20 reasons to start buying stocks and coincided with the trough in the SPX. This cyclical shift in our view from bearish-to-bullish aided our portfolio performance as we started adding cyclical exposure and trimming defensive exposure in order to benefit from the immense monetary and fiscal policy responses. Early on, we deemed these macro forces were forceful enough to really turn things around and we remained bullish on a cyclical time horizon. All in all, our trades produced alpha to the tune of 425bps. While our pair trades were sub-par (as is custom we are closing the remaining today), our high-conviction trades and cyclical portfolio moves recorded solid gains (please see the final tally below). Ray Of Light Encouragingly, there is light at the end of the tunnel, as a number of vaccines will become available late this year and/or early in 2021. This is great news for the economy and for stocks. We have positioned the portfolio to benefit from the reopening of the economy and the vaccine will act as an accelerant as our flagship publication posited last week while documenting BCA’s upbeat Outlook for 2021. Our portfolio enjoys a cyclical-over-defensive bent, has a small cap bias and we remain committed to the “Back-To-Work” basket versus the “COVID-19 Winners” basket (Chart 5). In the short-term, equities have discounted a lot of good news, which is likely to steal from next year’s returns. However, as populations get inoculated and large parts of the global economy reopen, a virtuous cycle of increasing consumer and business confidence would boost investment and GDP and prove a boon for corporate profits. Already the rally is broadening out with the value line arithmetic and geometric indexes outshining the SPX (Chart 6). An active ETF (RVRS:US) that has a reverse weighting to US large caps is also besting the S&P 500 and signals that more gains are in store in the New Year, especially for the still beaten down deep cyclical laggards. Chart 5Stick With The Reopening Trade Chart 6Rally Is Broadening Out, And That’s Healthy More Overweights Than Underweights As is custom every year, this Strategy Report introduces our high-conviction calls for 2021. This year we have four overweights, a bonus volatility trade on the long side, three underweights, and a bonus structural trade that we add to our trades of the decade first introduced in mid-December 2019. Our overweights comprise three “Back-To-Work” beneficiaries, a great rotation trade and a hedge. All of our underweights are focused on “COVID-19 Winners” that should lose some of their luster next year. Finally, this year we take a page out of Byron Wien’s annual “10 surprises” list and offer our clients three “also rans”, which got close but ultimately failed to make our high-conviction list. Anastasios Avgeriou US Equity Strategist anastasios@bcaresearch.com Overweight Hotels (Back-To-Work Theme) The recent positive vaccine news is a key reason we are warming up to this consumer discretionary sub group. While neither lodging nor cruise line vacationing will return to their previous peaks any time soon, both industries will survive and thus should no longer be priced for bankruptcy. One key industry demand determinant is confidence. Consumer sentiment has staged a W-shaped recovery. It is still flimsy, but the vaccine efficacy news should catapult confidence higher in the coming quarters. The implication is that the wide gulf between consumer confidence and relative share prices will narrow via a catch up phase in the latter (top panel, Chart 7). Moreover, the ISM non-manufacturing survey is on a sling shot recovery following the bombed out spring readings. This rebound also suggests that the path of least resistance is higher for lodging stocks (second panel, Chart 7). Our hotel demand indicator does an excellent job in encapsulating all these different forces and forecasts an enticing lodging services demand backdrop into 2021 (third panel, Chart 7). Already, consumer outlays on hotels are staging a comeback, albeit from an extremely depressed level. The upshot is that an earnings-led bounce is in the cards (fourth panel, Chart 7). Finally, washed out technicals and extremely alluring valuations provide an attractive reward/risk tradeoff at the current juncture (bottom panel, Chart 7). Bottom Line: The S&P hotels, resorts & cruise lines index is a high-conviction overweight. The ticker symbols for the stocks in this index are: BLBG: S5HOTL – MAR, HLT, CCL, RCL, NCLH. Chart 7Buy Hotels Overweight Real Estate (Back-To-Work Theme) Boost the S&P real estate sector all the way to overweight today, in order to benefit from the looming full reopening of the economy on the back of the vaccine’s arrival. We have been bearish this niche S&P sector and delivered alpha to our portfolio both via the cyclical and high-conviction underweights this year. Nevertheless, we do not want to overstay our welcome and the time is ripe for a bullish commercial real estate (CRE) stance. The bearish story is well known, but some bullish undertones are widely neglected. The rebound in relative share prices is substantially trailing the 2009 episode, when REITs outshined the SPX by 65% one year following the March 2009 trough. Currently, on a similar SPX advance from the March 2020 lows, REITs are lagging the S&P 500 by 22% (top panel, Chart 8). As large parts of CRE have been at the epicenter of the pandemic, any return to even semi-normalcy in 2021 should see these beaten down stocks sling shot passed the SPX. When the fiscal package finally passes, it will likely serve as a fresh reflationary bridge to support the economy. The proverbial “kicking the can down the road” will thus lift some uncertainty hanging over CRE landlords receiving rents and also via banks not foreclosing distressed properties which would have further depressed CRE prices. CRE prices will likely recover in the New Year as vulture funds and opportunistic investors are already bargain hunting. Tack on the likely refinancing lifeline bankers will extend to CRE debt originators (middle & bottom panels, Chart 8) and such a backdrop will loosen the noose around distressed property landlords. Bottom Line: Boost the S&P real estate sector to an above benchmark allocation and add it to the high-conviction overweight call list. Chart 8Upgrade Real Estate To Overweight Overweight Industrials (Back-To-Work Theme) Add the S&P industrials sector to the high-conviction overweight list. Emerging markets (EM) and China represent the key source for the sector’s buoyancy. The EM manufacturing PMI clocking in at 53.9 hit an all-time high (top panel, Chart 9). China’s PMIs are also on a similar trajectory, and the Chinese Citi economic surprise index has swung a whopping 277 points from -239 to +38 over the past nine months (second panel, Chart 9). The upshot is that US industrials stocks should outperform when China and the EM are vibrant. Peering over to the currency market, the debasing of the US dollar should also underpin industrials stocks via the export relief valve. A depreciating greenback also lifts the commodity complex and hence industrials equities that are levered to the extraction of commodities and other derivative activities (middle panel, Chart 9). Capex intentions are firming and CEO confidence is upbeat for the coming six months. The ISM manufacturing new orders-to-inventories ratio is corroborating the budding recovery in the soft data. Green shoots are also evident in hard data releases. Durable goods orders are on the verge of expanding anew (fourth panel, Chart 9). Sell-side analysts have never been more pessimistic with regard to the sector’s long-term EPS growth rate that is penciled in to trail the broad market by almost 800bps (bottom panel, Chart 9)! This bearishness is contrarily positive as a little bit of good news can go a long way. Bottom Line: The S&P industrials sector is a high-conviction overweight. Chart 9Overweight Industrials Overweight Small Caps At The Expense Of Large Caps (Rotation Trade) Recent vaccine efficacy announcements have paved the way for a sustainable great rotation trade into small caps and out of large caps. One of the key small size bias drivers is the delta in sector composition between the small and large cap indexes. The relative gap in deep cyclicals alone is 13% as we highlighted in recent research. Relative share prices remain far apart from the budding recovery in the commodity complex including Dr. Copper’s flirtations with seven-year highs. Thus, the small caps catch up phase has a long ways to go (top & fourth panels, Chart 10). The financials sector gulf is also significant, with small caps’ exposure relative to their large cap brethren clocking in at over 700bps. Already, the yield curve is steepening and there are high odds of a selloff in the bond market as the economy continues to reopen (third panel, Chart 10). In addition, easy fiscal policy is a tonic to the small/large share price ratio. As a flood of money enters the economy with a slight lag, small caps will continue to make up ground lost during the early stages of the pandemic (fiscal balance shown inverted, second panel, Chart 10). Not only is fiscal stimulus providing a lifeline to debt-burdened small caps, but also the Fed’s opening up of the monetary spigots has pushed fixed income investors out the risk spectrum. Thus, the proverbial “kicking the can down the road” is boosting the allure of small cap stocks (junk spread shown inverted, bottom panel, Chart 10). Bottom Line: A small size bias is a high-conviction call for 2021. Chart 10Prefer Small Caps To Large Caps Long VIX June 2021 Expiry Futures (Hedge Trade) We want to hedge our overweight exposures with a long VIX futures position for the June 16, 2021 expiry. We are spending $25.3 to go long and are comfortable paying up for insurance when the SPX is at all-time highs and there is a risk of some growth disappointment in the next six months. Chart 11 draws a parallel with the March 2009 SPX lows and plots the VIX in 2009 and 2010. While the path of least resistance is lower for volatility, sporadic surges are typical in the year following recessions. The S&P 500 also troughed in March 2020 and if history is an accurate guide, the path to SPX 4,000 will be rocky next year. As a reminder, the S&P 500 suffered a 16% correction in May 2010 and the VIX spiked higher. Positioning remains lopsided with both VIX put/call ratios (volume and open interest) at historically high levels, underscoring investor complacency. Net speculative futures positions as a percent of open interest are also probing multi-year lows, corroborating the complacent options data. Finally, the equity volatility curve has flipped from a 10% backwardation to a steep contango in the past month with the 3rd month now trading at a 25% premium to spot VIX; such a complacent level typically warns of a looming spike in the VIX. Bottom Line: Go long the VIX June 2021 futures as a small hedge to overweight equity positions. Chart 11Go Long VIX Futures As A Hedge Underweight Homebuilders (COVID-19 Winner Theme) We deem that most, if not all, of the good news (low mortgage rates, low inventories, high demand, work-from-home reality, all-time highs on the overall NAHB housing sentiment survey) is already priced in galloping homebuilders stock prices and exuberant expectations. While being contrarian is fraught with danger, because more often than not the herd is right, there is a key macro driver that gives us confidence to be bearish homebuilders: interest rates. If our economic reopening thesis proves accurate next year, then the COVID-19 winners – homebuilders included – will take the back seat. Historically, interest rates and relative share prices have been inversely correlated and a steep selloff in the bond market is bad news for homebuilding stocks (top panel, Chart 12). On the operating housing front, some cracks are forming. New home sales, while brisk in absolute terms, are losing out to existing housing sales and homebuilders have resorted to price concessions in order to drive volumes (second & third panels, Chart 12). Profit margins are at the highest level since the subprime crisis and are vulnerable to a squeeze, not only from lower selling prices, but also from rising input costs. Framing lumber comprises roughly 15% of a new home’s commodity related costs and lumber prices have been expanding all year long (bottom panel, Chart 12). Bottom Line: Put the S&P homebuilding index to the high-conviction underweight call list. The ticker symbols for the stocks in this index are: BLBG: S5HOME – LEN, PHM, DHI, NVR. Chart 12Avoid Homebuilders Underweight Pharma (COVID-19 Winner Theme) The S&P pharmaceutical index is a high-conviction underweight for 2021. On the macro front, the Fed’s ZIRP bodes ill for defensive pharma equities. The Fed was uncharacteristically quick this recession to drop rates to the lower zero bound to reflate the economy. As a result, safe haven equities, Big Pharma included, typically trail the broad market as the economy gets out of the ER and into the recovery room (second panel, Chart 13). Importantly, relative pharmaceutical profits are highly counter cyclical: they rise at the onset of recession and collapse as the economy heals. Currently, as the world economy has transitioned to a V-shaped recovery, the reopening of the economy into the New Year will continue to knock the wind out of relative pharma profitability. Similarly, an appreciating greenback has historically been synonymous with pharma outperformance and vice versa (third panel, Chart 13). Keep in mind, Big Pharma make the lion’s share of their profits domestically, further cementing the positive correlation with the US dollar. This local profit sourcing represents one of the main reasons why politicians on both sides of the aisle are after domestic pharma profits. Pharma prices are on the cusp of contracting. Importantly, President Trump’s late-July executive order “to allow importation of certain prescription drugs from Canada” among other provisions is a direct blow to the profit prospects of Big Pharma (bottom panel, Chart 13). Bottom Line: We are cognizant that the COVID-19 vaccine will lift Big Pharma, but only temporarily, as cyclical forces will more than offset the positive vaccine news. The S&P pharmaceuticals index is a high-conviction underweight. The ticker symbols for the stocks in this index are: BLBG – S5PHARX: JNJ, PFE, MRK, LLY, BMY, ZTS, CTLT, MYL, PRGO. Chart 13Sell Pharma Underweight Consumer Staples (COVID-19 Winner Theme) Countercyclical consumer staples stocks served their purpose and supported our portfolio in the front half of 2020. Now that vaccines are coming, we are adding the S&P consumer staples sector to the high-conviction underweight call list. The current macro backdrop underscores that the path of least resistance is lower for relative share prices. Not only is the ISM manufacturing survey on fire, but also, consumer confidence is forming a trough (ISM manufacturing shown inverted, second panel, Chart 14). One of the factors that will drive relative earnings lower is the weaker US dollar. As a reminder, the S&P consumer staples sector derives approximately 32% of its sales from abroad, which is 10 percentage points lower than the S&P 500. As a consequence, on a relative basis, staples stocks benefit much less than the rest of the market from a falling currency (third panel, Chart 14). Our relative macro earnings model does an excellent job in encapsulating all these moving parts and paints a dark profit picture for this GICS1 sector in the New Year (fourth panel, Chart 14). Bottom Line: The S&P consumer staples sector is a high-conviction underweight. Chart 14Underweight Consumer Staples Short NASDAQ 100 / Long S&P 500 (Secular 10-year Call) We first wrote about the extreme market cap concentration in January when we were cautioning investors of an SPX drawdown and drew parallels with the dotcom era. Back in late-1999/early-2000 the top 5 stocks comprised 18% of the S&P 500. In July we delved deeper and split the S&P 500 in the S&P 5 versus the S&P 495 to highlight the extraordinary narrow returns since 2015. Such extreme concentration in a handful of tech titan stocks is clearly unsustainable. The bullish case for tech is well documented and understood; the COVID-19 pandemic acted as an accelerant to the technological adoption of the new remote working realities. However, $2tn valuations (AAPL, MSFT & AMZN) make little sense to us, especially if there is little earnings follow through and most of the returns are explained by multiple expansion. In all likelihood, the easy money has been made. Going back to the early 1970s is instructive in order to put the tech juggernaut into proper perspective. Every decade or so there have been clearly defined booms and busts in US tech stocks (Chart 15). Schumpeter’s “creative destruction” forces are undoubtedly at play. What is interesting is that not only have tech stocks likely stalled near the dotcom era peak, but also they have been outperforming since the end of the GFC (i.e. roughly a decade); they are due for at least a breather. If history rhymes, we have entered a new bust cycle and the tech sector’s underperformance will play out over the coming decade. Bottom Line: We are compelled to add to our structural trades and recommend investors underweight the tech sector on a ten-year time horizon via the short QQQ / long SPY exchange traded funds which offer the most liquidity. Chart 15Short QQQ / Long SPX For The Next Decade Also Rans Within consumer discretionary, automobiles & auto parts & components piqued our interest from the long side. These stocks would greatly benefit from a reopening economy as a semblance of normality returns sometime next year. Nevertheless, two key factors kept us at bay. First, similar to homebuilders, this index has gone vertical since the March lows, besting the SPX by a factor of 2:1 (top panel, Chart 16). We maintain exposure via our “Back-To-Work” basket with GM, but even this auto manufacturer is up 50% since the September 8, 2020 inception. Finally, TSLA is about to enter the SPX at a stratospheric valuation that would dominate the automobile sub group. This is eerily reminiscent of YHOO’s SPX inclusion in late-1999 that led the dotcom bubble peak by four months. The parallel is making us nervous, therefore we are staying patiently on the sidelines. On the underweight side we wanted to include the niche S&P semi equipment index, but opted not to as the Bitcoin mania has really pushed these stocks to the stratosphere (middle panel, Chart 16). In addition, this chip sub-group has one of the highest export exposures in the SPX with a large slice of foreign revenue originating in China. Hence, news of a Biden presidency also served as a catalyst to propel them higher (i.e. at the margin, a less hawkish president on the Sino/American trade war). We really struggled with global gold miners (GDX:US). Our initial thinking was to downgrade them to underweight (from currently neutral), which is consistent with global growth reaccelerating and interest rates rising. However, we missed the boat when it set sail in early August (bottom panel, Chart 16). Now, the gold bearish trade is gaining momentum and has become a consensus trade as big macro investors (Tudor and Druckenmiller among others) are shifting toward Bitcoin and have been vociferous about their positioning. Thus, we preferred to remain on the sidelines with a benchmark allocation. Chart 16Three “Also Rans” Footnotes Current Recommendations Current Trades Strategic (10-Year) Trade Recommendations Size And Style Views October 26, 2020 Favor small over large caps July 27, 2020 Overweight cyclicals over defensives June 11, 2018 Long the BCA Millennial basket The ticker symbols are: (AAPL, AMZN, UBER, HD, LEN, MSFT, NFLX, SPOT, TSLA, V). January 22, 2018 Favor value over growth