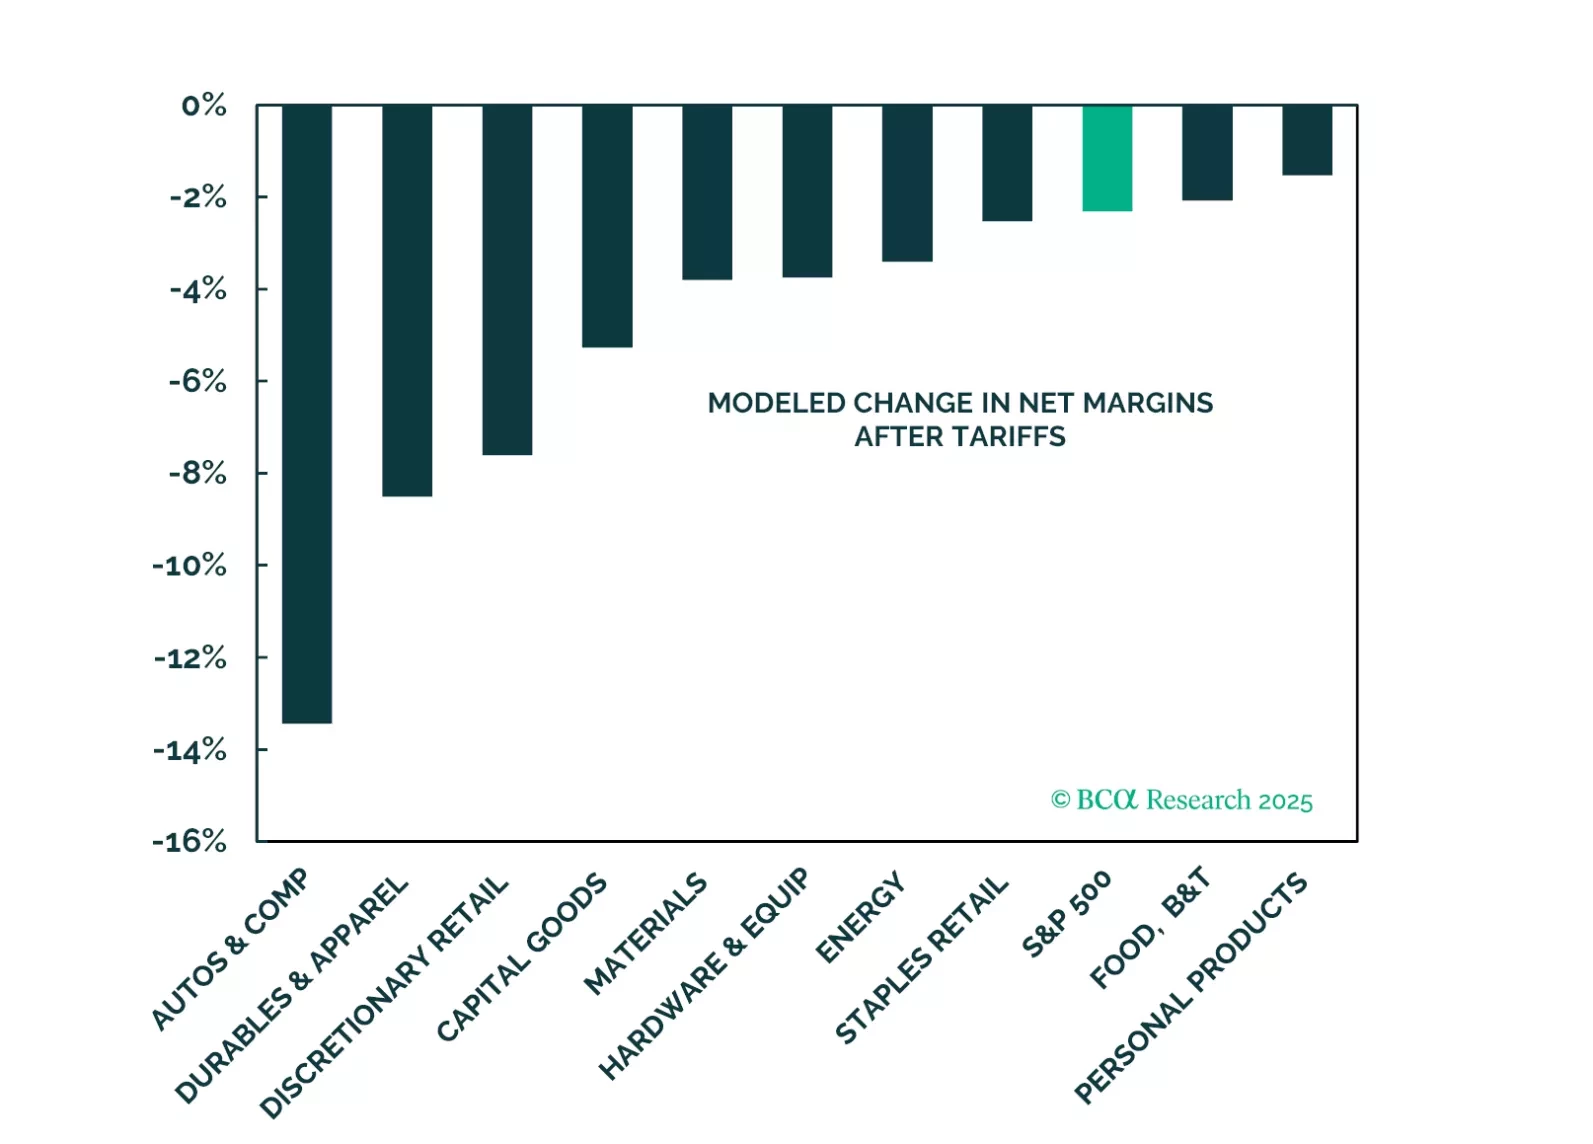
Last week, we hosted two webcasts for our clients globally to discuss the effects of tariffs on US equity sectors, preview the Q1 earnings season, and map out the trajectory of S&P 500 price performance. We also asked the webcast attendees to vote in a quick poll to gauge their views on the US economy and stock market.This report will summarize the poll results, present our research findings on the effect of tariffs on sectors' margins, and outline expectations for the earnings season.Webcast Poll ResultsQuestion #1: What Is Your Plan Of Action – Buy The Dip, Sell The Rip, Or Do Nothing?The question is highly relevant, as equities are down sharply from their recent highs and “up days” are luring investors back into the market.Across all the regions, investors choose caution.The “do nothing” option won 37% of votes, as investors wisely concluded that this is a trader’s market (Chart 1). “Selling the rip” garnered 36% of votes. “Buying the dip” had a surprisingly large following, with 27%. We are guessing that these investors expect a relief rally to run a while longer. However, optimists are a rare breed these days!Our Take: The poll results suggest a lack of consensus, unsurprising in markets clouded by policy uncertainty. Yet, if things get better, plenty of marginal buyers are on the sidelines. Question #2: What Is Your 2025 Target For The S&P 500?68% of respondents expected a range-bound market, with the S&P 500 ending the year between 4,500 and 5,500 (Chart 2).18% voted for the S&P 500 ending the year below 4,500, and 14% voted for the target above 5,500.This is a marked difference from our February 11th poll, in which only 32% voted for a year-end target below 6,000, with the majority opting for a higher target. What a difference two months make!Our Take: Investors' confidence has been shattered, and capitulation is waiting in the wings! If we were to vote, we would go with the consensus. However, our bias is to the downside: We expect the S&P 500 to end the year between 4,500 and 5,000. We showed how we get to these numbers in a recent Strategic Insight.Question #3: What Is A Likely Economic Scenario For The Rest Of 2025?Recession: This scenario garnered 46% of the vote (Chart 3).Stagflation got 36%.The “Moderate growth, contained inflation” scenario, the most optimistic outcome, gathered only 18% of the votes.Our Take: Investors’ mood is dour, and 82% of respondents expect an economic calamity. This aligns with our other questions and explains the “sell the rip” sentiment and the pessimistic year-end target.Question #4: Which Cohort Will Outperform In 2025: Cyclicals Ex Tech, Tech, Or Defensives?Defensives: Seventy percent of investors voted for this usually boring cohort. This is also a significant shift from two months ago, when investor preferences were evenly split between Defensives and Cyclicals ex Tech (Chart 4). Tech still has a small following and got 12% of the votes. This is 5% less than in February.Cyclicals ex-Tech received only 15% of the votes.Our Take: This somber positioning reflects concerns about the US economic outlook and the potential damage of tariffs and a trade war. We are also positioned defensively: We are overweight Consumer Staples, Utilities, and Pharma, and are underweight Consumer Discretionary and Financials. We have recently closed overweights in Telecoms and underweights in Tech to book profits. The Effect Of Tariffs On Sector MarginsHow It All StartedThe current trade policy standoff has been in the making for years. This section offers a brief overview of its origins. US manufacturing capacity has been stagnant for the past 20 years, real core goods orders have been trending down, and US manufacturing employment has declined by 30% since 2000 (Charts 5 & 6). Currently, manufacturing employment accounts for only 8% of total US employment. The reason for the lack of capacity expansion over the past 20 years has been outsourcing and the shift of production to other countries, especially China. The peak in US manufacturing capacity and employment occurred after the massive Asian currency devaluation in 1998 and China’s WTO admission in 2001. Consider this: In 1999, the value of Chinese goods exports came to only about a tenth of the US’s, and was less than Sweden’s. In 2008, China would surpass the US as the world’s top exporter of goods (Chart 7).The semiconductor sector, which has recently come into the limelight, is a case in point: From 1990 to 2025, the percentage of chips manufactured in the US fell from 37% to 11%, with the lion’s share of chips manufactured in Asia. It is a poster child of the “designed in the US, made abroad” trend prevalent in multiple industries.There is more. As Justin Lahart observed in his WSJ piece: In 1980, manufacturing accounted for 39% of the US jobs where workers earned high wages (after adjusting for factors such as education). By 2021, it had dropped to 20%. Over the same period, the share of high-paying jobs in the finance, professional, and legal industries jumped from 8% to 26%. This explains the gripe of the MAGA base.In addition to falling employment and a dearth of well-paying jobs for less educated Americans, the question of national security and dependency on other countries, including a geopolitical rival, China, has recently come to the fore. For example, the entire US produces as many ships as one shipyard in China. Another example is the mining and processing of rare earths. While the US has abundant supplies of rare earths and critical minerals—the US mines around 12% of the world’s supply—it lacks the manufacturing capacity to process them. As such, about two-thirds of raw minerals mined in the US are shipped to China, which is responsible for 85% of the world’s rare earth refining. Chinese companies then turn the ore into the final product—rare-earth magnets—and export the magnets back to the US. There are more examples of how US deindustrialization has started to favor its geopolitical rival, China. The dependency on other producers, such as Taiwan or Vietnam, also presents risks, as many of the top US outsourcing destinations are within the orbit of Chinese influence or are threatened by it.Significantly, as the US share of global goods exports has been shrinking, its service exports have been rising, increasing from $298 Bn USD in 2000 to $1,026 Bn USD in 2023. However, concerningly, the US share of global service imports has also been stagnant (Chart 8). Rejuvenating The US Industrial Base Is A Bipartisan PriorityOver the past few years, re-industrialization of the US and onshoring have become a bipartisan priority. The Chips Act, passed by the Biden administration, aimed to reverse the trend of the “designed in the US, made in Asia” semiconductor production process for national security reasons. The Inflation Reduction Act and Infrastructure Act also aimed to boost the country's industrial base and renew its infrastructure – an estimated $2.7T of public funds have been allotted to this end (Table 1). For a while, this worked, and onshoring picked up, creating jobs (Chart 9). The trouble is that it will be hard to improve US manufacturing employment meaningfully: According to Harvard University economist Gordon Hanson, a 30% increase in manufacturing jobs would only bring manufacturing’s share of private employment up to about 12%. However, even if manufacturing employment is unlikely to return to the US and most of the work will be done by robots—the US has the lowest robotization level of all developed countries (Chart 10)—having an industrial policy and rebuilding strategic industries is a worthwhile objective. The slap-dash reciprocal tariffs are unlikely to achieve this: There is little appetite in the US for making sneakers. Supply Chains Are Truly GlobalRe-industrialization is such a great challenge because modern supply chains are truly cross-border and very tightly integrated. Just look at the US's and Mexico’s top five exports and imports: The US exports Autos and parts only to get Autos back, while Mexico sends crude petroleum to the US to get gasoline (Charts 11 & 12). What Goods Is The US Importing?According to the US International Trade Commission, in 2024, the US imported $3.25T of domestic goods, with $430B from China and $2.8T from the rest of the world. Healthcare, Technology, Industrials, and Materials import the most (Chart 13). Pharmaceutical imports are exempt from new tariffs, but the Trump administration has opened an investigation under Section 232 of the Trade Expansion Act of 1962. Computer chips are subject to the same investigation.Regarding exposure to China, Consumer Discretionary, Industrials, and Tech top the list (Chart 14). In fact, in 2024, 29% of all the Chinese goods imported went to the Consumer Discretionary sector, 24% to Tech, 23% to Industrials companies, and 13% to Materials (Chart 15). Tariff RatesDuring his first term, Trump introduced tariffs on Chinese goods, which the Biden administration has maintained. According to our analysis of the tariff data, in 2024 US companies paid on average around 19.3% on imports from China and 4.1% on imports from other countries (Chart 16).With Chinese tariffs now set at an extraordinary 145%, Consumer Discretionary, Industrials, and Materials will bear the brunt of the trade standoff. Technology has dodged the bullet for now.However, sectors and companies that import from countries other than China will still feel the pain: Even with the recent pause on reciprocal tariffs, their existing tariff rates of 3-5% have increased to the across-the-board rate of 10%. The cost of tariffs will be split among the exporters, US companies, and their customers. How this will pan out depends on the exporting country, industry, and individual companies. Can Companies Pass On The Tariffs To Their Customers? Each company (and industry/sector)'s ability to pass cost increases onto customers depends on its pricing power, which is a function of demand for the product, the degree of competition in the industry, and the availability of substitutes. This is a complex dynamic that is the domain of the stock pickers.However, from a top-down perspective, we observe that the sectors that import the most—Industrials, Consumer Discretionary, and Materials—do not have the pricing power to pass on price increases to customers (Chart 17).The implication is that tariff increases may not lead to a stepwise surge in prices and unleash a new bout of inflation, but will likely be absorbed by companies.Tariffs Will Weigh On Profit MarginsIf companies can’t pass on cost increases to their customers, they will have to sacrifice their profitability. While the S&P 500 has enjoyed a margin expansion over the past decade, with the net margins reaching 13.4%, much of that is down to a surge in the profitability of the Technology sector (Chart 18). Once we exclude Tech, the S&P 500 operating margin is only 10.6%.Worse yet, sectors that are the largest importers, such as Consumer Discretionary, Industrial, and Materials, have some of the lowest margins in the index (Chart 19). Tariffs will increase their Cost of Goods Sold (COGS), a charge that will flow through the entire income statement.If our analysis and underlying assumptions are correct and companies won't be able to raise prices much, then a margin squeeze is the most likely outcome of the new trade policy. And as companies strive to preserve their profitability, they may be forced to cut expenses elsewhere. Labor force reduction may follow. Tariffs Will Result In Lower Margins And Lower MultiplesWe have run a quick analysis to estimate the effect of higher tariffs on each sector's profit margins. We model an increase in COGS. We include the table of our calculations in the appendix. We used the following rules:We assume that only industry groups in the “goods” category are affected by the tariffs. Industry groups currently exempt from new tariffs, such as Hardware and Equipment and Pharma, will not see a tariff-related increase in COGS. We also apply industry-specific tariffs such as a 25% tariff rate on steel, aluminum, and cars.Half of all COGS of the “goods” industry groups will be affected by the tariffs. We estimate the increase in the 2024 tariffs by calculating a weighted average tariff rate for China and the rest of the world, based on the source of imports. “Rest of the world” countries are assigned a 90-day exemption rate of 10%. New tariff rates on China are pegged at the 54% pre-retaliation rate: A 145% tariff rate on Chinese goods will choke off all trade with China and is non-sustainable. We expect a negotiation and a bilateral agreement.Our analysis indicates that once these rules are applied, the S&P 500 net margin will decrease from 13.4% to 11.2%, which is a 2.2% margin squeeze. Industry groups within the Consumer Discretionary sector, such as Auto & Components, Durable Goods, and Retailing are most exposed (Chart 20). In our earlier analysis of the Fair Value PE NTM, we assumed that, based on our model, if the operating margin declines by 2%, the FV PE will decline from 19x forward multiple to 17x (Table 2). How About Retaliation?So far, aside from China, few countries have chosen a path of trade war with the US, opting instead for negotiations and bilateral agreements. However, the US can also get squeezed if negotiation fails, even if it is a relatively closed economy. In 2024, the US exported $1.6T worth of goods, $125B (8%) of which went to China. Considering that trade with China is practically frozen until a new deal is done, it is heartening that it is only a small amount. Food (Consumer Staples), Technology, and Industrials dominate exports to China. However, it is important to remember that services, not goods, are the US's key exports. Thus, US multinationals with a significant share of revenue derived from abroad are most vulnerable. Companies in the Communications (Media and Entertainment), Technology, and Materials sectors are the most international (Chart 21).The European Union has been edging to regulate and tax US big tech for years and may double down on its efforts. Regarding Materials, China has signaled that it will withhold some rare earth minerals. This is a potent threat since, as discussed above, most of the refining occurs in China. Last, many US exporters may end up in the crosshairs of the trade war—the ban on Nvidia's H12 chips that resulted in a $5.5B write-off is a case in point. Downgrades Will AccelerateNaturally, investors are nervous about the trade war, which has sent the sectors most exposed to trade into a tailspin. Consumer Discretionary (with the number skewed by a sharp pullback in Tesla) is down as much as 24.8% from its peak, while Materials and Industrials are down 16.3% and 12.2%. Has the selloff run its course? We think not yet.First, while the valuations for the most exposed sectors are much lower than they were only a few months ago, they are not yet cheap (Chart 22). As we pointed out, tariffs will increase companies’ costs and weigh on margins and earnings growth. Analysts have already started downgrading S&P 500 earnings, with sectors most exposed to the trade war and high import duties bearing the brunt (Chart 23). While earnings growth expectations for the Materials sector are already down by 18.4%, reflecting fears of a trade war and slowing global growth, the downgrades of the other sectors have been milder and will likely gain speed. Once earnings are revised down, valuations will appear even more overextended. The US Economy Is Not The S&P 500The US stock market, and the S&P 500 in particular, is a poor proxy for the US economy. As of 2021, services comprised 78% of the US economy, while goods accounted for only 22%. The S&P 500 has a much higher exposure to “goods” industries, which represent roughly half of the index (Chart 24). As such, the effect of tariffs may be more pronounced in the index: Earnings growth and margins will contract, and an earnings recession will likely follow. Companies in the index may also have to resort to layoffs, potentially triggering a recession.However, these companies have wider margins than smaller public and privately-owned businesses. A hairdresser, who technically belongs to the service economy, may feel squeezed as he may have to pay more for scissors, shampoos, and hair dyes.Investment ImplicationsWe believe picking the tariffs' winners and losers is more effective at the company level. However, at the sector and industry level, we propose a few broad guidelines:Overweight services vs. underweight goods industries: The latter are more exposed to the trade war.Overweight sectors upstream in the value chain – tariff damage is lower for companies less exposed to imported intermediate goods.Overweight the beneficiaries of tariffs, e.g., US shipbuilders or steel producersOverweight domestic sectors – Real Estate, Telecom, Utilities.Overweight multinationals with a more favorable product mix and a larger domestic supply chain than their competitors. Overweight companies that are viable substitutes for more expensive imported goods – consider auto parts retailers vs. automakers.Greeting The Q1 Earnings SeasonThe Q1-2025 earnings season is officially open. While earnings projections for the quarter and the rest of the year remain robust, investors will be closely attuned to corporate forward guidance. After all, we are amid of a regime shift, which is ushering in deglobalization, fiscal tightening (at least compared to the profligacy of the past four years), ubiquitous denunciation of US exceptionalism, and heightened policy uncertainty.With the policy and economic backdrop deteriorating, companies will be incentivized to lower their earnings guidance significantly. Regardless of a company's particular woes, anything can be written off to the trade war, lowering the bar for potential beats. Earnings Expectations By The NumbersLet's start with the expectations.Earnings growth: Analysts expect 9.2% earnings growth in 2025 and 14.3% in 2026 (Chart 25). Q1 earnings growth is expected to be 8.1% y/y. This is a significant decline from the 14.3% expected in Q4 and 12.2% expected at the beginning of January. This is a minor downgrade compared to recent history (Chart 26). Sales growth for the quarter is pegged at 4.1%, a minor decline from the 4.9% penciled in at the start of the year. Sales are expected to grow by 4.7% and 6.1 % in 2025 and 2026, respectively. Guidance: Downgrades in earnings and sales expectations have been underpinned by the negative corporate guidance for the quarter, with the negative/positive ratio at 2.4 – which is higher than the past couple of quarters (Chart 27). We expect a lot of negative or pulled guidance for Q2 as companies process the effects of tariffs and the trade war. We anticipate an avalanche of downgrades to follow.Sector sales and earnings growth are still expected to be robust, with Healthcare and Tech projected to deliver the most growth (Table 3). Earnings of Energy, Materials, and Consumer Staples are expected to contract in Q1. Sales growth for these sectors is negative in real terms. Poor expectations are a function of concerns about the trade war, global growth slowdown, and US consumer weakness. As we showed in Chart 23 in the tariffs section of this report, expectations for these sectors have deteriorated over the quarter, and negative earnings revisions are reflected in the numbers. Bottom LineThe new US trade policy is bound to have a meaningful effect on US companies' profitability. The S&P 500's composition is skewed toward goods, and an increase in tariffs will depress profit margins and earnings growth. Earnings downgrades have already started, but they have not fully run their course. We expect more negative guidance and more downgrades. The market will bottom once lower multiples reflect a decline in profitability and lower earnings growth expectations. Irene TunkelChief Strategist, US Equity Strategyirene.tunkel@bcaresearch.comPlease follow me on LinkedInJulian CoyResearch Associatejulian.coy@bcaresearch.com Appendix