Hypermarkets
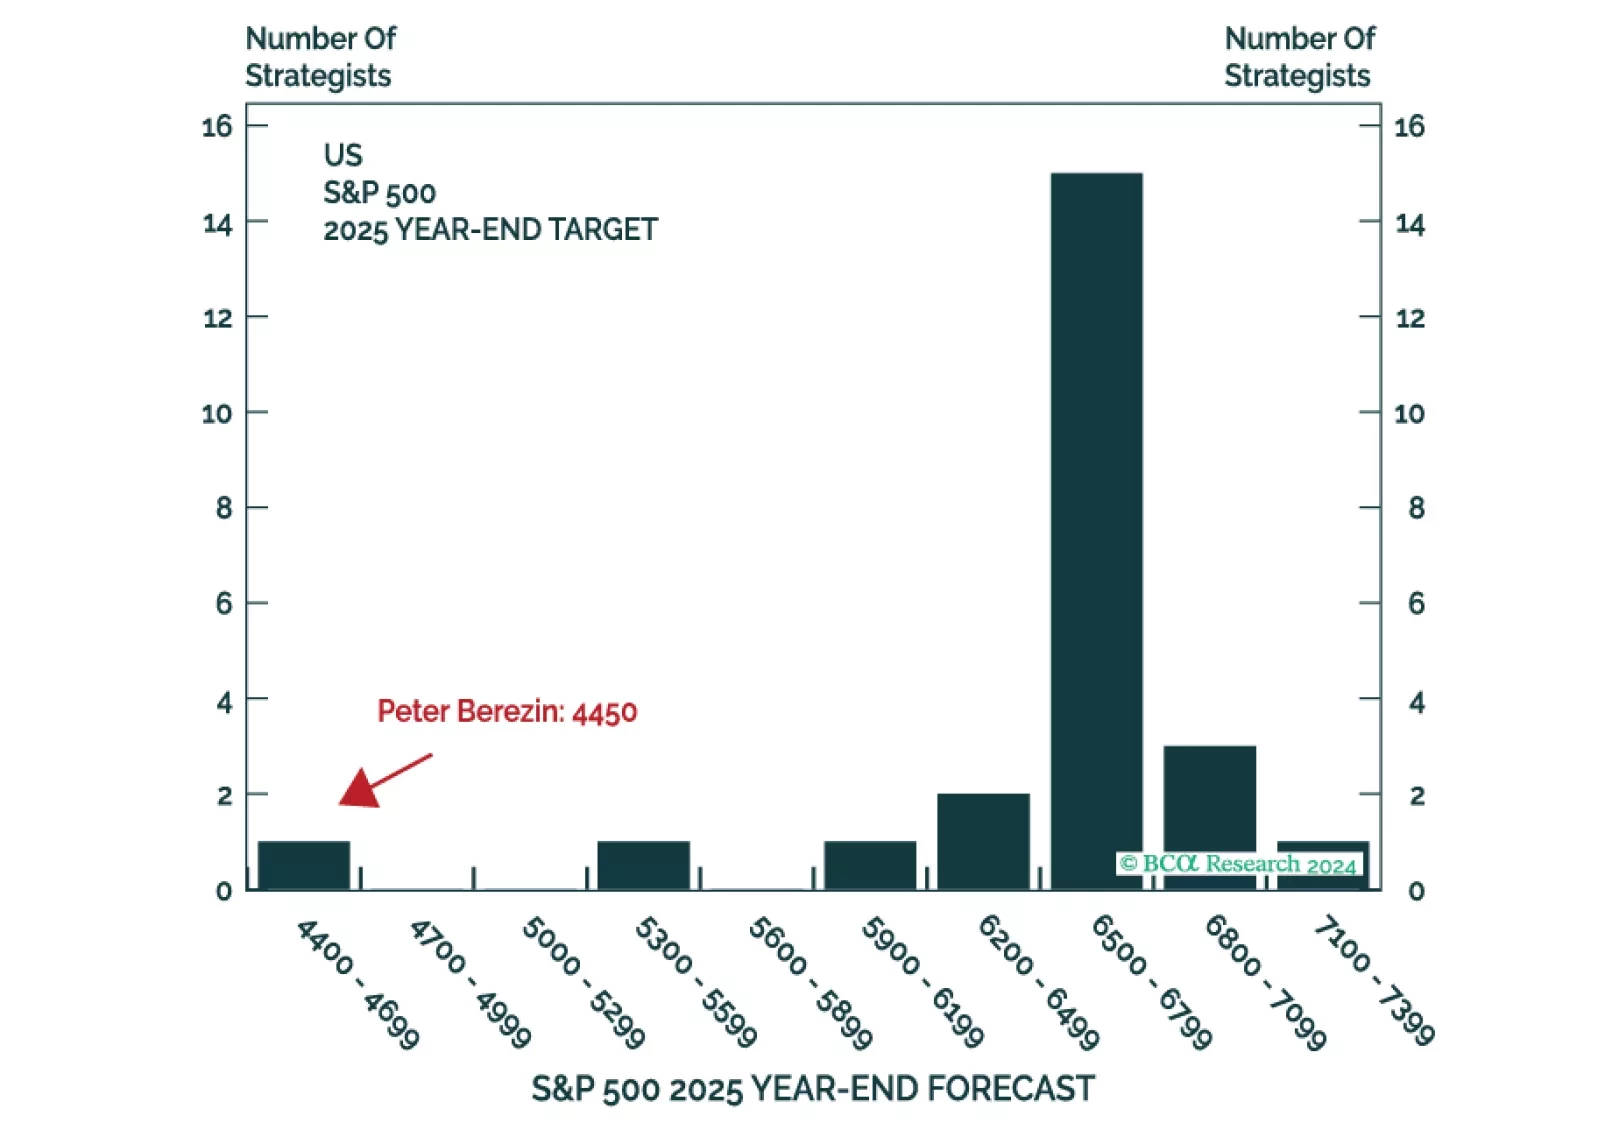
This is the time of the year when strategists are busy sending out their annual outlooks. Here on the Global Investment Strategy team, we decided to go one step further. Rather than pontificating about what could happen in 2025, we decided to harness the power of the multiverse to tell you what did happen (in at least one highly representative timeline).
Next week, please join me for a Webcast on Tuesday, December 17 at 10:30 AM EST (3:30 PM GMT, 4:30 PM CET) to discuss the economy and financial markets.
And with that, I will sign off for the year. I wish you and your loved ones a very happy and healthy 2025. We will be back in the first week of January with our MacroQuant Model Update.

Underweight “COVID-19 Winners” hypermarket equities remain a solid underweight call. Worrisomely, relative share prices recently broke down and propelled relative returns for our portfolio into the double digits since the late-August inception. While there is a number of factors that weigh on this defensive industry, today we turn our attention to the US dollar. As the greenback depreciates, it reduces the purchasing power of US importers, including Big Box retailers that source most of their goods from abroad (bottom panel, import prices shown inverted). As a result, relative margins bear the brunt of the USD’s fall – especially given that these input cost increases are difficult to pass on to the consumer – profits slip and relative share prices find an equilibrium lower. True, the US dollar has retraced part of its losses recently, but given the lag between the currency debasing and its effects on import prices and margins, the FX related damage will likely have a lasting effect (see chart). Tack on the stealing of demand from the future that these defensive retail stores enjoyed all of last year, as WMT recently admitted on their earnings call, and the revenue and profit outlooks darken further for this safe haven industry. Bottom Line: Remain underweight the S&P hypermarkets index. The ticker symbols for the stocks in this index are: BLBG: S5HYPC – WMT, COST.
Underweight We have been adding cyclical exposure to the portfolio and lightening up on defensives and as a continuation of this shift we recently downgraded the S&P hypermarkets group to underweight. The economy is reopening and thus it no longer pays to seek refuge in safe haven hypermarket equities. In fact, most of the macro indicators we track suggest the recession is over that will sustain severe downward pressure on relative share prices. The chart on the right shows that the ISM manufacturing new orders subcomponent has slingshot from below 30 to north of 60, junk spreads are probing all-time lows, consumer confidence has troughed and small and medium enterprises hiring intentions are on the mend. Bottom Line: Trim the S&P hypermarkets index to underweight. The ticker symbols for the stocks in this index are: BLBG S5HYPC – WMT, COST. For more details, please refer to this Monday’s Weekly Report.
Highlights Portfolio Strategy Softening operating metrics, the falling US dollar, the reopening of the economy, all suggest that investors should avoid hypermarket stocks. A firming macro backdrop, the USD’s recent drop, along with the bearish signals from financial variables, all concur that investors should start a program of modestly shedding consumer staples exposure. Recent Changes Downgrade the S&P hypermarkets index to underweight, today. This move also pushes our S&P consumer staples sector to a modest below benchmark allocation. Table 1 Feature In our March 23 Weekly Report, when we identified 20 reasons to start buying equities, we published a cycle-on-cycle profile (Chart 1, top panel) of how the SPX performs following a greater than 20% drawdown. History suggested that, on average, new all-time highs would emerge sometime in early 2022! Unfortunately, this assessment proved offside as the S&P 500 made fresh all-time closing highs last week, less than five months from the March 23 trough. Chart 1Overstretched Nevertheless, comparing the current unprecedented SPX rebound with the historical recessionary profile remains instructive as it highlights how excessively stretched equities currently appear. The bottom panel of Chart 1 warns that the SPX is vulnerable to a snapback, were the SPX to return to the historical mean or median recovery profile. Likely rising (geo)political risks could serve as a near-term catalyst for a healthy pullback. Importantly, all of the SPX’s return since the March lows is due to the multiple expansion and then some, as forward EPS have taken a beating (not shown). Equities are long duration assets and given the drubbing in the discount rate, the forward P/E multiple has done all the heavy lifting. Chart 2 puts some historical context to the S&P 500 forward P/E going back to 1979 using I/B/E/S data. Empirical data supports finance theory and shows that the 40-year bull market in bond prices has caused a structural upshift to the SPX forward P/E. Chart 2Moving In Opposite Directions While low rates explain the near all-time highs in the SPX forward P/E, looking ahead we doubt that the SPX multiple can expand much further if we assume that the easy assist from ZIRP is behind us and will not repeat; i.e. the Fed will refrain from wrecking the US banking system by exploring NIRP. In contrast, our analysis suggests that a selloff in the bond market is the missing ingredient that will ignite a massive rotation out of growth stocks and into value and propel deep cyclicals versus defensives to uncharted territory. More specifically, the rallies in copper prices, crude oil and the CRB Raw Industrials index need confirmation from the bond market that they are demand, rather than supply driven. This backdrop will also shift equity returns within deep cyclicals away from a handful of tech stocks and toward other beaten down high operating leverage sectors (i.e. energy, industrials and materials) as we posited in our recent August 3 Special Report “Top 10 Reasons To Start Nibbling On Cyclicals At The Expense Of Defensives”. Zooming out and observing how investors have moved capital from one asset class to the next in the aftermath of QE5 is in order (Chart 3). First, the SPX enjoyed a V-shaped recovery from the March 23 lows. Then in early-May, as we first posited in our May 11 Weekly Report, the big EURUSD up-move was set in motion and investors started piling into short USD positions taking cue from the Fed’s QE5 that was directly targeting the US dollar with liquidity swaps. The debasing of the dollar served as a global reflator. Now the final piece of the QE5 puzzle is the bond market. Chart 3 highlights that in order for QE to work, counterintuitively a selloff in the bond market would confirm that the economy is healing and is ready to start standing on its own two feet. The jury is still out. With regard to the Fed’s remaining bullets, yield curve control (YCC) is one unorthodox tool that the FOMC could choose to deploy in the coming years. On that front, turning back in time and drawing parallels with the 1940s is instructive. In 1942 the Fed, at the behest of the Treasury, pegged long-term interest rates at 2.5% and ballooned its balance sheet in order to finance the government’s expenditures during WWII. The Fed surrendered its independence, and this YCC unwarrantedly stayed in place until 1951 when in the midst of the Korean War, the Treasury-Federal Reserve Accord finally ended the peg of government long-dated bond interest rates.1 Chart 3Bonds Yields Are Left To Rally Chart 4WWII-Like Starting Point Chart 4 shows the ebbs and flows of the US government’s total debt-to-GDP ratio and fiscal deficit as a percentage of output since 1940. While the debt-to-GDP profile fell from 1945 onward owing partially to a tight fiscal ship that the US subsequently ran, it troughed when the US floated the greenback. Since then, the US has been fiscally irresponsible running large budget deficits and the debt-to-GDP ratio has never looked back and very recently went parabolic (top panel, Chart 4). Charts 5 & 6 take a closer look at some macro variables in the 1940s and Charts 7 & 8 compare them to today. Chart 5The… Chart 6…1940s… First, YCC did not prevent the late-1948 recession (Chart 5, shaded areas). Crudely put, monetary stimulus is not a panacea for boom/bust cycles. Second, M2 growth was climbing at a 30%/annum rate, the money multiplier was on a secular advance and money velocity was surging especially in the first half of the 1940s (Chart 6). As a result and as expected, YCC caused three significant inflationary jumps (bottom panel, Chart 6) that aided the US government in bringing down the massive debt-to-GDP ratio (i.e. inflating its way out of a debt trap) that it had accumulated via large deficits in the front half of the 1940s (top panel, Chart 5). Third, interest rates were a coiled spring and once the Treasury-Fed Accord was signed, they exploded higher (fourth panel, Chart 5). Finally, equities fared well during the first three years of YCC until the end of WWII, but then suffered an outsized setback until mid-1949, before recovering and taking out the 1945 highs in 1951 (bottom panel, Chart 5). Chart 7...Compared With… Chart 8…Today Were the Fed to embark on YCC in the near-future in order to monetize the US government’s deficits, there are a few parallels to draw with the 1940s especially given that the starting point of debt-to-GDP is similar to the WWII figure (top panel, Chart 4). The Fed would likely lose its independence. This would be a paradigm shift. The Fed would crowd out fixed income investors, and flood the market with US dollars. M2 money stock would continue to surge. Few investors will be chasing US dollar assets including equities. The path of least resistance would be significantly lower for the US dollar as foreign investors would flee. This debt monetization along with a depreciating currency and swelling money supply would result in inflation rearing its ugly head, especially given that import prices would soar. What is difficult to envision is how the economy would perform during an inflationary impulse. Our sense is that the risk of stagflation would rise significantly, especially given the current inverse correlation between M2 growth and the velocity of money.2 In the stagflationary 1970s, any liquidity injections via higher M2 growth failed to translate into rising money velocity. Importantly, the “Nixon shock” effectively ended the Bretton Woods system and floated the US dollar causing a 40% devaluation from peak-to-trough (Chart 9). Tack on the oil related supply shock and stagflation reigned supreme in the 1970s, owing to cost-push inflation. Chart 9Dollar The Reflator In contrast during the 1940s, demand-pull inflation hit the economy rather hard, as the US was retooling its industrial base to win WWII alongside its allies. Also the US dollar was linked to gold since the Gold Reserve Act of 1934 and ten years later the Bretton Woods international monetary agreement ushered in the era of fixed exchange rates, which is a big difference from the 1970s.3 As a reminder, from a political perspective venturing down the inflation avenue is the least painful way of dealing with a debt burden, rather than pursuing tight fiscal policy which is synonymous with political suicide. From an equity perspective, owning commodity-levered sectors and other hard asset-linked equities including REITs would make sense as we highlighted in our recent inflation Special Report. Health care stocks would also shine in case of an inflationary spurt according to empirical evidence that we highlighted in the same Special Report. On the flip side, our inflation Special Report also revealed that shedding telecom services and utilities would be wise and most importantly avoiding technology stocks. Tech stocks are disinflationary beneficiaries as they are mired in constant deflation and have built business models not only to withstand, but also to thrive in deflation. Inflation is a tech killer as these growth stocks suffer when the discount rate spikes and causes valuations to move from a premium to a discount. Nevertheless, deflation/disinflation is more likely in the coming 12-to-18 months, whereas inflation is at least two-to-three years away as we mentioned in our recent inflation Special Report. This week we continue to augment our cyclicals versus defensives portfolio bent and take our defensive exposure down a notch by downgrading consumer staples to a modest below benchmark allocation via a downgrade in the S&P hypermarkets index. Downgrade Hypermarkets To Underweight… Last summer we upgraded the S&P hypermarkets index to overweight as we were preparing the portfolio to withstand a recessionary shock given that the yield curve had inverted. Fast forward to the March carnage in the equity markets and this defensive move served our portfolio well. However, we did not want to overstay our welcome and set a stop in order to exit this position that was triggered in late-March netting our portfolio 26% in relative gains. More recently, we have been adding cyclical exposure to the portfolio and lightening up on defensives and as a continuation of this shift we are now compelled to downgrade the S&P hypermarkets to underweight. The economy is reopening and thus it no longer pays to seek refuge in safe haven hypermarket equities. In fact most of the macro indicators we track suggest the recession is over that will sustain severe downward pressure on relative share prices. Chart 10 shows that the ISM manufacturing new orders subcomponent has slingshot from below 30 to north of 60, junk spreads are probing all-time lows, consumer confidence has troughed and small and medium enterprises hiring intentions are on the mend. Moreover, the extraordinary fiscal expansion has brought spending forward and PCE is all but certain to skyrocket when the Q3 GDP figures get released in late-October, signaling that the easy money has been made in Big Box retailers (top panel, Chart 11). Similarly, discretionary spending should pick up the slack from staple-related purchases, further dampening the need to own hypermarket shares (middle & bottom panels, Chart 11). Chart 10Rebounding Macro Chart 11Returning to Normality On the operating front, while WMT is making strides in its online presence and offering mix, non-store retail sales are on a tear dominated by King AMZN (as a reminder we are overweight the S&P internet retail index). This is a secular trend and should continue unabated and in a relative sense continue to weigh on hypermarket profitability (bottom panel, Chart 12). Finally, a significant tailwind is turning into a severe headwind for this industry: import price inflation. The US dollar has reversed course and it is in a freefall. Historically, the greenback has been an excellent leading indicator of import price inflation and the current message is grim for hypermarket razor thin profit margins (import prices shown inverted, Chart 13). Chart 12Amazonification Is On Track Chart 13Currency Headwinds Adding it all up, softening operating metrics, the falling US dollar, the reopening of the economy, all suggest that investors should avoid hypermarket stocks. Bottom Line: Trim the S&P hypermarkets index to underweight. The ticker symbols for the stocks in this index are: BLBG S5HYPC – WMT, COST. …Which Pushes Consumer Staples To A Below Benchmark Allocation The downgrade in the S&P hypermarkets index tilts our S&P consumer staples sector to a modest below benchmark allocation. Countercyclical consumer staples stocks served their purpose and provided the support to our portfolio in the front half of the year when we needed them most. Now that the economic reopening is gaining steam and the government, the health care system and society are all ready to effectively deal with a flare up in the pandemic, the allure of defensive positioning has diminished. In other words, COVID-19 is currently a known known risk versus an unknown unknown risk early in the year, and defending against it now is more successful. Moreover, according to our mid-April research on what sectors investors should avoid during recessionary recoveries, consumer staples stocks trail the SPX on average by 660bps one year following the SPX trough. The current macro backdrop corroborates this analysis and underscores that the path of least resistance is lower for relative share prices. Not only is the ISM manufacturing survey on fire, but also consumer confidence is making an effort to trough (ISM manufacturing and consumer confidence shown inverted, Chart 14). Meanwhile, financial market variables emit a similarly bearish signal for safe haven staples stocks. Following a brief spike in the bond-to-stock ratio (BSR), the BSR has recently resumed its downdraft (top panel, Chart 15). Volatility has all but collapsed since soaring to over 80 in March, as the Fed has orchestrated a quashing of all asset class volatilities (middle panel, Chart 15). Lastly, the pairwise correlation between stocks in the S&P 500 has also nosedived bringing some semblance of normality back into equity markets (bottom panel, Chart 15). All three of these financial market variables will continue to exert downward pressure on relative share prices. Chart 14V-shaped Recovery… Chart 15...Across The Board On the US dollar front, while consumer goods manufacturers get a P&L translation gain from a depreciating currency, their export exposure is on par with the SPX and does not provide a relative advantage. In marked contrast, empirical evidence shows that relative profitability moves in tandem with the greenback and the USD recent weakness will undercut consumer staples profitability (bottom panel, Chart 16), especially via climbing input cost inflation. In sum, a firming macro backdrop, the US dollar’s recent drop, along with the bearish signals from financial variables, all concur that investors should start a program of modestly shedding consumer staples exposure. Bottom Line: Downgrade the S&P consumer staples index to underweight. Chart 16Mind the Gap Anastasios Avgeriou US Equity Strategist anastasios@bcaresearch.com Footnotes 1 https://www.richmondfed.org/publications/research/special_reports/treasury_fed_accord/background 2 The velocity of money “is the number of times one dollar is spent to buy goods and services per unit of time. If the velocity of money is increasing, then more transactions are occurring between individuals in an economy.” Source: Federal Reserve Bank of St. Louis. 3 Our colleagues from The Bank Credit Analyst recently illustrated how a strong dollar is good for the US economy on a medium term basis. Current Recommendations Current Trades Strategic (10-Year) Trade Recommendations Size And Style Views July 27, 2020 Overweight cyclicals over defensives April 28, 2020 Stay neutral large over small caps June 11, 2018 Long the BCA Millennial basket The ticker symbols are: (AAPL, AMZN, UBER, HD, LEN, MSFT, NFLX, SPOT, TSLA, V). January 22, 2018 Favor value over growth
Frenetic trading continued unabated in the US equity markets with some bizarre moves now a daily phenomenon. One such occurrence is the positive correlation of the VIX with the SPX, which we had flagged as a negative omen in mid-February.1 Thus, risk management portfolio metrics are of the utmost importance when trading goes haywire. Following up from closing all our high-conviction trades last Friday, we are obeying all recently instituted rolling stops in our cyclical portfolio positions in order to protect profits. Our underweight position in homebuilders, and overweight positions in hypermarkets and household products have been all stopped out this week for a profit of 41%, 26% and 5%, respectively. As such, all three positions have reverted back to neutral. Bottom Line: Erratic trading patterns and heightened volatility compel us to obey our rolling stops. Book gains and move to neutral in the cyclically underweight S&P homebuilders, overweight in S&P hypermarkets and overweight in S&P household products positions for a profit of 41%, 26% and 5%, respectively. Stay tuned. Footnotes 1 Please see BCA Research US Equity Strategy Weekly Report, “Will The Fed Save The Day, Again?”, dated February 18, 2020, available at uses.bcareseach.com.
Overweight Last summer, following our recession thought experiment report1 we upgraded the S&P hypermarkets index to overweight preparing our portfolio for the inevitable recession.2 Since then, hypermarket stocks have bested the SPX by nearly 30%. The 10-year Treasury yield recently melted to 0.31%, fully discounting ZIRP, QE5 and recession. This week’s US PMI release also made for grim reading, and it will likely be a harbinger of acute economic pain in the weeks to come. Tack on the 40% jump in weekly unemployment insurance claims, and things are falling into place for additional gains in relative share prices (see chart). Following explosive gains thanks to COVID-19 driven panic, we have also instituted a rolling 10% profit taking stop from the peak gains of 36% in the most recent Weekly Report. Bottom Line: We reiterate our overweight stance in the S&P hypermarkets index, but remain disciplined as we will obey our 10% rolling stop. The ticker symbols for the stocks in this index are: BLBG: S5HYPC – WMT, COST. Footnotes 1 Please see BCA US Equity Strategy Weekly Report, “A Recession Thought Experiment” dated June 10, 2019, available at uses.bcaresearch.com. 2 Please see BCA US Equity Strategy Weekly Report, “Divorced From Reality” dated July 15, 2019, available at uses.bcaresearch.com.
Highlights Portfolio Strategy We have identified 20 reasons to start buying equities. We highlight positive catalysts that should underpin the equity market as the pandemic progresses. Investors with higher risk tolerance should continue to layer in slowly and put cash to work with a cyclical 9-12 month time horizon. Consumer staples in general and hypermarkets and household products in particular are defensive areas where we are comfortable to deploy fresh longer-term oriented capital. Recent Changes Erratic trading compelled us to close out all our high-conviction calls for the year last Friday, booking handsome gains for our portfolio.1 Table 1 Feature Equities oscillated violently last week and remain mostly rudderless (Chart 1). While the relentless COVID-19 news bombardment kept on feeding the bears, on the flip side monumental monetary easing and fiscal packages the world over emboldened the bulls. This tug of war is far from over, but it is becoming crystal clear that both monetary and fiscal authorities will throw the proverbial kitchen sink at it until the hemorrhaging stops. Last week we showed that it takes a median two full years for the SPX to make fresh all-time highs following a bear market.2 This week we highlight the median and mean profile of the bear market recoveries since WWII (Chart 2). Crudely put, if history at least rhymes the SPX will not make any fresh all-time highs until early 2022. Chart 1Rudderless Chart 2Profile Of A Bear As a reminder, our equity market roadmap for the next few months is a drawn out consolidation phase leaving investors ample time to shift portfolios and put cash to work. This bottoming roadmap is something akin to the 1987, 2011, 2015/16 or early-2018 episodes.3 We cannot rule out further downside to equities. Moreover, we can neither time the tops nor the bottoms. However, the same way we were cautioning investors not to chase this market higher – as we were not willing to risk 100-200 points of SPX upside for a potential 1000 point drawdown – we are now compelled to nibble on the way down. Turning over to volatility, the VIX hit 85.47 intraday last week and clocked its highest close since the history of the data. Its sibling the VXO (volatility on the OEX or S&P 100) that predated the VIX hit an intraday high of 172.79 on Tuesday, following Black Monday, October 20, 1987, and clearly warns that if another crash takes root the VIX will explode higher.4 Importantly, vol at 85 translates into a 25% move in the SPX, in either direction, in the next 30 days. Chart 3 shows that actual SPX realized volatility jumped to 103 last week, trumping the VIX’s spike. Historically, when realized volatility trumps the VIX, it is time to sell the VIX; the opposite is also true. Given that we still do not expect a repeat of the GFC, or a depression, we recommend investors with higher risk tolerance start to deploy long-term oriented capital in the equity market. Chart 3Realized Versus Implied Vol Below are 20 reasons to start buying equities. We highlight positive catalysts that should underpin the equity market as the pandemic progresses. We are already in recession. Markets trough in recessions and historically offer enticing risk/reward return profiles. China’s manufacturing PMI and other hard data fell below the GFC lows. As a general rule of thumb investors should buy stocks when the global PMI is well below 50 (Chart 4). Cupboards are bare. A drawdown in inventories is usually followed by a jump in production. That is one of the reasons to be bullish staples. As for durables, pent-up demand due to delayed purchases will eventually be violently unleashed, especially given zero rates. Consumers will benefit from the oil market carnage and the super low mortgage refinancing rates. The Fed cut rates to zero, did QE5, and brought back the alphabet soup of programs like CPFF, PDCF and MMLF from the GFC, more will likely follow (Chart 5). Chart 4Time To Buy Chart 5The Fed Put The DXY has gone from 95 on March 9 to 103 on Friday. King dollar will soon have to reverse course and provide some much-needed relief globally as the Fed’s US dollar swap lines aim to alleviate the shortage of US dollars (Chart 6). Keep in mind what Dr. Bernanke told Scott Pelley in a 60 Minutes interview with regard to money creation: “PELLEY: Is that tax money that the Fed is spending? BERNANKE: It's not tax money. The banks have accounts with the Fed, much the same way that you have an account in a commercial bank. So, to lend to a bank, we simply use the computer to mark up the size of the account that they have with the Fed (emphasis ours). So it's much more akin to printing money than it is to borrowing.”5 Other global Central Banks are cutting rates and doing QE. Beyond Christine Lagarde’s recent €750bn bazooka, the ECB has the OMT ready from previous crises. Already last week the ECB intervened in Italian BTPs via Banca d’Italia. Germany has hinted that it would not be opposed to a “Covid-bond” A mega US fiscal package looms near the $1tn mark.6 The recession-related automatic stabilizers and government spending will soar. China’s fiscal response will likely be as large as in late 2008 (as a reminder in Q4/2008 the Chinese fiscal spending announcement equated “to 12.5% of China’s GDP in 2008, to be spent over 27 months”7). Germany and a slew of other countries have already pledged fiscal spending. Spain has announced a 20% of GDP package. Countries will bid-up the size of the bailout. IMF announced a $1tn bailout package. Nibbling at stocks when the VIX is at 85 makes sense versus when the VIX is at 12 (Chart 7). Chart 6Greenback Falls And Rates Rise When The Fed Does QE Chart 7Compelling Entry Point The yield curve slope is steepening (Chart 8). Chart 8The Yield Curve Always Leads Stocks The 10-year real Treasury yield hit a low of -50bps that indicator has also priced in recession (Chart 7). Chart 9Recession Nearly Fully Priced In Equity market internals have fully priced recession, small caps and weak balance sheet stocks in particular (Chart 9). Sentiment is washed out as per our Capitulation, Sentiment and Complacency-Anxiety Indicators (Chart 9). Bernie Sanders has lost his bid to become the nominee of the Democratic Party. Buffett will either bailout a company or two or buyout a company he likes. Jamie Dimon and/or other prominent CEOs (insiders) will start buying their own company stock. Social-distancing measures in the West will ultimately break the Epidemic Curve first derivative and arrest the panic. Even if COVID-19 comes back in force, the fact is that most of the patients who succumb to it are elderly. In Italy, the average age of death is 80 years old. As such, the final circuit-breaker ahead of a GFC would be desensitization by the population, as selective quarantines – targeting the elderly cohorts – get implemented in order to allow other people to return to work. Furthermore, two “silver bullet” solutions remain as tail risks to the bearish narrative. First, a biotech or pharmaceutical company may make a breakthrough in the fight against COVID-19. Not necessarily a vaccine, but a treatment. Finally, upcoming warm weather in the northern hemisphere may also help the fight against the virus. Nevertheless, there are some risks we are closely monitoring. First, if we are offside and this turns into a GFC, another big down-leg will ensue. One reason for this would be a Spanish Flu parallel where the second wave of deaths trounced the first wave. In that case, the GDP contraction will be longer-lived and SPX EPS will suffer a long-lasting setback. Second, a credit crunch can cause a credit event, which is a big risk as we have been highlighting recently. Counter party as well as bank insolvency risks will also come into play. Third, non-financial non tech corporate net debt-to-EBITDA is at all-time highs according to company reported data and non-financial corporate debt as a percent of GDP is at all-time highs according to national accounts (Chart 10). Finally, while lower rates are helpful in the long run, a long era of low rates in Japan and more recently the euro area have not helped equities in the longer-term. The NIKKEI 225 is still down 58% from the December 1989 all-time highs and the MSCI Eurozone index is down 46% from the March 2000 all-time highs (Chart 11). Chart 10Risk: Too Much Indebtedness Chart 11Japan And The Euro Area Are Scary ZIRP Parallels Netting it all out, following a nine-month cyclical period of being in the bearish camp, we are now selectively nibbling on stocks with a 9-12 month time horizon, as we deem the potential positive catalysts will overwhelm the few risks that we are closely monitoring. This week we reiterate our overweight stance in the second largest defensive sector – the S&P consumer staples index – and two of its key sub-components. Continue To Favor Defensive Staples… Consumer staples stocks have caught on fire lately as investors have been seeking refuge in defensive equities during the current “risk off” phase. Behind health care (15.6% of the SPX weight), their safe haven siblings, staples are the second largest defensive sector comprising 8.5% of the S&P 500, and we reiterate our overweight stance in this sector. Historically, staples equities thrive in recessions and in deflationary/disinflationary environments. The reason is the allure of their stable cash flows especially in times of duress when growth is really hard to come by, a staples company growing revenues 5%/annum is sought after aggressively. Currently, relative share prices have troughed near the GFC bottom, and are probing to break out of the one standard deviation below the historical time trend mean (Chart 12), offering a compelling entry point to deploy new capital. Chart 12Bouncing Last week’s jump in unemployment insurance claims to 281,000 is a small precursor of things to come as more parts of the US get locked down (middle panel, Chart 13). This recessionary backdrop, coupled with the surging VIX, which will take months to die down to 20 near the historical average, and investors hiding in Treasurys all argue that it pays to stay with defensive staples stocks (top & bottom panels, Chart 13). Two of our preferred vehicles to continue to explore an overweight in the consumer staples sector are via above benchmark allocation in both hypermarkets and household products stocks. Chart 13Sticks With Staples …Stick With Hypermarkets… Last summer, following our recession thought experiment report8 we upgraded the S&P hypermarkets index to overweight preparing our portfolio for the inevitable recession.9 Since then, hypermarket stocks have bested the SPX by over 36%. While a consolidation phase looms that will allow hypermarkets to build a base before vaulting higher, today we are instituting a rolling 10% stop from the highs in order to protect handsome gains for our portfolio. The savings rate more than trebled from the GFC lows as the once in a generation Great Recession scared consumers. The savings rate has remained elevated ever since and is primed to rise further in the current recession as consumers tighten their purse strings. Historically, relative share prices and the savings rate have been positively correlated as even wealthier consumers opt for rock bottom selling price points. The current message is to expect a durable bidding up phase of hypermarket equities (Chart 14). Chart 14When The Going Gets Tough, Buy Hypermarkets The soaring greenback is underpinning these pricing strategies from Big Box retailers as it keeps import prices in deflation, allowing retailers to pass these on to the consumer (fourth & bottom panels, Chart 15). The recent drubbing in oil prices is an added catalyst to boost hypermarket equities as lower prices at the pump will translate into more cash in consumers’ wallets (top panel, Chart 15). Keep in mind that WMT is the number one grocery store in the US with near 25% market share – COST is also a large mover of US groceries – thus the coronavirus pandemic will not deal a blow to their demand profile. Chart 15Defense Is… The 10-year Treasury yield recently melted to 0.31%, fully discounting ZIRP, QE5 and recession. Last week’s Philly Fed survey made for grim reading, a harbinger of acute economic pain in the weeks to come. Tack on the 40% jump in weekly unemployment insurance claims, and things are falling into place for additional gains in relative share prices (Chart 16). Finally, overall tighter financial conditions and the more than doubling in the junk spread also corroborate that the path of least resistance remains higher for hypermarket equities (second & middle panels, Chart 15). Bottom Line: We reiterate our overweight stance in the S&P hypermarkets index. Today, we are also instituting a risk management metric in order to protect profits: we are implementing a rolling 10% stop from the highs in order to protect gains. The ticker symbols for the stocks in this index are: BLBG: S5HYPC – WMT, COST. Chart 16…The Best Offense …And Overweight Household Products Household products stocks have recently bounced off of long-term support and have sling shot higher (Chart 17). While we continue to recommend an above benchmark allocation of this safe haven index, we are also obliged to initiate a 5% rolling stop in order to protect our recent explosive gains. We reckon that the COVID-19 experience will scar consumers and alter behaviors with long lasting effects. We doubt this sanitization craze will completely subside following the passing of the pandemic. Our sense is that use of disinfectants and cleaning products in general will experience a parallel shift higher in the demand curve. Chart 17Held The Line Therefore, consumer outlays on household products will continue to gain share from the overall spending pie and underpin relative share prices (top panel, Chart 18). US household products exports are another important source of demand for the industry. Exports recently ticked higher and the coronavirus pandemic underscores that US manufacturers that are held in high regard abroad especially sanitation household products will struggle to meet export demand (bottom panel, Chart 18). Domestically, overall grocery store level wholesale selling prices are expanding smartly paving the way for a similar trajectory for household products pricing power (second panel, Chart 18). Importantly, given the recent consumer behavior, shortages all but assure that non-durable goods factories will be humming at a time when almost all other industries will grind to a halt (third panel, Chart 18). Moreover, household products are part of consumer goods that have a fairly inelastic demand profile and really shine during recessions. The recent collapse of the Philly Fed survey heralds a durable outperformance phase for household products equities (Chart 18). While relative valuations appear expensive, relative forward EPS and revenues are slated to trail the market in the coming 12 months. If our thesis pans out then household products stocks will grow into their pricey valuations as profits will overwhelm (Chart 19). Chart 18Demand Driven Advance In fact, our macro based S&P household products sale per share growth model does an excellent job in capturing all these drivers and signals that top line growth will continue to accelerate for the rest of the year (Chart 20). Chart 19Low Bar To Surpass Chart 20Macro Model Says Buy Bottom Line: Stick with the S&P household products index, but institute a 5% rolling stop from the highs in order to protect profits. The ticker symbols for the stocks in this index are: BLBG: S5HOPRX – PG, CL, KMB, CLX, CHD. Anastasios Avgeriou US Equity Strategist anastasios@bcaresearch.com Footnotes 1 Please see BCA US Equity Strategy Daily Report, “Closing Out All High-Conviction Calls” dated March 20, 2020, available at uses.bcaresearch.com. 2 Please see BCA US Equity Strategy Weekly Report, “Inflection Point” dated March 16, 2020, available at uses.bcaresearch.com. 3 Please see BCA US Equity Strategy Daily Report, “Gravitational Pull” dated March 12, 2020, available at uses.bcaresearch.com. 4 http://www.cboe.com/products/vix-index-volatility/vix-options-and-futures/vix-index/vix-historical-data 5 https://www.cbsnews.com/news/ben-bernankes-greatest-challenge/2/ 6 Please see BCA US Equity Strategy Daily Report, “Don’t Be A Hero” dated March 11, 2020, available at uses.bcaresearch.com. 7 https://www.oecd.org/gov/budgeting/Public%20Governance%20Issues%20in%20China.pdf 8 Please see BCA US Equity Strategy Weekly Report, “A Recession Thought Experiment” dated June 10, 2019, available at uses.bcaresearch.com. 9 Please see BCA US Equity Strategy Weekly Report, “Divorced From Reality” dated July 15, 2019, available at uses.bcaresearch.com. Current Recommendations Current Trades Strategic (10-Year) Trade Recommendations Size And Style Views June 3, 2019 Stay neutral cyclicals over defensives (downgrade alert) January 22, 2018 Favor value over growth May 10, 2018 Favor large over small caps (Stop 10%) June 11, 2018 Long the BCA Millennial basket The ticker symbols are: (AAPL, AMZN, UBER, HD, LEN, MSFT, NFLX, SPOT, TSLA, V).
Overweight Last week Costco reported its fiscal fourth-quarter earnings, which came in beating expectations. These results are good news for our S&P hypermarkets overweight call as Costco accounts for nearly 50% of the index. We first recommended investors increase their exposure to this plain vanilla consumer defensive industry just under 3 months ago, and this position is already up 8% relative to the SPX since inception. Macroeconomic data remains soft across the board heralding more gains for the S&P hypermarkets index (second panel). Meanwhile, industry specific data is encouraging, with Big Box retail sales slated to firm further (third & bottom panels). Specifically, hypermarkets’ pricing power is set to increase as the relative consumer confidence by income (defined as the ratio of Americans who make less than $35,000/annum to those who make above $35,000/annum) has climbed to fresh cyclical highs (bottom panel). Bottom Line: Consumer staples stocks in general and hypermarkets in particular continue to shine. Stay overweight the S&P hypermarkets index. The ticker symbols for the stocks in this index are: BLBG: S5HYPC - WMT, COST.
Overweight Yesterday, Walmart delivered an upbeat profit report that propelled the S&P hypermarkets index to fresh multi-year relative performance highs. More gains are in store in coming months as this safe haven index has a lot going for it. Global growth remains anemic at best and as we posited in late spring there are high odds that the global growth reacceleration will be pushed out to at least Q1/2020. This bearish economic backdrop provides a shelter for investors to hide in hypermarket equities when the going gets tough (global manufacturing PMI shown inverted, middle panel). Domestic conditions are also wavering as evidenced by the drubbing in the 10-year real yield. The plunge in this economic growth metric is disconcerting, but a fillip to hypermarket equities (real yield shown inverted, top panel). Finally, oil prices are deflating and will continue to do so into the fall. Tack on the appreciating greenback that is keeping import prices in check despite the trade war and our Hypermarkets Pressure Gauge is signaling that relative forward earnings have more upside (bottom panel). Bottom Line: We reiterate our recent upgrade to overweight in the S&P hypermarkets index. The ticker symbols for the stocks in this index are: BLBG: S5HYPC - WMT, COST.
S&P Hypermarkets (Overweight) Upgraded from Neutral S&P Soft Drinks (Neutral) Upgraded from Underweight As a follow up to our yesterday’s Insight where we outlined some of our reasons to go underweight the S&P technology sector, today we focus on two defensive sub-sectors that will benefit from the spreading cracks in the U.S. economy: S&P hypermarkets and S&P soft drinks. Both sub-sectors enjoy deteriorating macroeconomic conditions, which are currently reflected in the steep fall in U.S. economic data surprises, the drubbing of the 10-year U.S. treasury yield, melting inflation and rapidly contracting ISM PMI numbers (see chart) Bottom Line: Stick with defensive consumer stocks. For a more detailed discussion on S&P hypermarkets and S&P soft drinks, please see our July 15 Weekly Report and “Bubbling Up” Insights,1 respectively. For the complete list of our recent moves, please see our Monday’s Weekly Report. 1 Please see BCA U.S. Equity Strategy Insight Reports, “Bubbling Up (Part I)” and “Bubbling Up (Part II)”, dated July 24, 2019 available at uses.bcaresearch.com.