Industrial Machinery
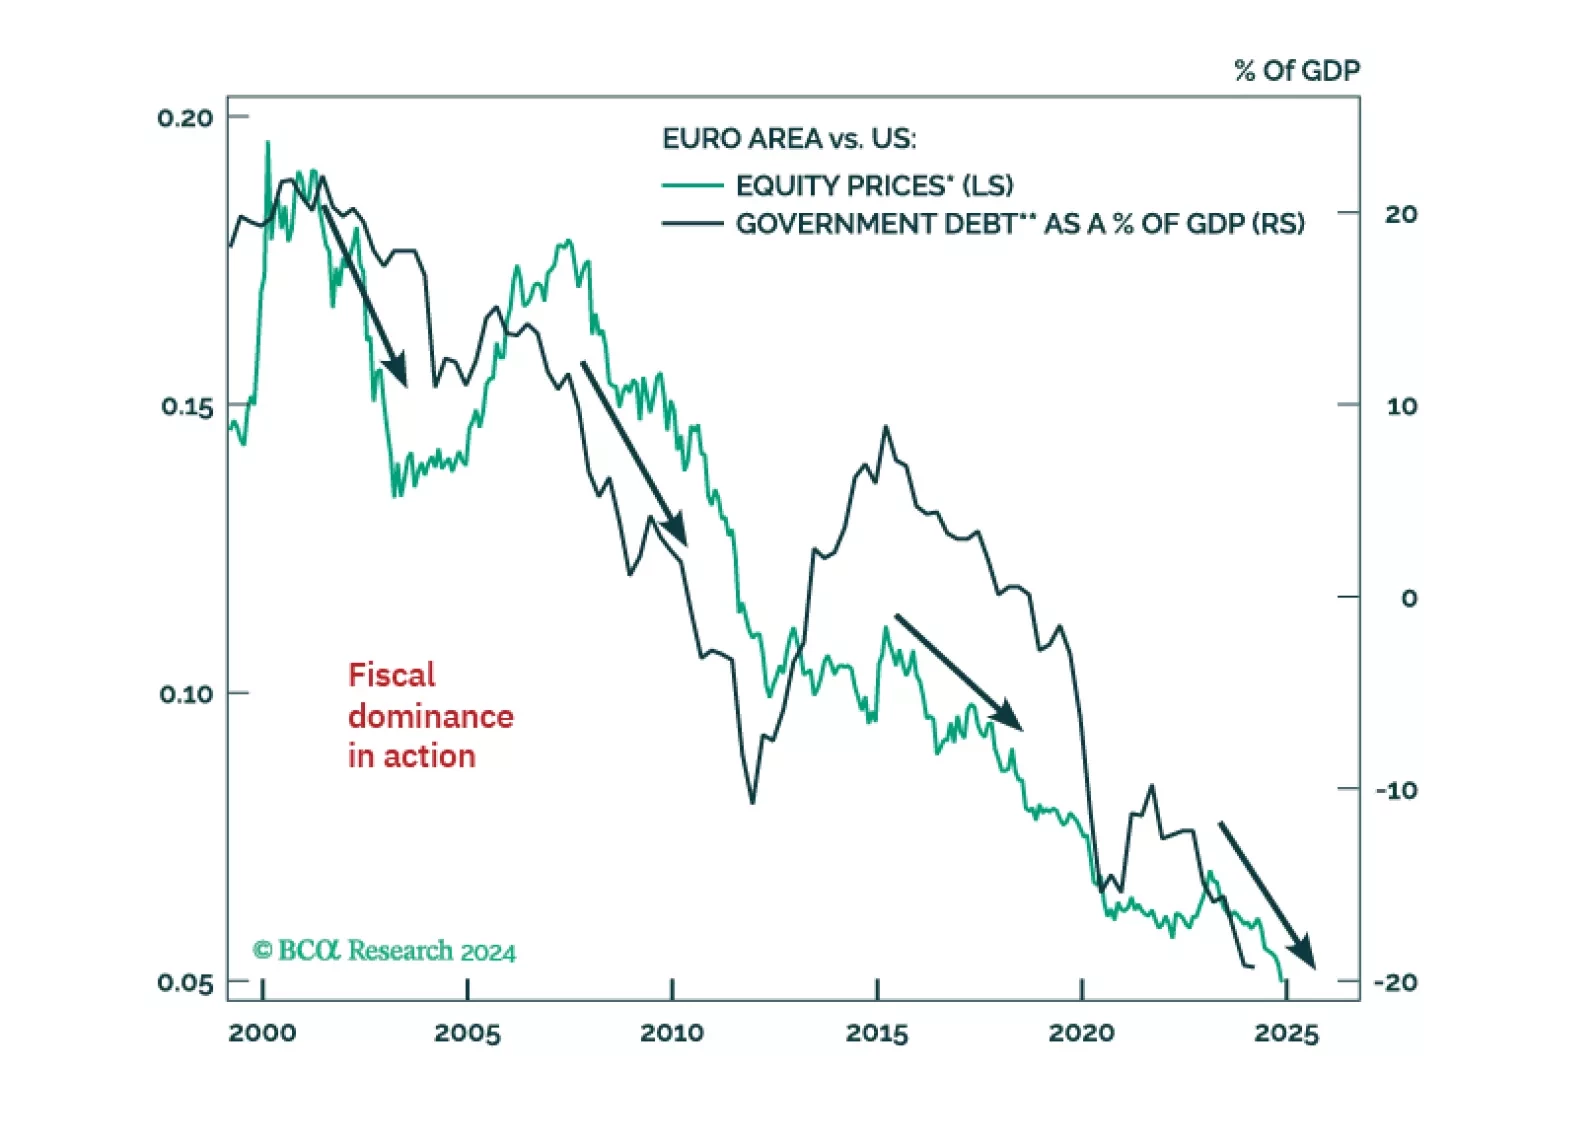
Investors have given up on European assets, which now suffer exceptional discounts to US ones. However, tighter US fiscal policy, the end of Europe’s austerity and deleveraging, the LNG Tsunami about to hit European shores, and the global capex fueled by the Impossible Geopolitical Trinity mean that Europe’s time to shine will soon come back.
Investors have given up on European assets, which now suffer exceptional discounts to US ones. However, tighter US fiscal policy, the end of Europe’s austerity and deleveraging, the LNG Tsunami about to hit European shores, and the global capex fueled by the Impossible Geopolitical Trinity mean that Europe’s time to shine will soon come back.

Neutral In yesterday’s Weekly Report, we outlined that the most cyclical parts of the S&P industrials index with high foreign sales content would benefit disproportionately from our stable-to-mildly sanguine EM/China view. While the broad machinery index fits the bill, the industrial machinery sub index less so, and we recommend monetizing gains of 4% since inception and moving to the sidelines while redeploying profits into the more cyclical S&P construction machinery & heavy truck index. One key determinant of the relative move of these indexes is the U.S. dollar. The greenback troughed in 2011 and since then the more “defensive”, less globally-exposed S&P industrials machinery index left their brethren in the dust (top panel). Now that the U.S. dollar has peaked, the catch up phase in the S&P construction machinery & heavy truck index that is already underway will likely gain momentum (bottom panel). Bottom Line: Book profits of 4% in the S&P industrial machinery index and downgrade to a benchmark allocation while staying overweight construction machinery; please see yesterday’s Weekly Report for more details. The ticker symbols for the stocks in this index are: BLBG: S5INDM - ITW, IR, SWK, PH, FTV, DOV, PNR, XYL, SNA, FLS.
Highlights Portfolio Strategy A stable China, a depreciating U.S. dollar, rising commodity prices and sustained synchronized global growth signal that the industrials complex, especially the most cyclical part, remains on a solid footing. Deteriorating profit prospects warn that investors should refrain from paying a premium valuation for industrial machinery; take profits and move to the sidelines. Recent Changes S&P Industrial Machinery - Book profits of 4% and downgrade to neutral today. S&P Construction Machinery & Heavy Truck - Stop triggered last week, remove from the high-conviction list for a 10% gain. Small Caps / Large Caps - Downgrade alert in a recent Insight. Table 1 Feature The S&P 500 smashed through the 2,800 mark last week, as corporate profits continued to deliver, the U.S. dollar took a dive and global economic data releases held their own. Stars could not be more aligned for a euphoric blow off phase, with equity bourses the world over already registering annual-like returns in but a few short weeks. While stocks have more room to run, especially versus bonds, on a cyclical time frame, tactically the likelihood of a short-term healthy pullback is increasing. Last week we identified five indicators we are closely monitoring that are signaling an overstretched market.1 This week we update our Complacency-Anxiety Indicator that also catapulted to all-time highs and breached the one standard deviation above the historical mean mark (Chart 1). This confirms that a Q1 setback remains likely, and our strategy since December 18 has been to monetize gains in tactical trades and institute stops to the high flyers in our high-conviction call list. Were a 5-10% correction to materialize, we would "buy the dip" as we do not foresee a recession in the coming 9-12 months. While consumer price inflation is nowhere to be found, corporate selling prices are climbing at a brisk pace. The U.S. dollar debasement and related commodity reflex rebound, especially in oil prices, are the culprits, and the latter will likely assist even the CPI basket and morph into an inflationary impulse as we posited in late-November (please see the bottom two panels of Chart 1B). Already, inflation expectations are headed higher. Chart 2 updates our corporate sector pricing power proxy and our diffusion index. It also updates the business sector's overall wage inflation and associated diffusion index from the latest BLS employment report. The middle panel of Chart 2 shows the Atlanta Fed Wage Growth Tracker and that measure of wage inflation has converged down to the AHE reading, suffering a 100bps drop in the past year. Chart 1Complacency Reigns Chart 2Margin Expansion Phase Is Intact Corporate pricing power is upbeat at a time when wages are decelerating. Taken together, our margin proxy indicator suggests that the ongoing profit margin expansion phase has more upside (bottom panel, Chart 2). Table 2 shows our updated industry group pricing power gauges, which we calculate from the relevant CPI, PPI, PCE and commodity growth rates for each of the 60 industry groups we track. Table 2 also highlights shorter-term pricing power trends and each industry's spread to overall inflation. Table 2Industry Group Pricing Power 78% of the industries we cover are lifting selling prices, and 45% are doing so at a faster clip than overall inflation. Importantly, inflation rates have increased since our late-September update. The outright deflating sectors dropped by two to 13 since our last update. Encouragingly, only 7 industries are experiencing a downtrend in selling price inflation, or 5 fewer than our most recent report. Impressively, deep cyclicals/commodity-related industries dominate the top ranks, occupying 8 out of the top 10 slots (top panel, Chart 3). A softening greenback and rising global end demand explain the commodity complex's sustained ability to increase prices. In contrast, tech, telecom and consumer discretionary sectors populate the bottom ranks of Table 2. Netting it out, accelerating corporate sector pricing power will continue to bolster top line growth in 2018. Tack on high operating leverage kicking into higher gear at this stage of the cycle and still muted wage inflation and profit margins and EPS growth will remain upbeat. With regard to cyclicals versus defensives, diverging pricing power (Chart 3) and wage growth trends (Chart 4) suggest that cyclicals continue to have the upper hand compared with defensives (Chart 5). Chart 3Deep Cyclicals... Chart 4...Have The Upper Hand... Chart 5...Vs. Defensives This week we update our view on a deep cyclical sector and modestly tweak our intra-sector positioning. Industrials And China We lifted the S&P industrials sector to an above benchmark allocation in early October via boosting the S&P construction machinery & heavy truck sub index to overweight.2 Synchronized global growth, a capex upcycle, firming capital goods final demand, and the U.S. dollar's fall coupled with the commodity price rebound all pointed to a bright outlook for U.S. capital goods producers. Currently, all these forces remain in play and continue to bolster industrials stocks' profit prospects. However, the emerging market (EM)/Chinese economic backdrop deserves closer scrutiny. Why? Because the most cyclical parts of the industrials complex are levered to the EM in general and China in particular. These high operating leverage businesses also drive relative profit and stock performance, signaling that China's economic growth might or ails determine the overall fortunes of U.S. capital goods producers. While Chinese economic data are currently a mixed bag and we take them with a big grain of salt, global high-frequency financial market data are emitting an unambiguously positive signal. First, BCA's FX strategist, Mathieu Savary, brought to our attention that the extremely economic-sensitive Canadian TSX Venture Exchange Index is in a V-shaped recovery.3 Highly speculative basic resources issues dominate this Index and help explain the tight positive correlation with Chinese output (top panel, Chart 6). Second, the ultimate economic-sensitive indicator, Dr. Copper, is also in a violent upswing, heralding that China will be, at least, stable in 2018 (middle panel, Chart 6). Third, high-beta Australian materials stocks have been in an upward trajectory since the early 2016 trough both versus the MSCI All-Country World Index and the broad Australian market, sniffing out improving Chinese-related commodity demand (bottom panel, Chart 6). Similarly, upbeat non-Chinese economic data suggest that China's economic prospects are far from faltering. Australia's close economic ties with China signal that taking a pulse of the Australian economic juggernaut reveals the state of China's economic affairs. Down Under employment growth has been brisk of late, with annual job creation running at a 3.3% clip, a rate last hit in the mid-2000s when China's economy was roaring and the commodity super-cycle was in full swing (second panel, Chart 7). Australian CEO confidence as well as consumer confidence are pushing decade highs, and the manufacturing PMI survey recently shot to a 16 year high (third panel, Chart 7). Chart 6China Is##BR##Alright Chart 7Australian Indicators Confirm:##BR## China Is Stable All of this suggests that China will likely remain stable in 2018, barring a policy mistake a la the August 11, 2015 currency devaluation. The upshot is that industrials EPS and equities have more room to run. On that front, both our Cyclical Macro Indicator and our profit growth model corroborate that the path of least resistance for relative share prices is higher (Chart 8). U.S. dollar debasing is synonymous with capital goods producers' top line growth acceleration, as a large part of total revenues are sourced from abroad. The near 20 percentage point fall in the trade-weighted U.S. dollar since 2015 suggests that more global market share gains are in store for U.S. industrials (Chart 9). Global growth is also joined at the hip with the greenback's depreciation. Synchronized global growth along with our derivative coordinated global capex growth 2018 theme, will likely serve as catalysts for a sustained breakout in relative share prices (Chart 10). Chart 8EPS Model And CMI Flash Green Chart 9Industrials Love A Cheap Greenback Chart 10Levered To Global Growth Adding it up, a stable China is music to the ears of industrials executives. Tack on a depreciating U.S. dollar, rising commodity prices and sustained synchronized global growth and the most cyclical parts of the industrials complex will continue to lead the pack. Bottom Line: Stay overweight the S&P industrials index, but selectivity is warranted. Take Profits In Industrial Machinery We outlined above that the most cyclical parts of the S&P industrials index with high foreign sales content would benefit disproportionately from our stable-to-mildly sanguine EM/China view. While the broad machinery index fits the bill, the industrial machinery sub index less so, and we recommend monetizing gains of 4% since inception and moving to the sidelines. Chart 11 shows the relative performance of the two key drivers of the S&P machinery index: industrial machinery and construction machinery & heavy truck sub-indexes. While these indexes moved hand-in-hand since the mid-1990s, early this decade this tight positive correlation fell apart. One key determinant of the relative move of these indexes is the U.S. dollar. The greenback troughed in 2011 and since then the more "defensive", less globally-exposed S&P industrials machinery index left their brethren in the dust (bottom panel, Chart 11). Now that the U.S. dollar has peaked, the catch up phase in the S&P construction machinery & heavy truck index that is already underway will likely gain momentum (top panel, Chart 11). Beyond the depreciating currency, at the margin, softening S&P industrial machinery operating metrics argue for pruning exposure in this index. Both the Empire and Philly Fed new orders surveys have petered out, suggesting that industry new order growth will likely continue to lose steam (middle panel, Chart 12). In fact, a weak industrial machinery new orders-to-inventories ratio is also warning that sell-side analysts' relative profits forecasts are too optimistic (bottom panel, Chart 12). Chart 11Catch Up Phase Chart 12Waning End-Demand Drilling deeper into industry operating metrics is revealing. While shipments have held their own and moved mostly sideways similar to new orders, inventory accumulation is worrying. Industry inventories have risen by over 30% during the past three years (Chart 13). Simultaneously, industrial machinery backlogs have drifted steadily lower. Given the supply build up, any hiccup in demand, even a minor one, could prove very deflationary and heavily weigh on industry profitability. With regard to valuations, Chart 14 shows that both on a relative trailing price-to-sales and relative forward price-to-earnings ratio basis, the index is trading one standard deviation above the historical mean. The moderating industry demand backdrop suggests that relative valuations are expensive. Chart 13Inventory Liquidation Risk Chart 14Why Pay A Premium? Adding it all up, deteriorating profit prospects warn that investors should refrain from paying a premium valuation for the S&P industrial machinery index. Bottom Line: Book profits of 4% in the S&P industrial machinery index and downgrade to a benchmark allocation. We also recommend redeploying profits from our downgrade in the S&P industrial machinery index to their more cyclical machinery siblings the S&P construction machinery & heavy truck index, thus sustaining the overall overweight exposure in the broad S&P industrials sector. Housekeeping Last week we instituted a risk management tool for our 2018 high-conviction list: setting a stop once a call has cleared the 10% return mark.4 This past week, the S&P construction machinery & heavy truck index hit the trailing stop at the 10% mark, and thus we are booking gains and removing this index from the high-conviction list. While our confidence is not as high as in late-November given the parabolic move in this index and rising chance of a tactical overall equity market pullback, from a cyclical perspective we continue to recommend a core overweight in this industrials sector powerhouse. Anastasios Avgeriou, Vice President U.S. Equity Strategy anastasios@bcaresearch.com 1 Please see BCA U.S. Equity Strategy Weekly Report, "Too Good To Be True?" dated January 22, 2018, available at uses.bcaresearch.com. 2 Please see BCA U.S. Equity Strategy Weekly Report, "Earnings Take Center Stage," dated October 2, 2017, available at uses.bcaresearch.com. 3 Please see BCA Foreign Exchange Strategy Weekly Report, "Health Care Or Not, Risks Remain," dated March 24, 2017, available at fes.bcaresearch.com. 4 Please see BCA U.S. Equity Strategy Weekly Report, "Too Good To Be True?" dated January 22, 2018, available at uses.bcaresearch.com. Current Recommendations Current Trades Size And Style Views Favor value over growth. Stay neutral small over large caps (downgrade alert).
Overweight Sales departments in the S&P industrial machinery index have been exceptionally busy in the past several months as order bookings have been soaring with both domestic and global orders pouring in (second panel). With growth accelerating around the world and a tax change at home that could shift the capex cycle into overdrive, the path of least resistance for industrial machinery new orders is higher. At the same time as orders have been surging, the industry has been ramping production to meet them, keeping the new orders to inventory relationship surprisingly stable over the past 4 years (third panel). However, growth in production has not been matched by an equivalent increase in employment, resulting in our productivity proxy moving much higher (bottom panel). This bodes well for profits, particularly in the context of a swelling top line in this relatively high fixed cost industry. The upshot is that EPS growth should outperform the market in 2018; stay overweight. The ticker symbols for the stocks in this index are: BLBG: S5INDM - ITW, IR, SWK, PH, FTV, DOV, PNR, XYL, SNA, FLS.
The dominant theme this week in U.S. Equity Strategy has been the acceleration in global trade. South Korea, the archetypal global trade bellwether, saw its exports grow by 16% in the first seven months this year with a 31% increase in the first three weeks of September. Such growth reinforces our thesis that we are in the early stages of a global capex resurgence. Global industrial machinery is heavily levered to changes in DM capital goods orders; the recent modest shift to growth in the latter has driven a surge in highly cyclical global machine orders (second panel). Paired with strong domestic demand (third panel) and an export-accommodative currency, U.S. industrial machinery manufacturers should be particularly well positioned to see earnings growth outpace the rest of the S&P 500. The market has been somewhat less sanguine than both us and the sell-side community; earnings estimates have been outpacing the index, resulting in a fall in valuation multiples year-to-date. Validation of those estimates seems likely to be the key catalyst for the index; stay overweight industrial machinery. The ticker symbols for the stocks in this index are: BLBG: S5INDM - ITW, IR, SWK, PH, FTV, DOV, PNR, XYL, SNA, FLS.
The Empire State Manufacturing and Philadelphia Fed Business Outlook surveys typically move in lockstep and their message last week was united; the domestic outlook for manufacturing is exceptionally strong. Both surveys have historically been reliable indicators for industrial machinery orders, which have only recently turned positive (second panel). A softer U.S. dollar too should lift demand with roughly 40% of revenues derived internationally. Capacity utilization should not present a roadblock to much higher production, as it remains below normal for this stage in the order cycle (third panel). As utilization rates firm, pricing power should gain strength. Despite the improving outlook, valuations have been stuck in neutral, as earnings estimates are rising faster than relative share prices. Importantly, the relative forward P/E remains well below previous bull market peaks (fourth panel). Stay overweight. The ticker symbols for the stocks in this index are: BLBG: S5INDM - ITW, IR, SWK, PH, FTV, DOV, PNR, XYL, SNA, FLS.
Portfolio Strategy Any meaningful weakness in the U.S. dollar could accelerate the budding recovery in corporate revenue growth after a multiyear malaise. Following this year's underperformance, lift the industrials sector to neutral via an upgrade in machinery stocks. The recent jump in auto parts stocks is a selling opportunity. Recent Changes S&P Industrial Machinery - Boost to overweight from underweight. S&P Construction Machinery & Heavy Trucks - Lift to neutral from underweight. S&P Industrials Sector - Remove from high conviction underweight and augment to neutral. Table 1Sector Performance Returns (%) Consolidation remains the dominant tactical market theme. The question is whether momentum behind the cyclical advance will fade at the same time? Our sense is that the overshoot will reassert itself once the corrective phase has run its course. Two weeks ago we updated a number of qualitative factors that suggested that a major market peak had not yet arrived, even though the rally is approaching retirement age and valuations are full. Other variables concur. For instance, while cash holdings are being depleted, they are not yet running on empty, gauging from survey data or depicted as a share of total market capitalization. Surprisingly, there are still a large number of bearish individual investors (Chart 1). Thus, drawing sidelined cash back into stocks at current stretched valuations and with buoyant expectations requires a resumption of top-line growth. Revenue growth has been conspicuously absent throughout the past few years of the bull market. Companies have supported per share profits through cost cutting and aggressive share buybacks, typically funded through debt issuance. Sustaining high valuations without reinvesting for growth is hard enough, but it becomes an even more onerous task without top-line expansion. There is room for cautious optimism. Deflation pressures have abated, and companies are enjoying a modest pricing power revival. As outlined in our regular industry group pricing power updates, the majority of sectors and industries are now able to lift selling prices, and an increasing number are able to keep pace with overall inflation. Our pricing power proxy has moved decisively back into positive territory (Chart 2), following a pattern typically reserved for when the economy exits recession. Even deflation in the chronically challenged retailing sector is ebbing. Chart 1Bears Still Have A Little Cash Chart 2Revenue Revival Importantly, both core inflation and inflation expectations remain well below the zone that would cause the Fed to tighten more aggressively than is currently expected (Chart 3). If financial conditions remain relatively easy, then business activity should stay sufficiently brisk to foster further pricing power improvement, i.e. a return to deflation is unlikely. The readings from both the ISM services and manufacturing sectors, and firming business confidence (Chart 2), indicate brighter revenue opportunities. The pickup in world trade volumes implies that goods and services are flowing more freely than they have for several years, and provided protectionist policies do not gain traction, a rebound in global growth should be supportive of total business sales. We doubt there is a vigorous top-line thrust ahead given that potential GDP growth around the world is limited, but modest growth is probable. If the U.S. dollar were to weaken substantially, especially if it occurred within the context of better economic growth abroad, then revenue upside would increase. Chart 4 shows that S&P 500 sales advanced significantly after the last two major U.S. dollar bull markets peaked. Chart 3The Fed Still Has Latitude Chart 4A Top-Line Boom ##br##Requires Dollar Depreciation In sum, the sales outlook has brightened, which is critical to absorbing the increase in labor costs and cushioning the profit margin squeeze. If investors begin to factor in sales-driven earnings growth, rather than buyback and cost cutting-dependent improvement, then it is plausible that the overshoot in stocks will be extended for a while longer. As outlined in recent weeks, the easing in the U.S. dollar allows for some selective bargain hunting in the lagging deep cyclical sectors, which have underperformed this year. This week we are prospecting in the industrials sector. The Wheels Are Turning: Upgrade Machinery Machinery stocks have been stronger than we anticipated. It is doubtful that an underweight position will pay off even if the broad market stays in a corrective phase. Many of the sales and earnings drags on the broad machinery industry, which comprises both industrial machinery and construction machinery & heavy trucks indexes, are lifting. Our primary concerns had been that the overhang from a lack of resource-related investment and a strong U.S. dollar would undermine sales performance (Chart 5). The former may not change much given poor resource balance sheet health, but the U.S. dollar has stopped appreciating. The currency bull market may have gone on extended hiatus if foreign growth continues to improve and the recent disappointing U.S. labor market report was the beginning of a period of economic cooling, as we expect. Despite the resilience of relative share performance, the machinery group is not overpriced based on a normalized relative forward P/E basis (Chart 5). A move to above average valuations requires an acceleration in relative profits. The objective message from our models has turned upbeat. Our Global Capital Spending Indicator has climbed back into positive territory. That primarily reflects the firming in global purchasing manager's surveys. G3 capital goods order momentum has not yet pushed above zero, but should soon recover based on our model (Chart 6). Chart 5Two Drags, But... Chart 6... Other Engines Are Revving Developing economies may soon participate to a greater degree, if the budding turnaround in long moribund Chinese loan demand gains traction (Chart 6). While China has begun to target a cooler housing market, the improvement in overall credit demand should provide an important offset. Other developing countries are easing policy and trying to spur growth, which should help machinery consumption. When global output growth recovers, machinery demand tends to demonstrate its high beta characteristics. Chart 6 shows that our global, excluding the U.S., machinery new orders proxy has jumped sharply in recent months, consistent with our global machinery exports proxy (Chart 6). While the previously strong U.S. dollar threatened to divert this demand to non-U.S. competitors, the playing field has leveled: U.S. machinery new orders have accelerated. The revival in coal prices is a major plus, given that the coal industry is a key source of domestic machinery demand (Chart 7, second panel). The new order jump, especially compared with inventories, bodes well for additional strength in machinery output (Chart 7, middle panel). Faster production should further propel our productivity proxy, which already suggests analyst earnings upgrades lie ahead (Chart 7). Better machinery sales prospects will add to the productivity gains already evident from cost control and capacity restraint. Chart 8 shows that machinery companies have had a clear focus on profit margin preservation. Headcount continues to contract, while inventories at both the wholesale and manufacturing levels are lean. Chart 7New Order Recovery Chart 8Lean There is corroborating evidence of tight supplies, as machinery selling prices are climbing anew even though factory utilization rates are not far off their lows (Chart 8). If demand strength persists, then additional pricing power upside is probable. All of this argues for making a full shift from underweight to overweight in the S&P industrial machinery group. This full upgrade does not extend to the S&P construction machinery & heavy trucks sub-component. Heavy truck sales are very weak, and the outlook for agriculture and food prices is shaky. Food commodity prices remain depressed (Chart 9), which will limit agricultural spending budgets. There is a high correlation between raw food price inflation and relative forward earnings estimates. Moreover, we remain skeptical that the resource industry is about to embark on a major expansion. Instead, only maintenance capital spending is probable, which is not conducive to driving a meaningful increase in construction machinery demand. It is notable that Caterpillar's machine sales to dealers continue to contract throughout most regions of the world. As such, chronic pricing power pressure will persist, keeping relative forward earnings under wraps (Chart 9). In sum, we are shifting our industrial machinery recommendation from underweight to overweight, to reflect the hiatus in the U.S. dollar bull market and firming in other leading top-line growth indicators. The S&P construction machinery & heavy trucks index only warrants an upgrade to neutral. These allocation changes argue for removing the overall industrials sector from our high-conviction underweight list, protecting the profit that accrued from year-to-date underperformance. From an industrials sector standpoint, it has paid to be skeptical of extrapolating the scale of the surge in leading sentiment indicators, such as capital spending intentions. However, enough evidence has now materialized to expect that the contraction in industrials sector relative forward earnings momentum should soon draw to a close. Core durable goods orders recently returned to growth territory, supporting the budding upturn in our Cyclical Macro Indicator (Chart 10). Both herald profit stabilization. Pricing power has rebounded, although capital goods import prices are still deflating, albeit at a lesser rate. Chart 9A Laggard Chart 10Our Models Have Perked Up Importantly, U.S. export price inflation is no longer lagging the rest of the world, suggesting that the U.S. manufacturers are regaining competitiveness (Chart 10). The upshot is that deflationary pressures are easing. Bottom Line: Lift the S&P industrial machinery index to overweight and the S&P construction machinery & heavy trucks index to neutral. We are also taking the industrials sector off of our high-conviction underweight list and raising allocations to neutral, partially to protect against a continued lateral move in the U.S. dollar. The ticker symbols for the stocks in the S&P construction machinery & heavy truck index are: BLBG: S5CSTF-CAT, PCAR, CMI. The ticker symbols for the stocks in the S&P industrial machinery index are: BLBG: S5INDM-ITW, IR, PH, SWK, FTV, DOV, PNR, SNA, XYL, FLS. Auto Components: Engine Trouble While we are upbeat on the broad consumer discretionary index and recently augmented restaurants to overweight, the niche S&P auto components index remains in the underweight column. Is such bearishness still warranted, especially following recent signs of life in share prices? The short answer is yes. Vehicle sales have plateaued and are unlikely to reaccelerate because pent-up demand has been fully exhausted and auto credit is harder to come by. Banks have started tightening the screws on auto loans. Auto loan delinquency rates are hooking up and charge-off rates have been rising sequentially since Q2/2016 according to the latest FDIC Quarterly Banking Profile. That reflects previous lax lending standards, especially in the sub-prime category. As credit availability dries up, auto loan growth will continue to deteriorate. Chart 11 shows that subprime auto loan originations have an excellent track record in leading light vehicle sales, given that they represent the marginal buyer. Moreover, rising interest rates are also denting affordability (Chart 11, bottom panel). All of this suggests low odds of renewed strength in vehicle demand. The last time vehicle sales flat-lined was in the middle of the last decade, from 2003 to 2007, share prices underperformed reflecting a relative valuation squeeze (Chart 11). Importantly, deflation has taken root in the auto industry and will likely intensify in the coming months. Auto factories are reasonably quiet, in sharp contrast with the recovery in overall industrial production (Chart 12). Chart 11Tighter Auto Loan Standards... Chart 12... Will Sustain Deflationary Forces The auto shipments-to-inventories ratio is probing multi-decade lows and car parts inventories both at the retail and manufacturing levels are beginning to pile up (Chart 13). Without a resurgence in vehicle sales, inventory liquidation pressures will rise, reinforcing the deflationary impulse and warning that industry earnings will likely underwhelm. Moreover, used car prices have nosedived. Used car prices tend to lead new car price inflation (Chart 12). Recent anecdotes of cutthroat competition in dealerships, with massive incentives failing to turn around sales, signal that deflation along the supply chain will likely become entrenched. Finally, international sales are unlikely to fill in the domestic void. Emerging markets (ex-China) automobile sales have been contracting, heralding an underperformance phase for the S&P auto components index (Chart 14, top panel). Chart 13Too Much Supply Chart 14No Global Relief There could be a respite if the U.S. dollar weakens substantially (Chart 14, second panel), but historically high relative valuations warn that optimism has already run ahead of the cloudy earnings outlook (Chart 14, bottom panel). Adding it up, auto demand will remain uninspiring as banks tighten their grip on auto loan lending standards, industry deflation is gaining steam owing to inventory accumulation, and there is no sizeable offset from foreign sales. This is recipe for an underweight position. Bottom Line: We reiterate our underweight stance in the S&P auto components index. The ticker symbols for the stocks in the S&P 1500 auto components index are: DLPH, GT, BWA, GNTX, DAN, DORM, LCII, CTB, CPS, THRM, AXL, FOXF, SMP, MPAA, SUP. Current Recommendations Current Trades Size And Style Views Favor small over large caps and stay neutral growth over value.
This year's surge in the S&P industrial machinery index is in jeopardy of making a full reversal, because earnings follow-through is not forthcoming. Previous sources of industry support, such as aerospace and automotive demand, are eroding. That is evident in the inability of machinery orders to gain traction, even in countries that have experienced currency weakness. Machinery orders are contracting steeply in Japan and Korea, while German machinery demand is barely growing. It is doubtful that the U.S. can buck this trend, particularly if the U.S. dollar continues to appreciate. Without top-line improvement, factory activity will wane, further undermining machinery productivity growth and profitability. The S&P industrial machinery index remains a high-conviction underweight. The ticker symbols for the stocks in this index are: BLBG: S5INDM - ITW, SWK, IR, PH, FTV, DOV, PNR, XYL, SNA, FLS.
Unlike rails, the S&P industrial machinery index has tested prior relative performance highs even though the global manufacturing sector is still laboring under excess capacity in Asia and weak commodity prices. Relative share price performance has already diverged wildly from oil prices, a rare occurrence, and a re-convergence is probable if profits fall short. While companies have cut inventories and staff to address productivity slippage, there is little top-line relief ahead. U.S. machinery new orders continue to contract and there is no help forthcoming from abroad. Non-U.S. developed economies are struggling. Capital spending is in retreat, based on the contraction in capital goods orders and capital goods imports. Our proxy for global machinery orders, excluding the U.S., is contracting. Consequently, there is little scope for a recovery in machinery output, which is necessary to lift utilization rates and allow the industry to sustainably escape deflation. We put this group on our high-conviction underweight list on Monday. The ticker symbols for the stocks in this index are: BLBG: S5INDM - ITW, SWK, IR, PH, PNR, DOV, SNA, XYL, FLS.