Inflation/Deflation
The August US Personal Income and Outlays report was broadly in line with expectations. Personal income rose 0.2% m/m following the prior month’s 1.1% m/m increase. Meanwhile, real personal spending grew 0.4% m/m after a downwardly revised percentage decline…

Highlights Recommended Allocation
Quarterly Portfolio Outlook: Stay Bullish But Verify
Quarterly Portfolio Outlook: Stay Bullish But Verify
The global economy will continue to grow at an above-trend rate over the next 12 months and central banks will remove accommodation only slowly.But the second year of a bull market is often tricky: Growth slows after its initial rebound, and monetary policy starts to be tightened, amid rising inflation.Equities are likely to outperform bonds over the next 12 months, driven by improving earnings, but at a slower pace than over the past year and with higher volatility.We continue to recommend only a cautiously optimistic stance on equities, with an overweight in US equities, and underweight in Europe. Our sector overweights are a mix of cyclicals (Industrials), plays on higher rates (Financials), and selective defensives (Health Care).China is likely to announce a stimulus to cushion the impact from Evergrande, which might push up oversold Chinese stocks. We close our underweight on Chinese equities, but raise them only to neutral as the real estate sector looks vulnerable. That could be bad news for commodities and the rest of Emerging Markets, which we cut to underweight.The Fed is likely to announce tapering this quarter, and raise rates in December 2022. This is likely to push up 10-year Treasury yields to 2-2.25% by then, and so we remain underweight duration.Investment-grade credit is expensive, but B-rated high-yield bonds still look attractive as defaults continue to decline. EM corporate debt is riskier post-Evergrande, but higher-rated sovereign dollar debt offers a good spread pickup.OverviewThe second year of a bull market is often tricky. Growth starts to slow after its initial rebound, and central banks move towards tightening policy. This does not signal the end of the bull market, but equity returns in Year 2 are typically lacklustre (Table 1).That is exactly the situation markets face now. Growth has been surprising on the downside, and inflation on the upside over the past few months (Chart 1). Table 1Year 2 Of Bull Markets Often Has Only Weak Returns
Quarterly Portfolio Outlook: Stay Bullish But Verify
Quarterly Portfolio Outlook: Stay Bullish But Verify
Chart 1Growth Surprising On The Downside, Inflation On The Upside
Growth Surprising On The Downside, Inflation On The Upside
Growth Surprising On The Downside, Inflation On The Upside
Our basic investment stance remains that the global economy will continue to grow at an above-trend rate over the next 12 months (as the consensus forecasts – Chart 2), and that central banks will remove accommodation only slowly. We can see no signs of a recession on the 18-to-24-month horizon and, as Chart 3 shows, equities almost always outperform bonds except during and in the run-up to recessions. Chart 2But Growth Will Continue To Be Above Trend
But Growth Will Continue To Be Above Trend
But Growth Will Continue To Be Above Trend
Chart 3Equities Outpeform Bonds Except Around Recessions
Equities Outpeform Bonds Except Around Recessions
Equities Outpeform Bonds Except Around Recessions
This justifies a moderately pro-risk stance, with overweights in equities and (selectively) credit, and a big underweight in government bonds. But the risks to this sanguine view are rising, and the next few months could be choppy. Stay bullish, but keep a close eye on what could go wrong.The slowdown in growth is largely because manufacturing boomed last year and now simply the pace of growth is decelerating. Manufacturing PMIs are (mostly) still above 50, but have fallen from their peaks (Chart 4). Supply-chain bottlenecks have also dented production. And consumers will spend less on durables and more on services, as lockdowns are eased.We have emphasized that the $2.5 trillion of excess savings in the US will boost spending over coming quarters. But enhanced unemployment benefits have now ended and most of the savings left are with richer households who have a lower propensity to spend (see page 9 for more on this). Covid also remains a risk: Cases are stickily high in some countries and consumers are still not 100% confident about going out to dine and for entertainment (Chart 5). Chart 4PMIs Falling But Mostly Still Above 50
PMIs Falling But Mostly Still Above 50
PMIs Falling But Mostly Still Above 50
Chart 5Consumers Still A Bit Wary About Going Out
Consumers Still A Bit Wary About Going Out
Consumers Still A Bit Wary About Going Out
China is an increasing risk to growth. Its economy has been slowing all year as a result of monetary tightening (Chart 6) and this may be exacerbated by the fallout from Evergrande. The Chinese authorities are likely to announce a stimulus package to offset the slowdown (which is why we are neutralizing our underweight on Chinese equities). But the stimulus will probably be only moderate and targeted, and they will not allow a renewed boom in real estate (as we explain on page 11), which has been a significant driver of Chinese growth in recent years (Chart 7). This could hurt the economies of Emerging Markets and other commodity producers, which depend on Chinese demand. Chart 6China Has Been Slowing All Year
China Has Been Slowing All Year
China Has Been Slowing All Year
Chart 7Real Estate Has Been A Big Driver Of Chinese Growth
Real Estate Has Been A Big Driver Of Chinese Growth
Real Estate Has Been A Big Driver Of Chinese Growth
At the same time that growth is slowing, inflation is proving a little stickier and broader-based than was expected. Measures of underlying inflation pressure, such as trimmed-mean CPIs, suggest that it is no longer only pandemic-related prices that are rising in the US and some other countries (Chart 8). Rising shipping charges (container rates are up 228% this year) are pushing up the cost of imported goods. And the first signs are emerging that labor shortages, especially in restaurants and shops, are causing wage rises (Chart 9). Chart 8Inflation Is Broadening Out In Some Countries
Inflation Is Broadening Out In Some Countries
Inflation Is Broadening Out In Some Countries
Chart 9The First Signs Of Wage Rises?
The First Signs Of Wage Rises?
The First Signs Of Wage Rises?
Unsurprisingly, then, central banks are starting to wind down their asset purchases and even raise rates. Norges Bank was the first developed central bank to hike this cycle in September. New Zealand may follow in Q4. And the Fed has pretty clearly signaled that it, too, will announce tapering before year-end. And this is not to mention Emerging Market central banks, many of which have had to raise rates sharply in the face of soaring inflation (Chart 10).A shrinking of excess liquidity is another common phenomenon of the second stage of expansions, as monetary policy starts to be tightened and liquidity is directed more towards the real economy and less towards speculation. This, too, often caps the upside for risk assets, though it doesn’t usually cause them to collapse (Chart 11). Chart 10EM Central Banks Raising Rates Sharply
EM Central Banks Raising Rates Sharply
EM Central Banks Raising Rates Sharply
Chart 11Excess Liquidity Is Drying Up
Excess Liquidity Is Drying Up
Excess Liquidity Is Drying Up
Table 2Who Will Raise Rates When?
Quarterly Portfolio Outlook: Stay Bullish But Verify
Quarterly Portfolio Outlook: Stay Bullish But Verify
While there are many factors that might cause market jitters over the coming months, the underlying picture is that robust growth is likely to continue and central banks will remain cautious about tightening too quickly. Excess savings will propel consumption, companies will need to increase capex to fulfill that demand, and the impact of fiscal stimulus is still coming through (Chart 12). The big central banks won’t raise rates for some time: The Fed perhaps in late-2022, but the ECB and the Bank of Japan not over the forecast horizon (Table 2). Decent growth and easy policy remains a positive backdrop for risk assets over the 12-month horizon. Chart 12Fiscal Stimulus Is Still Coming Through
Quarterly Portfolio Outlook: Stay Bullish But Verify
Quarterly Portfolio Outlook: Stay Bullish But Verify
Garry Evans, Senior Vice PresidentChief Global Asset Allocation Strategistgarry@bcaresearch.comWhat Our Clients Are AskingHow Worried Should We Be About Inflation?Since the beginning of the year, we have argued that the current period of high inflation will be transitory. The market has adopted this view, with 5-year/5-year forward inflation expectations remaining at 2.2%. Chart 13Growing Signs That Inflation Might Not Be Transitory
Growing Signs That Inflation Might Not Be Transitory
Growing Signs That Inflation Might Not Be Transitory
However, we have grown worried about the possibility that inflation might be stickier at a higher level than we initially expected. Specifically, while it is true that prices of supply-constrained items – such as used cars – have started to ease, there are signs that higher inflation has began to broaden. Core CPI excluding pandemic-related items and cars has started to pick up, with its 6-month rate of change reaching its highest level in more than a decade (Chart 13, panel 1). Meanwhile 42% of the PCE basket grew at an annual rate of more than 5% in July, compared to just 24% in March.Currently, we are watching the behavior of prices in the housing and labor markets to check if our worries are justified. We pay particular attention to these sectors because price pressures in housing and labor can be self-sustaining, giving rise to inflationary spirals if left unchecked.What is happening to inflation in these areas? So far, the signals are mixed. Even though wage growth remains within the historical norm for now, any further advance in wages will take us to a decade high (Chart 13, panel 2). Likewise, annual growth of shelter cost remains low, though its 6-month change suggests that it will soon begin to rise to its pre-pandemic levels (Chart 13, panel 3).Our base case continues to be that high inflation is transitory. That being said, we have positioned our portfolio to hedge for the risk that this view is wrong. We have given an overweight to real estate in our alternatives portfolio and within equities. Will Consumers Really Spend All Those Savings? Chart 14Low-Income Households Did Not Save Much
Quarterly Portfolio Outlook: Stay Bullish But Verify
Quarterly Portfolio Outlook: Stay Bullish But Verify
Generous unemployment benefits and the year-long lockdown have pushed up US excess savings over the past 18 months to an estimated $2.5 trillion, and the household savings ratio to 9.6% (Chart 14, panel 1). The consensus is that these savings will bolster consumer spending and support broad economic growth over the coming quarters. However, this expectation is based on the assumption that all consumers have accumulated savings, whereas the reality is a bit different.Survey results from the US Census Bureau show that households earning under $75,000, which have the highest propensity to consume, have almost entirely spent their first stimulus checks and three-quarters of their second and third checks on expenses and paying off debt. Even for those earning over $75,000, only 50% of those stimulus receipts have gone into savings (Chart 14, panel 2).With the labor market still not back to full employment (albeit mostly because of labor supply issues), enhanced unemployment benefits coming to an end, fears of further Covid variants and lockdowns, and higher inflation, could precautionary savings rise? The years following the Global Financial Crisis suggest that they might: The savings rate rose from 3% at the onset of the GFC to 8% five years after it (Chart 14, panel 3). A similar attitude among consumers this time could put a dent in US growth, given that consumption makes up about 70% of GDP.This raises the risk that consumption might slow over the coming quarters. In our latest Monthly Portfolio Outlook, we highlighted that consumption is shifting away from goods towards services. While value added from manufacturing is only 11% of GDP, the effect on markets might be bigger, since goods producers make up about 40% of US market cap. What Is The Risk Of A Big Upside Surprise In US Employment?The recovery of the labor market remains at the center of investors’ and Fed officials’ attention. The reluctance to return to the workforce mostly reflects overly generous unemployment benefits and fears of getting infected. With the fourth wave of the pandemic showing signs of cresting and benefits expiring, the consensus is that the unemployment gap will soon shrink. We would, however, question whether the labor market can surprise significantly to the upside and recover faster than the market currently implies. A swift recovery would push up bond yields and bring forward the Fed’s liftoff date, which could hurt the outlook for risk assets. Chart 15The Labor Market Could Surprise To The Upside
The Labor Market Could Surprise To The Upside
The Labor Market Could Surprise To The Upside
The number of men not in the labor force but who want a job has fallen back to the pre-pandemic level (Chart 15, panel 1). The sharp decline in this indicator in August coincided with the expiration of unemployment benefits in some Republican states. The overall Federal pandemic benefits program expired in early September. This should push even more people to return to the workforce (Chart 15, panel 2).However, there are still close to 3.5 million women (almost half a million above the pre-pandemic level) who are not in the labor force but would like a job: Some of these are keen to return to the workplace once they deem it safe for their children to get vaccinated and return to school. With governments eager to speed up vaccination rollouts and Pfizer’s recent announcement showing positive results of its Covid vaccine in trials on children under the age of 12, more women should return to the workforce.It is also worth noting that some of the most hard-hit sectors – such as leisure & hospitality – have already recovered over 80% of the jobs lost since February 2020. For sectors yet to reach such a high recovery rate, for example education & health services, returning workers have room to choose from jobs. For every job lost since the onset of the pandemic, there are now 2.1 job openings (Chart 15, panel 3). What Is The Risk Of Contagion From Evergrande?In September, Chinese property developer Evergrande failed to make an interest payment on an overseas bond issue. What would be the consequences for the Chinese and global economy if it went bankrupt? Chart 16Chinese Companies Are Highly Indebted
Chinese Companies Are Highly Indebted
Chinese Companies Are Highly Indebted
Evergrande is big. Its debts are $306 billion, 2% of Chinese GDP. It has yet to build 1 million units that have already been paid for. It employs 200,000 people. And the issue is bigger. For years, investors have worried about China’s corporate debt, which is 160% of GDP (Chart 16). Chinese companies have issued almost $1 trillion of bonds in foreign currencies. The property market plays an outsized role in the economy: It comprises 66% of household wealth (versus 24% in the US); real estate and related industries amount to some 30% of GDP.The government will likely rescue Evergrande. But it faces a dilemma: For years it has been trying to reduce bad debt and stabilize house prices. It cannot bail out Evergrande’s creditors without undermining those efforts.It will probably aid apartment buyers, who have paid upfront for Evergrande properties, and make arrangements for domestic banks to swap their debt for equity or land holdings. But it won’t bail out equity owners or foreign bond holders. It will also not ease real-estate market restrictions, such as the “three red line” rules on property companies’ leverage. Such a package could damage Chinese individuals’ confidence in property, and foreigners willingness to provide capital to the industry.China may also announce a stimulus package to bolster the economy. But local governments are dependent on land sales for around a third of their income (Chart 17). If the property market is weak, the transmission mechanism of stimulus may be damaged. Finally, Chinese housing sales are highly correlated to global commodities prices, which may fall as a result (Chart 18). Chart 17Local Governments Depend On Land Sales
Local Governments Depend On Land Sales
Local Governments Depend On Land Sales
Chart 18A Slowdown In Housing Would Hurt Commodities
A Slowdown In Housing Would Hurt Commodities
A Slowdown In Housing Would Hurt Commodities
BCA Research’s EM and China strategists do not see Evergrande as likely to trigger a systemic crisis or crash, but it will reinforce the chronic credit tightening that has been underway in China.1Is It Time To Overweight Japanese Equities?Japanese equities staged a strong rally in the third quarter, outperforming the MSCI global equity index by about 5% in US dollar total return terms. On an absolute basis, the MSCI Japan price index in USD is near its 1989 historical high, even though the local-currency index is still more than 30% below its 1989 all-time high.We have been underweight Japanese equities in our global equity portfolio since July 2019, mainly due to unfavorable structural forces such as the aging population and chronic deflationary pressures. Japanese equities have tended to stage counter-trend bounces, some of which were quite significant in magnitude (Chart 19, panel 1). We therefore recommend clients move to the sidelines to avoid the potentially short-lived but sharp upside risk, supported by the following two considerations:First, foreign investors play a significant role in the Japanese equity market. The fact that MSCI Japan in USD terms is near its all-time high could trigger more foreign buying, given the positive correlation between the price index and price momentum (Chart 19, panels 3 and 5).Second, Japanese equities are among the cheapest globally, trading at a large discount to the global index. Currently, the discount is larger than its 3-year moving average, making it risky to underweight Japan.So why not overweight Japanese equities?The Japanese equity index is dominated by Industrials. It should benefit from our favorable view on this sector. However, Japan’s machinery and machine tool industries have heavy reliance on Asia, especially China. Orders from China have already rolled over with the Chinese PMI now in contractionary territory. In the meantime, the rolling-over of the US and European PMIs also does not bode well for orders from the other two large regions (Chart 20). Chart 19Upgrade Japanese Equities To Neutral
Upgrade Japanese Equities To Neutral
Upgrade Japanese Equities To Neutral
Chart 20Japan's Heavy External Reliance
Japan's Heavy External Reliance
Japan's Heavy External Reliance
We expect that China will eventually inject stimulus into its economy in a measured fashion such that the negative spillover to Japan and Europe may be limited. That’s why we are also taking profit in our underweight position on China after the recent sharp selloff in the offshore Chinese equity index (see page 18).Global EconomyOverview: The developed world continues to see strong growth, albeit at a slower pace than nine months ago. This is causing a more persistent – and more broad-based – rise in inflation, especially in the US, than was previously expected. However, the Fed is unlikely to raise rates for at least another 12 months, and the ECB and BOJ not on the forecast horizon. The biggest risk to global economic growth is the slowdown in China and now the troubles at Evergrande. We assume that the Chinese government will launch a stimulus to cushion the slowdown, but it may be less effective than the market expects. Chart 21US Growth Has Slowed But Remains Above Trend
US Growth Has Slowed But Remains Above Trend
US Growth Has Slowed But Remains Above Trend
US: Growth has been slowing relative to expectations all year (Chart 21, panel 1). Nonetheless, it is still well above trend. The September Markit PMIs remained high at 60.5 for manufacturing and 54.4 for services. Although consumer confidence has fallen back a little because of the third Covid wave in some southern states, retail sales in August were still up 15% year-on-year and 1.8% (ex autos) month-on-month. Growth seems set to remain above trend, as consumers spend their $2.5 trillion of excess savings, companies increase capex to ease supply-chain bottlenecks, and the government rolls out more fiscal spending. The IMF forecasts 4.9% real GDP growth in 2022, after 7.0% this year. Euro Area growth also remains robust, with the manufacturing and services PMIs at 58.7 and 56.3 respectively in September. Vaccination levels have risen (more quickly than in the US) and, as a consequence, lockdowns and international travel restrictions have been largely eased. Inflation pressures remain more restrained than in the US, with core CPI at only 1.6% (mainly pushed up by pandemic-related shortages) and the trimmed-mean CPI barely above zero. The ECB persuaded the market that its tapering, announced in September, is very dovish, and it is certainly true that – with its new 2% symmetrical inflation target – the ECB is not set to raise rates any time soon. The IMF’s forecasts are for 4.6% real GDP growth this year, and 4.3% next.Japan has generally lagged the recovery in the rest of the world, due to its structural headwinds, but it is now seeing some more robust data. Industrial production is up 12% year-on-year and exports 26%, although the PMIs still remain somewhat depressed at 51.2 for manufacturing and 47.4 for services in September. Japan’s initial slow vaccine rollout has recently accelerated and the percent of double-vaccinated adults now exceeds the US. This suggests that sluggish consumption (with retail sales up only 2% year-on-year) might start to recover. Markets got excited about the prospects for fiscal stimulus ahead of the general election, which has to be held by the end of November. We do not see new LDP leader Fumio Kishida, who is likely to win that election, making any significant change in policy. Chart 22China Is The One Market Where Growth Is Slowing Sharply
China Is The One Market Where Growth Is Slowing Sharply
China Is The One Market Where Growth Is Slowing Sharply
Emerging Markets: China’s slowdown – and the government’s possible reaction to it with a large stimulus – dominate the outlook for Emerging Markets. Both China’s manufacturing and services PMIs are now below 50 (Chart 22, panel 3), and retail sales, industrial production and fixed-asset investment all surprised sharply on the downside last month. We expect an easing of policy, but only a moderate one. Elsewhere in Emerging Markets, central banks continue to struggle with the puzzle of whether they need to raise rates (as Russia, Brazil and Mexico have done) in the face of rising inflation and falling currencies, despite continuing underlying weakness in their economies. Interest Rates: US inflation looks stickier than believed three months ago, with a broadening of inflation away from just pandemic-affected items (see “How Worried Should We Be About Inflation?" on page 8). But inflation expectations are still well under control (Chart 22, panel 4) and so the Fed is likely to begin tapering only in December and not raise rates until end-2022. This will most likely cause a moderate rise in long-term rates with the 10-year US Treasury yield rising to 1.7% by year-end and 2-2.25% by the time of the first Fed rate hike. Inflation elsewhere in developed economies looks more subdued (except in the UK and Canada), and so long-term rates are likely to rise somewhat more slowly there.Global Equities Chart 23Watch Earning Revisions
Watch Earning Revisions
Watch Earning Revisions
Global equities ended the quarter more or less flat after a very strong performance in the first eight months of the year and a volatile September. Earnings growth continued its strong trend from the first half, powered by margin improvement in both the DM and EM universes. Consequently, the forward PE multiple contracted further (Chart 23).Going forward, despite worries about the potential spillover to the global economy and global financial markets from China’s Evergrande fiasco, the “earnings-driven” theme will likely continue. BCA’s global earnings model points to over 40% earnings growth for the next 12 months, and all sectors have positive forward earnings estimates. However, net revisions by analysts seem to be cresting as the global manufacturing PMI has rolled over from a very high level. Even though valuation is less stretched than at the beginning of the year, equities are still expensive by historical standards. In addition, central banks are preparing for an eventual withdrawal of their massive liquidity injections and there is still plenty of uncertainty concerning Covid variants. GAA has been cautiously optimistic so far this year with overweights on equities and cash relative to bonds, and overweight US equities relative to Japan, Europe and China. These positions have panned out well. After adjustments made in April and July, our sector portfolio has been well positioned by overweighting Industrials, Financials, Real Estate and Healthcare, underweighting Materials, Utilities and Consumer Staples, and being neutral on Tech, Consumer Discretionary and Communication Services. We have not made any changes to our sector recommendations this quarter.In accordance with our long-held belief of “taking risk where risk will likely be rewarded the most,” we make the following adjustments to our country allocations: close the underweights in China and Japan and the overweight in the UK; and initiate one new position: Underweight EM-ex-China. Overall, our country portfolio has a defensive tilt with an overweight in the US (defensive) and underweights in the euro area and EM-ex China (cyclical), while being neutral on the UK, Japan, Australia and Canada. Country Allocation: Upgrade MSCI China And Japan, Downgrade UK And EM-ex-China. We have been underweight MSCI China and overweight the UK since April 2021, and underweight Japan since July 2019.The China underweight generated outperformance of 23% and the UK overweight -2%, while the Japanese position produced an outperformance of 7%. Chart 24Favor China vs The Rest of The EM
Favor China vs The Rest of The EM
Favor China vs The Rest of The EM
While the fate of Evergrande Group, China’s second largest property developer, remains uncertain, our view is that the government will come up with a restructuring plan to minimize damaging ripple effects on the Chinese economy. This view is supported by the behavior of the domestic A-share market and also the CNY/USD, which has diverged from the offshore equity market (Chart 24, Panel 5).BCA Research’s house view is that China will now stimulate its economy, but only at a measured pace. This means that further underperformance of MSCI China is likely to be limited relative to the global benchmark, as shown in Chart 24, panel 1. The ongoing deleveraging in the Chinese real estate sector, however, means that activity in the sector will probably slow further, reducing demand for construction materials. This may put a dent on the strength of metal prices, therefore negatively impacting the ex-China EM equity index, as shown in panel 2.Moreover, the relative performance of China vs non-China EM is approaching a very oversold level while the relative valuation measure is at an extreme (Chart 24, panels 3 and 4). As such, we switch our positioning by upgrading Chinese equities to neutral from underweight and downgrade EM ex China to underweight from neutral. This implies an overall underweight to Emerging Markets.We also close the UK overweight to support an upgrade in Japan (see more details on page 13). The UK overweight was largely based on a positive view of the GBP, which has now risen to fair value.Government Bonds Chart 25Watch Inflation In 2022
Watch Inflation in 2022
Watch Inflation in 2022
Maintain Below-Benchmark Duration. Global bond yields ignored the sharp rise in core inflation in Q3. The US 10-year Treasury yield actually declined in the first two months of the quarter in response to the muted inflation readings in non-Covid related segments of the economy. Even with the fast run-up in yields in September, the US 10-year yield finished the quarter at 1.52%, only about 5 bps higher than the level on June 30th (Chart 25).We have advised clients to focus on the jobs market to determine when the Fed will lift the Fed Funds Rate off its zero bound because of the Fed’s emphasis on “maximum employment” as a pre-condition for this. However, the Fed has not clearly defined what “maximum employment” means. According to calculations by our US bond strategists, the US unemployment rate will fall to 3.8%, with a 63% participation rate, by the end of 2022 if job creation averages a reasonably achievable 414,000 per month until then. Our bond strategists think that the Fed will be forced to clarify its definition of “maximum unemployment” over the coming months and, as we get close to it next year, the key indicator to watch will shift back to inflation. If inflation remains high, then the Fed will be quicker to declare that the labor market is at “maximum employment”, and vice versa.Currently, the overnight index swap curve indicates the first rate hike will be in January 2023 with a total rate increase of 123 bps by the end of 2024. BCA Research’s house view is that the Fed will announce its first hike in December 2022 and will hike at a faster pace than what is priced in by the market. This is based on our view that unemployment will likely reach 3.5% by end-2022 with inflation above the Fed’s target. This would suggest that long-term rates will rise too, and so bond investors should remain below benchmark duration.Corporate BondsSince the beginning of the year, investment-grade credit has provided roughly 200 basis points of excess return over duration-matched Treasurys, while high-yield bonds have generated almost 600 basis points. Chart 26Continue to Favor High-Yield Credit
Continue to Favor High-Yield Credit
Continue to Favor High-Yield Credit
We continue to have a neutral allocation to investment-grade credits within the fixed-income category. While supportive monetary policy should generally favor spread product, we believe there is much better value to be found outside investment-grade bonds, since these bonds are currently trading at historically high valuation levels (Chart 26, panel 1).We think valuations look much more attractive in the high-yield space, and as a result remain overweight within the fixed-income category. Our US Bond Strategy service expects the share of defaults in the space to fall to between 2.3% and 2.8% – below the default rate currently priced in by the market (Chart 26, panel 2). Within high yield, we prefer B-rated bonds since they offer the most attractive spread pickup on a risk-adjusted basis.What about EM debt? Currently we are cautious on EM corporate debt. The default of Chinese real estate developer Evergrande is likely to have ripple effects throughout EM credit markets and currencies. There are already signs of considerable strains, with EM corporate spreads starting to rise (Chart 26, panel 3). We recommend that investors focus on EM sovereign issuers such as Mexico, Russia, and Malaysia, given that they provide a significant yield pickup over US bonds with comparable credit ratings, and are less likely to default than their corporate counterparts.CommoditiesEnergy (Overweight): Oil prices are likely to remain close to current levels for the remainder of this year. However, recovering demand – particularly from Emerging Markets – and production discipline by the OPEC 2.0 coalition should support prices over the next two years. Given this backdrop, our Commodity & Energy strategists expect the price of Brent crude to average $75 and $80 per barrel in 2022 and 2023 respectively, with WTI trading $2-$4/bbl lower. Chart 27Limited Upside For Oil And Metals In The Short-Term
Limited Upside For Oil And Metals In The Short-Term
Limited Upside For Oil And Metals In The Short-Term
Industrial Metals (Neutral): Industrial metals’ prices have bifurcated. Those relating to alternative energy, such as copper, nickel and cobalt, continue to rise and are up 30% on average since the beginning of the year. Iron ore on the other hand has taken a colossal hit, falling over 53% from its May high. The knock-on effects of accelerating Chinese production cuts and softening economic activity, as well as Evergrande’s debt woes, will continue to put downward pressure on prices. In the short-term, we do not expect a significant rebound. However, in the longer-term, demand will recover – particularly if China implements significant stimulus – and supply will remain tight, which will help metal prices to recover.Precious Metals (Neutral): Gold prices did not react positively to the decline in US real rates over the past quarter. In fact, gold prices are slightly down, by ~1.5% since the start of July (Chart 27, panel 4). We expect real rates to rise as economic growth and the labor market recover and the Fed turns slightly more hawkish, while inflation moderates as base and pandemic effects abate. Rising real rates are a negative factor for the gold price. Nevertheless, inflation is likely to be a bit stickier than the market is currently pricing in, and we therefore maintain a neutral exposure to gold, since it is a good inflation hedge.CurrenciesUS Dollar Chart 28Do Not Underweight The Dollar Yet
Do Not Underweight The Dollar Yet
Do Not Underweight The Dollar Yet
Since we went from underweight to neutral on the dollar in April, the DXY has risen by only 1%. Our position remains the same for this quarter. On the one hand, momentum – one of the most reliable indicators for cyclical movements in the dollar – has turned firmly positive. Moreover, pain in the Chinese real-estate sector should weight on commodities and emerging markets – a development which historically has been bullish for the USD (Chart 28, panel 1). However, not all is good news for the greenback. Relative growth and inflation trends are starting to rebound in the rest of the world vis-à-vis the US (Chart 28, panel 2). Additionally, speculators are now firmly overweight the USD, and it remains expensive by 11% relative to PPP fair value. We believe that these forces could eventually be strong enough for the dollar bear market to resume. As a result, we are putting the US dollar on downgrade watch. Canadian DollarWe believe that there is upside to the Canadian dollar. Canada’s employment market is recovering faster than in the US, which should prompt the BoC to normalize interest rates before the Fed. Additionally, while many commodities are likely to suffer as China’s real estate market slows, oil should hold up relatively well since its demand is not as dependent on the Chinese economy. As a result, we are upgrading the CAD from neutral to overweight. Australian DollarWe remain underweight the AUD. While it is true that the AUD is now cheap on a PPP basis, weakness in iron ore from a slowing Chinese real-estate market should continue to weigh on the Aussie dollar. Chinese YuanWe are negative on the yuan on a cyclical basis. Interest-rate differentials should start moving against this currency (Chart 28, panel 3). While the Fed is likely to tighten policy as the labor market enters full employment, Chinese authorities will ease monetary policy to avert a full-blown crisis in their real-estate market.Alternatives Chart 29Outlook Remains Favorable For Private Equity And Real Estate
Quarterly Portfolio Outlook: Stay Bullish But Verify
Quarterly Portfolio Outlook: Stay Bullish But Verify
Return Enhancers: With public markets expensive and unlikely to provide investors with more than single-digit returns, the focus has shifted to alternative assets, particularly private equity (PE). Performance continues to be impressive, with an annualized return of 59% in Q4 2020 (Chart 29, panel 1). This supports our previous research that funds raised during recessions and early in expansions tend to outperform those raised late-cycle. Distributions from existing positions should allow limited partners (LPs – the investors who provide capital to PE funds) to commit to newer funds. Data from Preqin shows that more than $610 billion has been raised so far during 2021 (Chart 29, panel 2). We continue to favor Private Equity over Hedge Funds.Inflation Hedges: Last year’s inflationary pressures should moderate over the coming months as base effects and supply chain bottlenecks abate. Given this backdrop, we maintain our positive view on real estate versus commodity futures. Commodity prices have already shot up over the past 18 months and have limited upside from current levels: Energy prices are up by 61% since the beginning of the year, industrial metals 24%, and agriculture 17%. Over the past 15 years, REITs outperformed commodity futures when inflation was between 0% and 3% (Chart 29, panel 3). There are opportunities within the real-estate sector, despite our concerns about weaknesses in some segments of commercial real estate such as prime office property in major cities.Volatility Dampeners: We continue to favor farmland and timberland over structured products, particularly mortgage-backed securities (MBS). Farmland offers attractive yields and should continue to provide the best portfolio protection in the event of any market distress. MBS spreads, on the other hand, while wider than the pre-pandemic level, remain tight compared to the pace of mortgage refinancing (Chart 29, panel 4).Risks To Our ViewOur main scenario is based on a Goldilocks-like view of the world: That growth will be robust, but not so strong as to push up inflation further and cause central banks to turn hawkish. The risks, therefore, are that the environment turns out to be either too hot or too cold. Chart 30A Resurgence Of Covid
A Resurgence Of Covid
A Resurgence Of Covid
What could cause growth to slow? Covid remains the biggest risk. Cases are still high in many countries, and could rise again as people socialize indoors during the colder months (Chart 30). A more virulent strain is not inconceivable. Governments will be reluctant to impose lockdowns again, but consumers might become wary about going out.We have written elsewhere (see page 11) about the risks coming from a China slowdown and the aftermath of the Evergrande affair. A policy mistake is not improbable: The Chinese authorities want to stimulate the economy, but at the same time keep a lid on property prices. That will be a hard balance to achieve. Slower Chinese growth would hurt commodity producers and many Emerging Markets. Other risks to growth include fiscal tightening as employment-support schemes end and countries look to repair their budget positions (Chart 31), consumers building up precautionary savings and not spending their excess cash (see page 9), and problems caused by rising energy prices.Our view remains that the currently high inflation is transitory. But it is proving quite sticky and could remain high for a while. Inflation expectations are well anchored for the moment (Chart 32) but could rise above central banks’ comfort-zones if recorded core inflation in the US, for example, currently 3.6%, stays above 3% for another 12 months. This could bring forward the date of the first Fed rate hike (currently priced in for January 2023), raise long-term rates and, in turn, push up the dollar. A combination of rising US rates and a stronger dollar would have very negative consequences for heavily indebted Emerging Market economies. Chart 31Fiscal Drag
Fiscal Drag
Fiscal Drag
Chart 32Deanchoring Of Inflation Expectations
Deanchoring Of Inflation Expectations
Deanchoring Of Inflation Expectations
Footnotes1 Please see China Investment Strategy Report "The Evergrande Saga Continues," dated September 29, 2021 and Emerging Markets Strategy Report "On Chinese Internet Stocks, Real Estate And Overall EM," dated September 16, 2021, available at https://www.bcaresearch.com/GAA Asset Allocation
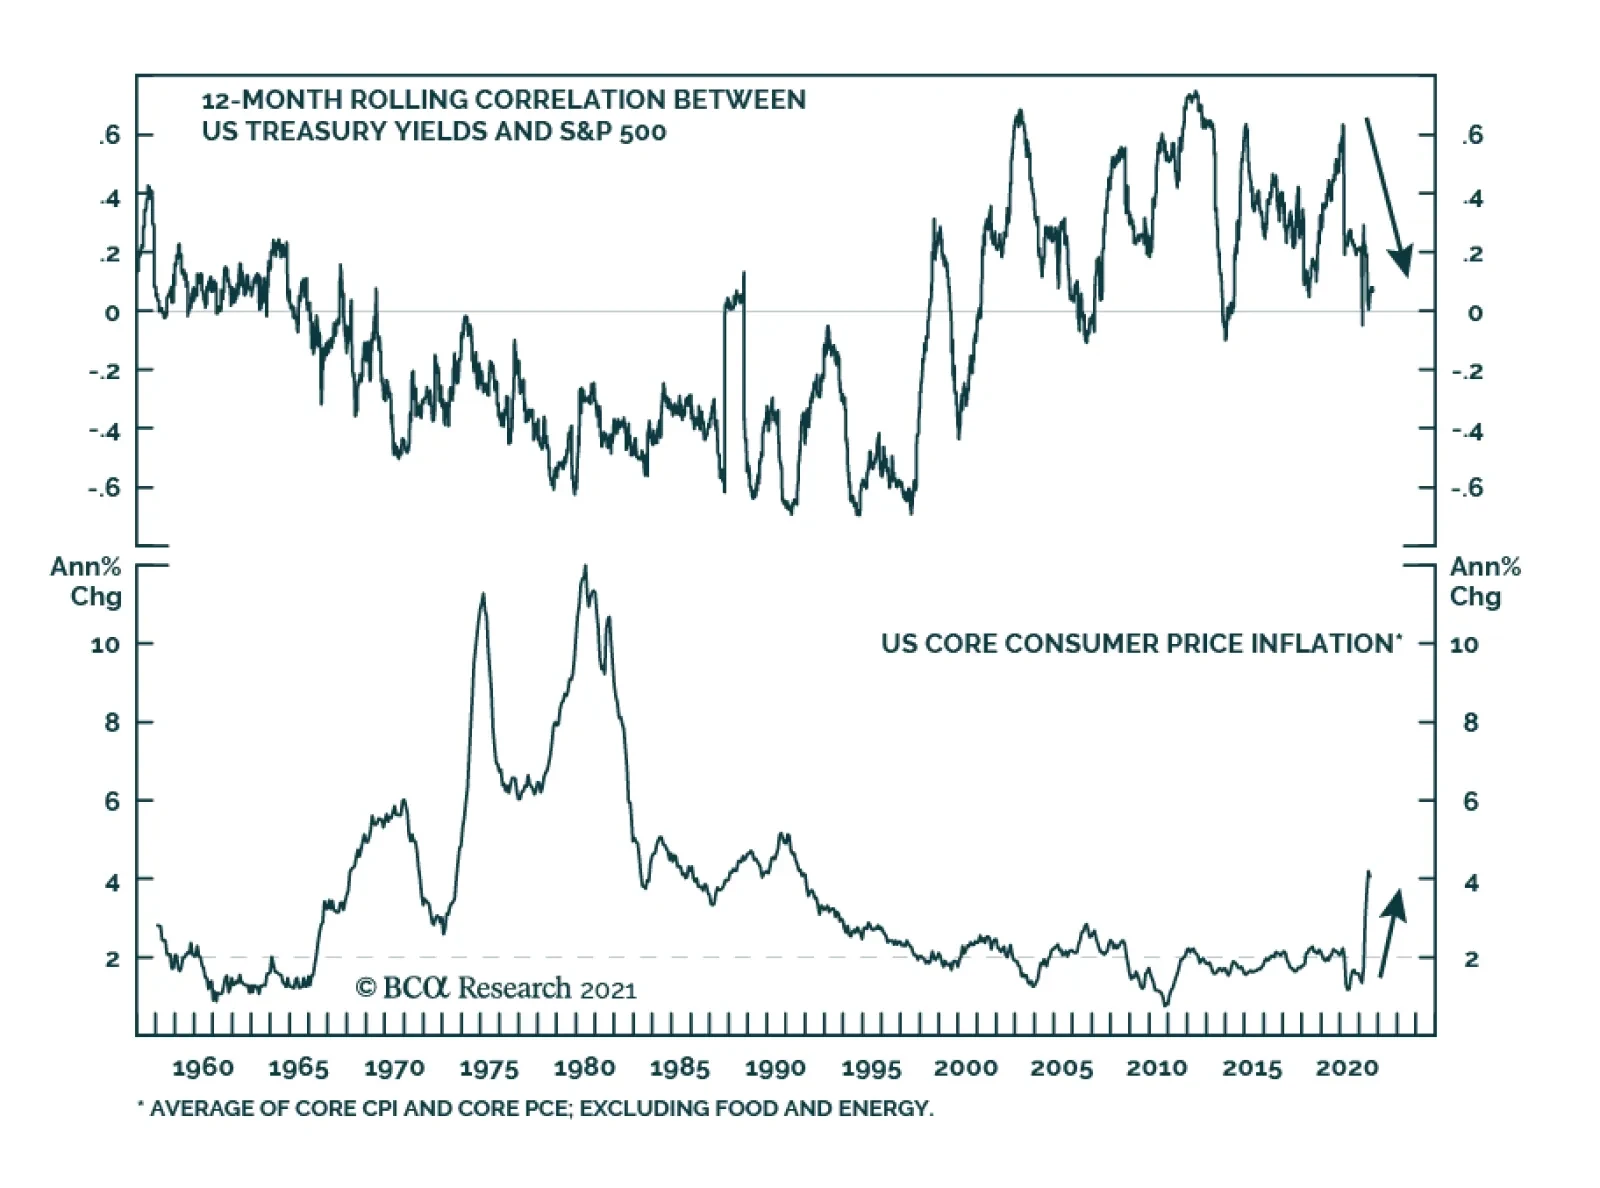
Highlights The current burst of inflation in developed economies is due to a (negative) supply shock rather than a (positive) demand shock. Consumer complaints of “poor buying conditions” mean that higher prices will cause demand destruction. Hence, it is extremely dangerous for central banks to respond with the signalling of tighter policy that leads to higher bond yields. The upper limit to the 10-year T-bond yield is no higher than 1.8 percent. Hence, this yield level would be a good cyclical entry point into both stocks and bonds. Continue to underweight consumer discretionary versus the market, given the very tight connection between weaker spending on durables and the underperformance of the goods dominated consumer discretionary sector. Commodities whose prices have not yet corrected are at much greater risk than those whose prices have corrected. Hence a new cyclical recommendation is to go underweight tin versus iron ore. Fractal analysis: Netflix versus Activision Blizzard, and AUD/NZD. Feature Chart of the Week"Buying Conditions Are Poor"
"Buying Conditions Are Poor"
"Buying Conditions Are Poor"
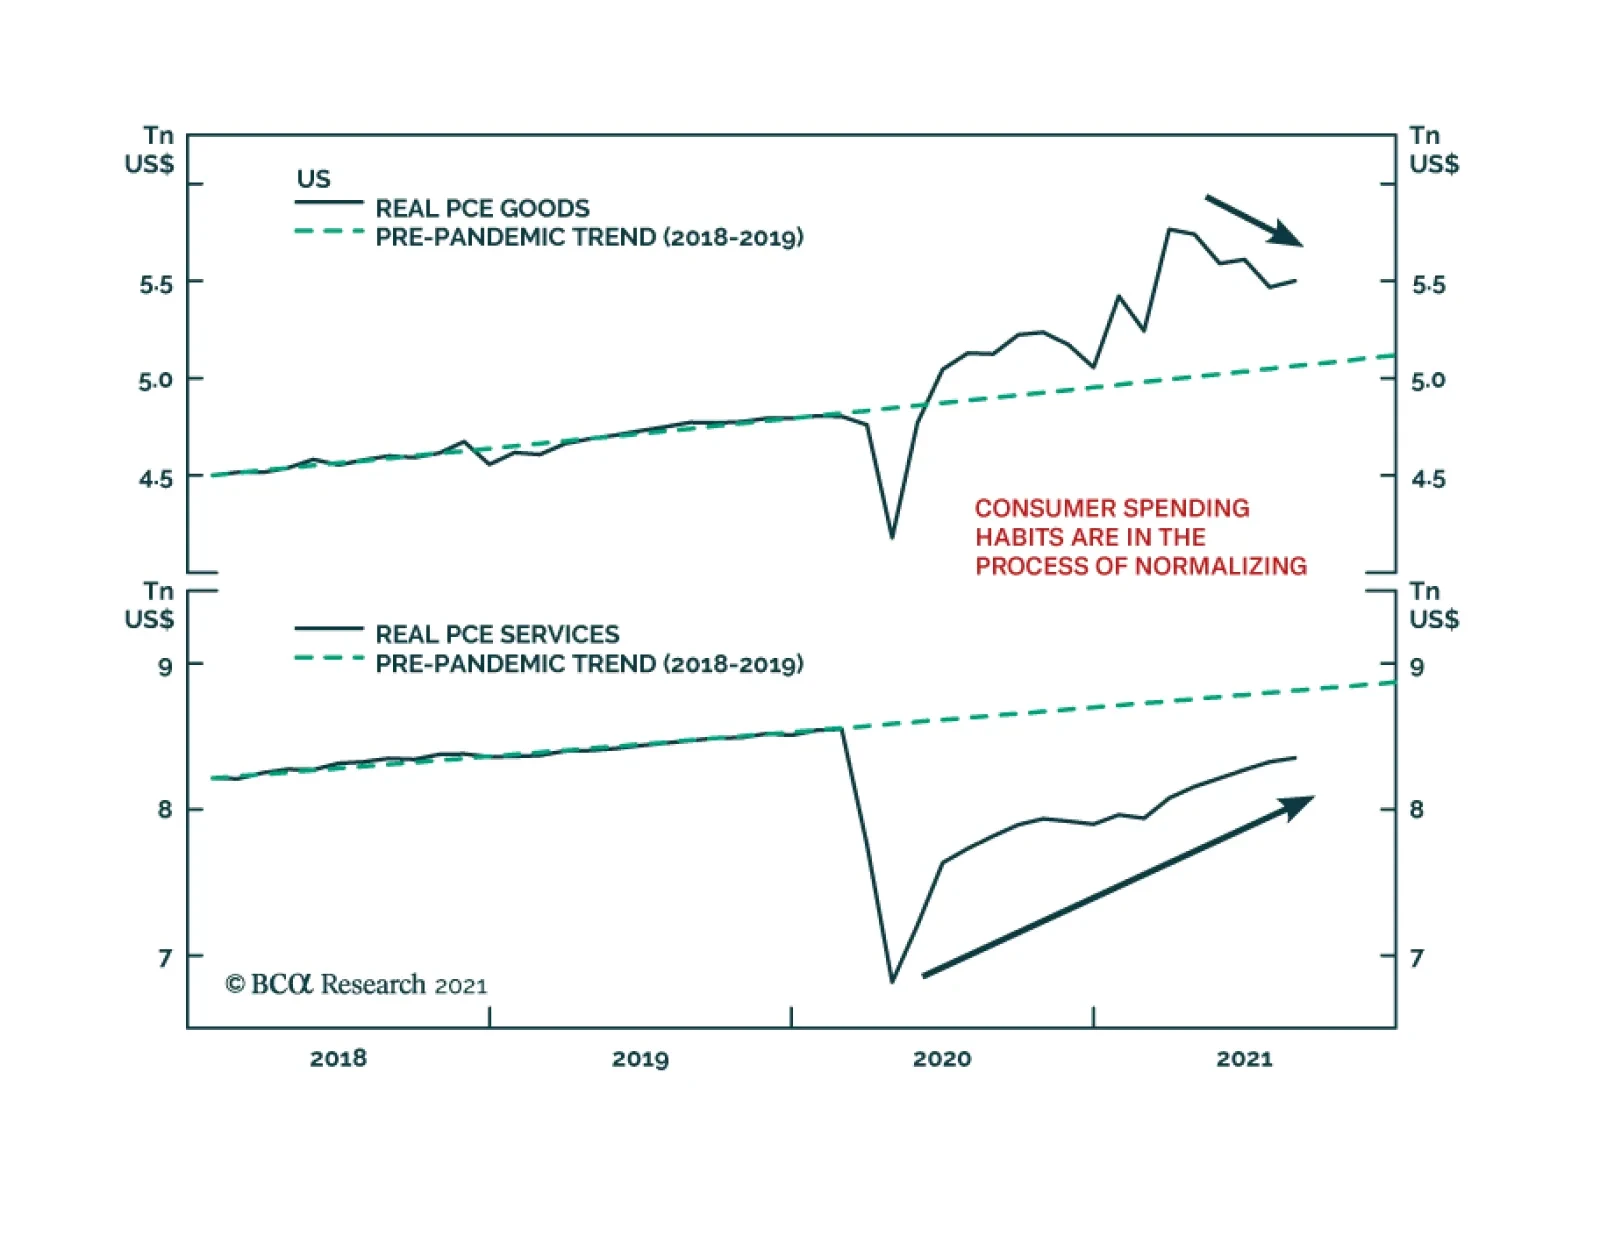
The current burst of inflation in developed economies is due to a (negative) supply shock rather than a (positive) demand shock. Getting this diagnosis right is crucial, because responding to supply shock generated inflation with tighter monetary policy is extremely dangerous. Responding to supply shock generated inflation with tighter monetary policy is extremely dangerous. The current burst of inflation cannot be due to a demand shock. If it was, aggregate demand would be surging. But it is not. For example, in the US, both consumer spending and income lie precisely on their pre-pandemic trend (Chart I-2). Furthermore, consumers are complaining that high prices for household durables, homes, and cars have caused “the poorest buying conditions in decades”, according to the University of Michigan’s latest consumer sentiment survey. If a positive demand shock was boosting incomes relative to prices, consumers would not be making this complaint. Given that they are making this complaint, there is the real risk of demand destruction. Meanwhile, employment remains far below its pre-pandemic trend. For example, in the US, by about 8 million jobs (Chart I-3). How can demand be on trend, but employment so far below trend? As an economic identity, the answer is that productivity has surged. Yet this should come as no surprise, because after recessions, productivity always surges. Chart I-2Demand Is On Trend...
Demand Is On Trend...
Demand Is On Trend...
Chart I-3...But Employment Is Well Below Trend
...But Employment Is Well Below Trend
...But Employment Is Well Below Trend
After Recessions, Productivity Always Surges As we explained in What The Olympics Teaches Us About Productivity Growth, productivity growth comes from better biology (which improves both our physical and intellectual capacity), better technology, and finding better ways to do the same thing. Of these three drivers, the first two are continuous processes but the third, finding better ways to do the same thing, is a step function whose up-steps come after disruptive changes in the economy such as recessions (Chart I-4). Chart I-4After Recessions, Productivity Always Surges
After Recessions, Productivity Always Surges
After Recessions, Productivity Always Surges
To do things better, a recession is the necessary catalyst for the wholesale adoption of an existing technology. For example, the mass manufacturing of autos already existed well before the Great Depression, but the Depression catalysed its wholesale adoption. Likewise, word processors existed well before the dot com bust, but the 2000 recession finally killed the office typing pool. In the same way, the technology for remote meetings and online shopping has been around for years, but the pandemic has catalysed its wholesale adoption. Of course, it is sub-optimal to meet people remotely or shop online all the time. But it is also sub-optimal to do these things in-person all the time. The most productive way is some hybrid of remote and in-person, which will differ for each person. The pandemic has given us the opportunity to find this personally optimal hybrid, and thereby to boost our productivity. The current boost to productivity could be larger than those after previous recessions because the pandemic has reshaped the entire economy. The current boost to productivity could be larger than those after previous recessions because the pandemic has forced us all to challenge our best practices. This is different from previous post-recession periods where transformations were focussed in one sector. For example, the 80s recession reshaped manufacturing, the dot com bust changed the technology sector, and the 2008 recession transformed the financial sector. By comparison, the current transformation is reshaping the entire economy. Yet, if productivity is booming, why has inflation spiked? The answer is that we have experienced a massive and unprecedented (negative) supply shock. It’s A Supply Shock, Not A Demand Shock To repeat, there has been no positive shock in aggregate demand. Yet there has been a massive shock in the distribution of this demand. Pandemic restrictions on socialising, interacting, and movement meant that leisure, hospitality, in-person shopping, and travel services were unavailable. As spending on services slumped, consumers shifted their firepower to items that could be enjoyed within the pandemic’s confines; namely, durable goods (Chart I-5). Chart I-5A Massive Displacement In The Distribution Of Demand Led To Supply Shocks
A Massive Displacement In The Distribution Of Demand Led To Supply Shocks
A Massive Displacement In The Distribution Of Demand Led To Supply Shocks
The problem is that modern supply chains have few, if any, built-in redundancies. They are always working ‘just in time’ and cannot cope with any surge in demand. To make matters worse, the type of goods in high demand also shifted: for example, from electronic goods during full lockdown – to cars when lockdowns eased, and people required local mobility. These shifting spikes in demand stressed and indeed snapped fragile supply chains, resulting in skyrocketing prices for durables. To assess the contribution to overall inflation, we need to gauge the deviation from the pre-pandemic trend. Relative to where they would have been, prices are higher by 0.5 percent for services, 1 percent for non- durables, but by a staggering 10 percent for durables. It follows that most of the current burst of inflation is due to the supply shock for durables (Chart of the Week). But now, consumer complaints that “buying conditions are poor” imply that high prices risk demand destruction as people wait for better conditions (lower prices) to make non-essential purchases. In any case, as we learn to live with the pandemic, the shock in the distribution of demand is easing. Meaning that the abnormally high spending on durable goods has a long way to fall. Furthermore, supply bottlenecks always clear as output responds with a lag. This risks unleashing a flood of supply just as higher prices have destroyed demand. Add to this mix a slowdown, or worse a slump, in China’s real estate and construction sector as we highlighted last week in The Real Risk Is Real Estate (Part 2). And the irony is that, for many global sectors, there could be a demand shock after all but it would be a negative demand shock. Three Investment Recommendations As consumers’ current complaints of poor buying conditions testify, the higher prices that come from a supply shock eventually lead to demand destruction. Hence, it is extremely dangerous for central banks to respond with tighter policy, including the signalling of tighter policy that leads to higher bond yields. The higher bond yields will, with a lag, choke demand just as the supply bottlenecks ease and unleash a flood of supply. Resulting in a deflationary shock for the economy, stock market, and commodities (Chart I-6). Chart I-6When Supply Shocks Ease, Prices Slump
When Supply Shocks Ease, Prices Slump
When Supply Shocks Ease, Prices Slump
On this basis, we are making three investment recommendations: The upper limit to the 10-year T-bond is no higher than 1.8 percent, as we detailed in Stocks, Not The Economy, Will Set The Upper Limit To Bond Yields. Hence, this yield level would be a good cyclical entry point into both stocks and bonds. Continue to underweight consumer discretionary plays versus the market, given the very tight connection between spending on durables and the relative performance of the goods dominated consumer discretionary plays in the stock market. As supply shocks always ultimately ease, those commodities whose prices have not yet corrected are at much greater risk than those commodities whose prices have corrected. Specifically, the price of industrial metals such as tin are at their most stretched versus iron ore in a decade (Chart I-7). Moreover, this fragility is confirmed by fractal analysis (Chart I-8 and Chart I-9). Chart I-7Tin Is Very Stretched Versus Iron Ore
Tin Is Very Stretched Versus Iron Ore
Tin Is Very Stretched Versus Iron Ore
Chart I-8Tin Is Fragile
Tin Is Fragile
Tin Is Fragile
Chart I-9Tin Versus Iron Ore Is Fragile
Tin Versus Iron Ore Is Fragile
Tin Versus Iron Ore Is Fragile
Hence, as a new cyclical recommendation, go underweight tin versus iron ore. Netflix Versus Activision Blizzard, And AUD/NZD Are Susceptible To Reversal In pure entertainment plays, the strong outperformance of Netflix versus Activision Blizzard has been fuelled by the delta wave of the virus, which helped Netflix, combined with the Chinese crackdown on gaming companies, which weighed down the whole gaming sector including Activision. The gaming company was also hit by a discrimination lawsuit, which it has now settled. Fractal analysis suggests that this strong outperformance is now fragile. Accordingly, the recommended trade is to short Netflix versus Activision Blizzard, setting a profit target and symmetrical stop-loss at 10 percent (Chart I-10). Chart I-10Netflix Versus Activision Blizzard Is Susceptible To Reversal
Netflix Versus Activision Blizzard Is Susceptible To Reversal
Netflix Versus Activision Blizzard Is Susceptible To Reversal
Meanwhile, in foreign exchange, the recent sell-off in AUD/NZD has reached fragility on the 130-day dimension which has reliably signalled previous reversal points (Chart I-11). Hence, the recommended trade is long AUD/NZD, setting a profit target and symmetrical stop-loss at 2 percent. Chart I-11AUD/NZD Is Likely To Rebound
AUD/NZD Is Likely To Rebound
AUD/NZD Is Likely To Rebound
Dhaval Joshi Chief Strategist dhaval@bcaresearch.com Fractal Trading System Fractal Trades 6-Month Recommendations Structural And Thematic Recommendations Closed Fractal Trades Indicators To Watch - Bond Yields Chart II-1Indicators To Watch - Bond Yields ##br##- Euro Area
Indicators To Watch - Bond Yields - Euro Area
Indicators To Watch - Bond Yields - Euro Area
Chart II-2Indicators To Watch - Bond Yields ##br##- Europe Ex Euro Area
Indicators To Watch - Bond Yields - Europe Ex Euro Area
Indicators To Watch - Bond Yields - Europe Ex Euro Area
Chart II-3Indicators To Watch - Bond Yields ##br##- Asia
Indicators To Watch - Bond Yields - Asia
Indicators To Watch - Bond Yields - Asia
Chart II-4Indicators To Watch - Bond Yields ##br##- Other Developed
Indicators To Watch - Bond Yields - Other Developed
Indicators To Watch - Bond Yields - Other Developed
Indicators To Watch - Interest Rate Expectations Chart II-5Indicators To Watch - Interest Rate Expectations
Indicators To Watch - Interest Rate Expectations
Indicators To Watch - Interest Rate Expectations
Chart II-6Indicators To Watch - Interest Rate Expectations
Indicators To Watch - Interest Rate Expectations
Indicators To Watch - Interest Rate Expectations
Chart II-7Indicators To Watch - Interest Rate Expectations
Indicators To Watch - Interest Rate Expectations
Indicators To Watch - Interest Rate Expectations
Chart II-8Indicators To Watch - Interest Rate Expectations
Indicators To Watch - Interest Rate Expectations
Indicators To Watch - Interest Rate Expectations
The decline in US government bond yields between April and August was largely put down to oversold conditions in the Treasury market and concerns amid signs that economic growth is moderating in the US. The stock market brushed off these…
BCA Research’s Global Fixed Income Strategy service recommends investors underweight government bonds where markets are discounting a path for future policy rates over the next two years that is too flat: the US, UK, Canada, and Norway Last week…
Highlights Monetary Policy: Last week’s numerous central bank meetings across the world confirmed that the overall direction for global monetary policy is shifting in a more hawkish direction. The main reason: growing fears that elevated inflation will persist for much longer than expected, even with global growth having lost some momentum. Country Allocation: The relative degrees of central banker hawkishness support our current government bond country allocation strategy. Stay underweight the US, UK, Canada, New Zealand and Norway where markets are discounting a path for future policy rates over the next two years that is too flat. Remain overweight countries where there is less need for a more aggressive tightening response: the euro area (both the core and periphery), Australia, Sweden and Japan. Still The Only Game In Town Last week was a busy one for global bond markets, with no fewer than 14 central banks within both the developed markets (DM) and emerging markets (EM) holding policy meetings. The results were eventful: Within EM, Brazil and Hungary lifted policy rates. Norway followed suit to become the first G-10 central bank to hike during the COVID era. The Fed teed up a formal announcement on tapering asset purchases at the next FOMC meeting in November. The Bank of England (BoE) gave strong hints that rate hikes could come sooner than expected, perhaps even before year-end. Chart of the WeekMonetary Policy Backdrop Turning More Bond-Bearish
Monetary Policy Backdrop Turning More Bond-Bearish
Monetary Policy Backdrop Turning More Bond-Bearish
Global bond yields in the developed markets took notice of the change in central bank guidance, especially from the Fed and BoE. The benchmark 10-year US Treasury yield rose from a pre-FOMC low of 1.30% to an intraday high of 1.57% yesterday – a level last seen late June. Longer-dated yields in the UK also rose significantly, with the 30-year Gilt yield rising from a pre-BoE meeting low of 1.11% to an intraday high of 1.40% yesterday – also the highest level since June. The pull on yields extended to other countries, as well, with 10-year yields in Germany, Canada and Australia climbing to three-month highs. The overall message from all of those policy meetings was one of an incremental shift toward less accommodative policies, even as the pace of global economic growth has slowed in recent months. Policymakers are growing more concerned that higher inflation could linger for longer (Chart of the Week). At the same time, loose policy settings have fueled a boom in asset markets that supports growth through easy financial conditions, but also raises future stability risks that worry the central banks. The number of countries seeing actual rate hikes is growing. Our Global Monetary Policy Tightening Indicator shows that just over one-quarter of G-10 and EM central banks have lifted rates over the past three months (Chart 2). All but one (Norway) are in EM, where policymakers have had to act more mechanistically in response to high inflation, even with softening economic growth momentum. While the slower pace of growth is more visible in EM relative to DM, when looking at cyclical indicators like manufacturing PMIs, inflation rates are simply too high around the world for inflation-targeting central banks to ignore (Chart 3). Chart 2Our Global Monetary Policy Indicator Shows A More Hawkish Turn
Our Global Monetary Policy Indicator Shows A More Hawkish Turn
Our Global Monetary Policy Indicator Shows A More Hawkish Turn
Chart 3Global CBs Growing More Worried About Inflation Risks
Global CBs Growing More Worried About Inflation Risks
Global CBs Growing More Worried About Inflation Risks
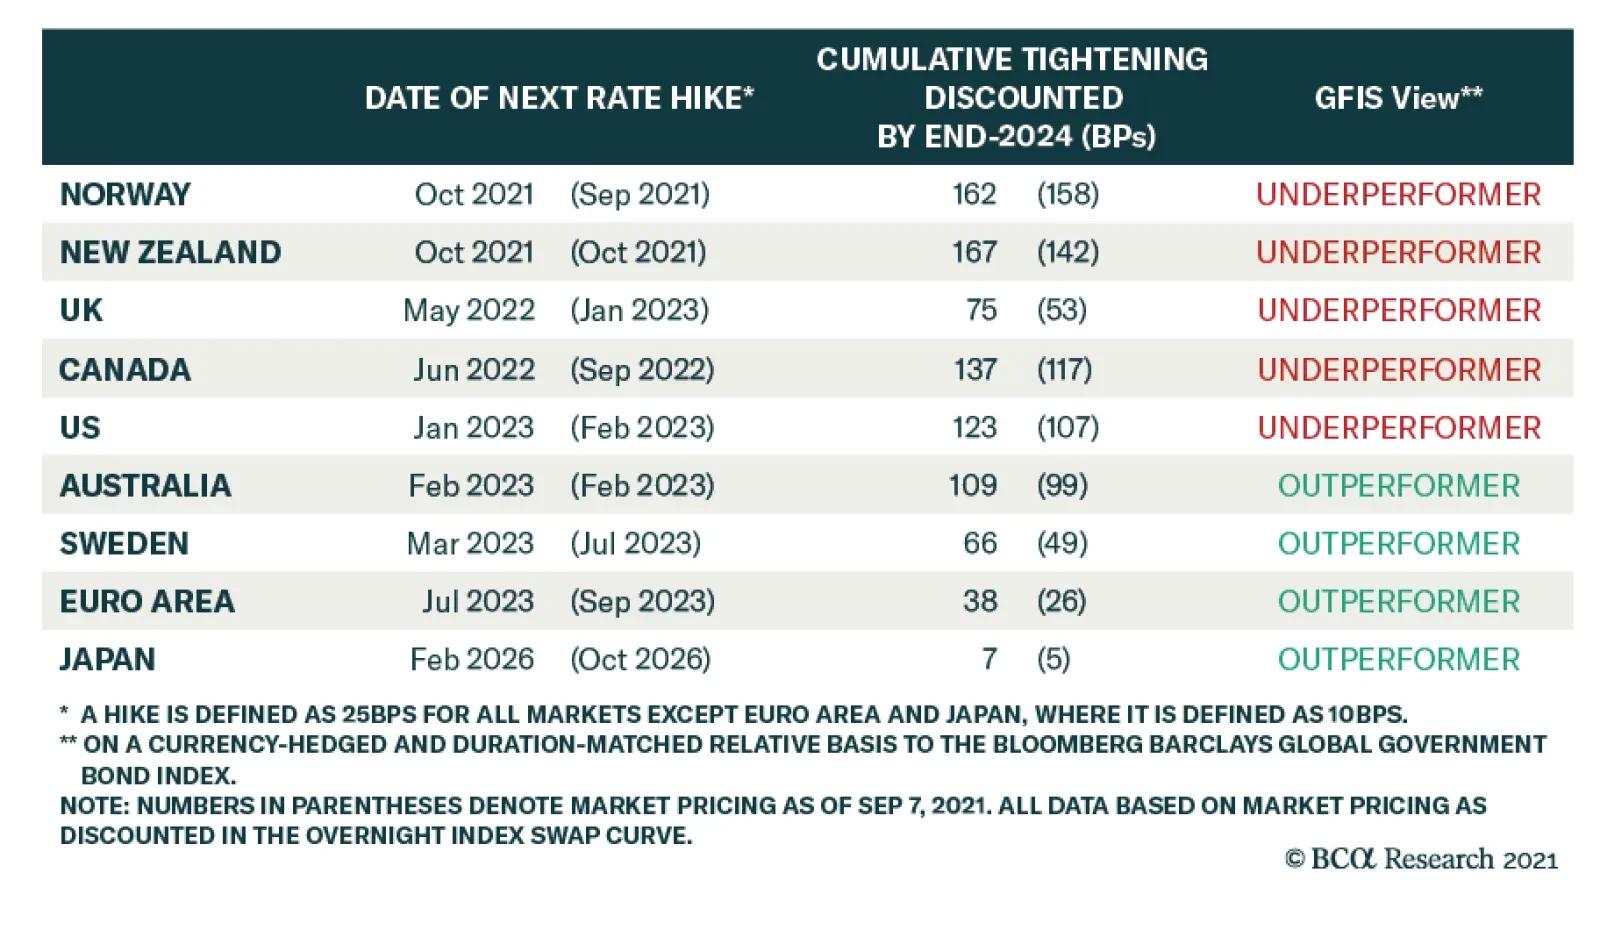
Within the major DM countries, there has been a notable shift in interest rate expectations in a more hawkish direction. Interest rate markets are, for the most part, still underestimating the potential for tighter monetary policies over the next couple of years. This is the main reason why we continue to recommend an overall below-benchmark strategic stance on global duration exposure. However, the relative expected pace of rate hikes also informs our views on country allocation. In Table 1, we show expectations for the timing of the next rate hike, as well as the cumulative amount of rate increases to the end of 2024, that are currently discounted in DM overnight index swap (OIS) curves. We present the latest level for both, as well as the reading from earlier this month to see how expectations have changed. Table 1Markets Still Pricing Very Modest Tightening Cycles
Marking-To-Market Our Bond Calls After "Central Bank Week"
Marking-To-Market Our Bond Calls After "Central Bank Week"
The so-called “liftoff date” for the first rate hike has been most notably pulled forward in the UK from January 2023 to May 2022, while other countries have seen more modest shifts in the timing of the next rate increase. More importantly, the discounted pace of rate hikes to end-2024 for all countries shown in the table has increased since early September (including Norway, factoring in last week’s tightening move by the Norges Bank). In our view, the biggest driver of relative government bond market yield movements and returns over the next 6-12 months will be the relative adjustments in the expected pace of rate hikes. On that front, the biggest shift higher in cumulative tightening has occurred in countries where we are more pessimistic on government bond performance on a relative basis to the global benchmark: the US, Canada, the UK and Norway. The smaller increases in the pace of hikes have occurred in our more preferred markets – Australia, Sweden, the euro area, and Japan. Assessing Our Two Biggest Government Bond Underweights: The US & UK For last week’s Fed meeting, a new set of economic and interest rate projections from the FOMC members (“the dots”) were presented (Chart 4). Compared to the forecasts from the June meeting, US real GDP growth expectations for 2021 were revised down (5.9% vs 7.6%) but were boosted for 2022 (3.8% vs 3.3%) and 2023 (2.5% vs 2.4%). A new forecast for 2024 was added, coming in at 2.0%. Importantly, none of those growth forecasts was below the median FOMC estimate of the longer-run real GDP growth rate of 1.8% (top panel). In other words, the Fed is not anticipating below-trend growth anytime in the next three years. Chart 4The Fed’s Rate Projections Look Too Low
Marking-To-Market Our Bond Calls After "Central Bank Week"
Marking-To-Market Our Bond Calls After "Central Bank Week"
The same conclusion goes for the US unemployment rate (second panel), with the median FOMC projection for 2022 (3.8%), 2023 (3.5%) and 2024 (3.5%) all below the median longer-run “full employment” estimate of 4.0%. The forecasts for US inflation (third panel) reflect that persistent low level of unemployment. Headline PCE inflation is expected to end 2021 at 4.2%, to be followed by a somewhat slower pace – but still above the 2% Fed inflation target – in 2022 (2.2%), 2023 (2.2%) and 2024 (2.1%). Yet despite these forecasts that show US growth and inflation exceeding its longer-run estimates for the next few years, the FOMC is projecting a relatively slow upward path for interest rates. The median dot now calls for the Fed to hike the funds rate once in 2022 and three more times in both 2023 and 2024. This would bring the funds rate to 1.75% by the end of 2024 – still 75bps below the Fed’s estimate of the longer-run “neutral” funds rate of 2.5% (bottom panel). That projected path for the funds rate is higher than the June dots, which only called for 75bps of cumulative hikes to the end of 2023. There is a wide divergence of opinions on the future path of rates within the FOMC, but the hawks appear to be winning the internal battle (Chart 5). There is now a 9-9 split of FOMC members who are calling for a rate hike in 2022, compared to a 7-11 split back in June, while the number of those projecting a funds rate above 1% in 2023 rose from 5 to 9. Chart 5A Wide Dispersion Of FOMC Interest Rate Views For 2023/24
A Wide Dispersion Of FOMC Interest Rate Views For 2023/24
A Wide Dispersion Of FOMC Interest Rate Views For 2023/24
One area where there does appear to be a consensus is on the timing and pace of tapering. Fed Chair Powell noted at his post-FOMC press conference that an announcement on the reduction of Fed asset purchases could come as soon as the next FOMC meeting on November 6. Powell also signaled that there was general agreement on the FOMC that the taper should end by mid-2022, barring any economic setbacks. That would likely open the door to a rate hike in the latter half of next year, given the Fed’s longstanding view that lifting the funds rate should only occur after tapering is complete, to avoid sending conflicting signals about the Fed’s policy bias. It is clear that the Fed’s policy guidance has shifted incrementally in a more hawkish direction, and confirms our long-held expectation that tapering would be announced by year-end, with rate hikes to begin in late 2022. This dovetails with our recommended investment positioning in the US Treasury market for the next 12-18 months. Maintain a below-benchmark US duration exposure, with a curve-flattening bias, while staying underweight US Treasuries in global (USD-hedged) fixed income portfolios (Chart 6). Our other high-conviction underweight government bond call is in the UK. The BoE’s recent messaging has turned more hawkish in a very short period of time, justifying our decision to downgrade our recommended UK Gilt exposure to underweight last month.1 The BoE Monetary Policy Committee had already sharply upgraded its inflation forecast for the end of 2021 to just above 4% at the last policy meeting in August. That was categorized as just a temporary surge due to rising energy prices and goods prices elevated by shorter-term global supply chain bottlenecks. At last week’s meeting, however, the MPC noted that +4% UK inflation could persist into Q2 2022 because of the current surge in wholesale natural gas prices that has driven many UK gas suppliers out of business (Chart 7). Chart 6Our Recommended Strategy For US Treasuries
Our Recommended Strategy For US Treasuries
Our Recommended Strategy For US Treasuries
Chart 7BoE Growing More Worried About Inflation
BoE Growing More Worried About Inflation
BoE Growing More Worried About Inflation
Chart 8Our Recommended Strategy For UK Gilts
Our Recommended Strategy For UK Gilts
Our Recommended Strategy For UK Gilts
The official view of the BoE has been like that of other central banks, that much of the current high inflation is supply driven and, hence, will not last. Yet within the MPC, there is clearly some growing nervousness about high realized inflation becoming more embedded in longer-term inflation expectations, which are moving higher. BoE Governor Andrew Bailey has noted in recent speeches that there was a growing case for interest rate hikes because of stubbornly higher inflation. Two members of the MPC even voted last week to reduce the size of the BoE’s QE program that is already set to end in just three months. The markets have begun to heed the more hawkish signals from the BoE. Our 24-month UK discounter, measuring the amount of rate hikes priced into the UK OIS curve, has jumped 24bps since September 7 (Chart 8). Over that same period, UK Gilts have underperformed the Bloomberg Barclays Global Treasury index by 108bps (on a USD-hedged and duration-matched basis). We are sticking with our underweight recommendation on UK Gilts, as there are still too few rate hikes priced into the UK curve relative to the BoE’s guidance and upside inflation risks. What About The BoJ? Same Old, Same Old Chart 9Reasons Why JGBs Will Outperform
Reasons Why JGBs Will Outperform
Reasons Why JGBs Will Outperform
Lost amid the hawkish din from the Fed and BoE meetings last week was the Bank of Japan (BoJ) meeting. The message from policymakers in Tokyo was predictably dovish, as Japan has not seen anything resembling the high inflation that has pushed central bankers elsewhere in a more hawkish direction. Japanese growth has also not seen the same magnitude of recovery from the pandemic shock as the other major developed markets, despite suffering comparable losses during the 2020 recession (Chart 9). One of the main reasons has been that Japan’s vaccine rollouts were much slower than those of other major countries. This forced an extension of emergency lockdowns and other economic restrictions that depressed domestic demand and delayed a return to normal economic activity (second panel). COVID outbreaks even cost Japan the one-time economic windfall from hosting an Olympics, with the Tokyo Games first delayed by a year and then taking place with no fans. Japan has also not suffered any of the higher inflation rates witnessed elsewhere over the past year, despite presumably facing many of the same inflationary forces from global supply chain disruption (third panel). Both headline and core CPI inflation are now in deflation. Governor Haruhiko Kuroda stated last week that it will take longer for Japan to see inflation return back to its 2% target than other developed countries, with the official BoJ forecast calling for that level to be reached by 2023 – a forecast that appears too optimistic. We continue to view Japanese government bonds (JGBs) as a relative safe haven during the period of rising global bond yields that we expect over the next 6-12 months. The BoJ is nowhere close to seeing the conditions necessary to begin exiting its Yield Curve Control and negative interest rate policies, both of which have crushed JGB volatility and kept longer-term bond yields hovering near 0%. We continue to recommend a moderate overweight stance on Japan in global government bond portfolios, particularly on a USD-hedged basis to make the yields more attractive. The Scandinavian Policy Divergence Last week, the Norges Bank raised its benchmark interest rate from 0% to 0.25% (Chart 10), stating that a normalizing economy requires a gradual normalization in monetary policy. The bank’s decision reflects idiosyncratic factors unique to the Norwegian economy, but also some of the same broader themes that are forcing other central banks in a more hawkish direction. As a small economy driven heavily by oil exports, both the Norwegian krone and the price of oil weigh heavily on the policy decisions of the Norges Bank. On that front, the rise in energy prices since the crisis has outpaced the appreciation in the krone (Chart 10, top panel). With this relative weakness in the krone comes higher import price inflation and increased export competitiveness, both of which mean that the Norges Bank must pull forward its path of rate hikes to compensate. As opposed to other G10 central banks, the Norges Bank clearly believes a pre-emptive move on rates is necessary to nip future inflation risk in the bud. The bank expects that increased capacity utilization and wage growth will help push up underlying inflation to approximately 1.9% by the end of 2024, with the ongoing supply chain disruptions creating additional upside risk to that forecast. Like other G10 banks, however, the Norges Bank is concerned about increasing financial imbalances. The Norwegian house price-to-disposable income ratio is now at all-time highs and the Norges Bank expects it to remain elevated to the end of its forecast horizon (Chart 10, bottom panel). With the growth in house prices substantially outpacing income growth during the pandemic, housing market vulnerabilities have increased as households have taken on greater leverage to enter the market. In contrast to the Norges Bank, the other major Scandinavian central bank, Sweden’s Riksbank, has hewed more closely to the prevailing global monetary policy orthodoxy – avoiding pre-emptive policy tightening in order to boost inflation. The central bank chose to hold its repo rate at 0% at last week’s policy meeting, even with a Swedish economy that has recovered the 2020 pandemic losses and is projected to return to pre-COVID growth rates in 2022 (Chart 11). In its decision, the Riksbank mirrored rhetoric from the Fed and ECB, citing that high inflation was driven by rising energy prices and supply logjams, both factors which are expected to subside over the coming year (Chart 11, middle panel). Both headline and core versions of the bank’s favored CPI-F (CPI with Fixed Interest Rate) measure are projected by the Riksbank to remain below target in 2022, reaching 2% only in 2024. Chart 10The Norges Bank Isn't Waiting Around...
The Norges Bank Isn't Waiting Around...
The Norges Bank Isn't Waiting Around...
Chart 11...But The Riksbank Will Remain Patient
...But The Riksbank Will Remain Patient
...But The Riksbank Will Remain Patient
Chart 12The Central Bank Story Will Further Widen The Norway-Sweden Spread
The Central Bank Story Will Further Widen The Norway-Sweden Spread
The Central Bank Story Will Further Widen The Norway-Sweden Spread
The Riksbank is less willing than the Norges Bank to respond to temporarily higher inflation because of the former’s growing reluctance to return to negative nominal interest rates in response to an economic shock. The Riksbank would likely be more comfortable in lifting nominal rates only when real rates were significantly lower than current levels, which requires higher inflation. In contrast to the neighboring Norges Bank, the Riksbank has an additional tool which it can use to express shifts in monetary policy—the size of its balance sheet. The bank forecasts that holdings of securities will remain unchanged in 2022 (Chart 11, bottom panel), implying that purchases, net of redemptions, will be drawn down roughly to zero. However, the bank does believe that the existing stock of purchases will continue to support financial conditions. Chart 12 shows the impact of the Norges Bank’s relatively hawkish reaction function. Despite relatively similar underlying growth and inflation profiles, sovereign debt from Norway has markedly underperformed Swedish counterparts, a dynamic that has been even more obvious since the pandemic. On the currency side, the NOK/SEK cross has recovered much of the losses from 2020, and will likely rally further as Norway-Sweden rate differentials will turn even more favorable for the NOK. Relative to the global benchmark on a currency-hedged and duration-matched basis, Norwegian government debt has underperformed much more than Sweden following the pandemic. We see these tends continuing over the next 6-12 months, with the Norges Bank likely to remain far more hawkish than the Riksbank. Our bias is to favor Swedish sovereign debt over Norwegian government bonds. Robert Robis, CFA Chief Fixed Income Strategist rrobis@bcaresearch.com Shakti Sharma Senior Analyst ShaktiS@bcaresearch.com Ray Park, CFA Research Analyst ray@bcaresearch.com Footnotes 1 Please see BCA Research Global Fixed Income Strategy/European Investment Strategy Report, "The UK Leads The Way", dated August 11, 2021, available at gfis.bcaresearch.com. Recommendations The GFIS Recommended Portfolio Vs. The Custom Benchmark Index
Marking-To-Market Our Bond Calls After "Central Bank Week"
Marking-To-Market Our Bond Calls After "Central Bank Week"
Duration Regional Allocation Spread Product Tactical Trades Yields & Returns Global Bond Yields Historical Returns
BCA Research’s US Bond Strategy services recommends investors enter 2/10 steepeners on the inflation compensation curve and/or 2/10 flatteners on the real (TIPS) curve. The increase in the 10-year nominal yield since last Wednesday was roughly evenly split…
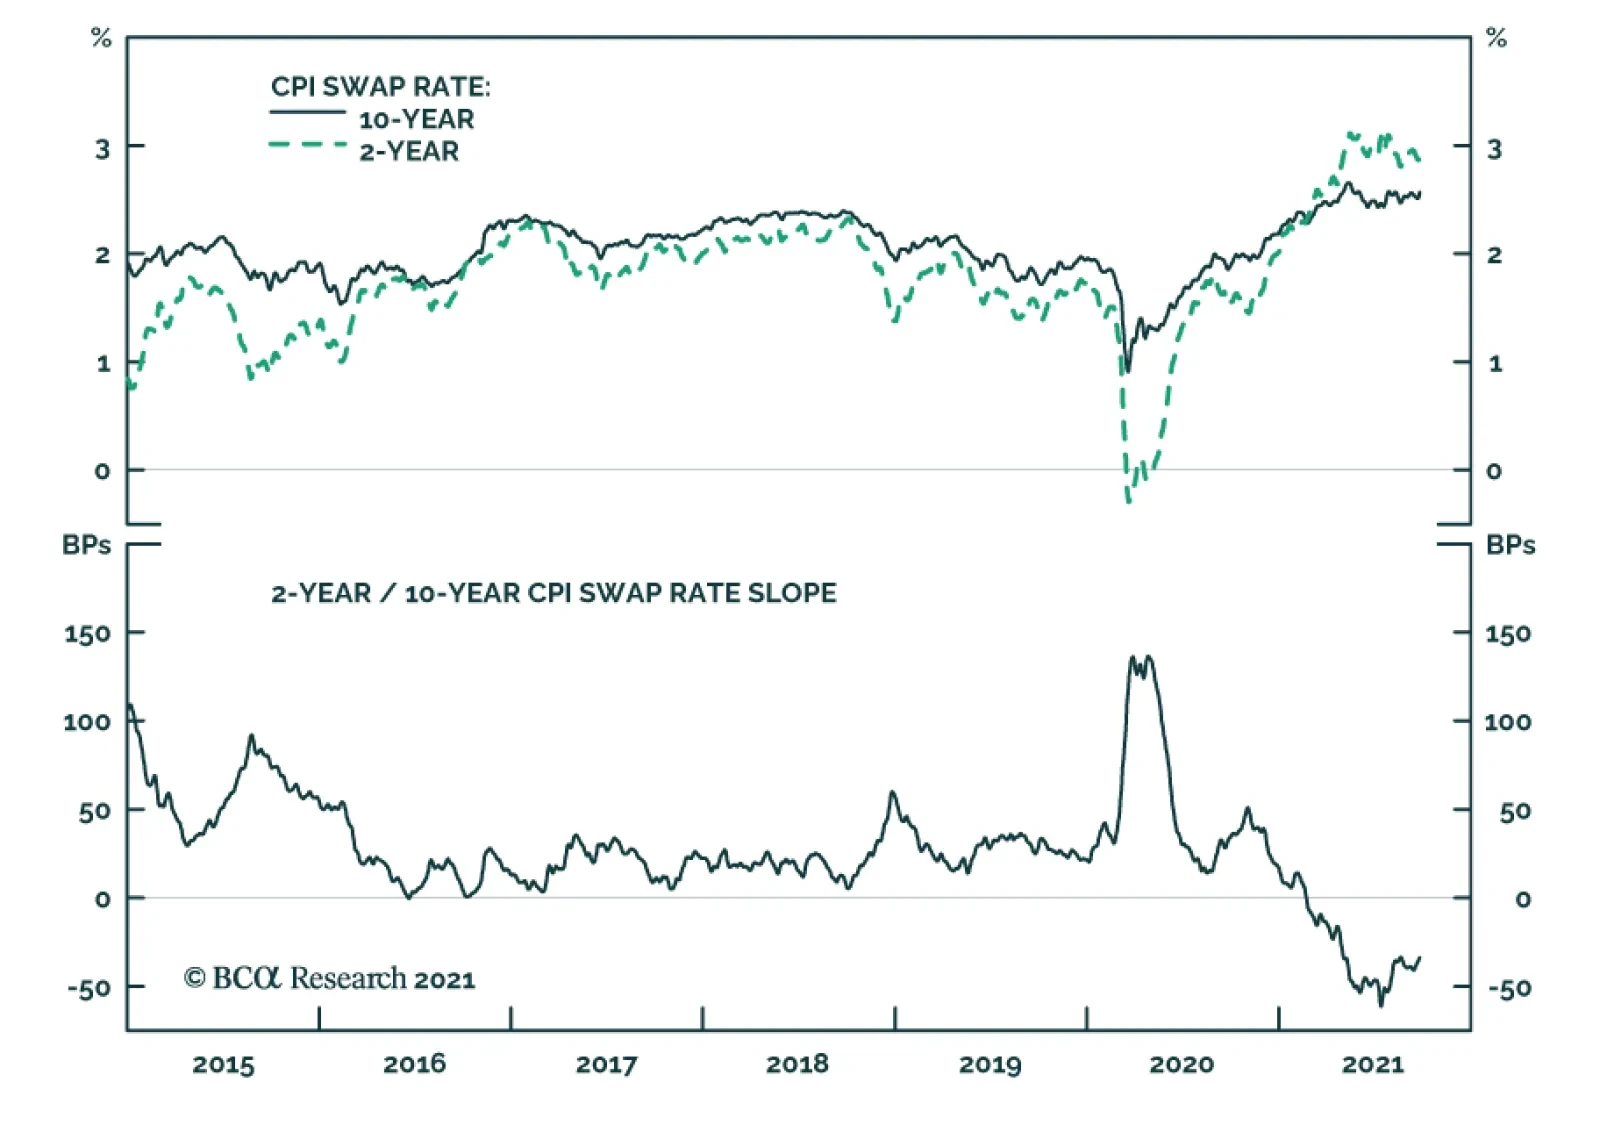
Highlights Monetary Policy: It’s all but certain that tapering will begin next month and conclude by the middle of next year, but the FOMC is currently split right down the middle on whether it will be appropriate to lift rates in H2 2022. We present five factors to track to decide when the Fed will hike rates. Yield Curve: A bear-flattening of the nominal yield curve remains the most likely scenario for the next 6-12 months. Maintain a position short the 5-year bullet versus a duration-matched 2/10 barbell. TIPS: Investors should enter 2/10 steepeners on the inflation compensation curve and/or 2/10 flatteners on the real (TIPS) curve. The 2-year real yield, in particular, has a lot of upside during the next 6-12 months. EM Bonds: US bond investors should shift some allocation out of expensive US investment grade corporate bonds and into USD-denominated investment grade EM Sovereigns and Corporates where valuation is more compelling. Feature This past week was quite eventful for US bond investors. First, the Fed presented its September update on Wednesday, offering some hints about the timing and pace of asset purchase tapering alongside its updated economic and interest rate forecasts. Then, bonds sold off sharply on Thursday, Friday and Monday with the 10-year Treasury yield rising all the way to 1.49%. The first section of this week’s report looks at what we learned from last week’s FOMC meeting and opines on some monetary policy questions that remain unanswered. The second section updates our views on portfolio duration, the yield curve and TIPS in light of last week’s large market moves. Finally, we conclude with an update on the outlook for USD-denominated Emerging Market bonds. Powell Answers Some Small Questions, Avoids The Big One The Small Questions The start date for asset purchase tapering is the first small question that the Fed answered last week. A new sentence was added to the post-meeting statement saying that “a moderation in the pace of asset purchases may soon be warranted” and, in his press conference, Chair Powell clarified that the purpose of the new language is “to put notice out there that [tapering] could come as soon as the next meeting”. After this statement from the Fed, we expect asset purchase tapering to be announced at the next FOMC meeting on November 3rd. A delay until December is possible if September’s employment report is a massive disappointment, but the bar for delaying tapering beyond November appears high. Chair Powell also shed some light on a second small question related to the Fed’s balance sheet. Specifically, the pace of asset purchase tapering. In his press conference the Chair said that “participants generally view that, so long as the recovery remains on track, a gradual tapering process that concludes around the middle of next year is likely to be appropriate.” The information about the pace of tapering is slightly more interesting than the start date, if only because Fed policymakers have expressed a desire for net purchases to reach zero before the first interest rate increase. The fact that the Fed is planning to reach net zero purchases by the middle of next year suggests that it wants to leave the door open for a possible rate hike in the second half of 2022. This message was confirmed by the Fed’s updated interest rate projections (Chart 1). The projections revealed an even split (9 vs. 9) on the Committee between those that expect at least one 25 basis point rate increase before the end of 2022 and those that do not expect to lift rates next year. It’s also notable that, out of the 9 participants that don’t expect a rate hike in 2022, 8 anticipate lifting rates in 2023. Chart 1Rate Expectations
Rate Expectations
Rate Expectations
Of course, as Chair Powell often points out, the Fed’s interest rate projections are contingent on the future state of the economy and will almost certainly be revised as the outlook evolves. What’s more important from a forecasting perspective is knowing how the Fed will react to different economic conditions. The Big Question With that in mind, we know that the Fed has promised not to lift rates until the labor market reaches “maximum employment”. However, as we noted in a recent report, the Fed hasn’t provided much detail on what “maximum employment” actually means.1 Powell’s comments last week didn’t add much clarity, but we can hunt for clues in the Summary of Economic Projections (SEP). In the SEP, we first notice that 13 FOMC participants expect the unemployment rate to be 3.8% - 3.9% or lower by the end of 2022 (Chart 2A). It is logical to assume that this group includes the 9 participants who expect to lift rates in 2022 and 4 additional ones. We also observe that 17 out of 18 participants anticipate an unemployment rate of 3.8% - 3.9% or lower by the end of 2023 (Chart 2B), exactly matching the number of participants who expect to lift rates by then. We can therefore infer that the Fed views an unemployment rate of roughly 3.8% as consistent with “maximum employment”. That is, FOMC participants tend to have rate hikes penciled into their forecasts once the unemployment rate is below 3.8%. Chart 2AFOMC 2022 Unemployment Rate Projection Distribution
Damage Assessment
Damage Assessment
Chart 2BFOMC 2023 Unemployment Rate Projection Distribution
Damage Assessment
Damage Assessment
The SEP’s inflation forecasts are less illuminating than the unemployment ones. All but 4 participants expect core PCE inflation to be above the Fed’s 2% target at the end of 2022 (Chart 3A) and no FOMC participant is forecasting below-2% core PCE at the end of 2023 (Chart 3B).2 The most we can take away from these forecasts is that 14 FOMC participants expect inflation to be above target in 2022, but five of those participants don’t see the labor market as being tight enough to lift rates by then. Chart 3AFOMC 2022 Core PCE Inflation Rate Projection Distribution
Damage Assessment
Damage Assessment
Chart 3BFOMC 2023 Core PCE Inflation Rate Projection Distribution
Damage Assessment
Damage Assessment
The revelation that FOMC participants view a 3.8% unemployment rate as consistent with “maximum employment” is illuminating, but it doesn’t tell the entire story. We don’t know, for example, what assumptions about labor force participation the different Fed officials are using. Our sense is that the following five criteria will ultimately determine when the Fed starts to lift interest rates: An unemployment rate in the neighborhood of 3.8%. Prime-age (25-54) labor force participation close to its pre-pandemic level (Chart 4, top panel). Accelerating wage growth (Chart 4, bottom 2 panels). Long-dated inflation expectations at or above target levels (Chart 5, top 2 panels). Non-transitory inflation at or above target levels (Chart 5, bottom panel). Bottom Line: The FOMC is currently split right down the middle on whether it will be appropriate to lift rates in 2022, but these forecasts aren’t set in stone and next year’s economic data – particularly the five factors listed above – will determine which group is correct. Chart 4Part Rate & Wage Growth
Part Rate & Wage Growth
Part Rate & Wage Growth
Chart 5Inflation & Inflation Expectations
Inflation & Inflation Expectations
Inflation & Inflation Expectations
Our own view is that the labor market will be sufficiently tight for the Fed to deliver its first rate hike in December 2022, and that rate hikes will proceed more quickly than what is currently priced in the yield curve. US bond investors should maintain below-benchmark portfolio duration. The Fallout In Bond Markets Bonds sold off sharply last Thursday and again yesterday morning. At the time of publication, the 30-year Treasury yield had risen from 1.81% on Wednesday to 2.02% (Chart 6). The 10-year Treasury yield had risen from 1.30% to 1.49% (Chart 6, panel 2). The 5-year yield is up to 0.98% from 0.85% on Wednesday (Chart 6, panel 3), and the 2-year yield is up to 0.28% from 0.24% (Chart 6, panel 4). The yield curve has also steepened since Wednesday, though the 2/10 slope remains well below its March peak (Chart 7). The trend during the past few months has been one of curve steepening out to the 5-year maturity point (Chart 7, panel 2) and flattening beyond that point (Chart 7, bottom 2 panels). Recent market action has led to some steepening beyond the 5-year maturity, but so far that steepening is minor compared to the flattening move we’ve witnessed since the spring. Chart 6Treasury Yield Trends
Treasury Yield Trends
Treasury Yield Trends
Chart 7Treasury Curve Trends
Treasury Curve Trends
Treasury Curve Trends
Nominal Curve We have been recommending a position short the 5-year bullet and long a duration-matched barbell consisting of the 2-year and 10-year notes, and we think this trade will continue to outperform. First, the 5-year/5-year forward Treasury yield is back above 2%, consistent with median estimates of the long-run neutral fed funds rate from the New York Fed’s Surveys of Market Participants (2%) and Primary Dealers (2.25%) (Chart 6, bottom panel). We think it will be difficult for the 5-year/5-year forward yield to rise much above these levels, which makes curve flattening more likely than steepening going forward.3 Second, we updated our work on yield curve scenarios to incorporate recent market action and some new information gleaned from last week’s SEP. In this analysis we estimate fair value levels for different parts of the yield curve as of the end of 2022 based on a scenario for the path of the fed funds rate. For example, if we assume that Fed liftoff occurs in December 2022 and rate hikes proceed at a pace of 75 bps per year (the median pace in the SEP) until the fed funds rate levels-off at 2.08% (consistent with a 2%-2.25% range for the long-run neutral fed funds rate), we calculate that the 2-year yield has 74 bps of upside between now and the end of 2022. This is slightly more than the 65 bps of upside in the 5-year yield and much more than the 37 bps of upside in the 10-year yield (Table 1). Comparing this expected change to what is already discounted in the forward curve, we see that both the 2-year and 10-year yields are expected to exceed their forwards by 6 bps. The 5-year yield is expected to exceed its forward by 16 bps. Table 1Treasury Curve Scenario Analysis
Damage Assessment
Damage Assessment
To us, the message is clear. We want to remain short the 5-year note versus a duration-matched 2/10 barbell. Real & Inflation Curves Chart 8Real & Inflation Curves
Real & Inflation Curves
Real & Inflation Curves
The increase in the 10-year nominal yield since last Wednesday was roughly evenly split between the real and inflation compensation components. Interestingly, inflation drove a greater proportion of the increase at the front-end of the curve, and the 2-year real yield actually fell. We maintain a neutral recommendation on TIPS versus nominal Treasuries, but this week we recommend taking advantage of recent market action by implementing some curve trades across the real and inflation curves. Specifically, we note that the cost of short-maturity inflation compensation remains well above the cost of long-maturity inflation compensation (Chart 8). Going forward, the cost of front-end inflation compensation will fall as inflation moderates from its current extremely high level. Meanwhile, the cost of long-maturity inflation compensation will remain sticky near the Fed’s target levels. This will lead to a steepening of the inflation curve (Chart 8, panel 2). The combination of a steeper inflation curve and a flatter nominal curve will lead to a much flatter real yield curve (Chart 8, bottom 2 panels). The 2-year real yield, in particular, has a lot of upside if inflation moderates, as we expect, and the 2-year nominal yield rises in line with the projections shown in Table 1. Bottom Line: Investors should remain short the 5-year bullet versus a duration-matched 2/10 barbell on the nominal Treasury curve. Investors should also enter 2/10 steepeners on the inflation compensation curve and/or 2/10 flatteners on the real (TIPS) curve. A Quick Update On Emerging Market Bonds The collapse of Chinese real estate behemoth Evergrande dominated headlines for most of the past week, though so far there has been little contagion into USD-denominated credit markets. Unsurprisingly, the spread on Chinese corporate and quasi-sovereign bonds has widened, and there has been some passthrough into both the High-Yield EM USD Corporate & Quasi-Sovereign Index and the High-Yield EM USD Sovereign Index (Chart 9). However, investment grade EM credit spreads have been relatively unaffected by the turmoil, as have US corporate bond spreads (both IG and HY) (Chart 9, bottom 2 panels). While the Evergrande drama – and weakening Chinese economic growth in general – could weigh on USD-denominated EM bond performance in the near-term, we see an excellent buying opportunity in investment grade EM bonds on a 6-12 month horizon. Investment grade EM Sovereigns outperformed credit rating and duration-matched US corporate bonds in the early months of the recovery but have lagged during the past few months (Chart 10). The same is true for the investment grade EM Corporate and Quasi-Sovereign index (Chart 10, panel 3). This is not to say that EM bond performance has been poor – the EM Sovereign index is still up 97 bps versus duration-matched Treasuries on the year – it has simply failed to keep pace with the stellar performance of US corporate bonds. Chart 9No Contagion
No Contagion
No Contagion
Chart 10EM Bonds Versus US Corporates
EM Bonds Versus US Corporates
EM Bonds Versus US Corporates
But that recent stellar performance of US investment grade corporate bonds has left spreads in the sector near historically tight levels. In last week’s report we ran some scenarios for US investment grade corporate bond returns during the next 12 months and concluded that excess returns versus Treasuries are probably capped at 85 bps.4 This makes the current spread advantage in EM Sovereigns (Chart 10, panel 2) and EM Corporates & Quasi-Sovereigns (Chart 10, bottom panel) very compelling. This will be especially true if Emerging Market growth accelerates in 2022 on the back of increased Chinese stimulus and a COVID vaccination campaign that is already picking up steam.5 Bottom Line: US bond investors should shift some allocation out of expensive US investment grade corporate bonds and into USD-denominated investment grade EM Sovereigns and Corporates where valuation is more compelling. Ryan Swift US Bond Strategist rswift@bcaresearch.com Footnotes 1 Please see US Bond Strategy Weekly Report, “2022 Will Be All About Inflation”, dated September 14, 2021. 2 Chart 3B shows that 4 participants expect core PCE inflation of 1.9%-2.0% in 2023, but the SEP also reveals that the minimum forecast for core PCE in 2023 is 2.0%. In other words, all 4 participants in that range are forecasting 2.0%, not 1.9%. 3 For more details on the relationship between our 5-year/5-year forward yield target and the yield curve please see US Bond Strategy Weekly Report, “A Bump On The Road To Recovery”, dated July 27, 2021. 4 Please see US Bond Strategy Weekly Report, “Expected Returns In Corporate Bonds”, dated September 21, 2021. 5 For a recent debate about the outlook for Emerging Market assets please see last Friday’s Webcast: https://www.bcaresearch.com/webcasts/detail/458 Recommended Portfolio Specification Other Recommendations Treasury Index Returns Spread Product Returns
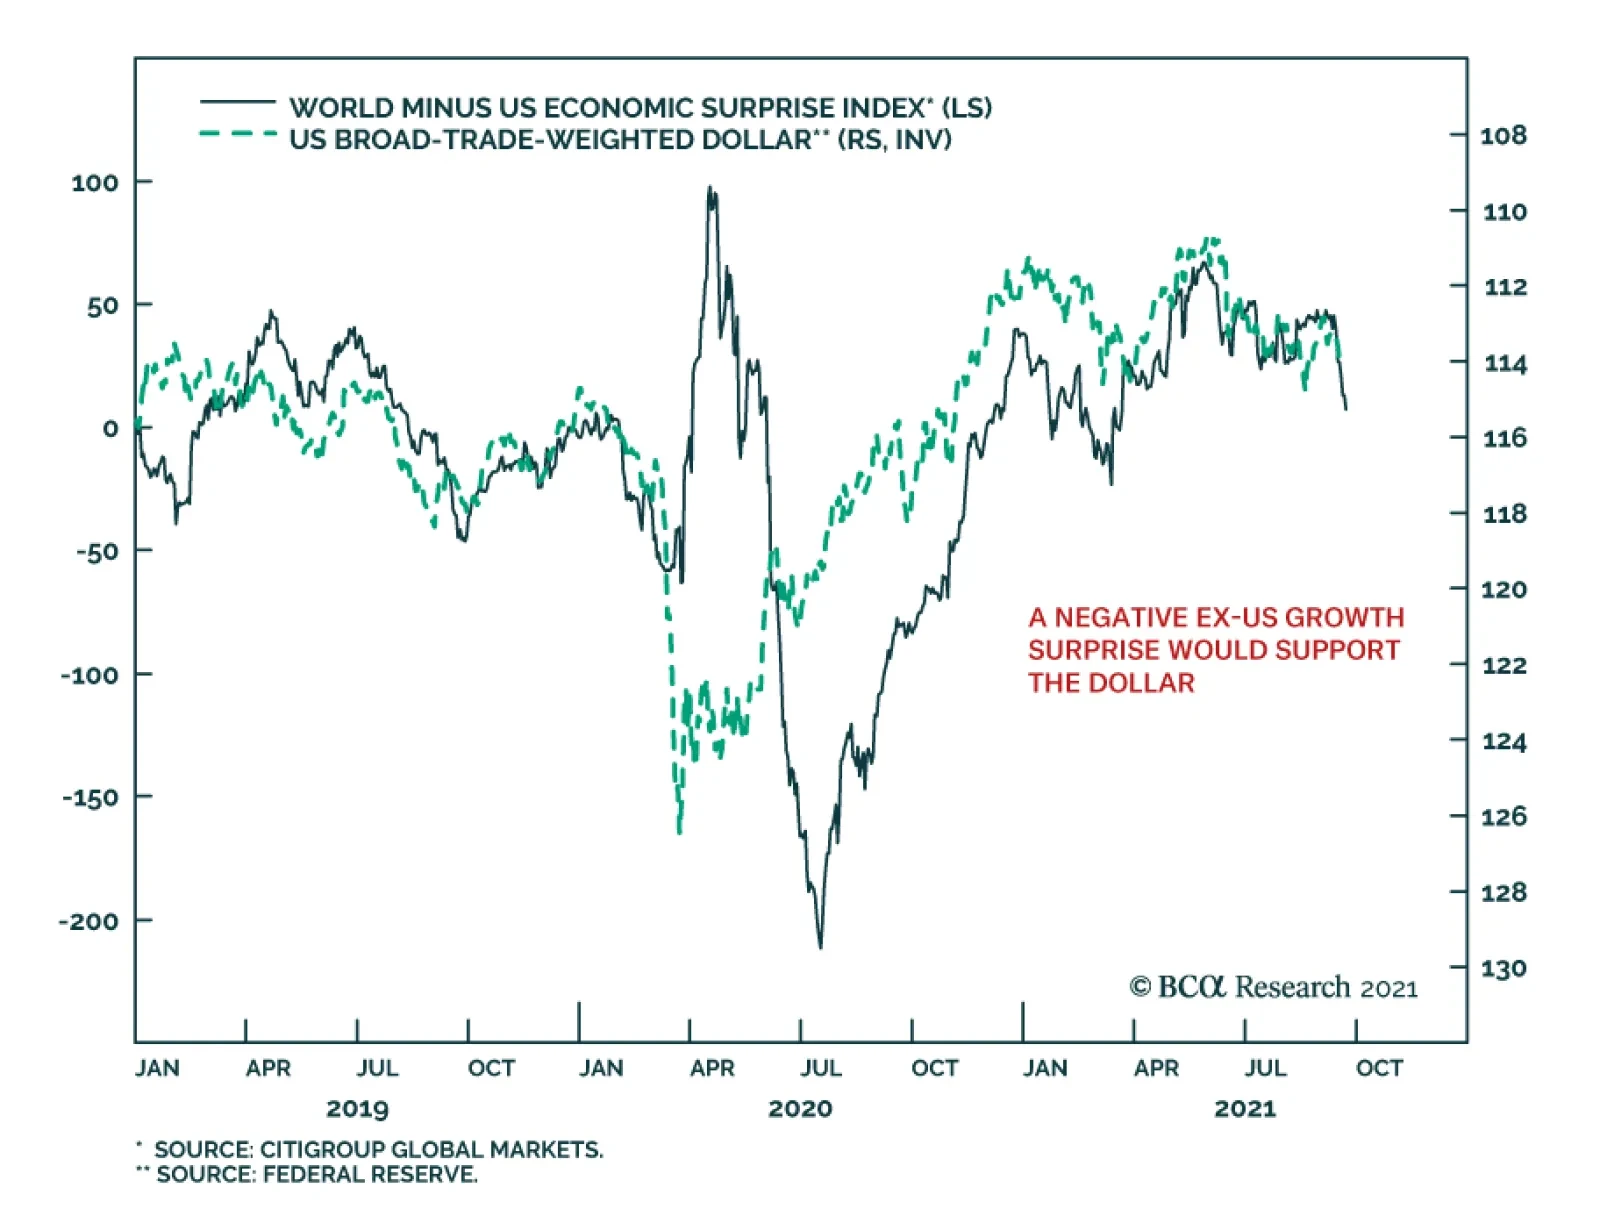
Although the US dollar has appreciated this year, our foreign exchange strategists highlight that from a big picture perspective, dynamics remain tilted against the dollar. True, the DXY is off its May low of 89.6. However, it has failed to break above 94,…
Highlights Economy – We find the leading arguments for why households’ excess savings won’t be spent to be wanting: US households do not commonly demonstrate the detached foresight that Ricardian equivalence takes as given and the trauma-will-change-behavior thesis fails to account for the absence of widespread financial trauma. Markets – Public equities account for a record portion of household wealth, but their share gains are not a sign of a budding mania: Our analysis of the Fed’s Flow of Funds data argues that much of equities’ relative share gains have been driven by structural rather than cyclical factors. Strategy – It would be premature to shift to defensive asset allocation settings if monetary policy is going to remain accommodative for another three years: The rate hike progression envisioned by FOMC participants’ dot-plot projections suggests policy won’t become tight until late 2024 at the earliest. Feature The US Investment Strategy team has been at the more bullish end of the continuum within BCA, and among the broader strategist community, since the spring of 2020. Our view was premised on the idea that the fiscal and monetary policy responses to the pandemic were (and would continue to be) so large that they would overwhelm its adverse effects on the economy and markets. That view came to pass as Congress augmented the CARES Act’s fiscal largesse with two subsequent rounds of direct payments to households earning up to $100,000 per adult and a renewed federal supplement to unemployment insurance (UI) benefits. With the expiration of the UI benefit program at the beginning of the month and the Fed poised to end asset purchases by the middle of next year, clients have begun to ask if our underlying bullish premise still applies. We believe that it does, on the grounds that policy remains on an emergency footing even though the emergency has passed. The fiscal transfers may have ended, but their full effect has yet to be felt. They will support the economy on an ongoing basis as households direct their excess pandemic savings toward consumption. No one knows for sure how much of the excess savings will be spent or when, but the arguments citing Ricardian equivalence or consumer trauma as impediments to consumption are flawed. What If Today’s Income Is Taxed Tomorrow? British classical economist David Ricardo is best known to introductory economics students for comparative advantage, but he also posited that deficit spending may fail to boost aggregate demand because taxpayers, anticipating that they will be tapped in the future to repay state loans, may increase savings to cover future taxes. Despite its theoretical appeal, empirical data in support of Ricardian equivalence is elusive. Two centuries and an ocean removed from Ricardo’s England, we submit that Americans are not known for parsimony, studied caution or a tendency to see the glass as half-empty. Although American households began to rebuild savings after the global financial crisis, an additional dollar has tended to burn a hole in their pockets ever since the baby boomers began reaching adulthood (Chart 1). Chart 1The Searing Trauma Of The Depression Weighed On Consumption Decisions
The Searing Trauma Of The Depression Weighed On Consumption Decisions
The Searing Trauma Of The Depression Weighed On Consumption Decisions
Even if Americans were wont to consider future tax burdens, it may be rational for the households who received the fiscal transfers to assume they will largely escape them unless their relative income surges. Per the most recent adjusted gross income (AGI) distribution data (for tax year 2018), 70% of taxpayers earn $75,000 or less (Chart 2). Single taxpayers meeting that threshold (and married taxpayers earning $150,000 or less) received the full amount of the economic impact payments authorized by the CARES Act and subsequent legislation. That bottom 70% paid just 5.1% of AGI in federal taxes (Chart 3), and the current political climate points in the direction of an increasingly progressive tax system, so they may not have to worry about being called upon to cover the expanding deficit down the road. Chart 2The Income Distribution Is Top Heavy ...
Post-Traumatic Bliss
Post-Traumatic Bliss
Chart 3…But So Is The Tax Burden
Post-Traumatic Bliss
Post-Traumatic Bliss
The (Not So Traumatic) Economic Trauma Of COVID-19 While we are confident that Ricardian equivalence will not act as an impediment to consumption, the ultimate disposition of households’ excess pandemic savings is unknown. Our working assumption has been that half of the savings will be spent across 2021 and 2022. Though we do not have any close antecedents for what households might do with a savings windfall equivalent to 10% of a year’s GDP amassed over a thirteen-month span, we reject the notion that those who experienced COVID-19 will behave like the many shell-shocked survivors of the Great Depression who became lifelong precautionary savers. However terrible the human cost of COVID, it did not ravage American households’ financial position; as the Fed’s latest Flow of Funds report showed, their balance sheets flourished, allowing the vast majority of them to escape any sense of financial trauma. Per the Flow of Funds, American household wealth grew by nearly $6 trillion in the second quarter, extending the last five quarters’ gains to $31 trillion since financial markets cratered when the pandemic burst forth in the first quarter of 2020. The 22% annualized five-quarter gain is nearly four standard deviations above the mean and blows away 4Q03 through 4Q04’s 14% second-place mark by two full standard deviations (Chart 4, top panel). The current run sets a record even when it’s stretched to six quarters to include 1Q20, the worst quarter in series history, and the five- and six-quarter gains are also pacesetters after adjusting for inflation (Chart 4, bottom panel). Chart 4Recessions Aren't So Bad When Congress And The Fed Throw Everything They Have At Them
Recessions Aren't So Bad When Congress And The Fed Throw Everything They Have At Them
Recessions Aren't So Bad When Congress And The Fed Throw Everything They Have At Them
Changes in household net worth lead consumption growth with a two-quarter lag (Chart 5), though the four quarters before the most recent one (the red dots with negative consumption growth) were notable outliers. 2Q21 consumption was just a little more than a percentage point below the best-fit line, however, so it is closing in on its modeled value and we expect it will overshoot it in coming quarters upon the release of pent-up demand. We do not believe that the pandemic will dampen household spending simply because the broad mass of consumers did not experience financial trauma on a scale that would alter future behavior. As household wealth and income data have shown, this recession has been a boon for most Americans. Chart 5Consumption Overshoots Are On The Way
Post-Traumatic Bliss
Post-Traumatic Bliss
Chart 6Fiscal Shock And Awe
Post-Traumatic Bliss
Post-Traumatic Bliss
We additionally reject the notion that households have learned a lesson that will make them want to hold more savings. The financial lesson of the pandemic seems to be that policymakers will do their utmost to shelter them from calamity. Between the economic impact payments (Chart 6, top panel) and the UI benefit supplement (Chart 6, middle panel), Congress directly sent nearly $1.5 trillion to US households to offset $300 billion of lost wages (Chart 6, bottom panel). COVID-19 inflicted terrible distress on those who lost loved ones and witnessed or experienced near fatal suffering, but it boosted the lower three quartiles of households who received transfers and the top decile of households who reveled in the financial markets’ advance. Those who experienced it will not hoard their pennies and shun debt like many of the Depression’s survivors; they are more likely to have experienced post-traumatic bliss than stress when it comes to their financial outlook. Too Much Of A Good Thing? We periodically check in on the Flow of Funds for insight into the evolution of households’ asset allocations and the share of net worth accounted for by homes. Directly owned equities and mutual funds have taken share from the other major categories throughout the pandemic run (Chart 7) and now account for a record share of household financial assets after having surpassed their 2000 highs (Chart 8, top panel). It is sensible to approach any equity milestone that invokes the dot-com bubble with some trepidation, but structural factors go a long way toward explaining the new allocation peak. The financialization of the economy has steadily advanced since the Flow of Funds data began to be compiled in 1951, promoting public equity ownership, and consolidation has supported the transfer of commercial ownership from mom-and-pop operations to corporate interests, many of which are publicly traded. Overall equity in businesses as a share of household net worth is merely in line with its ‘50s levels (Chart 8, bottom panel). Chart 7The Running Of The Bulls
The Running Of The Bulls
The Running Of The Bulls
Chart 8From Mom And Pop To Broad And Wall
From Mom And Pop To Broad And Wall
From Mom And Pop To Broad And Wall
Home price appreciation has picked up, but it is not out of the ordinary (Chart 9). Home equity gains have outstripped home price gains, relative to each series’ history, testifying to prudent behavior on the part of borrowers and lenders. The low aggregate mortgage loan-to-value ratio (Chart 10) suggests that slowing home price appreciation, or even an outright decline, would not be a source of economic instability. Chart 9Home Price Gains Are Not Out Of The Ordinary ...
Home Price Gains Are Not Out Of The Ordinary ...
Home Price Gains Are Not Out Of The Ordinary ...
Chart 10... And Leverage Levels Are Not A Concern
... And Leverage Levels Are Not A Concern
... And Leverage Levels Are Not A Concern
The Fed Signals That Tapering Is Near Though the FOMC did not adjust the pace of its asset purchases last week, it indicated that tapering will most likely begin after its November meeting. Chair Powell noted that the economy has made substantial further progress toward reaching the committee’s inflation goal and expressed that “many” members feel that it has made substantial progress toward achieving its full employment objective as well, going so far as to volunteer his personal view that the employment test has been “all but met.” Per the committee’s discussions, the purchases will likely end around the middle of next year if the economy progresses in line with its expectations. The committee would not be talking about reducing the accommodation it’s providing the economy if it weren’t secure in the sense that it is on solid footing. Powell expressed satisfaction with the evolution of inflation expectations (Chart 11) and although the real GDP forecast for this year was lowered in the summary of economic projections (the “dots”), next year’s forecast was raised and slightly higher inflation expectations imply that nominal GDP growth will remain quite robust. A shift in two members’ fed funds rate projections brought the median member’s liftoff date to 2022 from 2023, in line with our view. Chart 11The Fed Has Succeeded In Firming Up Inflation Expectations
The Fed Has Succeeded In Firming Up Inflation Expectations
The Fed Has Succeeded In Firming Up Inflation Expectations
The chair reiterated that tapering – slowing the pace of accommodation – and hiking the fed funds rate – slowing the economy – are distinct actions subject to separate criteria. We see liftoff as a more significant action than tapering, but much will depend on the pace at which the committee lifts the fed funds rate. It is too soon to speculate on the pace, but we stress that the big move for financial markets will occur once the policy rate exceeds the neutral rate. If the latter is somewhere around 2%, the rate hike pace embedded in the dots suggests that it may take until the end of 2024 or early 2025 before monetary policy becomes restrictive. Investment Implications If monetary policy is not going to become tight for another three years, it is premature to shift a portfolio to more defensive settings, especially for anyone sharing our three-to-twelve-month cyclical timeframe. Growth will be robust in the near term, supported by the income boost that the lower three quartiles of taxpayers received from fiscal transfers and the way wealthier households cleaned up as financial asset prices soared. We expect that a hearty portion of the newly minted wealth will be spent, as Ricardian equivalence requires a longer attention span than Americans typically exhibit, and the pandemic was largely trauma-free for most households from a financial perspective. The clearest policy lesson that a citizen should have taken from COVID is that Congress and the Fed have his/her back in a big way. We are staying the course with our risk-friendly asset allocation recommendations. Doug Peta, CFA Chief US Investment Strategist dougp@bcaresearch.com