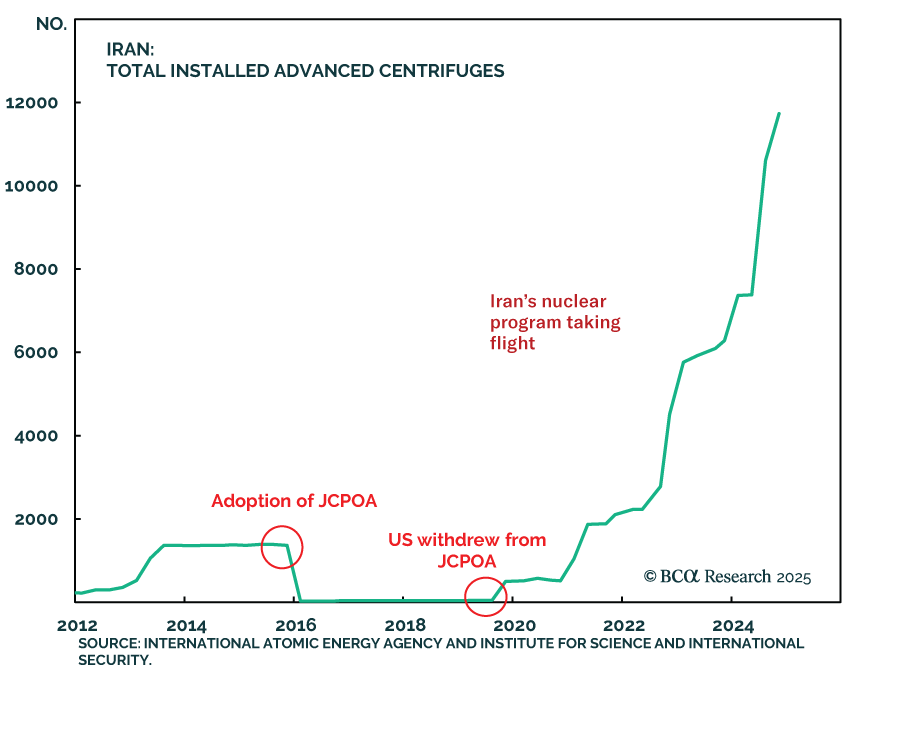
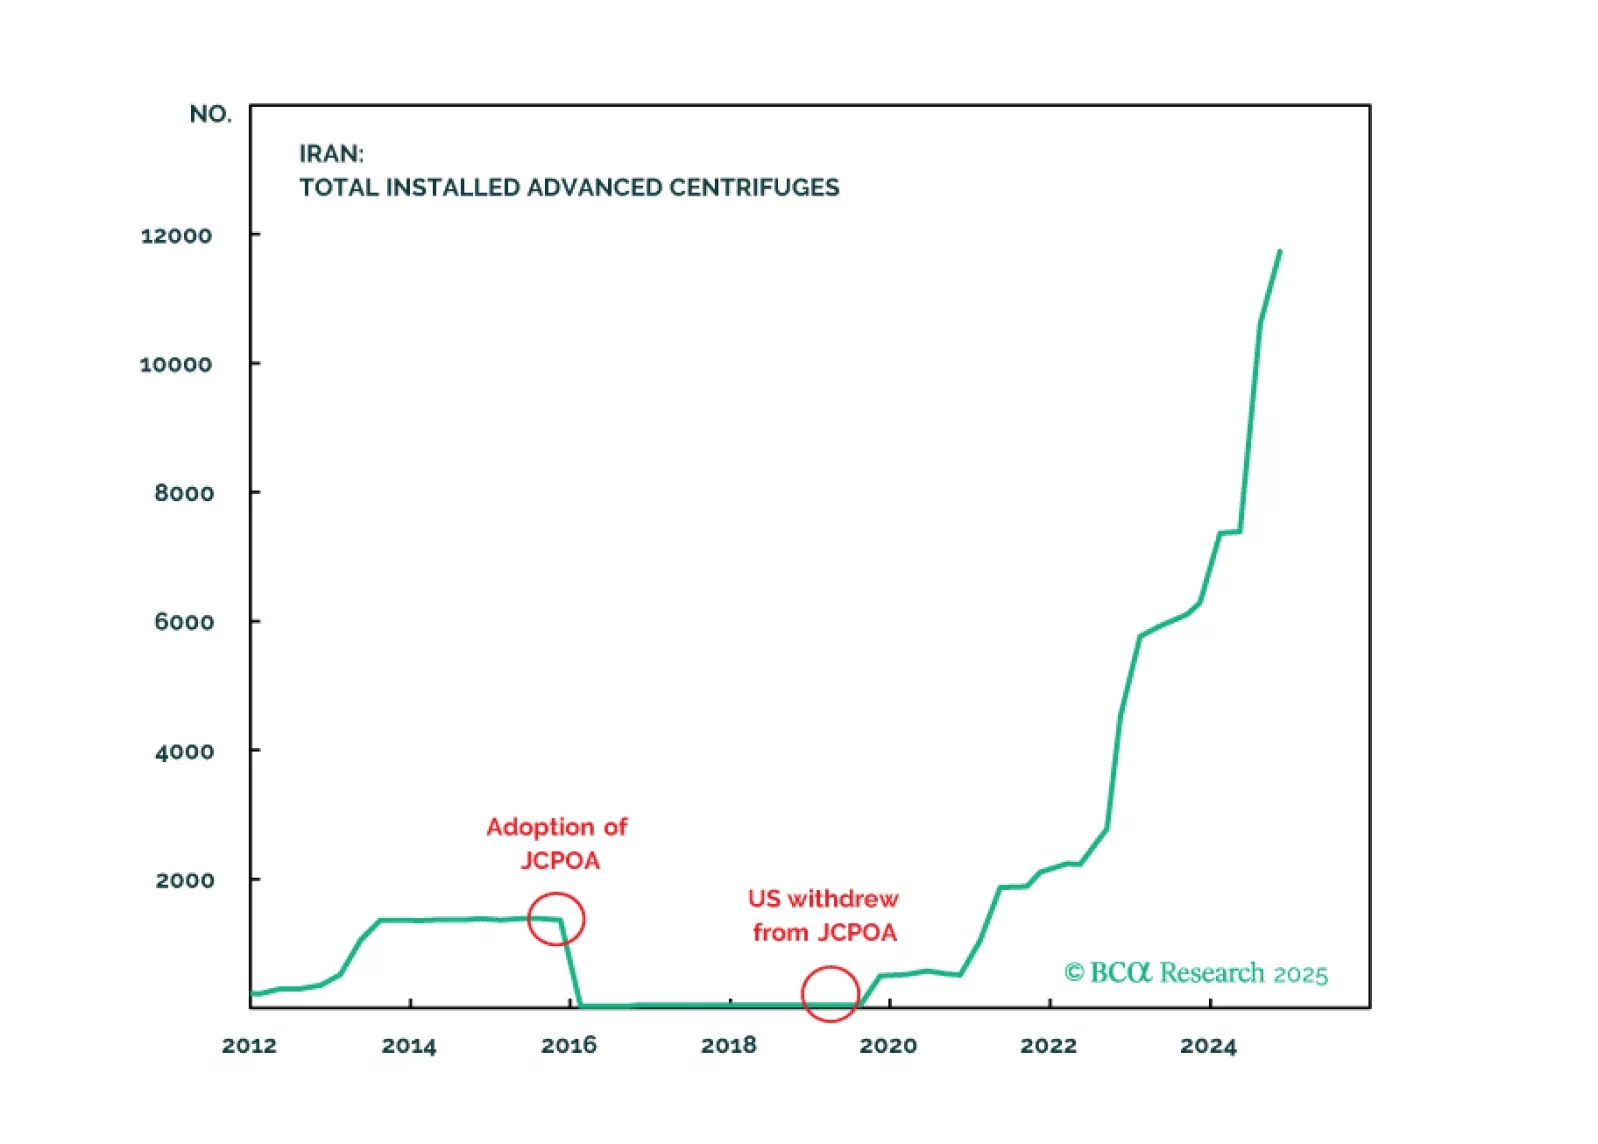
Iran
Every year we highlight five low-odds scenarios that would have a major impact on global financial markets if they happened. This year we contemplate a total reversal of Chinese policy, a US-Iran nuclear deal, a breakdown of NATO, US military action across the Americas, and an internationally coordinated FX intervention.
- Congress will pass tax cuts by end of 2025 producing a fiscal thrust of about 0.9% of GDP in 2026.
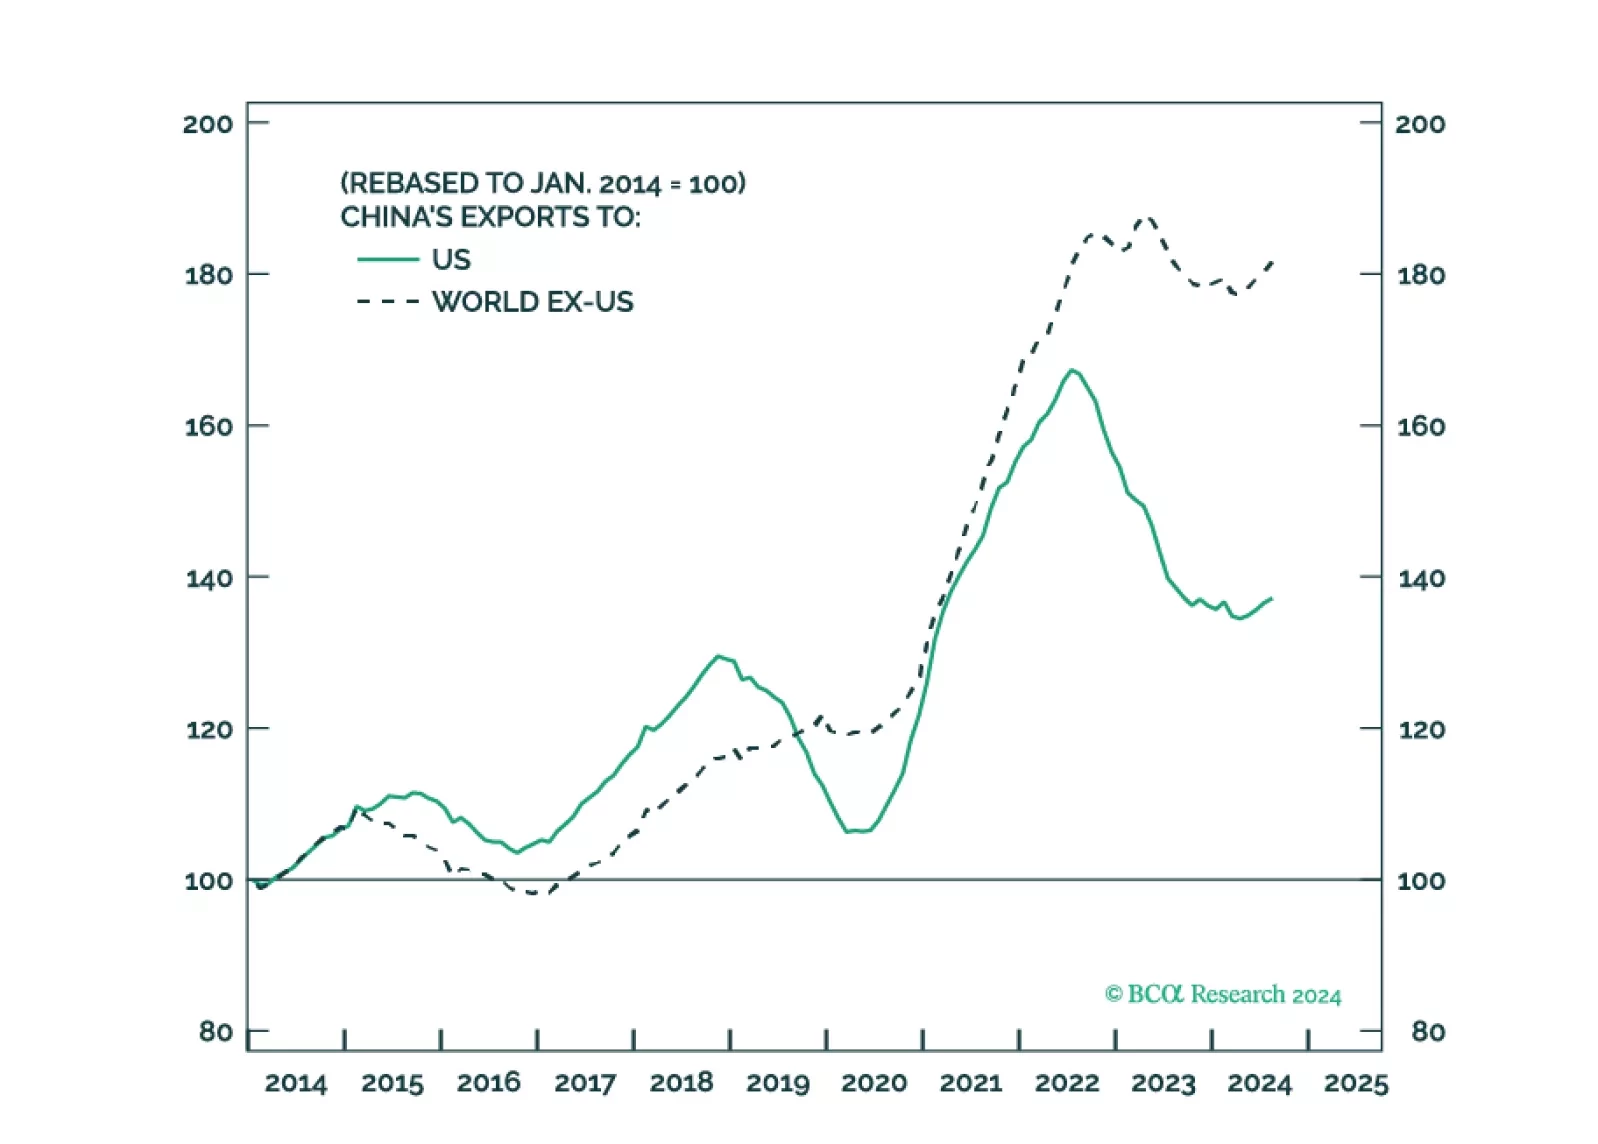
- Trump will count on that stimulus as a basis for slapping tariffs on leading trade partners.
- China will retaliate against Trump and stimulate its domestic economy, while pursuing stronger trade ties with other countries. Europe will also retaliate.
- Geopolitical risk will shift from Ukraine-Russia to Israel-Iran, where the conflict will continue to escalate until a crisis point is reached within 2025.
The global political system is destabilizing and the US will turn more hawkish in foreign policy, trade policy, or both, regardless of the election outcome. Tactically go long the dollar.

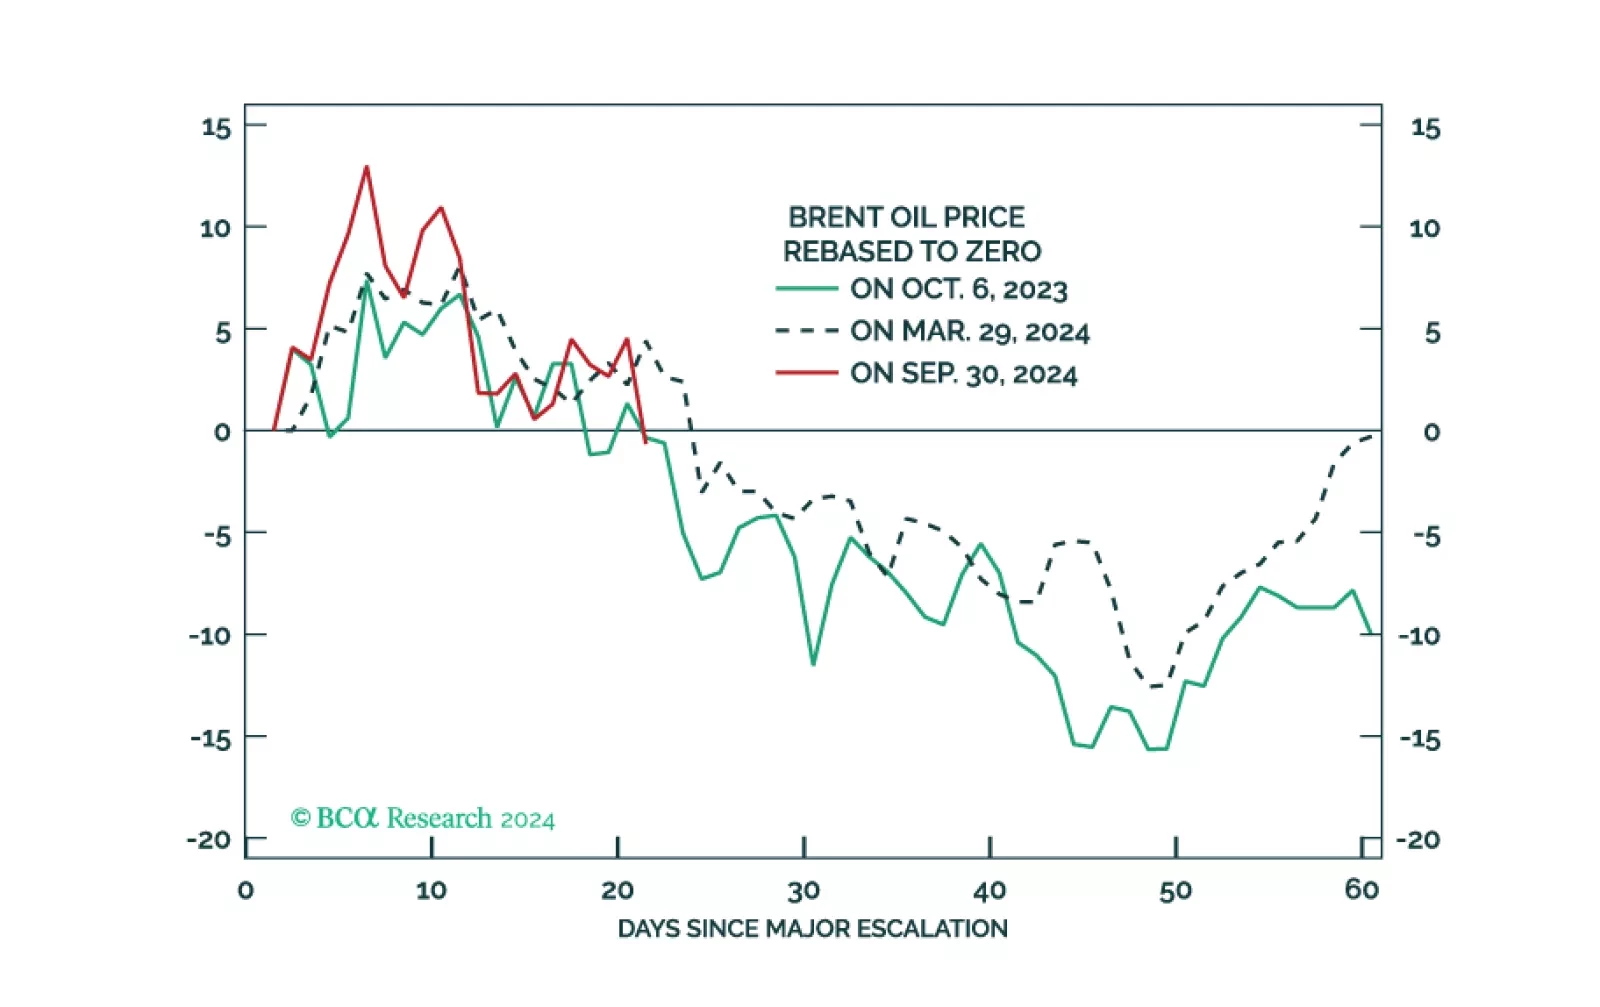
We maintain 37% odds of a major recessionary oil shock, 51% odds of minor shocks, and 12% odds of no shocks.
October seasonality tends to be negative for stocks in an election year. That is the only thing that has stayed our hand from shifting out of our tactical underweight on US equities, initiated – poorly – in July.
But the big macro news from September has not been bearish. The Fed has signaled jumbo cuts. Within seven weeks, the US central bank intends to cut by 100bps! Meanwhile, China appears to have reached a “policy bottom,” with its September 26 Politburo meeting signaling an extraordinary rhetorical shift towards fiscal policy. As such, we are starting to sniff out global reflation, akin to the 2015-2016 mid-cycle slowdown.
The labor market data still worries us. It is clearly deteriorating, on paper. Is it because of an imminent recession or “normalization?” It is difficult to say. We are open minded.
Finally, the Middle East tensions are again on the horizon. If Iran stays its hand against Saudi energy facilities – which we expect it to continue to do – the Iran-Israel conflict is a sideshow. Nonetheless, with global reflation afoot, we went long oil last week, on September 26. As such, geopolitics is a neat tailwind to that call.

Markets are rallying on Fed rate cuts and China stimulus but there will also be October surprises ahead of the US election, which Trump could still win. Russia’s conflict with the West is escalating and the Middle East is destabilizing further. Investors should favor US bonds but they should add some risk in emerging markets in response to China’s policy turn.
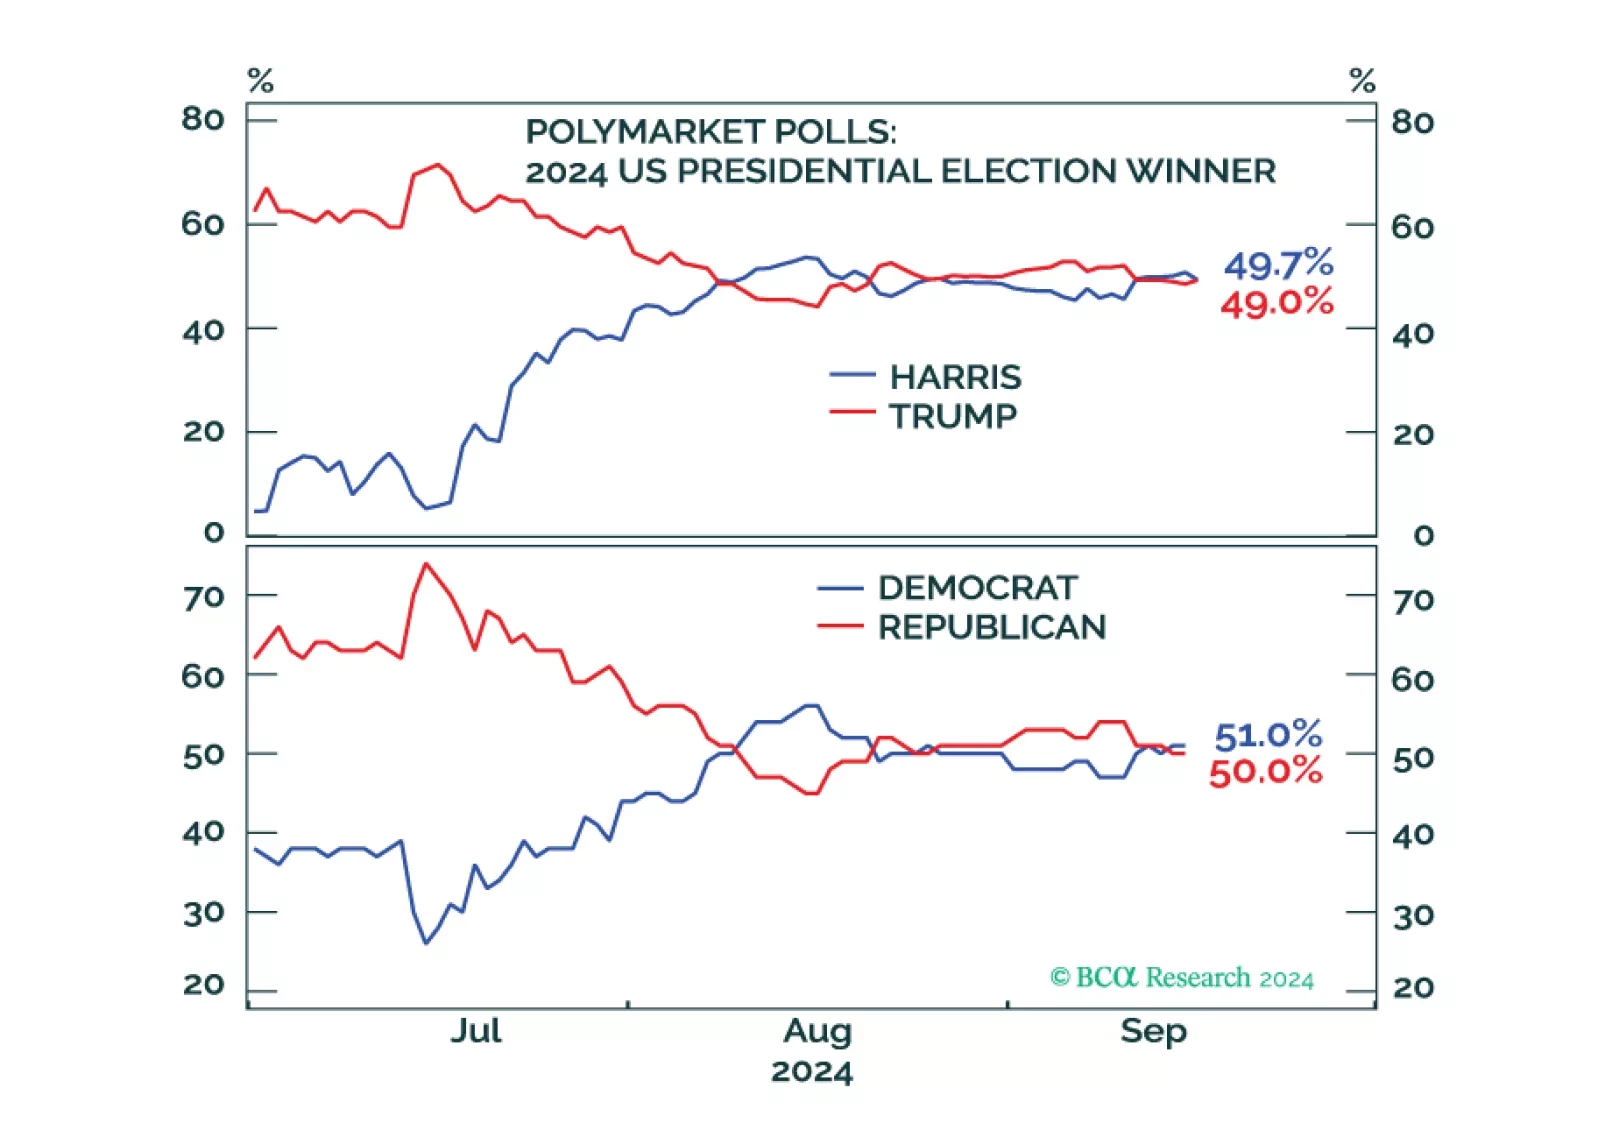
Investors should de-risk tactically in expectation of shocks and surprises ahead of the US election and an uncertain aftermath. Democratic victory with a gridlocked Congress is our base case but would bring minor tax hikes and nuclear brinksmanship with Russia. A Republican single-party sweep offers huge tax cuts but also a global trade war. Recession looms regardless.
Investors should buy protection against further volatility. The shakeup in early August was a taste of things to come. The US election is a pivotal moment in modern history that will drive up uncertainty, while other countries take advantage of US division and distraction.
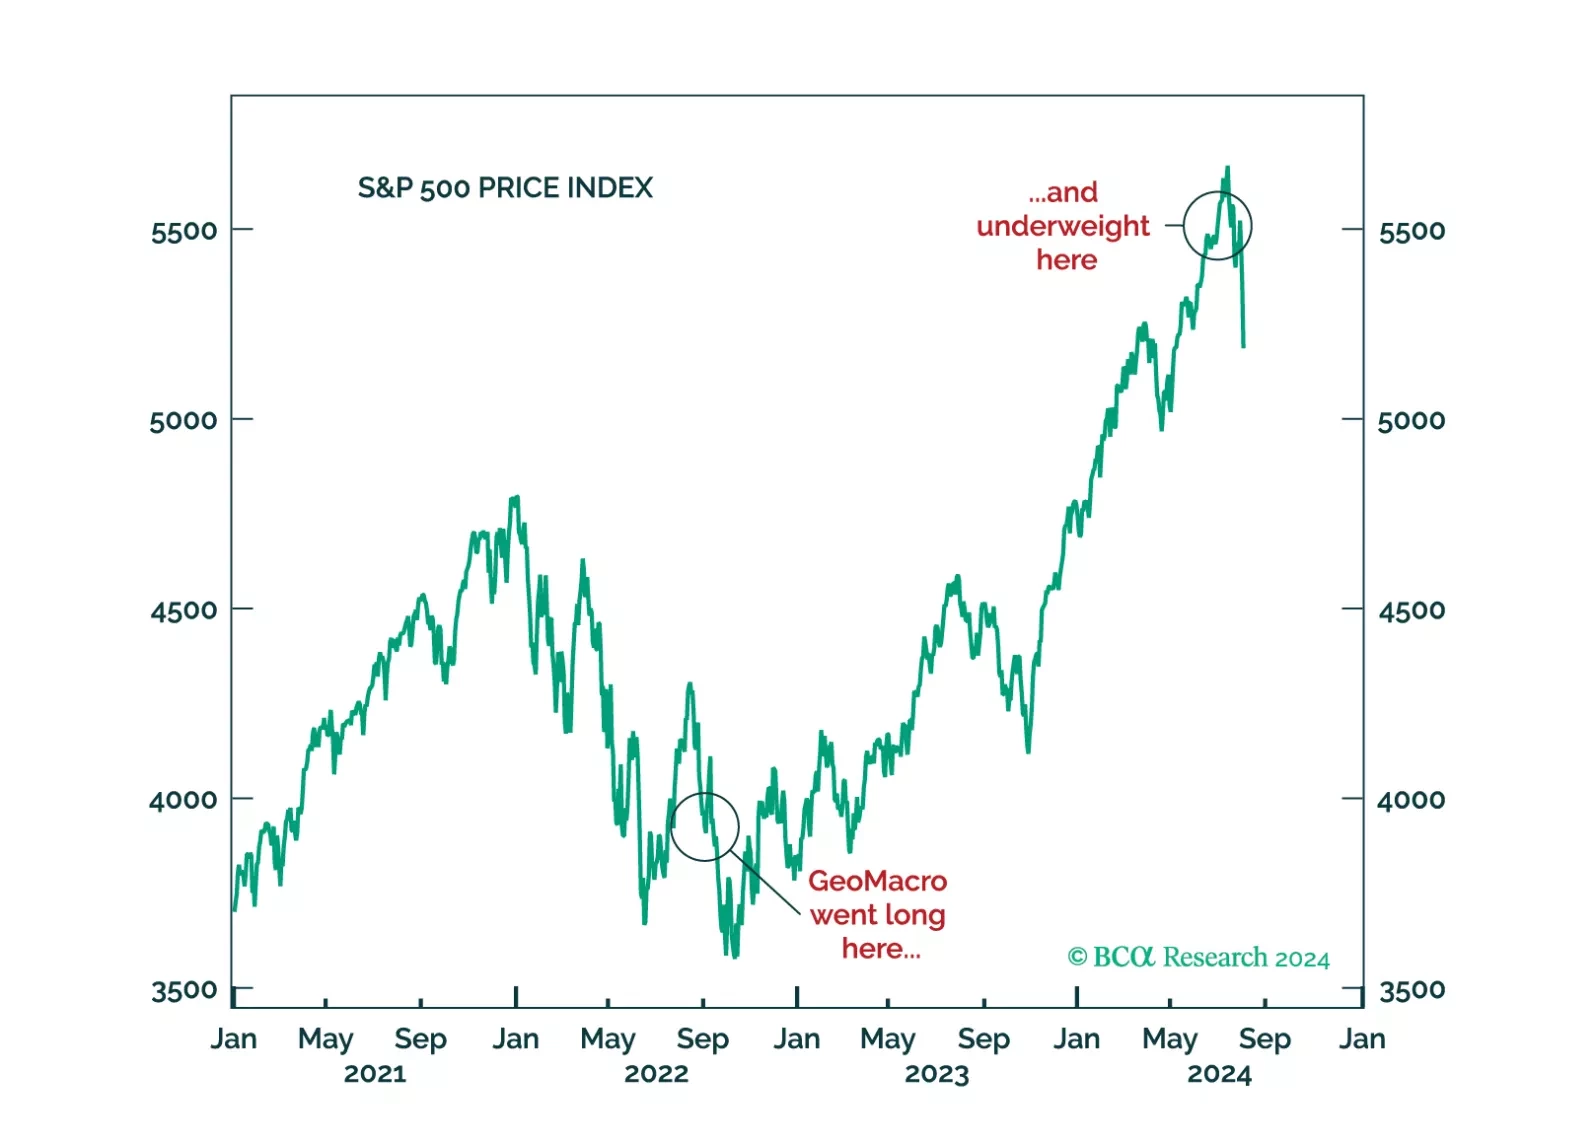
The decision by GeoMacro team on July 2 to short USDJPY and underweight equities has proven to be prescient. We still do not like the market setup from here on out. A recession would, obviously, be negative for risk assets. But even if investors avoid that scenario, the transition from cash- to leverage-driven growth is unlikely without a significant Fed rate-cutting cycle.