Mega Themes

Highlights Global equities are poised to deliver mid-to-high single-digit returns this year, with the outlook turning bleaker in 2023 and beyond. Non-US markets are likely to outperform. We examine the four pillars that have historically underpinned stock market performance. Pillar 1: Technically, the outlook for equities is modestly bullish, as investor sentiment is nowhere near as optimistic as it usually gets near market tops. Pillar 2: The outlook for economic growth and corporate earnings is modestly bullish as well. While global growth is slowing, it will remain solidly above trend in 2022. Pillar 3: Monetary and financial conditions are neutral. The Fed and a number of other central banks are set to raise rates and begin unwinding asset purchases this year. However, monetary policy will remain highly accommodative well into 2023. Pillar 4: Valuations are bearish in the US and neutral elsewhere. Investors should avoid tech stocks in 2022, focusing instead on banks and deep cyclicals, which are more attractively priced. The Bedrock For Equities In assessing the outlook for the stock market, our research has focused on four pillars: 1) Sentiment and other technical factors, which are most pertinent for stocks over short-term horizons of about three months; 2) cyclical fluctuations in economic growth and corporate earnings, which tend to dictate the path for stocks over medium-term horizons of about 12 months; 3) monetary and financial conditions, which are also most relevant over medium-term horizons; and finally 4) valuations, which tend to drive stocks over the long run. In this report, we examine all four pillars, concluding that global equities are likely to deliver mid-to-high single-digit returns this year, with the outlook turning bleaker in 2023 and beyond. Pillar 1: Sentiment And Other Technical Factors (Modestly Bullish) Chart 1US Equities: Breadth Is A Concern
US Equities: Breadth Is A Concern
US Equities: Breadth Is A Concern
Scaling The Wall Of Worry Stocks started the year on a high note, before tumbling on Wednesday following the release of the Fed minutes. Market breadth going into the year was quite poor. Even as the S&P 500 hit a record high on Tuesday, only 57% of NYSE stocks and 38% of NASDAQ stocks were trading above their 200-day moving averages compared to over 90% at the start of 2021 (Chart 1). The US stock market had become increasingly supported by a handful of mega-cap tech stocks, a potentially dangerous situation in an environment where bond yields are rising and stay-at-home restrictions are apt to ease (more on this later). That said, market tops often occur when sentiment reaches euphoric levels. That was not the case going into 2022 and it is certainly not the case after this week's sell-off. The number of bears exceeded the number of bulls in the AAII survey this week and in six of the past seven weeks (Chart 2). The share of financial advisors registering a bullish bias declined by 25 percentage points over the course of 2021 in the Investors Intelligence poll. Option pricing is far from complacent. The VIX stands at 19.6, above its post-GFC median of 16.7. According to the Minneapolis Fed’s market-based probabilities model, the market was discounting a slightly negative 12-month return for the S&P 500 as of end-2021, with a 3.6 percentage-point larger chance of a 20% decline in the index than a 20% increase (Chart 3). Chart 3Option Pricing Is Not Pointing To Elevated Complacency
Option Pricing Is Not Pointing To Elevated Complacency
Option Pricing Is Not Pointing To Elevated Complacency
Chart 2Sentiment Is Not Exceptionally Bullish, Despite The S&P 500 Trading Close To All-Time Highs
Sentiment Is Not Exceptionally Bullish, Despite The S&P 500 Trading Close To All-Time Highs
Sentiment Is Not Exceptionally Bullish, Despite The S&P 500 Trading Close To All-Time Highs
Equities do best when sentiment is bearish but improving (Chart 4). With bulls in short supply, stocks can continue to climb the proverbial wall of worry. Whither The January Effect? Historically, stocks have fared better between October and April than between May and September (Chart 5). One caveat is that the January effect, which often saw stocks rally at the start of the year, has disappeared. In fact, the S&P 500 has fallen in January by an average annualized rate of 5.2% since 2000 (Table 1). Other less well-known calendar effects – such as the tendency for stocks to underperform on Mondays but outperform on the first trading day of each month – have persisted, however.
Chart 4
Chart 5
Table 1Calendar Effects
The Four Pillars Of The Stock Market
The Four Pillars Of The Stock Market
Bottom Line: January trading may be choppy, but stocks should rise over the next few months as more bears join the bullish camp. Last year’s losers are likely to outperform last year’s winners. Pillar 2: Economic Growth And Corporate Earnings (Modestly Bullish) Economic Growth And Earnings: Joined At The Hip The business cycle is the most important driver of stocks over medium-term horizons of about 12 months. The reason is evident in Chart 6: Corporate earnings tend to track key business cycle indicators such as the ISM manufacturing index, industrial production, business sales, and global trade. Chart 6The Business Cycle Is The Most Important Driver Of Stocks Over Medium-Term Horizons
The Business Cycle Is The Most Important Driver Of Stocks Over Medium-Term Horizons
The Business Cycle Is The Most Important Driver Of Stocks Over Medium-Term Horizons
Chart 7PMIs Signaling Above-Trend Growth
PMIs Signaling Above-Trend Growth
PMIs Signaling Above-Trend Growth
Global growth peaked in 2021 but should stay solidly above trend in 2022. Both the service and manufacturing PMIs remain in expansionary territory (Chart 7). The forward-looking new orders component of the ISM exceeded 60 for the second straight month in December. The Bloomberg consensus is for real GDP to rise by 3.9% in the G7 in 2022, well above the OECD’s estimate of trend G7 growth of 1.4% (Chart 8). Global earnings are expected to increase by 7.1%, rising 7.5% in the US and 6.7% abroad (Chart 9). Our sense is that both economic growth and earnings will surprise to the upside in 2022. Chart 9Analysts Expect Single-Digit Earnings Growth
Analysts Expect Single-Digit Earnings Growth
Analysts Expect Single-Digit Earnings Growth
Chart 8
Plenty Of Pent-Up Demand For Both Consumer And Capital Goods US households are sitting on $2.3 trillion in excess savings (Chart 10). Around half of these savings will be spent over the next few years, helping to drive demand. Households in the other major advanced economies have also buttressed their balance sheets. Chart 10Plenty Of Pent-Up Demand
Plenty Of Pent-Up Demand
Plenty Of Pent-Up Demand
After two decades of subdued corporate investment, capital goods orders have soared. This bodes well for capex in 2022. Inventories remain at rock-bottom levels, which implies that output will need to exceed spending for the foreseeable future (Chart 11). On the residential housing side, both the US homeowner vacancy rate and the inventory of homes for sale are near multi-decade lows. Building permits are 11% above pre-pandemic levels (Chart 12). Chart 11Business Investment Should Be Strong In 2022
Business Investment Should Be Strong In 2022
Business Investment Should Be Strong In 2022
Chart 12Residential Construction Will Remain Well Supported
Residential Construction Will Remain Well Supported
Residential Construction Will Remain Well Supported
Chart 13China's Credit Impulse Has Bottomed
China's Credit Impulse Has Bottomed
China's Credit Impulse Has Bottomed
Chinese Growth To Rebound, Europe To Benefit From Lower Natural Gas Prices Chinese credit growth decelerated last year. However, the 6-month credit impulse has bottomed, and the 12-month impulse is sure to follow (Chart 13). Chinese coal prices have collapsed following the government’s decision to instruct 170 mines to expand capacity (Chart 14). China generates 63% of its electricity from coal. Lower energy prices and increased stimulus should support Chinese industrial activity in 2022. Like China, Europe will benefit from lower energy costs. Natural gas prices have fallen by nearly 50% from their peak on December 21st. A shrinking energy bill will support the euro (Chart 15). Chart 14Coal Prices Are Renormalizing In China
Coal Prices Are Renormalizing In China
Coal Prices Are Renormalizing In China
Chart 15A Shrinking Energy Bill Will Support The Euro
A Shrinking Energy Bill Will Support The Euro
A Shrinking Energy Bill Will Support The Euro
Chart 16
Omicron Or Omicold? While the Omicron wave has led to an unprecedented spike in new cases across many countries, the economic fallout will be limited. The new variant is more contagious but significantly less lethal than previous ones. In South Africa, it blew through the population without triggering a major increase in mortality (Chart 16). Preliminary data suggest that exposure to Omicron confers at least partial immunity against Delta. The general tendency is for viral strains to become less lethal over time. After all, a virus that kills its host also kills itself. Given that Omicron is crowding out more dangerous strains such as Delta, any future variant is likely to emanate from Omicron; and odds are this new variant will be even milder than Omicron. Meanwhile, new antiviral drugs are starting to hit the market. Pfizer claims that its new drug, Paxlovid, cuts the risk of hospitalization by almost 90% if taken within five days from the onset of symptoms. Bottom Line: While global growth has peaked and the pandemic remains a risk, growth should stay well above trend in the major economies in 2022, fueling further gains in corporate earnings and equity prices. Pillar 3: Monetary And Financial Factors (Neutral) Chart 17The Overall Stance Of Monetary Policy Will Not Return To Pre-Pandemic Levels For At Least Another 12 Months
The Overall Stance Of Monetary Policy Will Not Return To Pre-Pandemic Levels For At Least Another 12 Months
The Overall Stance Of Monetary Policy Will Not Return To Pre-Pandemic Levels For At Least Another 12 Months
Tighter But Not Tight Monetary and financial factors help govern the direction of equity prices both because they influence economic growth and also because they affect the earnings multiple at which stocks trade. There is little doubt that a number of central banks, including the Federal Reserve, are looking to dial back monetary stimulus. However, there is a big difference between tighter monetary policy and tight policy. Even if the FOMC were to raise rates three times in 2022, as the market is currently discounting, the fed funds rate would still be half of what it was on the eve of the pandemic (Chart 17). Likewise, even if the Fed were to allow maturing assets to run off in the middle of this year, as the minutes of the December FOMC meeting suggest is likely, the size of the Fed’s balance sheet will probably not return to pre-pandemic levels until the second half of this decade. A Higher Neutral Rate We have argued in the past that the neutral rate of interest in the US is higher than widely believed. This implies that the overall stance of monetary policy remains exceptionally stimulative. Historically, stocks have shrugged off rising bond yields, as long as yields did not increase to prohibitively high levels (Table 2). Table 2As Long As Bond Yields Don’t Rise Into Restrictive Territory, Stocks Will Recover
The Four Pillars Of The Stock Market
The Four Pillars Of The Stock Market
If the neutral rate ends up being higher than the Fed supposes, the danger is that monetary policy will stay too loose for too long. The question is one of timing. The good news is that inflation should recede in the US in 2022, as supply-chain bottlenecks ease and spending shifts back from goods to services. The bad news is that the respite from inflation will not last. As discussed in Section II of our recently-published 2022 Strategy Outlook, inflation will resume its upward trajectory in mid-2023 on the back of a tightening labor market and a budding price-wage spiral. This second inflationary wave could force the Fed to turn much more aggressive, spelling the end of the equity bull market. Bottom Line: While the Fed is gearing up to raise rates and trim the size of its balance sheet, monetary policy in the US and in other major economies will remain highly accommodative in 2022. US policy could turn more restrictive in 2023 as a second wave of inflation forces a more aggressive response from the Fed. Pillar 4: Valuations (Bearish In The US; Neutral Elsewhere) US Stocks Are Looking Pricey… While valuations are a poor timing tool in the short run, they are an excellent forecaster of stock prices in the long run. Chart 18 shows that the Shiller PE ratio has reliably predicted the 10-year return on equities. Today, the Shiller PE is consistent with total real returns of close to zero over the next decade.
Chart 18
Investors’ allocation to stocks has also predicted the direction of equity prices (Chart 19). According to the Federal Reserve, US households held a record high 41% of their financial assets in equities as of the third quarter of 2021. If history is any guide, this would also correspond to near-zero long-term returns on stocks. Chart 19Valuations Matter For Long-Term Returns (II)
Valuations Matter For Long-Term Returns (II)
Valuations Matter For Long-Term Returns (II)
… But There Is More Value Abroad Valuations outside the US are more reasonable. Whereas US stocks trade at a Shiller PE ratio of 37, non-US stocks trade at 20-times their 10-year average earnings. Other valuation measures such as price-to-book, price-to-sales, and dividend yield tell a similar story (Chart 20). Chart 20AUS Stocks Are Trading At A Significant Premium To Their Non-US Peers (I)
US Stocks Are Trading At A Significant Premium To Their Non-US Peers (I)
US Stocks Are Trading At A Significant Premium To Their Non-US Peers (I)
Chart 20BUS Stocks Are Trading At A Significant Premium To Their Non-US Peers (II)
US Stocks Are Trading At A Significant Premium To Their Non-US Peers (II)
US Stocks Are Trading At A Significant Premium To Their Non-US Peers (II)
Cyclicals And Banks Overrepresented Abroad Our preferred sector skew for 2022 favors non-US equities. Increased capital spending in developed economies and incremental Chinese stimulus should boost industrial stocks and other deep cyclicals, which are overrepresented outside the US (Table 3). Banks are also heavily weighted in overseas markets; they should also do well in response to faster-than-expected growth and rising bond yields (Chart 21). Table 3Deep Cyclicals And Financials Are Overrepresented Outside The US
The Four Pillars Of The Stock Market
The Four Pillars Of The Stock Market
Chart 21Rising Bond Yields Will Help Bank Shares
Rising Bond Yields Will Help Bank Shares
Rising Bond Yields Will Help Bank Shares
Bottom Line: Valuations are more appealing outside the US, and with deep cyclicals and banks set to outperform tech over the coming months, overseas markets are the place to be in 2022. Peter Berezin Chief Global Strategist peterb@bcaresearch.com Global Investment Strategy View Matrix
Image
Special Trade Recommendations
Image
Current MacroQuant Model Scores
Image
Highlights For the time being, US core inflation will not drop anywhere close to the Fed’s target range. The Fed will continue tightening until something breaks. US bond yields and the US dollar are heading higher. The S&P500 will need to drop meaningfully for the Fed to stop tightening. The Fed’s tightening and the US dollar’s persistent strength amid the lack of recovery in the Chinese business cycle will eventually produce a drawdown in commodity prices in the coming months. Absolute-return investors should stay defensive on EM risk assets and asset allocators should continue to underweight EM versus DM in global equity and credit portfolios. Feature We are starting the year with a review of a few macro pillars of our view that will shape global financial markets in the coming months. US Core Inflation Will Prove Sticky… Chart 1Average Of All Core US Inflation Measures
Average Of All Core US Inflation Measures
Average Of All Core US Inflation Measures
The average of seven various US core inflation measures – core CPI, core PCE, trimmed-mean CPI, median CPI, sticky core CPI, trimmed-mean PCE and market-based core PCE – has surged to 4% (Chart 1). Although the core inflation rate could decline in 2022 as supply bottlenecks ease and base effects become more favorable, it is unlikely to drop below 3%. Instead, it will remain well above the Fed’s inflation target. If the Fed adheres to its mandate, it will have to hike rates until inflation heads toward 2%. US core inflation will not drop toward 2% unless the economy slows materially. Consumer and business inflation expectations have risen substantially. US consumer inflation expectations for one and three years ahead have risen to 4-6%, and US non-farm businesses have been able to raise prices by 4.5% y/y in Q3 (Chart 2). We can say the genie – inflation and inflation expectations – is out of bottle and it will be hard to put it back in. Importantly, labor market shortages will persist, and employee wage demand will be strong. Employees’ current wage growth expectations are based on their inflation expectations in the next one to three years, not the next decade. Even though longer term inflation expectations remain somewhat muted, they will not prevent high wage growth. Critically, inflation has “eaten” into employee income: real wage growth – adjusted for headline consumer price inflation – has been negative in 2021 (Chart 3). Consistently, employees know their compensation has lagged inflation and will be demanding significant wage hikes in 2022. Chart 3Inflation Is "Eating" Into Wages In The US
Inflation Is "Eating" Into Wages In The US
Inflation Is "Eating" Into Wages In The US
Chart 2US Inflation Expectations Have Risen Sharply
US Inflation Expectations Have Risen Sharply
US Inflation Expectations Have Risen Sharply
In short, a wage-price spiral of moderate proportions is unfolding. Given tight labor market conditions, businesses will have no choice but raise wages considerably and then try to pass the higher costs on to their consumers. … Prompting Higher US Bond Yields … Despite the surge in core inflation to a 30-plus year high, US bond yields have remained low. The long end of the US yield curve has continued to be suppressed even as the market participants raised their rate hike expectations. Not only has the expected terminal Fed funds target rate not risen much, but also the bond term premium has remained negative. The bond term premium is akin to the equity risk premium. Pronounced uncertainty about the US inflation outlook as well as elevated bond volatility warrant a higher bond term premium (Chart 4). … Which Will Push The US Dollar Higher… Rising US interest rate expectations will lead to a stronger greenback. Our US Dollar Liquidity Indicator points to continued firmness in the broad trade-weighted US dollar ( the latter is shown inverted in this chart) (Chart 5). Chart 5US Dollar Liquidity And The US Dollar
US Dollar Liquidity And The US Dollar
US Dollar Liquidity And The US Dollar
Chart 4Inflation Uncertainty And High Bond Volitility Herald A Higher Term Premium
Inflation Uncertainty And High Bond Volitility Herald A Higher Term Premium
Inflation Uncertainty And High Bond Volitility Herald A Higher Term Premium
Our framework for the relationship between currencies and their interest rates is as follows: Scenario 1: When inflation is high or rising fast, the central bank is willing to hike rates and the economy can withstand higher borrowing costs, the currency will appreciate. Scenario 2: When inflation is high or rising fast and the central bank is unwilling to hike rates, the currency will depreciate. This is the case when the central bank falls behind the curve. Scenario 3: When the central bank is tightening but the economy cannot handle higher borrowing costs, the currency will depreciate. The US economy is presently able to handle higher interest rates. Hence, the US dollar is currently driven by the dynamics described in Scenario 1, i.e., rising interest rates will support the greenback. Chart 6US Household Finances Are Healthy
US Household Finances Are Healthy
US Household Finances Are Healthy
Our rationale is that US interest rate sensitive sectors like housing and car sales have been restrained by supply shortages – not weak demand. In fact, there is large pent-up demand for both housing and autos and a reasonable rise in borrowing costs will not thwart this demand. Besides, US household debt and debt servicing costs have declined substantially in the past 10 years (Chart 6). US households are no longer highly indebted. This development – along with robust wage gains – will allow households to borrow more and service their debt. Finally, unlike in many other Anglo-Saxon countries, in the US it is long-term rates – rather than short ones – that matter for household debt servicing. Mortgages make up 70% of household debt in the US and the mortgage rate is tied to the 30-year bond yield. In many other advanced and emerging economies, mortgage rates are more influenced by the central bank policy rate than long-term bond yields. As a result, the US economy will be able to endure monetary tightening by the Fed better than other developed and emerging economies can handle rate hikes from their central banks. Specifically, mainstream EM economies (EM ex-China, Korea and Taiwan) will slow markedly as and if their central banks hike rates further (Chart 7). There is, however, a caveat: Even though Main Street America will be able to withstand a reasonable amount of rate hikes, Wall Street might not be able ride out these rate hikes. The difference is the starting point – US equity valuations are very high. … And Will Herald A US Equity Correction And Sector Rotation The spike in US core inflation is likely to engender a negative correlation between US share prices and bond yields, as was the case in 1966. We first made this argument in last year’s Special Report titled A Paradigm Shift In The Stock-Bond Relationship (Chart 8). Chart 7Mainstream EM: Monetary Tightening Will Dampen Growth
Mainstream EM: Monetary Tightening Will Dampen Growth
Mainstream EM: Monetary Tightening Will Dampen Growth
Chart 8S&P500 And Bond Yields Correlation Will Turn Negative
S&P500 And Bond Yields Correlation Will Turn Negative
S&P500 And Bond Yields Correlation Will Turn Negative
The current episode in the US is akin to the second half of the 1960s when US core inflation and bond yields rose after decades of lingering at very low levels. Starting in 1966, US share prices became negatively correlated with US Treasury yields (Chart 9 – bond yields are shown inverted). Going forward, the S&P 500 will often take its cue from US bond yields: stocks will rally when bond yields decline, and tumble when bond yields rise. Given that we expect US Treasury yields to rise in the coming months (10-year yields will move well above 2%), the S&P 500 is likely to correct. The key risk to this view is the massive amount of cash on the sidelines, and widespread investor willingness to buy any dip in US equities. The absolute level of US retail money market funds currently stands at a formidable $1 trillion (Chart 10, top panel). However, this just represents a mere 2% of the US equity market cap (Chart 10, bottom panel). Hence, if institutional investors begin selling stocks, retail investors might not be able to support the market. Chart 9Early 2020s = Late 1960s?
Early 2020s = Late 1960s?
Early 2020s = Late 1960s?
Chart 10Cash on Sidelines: A Lot Or Not So Much?
Cash on Sidelines: A Lot Or Not So Much?
Cash on Sidelines: A Lot Or Not So Much?
Chart 11EM Relative Equity Performance Is Correlated With The USD, Not Bond Yields
EM Relative Equity Performance Is Correlated With The USD, Not Bond Yields
EM Relative Equity Performance Is Correlated With The USD, Not Bond Yields
Furthermore, rising US bond yields will cause US value stocks to outperform US growth stocks. Will EM stocks outperform US or DM ones as US bond yields rise? The top panel of Chart 11 illustrates that there has been no stable correlation between US bond yields and EM versus DM relative equity performance. Yet, there is a strong relationship between EM relative equity performance and the US dollar (Chart 11, bottom panel). If the broad trade-weighted US dollar rallies, EM stocks will underperform their DM counterparts (the greenback is shown inverted in the bottom panel of Chart 11). A sell-off in US stocks and bonds and the greenback’s rally will tighten US financial conditions considerably. The Fed is putting a lot of weight on financial conditions, especially when they are becoming restrictive. As US financial conditions tighten, the Fed will likely pivot, i.e., soften its hawkish stance. The Fed would likely argue that tight financial conditions will slow growth, which will in turn bring down inflation. Such a Fed pivot will potentially mark the end of a US dollar rally, enable American share prices to rise again, and EM stocks to start outperforming. However, we are not there yet. Bottom Line: For the time being, US core inflation will not drop anywhere close to the Fed’s target range. Hence, the Fed will continue tightening until something breaks. It will take a meaningful drop in the S&P500 (~20%) to make the Fed stop tightening. Commodity Prices Commodity prices have been caught between two opposing forces: US inflation and China’s slowdown. Worries about US inflation have made investors buy inflation hedges, and commodities are traditionally viewed as an inflation hedge. Yet, there is a caveat: Inflation is proliferating in the US but not in China. On the contrary, Chinese imports of key commodities contracted dramatically in H2 2021 (Chart 12). We are surprised that commodity prices have been so resilient despite shrinking Chinese commodity imports. Our sense is that commodity prices have been held up by two forces: strong global manufacturing activity and financial demand from investors. As for the green revolution, we believe it will be a major bullish force for select commodities in a couple of years. At the moment, however, it is not large enough to offset the slowdown in the Chinese economy. It might take investor concerns about US demand and/or a slowdown in global manufacturing to trigger a relapse in commodity prices. Rising US interest rates and a continued dollar rally will eventually result in a meaningful drawdown in commodity prices. Chart 13 demonstrates that the declines in the Swedish manufacturing PMI new orders-to-inventory ratio and the Swedish krona/Swiss franc cross rate point to downside risks in raw materials prices. Chart 12Chinese Imports Of Key Commodities Have Shrunk
Chinese Imports Of Key Commodities Have Shrunk
Chinese Imports Of Key Commodities Have Shrunk
Chart 13A Red Flag For Commodities From Industrial Sweden
A Red Flag For Commodities From Industrial Sweden
A Red Flag For Commodities From Industrial Sweden
Bottom Line: Commodity prices have so far ignored China’s slowdown. However, the Fed’s tightening and the US dollar’s persistent strength amid the lack of recovery in the Chinese business cycle will eventually produce a drawdown in resource prices in the coming months. Investment Strategy For EM Chart 14EM Equities: No Profit Growth, No Bull Market
EM Equities: No Profit Growth, No Bull Market
EM Equities: No Profit Growth, No Bull Market
EM share prices have been falling in absolute terms despite the strength in the S&P 500. The EM equity index will drop further due to the dismal EM profit outlook and the continued de-rating of Chinese TMT stocks. In absolute terms, the EM equity index is at the same level as it was in 2011 because EM EPS in USD has not expanded at all since 2011 (Chart 14). Investors are reluctant to pay high multiples for EM companies because they have produced zero earnings growth over the past 10 years. Besides, higher US bond yields and continued strength in the US dollar will lead to higher EM sovereign and corporate bond yields. EM non-TMT share prices typically wobble when EM US dollar borrowing costs rise (Chart 15). Chart 15Rising EM USD Borrowing Costs Are Bearish For EM Non-TMT Stocks
Rising EM USD Borrowing Costs Are Bearish For EM Non-TMT Stocks
Rising EM USD Borrowing Costs Are Bearish For EM Non-TMT Stocks
We continue to recommend underweighting EM in a global equity portfolio. EM always underperforms DM when the greenback rallies. We maintain our short positions in a basket of EM currencies versus the US dollar. Rising US bond yields and a firm greenback will continue weighing on EM fixed income markets – both local currency and US dollar ones. Fixed-income investors should favor US corporate credit over EM corporate and sovereign credit, quality adjusted. In local rates, we are betting on yield curve inversion in Russia and Mexico, receiving rates in China and Malaysia and paying rates in the Czech Republic. For the full list of our fixed-income, currency and equity recommendations, please refer to the tables below. These are also available on our website. Arthur Budaghyan Chief Emerging Markets Strategist arthurb@bcaresearch.com Equities Recommendations Currencies, Credit And Fixed-Income Recommendations
Highlights Demand in the major economies remains well below its pre-pandemic trend. Meaning that relative to potential output, demand is lukewarm, at best. Inflation is hot, not because of strong overall demand, but because of the surging demand for goods. If the spending on goods cools, then inflation will also cool. We expect this ‘good’ resolution of inflation to unfold, because there are only so many goods that any person can buy. Underweight personal goods versus consumer services. Bond yields have the scope to rise by just 50-100 bps before pulling the bottom out of the $300 trillion global real estate market and the $100 trillion global equity market. Long-term investors should continue to own US T-bonds and focus their equity investments in long-duration (growth) stocks, sectors, and stock markets… …because the ultimate low in bond yields is yet to come. Feature Chart of the WeekWill Bond Yields Stay Chilled With Inflation So Hot?
Will Bond Yields Stay Chilled With Inflation So Hot?
Will Bond Yields Stay Chilled With Inflation So Hot?
2022 begins with an investment conundrum. Why have long bond yields been so chilled when inflation is running so hot? (Chart I-1) While US and UK inflation have ripped to 6.9 percent and 5.1 percent respectively, the 30-year T-bond yield and 30-year gilt yield remain a relative oasis of calm – standing at 2.1 percent and 1.2 percent respectively. 10-year yields have also stayed relatively calm. Moreover, as long-duration bonds set the valuations of long-duration stocks, a calm bond market has meant a calm stock market. What can explain this apparent conundrum of chilled yields in the face of the hottest inflation in a generation? Long Bond Yields Are Tracking Demand, Not Inflation Chart I-2 answers the conundrum. The long bond yield is taking its cue not from hot inflation, but from economic demand, which is far from overheating. Quite the contrary, US real GDP and consumption are struggling to reach their pre-pandemic trends. Meanwhile, UK real GDP languishes 5 percent below its pre-pandemic trend (Chart I-3), and other major economies tell similar stories. Chart I-2Long Bond Yields Are Tracking Demand
Long Bond Yields Are Tracking Demand
Long Bond Yields Are Tracking Demand
Chart I-3Demand Is Lukewarm, At Best
Demand Is Lukewarm, At Best
Demand Is Lukewarm, At Best
Some people mistake the strong economic growth in recent quarters for overheating demand. In fact, this robust growth is just the natural snap-back after the pandemic induced collapse in early-2020. Meaning that the strong growth is unsustainable, just as the bounce that a ball experiences after a big drop is unsustainable. Demand in the major economies remains well below its pre-pandemic trend. To repeat, demand in the major economies remains well below its pre-pandemic trend. As this pre-pandemic trend is a good gauge of potential output, economic demand is lukewarm, at best. And this explains why long bond yields have remained chilled. Inflation Is Tracking The Displacement Of Demand Yet solving the first conundrum simply raises a second conundrum. If overall demand is lukewarm, then why is inflation so hot? (Chart I-4). The answer is that inflation is being fuelled by the displacement of demand into goods from services (Chart I-5). Chart I-4Hot Inflation Is Not Reflecting Lukewarm Overall Demand
Hot Inflation Is Not Reflecting Lukewarm Overall Demand
Hot Inflation Is Not Reflecting Lukewarm Overall Demand
Chart I-5Hot Inflation Is Reflecting The Hot Demand For Goods
Hot Inflation Is Reflecting The Hot Demand For Goods
Hot Inflation Is Reflecting The Hot Demand For Goods
If a dollar spent on goods is displaced from a dollar spent on services, then overall demand will be unchanged. However, what happens to the overall price level depends on the relative price elasticities of demand for goods and services. If the price elasticities are the same, then overall prices will also be unchanged, because a higher price for goods will be exactly countered by a lower price for services. But if the price elasticities are very different, then overall prices can rise sharply because the higher price for goods will dominate overall inflation. All of which solves our second conundrum. Spending on services that require close contact with strangers – using public transport, going to the dentist, cinema, or recreational activities that involve crowds – are suffering severe shortfalls compared to pre-pandemic times. Some people say that this is due to supply shortages, yet the trains and buses are running empty and there is no shortage of dentists, cinema seats, or even (English) Premier League tickets. Indeed, the Premier League team that I support (which I will not name) has been sending me begging emails to attend matches! Surging inflation is no longer a reliable reflection of overall demand. If somebody doesn’t use public transport, or go to the cinema or crowded events because he is worried about the health risk, then lowering the price will not lure that person back. In fact, the person might interpret the lower price as a signal of greater risk, and might become more averse. In other words, the price elasticity of demand for certain services has flipped from its usual negative to zero, or even positive. This creates a major problem for central banks, because if the price elasticity of services demand has changed, then surging inflation is no longer a reliable reflection of overall demand, which remains below its potential. Instead, surging inflation is largely reflecting the surging demand for goods. Two Ways That Inflation Can Resolve: One Good, One Bad It follows that if the spending on goods cools, then inflation will also cool. We expect this ‘good’ resolution of inflation to unfold, because there are only so many goods that any person can buy. Durables, by their very definition, last a long time. Even clothes and shoes, though classified as nondurables, are in fact quite durable. Meaning that are only so many cars, iPhone 13s, gadgets, clothes and shoes that any person can own before reaching saturation. We recommend that equity investors play this inevitable normalisation by underweighting personal goods versus consumer services. Still, the resolution of inflation could also take a ‘bad’ form. If inflation persisted, then bond yields could lose their chill as they flipped their focus from lukewarm demand to hot inflation. Given that long-duration bonds set the valuations of long-duration stocks, and given that stock valuations are already stretched versus bonds, this would quickly inflict pain on stock investors (Chart I-6). Chart I-6The US Stock Market = The 30-Year T-Bond Price Multiplied By Profits
The US Stock Market = The 30-Year T-Bond Price Multiplied By Profits
The US Stock Market = The 30-Year T-Bond Price Multiplied By Profits
More significantly, it would also quickly inflict pain on the all-important real estate market. Through the past ten years, world prime residential prices are up by 70 percent while rents are up by just 25 percent1 (Chart I-7). Meaning that the bulk of the increase in global real estate prices is due to skyrocketing valuations. The culprit is the structural collapse in global bond yields (Chart I-8). Chart I-7The Bulk Of The Increase In Global Real Estate Prices Is Due To Valuation Expansion…
The Bulk Of The Increase In Global Real Estate Prices Is Due To Valuation Expansion...
The Bulk Of The Increase In Global Real Estate Prices Is Due To Valuation Expansion...
Chart I-8…And The Culprit For The Richest Ever Valuation Of Global Real Estate Is The Structural Collapse In Global Bond Yields
...And The Culprit For The Richest Ever Valuation Of Global Real Estate Is The Structural Collapse In Global Bond Yields
...And The Culprit For The Richest Ever Valuation Of Global Real Estate Is The Structural Collapse In Global Bond Yields
This means that bond yields have the scope to rise by just 50-100 bps before pulling the bottom out of the $300 trillion global real estate market. Given that this dwarfs the $90 trillion global economy, the massive deflationary backlash would annihilate any lingering inflation. Some people counter that in an inflationary shock, stocks and property – as the ultimate real assets – ought to perform well even as bond yields rise. However, when valuations start off stretched as now, the initial intense headwind from deflating valuations would obliterate the tailwind from inflating incomes. The scope for higher bond yields is limited by the fragility of stock market and real estate valuations. With the scope for higher yields limited by the fragility of stock market and real estate valuations, and with the ultimate low in yields yet to come, long-term investors should continue to own US T-bonds. And they should focus their equity investments in long-duration (growth) stocks, sectors, and stock markets. Fractal Trading Update Owing to the holidays, we are waiting until next week to initiate new trades. We will also add a new feature – a ‘watch list’ of investments that are approaching potential turning points, but are not yet at peak fragility. We believe that this enhancement will help to prepare future trades. Stay tuned. Dhaval Joshi Chief Strategist dhaval@bcaresearch.com Footnotes 1 Based on Savills Prime Index: World Cities – Capital Values, and World Cities – Rents and Yields, June 2011 through June 2021. Fractal Trading System Fractal Trades
Image
6-Month Recommendations Structural Recommendations Closed Fractal Trades Indicators To Watch - Bond Yields Chart II-1Indicators To Watch - Bond Yields - ##br##Euro Area
Indicators To Watch - Bond Yields - Euro Area
Indicators To Watch - Bond Yields - Euro Area
Chart II-2Indicators To Watch - Bond Yields - Europe Ex Euro Area
Indicators To Watch - Bond Yields - Europe Ex Euro Area
Indicators To Watch - Bond Yields - Europe Ex Euro Area
Chart II-3Indicators To Watch - Bond Yields - ##br##Asia
Indicators To Watch - Bond Yields - Asia
Indicators To Watch - Bond Yields - Asia
Chart II-4Indicators To Watch - Bond Yields - Other Developed
Indicators To Watch - Bond Yields - Other Developed
Indicators To Watch - Bond Yields - Other Developed
Indicators To Watch - Interest Rate Expectations Chart II-5Indicators To Watch - Interest Rate Expectations
Indicators To Watch - Interest Rate Expectations
Indicators To Watch - Interest Rate Expectations
Chart II-6Indicators To Watch - Interest Rate Expectations
Indicators To Watch - Interest Rate Expectations
Indicators To Watch - Interest Rate Expectations
Chart II-7Indicators To Watch - Interest Rate Expectations
Indicators To Watch - Interest Rate Expectations
Indicators To Watch - Interest Rate Expectations
Chart II-8Indicators To Watch - Interest Rate Expectations
Indicators To Watch - Interest Rate Expectations
Indicators To Watch - Interest Rate Expectations
Highlights Long-only investors with a minimum horizon of two years should buy the interactive entertainment sector. Hedge fund investors with a minimum horizon of two years should go long interactive entertainment versus technology. Despite a trebling of sales since 2014, interactive entertainment comprises just 0.2 percent of world GDP, and just 0.3 percent of US consumer spending, providing scope for substantial further growth. Looking ahead, we identify four specific drivers of growth: cloud gaming, e-sports, 5G, and ‘gaming as a service’. After this year’s sell-off, the sector’s relative valuation has fallen below its long-term average. Even more striking, the sector now trades at a record 20 percent discount to the tech sector. Yet we think we can do better than the sector index and reveal our preferred basket of interactive entertainment stocks. Feature In the future, a typical day will be divided into three. A third we will spend sleeping and dreaming; a third we will spend in reality; and a third we will spend in virtual reality. Parents of teenagers may already recognise this pattern, and will certainly do so over the coming holiday season! But many people in their twenties and thirties are also spending more of their time in the virtual world entered through the portal of interactive entertainment (meaning video gaming, and we will use these terms interchangeably throughout this report). Since 2014, interactive entertainment has experienced explosive growth. Since 2014, interactive entertainment has experienced explosive growth. Sales have trebled, outperforming even the tech sector whose sales have doubled, and far outperforming the total stock market’s sales (and global GDP) which are up a sedate 30 percent (Chart I-1 and Chart I-2). Yet despite this explosive growth, interactive entertainment comprises just 0.2 percent of world GDP, and just 0.3 percent of US consumer spending, providing scope for substantial further growth (Chart I-3 and Chart I-4). Chart I-1Since 2014, Interactive Entertainment’s Sales Have Almost Trebled…
Since 2014, Interactive Entertainment's Sales Have Trebled...
Since 2014, Interactive Entertainment's Sales Have Trebled...
Chart I-2…And Its Profits Have More Than ##br##Trebled
...And Its Profits Have Quadrupled
...And Its Profits Have Quadrupled
Chart I-3
Chart I-4…And 0.3 Percent Of US Consumer Spending
...And 0.3 Percent Of US Consumer Spending
...And 0.3 Percent Of US Consumer Spending
Meanwhile, the interactive entertainment sector’s profit margin has also trended higher, to 14 percent. This compares with 16 percent for tech, and around 10 percent for the total stock market (Chart I-5). Chart I-5Interactive Entertainment’s Profit Margin Has Trended Higher
Interactive Entertainment's Profit Margin Has Trended Higher
Interactive Entertainment's Profit Margin Has Trended Higher
The combination of explosive sales growth and higher margins has resulted in spectacular profit growth. Interactive entertainment profits have skyrocketed by 250 percent, outperforming tech profits which are up 150 percent, and far outperforming total stock market profits which are up 50 percent. We expect this strong outperformance in profits to continue. Cloud Gaming, E-Sports, 5G, And ‘Gaming As A Service’ Will Drive Sales Growth Looking ahead, we identify four specific drivers of growth: cloud gaming, e-sports, 5G, and ‘gaming as a service’. Cloud gaming (gaming-on-demand) streams high quality interactive content that is running on remote servers, akin to how remote desktops work. Thereby, gamers can play using just a device and an internet connection. Cloud gaming displaces physical disks, powerful hardware, and the need to download games onto a platform – analogous to how the on-demand streaming of media and entertainment has displaced DVDs and cable TV. Cloud gaming benefits both content developers and players. Developers do not have to worry about piracy, illegal downloads or digital rights management. Players benefit from a high (and equal) server processing power, creating a level-playing field in games. Which brings us nicely to the second driver of growth: e-sports. E-sports refers to competitive video gaming, a sector which is experiencing massive growth. 175 colleges and universities have already become members of the National Association of Collegiate Esports (NACE), offering varsity e-sports programs, and recognizing student gamers through scholarship awards. E-sports are hugely popular not only for their competitive element but also for their opportunity for social engagement, albeit virtually. The third major driver of interactive entertainment profits is the widespread rollout of 5G cellular networks, which makes cloud gaming accessible to mobile devices, rather than just to consoles and PCs. Mobile gaming revenues have become the most powerful engine of growth. This is significant because revenues from mobile gaming have now overtaken the combined revenues from the console and PC platforms. As such, mobile gaming revenues have become the most powerful engine of growth (Chart I-6 and Chart I-7).
Chart I-6
Chart I-7
The fourth driver of profits is the ‘gaming as a service’ (GaaS) revenue model, which is analogous to the software industry’s standard ‘software as a service’ (SaaS) revenue model. Instead of a one-time sale, revenue comes from a continuous stream of in-game sales and subscriptions. For example, Activision Blizzard’s doubling of revenues since 2014 has come mostly from in-game subscriptions. Product sales now comprise less than 30 percent of total revenues (Chart I-8).
Chart I-8
As well as being a major contributor to strong sales growth, GaaS boosts profit margins by lengthening the sales derived from the fixed costs of developing a given game. But Isn’t Video Gaming An Unhealthy Addiction? In 2018, the World Health Organization recognized 'gaming disorder' as an addictive behaviour and has officially defined it in the 11th Revision of the International Classification of Diseases (ICD-11). Then in August this year, the Chinese government imposed harsh restrictions on video gaming for minors. Under-18s can play video games for a maximum of three hours a week, one hour each on Friday, Saturday, and Sunday. These developments beg the question, is the interactive entertainment sector exposed to significant regulatory risks? The crackdown and regulation of illicit activities should be welcomed, not feared. China’s crackdown on video gaming for minors is consistent with its other crackdowns – for example, on cryptocurrencies – that decree that ‘the Chinese government knows what’s best for its people.’ However, libertarian western economies are unlikely to follow suit. In any case, even the World Health Organization concedes that gaming disorder affects only a small proportion of people. Another regulatory issue is so-called ‘gamblification’. Popularly known as loot boxes, or mystery boxes, the contents of some in-game virtual goods are unknown to gamers who purchase them in the hopes of attaining rare items that boast high in-game utility. The features resemble gambling and raise concerns of predatory monetization. Calls for regulatory action refer to gamblification as a contributing cause to gaming disorder. Still, such features are not significant enough in most games to change the structural outlook. A final putative concern is that in-game tradable virtual currencies create a haven for cyber criminals and money launderers. The solution could be know-your-customer (KYC) and anti-money laundering (AML) regulations akin to those in the online gambling/betting industry. Ultimately, just as in the cryptocurrency space, and indeed the internet space, the crackdown and regulation of illicit activities should be welcomed, not feared. As such, it strengthens rather than weakens the structural outlook. The Investment Case This year’s sell-off in the interactive entertainment sector provides a good entry point for long-term investors (Chart I-9). The sell-off was exacerbated by two bits of bad news: first, the revelation of a toxic and sexist workplace culture at Activision Blizzard – since when the company has suffered a wave of bad publicity, numerous resignations, and a 40 percent plunge in its stock price; then, the Chinese crackdown on video gaming for minors. Chart I-9Interactive Entertainment’s Recent Sell-Off Provides A Good Long-Term Entry Point
Interactive Entertainment's Recent Sell-Off Provides A Good Long-Term Entry Point
Interactive Entertainment's Recent Sell-Off Provides A Good Long-Term Entry Point
Both items of bad news seem well discounted. The sector’s relative valuation to the market has fallen below its long-term average. Even more striking, the sector now trades at a record 20 percent discount to the tech sector (Chart I-10 and Chart I-11). Chart I-10Interactive Entertainment Now Trades At A 20 Percent Discount To Technology…
Interactive Entertainment Now Trades At A 20 Percent Discount To Technology...
Interactive Entertainment Now Trades At A 20 Percent Discount To Technology...
Chart I-11…And Its Relative Valuation To The Market Is Below The Long-Term Average
...And Its Relative Valuation To The Market Is Below The Long-Term Average
...And Its Relative Valuation To The Market Is Below The Long-Term Average
Given that the structural outlook for the sector’s sales and profits remains intact, long-only investors with a minimum horizon of two years should buy the interactive entertainment sector (Table I-1). Hedge fund investors with a minimum horizon of two years should go long interactive entertainment versus technology.
Chart I-
Yet we think we can do better than the sector index by filtering out the riskiest stocks, based on overvaluation, commercial risk, and regulatory risk. For example, we exclude the Chinese stocks that are most exposed to the Chinese government crackdown and future whims. Long-only investors with a minimum horizon of two years should buy the interactive entertainment sector. On this basis, our interactive entertainment basket comprises: (Table I-2).
Chart I-
Nintendo Activision Blizzard Electronic Arts Zynga Konami Capcom Square Enix This is the final Counterpoint report of the year. We wish you all a very happy and restful holiday season. Dhaval Joshi Chief Strategist dhaval@bcaresearch.com Mohamed El Shennawy Research Associate mohamede@bcaresearch.com
Highlights Our three strategic themes over the long run: (1) great power rivalry (2) hypo-globalization (3) populism and nationalism. The implications are inflationary over the long run. Nations that gear up for potential conflict and expand the social safety net to appease popular discontent will consume a lot of resources. Our three key views for 2022: (1) China’s reversion to autocracy (2) America’s policy insularity (3) petro-state leverage. The implications are mostly but not entirely inflationary: China will ease policy, the US will pass more stimulus, and energy supply may suffer major disruptions. Stay long gold, neutral US dollar, short renminbi, and short Taiwanese dollar. Stay tactically long global large caps and defensives. Buy aerospace/defense and cyber-security stocks. Go long Japanese and Mexican equities – both are tied to the US in an era of great power rivalry. Feature Chart 1US Resilience
US Resilience
US Resilience
Global investors have not yet found a substitute for the United States. Despite a bout of exuberance around cyclical non-US assets at the beginning of 2021, the year draws to a close with King Dollar rallying, US equities rising to 61% of global equity capitalization, and the US 30-year Treasury yield unfazed by inflation fears (Chart 1). American outperformance is only partly explained by its handling of the lingering Covid-19 pandemic. The US population was clearly less restricted by the virus (Chart 2). But more to the point, the US stimulated its economy by 25% of GDP over the course of the crisis, while the average across major countries was 13% of GDP. Americans are still more eager to go outdoors and the government has been less stringent in preventing them (Chart 3).
Chart 2
Chart 3Social Restrictions Short Of Lockdown
Social Restrictions Short Of Lockdown
Social Restrictions Short Of Lockdown
Going forward, the pandemic should decline in relevance, though it is still possible that a vaccine-resistant mutation will arise that is deadlier for younger people, causing a new round of the crisis. The rotation into assets outside the US will be cautious. Across the world, monetary and credit growth peaked and rolled over this year, after the extraordinary effusion of stimulus to offset the social lockdowns of 2020 (Chart 4). Government budget deficits started to normalize while central banks began winding down emergency lending and bond-buying. More widespread and significant policy normalization will get under way in 2022 in the face of high core inflation. Tightening will favor the US dollar, especially if global growth disappoints expectations. Chart 4Waning Monetary And Credit Stimulus
Waning Monetary And Credit Stimulus
Waning Monetary And Credit Stimulus
Chart 5Global Growth Stabilization
Global Growth Stabilization
Global Growth Stabilization
Global manufacturing activity fell off its peak, especially in China, where authorities tightened monetary, fiscal, and regulatory policy aggressively to prevent asset bubbles from blowing up (Chart 5). Now China is easing policy on the margin, which should shore up activity ahead of an important Communist Party reshuffle in fall 2022. The rest of the world’s manufacturing activity is expected to continue expanding in 2022, albeit less rapidly. This trend cuts against US outperformance but still faces a range of hurdles, beginning with China. In this context, we outline three geopolitical themes for the long run as well as three key views for the coming 12 months. Our title, “The Gathering Storm,” refers to the strategic challenge that China and Russia pose to the United States, which is attempting to form a balance-of-power coalition to contain these autocratic rivals. This is the central global geopolitical dynamic in 2022 and it is ultimately inflationary. Three Strategic Themes For The Long Run The international system will remain unstable in the coming years. Global multipolarity – or the existence of multiple, competing poles of political power – is the chief destabilizing factor. This is the first of our three strategic themes that will persist next year and beyond (Table 1). Our key views for 2022, discussed below, flow from these three strategic themes. Table 1Strategic Themes For 2022 And Beyond
2022 Key Views: The Gathering Storm
2022 Key Views: The Gathering Storm
1. Great Power Rivalry Multipolarity – or great power rivalry – can be illustrated by the falling share of US economic clout relative to the rest of the world, including but not limited to strategic rivals like China. The US’s decline is often exaggerated but the picture is clear if one looks at the combined geopolitical influence of the US and its closest allies to that of the EU, China, and Russia (Chart 6).
Chart 6
China’s rise is the most destabilizing factor because it comes with economic, military, and technological prowess that could someday rival the US for global supremacy. China’s GDP has surpassed that of the US in purchasing power terms and will do so in nominal terms in around five years (Chart 7).
Chart 7
True, China’s potential growth is slowing and Chinese financial instability will be a recurring theme. But that very fact is driving Beijing to try to convert the past 40 years of economic success into broader strategic security. Chart 8America's Global Role Persists (If Lessened)
America's Global Role Persists (If Lessened)
America's Global Role Persists (If Lessened)
Since China is capable of creating an alternative political order in Asia Pacific, and ultimately globally, the United States is reacting. It is penalizing China’s economy and seeking to refurbish alliances in pursuit of a containment policy. The American reaction to the loss of influence has been unpredictable, contradictory, and occasionally belligerent. New isolationist impulses have emerged among an angry populace in reaction to gratuitous wars abroad and de-industrialization. These impulses appeared in both the Obama and Trump administrations. The Biden administration is attempting to manage these impulses while also reinforcing America’s global role. The pandemic-era stimulus has enabled the US to maintain its massive trade deficit and aggressive defense spending. But US defense spending is declining relative to the US and global economy over time, encouraging rival nations to carve out spheres of influence in their own neighborhoods (Chart 8). Russia’s overall geopolitical power has declined but it punches above its weight in military affairs and energy markets, a fact which is vividly on display in Ukraine as we go to press. The result is to exacerbate differences in the trans-Atlantic alliance between the US and the European Union, particularly Germany. The EU’s attempt to act as an independent great power is another sign of multipolarity, as well as the UK’s decision to distance itself from the continent and strengthen the Anglo-American alliance. If the US and EU do not manage their differences over how to handle Russia, China, and Iran then the trans-Atlantic relationship will weaken and great power rivalry will become even more dangerous. 2. Hypo-Globalization The second strategic theme is hypo-globalization, in which the ancient process of globalization continues but falls short of its twenty-first century potential, given advances in technology and governance that should erode geographic and national boundaries. Hypo-globalization is the opposite of the “hyper-globalization” of the 1990s-2000s, when historic barriers to the free movement of people, goods, and capital seemed to collapse overnight. Chart 9From 'Hyper-Globalization' To Hypo-Globalization
From 'Hyper-Globalization' To Hypo-Globalization
From 'Hyper-Globalization' To Hypo-Globalization
The volume of global trade relative to industrial production peaked with the Great Recession in 2008-10 and has declined slowly but surely ever since (Chart 9). Many developed markets suffered the unwinding of private debt bubbles, while emerging economies suffered the unwinding of trade manufacturing. Periods of declining trade intensity – trade relative to global growth – suggest that nations are turning inward, distrustful of interdependency, and that the frictions and costs of trade are rising due to protectionism and mercantilism. Over the past two hundred years globalization intensified when a broad international peace was agreed (such as in 1815) and a leading imperial nation was capable of enforcing law and order on the seas (such as the British empire). Globalization fell back during times of “hegemonic instability,” when the peace settlement decayed while strategic and naval competition eroded the global trading system. Today a similar process is unfolding, with the 1945 peace decaying and the US facing the revival of Russia and China as regional empires capable of denying others access to their coastlines and strategic approaches (Chart 10).1 Chart 10Hypo-Globalization And Hegemonic Instability
Hypo-Globalization And Hegemonic Instability
Hypo-Globalization And Hegemonic Instability
Chart 11Hypo-Globalization: Temporary Trade Rebound
Hypo-Globalization: Temporary Trade Rebound
Hypo-Globalization: Temporary Trade Rebound
No doubt global trade is rebounding amid the stimulus-fueled recovery from Covid-19. But the upside for globalization will be limited by the negative geopolitical environment (Chart 11). Today governments are not behaving as if they will embark on a new era of ever-freer movement and ever-deepening international linkages. They are increasingly fearful of each other’s strategic intentions and using fiscal resources to increase economic self-sufficiency. The result is regionalization rather than globalization. Chinese and Russian attempts to revise the world order, and the US’s attempt to contain them, encourages regionalization. For example, the trade war between the US and China is morphing into a broader competition that limits cooperation to a few select areas, despite a change of administration in the United States. The further consolidation of President Xi Jinping’s strongman rule will exacerbate this dynamic of distrust and economic divorce. Emerging Asia and emerging Europe live on the fault lines of this shift from globalization to regionalism, with various risks and opportunities. Generally we are bullish EM Asia and bearish EM Europe. 3. Populism And Nationalism A third strategic theme consists of populism and nationalism, or anti-establishment political sentiment in general. These forces will flare up in various forms across the world in 2022 and beyond. Even as unemployment declines, the rise in food and fuel inflation will make it difficult for low wage earners to make ends meet. The “misery index,” which combines unemployment and inflation, spiked during the pandemic and today stands at 10.8% in the US and 11.4% in the EMU, up from 5.2% and 8.1% before the pandemic, respectively (Chart 12). Large budget deficits and trade deficits, especially in the US and UK, feed into this inflationary environment. Most of the major developed markets have elected new governments since the pandemic, with the notable exception of France and Spain. Thus they have recapitalized their political systems and allowed voters to vent some frustration. These governments now have some time to try to mitigate inflation before the next election. Hence policy continuity is not immediately in jeopardy, which reduces uncertainty for investors. By contrast, many of the emerging economies face higher inflation, weak growth, and are either coming upon elections or have undemocratic political systems. Either way the result will be a failure to address household grievances promptly. The misery index is trending upward and governments are continually forced to provide larger budget deficits to shore up growth, fanning inflation (Chart 13). Chart 12DM: Political Risk High But New Governments In Place
DM: Political Risk High But New Governments In Place
DM: Political Risk High But New Governments In Place
Chart 13EM: Political Risk High But Governments Not Recapitalized
EM: Political Risk High But Governments Not Recapitalized
EM: Political Risk High But Governments Not Recapitalized
Chart 14EM Populism/Nationalism Threatens Negative Surprises In 2022
EM Populism/Nationalism Threatens Negative Surprises In 2022
EM Populism/Nationalism Threatens Negative Surprises In 2022
Just as social and political unrest erupted after the Great Recession, notably in the so-called “Arab Spring,” so will new movements destabilize various emerging markets in the wake of Covid-19. Regime instability and failure can lead to big changes in policies, large waves of emigration, wars, and other risks that impact markets. The risks are especially high unless and until Chinese imports revive. Investors should be on the lookout for buying opportunities in emerging markets once the bad news is fully priced. National and local elections in Brazil, India, South Korea, the Philippines, and Turkey will serve as market catalysts, with bad news likely to precede good news (Chart 14). Bottom Line: These three themes – great power rivalry, hypo-globalization, and populism/nationalism – are inflationary in theory, though their impact will vary based on specific events. Multipolarity means that governments will boost industrial and defense spending to gear up for international competition. Hypo-globalization means countries will attempt to put growth on a more reliable domestic foundation rather than accept dependency on an unreliable international scene, thus constraining supplies from abroad. Populism and nationalism will lead to a range of unorthodox policies, such as belligerence abroad or extravagant social spending at home. Of course, the inflationary bias of these themes can be upset if they manifest in ways that harm growth and/or inflation expectations, which is possible. But the general drift will be an inflationary policy setting. Inflation may subside in 2022 only to reemerge as a risk later. Three Key Views For 2022 Within this broader context, our three key views for 2022 are as follows: 1. China’s Reversion To Autocracy As President Xi Jinping leads China further down the road of strongman rule and centralization, the country faces a historic confluence of internal and external risks. This was our top view in 2021 and the same dynamic continues in 2022. The difference is that in 2021 the risk was excessive policy tightening whereas this coming year the risk is insufficient policy easing. Chart 15China Eases Fiscal Policy To Secure Recovery In 2022
China Eases Fiscal Policy To Secure Recovery In 2022
China Eases Fiscal Policy To Secure Recovery In 2022
China’s economy is witnessing a secular slowdown, a deterioration in governance, property market turmoil, and a rise in protectionism abroad. The long decline in corporate debt growth points to the structural slowdown. Animal spirits will not improve in 2022 so government spending will be necessary to try to shore up overall growth. The Politburo signaled that it will ease fiscal policy at the Central Economic Work Conference in early December, a vindication of our 2021 view. Neither the combined fiscal-and-credit impulse nor overall activity, indicated by the Li Keqiang Index, have shown the slightest uptick yet (Chart 15). Typically it takes six-to-nine months for policy easing to translate to an improvement in real economic activity. The first half of the year may still bring economic disappointments. But policymakers are adjusting to avoid a crash. Policy will grow increasingly accommodative as necessary in the first half of 2022. The key political constraint is the Communist Party’s all-important political reshuffle, the twentieth national party congress, to be held in fall 2022 (usually October). While Xi may not want the economy to surge in 2022, he cannot afford to let it go bust. The experience of previous party congresses shows that there is often a policy-driven increase in bank loans and fixed investment. Current conditions are so negative as to ensure that the government will provide at least some support, for instance by taking a “moderately proactive approach” to infrastructure investment (Chart 16). Otherwise a collapse of confidence would weaken Xi’s faction and give the opposition faction a chance to shore up its position within the Communist Party. Chart 16China Aims For Stability, Not Rapid Growth, Ahead Of 20th National Party Congress
China Aims For Stability, Not Rapid Growth, Ahead Of 20th National Party Congress
China Aims For Stability, Not Rapid Growth, Ahead Of 20th National Party Congress
Party congresses happen every five years but the ten-year congresses, such as in 2022, are the most important for the country’s overall political leadership. The party congresses in 1992, 2002, and 2012 were instrumental in transferring power from one leader to the next, even though the transfer of power was never formalized. Back in 2017 Xi arranged to stay in power indefinitely but now he needs to clinch the deal, lest any unforeseen threat emerge from at home or abroad. Xi’s success in converting the Communist Party from “consensus rule” to his own “personal rule” will be measurable by his success in stacking the Politburo and Politburo Standing Committee with factional allies. He will also promote his faction across the Central Committee so as to shape the next generations of party leaders and leave his imprint on policy long after his departure. The government will be extremely sensitive to any hint of dissent or resistance and will move aggressively to quash it. Investors should not be surprised to see high-level sackings of public officials or private magnates and a steady stream of scandals and revelations that gain prominence in western media. The environment is also ripe for strange and unexpected incidents that reveal political differences beneath the veneer of unity in China: defections, protests, riots, terrorist acts, or foreign interference. Most incidents will be snuffed out quickly but investors should be wary of “black swans” from China in 2022. Chinese government policies will not be business friendly in 2022 aside from piecemeal fiscal easing. Everything Beijing does will be bent around securing Xi’s supremacy at all levels. Domestic politics will take precedence over economic concerns, especially over the interests of private businesses and foreign investors, as is clear when it comes to managing financial distress in the property sector. Negative regulatory surprises and arbitrary crackdowns on various industrial sectors will continue, though Beijing will do everything in its power to prevent the property bust from triggering contagion across the economic system. This will probably work, though the dam may burst after the party congress. Relations with the US and the West will remain poor, as the democracies cannot afford to endorse what they see as Xi’s power grab, the resurrection of a Maoist cult of personality, and the betrayal of past promises of cooperation and engagement. America’s midterm election politics will not be conducive to any broad thaw in US-China relations. While China will focus on domestic politics, its foreign policy actions will still prove relatively hawkish. Clashes with neighbors may be instigated by China to warn away any interference or by neighbors to try to embarrass Xi Jinping. The South and East China Seas are still ripe for territorial disputes to flare. Border conflicts with India are also possible. Taiwan remains the epicenter of global geopolitical risk. A fourth Taiwan Strait Crisis looms as China increases its military warnings to Taiwan not to attempt anything resembling independence (Chart 17A). China may use saber-rattling, economic sanctions, cyber war, disinformation, and other “gray zone” tactics to undermine the ruling party ahead of Taiwan’s midterm elections in November 2022 and presidential elections in January 2024. A full-scale invasion cannot be ruled out but is unlikely in the short run, as China still has non-military options to try to arrange a change of policy in Taiwan.
Chart 17
Chart 17BMarket-Based Risk Indicators Say China/Taiwan Risk Has Not Peaked
Market-Based Risk Indicators Say China/Taiwan Risk Has Not Peaked
Market-Based Risk Indicators Say China/Taiwan Risk Has Not Peaked
China has not yet responded to the US’s deployment of a small number of troops in Taiwan or to recent diplomatic overtures or arms sales. It could stage a major show of force against Taiwan to help consolidate power at home. China also has an interest in demonstrating to US allies and partners that their populations and economies will suffer if they side with Washington in any contingency. Given China’s historic confluence of risks, it is too soon for global investors to load up on cheap Chinese equities. Volatility will remain high. Weak animal spirits, limited policy easing, high levels of policy uncertainty, regulatory risk, ongoing trade tensions, and geopolitical risks suggest that investors should remain on the sidelines, and that a large risk premium can persist throughout 2022. Our market-based geopolitical risk indicators for both China and Taiwan are still trending upwards (Chart 17B). Global investors should capitalize on China’s policy easing indirectly by investing in commodities, cyclical equity sectors, and select emerging markets. 2. America’s Policy Insularity Our second view for 2022 centers on the United States, which will focus on domestic politics and will thus react or overreact to the many global challenges it faces. The US faces the first midterm election after the chaotic and contested 2020 presidential election. Political polarization remains at historically high levels, meaning that social unrest could flare up again and major domestic terrorist incidents cannot be ruled out. So far the Biden administration has focused on the domestic scene: mitigating the pandemic and rebooting the economy. Biden’s signature “Build Back Better” bill, $1.75 trillion investment in social programs, has passed the House of Representatives but not the Senate. The spike in inflation has shaken moderate Democratic senators who are now delaying the bill. We expect it to pass, since tax hikes were dropped, but our conviction is low (65% subjective odds), as a single defection would derail the bill. The implication would be inflationary since it would mark a sizable increase in government spending at a time when the output gap is already virtually closed. Spending would likely be much larger than the Congressional Budget Office estimate, shown in Chart 18, because the bill contains various gimmicks and hard-to-implement expiration clauses. Equity markets may not sell if the bill fails, since more fiscal stimulus would put pressure on the Federal Reserve to hike rates faster.
Chart 18
Chart 19
Whether the bill passes or fails, Biden’s legislative agenda will be frozen thereafter. He will have to resort to executive powers and foreign policy to lift his approval rating and court the median voter ahead of the midterm elections. Currently Democrats are lined up to lose the House and probably also the Senate, where a single seat would cost them their majority (Chart 19). The Senate is still in play so Biden will be averse to taking big risks. For the same reason, Biden’s foreign policy goal will be to stave off various bubbling crises. Restoring the Iranian nuclear deal was his priority but Russia has now forced its way to the top of the agenda by threatening a partial reinvasion of Ukraine. In this context Biden will not have room for maneuver with China. Congress will be hawkish on China ahead of the midterms, and Xi Jinping will be reviving autocracy, so Biden will not be able to improve relations much. Biden’s domestic policy could fuel inflation, while his domestic-focused foreign policy will embolden strategic rivals, which increases geopolitical risks. 3. Petro-State Leverage A surge in gasoline prices at the pump ahead of the election would be disastrous for a Democratic Party that is already in disarray over inflation (Chart 20). Biden has already demonstrated that he can coordinate an international release of strategic oil reserves this year. Oil and natural gas producers gain leverage when the global economy rebounds, commodity prices rise, and supply/demand balances tighten. The frequency of global conflicts, especially those involving petro-states, tend to rise and fall in line with oil prices (Chart 21). Chart 20Inflation Constrains Biden Ahead Of Midterms
Inflation Constrains Biden Ahead Of Midterms
Inflation Constrains Biden Ahead Of Midterms
Chart 21
Both Russia and Iran are vulnerable to social unrest at home and foreign strategic pressure abroad. Both have long-running conflicts with the US and West that are heating up for fundamental reasons, such as Russia’s fear of western influence in the former Soviet Union and Iran’s nuclear program. Both countries are demanding that the US make strategic concessions to atone for the Trump administration’s aggressive policies: selling lethal weapons to Ukraine and imposing “maximum pressure” sanctions on Iran. Biden is not capable of making credible long-term agreements since he could lose office as soon as 2025 and the next president could reverse whatever he agrees. But he must try to de-escalate these conflicts or else he faces energy shortages or price shocks, which would raise the odds of stagflation ahead of the election. The path of least resistance for Biden is to lift the sanctions on Iran to prevent an escalation of the secret war in the Middle East. If this unilateral concession should convince Iran to pause its nuclear activities before achieving breakout uranium enrichment capability, then Biden would reduce the odds of a military showdown erupting across the region. Opposition Republicans would accuse him of weakness but public opinion polls show that few Americans consider Iran a major threat. The problem is that this logic held throughout 2021 and yet Biden did not ease the sanctions. Given Iran’s nuclear progress and the US’s reliance on sanctions, we see a 40% chance of a military confrontation with Iran over the coming years. With regard to Ukraine, an American failure to give concessions to Russia will probably result in a partial reinvasion of Ukraine (50% subjective odds). This in turn will force the US and EU to impose sanctions on Russia, leading to a squeeze of natural gas prices in Europe and eventually price pressures in global energy markets. If Biden grants Russia’s main demands, he will avoid a larger war or energy shock but will make the US vulnerable to future blackmail. He will also demoralize Taiwan and other US partners who lack mutual defense treaties. But he may gain Russian cooperation on Iran. If Biden gives concessions to both Russia and Iran, his party will face criticism in the midterms but it will be far less vulnerable than if an energy shock occurs. This is the path of least resistance for Biden in 2022. It means that the petro-states may lose their leverage after using it, given that risk premiums would fall on Biden’s concessions. Of course, if energy shocks happen, Europe and China will suffer more than the US, which is relatively energy independent. For this reason Brussels and Beijing will try to keep diplomacy alive as long as possible. Enforcement of US sanctions on Iran may weaken, reducing Iran’s urgency to come into compliance. Germany may prevent a hardline threat of sanctions against Russia, reducing Russia’s fear of consequences. Again, petro-states have the leverage. Therefore investors should guard against geopolitically induced energy price spikes or shocks in 2022. What if other commodity producers, such as Saudi Arabia, crank up production and sink oil prices? This could happen. Yet the Saudis prefer elevated oil prices due to the host of national challenges they face in reforming their economy. If the US eases sanctions on Iran then the Saudis may make this decision. Thus downside energy price shocks are possible too. The takeaway is energy price volatility but for the most part we see the risk as lying to the upside. Investment Takeaways Traditional geopolitical risk, which focuses on war and conflict, is measurable and has slipped since 2015, although it has not broken down from the general uptrend since 2000. We expect the secular trend to be reaffirmed and for geopolitical risk to resume its rise due to the strategic themes and key views outlined above. The correlation of geopolitical risk with financial assets is debatable – namely because some geopolitical risks push up oil and commodity prices at the expense of the dollar, while others cause a safe-haven rally into the dollar (Chart 22). Global economic policy uncertainty is also measurable. It is in a secular uptrend since the 2008 financial crisis. Here the correlation with the US dollar and relative equity performance is stronger, which makes sense. This trend should also pick up going forward, which is at least not negative for the dollar and relative US equity performance (Chart 23). Chart 22Geopolitical Risk Will Rise, Market Impacts Variable
Geopolitical Risk Will Rise, Market Impacts Variable
Geopolitical Risk Will Rise, Market Impacts Variable
Chart 23Economic Policy Uncertainty Will Rise, Not Bad For US Assets
Economic Policy Uncertainty Will Rise, Not Bad For US Assets
Economic Policy Uncertainty Will Rise, Not Bad For US Assets
We are neutral on the US dollar versus the euro and recommend holding either versus the Chinese renminbi. We are short the currencies of emerging markets that suffer from great power rivalry, namely the Taiwanese dollar versus the US dollar, the Korean won versus the Japanese yen, the Russian ruble versus the Canadian dollar, and the Czech koruna versus the British pound. We remain long gold as a hedge against both geopolitical risk and inflation. We recommend staying long global equities. Tactically we prefer large caps and defensives. Within developed markets, we favor the UK and Japan. Japan in particular will benefit from Chinese policy easing yet remains more secure from China-centered geopolitical risks than emerging Asian economies. Within emerging markets, Mexico stands to benefit from US economic strength and divorce from China. We would buy Indian equities on weakness and sell Chinese and Russian equities on strength. We remain long aerospace and defense stocks and cyber-security stocks. -The GPS Team We Read (And Liked) … Conspiracy U: A Case Study “Crazy, worthless, stupid, made-up tales bring out the demons in susceptible, unthinking people.” Thus the author’s father, a Holocaust survivor translated from Yiddish, on conspiracy theories and the real danger they present in the world. Scott A. Shay, author and chairman of Signature Bank, whose first book was a finalist for the National Jewish Book Award, has written an intriguing new book on the topic and graciously sent it our way.2 Shay is a regular reader of BCA Research’s Geopolitical Strategy and an astute observer of international affairs. He is also a controversialist who has written essays for several of America’s most prominent newspapers. Shay’s latest, Conspiracy U, is a bracing read that we think investors will benefit from. We say this not because of its topical focus, which is too confined, but because of its broader commentary on history, epistemology, the US higher education system – and the very timely and relevant problem of conspiracy theories, which have become a prevalent concern in twenty-first century politics and society. The author and the particular angle of the book will be controversial to some readers but this very quality makes the book well-suited to the problem of the conspiracy theory, since it is not the controversial nature of conspiracy theories but their non-falsifiability that makes them specious. As the title suggests, the book is a polemical broadside. The polemic arises from Shay’s unique set of moral, intellectual, and sociopolitical commitments. This is true of all political books but this one wears its topicality on its sleeve. The term “conspiracy” in the title refers to antisemitic, anti-Israel, and anti-Zionist conspiracy theories, particularly the denial of the Holocaust, coming from tenured academics on both the right and the left wings of American politics. The “U” in the title refers to universities, namely American universities, with a particular focus on the author’s beloved alma mater, Northwestern University in Chicago, Illinois. Clearly the book is a “case study” – one could even say the prosecution of a direct and extended public criticism of Northwestern University – and the polemical perspective is grounded in Shay’s Jewish identity and personal beliefs. Equally clearly Shay makes a series of verifiable observations and arguments about conspiracy theories as a contemporary phenomenon and their presence, as well as the presence of other weak and lazy modes of thought, in “academia writ large.” This generalization of the problem is where most readers will find the value of the book. The book does not expect one to share Shay’s identity, to be a Zionist or support Zionism, or to agree with Israel’s national policies on any issue, least of all Israeli relations with Arabs and Palestinians. Shay’s approach is rigorous and clinical. He is a genuine intellectual in that he considers the gravest matters of concern from various viewpoints, including viewpoints radically different from his own, and relies on close readings of the evidence. In other words, Shay did not write the book merely to convince people that two tenured professors at Northwestern are promoting conspiracy theories. That kind of aberration is sadly to be expected and at least partially the result of the tenure system, which has advantages as well, not within the scope of the book. Rather Shay wrote it to provide a case study for how it is that conspiracy theories can manage to be adopted by those who do not realize what they are and to proliferate even in areas that should be the least hospitable – namely, public universities, which are supposed to be beacons of knowledge, science, openness, and critical thinking, but also other public institutions, including the fourth estate. Shay is meticulous with his sources and terminology. He draws on existing academic literature to set the parameters of his subject, defining conspiracy theories as “improbable hypotheses [or] intentional lies … about powerful and sinister groups conspiring to harm good people, often via a secret cabal.” The definition excludes “unwarranted criticism” and “unfair/prejudiced perspectives,” which are harmful but unavoidable. Many prejudices and false beliefs are “still falsifiable in the minds of their adherents,” which is not the case with conspiracy theories, although deep prejudices can obviously be helpful in spreading such theories. Conspiracy theories often depend on “a stunning amount of uniformity of belief and coordination of action without contingencies.” They also rely excessively on pathos, or emotion, in making their arguments, as opposed to logos (reason) and ethos (credibility, authority). Unfortunately there is no absolute, infallible distinction between conspiracy theories and other improbable theories – say, yet-to-be-confirmed theories about conspiracies that actually occurred. Conspiracy theories differ from other theories “in their relationship to facts, evidence, and logic,” which may sound obvious but is very much to the point. Again, “the key difference is the evidence and how it is evaluated.” There is no ready way to refute the fabrications, myths, and political propaganda that people believe without taking the time to assess the claims and their foundations. This requires an open mind and a grim determination to get to the bottom of rival claims about events even when they are extremely morally or politically sensitive, as is often the case with wars, political conflicts, atrocities, and genocides: Reliable historians, journalists, lawyers, and citizens must first approach the question of the cause or the identity of perpetrators and victims of an event or process with an open mind, not prejudiced to either party, and then evaluate the evidence. The diagnosis may be easy but the treatment is not – it takes time, study, and debate, and one’s interlocutors must be willing to be convinced. This problem of convincing others is critical because it is the part that is so often left out of modern political discourse. Conspiracy theories are often hateful and militant, so there is a powerful urge to censor or repress them. Openly debating with conspiracy theorists runs the risk of legitimizing or appearing to legitimize their views, providing them with a public forum, which seems to grant ethos or authority to arguments that are otherwise conspicuously lacking in it. In some countries censorship is legal, almost everywhere when violence is incited. The problem is that the act of suppression can feed the same conspiracy theories, so there is a need, in the appropriate context, to engage with and refute lies and specious arguments. Clients frequently email us to ask our view of the rise of conspiracy theories and what they entail for the global policy backdrop. We associate them with the broader breakdown in authority and decline of public trust in institutions. Shay’s book is an intervention into this topic that clients will find informative and thought-provoking, even if they disagree with the author’s staunchly pro-Israel viewpoint. It is precisely Shay’s ability to discuss and debate extremely contentious matters in a lucid and empirical manner – antisemitism, the history of Zionism, Holocaust denialism, Arab-Israeli relations, the Rwandan genocide, QAnon, the George Floyd protests, various other controversies – that enables him to defend a controversial position he holds passionately, while also demonstrating that passion alone can produce the most false and malicious arguments. As is often the case, the best parts of the book are the most personal – when Shay tells about his father’s sufferings during the Holocaust, and journey from the German concentration camps to New York City, and about Shay’s own experiences scraping enough money together to go to college at Northwestern. These sequences explain why the author felt moved to stage a public intervention against fringe ideological currents, which he shows to have gained more prominence in the university system than one might think. The book is timely, as American voters are increasingly concerned about the handling of identity, inter-group relations, history, education, and ideology in the classroom, resulting in what looks likely to become a new and ugly episode of the culture and education wars. Let us hope that Shay’s standards of intellectual freedom and moral decency prevail. Matt Gertken, PhD Vice President Geopolitical Strategy mattg@bcaresearch.com Footnotes 1 The downshift in globalization today is even worse than it appears in Chart 10 because several countries have not yet produced the necessary post-pandemic data, artificially reducing the denominator and making the post-pandemic trade rebound appear more prominent than it is in reality. 2 Scott A. Shay, Conspiracy U: A Case Study (New York: Post Hill Press, 2021), 279 pages. Strategic Themes Open Tactical Positions (0-6 Months) Open Cyclical Recommendations (6-18 Months) Appendix: GeoRisk Indicator China
China: GeoRisk Indicator
China: GeoRisk Indicator
Russia
Russia: GeoRisk Indicator
Russia: GeoRisk Indicator
United Kingdom
UK: GeoRisk Indicator
UK: GeoRisk Indicator
Germany
Germany: GeoRisk Indicator
Germany: GeoRisk Indicator
France
France: GeoRisk Indicator
France: GeoRisk Indicator
Italy
Italy: GeoRisk Indicator
Italy: GeoRisk Indicator
Canada
Canada: GeoRisk Indicator
Canada: GeoRisk Indicator
Spain
Spain: GeoRisk Indicator
Spain: GeoRisk Indicator
Taiwan
Taiwan Territory: GeoRisk Indicator
Taiwan Territory: GeoRisk Indicator
Korea
Korea: GeoRisk Indicator
Korea: GeoRisk Indicator
Turkey
Turkey: GeoRisk Indicator
Turkey: GeoRisk Indicator
Brazil
Brazil: GeoRisk Indicator
Brazil: GeoRisk Indicator
Australia
Australia: GeoRisk Indicator
Australia: GeoRisk Indicator
South Africa
South Africa: GeoRisk Indicator
South Africa: GeoRisk Indicator
Section III: Geopolitical Calendar
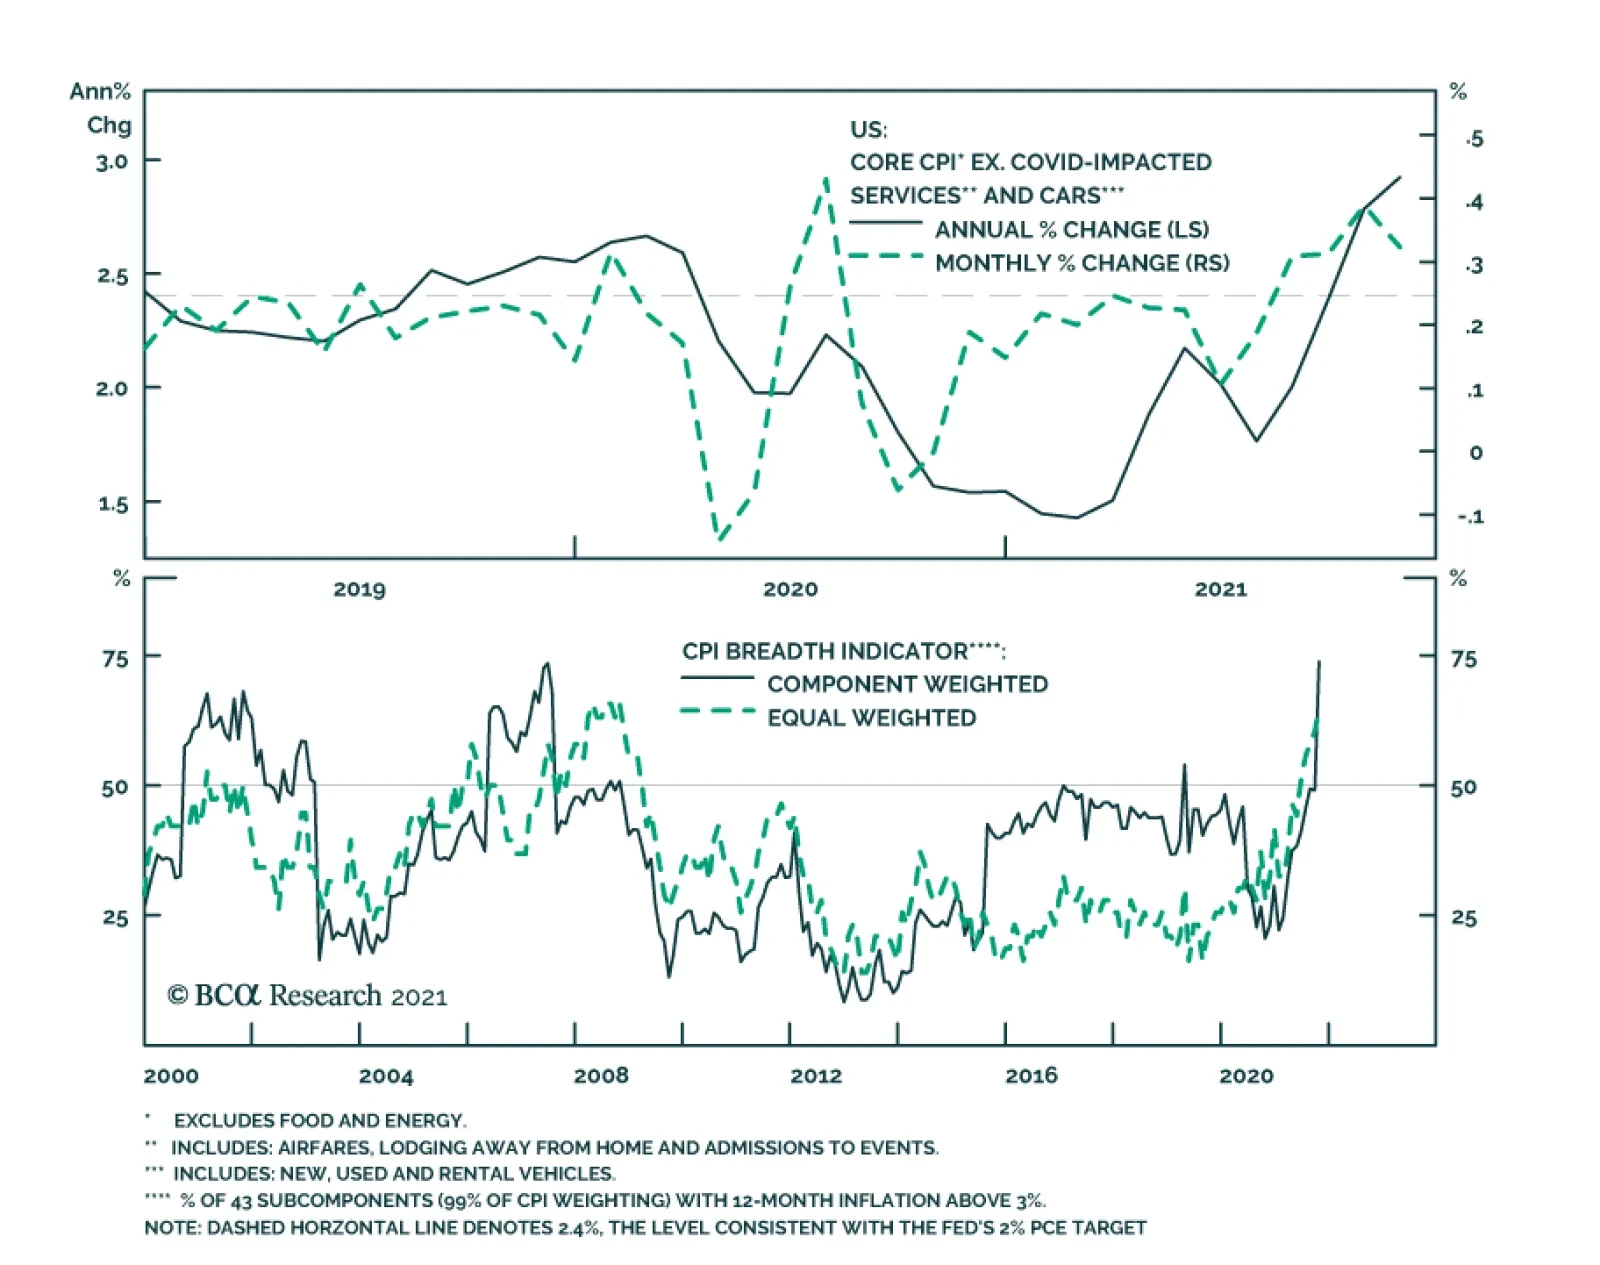
As expected, US CPI inflation accelerated in November, reaching a 39-year high of 6.8% y/y. Similarly, core inflation rose to a 30-year high of 4.9%. While the low base effect is likely to keep year-on-year growth rates elevated in Q1, the month-on-month…
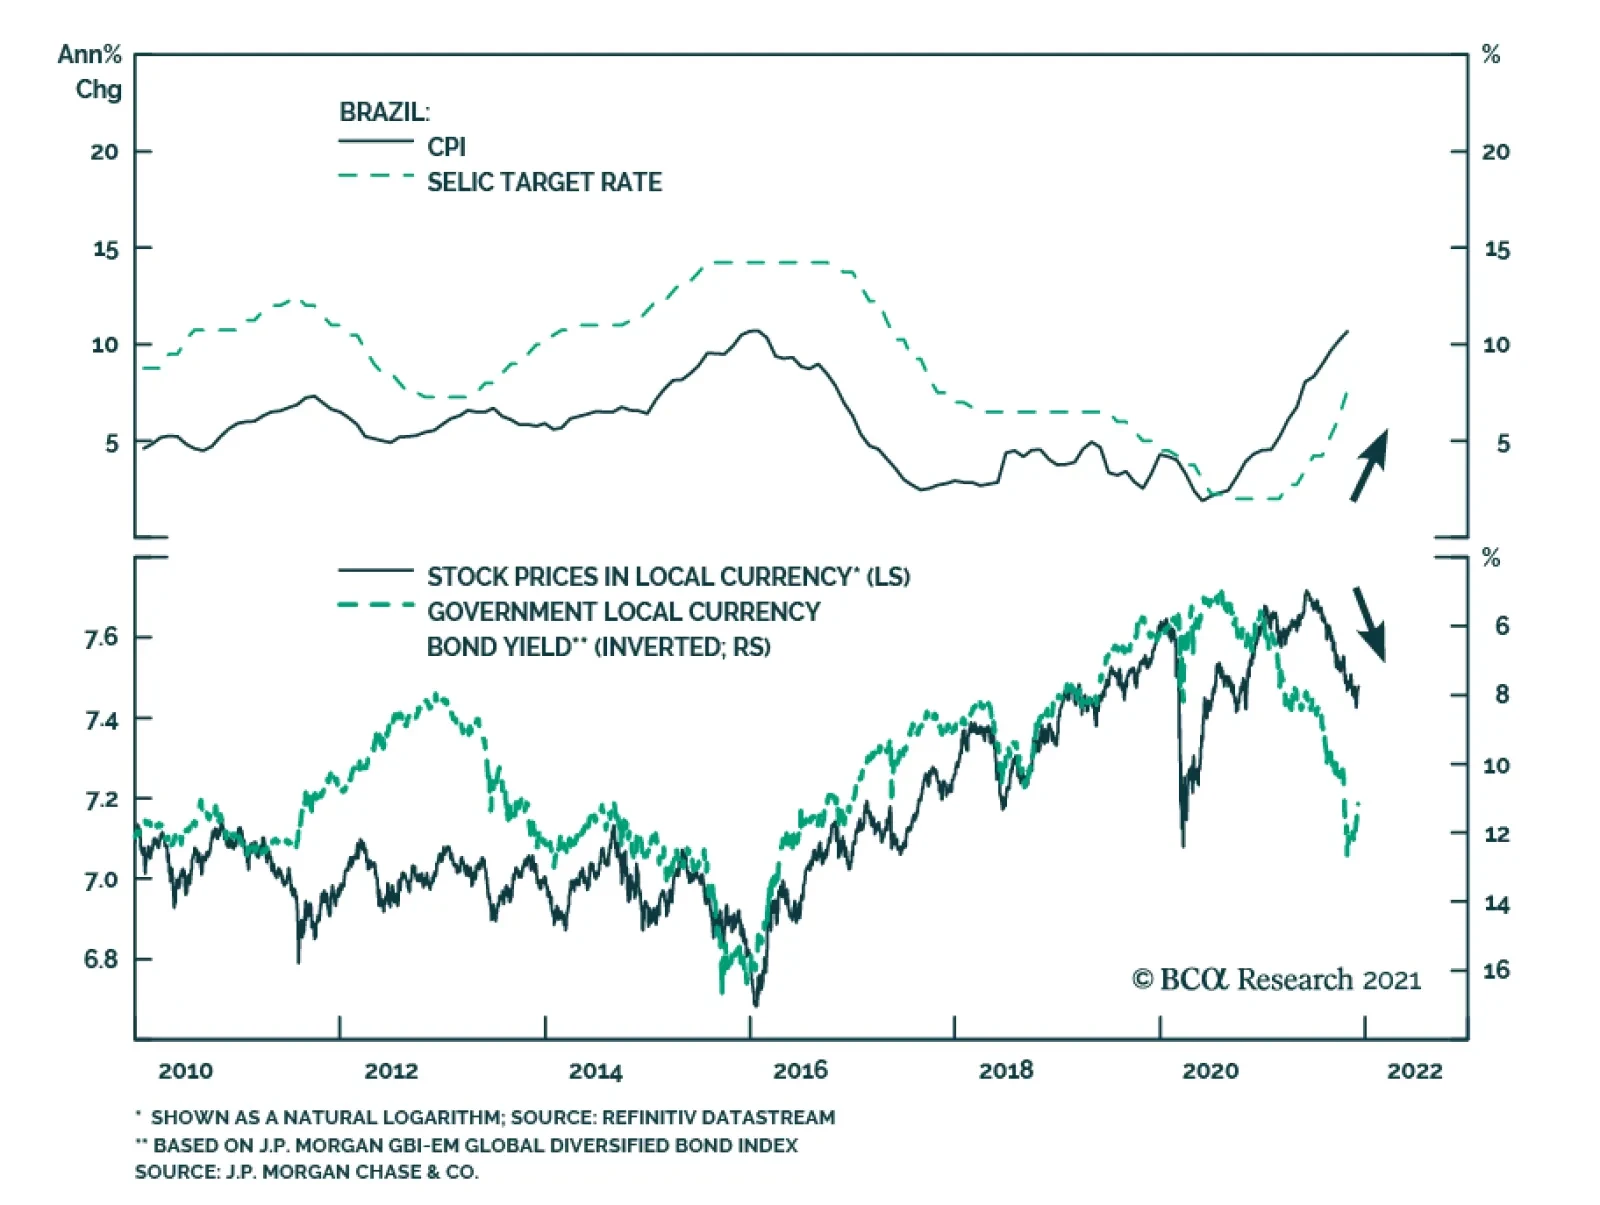
As expected, Brazil’s Central Bank lifted the benchmark Selic rate by 150 bps to 9.25% on Wednesday. This move brings the total increase since the beginning of the year to 725 bps. Policymakers also signaled that another rate hike is likely at its next policy…
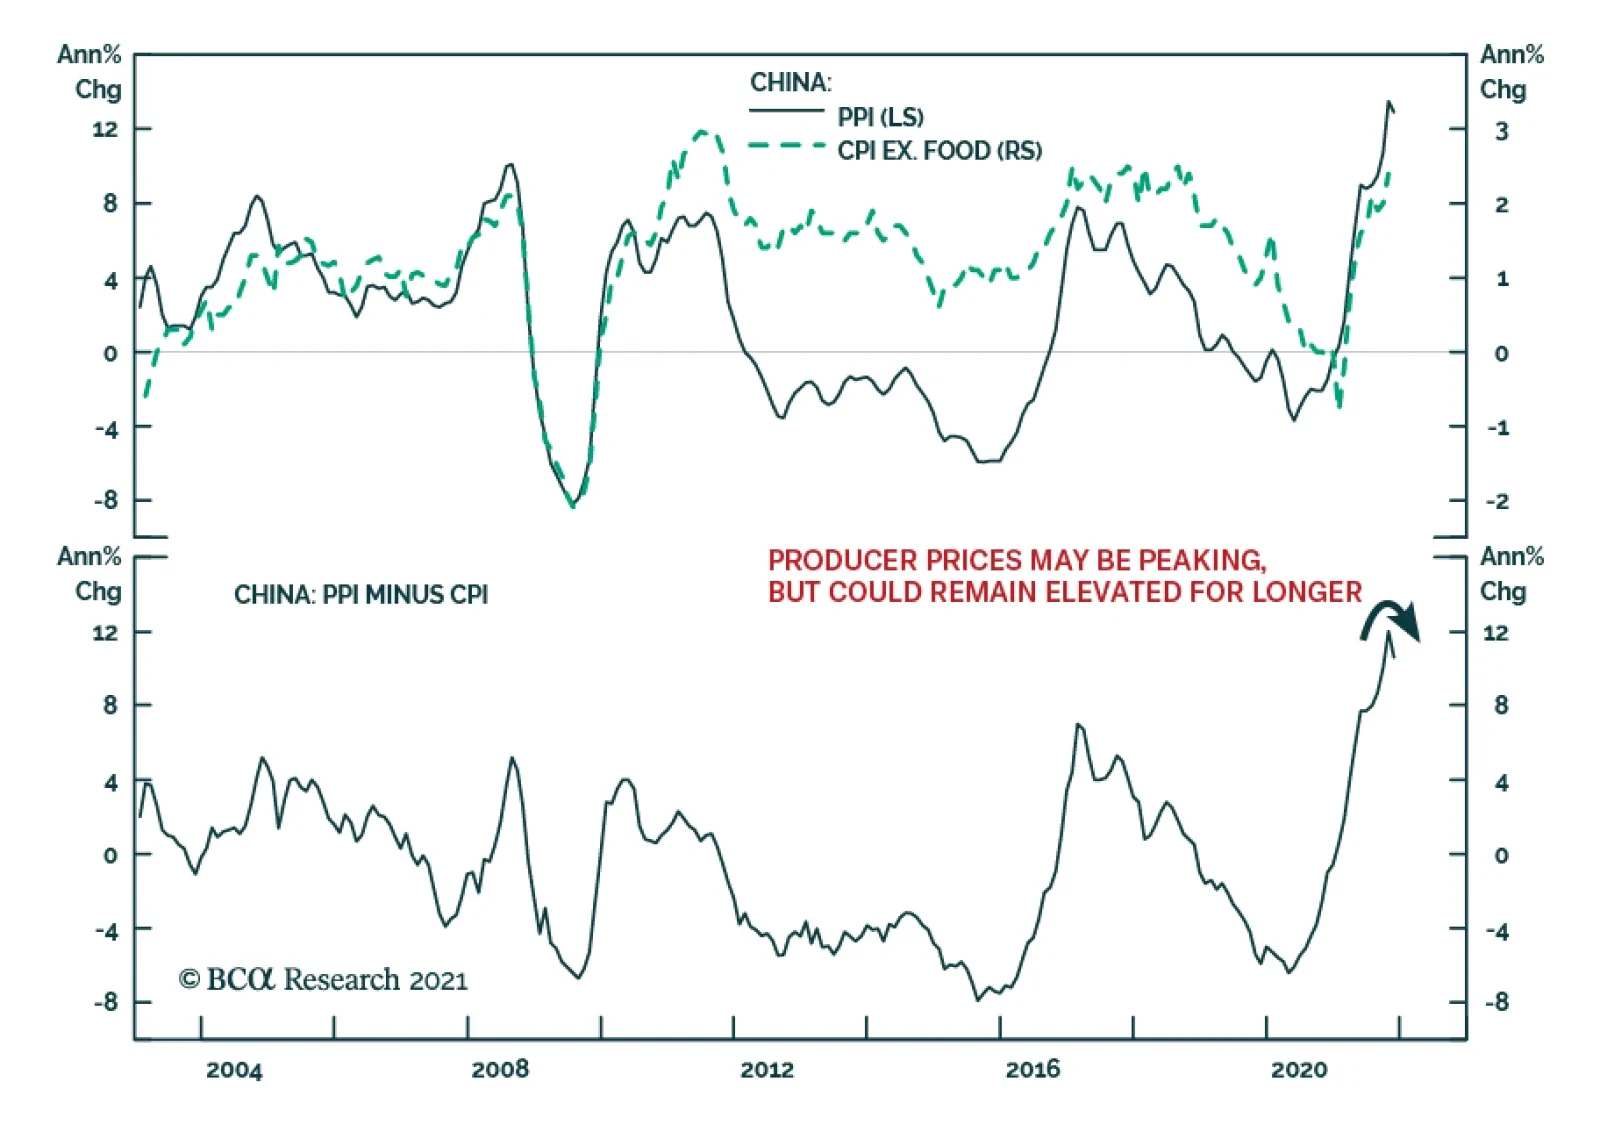
The gap between Chinese producer and consumer price inflation narrowed in November. PPI growth slowed from 13.5% to 12.9% while consumer price inflation accelerated to 2.3% from 1.5%. The moderation in producer prices reflects lower commodity prices amid…
Highlights 1. How will the pandemic resolve? 2. Will services spending recover to its pre-pandemic trend? 3. Will we spend our excess savings? 4. How will central banks react to inflation? 5. Will cryptocurrencies continue to eat gold’s lunch? 6. How fragile is Chinese real estate? 7. Will there be another shock? Fractal analysis: Personal goods versus consumer services. Feature Chart of the WeekWill Services Spending Recover To Its Pre-Pandemic Trend?
Will Services Spending Recover To Its Pre-Pandemic Trend?
Will Services Spending Recover To Its Pre-Pandemic Trend?
“Judge a man by his questions, not by his answers” The quotation above is often misattributed to Voltaire instead of its true author, Pierre-Marc-Gaston de Lévis. Irrespective of the misattribution, we agree with the maxim. Asking the right questions is more important than finding answers to the wrong questions. In this vein, this report takes the form of the seven crucial questions for 2022 (and our answers). 1. How Will The Pandemic Resolve? As new variants of SARS-CoV-2 have arrived like clockwork, the number of new global cases of infection and the virus reproduction rate have formed a near-perfect mathematical ‘sine wave’. This near-perfect sine wave will propagate into 2022 (Chart I-2). Chart I-2The Pandemic's Sine-Wave Will Propagate Into 2022
The Pandemic's Sine-Wave Will Propagate Into 2022
The Pandemic's Sine-Wave Will Propagate Into 2022
But how will this sine wave of infections translate into mortality, morbidity, and stress on our healthcare systems? As we explained in RNA Viruses: Time To Tell The Truth, the answer depends on the specific combination of contagiousness, immuno-evasion, and pathogenicity of each variant. Yet none of this should come as any surprise. Flus and colds also come in waves, which is why we call them flu and cold seasons. And the morbidity of a given flu and cold season depends on the aggressiveness of that season’s flu and cold variant. So, just like the flu and the cold, Covid will become an endemic respiratory disease which comes in waves. The trouble is that our under-resourced health care systems can barely cope with a bad flu season, let alone with an additional novel disease that can be worse than the flu. Hence, until we add enough capacity to our healthcare systems, expect more disruptions to economic activity from periodic non-pharmaceutical interventions such as travel bans, vaccine passports, and face-mask mandates. 2. Will Services Spending Recover To Its Pre-Pandemic Trend? The pandemic has given us a crash course in virology and epidemiology. We now understand antigens, antibodies, and ‘reproduction rates.’ We understand that a virus transmits as an aerosol in enclosed unventilated spaces, and that singing, and yelling eject this viral aerosol. We understand that vaccinations for RNA viruses have limited longevity, do not prevent reinfections, and that certain environments create ‘super-spreader’ events. Armed with this new-found awareness, a significant minority of people have changed their behaviour. Services which require close contact with strangers – going to the dentist or in-person doctors’ appointments, going to the cinema or to amusement parks, or using public transport – are suffering severe shortfalls in demand. Given that this change in behaviour is likely long-lasting, demand for these services is unlikely to regain its pre-pandemic trend in 2022 (Charts I-3 - I-6). Chart I-3Dental Services Are Far Below The Pre-Pandemic Trend
Dental Services Are Far Below The Pre-Pandemic Trend
Dental Services Are Far Below The Pre-Pandemic Trend
Chart I-4Physician Services Are Far Below The Pre-Pandemic Trend
Physician Services Are Far Below The Pre-Pandemic Trend
Physician Services Are Far Below The Pre-Pandemic Trend
Chart I-5Recreation Services Are Far Below The Pre-Pandemic Trend
Recreation Services Are Far Below The Pre-Pandemic Trend
Recreation Services Are Far Below The Pre-Pandemic Trend
Chart I-6Public Transportation Is Far Below The Pre-Pandemic Trend
Public Transportation Is Far Below The Pre-Pandemic Trend
Public Transportation Is Far Below The Pre-Pandemic Trend
Therefore, to keep overall demand on trend, spending on goods will have to stay above its pre-pandemic trend. This will be a tough ask. Durables, by their very definition, last a long time. Even clothes and shoes, though classified as nondurables, are in fact quite durable. Meaning that are only so many cars, iPhone 13s, gadgets, clothes and shoes that any person can own before reaching saturation. If, as we expect, spending on goods falls back to its pre-pandemic trend, but spending on services does not recover to its pre-pandemic trend, then there will be a demand shortfall in 2022 (Chart of the Week). 3. Will We Spend Our Excess Savings? If spending falls short of income – as it did through the pandemic – then, by definition, our savings have gone up. Many people claimed that this war chest of savings would unleash a tsunami of spending. Well, it didn’t. And, it won’t. Previous episodes of excess savings in 2004, 2008, and 2012 had no impact on the trend in spending (Chart I-7).
Image
The explanation comes from a theory known as Mental Accounting Bias. The theory states that we segment our money into different accounts, which are sometimes physical, sometimes only mental, and that our willingness to spend money depends on which mental account it occupies. This contrasts with standard economic theory which assumes that money is perfectly fungible, meaning that a dollar in a current (checking) account is no different to a dollar in a savings or investment account. In practice, money is not fungible, because we attach different emotions to our different mental accounts. A dollar in our current account we will gladly spend, but a dollar in our savings account we will not spend. Hence, the moment we move the dollar from our current account into our savings account, our willingness to spend it collapses. This explains why consumption trends have no connection with windfall income receipts once those income receipts end up in our savings mental or physical account. Pulling all of this together, the war chest of savings accumulated during the pandemic is unlikely to change the overall trend in spending. 4. How Will Central Banks React To Inflation? The real story of the current ‘inflation crisis’ is that while goods and commodity prices have surged exactly as expected in a positive demand shock, services prices have not declined as would be expected in the mirror-image negative demand shock. The result is that aggregate inflation has surged even though aggregate demand has not (Chart I-8 and Chart I-9). Chart I-8Goods Prices Have Reacted To A Positive Demand Shock...
Goods Prices Have Reacted To A Positive Demand Shock...
Goods Prices Have Reacted To A Positive Demand Shock...
Chart I-9...But Service Prices Have Not Reacted To A Negative Demand Shock
...But Service Prices Have Not Reacted To A Negative Demand Shock
...But Service Prices Have Not Reacted To A Negative Demand Shock
Why have services prices remained resilient despite a massive negative demand shock? One answer, as explained in question 2, is that much of the shortfall in services demand is due to behavioural changes, which cannot be alleviated by lower prices. If somebody doesn’t go to the dentist or use public transport because he is worried about catching Covid, then lowering the price will not lure that person back. In fact, the person might interpret the lower price as a signal of greater risk, and might become more averse. In technical terms, the price elasticity of demand for certain services has flipped from its usual negative to positive. This creates a major problem for central banks, because if the price elasticity of services demand has changed, then surging aggregate inflation is no longer a reliable indicator of surging aggregate demand. To repeat, inflation is surging even though aggregate demand is barely on its pre-pandemic trend. Hence in 2022, central banks face a Hobson’s choice. Choke demand that does not need to be choked, or turn a blind eye to inflation and risk losing credibility. 5. Will Cryptocurrencies Continue To Eat Gold’s Lunch? Most of the value of gold comes not from its economic utility as a beautiful, wearable, and electrically conductive metal, but from its investment value as a hedge against the debasement of fiat money. The multi-year investment case for cryptocurrencies is that they are set to displace much of gold’s investment value. Still, to displace gold’s investment value, cryptocurrencies need to match its other qualities: an economic utility, and limited supply. A cryptocurrency’s economic utility comes from its means of exchange for the intermediation services that its blockchain provides. For example, if you issue a bond or smart-contract using the Ethereum blockchain, then you must pay in its cryptocurrency ETH. Which gives ETH an economic utility. Furthermore, the number of blockchains that will succeed as go-to places for intermediation services will be limited, and each cryptocurrency has a limited supply. Thereby, the supply of cryptocurrencies that have a utility is also limited. With an economic utility, a limited supply, and drawdowns that are becoming smaller, cryptocurrencies can continue to displace gold’s dominance of the $12 trillion anti-fiat investment market. Therefore, the cryptocurrency asset-class can continue its strong structural uptrend, albeit punctuated by short sharp corrections (Chart I-10). Chart I-10Cryptocurrencies Will Continue To Displace Gold's Investment Value
Cryptocurrencies Will Continue To Displace Gold's Investment Value
Cryptocurrencies Will Continue To Displace Gold's Investment Value
The corollary is that the structural outlook for gold is poor. 6. How Fragile Is Chinese Real Estate? A decade-long surge in Chinese property prices has lifted Chinese valuations to nosebleed levels. According to global real estate specialist Savills, prime real estate yields in China’s major cities are now barely above 1 percent, and the world’s five most expensive cities are all in China: Hangzhou, Shenzhen, Guangzhou, Beijing, and Shanghai (Chart I-11).
Chart I-11
Without a social safety net and with limited places to park their money, Chinese savers have for years been encouraged to buy homes, in the widespread belief that property is the safest investment, whose price only goes up. With the bulk of people’s wealth in property acting as a perceived economic safety net, even a modest decline in house prices would constitute a major shock to the household sector’s hopes and expectations of what property is. Therefore, in contrast to the US housing debacle in 2008, the Chinese government will ensure that its property market adjustment does not come from a collapse in home prices. Rather, it will come from a collapse in property development and construction activity. This will have negative implications for commodities, emerging Asia, developing countries that produce raw materials, and machinery stocks worldwide. 7. Will There Be Another Shock? Most strategists claim that shocks, such as the pandemic, are unpredictable. We disagree. Yes, the timing and source of an individual shock is unpredictable, but the statistical distribution of shocks is highly predictable. We define a shock as any event that causes the long-duration bond price in a major economy to rally or slump by at least 20 percent.1 Using this definition through the last 60 years, the statistical distribution of the number of shocks in any ten-year period is Poisson (3.33) and the time between shocks is Exponential (3.33). This means that in any ten-year period, the likelihood of suffering a shock is a near-certain 95 percent; in any five-year period, it is an extremely high 80 percent; in a two-year period it is a coin toss at 50 percent; and even in one year it is a significant 30 percent (Chart I-12).
Chart I-12
Therefore, on a multi-year horizon, another shock is a near-certainty even if we do not know its source or precise timing. The question is, will it be net deflationary, or net inflationary? Our high-conviction view is that it will be net deflationary. Meaning that even if it starts as inflationary, it will quickly morph into deflationary. The simple reason is that it is not just Chinese real estate that is fragile. Through the past ten years, world prime residential prices are up by 70 percent while rents are up by just 25 percent2 (Chart I-13). Meaning that the bulk of the increase in global real estate prices is due to skyrocketing valuations. The culprit is the structural collapse in global bond yields – which, in turn, is due to persistently ultra-low policy interest rates combined with trillions of dollars of quantitative easing. Chart I-13Property Price Inflation Has Far Exceeded Rent Inflation
Property Price Inflation Has Far Exceeded Rent Inflation
Property Price Inflation Has Far Exceeded Rent Inflation
This means that bond yields have very limited scope to rise before pulling the bottom out of the $300 trillion global real estate market. Given that this dwarfs the $90 trillion global economy, it would constitute a massive deflationary backlash to the initial inflationary shock. Some people counter that in an inflationary shock, property – as the ultimate real asset – ought to perform well even as bond yields rise. However, when valuations start off in nosebleed territory as now, the initial intense headwind from deflating valuations would obliterate the tailwind from inflating incomes. Investment Conclusions To summarise, 2022 will be a year in which: Covid waves continue to disrupt the economy; a persistent shortfall in spending on services is not fully countered by excess spending on goods; China’s construction boom comes to an end; inflation takes time to cool, pressuring central banks to raise rates despite fragile demand; and the probability of another shock is an underestimated 30 percent. We reach the following investment conclusions: Overweight the China 30-year bond and the US 30-year T-bond. There will be no sustained rise in long-duration bond yields, and the risk to yields is to the downside. Long-duration equity sectors and stock markets that are least sensitive to cyclical demand will continue to rally (Chart I-14). Chart I-14The US Stock Market = The 30-Year T-Bond Multiplied By Profits
The US Stock Market = The 30-Year T-Bond Multiplied By Profits
The US Stock Market = The 30-Year T-Bond Multiplied By Profits
Overweight the US versus non-US. Underweight Emerging Markets. Underweight old-economy cyclical sectors such as banks, materials, and industrials. Commodities will struggle. Underweight commodities that haven’t corrected versus those that have (Chart I-15). Chart I-15Underweight Commodities That Haven't Yet Corrected
Underweight Commodities That Haven't Yet Corrected
Underweight Commodities That Haven't Yet Corrected
Overweight the US dollar versus commodity currencies. Cryptocurrencies will continue their structural uptrend at the expense of gold. Goods Versus Services Is Technically Stretched Finally, this week’s fractal analysis corroborates the massive displacement from services spending into goods spending, highlighted by the spectacular outperformance of personal goods versus consumer services. This outperformance is now at the point of fragility on its 260-day fractal structure that has signalled previous reversals (Chart I-16). Therefore, a good trade would be to short personal goods versus consumer services, setting a profit target and symmetrical stop-loss at 12.5 percent. Chart I-16Underweight Personal Goods Versus Consumer Services
Underweight Personal Goods Versus Consumer Services
Underweight Personal Goods Versus Consumer Services
Dhaval Joshi Chief Strategist dhaval@bcaresearch.com Footnotes 1 As bond yields approach their lower limit, this definition of a shock will need to change as it will become impossible for long-duration bond prices to rally by 20 percent. 2 Based on Savills Prime Index: World Cities – Capital Values, and World Cities – Rents and Yields, June 2011 through June 2021. Fractal Trading System Fractal Trades 6-Month Recommendations Structural Recommendations Closed Fractal Trades Indicators To Watch - Bond Yields Chart II-1Indicators To Watch - Bond Yields - Euro Area
Indicators To Watch - Bond Yields - Euro Area
Indicators To Watch - Bond Yields - Euro Area
Chart II-2Indicators To Watch - Bond Yields - Europe Ex Euro Area
Indicators To Watch - Bond Yields - Europe Ex Euro Area
Indicators To Watch - Bond Yields - Europe Ex Euro Area
Chart II-3Indicators To Watch - Bond Yields - Asia
Indicators To Watch - Bond Yields - Asia
Indicators To Watch - Bond Yields - Asia
Chart II-4Indicators To Watch - Bond Yields - Other Developed
Indicators To Watch - Bond Yields - Other Developed
Indicators To Watch - Bond Yields - Other Developed
Indicators To Watch - Interest Rate Expectations Chart II-5Indicators To Watch - Interest Rate Expectations
Indicators To Watch - Interest Rate Expectations
Indicators To Watch - Interest Rate Expectations
Chart II-6Indicators To Watch - Interest Rate Expectations
Indicators To Watch - Interest Rate Expectations
Indicators To Watch - Interest Rate Expectations
Chart II-7Indicators To Watch - Interest Rate Expectations
Indicators To Watch - Interest Rate Expectations
Indicators To Watch - Interest Rate Expectations
Chart II-8Indicators To Watch - Interest Rate Expectations
Indicators To Watch - Interest Rate Expectations
Indicators To Watch - Interest Rate Expectations
Dear Clients, Next week, in addition to sending you the China Macro And Market Review, we will be presenting our 2022 outlook on China at our last webcasts of the year “China 2021 Key Views: A Challenging Balancing Act”. The webcasts will be held Wednesday, December 15 at 10:00 am EDT (English) and Thursday, December 16 at 9:00 am HKT (Mandarin). Best regards, Jing Sima China Strategist Highlights China’s policymakers are balancing between staying the course with structural reforms and stabilizing the economy. This carefully calibrated approach means that Beijing will only initiate piecemeal policy easing in the near term. China will ramp up investment in the new economy, which is too small to fully offset the drag on the aggregate economy from weakening old economy sectors. In the next three to six months, the economy will deteriorate further, but Beijing will only press the stimulus accelerator harder if their pressure points are breached. A zero-tolerance policy towards COVID will be maintained for the foreseeable future. Uncertainties surrounding the Omicron variant will reinforce this approach. The common prosperity policy initiative will likely accelerate ahead of the 20th National Congress of the Chinese Communist Party (NCCCP) in the fall of 2022. While the plan will ultimately benefit income and consumption for the majority of Chinese households, the uncertainties surrounding impending tax reforms will curb demand for housing and luxury goods in the short term. We remain underweight Chinese stocks. Prices for onshore stocks will likely fall in the next three to six months when the market starts to price in lower-than-expected economic growth and disappointing stimulus. Selloffs in the first half of 2022 may present an opportunity to turn positive on onshore stocks in absolute terms. We will turn bullish on Chinese stocks relative to global equities only when credit expansion overshoots weakness in the economy, which has a low likelihood. We continue to favor onshore stocks versus offshore within a Chinese equity portfolio. Tensions between the US and China may intensify leading up to the political events next year. Chinese offshore stocks, highly concentrated in internet companies, still face the risks of being caught in both geopolitical crossfires and domestic regulatory pressures. Feature China’s economy slowed significantly in 2H21, with the extent of policy tightening and magnitude of the decline in growth much larger than global investors expected. As we forecasted in our last year’s Key Views report, 2021 marked the beginning of a new era in which policymakers would switch gears from building a "moderately prosperous society" to becoming a "great modern socialist nation”.The pivot means that officials would tolerate slower economic growth, implement tougher financial and industry regulations, and accelerate structural reforms. On the cusp of 2022, we are cautious about the willingness of China’s top leadership to initiate large-scale policy easing. Even though policy tone has shifted to a more pro-growth bias, authorities are still trying to replace old economic drivers with the new economy sectors. Furthermore, they are struggling to maintain a delicate balance between boosting short-term growth and maintaining long-term reforms goals. As a result, their policies are sending mixed signals. As seen in 2018 and 2019, the policymakers’ reluctance to activate a full-scale stimulus does not bode well for global commodity prices. Chinese onshore stocks underperformed their global counterparts during the 2018-19 period. Chinese stocks will face nontrivial headwinds in the coming months and warrant a cautious stance until more stimulus is introduced and the macro picture begins to meaningfully improve. The main themes in our outlook for 2022 are discussed below. Key View #1: Balancing Between The Old And New Economies Despite a recent pro-growth bias in the policy tone, the speed of easing has been incremental and the magnitude piecemeal. Moreover, authorities are telegraphing policy support in new economy sectors (such as high tech and clean energy), while only somewhat loosening restrictions in old economy sectors (mainly property and infrastructure). Chart 1Current Easing Path Is Looking A Lot Like In 2018/19
Current Easing Path Is Looking A Lot Like In 2018/19
Current Easing Path Is Looking A Lot Like In 2018/19
China’s policy framework has shifted since late 2017 as we noted in previous reports. The top leadership is more determined to stay the course with reforms and tolerate slower growth in the old economy. Our BCA Li Keqiang Leading Indicator highlights policymakers’ carefully calibrated policy actions to avoid a dramatic overshoot of credit growth; these actions are consistent with 2018/19 and starkly contrast with policy frameworks in 2012 and 2015. Monetary conditions have meaningfully eased, but the rebound in money supply and credit growth has lagged and is muted due to heightened regulatory oversight (Chart 1). Investors should keep low expectations about the policymakers’ willingness to boost growth in old economy sectors. The easing of restrictions in property sector – from prompting banks to resume lending to qualified homebuyers and developers, to allowing funding for developers to acquire distressed real estate assets – are steps to alleviate an escalating risk of widespread bankruptcies among real estate developers. However, regulators have not changed the direction of their structural policies. Funding constraints placed on both developers and banks since last August remain intact. Banks still need to meet the “two red lines” that set the upper limit on the portion of their lending to the property sector, while developers must bring their leverage ratios below the “three red lines” by end-2023. Maintaining these binding constraints on developers and banks will continue to weigh on the housing market in the coming years. The recent easing may reduce the intensity of funding constraints, but the banks will be extremely cautious to extend lending to a broad range of developers. Aggressive crackdowns on property market speculation in the past 12 months has fundamentally shifted both developers’ and consumers’ expectations for future home prices. Growth in home sales and new projects dropped to their 2015 lows, while current real estate inventories are comparable to 2015 highs (Chart 2). Therefore, unless regulators are willing to initiate more aggressive policy boosts, such as cutting mortgage rates and/or providing government funds to monetize inventory excesses in the housing market, the current easing measures probably will not revive sentiment in the property market. Thus, odds are that the property market downtrend will extend through 2022 (Chart 3). Chart 2Downward Momentum In Property Market Comparable To 2015
Downward Momentum In Property Market Comparable To 2015
Downward Momentum In Property Market Comparable To 2015
Chart 3Policymakers Will Have To Allow Significant Re-leveraging To Revive The Market
Policymakers Will Have To Allow Significant Re-leveraging To Revive The Market
Policymakers Will Have To Allow Significant Re-leveraging To Revive The Market
Chart 4Key Indicators Show Weak Signs Of Revival In Infrastructure Spending
Key Indicators Show Weak Signs Of Revival In Infrastructure Spending
Key Indicators Show Weak Signs Of Revival In Infrastructure Spending
We expect some modest increase in infrastructure spending next year from the meager 0.7% growth in 2021, but we are skeptical that policymakers will allow any substantial rebound. Shadow banking activity and infrastructure project approval, two key indicators we monitor for signs of a meaningful easing in infrastructure spending, show little improvement (Chart 4). Our outlook for infrastructure investment is based on the following: Since 2017 policymakers have assumed a much more hawkish approach toward reducing investment in the capital-intensive and unproductive old economic sectors. Next year’s 20th NCCCP will not fundamentally change this policy setting. The 19th NCCCP in late 2017 deviated from the past; infrastructure investment growth downshifted following the event, whereas significant spending boosts had followed previous NCCCPs (Chart 5). Beijing adhered to its structural downshift in infrastructure spending even during the 2018/19 US-China trade war and after last year’s pandemic-induced economic contraction. Chart 5Infrastructure Investment Shifted To A Lower Gear Following The 19th NCCCP
Infrastructure Investment Shifted To A Lower Gear Following The 19th NCCCP
Infrastructure Investment Shifted To A Lower Gear Following The 19th NCCCP
Chart 6
Secondly, government spending since 2017 has tilted towards social welfare over building “bridges to nowhere”, a meaningful change from the past and in keeping with President Xi Jinping’s political priorities (Chart 6). The trend will likely continue next year because local governments need to maintain large social welfare budgets to counter the economic impact of the prolonged domestic battle against COVID. Local government revenues, on the other hand, will be reduced due to slumping land sales. Thirdly, there has been strong policy guidance by the central government to shift investment to the new economy sectors and away from traditional infrastructure projects. The PBoC in early November launched the carbon emission reduction facility (CERF) to offer low interest loans to financial institutions that help firms cut carbon emissions.
Chart 7
China’s new economy sectors have experienced rapid growth in recent years, but in the short-term, infrastructure spending in those sectors will not fully offset a reduction in traditional infrastructure (Chart 7). The combined spending in tech infrastructure (including information transmission such as 5G technology and services) and green energy stood at RMB1.6 trillion last year, compared with the RMB19 trillion investment in traditional infrastructure and RMB14 trillion in the real estate sector. Bottom Line: Beijing will continue to push for investment in new economy sectors since the leadership is determined to reduce dependency on unproductive segments of the economy. Even as the economy slows, they will be reluctant to ramp up leverage and channel capital to the old economy sectors. Unfortunately, the small size of the new economy’s sectors versus the old economy will inhibit their ability to stabilize and accelerate economic growth via these policies. Key View #2: The Pressure Points We do not think Beijing will allow the economy to freefall past the “point of no return”. The economy still needs to grow by 4.5-5.0% per annum between 2021 and 2035 to achieve the target of doubling GDP by 2035 (Chart 8A and 8B). Chart 8AThe Structural Downshift In Chinese Growth Will Continue…
The Structural Downshift In Chinese Growth Will Continue…
The Structural Downshift In Chinese Growth Will Continue…
Chart 8B...But A 5%+/- Rate Of Growth Will Keep China Well On Track Of Doubling Its GDP By 2035
...But A 5%+/- Rate Of Growth Will Keep China Well On Track Of Doubling Its GDP By 2035
...But A 5%+/- Rate Of Growth Will Keep China Well On Track Of Doubling Its GDP By 2035
Investors should watch the following pressure points to assess whether China’s leaders will feel the urgency to turn policy to outright reflationary: A collapse in onshore financial market prices. China’s economic fundamentals will weaken further in the next three to six months and the risks to Chinese equity prices are on the downside. However, the odds are still low that the onshore equity, bond and currency markets will plunge as in 2015. Onshore stocks are cheaper than during the height of their 2015 boom-bust cycle, margin trading remains well below its 2015 level and economic fundamentals are stronger (Chart 9). Selloffs by global investors in China’s offshore equity and high-yield bond markets have not triggered much panic in the onshore markets and, therefore, will not drive Beijing to change its macro policy (Chart 10). Chart 9Valuations In Chinese Stocks Are Not As Extreme As In 2015
Valuations In Chinese Stocks Are Not As Extreme As In 2015
Valuations In Chinese Stocks Are Not As Extreme As In 2015
Chart 10Onshore Markets Have Been Relatively Calm
Onshore Markets Have Been Relatively Calm
Onshore Markets Have Been Relatively Calm
Chart 11China/US Growth Rates In 2022 Will Be Uncomfortably Close, Based On IMF Forecasts
China/US Growth Rates In 2022 Will Be Uncomfortably Close, Based On IMF Forecasts
China/US Growth Rates In 2022 Will Be Uncomfortably Close, Based On IMF Forecasts
Narrowing growth differentials between China and the US. In the IMF’s October World Economic Outlook, economic growth in 2022 for China and the US is projected at 5.6% and 5.2%, respectively. The forecast suggests that next year the growth differential between the two largest economies will be narrowed to less than one percentage point, rarely seen in China’s post-reform history (Chart 11). Notably, the most recent Bloomberg consensus estimate for the 2022 US real GDP growth is much lower at 3.9%, whereas China is expected to grow by 5.3% and in line with the IMF forecast. We do not suggest that Beijing will make its policy decisions based on these growth projections. Rather, we expect that if China’s growth in 1H22 falls behind that in the US, Chinese policymakers will feel an urgency to stimulate the economy and show a better economic scorecard ahead of the all-important 20th NCCCP next fall. Rising unemployment. Current data shows a mixed picture. Unemployment rates have been falling in all age groups (Chart 12). Demand for labor in urban areas, on the other hand, has been shrinking (Chart 13). The employment subindex in China’s service PMIs has also been dropping. Our view is that the resilient export/manufacturing sector has provided strong support to employment this year, while the labor supply in urban areas has been sluggish due to tighter travel restrictions and frequent regional lockdowns. The combination of strong manufacturing demand for labor and a lack of supply has reduced excesses in the labor market and the urgency to stimulate the economy (Chart 13, bottom panels). However, the picture could change if China’s exports start to slow into next year. Chart 12China's Unemployment Rate Is Falling...
China's Unemployment Rate Is Falling...
China's Unemployment Rate Is Falling...
Chart 13...But Demand For Labor Is Also Falling
...But Demand For Labor Is Also Falling
...But Demand For Labor Is Also Falling
Bottom Line: In the coming year, investors should watch for three pressure points that may trigger more forceful growth-supporting actions from policymakers: the onshore financial markets, economic growth differentials between the US and China, and labor market dynamics. Key View #3: The Exit Strategy Chart 14Service Sector Activities Have Been Restricted By Domestic Covid Cases And Frequent Lockdowns
Service Sector Activities Have Been Restricted By Domestic Covid Cases And Frequent Lockdowns
Service Sector Activities Have Been Restricted By Domestic Covid Cases And Frequent Lockdowns
China will not completely lift its zero-tolerance policy toward COVID in the coming year. We will likely see tightened domestic preventive measures leading to the Beijing Olympics in February and the NCCCP in October. The zero-tolerance policy cannot be sustained in the long run; China’s stringent counter-COVID measures have created a stop-and-go pattern in China’s service sector, which has taken a toll on household consumption (Chart 14). As such, Chinese policymakers will face a trade-off between hefty economic costs from its current counter-COVID measures, and the potential social costs and risks if there is a dramatic increase in domestic COVID cases. China is estimated to have fully vaccinated more than 80% of its citizens and is close to launching its own mRNA vaccine next year to be used as a booster shot. However, the inoculation rate will likely matter less to Beijing’s decision to relax its draconian approach towards COVID given the emergence of the virulent Omicron variant. Recent statement by China's top respiratory experts suggests that China will return to normalcy if fatality rate of COVID-19 drops to around 0.1%, and when R0 (the virus reproduction ratio) sits between 1 and 1.5. A more important factor that could influence Beijing’s decision is the development and effectiveness of anti-viral drug treatments. Pfizer recently announced that its anti-viral oral drug Paxlovid can reduce the hospitalization and death rates by 89% if taken within three days of the onset of symptoms. The drug-maker has announced its intention to produce enough of the medication to treat 50 million people in 2022. China’s Tsinghua University has also developed an antibody combination drug that may reduce hospitalization and mortality by 78% and is expected to be approved by Chinese regulators within this year. Beijing’s decision to abandon its zero-tolerance policy, therefore, will be based on the combined effectiveness of both vaccines and treatments. If clinical trials prove that the new antiviral drugs are effective in treating COVID patients, combined with China’s aggressive rollout of booster shots, then Beijing may incrementally relax its COVID containment measures by late 2022 or early 2023. Bottom Line: China will not loosen its zero-tolerance policy until a combination of vaccines and treatments proves to be effective against COVID. Key View #4: Common Prosperity Will Gather Steam We expect the notion of common prosperity espoused by President Xi Jinping to gain momentum ahead of the 20th NCCCP. Beijing will likely roll out measures to support consumption, particularly for low-income households. At the same time, there is a high possibility that policymakers will introduce taxes on luxury goods and accelerate the legislative process on real estate taxes. Chart 15The Slump In Property Market Will Likely Be An Extended One
The Slump In Property Market Will Likely Be An Extended One
The Slump In Property Market Will Likely Be An Extended One
The property market will remain in a limbo in 2022. In the near term, potential homebuyers will likely maintain their wait-and-see attitude before details of real estate taxes are disclosed. Home sales will remain in contraction despite improved mortgage lending conditions (Chart 15). Consumption taxes are expected to increase, targeting consumer discretionary and/or luxury goods. Chinese consumption of luxury goods benefited from government pro-growth measures last year, flush liquidity in the market and global travel restrictions. Meanwhile, growth in aggregate household income and consumption has been lackluster. President Xi Jinping’s common prosperity policy initiative is intended to narrow the income and wealth gap between the rich and poor. Moreover, empirical studies show that the marginal propensity to consume among lower- and middle-income groups, which account for more than 80% of China’s total population, is significantly higher than that of high-income groups. We expect more support for lower income groups as Beijing looks to stabilize the economy and narrow the wealth gap. Bottom Line: There is a high probability that policymakers will introduce taxes on the consumption of luxury goods and initiate the legislative process on real estate taxes in the next 12 months. Investment Conclusions Chinese stocks in both the onshore and offshore markets have cheapened relative to global equities. However, in absolute terms onshore stocks are not unduly cheap and offshore stocks are cheap for a reason (Chart 16). We remain defensive in our investment strategy for Chinese stocks in the next two quarters, given the headwinds facing the onshore and offshore markets. We do not rule out the possibility that China’s authorities will stimulate more forcefully in the next 12 months. However, for Chinese policymakers to ramp up leverage again, the near-term dynamics in the country’s economic cycle will have to significantly worsen. Chinese stocks will sell off in this scenario, but the selloff will provide investors with a good buying opportunity in the expectation of a more decisive stimulus (Chart 17). Chart 16Chinese Onshore Stocks Are Not Particularly Cheap, While Offshore Stocks Are Cheap For A Reason
Chinese Onshore Stocks Are Not Particularly Cheap, While Offshore Stocks Are Cheap For A Reason
Chinese Onshore Stocks Are Not Particularly Cheap, While Offshore Stocks Are Cheap For A Reason
Chart 17Selloff Risks Are High Before The Economy Stabilizes
Selloff Risks Are High Before The Economy Stabilizes
Selloff Risks Are High Before The Economy Stabilizes
Chart 18A Deja Vu Of 2018-2019?
A Deja Vu Of 2018-2019?
A Deja Vu Of 2018-2019?
If the economy slows in an orderly and gradual manner, then there is a slim chance that policymakers will allow an overshoot in stimulus. The Politburo meeting on Monday sent a stronger pro-growth message, the PBoC cut the reserve requirement ratio (RRR) rate by 50bps, and regulators will likely allow a front-loading of local government special-purpose bonds in Q1 next year. However, based on the lessons learned in 2019, regulators can be quick to scale back policy support if they see there is a risk of overshooting in credit expansion (Chart 18). The measured stimulus during the 2018-2019 period did not bode well for Chinese stocks or global commodity prices (Chart 19A and 19B). Meanwhile, we do not think the recent selloff in offshore stocks provided good buying opportunities. In the next 6 to 12 months, any tactical rebound in Chinese investable stocks will present a good selling point. Chart 19AChina's Measured Stimulus In 2018-2019 Did Not Bode Well For Global Commodity Prices
China's Measured Stimulus In 2018-2019 Did Not Bode Well For Global Commodity Prices
China's Measured Stimulus In 2018-2019 Did Not Bode Well For Global Commodity Prices
Chart 19BChinese Stocks Underperformed In 2018-2019
Chinese Stocks Underperformed In 2018-2019
Chinese Stocks Underperformed In 2018-2019
Investable stocks, highly concentrated in China’s internet companies, are caught in domestic regulatory clampdowns and geopolitical crossfires. We expect tensions between China and the US to intensify in 2022 in light of next fall’s 20th NCCCP in China and mid-term elections in the US. Furthermore, Didi Global’s decision to delist from the New York Stock Exchange last week highlights that both China and the US are unanimous in their efforts (although for different reasons) to remove Chinese firms from US bourses. Risks associated with future delisting of Chinese firms will continue to depress the valuations of Chinese technology stocks. Jing Sima China Strategist jings@bcaresearch.com Market/Sector Recommendations Cyclical Investment Stance