Monetary

Highlights Geopolitical conflicts point to energy price spikes and could add to inflation surprises in the near term. However, US fiscal drag and China’s economic slowdown are both disinflationary risks to be aware of. Specifically, energy-producers like Russia and Iran gain greater leverage amid energy shortages. Europe’s natural gas prices could spike again. Conflict in the Middle East could disrupt oil flows. President Biden’s $1.75 trillion social spending bill is a litmus test for fiscal fatigue in developed markets. It could fail, and even assuming it passes it will not prevent overall fiscal drag in 2022-23. However, it is inflationary over the long run. China’s slowdown poses the chief disinflationary risk. But we still think policy will ease to avoid an economic crash ahead of the fall 2022 national party congress. We are closing this year’s long value / short growth trade for a loss of 3.75%. Cyclical sectors ended up being a better way to play the reopening trade. Feature Equity markets rallied in recent weeks despite sharp upward moves in core inflation across the world (Chart 1). Inflation is fast becoming a popular concern and we see geopolitical risks that could drive headline inflation still higher in the short run. We also see underrated disinflationary factors, namely China’s property sector distress and economic slowdown. Several major developments have occurred in recent weeks that we will cover in this report. Our conclusions: Biden’s domestic agenda will pass but risks are high and macro impact is limited. Congress passed Biden’s infrastructure deal and will probably still pass his signature social spending bill, although inflation is creating pushback. Together these bills have little impact on the budget deficit outlook but they will add to inflationary pressures. Energy shortages embolden Russia and Iran. Winter weather is unpredictable, the energy crisis may not be over. But investors are underrating Russia’s aggressive posture toward the West. Any conflict with Iran could also cause oil disruptions in the near future. US-China relations may improve but not for long. A bilateral summit between Presidents Joe Biden and Xi Jinping will not reduce tensions for very long, if at all. Climate change cooperation is an insufficient basis to reverse the cold war-style confrontation over the long run. Chart 1Inflation Rattles Policymakers
Inflation Rattles Policymakers
Inflation Rattles Policymakers
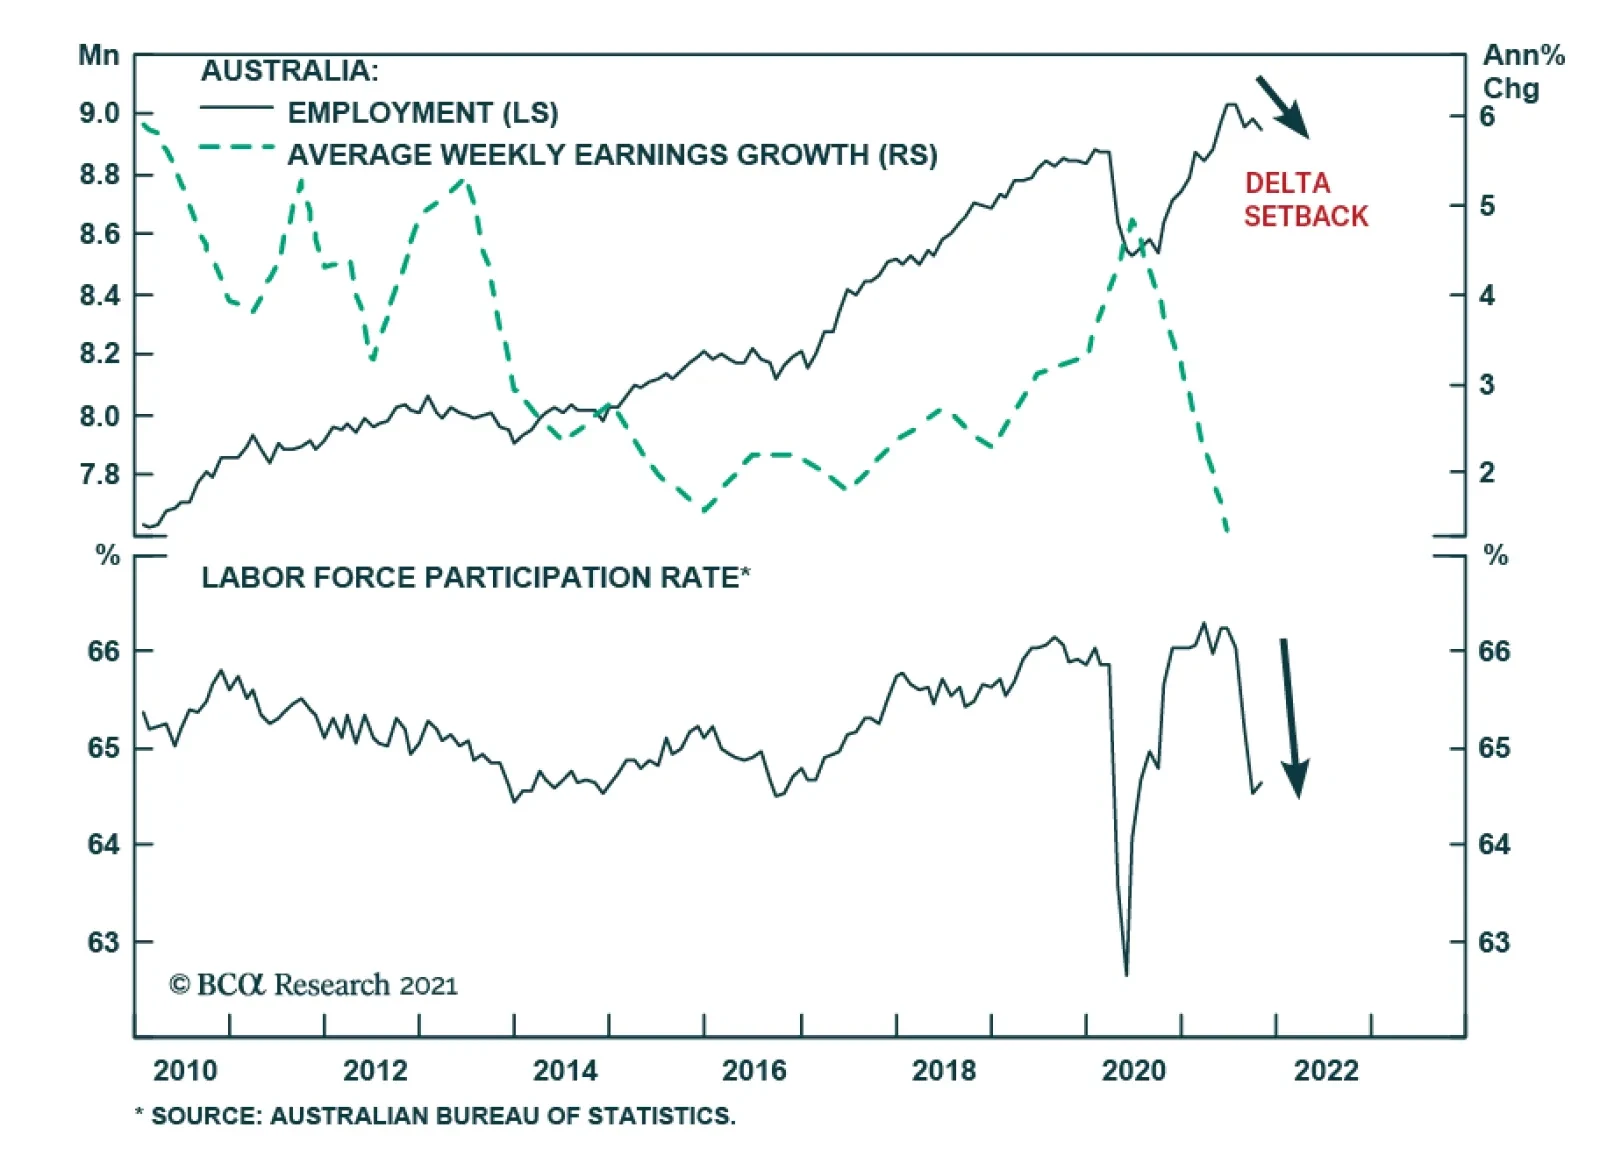
The investment takeaway is that geopolitical tensions could push energy prices still higher in the short term. Iran and Russia need to be monitored. However, China’s economic slowdown will weigh on growth. China poses an underrated disinflationary risk to our views. US Congress: Bellwether For Fiscal Fatigue While inflation is starting to trouble households and voters, investors should bear in mind that the current set of politicians have long aimed to generate an inflation overshoot. They spent the previous decade in fear of deflation, since it generated anti-establishment or populist parties that threatened to disrupt the political system. They quietly built up an institutional consensus around more robust fiscal policy and monetary-fiscal coordination. Now they are seeing that agenda succeed but are facing the first major hurdle in the form of higher prices. They will not simply cut and run. Inflation is accompanied by rising wages, which today’s leaders want to see – almost all of them have promised households a greater share of the fruits of their labor, in keeping with the new, pro-worker, populist zeitgeist. Real wages are growing at 1.1% in the US and 0.9% across the G7 (Chart 2). Even more than central bankers, political leaders are focused on jobs and employment, i.e. voters. Yet the labor market still has considerable slack (Chart 3). Almost all of the major western governments have been politically recapitalized since the pandemic, either through elections or new coalitions. Almost all of them were elected on promises of robust public investment programs to “build back better,” i.e. create jobs, build infrastructure, revitalize industry, and decarbonize the energy economy. Thus while they are concerned about inflation, they will leave that to central banks, as they will be loathe to abandon their grand investment plans. Chart 2Higher Wages: Real Or Nominal?
Higher Wages: Real Or Nominal?
Higher Wages: Real Or Nominal?
Still, there will be a breaking point at which inflation forces governments to put their spending plans on hold. The US Congress is the immediate test of whether today’s inflation will trigger fiscal fatigue and force a course correction. Chart 3Policymakers Fear Populism, Focus On Employment
Policymakers Fear Populism, Focus On Employment
Policymakers Fear Populism, Focus On Employment
President Biden’s $550 billion infrastructure bill passed Congress last week and will be signed into law around November 15. Now he is worried that his signature $1.75 trillion social spending bill will falter due to inflation fears. He cannot spare a single vote in the Senate (and only three votes in the House of Representatives). Odds that the bill fails are about 35%. Democratic Party leaders will not abandon the cause due to recent inflation prints. They see a once-in-a-generation opportunity to expand the role of government, the social safety net, and the interests of their constituents. If they miss this chance due to inflation that ends up being transitory then they will lose the enthusiastic left wing of the party and suffer a devastating loss in next year’s midterm elections, in which they are already at a disadvantage. Biden’s social bill is also likely to pass because the budget reconciliation process necessary to pass the bill is the same process needed to raise the national debt limit by December 3. A linkage of the two by party leaders would ensure that both pass … and otherwise Democrats risk self-inflicting a national debt default. The reconciliation bill is more about long-term than short-term inflation risk. The bill does not look to have a substantial impact on the budget outlook: the new spending is partially offset by new taxes and spread out over ten years. The various legislative scenarios look virtually the same in our back-of-the-envelope budget projections (Chart 4).
Chart 4
However, given that the output gap is virtually closed, this bill combined with the infrastructure bill will add to inflationary pressures. The fiscal drag will diminish by 2024, not coincidentally the presidential election year 2024, not coincidentally the presidential election year. The deficit is not expected to increase or decrease substantially between 2023 and 2024. From then onward the budget deficit will expand. The increased government demand for goods and services and the increased disposable income for low-earning families will add to inflationary pressures. Other developed markets face a similar situation: inflation is picking up, but big spending has been promised and normalizing budgets will marginally weigh on growth in the next few years (Chart 5). True, growth should hold up since the private economy is rebounding in the wake of the pandemic. But politicians will not be inclined to renege on campaign promises of liberal spending in the face of fiscal drag. The current crop of leaders is primed to make major public investments. This is true of Germany, Japan, Canada, and Italy as well as the United States. It is partly true in France, where fiscal retrenchment has been put on hold given the presidential election in the spring. The effect will be inflationary, especially for the US where populist spending is more extravagant than elsewhere.
Chart 5
The long run will depend on structural factors and how much the new investments improve productivity. Bottom Line: A single vote in the US Senate could derail the president’s social spending bill, so the US is now the bellwether for fiscal fatigue in the developed world. Biden is likely to pass the bill, as global fiscal drag is disinflationary over the next 12 months. Yet inflation could stay elevated for other reasons. And this fiscal drag will dissipate later in the business cycle. Russia And Iran Gain Leverage Amid Energy Crunch The global energy price spike arose from a combination of structural factors – namely the pandemic and stimulus. It has abated in recent weeks but will remain a latent problem through the winter season, especially if La Niña makes temperatures unusually cold as expected. Rising energy prices feed into general producer prices, which are being passed onto consumers (Chart 6). They look to be moderating but the weather is unpredictable. There is another reason that near-term energy prices could spike or stay elevated: geopolitics. Tight global energy supply-demand balances mean that there is little margin of safety if unexpected supply disruptions occur. This gives greater leverage to energy producers, two of which are especially relevant at the moment: Russia and Iran. Russia’s long-running conflict with the West is heating up on several fronts, as expected. Russia may not have caused the European energy crisis but it is exacerbating shortages by restricting flows of natural gas for political reasons, as it is wont to do (Chart 7). Moscow always maintains plausible deniability but it is currently flexing its energy muscles in several areas: Chart 6Energy Price Depends On Winter ... And Russia/Iran!
Energy Price Depends On Winter ... And Russia/Iran!
Energy Price Depends On Winter ... And Russia/Iran!
Ukraine: Russia has avoided filling up and fully utilizing pipelines and storage facilities in Ukraine, where the US is now warning that Russia could stage a large military action in retaliation for Ukrainian drone strikes in the still-simmering Russia-Ukraine war. Belarus: Russia says it will not increase the gas flow through the major Yamal-Europe natural gas pipeline in 2022 even as Belarus threatens to halt the pipeline’s operation entirely. Belarus, backed by Russia, is locked in a conflict with Poland and the EU over Belarus’s funneling of migrants into their territory (Chart 8). The conflict could lead not only to energy supply disruptions but also to a broader closure of trade and a military standoff.1 Russia has flown two Tu-160 nuclear-armed bombers over Belarus and the border area in a sign of support. Moldova: Russia is withholding natural gas to pressure the new, pro-EU Moldovan government.
Chart 7
Chart 8
Russia’s main motive is obvious: it wants Germany and the EU to approve and certify the new Nord Stream II pipeline. Nord Stream II enables Germany and Russia to bypass Ukraine, where pipeline politics raise the risk of shortages and wars. Lame duck German Chancellor Angela Merkel worked with Russia to complete this pipeline before the end of her term, convincing the Biden administration to issue a waiver on congressional sanctions that could have halted its construction. However, two of the parties in the incoming German government, the Greens and the Free Democrats, oppose the pipeline. While these parties may not have been able to stop the pipeline from operating, Russia does not want to take any chances and is trying to force Germany’s and the EU’s hand. The energy crisis makes it more likely that the pipeline will be approved, since the European Commission will have to make its decision during a period when cold weather and shortages will make it politically acceptable to certify the pipeline.2 The decision will further drive a wedge between Germany and eastern EU members, which is what Russia wants. EU natural gas prices will likely subside sometime next year and will probably not derail the economic recovery, according to both our commodity and Europe strategists. A bigger and longer-lasting Russian energy squeeze would emerge if the Nord Stream II pipeline is not certified. This is a low risk at this point but the next six months could bring surprises. More broadly, the West’s conflict with Russia can easily escalate from here. First, President Vladimir Putin faces economic challenges and weak political support. He frequently diverts popular attention by staging aggressive moves abroad. There is no reason to believe his post-2004 strategy of restoring Russia’s sphere of influence in the former Soviet space has changed. High energy prices give him greater leverage even aside from pipeline coercion – so it is not surprising that Russia is moving troops to the Ukraine border again. Growing military support for Belarus, or an expanded conflict in Ukraine, are likely to create a crisis now or later. Second, the US-Germany agreement to allow Nord Stream II explicitly states that Russia must not weaponize natural gas supply. This statement has had zero effect so far. But when the energy shortage subsides, the EU could pursue retaliatory measures along with the United States. Of course, Russia has been able to weather sanctions. But tensions are already escalating significantly. After Russia, Iran also gains leverage during times of tight energy supplies. With global oil inventories drawing down, Iran is in the position to inflict “maximum pressure” on the US and its allies, a role reversal from the 2017-20 period in which large inventories enabled the US to impose crippling sanctions on Iran after pulling out of the 2015 nuclear deal (Chart 9). Iran is rapidly advancing on its nuclear program and a new round of diplomatic negotiations may only serve to buy time before it crosses the “breakout” threshold of uranium enrichment capability as early as this month or next. In a recent special report we argued that there is a 40% chance of a crisis over Iran in the Middle East. Such a crisis could ultimately lead to an oil shock in the Persian Gulf or Strait of Hormuz. Chart 9Now Iran Can Use 'Maximum Pressure'
Now Iran Can Use 'Maximum Pressure'
Now Iran Can Use 'Maximum Pressure'
Bottom Line: Russia’s natural gas coercion of Europe could keep European energy prices high through March or May. More broadly Russia’s renewed tensions with the West confirm our view that oil producers gain geopolitical leverage amid the current supply shortages. Iran also gains leverage and its conflict with the US could lead to global oil supply disruptions anytime over the next 12 months. Until Nord Stream II is certified and a new Iranian nuclear agreement is signed, there are two clear sources of potential energy shocks. Moreover in today’s inflationary context there is limited margin of safety for unexpected supply disruptions regardless of source. Xi’s Historical Rewrite China continues to be a major source of risk for the global economy and financial markets in the lead-up to the twentieth national party congress in fall 2022. While Chinese assets have sold off this year, global risk assets are still vulnerable to negative surprises from China. The five-year political reshuffle in 2022 is more important than usual since President Xi Jinping was originally supposed to step down but will instead stick around as leader for life, like China’s previous strongmen Mao Zedong and Deng Xiaoping.3 Xi’s rejection of term limits became clear in 2017 and is not really news. But Xi will fortify himself and his faction in 2022 against any opposition whatsoever. He is extremely vigilant about any threats that could disrupt this process, whether at home or abroad. The Communist Party’s sixth plenary session this week highlights both Xi’s success within the Communist Party and the sensitivity of the period. Xi produced a new “historical resolution,” or interpretation of the party’s history, which is only the third such resolution. A few remarks on this historical resolution are pertinent: Mao’s resolution: Chairman Mao wrote the first such resolution in 1945 to lay down his version of the party’s history and solidify his personal control. It is naturally a revolutionary leftist document. Deng’s revision of Mao: General Deng Xiaoping then produced a major revision in 1981, shortly after initiating China’s economic opening and reform. Deng’s interpretation aimed to hold Mao accountable for “gross mistakes” during the Cultural Revolution and yet to recognize the Communist Party’s positive achievements in founding the People’s Republic. His version gave credit to the party and collective leadership rather than Mao’s personal rule. Two 30-year periods: The implication was that the party’s history should be divided into two thirty-year periods: the period of foundations and conflict with Mao as the party’s core and the period of improvement and prosperity with Deng as the core. Jiang’s support of Deng: Deng’s telling came under scrutiny from new leftists in the wake of Tiananmen Square incident in 1989. But General Secretary Jiang Zemin largely held to Deng’s version of the story that the days of reform and opening were a far better example of the party’s leadership because they were so much more stable and prosperous.4 Xi’s reaction to Jiang and Deng: Since coming to power in 2012, Xi Jinping has shown an interest in revising the party’s official interpretation of its own history. The central claim of the revisionists is that China could never have achieved its economic success if not for Mao’s strongman rule. Mao’s rule and the Communist Party’s central control thus regain their centrality to modern China’s story. China’s prosperity owes its existence to these primary political conditions. The two periods cannot be separated. Xi’s synthesis of Deng and Mao: Now Xi has written himself into that history above all other figures – indeed the communique from the Sixth Plenum mentions Xi more often than Marx, Mao, or Deng (Chart 10). The implication is that Xi is the synthesis of Mao and Deng, as we argued back in 2017 at the end of the nineteenth national party congress. The synthesis consists of a strongman who nevertheless maintains a vibrant economy for strategic ends.
Chart 10
What are the practical policy implications of this history lesson? Higher Country Risk: China’s revival of personal rule, as opposed to consensus rule, marks a permanent increase in “country risk” and political risk for investors. Autocratic governments lack institutional guardrails (checks and balances) that prevent drastic policy mistakes. When Xi tries to step down there will probably be a succession crisis. Higher Macroeconomic Risk: China is more likely to get stuck in the “middle-income trap.” Liberal or pro-market economic reform is de-emphasized both in the new historical resolution and in the Xi administration’s broader program. Centralization is already suppressing animal spirits, entrepreneurship, and the private sector. Higher Geopolitical Risk: The return to autocracy and the withdrawal from economic liberalism also entail a conflict with the United States, which is still the world’s largest economy and most powerful military. The US is not what it once was but it will put pressure on China’s economy and build alliances aimed at strategic containment. Bottom Line: China is trying to escape the middle-income trap, like Taiwan, Japan, and South Korea, but it is trying to do so by means of autocracy, import substitution, and conflict with the United States. These other Asian economies improved productivity by democratizing, embracing globalization, and maintaining a special relationship with the United States. China’s odds of succeeding are low. China will focus on power consolidation through fall 2022 and this will lead to negative surprises for financial markets. China Slowdown: The Disinflationary Risk While it is very unlikely that Xi will face serious challenges to his rule, strange things can happen at critical junctures. Therefore the regime will be extremely alert for any threats, foreign or domestic, and will ultimately prioritize politics above all other things, which means investors will suffer negative surprises. The lingering pandemic still poses an inflationary risk for the rest of the world while the other main risk is disinflationary: Inflationary Risk – Zero COVID: The “Covid Zero” policy of attempting to stamp out any trace of the virus will still be relevant at least over the next 12 months (Chart 11). Clampdowns serve a dual purpose since the Xi administration wants to minimize foreign interference and domestic dissent before the party congress. Hence the global economy can suffer more negative supply shocks if ports or factories are closed. Inflationary Risk – Energy Closures: The government is rationing electricity amid energy shortages to prioritize household heating and essential services. This could hurt factory output over the winter if the weather is bad. Disinflationary Risk – Property Bust: The country is still flirting with overtightening monetary, fiscal, and regulatory policies. Throughout the year we have argued that authorities would avoid overtightening. But China is still very much in a danger zone in which policy mistakes could be made. Recent rumors suggest the government is trying to “correct the overcorrection” of regulatory policy. The government is reportedly mulling measures to relax the curbs on the property sector. We are inclined to agree but there is no sign yet that markets are responding, judging by corporate defaults and the crunch in financial conditions (Chart 12).
Chart 11
Chart 12China Has Not Contained Property Turmoil
China Has Not Contained Property Turmoil
China Has Not Contained Property Turmoil
Evergrande, the world’s most indebted property developer, is still hobbling along, but its troubles are not over. There are signs of contagion among other developers, including state-owned enterprises, that cannot meet the government’s “three red lines.” 5 Credit growth has now broken beneath the government’s target range of 12%, though money growth has bounced off the lower 8% limit set for this year (Chart 13). China is dangerously close to overtightening. China’s economic slowdown has not yet been fully felt in the global economy based on China’s import volumes, which are tightly linked to the combined credit-and-fiscal-spending impulse (Chart 14). The implication is that recent pullbacks in industrial metal prices and commodity indexes will continue. Chart 13China Tries To Avoid Over-Tightening
China Tries To Avoid Over-Tightening
China Tries To Avoid Over-Tightening
Chart 14China Slowdown Not Yet Fully Felt
China Slowdown Not Yet Fully Felt
China Slowdown Not Yet Fully Felt
Until China eases policy more substantially, it poses a disinflationary risk and a strong point in favor of the transitory view of global inflation. It is difficult for China to ease policy – let alone stimulate – when producer prices are so high (see Chart 6 above). The result is a dangerous quandary in which the government’s regulatory crackdowns are triggering a property bust yet the government is prevented from providing the usual policy support as the going gets tough. Asset prices and broader risk sentiment could go into free fall. However, the party has a powerful incentive to prevent a generalized crisis ahead of the party congress. So we are inclined to accept signs that property curbs and other policies will be eased. Bottom Line: The full disinflationary impact of China’s financial turmoil and economic slowdown has yet to be felt globally. Biden-Xi Summit Not A Game Changer As long as inflation prevents robust monetary and fiscal easing, Beijing is incentivized to improve sentiment in other ways. One way is to back away from the regulatory crackdown in other sectors, such as Big Tech. The other is to improve relations with the United States. A stabilization of US ties would be useful before the party congress since President Xi would prefer not to have the US interfering in China’s internal affairs during such a critical hour. No surprise that China is showing signs of trying to stabilize the relationship. The US is apparently reciprocating. Presidents Biden and Xi also agreed to hold a virtual bilateral summit next week, which could lead to a new series of talks. The US Trade Representative also plans to restart trade negotiations. The plan is to enforce the Phase One trade deal, issue waivers for tariffs that hurt US companies, and pursue new talks over outstanding structural disputes. The Phase One trade deal has fallen far short of its goals in general but on the energy front it is doing well. China will continue importing US commodities amid global shortages (Chart 15).
Chart 15
Chart 15
The summit alone will have a limited impact. Biden had a summit with Putin earlier this year but relations could deteriorate tomorrow over cyber-attacks, Ukraine, or Belarus. However, there is some basis for the US and China to cooperate next year: Iran. Xi is consolidating power at home in 2022 and probably wants to use negotiations to keep the Americans at bay. Biden is pivoting to foreign policy in 2022, since Congress will not get anything done, and will primarily focus on halting Iran’s nuclear program. If China assists the US with Iran, then there is a basis for a reduction in tensions. The problem is not only Iran itself but also that China will not jump to enforce sanctions on Iran amid energy shortages. And China is not about to make sweeping structural economic concessions to the US as the Xi administration doubles down on state-guided industrial policy. Meanwhile the US is pursuing a long-term policy of strategic containment and Biden will not want to be seen as appeasing China ahead of midterm elections, especially given Xi’s reversion to autocracy. What about cooperation on climate change? The US and China also delivered a surprise joint statement at the United Nations climate change conference in Scotland (COP26), confirming the widely held expectation that climate policy is an area of engagement. These powers and Europe have a strategic interest in reducing dependency on Middle Eastern oil (Chart 16). Climate talks will begin in the first half of next year. However, climate cooperation is not significant enough alone to outweigh the deeper conflicts between the US and China. Moreover climate policy itself is somewhat antagonistic, as the EU and US are looking at applying “carbon adjustment fees” to carbon-intensive imports, e.g. iron and steel exports from China and other high-polluting producers (Chart 17). While the EU and US are not on the same page yet, and these carbon tariffs are far from implementation, the emergence of green protectionism does not bode well for US-China relations even aside from their fundamental political and military disputes.
Chart 16
Bottom Line: Some short-term stabilization of US-China relations is possible but not guaranteed. Markets will cheer if it happens but the effect will be fleeting. Chinese assets are still extremely vulnerable to political and geopolitical risks.
Chart 17
Investment Takeaways Gold can still go higher. Financial markets are pricing higher inflation and weak real rates. Gold has been our chief trade to prepare both for higher inflation and geopolitical risk. We are closing our long value / growth equity trade for a loss of 3.75%. We are maintaining our long DM Europe / short EM Europe trade. This trade has performed poorly due to the rally in energy prices and hence Russian equities. But while energy prices may overshoot in the near term, investors will flee Russian equities as geopolitical risks materialize. We are maintaining our long Korea / short Taiwan trade despite its being deeply in the red. This trade is valid over a strategic or long-term time horizon, in which a major geopolitical crisis and/or war is likely. Our expectation that China will ease policy to stabilize the economy ahead of fall 2022 should support Korean equities. Matt Gertken Vice President Geopolitical Strategy mattg@bcaresearch.com Footnotes 1 Over the past year President Alexander Lukashenko’s repression of domestic unrest prompted the EU to impose sanctions. Lukashenko responded by organizing an immigration scheme in which Middle Eastern migrants are flown into Belarus and funneled into the EU via Poland. The EU is threatening to expand sanctions while Belarus is threatening to cut off the Yamal-Europe pipeline amid Europe’s energy crisis. See Pavel Felgenhauer, “Belarus as Latest Front in Acute East-West Standoff,” Jamestown Foundation, November 11, 2021, Jamestown.org. 2 Both Germany and the EU must approve of Nord Stream II for it to enter into operation. The German Federal Network Agency has until January 8, 2022 to certify the project. The Economy Ministry has already given the green light. Then the European Commission has two-to-four months to respond. The EU is supposed to consider whether the pipeline meets the EU’s requirement that gas transport be “unbundled” or separated from gas production and sales. This is a higher hurdle but Germany’s clout will be felt. Hence final approval could come by March 8 or May 8, 2022. The energy crisis will put pressure for an early certification but the EU Commission may take the full time to pretend that it is not being blackmailed. See Joseph Nasr and Christoph Steitz, “Certifying Nord Stream 2 poses no threat to gas supply to EU – Germany,” Reuters, October 26, 2021, reuters.com. 3 Xi is not serving for an “unprecedented third term,” as the mainstream media keeps reporting. China’s top office is not constant nor were term limits ever firmly established. Each leader’s reign should be measured by their effective control rather than technical terms in office. Mao reigned for 27 years (1949-76), Deng for 14 years or more (1978-92), Jiang Zemin for 10 years (1992-2002), and Hu Jintao for 10 years (2002-2012). 4 See Joseph Fewsmith, “Mao’s Shadow” Hoover Institution, China Leadership Monitor 43 (2014), and “The 19th Party Congress: Ringing In Xi Jinping’s New Age,” Hoover Institution, China Leadership Monitor 55 (2018), hoover.org. 5 Liability-to-asset ratios less than 70%, debt-to-equity less than 100%, and cash-to-short-term-debt ratios of more than 1.0x. Strategic View Open Tactical Positions (0-6 Months) Open Cyclical Recommendations (6-18 Months) Open Trades & Positions
Image
Dear client, This week, we are introducing our new “Currency Month-In-Review” report. The new format should dovetail nicely with the historical back sections you have become accustomed to, but with a more holistic approach to interpreting data releases, along with actionable investment advice. We would appreciate any comments, criticisms, and feedback to help us better serve you. Kind regards, The Foreign Exchange Strategy team Highlights The DXY index has broken above our 95-threshold level. As a momentum currency, the prospect for further gains in the near term are high. That said, we are sticking with our longer-term (12-18 month) bearish view. Most of the catalysts propping the dollar in the near-term should reverse. The Fed will continue to lag the inflation curve, and economic growth will rotate from the US to other economies that are getting their populations vaccinated. Both are dollar bearish. Speculative positioning in the dollar is now approaching extremes. This warns against establishing fresh long positions. Amidst the volatility in currency markets, trading opportunities are emerging. This week, we are initiating a limit-buy on EUR/CHF trade at 1.05. Feature The latest CPI report from the US was strong, taking markets much by surprise. In the currency world, the spread between the 3-month Eurodollar and Euribor interest rate shot up, pushing up the dollar (Chart 1). December 2022 Eurodollar futures are now pricing in a much faster pace of rate hikes than they did earlier this year. This helped cement the dollar as king this year (Chart 2). Chart 1The Dollar And Interest Rates
The Dollar And Interest Rates
The Dollar And Interest Rates
Chart 2AThe Strength In The DXY Is Not Fully Justified By The Economic Picture
The Strength In The DXY Is Justified By The Economic Picture
The Strength In The DXY Is Justified By The Economic Picture
Chart 2BThe Strength In The DXY Is Not Fully Justified By The Economic Picture
The Strength In The DXY Is Justified By The Economic Picture
The Strength In The DXY Is Justified By The Economic Picture
Chart 2CThe Strength In The DXY Is Not Fully Justified By The Economic Picture
The Strength In The DXY Is Justified By The Economic Picture
The Strength In The DXY Is Justified By The Economic Picture
Chart 2DThe Strength In The DXY Is Not Fully Justified By The Economic Picture
The Strength In The DXY Is Justified By The Economic Picture
The Strength In The DXY Is Justified By The Economic Picture
Economic data has also been moving in favor of the US of late. The economic surprise index in the US is at 19, while in the eurozone and Japan, it is at -50 and -73.9, respectively. From a broader perspective, the recovery in the services PMI in the US had been more robust than most other developed economies. That said, there are also signs that US economic momentum is giving way to other countries. The US is likely to be the first country to close its output gap, and commensurately, inflation is surprising to the upside (Chart 3). Wage growth has also inflected higher. This is raising the prospect that inflation might be more of a genuine concern. For many other countries, surging house prices are threatening financial stability. In New Zealand, the central bank now has a mandate to consider house prices when calibrating policy. Chart 3AThe US Is Generating Genuine Inflation. This Is Depressing Real Rates
The US Is Generating Genuine Inflation. This Is Depressing Real Rates
The US Is Generating Genuine Inflation. This Is Depressing Real Rates
Chart 3BThe US Is Generating Genuine Inflation. This Is Depressing Real Rates
The US Is Generating Genuine Inflation. This Is Depressing Real Rates
The US Is Generating Genuine Inflation. This Is Depressing Real Rates
Chart 3CThe US Is Generating Genuine Inflation. This Is Depressing Real Rates
The US Is Generating Genuine Inflation. This Is Depressing Real Rates
The US Is Generating Genuine Inflation. This Is Depressing Real Rates
Chart 3DThe US Is Generating Genuine Inflation. This Is Depressing Real Rates
The US Is Generating Genuine Inflation. This Is Depressing Real Rates
The US Is Generating Genuine Inflation. This Is Depressing Real Rates
The key point is that many central banks have already withdrawn accommodation ahead of the Fed, which puts the recent dollar rally into question. QE has ended in Canada and New Zealand. Norway and New Zealand have hiked interest rates. Forward curves suggest that most central banks should continue to withdraw accommodation. The key question is whether the Fed turns more hawkish that what is already priced in, or disappoints market expectations. We side with the latter. In the meantime, real rates continue to remain deeply negative in the US. With negative real rates and a deteriorating trade balance, the US will need to significantly raise interest rates to attract portfolio investment. For the US, portfolio investment has mostly been in the form of equity purchases rather than bond flows (Chart 4) and Chart 5). But even an increase in the US 10-year yield to 2.25% will keep real interest rates low. In the following sections, we look at the latest economic releases and provide our assessment of the impact going forward on various currencies. Chart 4AThe Fed Could Disappoint Market Expectations
The Fed Could Disappoint Market Expectations
The Fed Could Disappoint Market Expectations
Chart 4BThe Fed Could Disappoint Market Expectations
The Fed Could Disappoint Market Expectations
The Fed Could Disappoint Market Expectations
Chart 4CThe Fed Could Disappoint Market Expectations
The Fed Could Disappoint Market Expectations
The Fed Could Disappoint Market Expectations
Chart 4
Chart 5AThe US Trade Deficit Needs To Be Financed Externally
The US Trade Deficit Needs To Be Financed Externally
The US Trade Deficit Needs To Be Financed Externally
Chart 5BThe US Trade Deficit Needs To Be Financed Externally
The US Trade Deficit Needs To Be Financed Externally
The US Trade Deficit Needs To Be Financed Externally
Chart 5CThe US Trade Deficit Needs To Be Financed Externally
The US Trade Deficit Needs To Be Financed Externally
The US Trade Deficit Needs To Be Financed Externally
Chart 5DThe US Trade Deficit Needs To Be Financed Externally
The US Trade Deficit Needs To Be Financed Externally
The US Trade Deficit Needs To Be Financed Externally
US Dollar The last month has seen US economic data outperform that of its peers. Within the G10, the Citigroup economic surprise index is much higher in the US (+19), than say, the euro area (-50) or Japan (-74). This has supported the DXY, which is up almost 1% over the last month. For risk-management purposes, we are turning neutral on the DXY in the near term, even though our longer-term view remains bearish. The two most important releases in the US over the last month were the jobs report and this week’s CPI report. Nonfarm payrolls increased by 531,000 jobs and unemployment fell to 4.6% in October. This is inching closer to NAIRU. Meanwhile, headline CPI came in at 6.2% year-on-year in September while core inflation came in at 4.9%, the highest for several decades. This is occurring within the context of accelerating wage growth (unit labor costs in the nonfarm business sector surged 8.3% in Q3), higher house prices, and an ebullient stock market, reinforcing the wealth effect. That said, strong domestic demand in the US will have to trigger a much more hawkish Fed for the dollar to reach escape velocity. This is because it will push real interest rates lower as it inflates the US current account deficit. The trade deficit grew 11.2% in September, the sharpest monthly increase since July of 2020. Equity portfolio flows, which have been sustaining the trade deficit, are softening of late. Bond portfolio flows will need a much weaker dollar, or higher Treasury yields, to accelerate. Against such a backdrop, the Fed recently announced a “dovish taper” by reducing the monthly pace of its asset purchases by $15 billion, with the tapering expected to be completed by mid-2022. No imminent rate hike was signaled. The market is likely to continue to challenge such a dovish stance, which will put near-term upward pressure on the dollar, until inflation eventually rolls over. From a relative standpoint, the Fed is lagging many other major developed market central banks in normalizing monetary policy. We are sticking to our long-term bearish view on the dollar index, but a more proactive Fed is a risk to this view. We are upgrading our near-term outlook on the dollar to neutral. Chart 6AUS Dollar
US Dollar
US Dollar
Chart 6BUS Dollar
US Dollar
US Dollar
Euro The euro has been breaking down in recent sessions and is the main cause of the surge in the DXY index. The euro is down 0.7% over the last month and is currently at 1.145. The key catalyst for the weakness in the euro is the perception that the ECB will severely lag the Fed in normalizing policy settings. This is occurring within the context of surging inflation in the euro area. Headline CPI came in at 4.1% in October, above expectations of 3.7% and well above September’s 3.4% print. The is dampening real rates in the entire eurozone. On the flip side, there is credence to the ECB’s dovish stance given that unemployment is still above NAIRU and eurozone wage growth remains very tepid. On the economy, the recent improvement in both the Sentix and ZEW expectations bode well for euro area activity. Lower real rates have been the proximate driver of a soft euro in recent trading sessions. That said, real rates could improve if inflation proves transitory. The energy component of the CPI was up 23% year-on-year, by far the biggest contributor to the headline print. Any sign that the ECB is tilting towards a more hawkish direction will initially materialize in the form of reduced asset purchases. This would curtail the significant portfolio outflows from the eurozone this year. From a positioning standpoint, speculative long positions in the euro have also been liquidated, which provides some footing for the currency. We are maintaining a neutral stance on the euro in the very near term, with a bias to buy on weakness. Chart 7AEuro
Euro
Euro
Chart 7BEuro
Euro
Euro
Japanese Yen JPY is the worst-performing currency this year and it is also one of the most shorted. Over the last month, the yen is down 0.4%. Japan is just now emerging from the pandemic, having vaccinated most of its population. Ergo, the economic surprise index, which currently sits at -74, could stage a powerful rebound. While both the inflation print and employment data were in line with expectations (the unemployment rate came in at 2.8% in September), there were other encouraging signs. In October, the Eco Watcher’s Survey rose from 42.1 to 55.5, the manufacturing PMI rose from 51.5 to 53.2, and machine tool orders accelerated 81.5% year-on-year. The Bank of Japan kept monetary policy unchanged at its latest meeting. The policy stance of the BoJ remains dovish, with little prospect of any interest rate increase until 2025. Therefore, in an environment where interest rates rise, that will hurt the yen at the margin. That said, the underperformance of Japanese assets is attracting portfolio inflows, especially from equity investors. As we wrote last week, the underperformance of certain Japanese equity sectors has not been fully justified by the improving earnings picture. From a valuation standpoint, the yen is the cheapest G10 currency according to our PPP models, and it is also quite cheap according to our intermediate-term timing model. Therefore, even given the breakout in the DXY index, we are maintaining our near-term positive for the yen. Chart 8AJapanese Yen
Japanese Yen
Japanese Yen
Chart 8BJapanese Yen
Japanese Yen
Japanese Yen
British Pound As a high-beta currency, sterling has been one of the victims of dollar strength. GBP is down 1.6% over the last month. The biggest driver was the volte-face from the BoE. The BoE kept rates on hold despite their seemingly hawkish messaging weeks ahead of the MPC meeting. Gilt yields fell along with the pound. Following the expiry of the furlough scheme in September, the central bank is waiting to the see the potential impact on the labor market before curtailing accommodation. Hence, a hike in December is still on the table. Incoming data continues to strengthen the case for the BoE to tighten policy. CPI is at 3.5%, with the transport and housing sectors continuing to see surging prices. At 4.5%, the unemployment rate is at NAIRU. Wages are also inflecting higher. The latest GDP report (Q3 GDP rose 6.6% year-on-year) continues to suggest the UK economy maintains upward momentum. The October manufacturing PMI rose from 57.1 to 57.8. Near term, the pound could continue to face weakness as speculators liquidate positions and capital inflows soften. This is especially the case as the post-Brexit environment remains quite volatile. As a play on this trend, we are tactically long EUR/GBP. However, we remain bullish sterling on a cyclical horizon as real rates should continue to normalize. Chart 9ABritish Pound
British Pound
British Pound
Chart 9BBritish Pound
British Pound
British Pound
Australian Dollar The Australian dollar is down 0.8% over the last month, as both a stronger dollar and lower iron ore prices exert downward pressure on the exchange rate. The biggest developments over the last few weeks in Australia were the CPI report and the RBA policy meeting. The Q3 print for CPI was 3%, the upper bound of the central bank’s target range, with the trimmed-mean and weighted-median figure coming in at 2.1%. This helped justify the RBA’s decision to abandon the 0.1% yield target on the April 2024 bond. That said, the central bank maintained its cash rate target of 0.1% until earliest 2023 and left the pace of asset purchases unchanged. The RBA trimmed its forecast for GDP for this year to 3% from 4% and said more than 50% of jobs were currently experiencing little to no wage growth. Wages grew just 1.7% in the year to June, far below the 3%-plus levels the RBA believes is necessary to keep inflation sustainably within the 2%-3% band and trigger a rate hike. Hence, the release of the Q3 wage price index, on November 17, will be closely watched. Any upward surprise can challenge the RBA’s measured projections. The bearish case for the Aussie is well known, with speculative positioning near a record short. That said, real yields in Australia have been improving and portfolio flows are accelerating, especially into the mining and energy sectors, which are benefiting from a terms-of-trade tailwind. This sets the stage for a coil-spring rebound in the Aussie. Meanwhile, the AUD is cheap, especially on a terms-of-trade basis. At the crosses, we are long AUD/NZD as a play on these trends. From a tactical standpoint, we are neutral the Aussie, but will buy outright at 70 cents. Chart 10AAustralian Dollar
Australian Dollar
Australian Dollar
Chart 10BAustralian Dollar
Australia Dollar
Australia Dollar
New Zealand Dollar The New Zealand dollar is up 1.3% over the last month. New Zealand’s economy is firing on all cylinders. CPI accelerated sharply from 3.3% to 4.9% in Q3, well above the RBNZ’s target band of 1%-3%, and behind only that of the US. The unemployment rate fell to 3.4% in Q3, far lower than the 3.9% forecasted by economists polled by Reuters. Wage growth was strong in the quarter with the private sector labor cost index registering a 0.7% lift. The seasonally adjusted employment number jumped 2.0% on the quarter, beating expectations of a 0.4% increase. The participation rate also rose to 71.2%, higher than the 70.6% forecast. Meanwhile, house prices continue to move higher, especially in Wellington. As a result, the RBNZ has been one of the most hawkish G10 central banks, hiking rates last month for the first time in seven years to 0.5%. Another 0.25% hike is likely at the November 24 meeting. Meanwhile, at 2.6%, New Zealand currently has the highest G10 10-year bond yield. This is bullish for the kiwi. The one caveat is that the Covid-19 situation in New Zealand continues to deteriorate, which could be a catalyst for a pause. Portfolio flows into New Zealand have turned negative in recent quarters. The equity market, which is quite expensive, has underperformed and the currency is overvalued according to our models, which has dampened the appeal of higher yields. We continue to believe the NZD will fare well cyclically, but hawkish expectations from the RBNZ are already priced in. This provides room for disappointment. Chart 11ANew Zealand Dollar
New Zealand Dollar
New Zealand Dollar
Chart 11BNew Zealand Dollar
New Zealand Dollar
New Zealand Dollar
Canadian Dollar The CAD is the best-performing currency this year, even though it is down 1% over the last month. The key driver of the CAD in recent weeks remains the outlook for monetary policy, and the path of energy prices. CPI inflation came in at 4.4% year-on-year for September, beating market expectations and among the highest across the G10. The CPI-trim hit 3.4% year-on-year. With all eight major components of the CPI rising year-over-year, upward price pressures are broad-based. The housing market also appears bubbly, all providing fertile ground for tighter monetary settings. At first blush, the October employment report was disappointing, with only 31,000 jobs added. However, employment in Canada is already above pre-pandemic levels and is likely to now settle towards trend growth of around 2%. This suggests a print of 30,000 - 40,000 jobs, in line with October’s release. The unemployment rate continues to drop, hitting 6.7%. Incoming data justified the Bank of Canada’s policy response. It delivered a hawkish surprise announcing an end to its quantitative easing program and shifting to the reinvestment phase whereby its holdings of Canadian government bonds will be held constant. It also brought forward the first rate hike to Q2 2022. The BoC will marginally diverge from the US Fed, which is expected to keep rates unchanged through most of next year. This will continue to boost real rates in Canada. Meanwhile, net purchases of Canadian securities continue to inflect higher, as the commodity sector benefits from a terms-of-trade boom. That said, from a tactical standpoint, speculators are marginally long the CAD. As such, our near-term view is cautious. We however doubt the CAD will significantly break below 78 cents, given burgeoning tailwinds. Chart 12ACanadian Dollar
Canadian Dollar
Canadian Dollar
Chart 12BCanadian Dollar
Canadian Dollar
Canadian Dollar
Swiss Franc The Swiss franc is up 1% against the dollar over the last month. EUR/CHF has also been very weak in recent trading sessions, constantly testing the 1.054 level. In our view, this has been much more due to euro weakness (see euro section above) than franc strength. The Swiss franc is trading near 11-month highs versus the euro. On the economic front, the labor market is improving and inflation in Switzerland is picking up. House prices have also risen quite robustly. This is lessening the need for the central back to maintain ultra-accommodative settings. That said, the Swiss National Bank is likely to lag the rest of the G10 in lifting rates from -0.75%, currently the lowest benchmark interest rate in the world. This suggests that market pricing of a 25 basis-point rate rise by the SNB by the end of 2022 is misplaced. Inflation would have to rise substantially more - above the SNB's target range of less than 2% - before any hike is possible. The SNB has also said it remained ready to intervene to weaken a highly valued Swiss franc. The ECB’s dovish stance is one reason why the SNB will be loath to let the currency appreciate. Our guess is that the 1.05 level provides a near-term line in the sand, which will prompt the SNB to intervene. We would be buyers of EUR/CHF below 1.05. Chart 13ASwiss Franc
Swiss Franc
Swiss Franc
Chart 13BSwiss Franc
Swiss Franc
Swiss Franc
Norwegian Krone The Norwegian krone has violently sold off in recent weeks, prompting our long Scandinavian basket to be stopped out. This has been mostly due to low liquidity and the high-beta nature of the krone. Norway’s central bank kept interest rates on hold at its latest meeting but reiterated it will likely hike its key rate by 25 basis points to 0.5% in December. The central bank noted that the economic recovery pushed activity back to pre-pandemic levels, while unemployment receded further. That said, underlying inflation still runs below the bank’s target. The recent surge in oil prices has provided strong support for Norway’s trade balance and terms of trade. Oil and gas make up around 18% of Norway’s GDP. This is encouraging portfolio flows and has provided underlying support for the NOK. That said, given that much of the Norges Bank’s hawkishness has likely been priced into the NOK, the rewards of going long the currency should start shifting to its carry. Chart 14ANorwegian Krone
Norwegian Krone
Norwegian Krone
Chart 14BNorwegian Krone
Norwegian Krone
Norwegian Krone
Swedish Krona The SEK was up 0.9% over the last month. Sweden never closed its economy, yet Covid-19 still had an impact. The good news is that this is mostly behind them. GDP expanded by 1.8% on the quarter in Q3, beating forecasts and the country recently ended all pandemic curbs. The labor market is recovering, and inflation is rising. CPIF inflation, on which the Riksbank sets its 2% target, is at 2.8%. Surging energy prices should turn out to be less of a problem for Sweden than the more coal-dependent countries in Europe, suggesting any increase in prices will be more genuine. The Riksbank will complete its planned balance-sheet expansion later this year and has committed to maintaining the size of its bond holdings through 2022. The central bank, one of the most dovish amongst the G10, is slated to keep its policy rate flat at least until 2024. This could change if inflationary pressures remain persistent. The big risk for Sweden is a slowdown in Europe and China. Supply chain bottlenecks are another issue. Several Swedish car and truck makers were forced to halt production in August due to semiconductor shortages. With the recent surge in the dollar, we were stopped out of our short EUR/SEK and USD/SEK positions for a profit. We will be looking to reinstate these trades from higher levels. Chart 15ASwedish Krona
Swedish Krona
Swedish Krona
Chart 15BSwedish Krona
Swedish Krona
Swedish Krona
Chester Ntonifor Foreign Exchange Strategist chestern@bcaresearch.com Kate Sun Research Analyst kate.sun@bcaresearch.com Trades & Forecasts Strategic View Cyclical Holdings (6-18 months) Tactical Holdings (0-6 months) Limit Orders Forecast Summary
Rising inflationary pressures are seeping into Aussie inflation expectations which according to the Melbourne Institute reached 4.6% in November. Nevertheless, the RBA pushed back against market rate hike expectations at last week’s meeting. Instead, it…
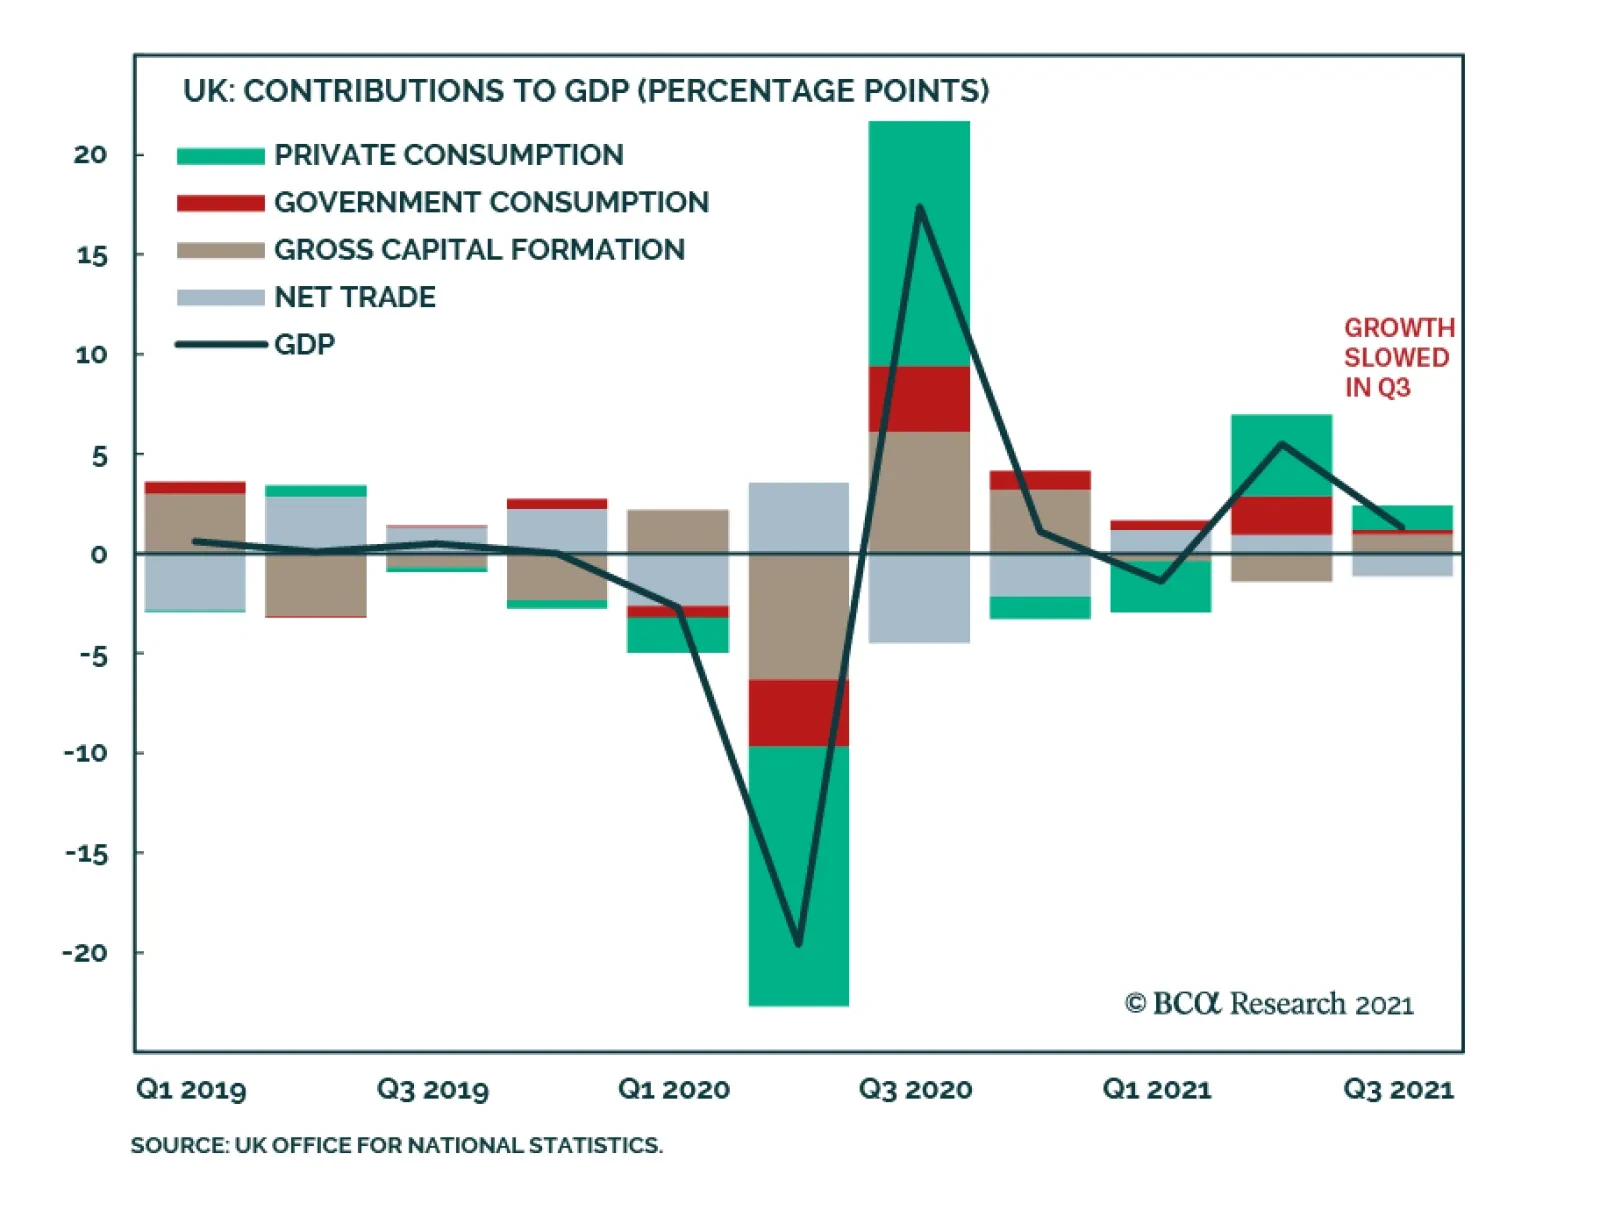
The UK economy decelerated in Q3 with the GDP print falling below expectations. Economic growth slowed from 5.5% to 1.3% q/q versus an anticipated 1.5% rate. Similarly, year-over-year growth moderated to 6.6% from 23.6%. However, the month-on-month momentum…
Highlights Fed/BoE: Both the Fed and the Bank of England found ways to talk down 2022 rate hike expectations discounted in US and UK bond markets. This is only a temporary reprieve, however, as the near-term uncertainties over the persistence of cost-push inflation will eventually be overwhelmed by medium-term certainties of demand-pull inflation confirmed by tightening labor markets. Stay underweight US Treasuries and UK Gilts in global bond portfolios. US Treasury Curve: Longer-term US Treasury yields are priced too low relative to the likely peak in the fed funds rate in the next cycle. Position for a steeper US Treasury curve until Fed rate hikes are imminent, which will likely not be until Q4/2022. Feature Chart of the WeekShifting Rate Expectations Driving Bond Yields As QE Fades
Shifting Rate Expectations Driving Bond Yields As QE Fades
Shifting Rate Expectations Driving Bond Yields As QE Fades
Bond market uncertainty about future monetary policy moves is on the rise. Bond volatility has picked up, most notably at the front end of yield curves that are most sensitive to rate hike expectations which have been intensifying. Yet last week, the Federal Reserve and Bank of England (BoE) were able to talk bond investors off the ledge – at least, temporarily - by pushing back against expectations of multiple rate hikes in the US and UK in 2022. Central bankers in those countries are stuck in a difficult spot. Inflation is high enough to warrant some tightening of monetary policy. Yet there are lingering concerns over how long the current upturn in global inflation will last. Meanwhile, there are just enough questions on the underlying pace of economic momentum to require policymakers to see more data, especially in labor markets, before feeling comfortable enough to pull the trigger on actual rate hikes. We now see that happening first in the UK early next year, and in the US in late 2022. One thing that is certain is that the ups and downs of interest rate expectations – and the central bank forward guidance that influences them – will increasingly become the more dominant driver of bond yields and yield curve shape as global pandemic bond-buying programs get wound down (Chart of the Week). On that front, we see more potential for bond-bearish steepening in the UK and US over the next several months. The BoE: Another Bad Date With The Unreliable Boyfriend The UK financial press infamously dubbed the BoE “the unreliable boyfriend”, under the leadership of former Governor Mark Carney, for hinting at interest rate increases that never materialized. At last week’s Monetary Policy Committee (MPC) meeting, rates were kept unchanged in a 7-2 vote despite some intense signaling in recent weeks that a rate hike was imminent. Under current BoE Governor Andrew Bailey, this edition of the MPC is more like an indecisive spouse than unreliable boyfriend. On the one hand, there is a clear overshoot of UK inflation (and inflation expectations) that would justify a rate hike as soon as possible (Chart 2). The BoE’s new economic forecasts presented in the November Monetary Policy Report (MPR) called for headline CPI inflation to reach a peak of 5% in April 2022 – significantly higher than the 4% late-2021 forecast from the August MPR. On the other hand, high current inflation is already having a dampening effect on economic sentiment. The GfK index of UK consumer confidence is down -10% from the peak seen in July, despite diminishing concerns over COVID seen in public opinion polls (Chart 3, middle panel). A similar divergence is evident in the BoE’s Decision Maker Panel survey of UK Chief Financial Officers, which showed that uncertainty over future sales was somewhat elevated compared to diminished concerns about COVID and Brexit (bottom panel). Chart 2Fed/BoE Cannot Stay Dovish For Much Longer
Fed/BoE Cannot Stay Dovish For Much Longer
Fed/BoE Cannot Stay Dovish For Much Longer
Chart 3High UK Inflation Raises Growth Uncertainty
High UK Inflation Raises Growth Uncertainty
High UK Inflation Raises Growth Uncertainty
The BoE highlighted these divergences in economic sentiment series in the November MPR as examples of how high inflation, fueled by global supply chain disruptions and soaring energy prices, introduced uncertainty into the central bank’s forecasts. Even more uncertainty exists in the BoE’s ability to assess the amount of spare capacity, and underlying inflationary pressure, in the UK economy. The BoE dedicated a 9-page section of the November MPR to a discussion about estimating the growth of the supply-side of the UK economy, evidence of how difficult that process has become during the COVID era. The BoE concluded that the pandemic would end up reducing the level of UK potential supply by -2% from pre-COVID levels, even though the growth rate would return to a pre-pandemic pace of around 1.5% by 2023-24. This is a combination that makes setting monetary policy tricky. Reduced supply indicates that the UK economy has a smaller output gap with more inflationary pressure that would require higher interest rates. Yet sluggish growth in potential supply implies that the UK equilibrium interest rate is likely still very low, thus the BoE would not have to raise rates much to get policy back to neutral. This uncertainty over the size of the output gap in the UK economy will force to BoE to focus more on the labor market as the best “real-time” measure of spare capacity. On that front, the evidence is also difficult to interpret. The UK unemployment rate fell to 4.5% over the three months to August, the last available data before the UK government’s COVID furlough schemes, which protected worker incomes hit by COVID job losses, ended on September 30. The UK Office of National Statistics estimates that there were between 900,000 and 1.4 million UK workers furloughed in late September, representing a significant source of labor supply to be absorbed when the government income assistance ends. Thus, the BoE would need to see at least a month or two of post-furlough employment reports – not just job growth, but labor force participation - to assess how quickly those workers were being reabsorbed into the UK labor market. By the BoE’s own estimates, the impact of the furlough schemes, combined with the compositional issues arising from pandemic job losses being borne more by lower-wage workers, boosted UK wage growth by 2.2% (Chart 4, bottom panel). “Underlying” wage growth, net of those effects, is 0.6%, above the pre-COVID peak, suggesting a tightening labor market before the return of furloughed workers to the labor force. In the end, we see the BoE’s November non-hike as nothing more than a delay of the inevitable. While a December hike is possible, this would represent a “double tightening” of monetary policy with the current BoE quantitative easing program set to expire at year-end. The more likely date for a rate hike is now February. This would give the MPC a few months of post-furlough labor data to assess the amount of spare capacity in UK labor markets. We expect the data to show enough underlying health in labor demand relative to supply for the BoE to conclude that accelerating wage growth represents a more sustainable form of UK inflation in 2022 than energy prices or supply-chain disruptions were in 2021, justifying a move to begin hiking rates. We continue to recommend positioning for a steeper UK Gilt curve, focused on longer-maturities where yields were too low relative to even a moderate future BoE rate hike cycle (Chart 5). We entered a new tactical butterfly spread trade last week, going long the 10-year Gilt bullet versus a duration-neutral 7-year/30-year barbell – we continue to like that trade as a way to play for eventual BoE rate hikes in the first half of 2022. Chart 4BoE Needs More Employment Data To Confirm Wage Uptrend
BoE Needs More Employment Data To Confirm Wage Uptrend
BoE Needs More Employment Data To Confirm Wage Uptrend
Chart 5Stay In UK Long-End Gilt Curve Steepeners
Stay In UK Long-End Gilt Curve Steepeners
Stay In UK Long-End Gilt Curve Steepeners
Bottom Line: The Bank of England is still on a path to begin rate hikes, either in December or, more likely, February of next year. Stay underweight UK Gilts. Position For A Steeper US Treasury Curve The Fed announced last week that tapering would begin right away in November, in a move that has been hinted at since the summer. The monthly pace of purchases of Treasuries and Agency MBS will decline by $10 billion and $5 billion, respectively in November and also December. The Fed declined to commit to any specific tapering amounts beyond that, although it seems likely that the same monthly pace of reduction will continue in 2022. This would take the buying of Treasuries and MBS, net of maturing debt, to zero by June of next year, clearing the first necessary hurdle before the FOMC could contemplate a hike in the funds rate. A completion of the taper by June has been hinted at in the speeches of several Fed officials in recent weeks. This is a bit faster than the expected pace of tapering seen in the most recent New York Fed Primary Dealer and Market Participant Surveys from September (Chart 6), but should not be categorized as a hawkish surprise. There were also few bond-bearish signals on future policy moves hinted at by Fed Chair Jay Powell in post post-FOMC meeting press conference.
Chart 6
Chart 7Upside Risk To UST Yields From A Tightening Labor Market
Upside Risk To UST Yields From A Tightening Labor Market
Upside Risk To UST Yields From A Tightening Labor Market
Powell did note that it was still not clear how long the current supply chain/commodity price driven surge in inflation would persist into next year. The expectation, however, was that these forces would eventually subside and allow US inflation to return back to levels much closer to the Fed’s 2% target. Given the uncertainties in the timing of that peak and decline in US inflation, the Fed has limited ability to calibrate any post-taper rate hikes by focusing solely on inflation - especially with longer-term inflation expectations still at levels consistent with the Fed’s target. The Fed will continue to look at US labor market developments to determine the timing and pace of future rate hikes. The last set of FOMC economic projections compiled for the September meeting have the US unemployment rate falling to 3.8% next year, below the median FOMC estimate of full employment at 4%, with one 25bp rate hike penciled in for 2022. We can use that as a baseline assumption on what the Fed considers to be the level of “maximum employment” that would need to be reached before rate hikes could begin. The US unemployment rate fell to 4.6% in October, thus there is still some more to go before hitting that 3.8% rate hike threshold. Yet among the FOMC members, the estimates of full employment range from 3.5%-4.5%, so the October print did knock on the door of that range (Chart 7, middle panel). With US wage growth already showing signs of breaking out – the Atlanta Fed Wage Tracker hit a 14-year high of 14% in September (bottom panel), while the Employment Cost Index rose by a record quarterly pace of 1.3% in Q3 – the Fed will likely be under a lot of pressure to begin hiking rates soon after the taper is expected to end next June. Chart 8UST Curve Forwards Too Flat Vs. Likely Fed Rate Hikes
UST Curve Forwards Too Flat Vs. Likely Fed Rate Hikes
UST Curve Forwards Too Flat Vs. Likely Fed Rate Hikes
We still see December 2022 as the most likely liftoff date, although a faster decline in unemployment could move that timetable forward. The bigger issue for the US Treasury market, however, is not the timing of liftoff but how fast the pace of hikes will be afterward. On that note, future rate expectations are still far too low. For example, according to the New York Fed’s Primary Dealer Survey, the fed funds rate is expected to average only 1.7% over the next ten years (top panel), a level that has proved to be a ceiling for the 10-year Treasury yield so far in 2021. Our colleagues at BCA Research US Bond Strategy recently made the case for expecting the US Treasury curve to bearishly steepen in the coming months. In their view, longer-maturity Treasury yield forward rates were too low compared to a fair value determined by the likely path for the funds rate that assumes rate hikes start in December of next year and rise by 100bps per year to a terminal rate of 2.08% (Chart 8). Interestingly, 2-year Treasury forward rates were in line with the projections of our US Bond Strategy team’s fair value framework. We fully agree with our US Bond colleagues on the likelihood of future Treasury curve steepening. This fits with our views on many developed market countries, not just the US, where longer-maturity bond yields were pricing in too few future rate hikes relative to what was likely to occur over the next few years. Even when taking a much longer perspective, the US Treasury curve looks too flat right now. Going back to the mid-1980s, the current 2-year/10-year US Treasury curve slope of just over 100bps has never been reached (in a flattening move) in the absence of actual Fed rate hikes (Chart 9). Chart 9UST Curve Has Never Been This Flat Without Some Actual Fed Rate Hikes
UST Curve Has Never Been This Flat Without Some Actual Fed Rate Hikes
UST Curve Has Never Been This Flat Without Some Actual Fed Rate Hikes
This week, we are adding a new trade to our Tactical Overlay table to benefit from this expected move in the US yield curve, a US Treasury 2-year/10-year curve steepener (combined with a position in cash, or US 3-month treasury bills, to make the entire trade duration-neutral). We are also taking profits on our previous Tactical US curve flattening trade, which has returned 0.84% since initiation back in June. The exact securities and weightings for our new trade can be found in the Tactical Overlay Trades table below. Bottom Line: Longer-term US Treasury yields are priced too low relative to the likely peak in the fed funds rate in the next cycle. Position for a steeper US Treasury curve until Fed rate hikes are imminent, which will likely not be until Q4/2022. Robert Robis, CFA Chief Fixed Income Strategist rrobis@bcaresearch.com Recommendations Duration Regional Allocation Spread Product Tactical Overlay Trades GFIS Model Bond Portfolio Recommended Positioning Active Duration Contribution: GFIS Recommended Portfolio Vs. Custom Performance Benchmark
Image
The GFIS Recommended Portfolio Vs. The Custom Benchmark Index
Highlights Fed: Chair Powell’s remarks after the November FOMC meeting suggest that the Fed will not panic and move quickly toward tightening in the face of high inflation. Rather, the Fed will stay the course and will only lift rates once its “maximum employment” liftoff trigger is met. We continue to expect Fed liftoff in December 2022. Nominal Treasuries: We project that Treasury securities will still deliver negative total returns, even if Fed liftoff is delayed until December 2022. Investors can protect returns by favoring the 2-year note (long 2yr over cash/10yr barbell) and 20-year bond (long 20yr over 10yr/30yr barbell). TIPS: Investors should short 2-year TIPS outright in anticipation of falling short-dated inflation expectations during the next 12 months. The Taper Is Done, Now Onto Liftoff The Fed announced a tapering of its asset purchases last week and the details of the tapering plan were consistent with what had already been signaled to the public. The Fed will purchase $70 billion of Treasuries this month (compared to $80 billion in October) and $35 billion of agency MBS (down from $40 billion in October). It will then reduce monthly Treasury and MBS purchases by $10 billion and $5 billion each month, respectively, until it reaches net zero asset purchases by June of next year (Chart 2). The Fed didn’t give specific guidance on what will happen with the balance sheet after June, but it’s highly likely that it will follow the pattern of the last tightening cycle and keep the balance sheet flat for a long time, until the fed funds rate is well above the zero bound. The Fed also gave itself the option to increase or decrease the pace of purchases if such changes are warranted by the economic outlook, but it would take a major shock to knock the Fed off its pre-set course. Chart 1The Market's Liftoff Expectations
The Market's Liftoff Expectations
The Market's Liftoff Expectations
Chart 2Net Purchases Will Reach Zero By June
Net Purchases Will Reach Zero By June
Net Purchases Will Reach Zero By June
With the tapering announcement out of the way, the Fed can now turn to the more important question of when to start lifting interest rates. Jay Powell made it clear at last week’s press conference that the committee hasn’t yet formally taken up the issue, but that didn’t stop reporters from pressing the Chairman to provide more details about when the Fed will hike. None of that should be too surprising. There’s intense market interest and a great deal of uncertainty about the timing of Fed liftoff. Two months ago, markets were pricing-in no rate hikes at all in 2022. Now, markets are looking for Fed liftoff at the September 2022 FOMC meeting and are discounting a 90% chance of 2 rate hikes by the end of next year (Chart 1). The Fed’s Thinking On Liftoff So, what did we learn from last week’s FOMC Statement and press conference about how the Fed is thinking about the liftoff date? First, we know from previous comments that the Fed would prefer to reduce net asset purchases to zero before it starts lifting rates. This means that the July 2022 FOMC meeting is the first “live meeting” where a rate hike could possibly occur, and the fed funds futures market is already pricing-in a 74% chance that liftoff will occur at that meeting (Chart 1). We aren’t so sure. In fact, we don’t see the Fed lifting rates until December 2022, and Chair Powell’s comments about inflation at last week’s press conference only increased our confidence in that view. On inflation, Powell echoed comments by Fed Governor Randal Quarles that we flagged in a recent report.1 Both Powell and Quarles put less emphasis on the length of time that inflation remains above the Fed’s target and more emphasis on the causes of that inflation and whether it’s appropriate for the Fed to lean against it. Here’s Powell from last week (emphasis added): Supply constraints have been larger and longer lasting than anticipated. Nonetheless, it remains the case that the drivers of higher inflation have been predominantly connected to dislocations caused by the pandemic, specifically the effects on supply and demand from the shutdown, the uneven reopening, and the ongoing effects of the virus itself. Our tools cannot ease supply constraints. Like most forecasters, we continue to believe that our dynamic economy will adjust to the supply and demand imbalances, and that as it does, inflation will decline to levels much closer to our 2 percent longer-run goal. Of course, it is very difficult to predict the persistence of supply constraints or their effects on inflation. Global supply chains are complex; they will return to normal function, but the timing of that is highly uncertain.2 Essentially, Powell is pointing out that it would be a mistake for the Fed to tighten policy to bring down inflation only to find out that the economy’s natural supply side response was about to do so anyways. The Fed would have dragged down aggregate demand for no reason. So what would cause the Fed to lift rates? We see two potential triggers. The first liftoff trigger would be an assessment by the FOMC that the labor market has reached “maximum employment”. This is the liftoff condition that the Fed has officially set for itself. The second liftoff trigger would be an uncomfortable increase in long-dated inflation expectations. A spike in long-dated inflation expectations would be worrying enough that the Fed would abandon its “maximum employment” goal and tighten earlier. The “Maximum Employment” Trigger Chart 3How Far From "Maximum Employment"?
How Far From "Maximum Employment"?
How Far From "Maximum Employment"?
The concept of “maximum employment” brings a whole host of other issues along with it. How will the Fed know if the labor market is at “maximum employment”? We’ve discussed this topic at length ourselves and have come to a few helpful conclusions.3 First, we can infer from the most recent Summary of Economic Projections that the Fed views an unemployment rate of 3.8% as roughly consistent with “maximum employment”. It is therefore highly unlikely that the Fed will even consider declaring victory on its employment goal until the unemployment rate is in the vicinity of 3.8%, down from its current 4.6% (Chart 3). Second, there are good reasons to believe that the aging of the US population and the recent sharp increase in retirements will prevent the labor force participation rate from re-gaining its pre-pandemic level. However, FOMC participants seem to agree that the prime-age (25-54) labor force participation rate should be close to its February 2020 level for the “maximum employment” condition to be satisfied (Chart 3, bottom panel). Chair Powell even specifically referenced the prime-age participation rate at last week’s press conference.
Chart 4
We think a declaration of “maximum employment” will only occur once the unemployment rate is near 3.8% and the prime-age (25-54) labor force participation rate is near its February 2020 level of 82.9%, up from its current 81.7%. It’s unlikely that these conditions will be met in time for a July 2022 rate hike. The Appendix to this report updates our scenarios for the average monthly nonfarm payroll growth that is required to reach different combinations of the unemployment and participation rates by specific future dates. Our scenarios use the overall participation rate (not the prime-age one), but we think the scenarios derived from the New York Fed’s Surveys of Market Participants and Primary Dealers come close to capturing reasonable conditions for “maximum employment”. Based on those scenarios, we calculate that average monthly nonfarm payroll growth of 602k to 733k is required to reach “maximum employment” by June 2022. Conversely, average monthly payroll growth of only 379k to 455k is required to reach “maximum employment” by December 2022. We see the latter as easily achievable and the former as more of a stretch. On the topic of employment growth, it’s worth noting that both monthly nonfarm payroll growth and the prime-age labor force participation rate were dragged down by the spread of the Delta variant during the past few months (Chart 4). With new COVID cases falling, we should see stronger payroll growth and a higher prime-age part rate in the months ahead. Relatedly, falling COVID cases will also help alleviate some the constraints on labor supply as workers grow less fearful of the virus and more confident about re-entering the labor force. This will not only push prime-age participation higher, but it will also take some of the sting out of wage growth. Wage growth has been extremely high recently as the number of job openings has far outpaced the number of new hires (Chart 5). Fading COVID fears should increase the pace of hiring and slow wage growth. This will give the Fed even more confidence that it should stay the course. Chart 5Peak Wage Growth?
Peak Wage Growth?
Peak Wage Growth?
The Inflation Expectations Trigger Chart 6Inflation Expectations Are Well-Anchored
Inflation Expectations Are Well-Anchored
Inflation Expectations Are Well-Anchored
We noted above that the Fed would abandon its “maximum employment” liftoff condition if long-dated inflation expectations rose to uncomfortably high levels. Specifically, we like to track the 5-year/5-year forward TIPS breakeven inflation rate relative to a target range of 2.3% to 2.5% (Chart 6). As long as the 5-year/5-year breakeven rate stays within that range or below, the Fed will be guided by its “maximum employment” goal. However, if that rate were to break above 2.5% for a significant period of time, the Fed would be sufficiently worried about an expectations-driven inflationary spiral that it would abandon its “maximum employment” trigger and bring forward the liftoff date. We don’t expect to see a breakout above 2.5% in the 5-year/5-year forward TIPS breakeven inflation rate anytime soon. The rate has stayed well contained throughout the past few months even as inflation skyrocketed. It would be strange for it to suddenly spike after inflation has already peaked.4 Bottom Line: Chair Powell’s remarks after the November FOMC meeting suggest that the Fed will not panic and move quickly toward tightening in the face of high inflation. Rather, the Fed will stay the course and will only lift rates once its “maximum employment” liftoff trigger is met. We continue to expect Fed liftoff in December 2022. Treasury Market Positioning For A December 2022 Liftoff To determine how we should position within the Treasury market, we translate our above views on the timing of Fed liftoff into fair value estimates for different segments of the Treasury curve. Specifically, we assume a scenario where the Fed starts hiking in December 2022 and then lifts rates at a pace of 100 bps per year until reaching a terminal rate of 2.08%. That 2.08% terminal rate is based on an expected target range of 2%-2.25% that is inferred from responses to the New York Fed’s Surveys of Market Participants and Primary Dealers. We assume that the effective fed funds rate will trade 8 bps above the lower-bound of its target range, as it does currently. Table 1 shows expected 12-month total returns for each Treasury maturity, assuming the market moves to fully price-in our expected funds rate path during the next year. Table 1Projected 12-Month Treasury Returns: Dec 2022 Liftoff/100 Bps Per Year Pace/2.08% Terminal Rate
A Rate Hike Next Summer? Don’t Count On It.
A Rate Hike Next Summer? Don’t Count On It.
The first observation that jumps out is that, except for the 2-year and 20-year maturities, expected Treasury returns are negative across the board. This justifies sticking with our recommended below-benchmark portfolio duration stance. Second, our expectation that liftoff will be delayed relative to current market expectations gives the 2-year note slightly better expected returns, particularly relative to the 10-year note. As a result, we advise investors to hold 2/10 yield curve steepeners. Specifically, investors should go long the 2-year note versus a duration-matched barbell consisting of the 10-year note and cash. Third, the 20-year bond looks to be priced cheaply on the curve. It offers expected 12-month returns of +79 bps while the 10-year note and 30-year bond are both projected to lose money. We recommend taking advantage of this situation by going long the 20-year bond versus a duration-matched barbell consisting of the 10-year note and 30-year bond. This proposed trade offers positive carry of 20 bps (Chart 7). Further, the 10/20 slope is stuck in the middle of where it was on the 2015 and 2004 liftoff dates (Chart 7, panel 2). The 20/30 slope, meanwhile, is inverted and well below where it was on the 2015 and 2004 liftoff dates (Chart 7, bottom panel). Our 20 over 10/30 trade will profit as the 20/30 slope re-steepens, even if the 10/20 slope doesn’t move that much. Chart 7Buy 20s Versus 10s30s
Buy 20s Versus 10s30s
Buy 20s Versus 10s30s
It could be argued that our recommend trades are all predicated on a fed funds rate scenario that embeds too low of a terminal rate. In fact, the median projection of FOMC participants would place the terminal rate closer to 2.5% than to 2%. If we alter our scenario by increasing the terminal rate assumption from 2.08% to 2.58%, it only improves the outlook for our recommended positions (Table 2). Table 2Projected 12-Month Treasury Returns: Dec 2022 Liftoff/100 Bps Per Year Pace/2.58% Terminal Rate
A Rate Hike Next Summer? Don’t Count On It.
A Rate Hike Next Summer? Don’t Count On It.
In the new scenario, expected Treasury returns are more negative – especially at the long-end. However, the 2-year note is still expected to earn a small profit. Our 20 over 10/30 trade performs slightly worse in this second scenario compared to the first one (+1.79% versus +1.95%), but it is still expected to make money. TIPS Chart 8A Lot Of Upside In Short-Maturity Real Yields
A Lot Of Upside In Short-Maturity Real Yields
A Lot Of Upside In Short-Maturity Real Yields
We have one final government bond recommendation based on our expectation that Fed liftoff will be delayed until December 2022. That trade is to go short 2-year TIPS. Alternatively, investors could enter 2/10 inflation curve steepeners or 2/10 real yield curve flatteners. Our base case economic outlook is that supply side constraints (both in global supply chains and in the labor market) will loosen during the next 12 months. This will push down short-dated inflation expectations while long-dated inflation expectations stay relatively close to the Fed’s target. If we assume that both the 2-year and 10-year TIPS breakeven inflation rates trend towards the middle of the Fed’s 2.3% to 2.5% target range during the next 12 months and that the nominal 2-year and 10-year yields follow the paths predicted by the fair value scenario presented in Table 1, then we see that the 2-year real yield has a lot of upside (Chart 8). This is true both in absolute terms and relative to the 10-year real yield. We advise investors to short 2-year TIPS outright. Alternatively, 2/10 inflation curve steepeners or 2/10 real yield curve flatteners will also perform well during the next 12 months. Bottom Line: We suggest four different ways that bond investors can profit from the Fed delaying liftoff until December 2022. Investors should keep portfolio duration low, enter 2/10 nominal curve steepeners, buy the 20-year T-bond versus a 10/30 barbell and short 2-year TIPS. Appendix: How Far From “Maximum Employment” And Fed Liftoff? Chart A1Defining “Maximum Employment”
Defining "Maximum Employment"
Defining "Maximum Employment"
The Federal Reserve has promised that the funds rate will stay pinned at zero until the labor market returns to “maximum employment”. The Fed has not provided explicit guidance on the definition of “maximum employment”, but we deduce that “maximum employment” means that the Fed wants to see the U3 unemployment rate within a range consistent with its estimates of the natural rate of unemployment, currently 3.5% to 4.5%, and that it wants to see a significant increase in the labor force participation rate (Chart A1). Alternatively, we can infer definitions of “maximum employment” from the New York Fed’s Surveys of Primary Dealers and Market Participants. These surveys ask respondents what they think the unemployment and labor force participation rates will be at the time of Fed liftoff. Currently, the median respondent from the Survey of Market Participants expects an unemployment rate of 3.5% and a participation rate of 63%. The median respondent from the Survey of Primary Dealers expects an unemployment rate of 3.7% and a participation rate of 62.7%. Tables A1-A4 present the average monthly nonfarm payroll growth required to reach different combinations of unemployment rate and participation rate by specific future dates. For example, if we use the definition of “maximum employment” from the Survey of Market Participants, then we need to see average monthly nonfarm payroll growth of +455k in order to hit “maximum employment” by the end of 2022.
Image
Image
Image
Image
Chart A2 presents recent monthly nonfarm payroll growth along with target levels based on the Survey of Market Participants’ definition of “maximum employment”. This chart is to help us track progress toward specific liftoff dates. For example, if monthly nonfarm payroll growth prints +400k per month going forward, we would expect Fed liftoff between December 2022 and June 2023. Chart A2Tracking Toward Fed Liftoff
Tracking Toward Fed Liftoff
Tracking Toward Fed Liftoff
We will continue to track these charts and tables in the coming months, and will publish updates after the release of each monthly employment report. Ryan Swift US Bond Strategist rswift@bcaresearch.com Footnotes 1 Please see US Bond Strategy Weekly Report, “The Best & Worst Spots On The Yield Curve”, dated October 26, 2021. 2 https://www.federalreserve.gov/mediacenter/files/FOMCpresconf20211103.pdf 3 Please see US Bond Strategy Weekly Report, “2022 Will Be All About Inflation”, dated September 14, 2021. 4 For more details on our inflation outlook please see US Bond Strategy Weekly Report, “Right Price, Wrong Reason”, dated October 19, 2021. Recommended Portfolio Specification Other Recommendations Treasury Index Returns Spread Product Returns
Highlights Supply-side pressures should abate over the coming months as semiconductor availability improves, transportation bottlenecks ease, energy prices recede, and more workers enter the labor force. The respite from inflation will be temporary, however. The combination of easy fiscal and monetary policies will cause unemployment to fall below its equilibrium level in the US, and eventually, in most major economies. Unlike in the late 1990s, when rising wages were counterbalanced by robust productivity gains, most of the recent rebound in US productivity growth will prove to be illusory. US inflation will follow a “two steps up, one step down” trajectory. We are currently at the top of those two steps, but rising unit labor costs will eventually drive inflation higher. Rather than fretting that the Federal Reserve will keep rates too low for too long, investors are worried that the Fed will tighten too much. This is a key reason why the 20-year/30-year Treasury slope has inverted. Such an inversion does not make sense to us. Hence, we are initiating a trade going long the 20-year bond versus the 30-year bond. Go short the 10-year Gilt on any break below 0.85%. UK real bond yields are amongst the lowest in the world. The Bank of England will eventually have to turn more hawkish, which will support the beleaguered pound. Structurally higher bond yields will benefit value stocks. Banks stand to gain from rising bond yields while tech could suffer. The eventual re-emergence of supply-side pressures will catalyze more investment spending. This will bolster industrial stocks. The Supply Side Matters, Again Savings glut, secular stagnation; call it what you will, but for the better part of two decades, the global economy has faced a chronic shortfall of aggregate demand. Times are changing, however. The predominant problem these days is not a lack of spending; it is a lack of production. Unlike during the Global Financial Crisis – when worries about moral hazard complicated efforts to bail out homeowners and banks – the victims of the pandemic elicited sympathy. As a result, governments in developed economies rolled out a slew of measures to support workers and businesses. Thanks to bountiful fiscal transfers, households in the US have accrued $2.2 trillion in income since the start of the pandemic, about $1.2 trillion more than one would have expected based on the pre-pandemic trend (Chart 1). With many services unavailable, consumers diverted spending towards manufactured goods. At first, sellers were able to dip into their inventories to meet rising demand. By early this year, however, inventories had been depleted (Chart 2). Shortages began to pop up across much of the global supply chain. Chart 1Stimulus-Supported Income Growth Boosted Goods Consumption
Stimulus-Supported Income Growth Boosted Goods Consumption
Stimulus-Supported Income Growth Boosted Goods Consumption
Chart 2The Pandemic Depleted Inventories
The Pandemic Depleted Inventories
The Pandemic Depleted Inventories
While today’s empty warehouses can be largely attributed to surging demand for goods, supply-side disruptions have also played an important role. Four disruptions stand out: 1) semiconductor shortages; 2) transportation bottlenecks; 3) inadequate energy supplies; and 4) reduced labor force participation. Let us examine all four in turn. Semiconductor Shortages Chart 3Car Prices Have Jumped
Car Prices Have Jumped
Car Prices Have Jumped
The global supply chain was not equipped to handle the dislocations caused by the pandemic. The combination of just-in-time inventory systems and far-flung supplier networks ensured that bottlenecks in one part of the global economy quickly filtered down to other parts of the economy. Few industries are as important as semiconductors. The auto sector has felt the brunt of the chip shortage. Both new and used vehicle prices have soared as dealer lots have emptied out (Chart 3). The drop in vehicle spending alone shaved 2.4 percentage points off US real GDP growth in the third quarter. Semiconductor makers have ramped up production to meet growing demand. The US Census Bureau’s Quarterly Survey of Plant Capacity Utilization showed that semiconductor plants operated an average of 73 hours per week in the first half of this year, up from around 45-to-50 hours prior to the pandemic (Chart 4). Chip production in Northeast Asia has rebounded (Chart 5). Southeast Asian production dropped in August due to Covid lockdowns, with semiconductor exports falling by over a third in Malaysia and Vietnam. Fortunately, since then, a decline in Covid cases and rising vaccination rates have spurred a recovery throughout the region. Chart 4Chipmakers Are Working Overtime
Chipmakers Are Working Overtime
Chipmakers Are Working Overtime
Chart 5Semiconductor Production Has Accelerated In Northeast Asia
Semiconductor Production Has Accelerated In Northeast Asia
Semiconductor Production Has Accelerated In Northeast Asia
Chart 6Memory Chip Prices Are Declining
Memory Chip Prices Are Declining
Memory Chip Prices Are Declining
Commentary from semiconductor companies and automakers suggest that the chip shortage will ease over the coming months. In an auspicious sign, US auto sales jumped to 13.1 million in October from 12.3 million in September. Memory chip prices are also falling (Chart 6). Nevertheless, the overall chip market is unlikely to return to balance until 2023. Transportation Bottlenecks Unlike semiconductors and high-end electronics, which usually arrive by air, bulkier items such as furniture, sporting goods, and housing appliances typically arrive by sea. Port congestion, insufficient warehouse capacity, and a lack of truck chassis on which to place containers have all contributed to transportation bottlenecks. Chart 7Transportation Bottlenecks: Past The Worst?
Transportation Bottlenecks: Past The Worst?
Transportation Bottlenecks: Past The Worst?
As with the semiconductor shortage, we are probably past the worst point in the shipping crisis. Drewry’s composite World Container Index has edged down 11% from its highs, although it is still up more than three-fold from mid-2020 levels (Chart 7). The easing in container shipping costs follows a dramatic 47% decline in the Baltic Dry Index since early October. The number of ships waiting to unload cargo off the coast of Los Angeles and Long Beach remains near record highs (Chart 8). Port congestion should ease over the next few months. US port throughput usually falls starting in the late fall and remains weak during the winter months, bottoming shortly after the Chinese New Year. If throughput remains elevated near current levels this year, this should be enough to clear much of the backlog. Looking further out, shipping costs could face additional downward pressure. Chart 9 shows that the number of container ships on order has risen to a 10-year high; these new ships will be delivered over the next two years. Chart 8Port Congestion Should Ease Over The Coming Months
Port Congestion Should Ease Over The Coming Months
Port Congestion Should Ease Over The Coming Months
Chart 9Shipbuilders Are Busy
Shipbuilders Are Busy
Shipbuilders Are Busy
Inadequate Energy Supplies After a torrid rally since the start of the year, energy prices have come off their highs. The price of Brent oil has dipped 6% from its October peak. US natural gas prices have retreated 11%. Natural gas prices in Europe have fallen 37%.
Chart 10
The biggest move has been in coal prices, which have dropped 36% over the past two weeks alone. Futures curves are pricing in further declines in key energy prices (Chart 10). BCA’s Commodity and Energy Strategy service expects energy prices to soften over the next 12 months, but not as much as markets are discounting. Their latest forecast calls for the price of Brent crude to average $81/bbl in 2021Q4, $80/bbl in 2022 (versus market expectations of $77/bbl), and $81/bbl in 2023 (versus market expectations of $71/bbl). As we discussed a few weeks ago, years of underinvestment have led to tight supply conditions across the entire energy complex (Chart 11). Proven global oil reserves increased by only 6% between 2010 and 2020, having risen by 26% over the preceding decade. Gas reserves followed a similar trajectory, increasing by only 5% between 2010 and 2020 compared to 30% over the prior ten years (Chart 12).
Chart 11
Chart 12
With little spare capacity, energy markets have become increasingly vulnerable to shocks. A cold snap across the Northern Hemisphere this spring depleted natural gas supplies, while a lack of wind reduced energy production by European wind farms. Increased gas imports from Russia could have mitigated the problem, but the dispute over the Nord Stream 2 pipeline prevented that from happening. The pipeline is popular with German voters (Chart 13). BCA’s geopolitical team expects it to be approved, a welcome development given that La Niña is highly likely to lead to colder-than-normal temperatures across northern Europe this winter.
Chart 13
China has also restarted 170 coal mines and will probably begin re-importing Australian coal. Beijing is also allowing utilities to charge higher prices, which should help stave off bankruptcies across the sector. These measures should help mitigate China’s energy crisis. Chart 14US Rig Count Has Risen From Low Levels
US Rig Count Has Risen From Low Levels
US Rig Count Has Risen From Low Levels
A bit more oil production will also help. The US rig count, while still far below its 2014 highs, has doubled since last year (Chart 14). BCA’s commodity strategists expect output in the Lower 48 states to average 9.5mm b/d in 2022 and 10mm b/d in 2023, versus 2021 production levels of 9.0mm b/d. Nevertheless, shale producers are a lot more disciplined these days. Debt reduction and cash flow generation are now the top priorities. This implies that fairly high oil prices may be necessary to catalyze additional investment in the industry. Reduced Labor Force Participation Despite the rapid economic recovery, US employment remains 5 million below its pre-pandemic peak. One would not know this from the survey data, however. A record 51% of small businesses expressed difficulty finding qualified workers in the October NFIB survey. The share of households reporting that jobs are plentiful versus hard-to-get has returned to its 2000 highs. Both the quits rate and the job openings rate are well above their pre-pandemic levels (Chart 15). A wave of early retirement accounts for some of the apparent labor market tightness. About 1.3 million more workers have retired since the pandemic began than one would have expected based on demographic trends. Yet, there is more to the story than that. The labor force participation rate for workers aged 25-to-54 has not fully recovered; the employment-to-population ratio for that age cohort is still 2.5 percentage points below pre-pandemic levels (Chart 16).
Chart 15
Chart 16Labor Force Participation Has Room To Rise
Labor Force Participation Has Room To Rise
Labor Force Participation Has Room To Rise
There is considerable uncertainty about how many workers will re-enter the labor force over the coming months. On the one hand, the expiration of enhanced unemployment benefits could prod more workers into the job market. Diminished anxiety about the virus should help. While the number has fallen by half, there are still 2.5 million people not working due to concerns about getting or spreading Covid-19 (Chart 17). According to Boston College’s Center for Retirement Research, the retirement rate rose more for older lower-income workers than higher-income workers (Chart 18). Some of these retirees may decide to re-enter the labor force. Chart 17Less Anxiety About The Coronavirus Should Increase Labor Supply
Poorer Older Workers Were More Likely To Retire Last Year
Poorer Older Workers Were More Likely To Retire Last Year
Chart 18
On the other hand, the imposition of vaccine mandates could reduce labor supply. About 100 million US workers are currently subject to the mandates. According to the Census Household Pulse Survey, about 8 million of them are unvaccinated and attest that “they will definitely not get the vaccine.” Perhaps the biggest question mark is over whether the pandemic will lead to permanent changes in peoples’ perspectives on the optimal work/life balance. High burnout rates (especially in the health care sector), a reluctance to restart the daily commute to the office, and the desire to spend more time with family have all contributed to what some commentators have dubbed The Great Resignation. Ultimately, the deciding factor may be wages. Wage growth accelerated during the late 1990s as the labor market tightened (Chart 19). This drew a lot of people – especially less-skilled workers – into the labor force. Recently, wage growth has exploded at the bottom end of the income distribution, and our guess is that this will entice more people to seek employment (Chart 20). Chart 19Wage Growth Accelerated During The Late 1990s As The Labor Market Tightened
Wage Growth Accelerated During The Late 1990s As The Labor Market Tightened
Wage Growth Accelerated During The Late 1990s As The Labor Market Tightened
Chart 20Wages At The Bottom End Of The Income Distribution Are Rising Briskly
Wages At The Bottom End Of The Income Distribution Are Rising Briskly
Wages At The Bottom End Of The Income Distribution Are Rising Briskly
Will Higher Productivity Growth Mitigate Supply-Side Pressures? The late 1990s saw a resurgence in productivity growth. This helped restrain unit labor costs in the face of rising wages.
Chart 21
While US productivity did jump during the pandemic, we are sceptical of claims that this can be attributed to efficiency gains from digitalization and work-from-home practices. A recent study of 10,000 skilled professionals at a major IT company revealed that work-from-home policies decreased productivity by 8%-to-19%, mainly because people ended up working longer. It is telling that productivity outside of the US generally declined during the pandemic (Chart 21). This suggests that last year’s productivity gains stemmed mainly from increased operating leverage, a common feature of post-recession US recoveries (Chart 22). Supporting this view is the fact that productivity growth slowed from 4.3% in Q1 to 2.4% in Q2 on a quarter-over-quarter annualized basis. Productivity declined by 5% in Q3, leading to an 8.3% increase in unit labor costs. Chart 22US Productivity Tends To Jump After Recessions
US Productivity Tends To Jump After Recessions
US Productivity Tends To Jump After Recessions
Chart 23Capital Goods Orders Have Soared
Capital Goods Orders Have Soared
Capital Goods Orders Have Soared
The only saving grace is that core capital goods orders have soared (Chart 23). This should translate into increased business capital spending next year and higher productivity down the road. Investment Implications Supply-side pressures should abate over the coming months as semiconductor availability improves, transportation bottlenecks ease, energy prices recede, and more workers enter the labor force. The respite from inflation will be temporary, however. The combination of easy fiscal and monetary policies will cause unemployment to fall below its equilibrium level in the US, and eventually, in most major economies. This is consistent with our “two steps up, one step down” projection for US inflation. We are probably near the top of those two steps at present. This implies that the next move for inflation is to the downside, even if the longer-term trend is still to the upside. The US 10-year Treasury yield should stabilize at around 1.8% in the first half of 2022, before moving higher later in the year. As we discussed last week, markets are understating the true level of the neutral rate of interest. Rather than fretting that the Federal Reserve will keep rates too low for too long, investors are worried that the Fed will tighten too much. This is a key reason why the 20-year/30-year Treasury slope has inverted (Chart 24). Such an inversion does not make sense to us. Hence, as of this week, we are initiating a trade going long the 20-year bond versus the 30-year bond. We would also go short the 10-year Gilt on any break below 0.85%. The Bank of England’s “surprising hold” knocked the yield down 14 basis points to 0.93%. UK real bond yields are amongst the lowest in the world (Chart 25). Growth is strong and will remain buoyant as Brexit headwinds fade. The BoE will eventually have to turn more hawkish, which will support the beleaguered pound. Chart 24Go Long US 20-Year Bonds Versus 30-Year Bonds
Go Long US 20-Year Bonds Versus 30-Year Bonds
Go Long US 20-Year Bonds Versus 30-Year Bonds
Chart 25UK Real Bond Yields Are Amongst The Lowest In The World
UK Real Bond Yields Are Amongst The Lowest In The World
UK Real Bond Yields Are Amongst The Lowest In The World
Structurally higher bond yields will benefit value stocks. Chart 26 shows that there has been a close correlation between the US 30-year Treasury yield and the relative performance of global value versus growth stocks. Banks stand to gain from rising bond yields while tech could suffer (Chart 27). Chart 26Higher Bonds Yields Favor Value Stocks
Higher Bonds Yields Favor Value Stocks
Higher Bonds Yields Favor Value Stocks
Chart 27
The re-emergence of supply-side pressures could affect companies in a variety of unexpected ways. For example, Facebook and Google both rely heavily on revenue from advertising. But what is the point of trying to boost demand for your product if you already cannot produce enough of it? Companies such as Hershey and Kimberly-Clark are already cutting ad spending in response to supply-chain bottlenecks. Finally, tight supply conditions will catalyze more investment spending. This will benefit industrial stocks. Peter Berezin Chief Global Strategist pberezin@bcaresearch.com Global Investment Strategy View Matrix
Chart 28
Special Trade Recommendations
The Supply Side Strikes Back
The Supply Side Strikes Back
Current MacroQuant Model Scores
Chart 29
Highlights Duration & Country Allocation: Global bond yields have been driven by growth and inflation expectations over the past year, but shifting policy expectations are now the more important driver. Tighter monetary policies will pressure global bond yields higher over the next 6-12 months, but not equally. Stay underweight countries where tapering and rate hikes are more likely (the US, the UK, Canada, New Zealand) relative to countries where policymakers will move much more slowly (euro area, Australia, Japan). Inflation-Linked Bonds: An update of our Comprehensive Breakeven Indicators shows limited scope for a further widening of breakeven inflation rates between nominal and index-linked government bonds in most developed economies, most notably in Europe. Downgrade strategic (6-18 months) exposure to inflation-linked bonds (vs nominals) to underweight in Germany, France and Italy. Feature Chart of the WeekGlobal Bond Yield Drivers: Inflation Now, Labor Later
Global Bond Yield Drivers: Inflation Now, Labor Later
Global Bond Yield Drivers: Inflation Now, Labor Later
“Actually, we talked about inflation, inflation, inflation. That has been a topic that has occupied a lot of our time and a lot of our debates.” – ECB President Christine Lagarde Are you tired of talking about inflation? Central bankers likely are. The only problem is that is the job of monetary policymakers to worry about inflation – and the appropriate policy response – when it is rising as fast as been the case in 2021. The current global inflation surge, on the back of supply squeezes for both durable goods and commodity prices, will ease to some degree in 2022. This does not mean, however, that global bond yields have seen their cyclical peak. The driver of higher yields is already starting to transition from high inflation to tightening labor markets and rising wage costs – more enduring sources of potential inflation that will require monetary tightening in many, but not all, countries (Chart of the Week). This week, we discuss the implications of this shift to more policy-driven yields for the country allocation decisions in a government bond portfolio, for both nominal and inflation-linked debt. Shorter-Term Bond Yields Awaken, Longer-Term Yields Take Notice October represented a shift in the relative performance of developed economy government bond markets compared to the previous three months, most notably at the extremes (Chart 2). UK Gilts were the largest underperformer in Q3, down 1.8% versus the Bloomberg Global Treasury index (in USD-hedged terms, duration-matched to the benchmark), while Spain (+0.7%), Australia (+0.4%) and Italy (+0.3%) were the outperformers. In October, that script was flipped with Gilts being the best performer (+2.3%), Australia being the worst performer (-4.2%) and Spain (-0.6%) and Italy (-1.5%) reversing the Q3 gains.
Chart 2
Those particular swings in relative performance were a result of shifting market views on policy changes in those countries. The UK Gilt rally was largely contained to a single day, and focused at the long-end of the Gilt curve after the Conservative government announced a smaller-than-expected budget deficit on October 26 - with much less issuance of longer-maturity bonds – which triggered a huge -22bps decline in 30-year Gilt yields. The Australian bond selloff was a triggered by a rapid market reassessment of the next move in monetary policy for the Reserve Bank of Australia (RBA) after an upside surprise on Q3 inflation data. Italian and Spanish debt also sold off on the back of growing fears that even the European Central Bank (ECB) would be forced to tighten policy in response to higher inflation. The backup in Australian and European yields ran counter to the latest policy guidance of from the RBA and ECB, indicating speculation of a bond-bearish hawkish policy shift. In countries where policymakers have been more explicit about the need for monetary tightening, like Canada and New Zealand, government bonds performed poorly in both Q3 and October. While US Treasury returns were “flattish” in both Q3 (0.1%) and October (0.1%), the 2-year Treasury yield doubled from 0.27% to 0.52% during October as the market pulled forward the timing and pace of Fed rate hikes starting next year (Chart 3). Shifting views on monetary policy have not only impacted the relative performance of bond markets, but also the shapes of yield curves. The bigger increases seen in shorter-maturity bond yields have resulted in a fairly synchronized global move towards curve flattening (Chart 4). This would not be unusual during an actual monetary policy tightening cycle involving rate hikes. However, within the developed economies, only Norway and New Zealand have seen an actual rate hike. In other words, yield curves have been flattening on the anticipation of a rate hiking cycle – but one that is expected to be relative mild. Chart 3A Bond-Bearish Repricing Of Global Rate Expectations
A Bond-Bearish Repricing Of Global Rate Expectations
A Bond-Bearish Repricing Of Global Rate Expectations
Chart 4Some Violent Repricing Of Policy Expectations
Some Violent Repricing Of Policy Expectations
Some Violent Repricing Of Policy Expectations
Forward interest rates in Overnight Index Swap (OIS) curves are discounting higher rates in 2022 and 2023 across most countries, but with stable rates in 2024 (Chart 5). Yet the cumulative amounts of tightening are very modest, especially when compared to inflation (both realized and expected). Only in New Zealand are policy rates expected to go above 2% by 2023, with the US OIS curve discounting the Fed lifting policy rates to just 1.4%. In the UK, markets are discounting 123bps of hikes by the end of 2022 and a rate cut in 2024 – market pricing that strongly suggests that the Bank of England will make a “policy error” by tightening too much, too quickly, over the next year. Chart 5Markets Still Think Central Banks Will Not Have To Hike Much
Markets Still Think Central Banks Will Not Have To Hike Much
Markets Still Think Central Banks Will Not Have To Hike Much
After the October repricing of rate expectations, and reshaping of yield curves, we see a few conclusions – and investment opportunities – that stand out: US Treasuries With the Fed set to begin tapering asset purchases, the market discussion has moved on to the timing and pace of the post-taper rate hike cycle. The US OIS curve is discounting two Fed hikes in the second half of 2022, starting shortly after the likely end of the Fed taper in June. That timing and pace for 2022 is a bit more aggressive than we are expecting, but a rapidly tightening US labor market and rising wage growth could force the Fed to at least match the market pricing for hikes next year. On that note – the US Employment Cost Index in Q3 rose +1.3%, the fastest quarterly pace since 2001, and +3.7% on a year-over-year basis, the highest since 2004. The greater medium-term risk for the Treasury market is that the Fed starts to signal a need to go higher and faster than the market expects in 2023 and even into 2024. US Treasury yields remain well below levels implied by growth indicators like the ISM index. Thus, there is upside potential as the Fed tightens because of persistent above-trend growth and falling unemployment over the next couple of years (Chart 6). Chart 6Stay Below-Benchmark On US Duration Exposure
Stay Below-Benchmark On US Duration Exposure
Stay Below-Benchmark On US Duration Exposure
We continue to recommend a below-benchmark duration strategic stance for dedicated US bond investors, based on our expectation that US bond yields will climb higher over the next 12-18 months. However, our more preferred way to play this for global investors is as a spread trade versus euro area bond yields – specifically, selling 10-year US Treasury versus 10-year German bunds (Chart 7). Chart 7Position For UST Underperformance Vs. Europe
Position For UST Underperformance Vs. Europe
Position For UST Underperformance Vs. Europe
While headline inflation in the euro area has rapidly converged to the pace of US inflation over the past few months, this is overwhelmingly due to surging European energy costs. The pace of underlying inflation, as proxied by measures like the Cleveland Fed trimmed mean CPI and the euro area trimmed mean CPI constructed by our colleagues at BCA Research European Investment Strategy, has diverged sharply with the latter barely above 0%. The ECB will not follow the Fed into a rate hiking cycle next year, which will push US government yields higher versus European equivalents. Australia Government Bonds Chart 8Fade The RBA 'Rate Shock' In Australia
Fade The RBA 'Rate Shock' In Australia
Fade The RBA 'Rate Shock' In Australia
The RBA fought back against the sharp repricing of Australian interest rate expectations earlier this week by signaling that no rate hikes are expected until 2023. This is a modest change from the previous forward guidance of 2024 liftoff, but a surprisingly dovish message for markets that had rapidly moved to price in rate hikes next year after the big upside surprise on Q3/2021 Australian inflation With underlying trimmed mean inflation now having crept back into the RBA’s 2-3% target range, although just barely at 2.1%, the RBA would be justified in removing some degree of monetary accommodation. The central bank has already been doing so, on the margin, with some earlier tapering of the pace of asset purchases and last week’s decision to formally abandon its yield control target on shorter-dated government bond yields. Per the RBA’s current forward guidance, however, a move to actual rate hikes would require more evidence of tighter labor markets and faster wage growth – and thus, a more sustainable move to the 2-3% inflation target - that is not yet evident in measures like the Wage Cost Index (Chart 8). We plan on doing a deeper dive into Australia for next week’s report, where we’ll more formally evaluate our strategic view on Australian bond markets. For now, we remain comfortable with our overweight stance on Australian government bonds, as the RBA is still projected to be one of the less hawkish central banks in 2022. UK Gilts
Chart 9
The sharp rally in longer-dated UK Gilts seen at the end of October was due to a downside surprise in the expected size of the UK budget deficit next year, and the amount of Gilt issuance that will be needed to finance it. The UK Debt Management Office (DMO) said it planned to issue 194.8 billion pounds ($267.5 billion) of bonds in the current 2021/22 financial year, 57.8 billion pounds less than its previous remit back in March. The pre-budget market expectation was for a far smaller reduction of 33.8 billion pounds. The cut in issuance was most pronounced for longer-dated Gilts, -35% lower than the March budget issuance projection (Chart 9). With longer-maturity Gilts always in high demand from longer-term UK institutional investors, a major “supply shock” of reduced issuance can temporarily boost bond prices and lower yields. This is especially true in the UK where more aggressive rate hike expectations, and more defensive bond market positioning after the August/September selloff, left Gilts vulnerable to a short squeeze. The most important medium-term drivers of Gilt yields are still expectations of growth, inflation and future policy rates. There was very little change in shorter-dated Gilt yields or UK OIS forward rates after last week’s budget announcement – all the price action was the long end of the Gilt yield curve, resulting in an overall bull flattening. As we discussed in last week’s report, we expect the next move in the shape of the Gilt curve will be towards a steeper curve, likely bond-bearishly as long-term yields are still priced too low relative to how high UK policy rates will eventually have to climb in the upcoming BoE hiking cycle. The post-budget flattening has made the valuation of longer-maturity Gilt curve steepeners far more attractive, according to our UK butterfly spread valuation model (Table 1). Table 1UK Butterfly Spread Valuations From Our Curve Models
Transitioning From Inflation To Policy As The Driver Of Bond Yields
Transitioning From Inflation To Policy As The Driver Of Bond Yields
Chart 10A New UK Tactical Trade: Long 10yr Bullet Vs. 7/30 Barbell
A New UK Tactical Trade: Long 10yr Bullet Vs. 7/30 Barbell
A New UK Tactical Trade: Long 10yr Bullet Vs. 7/30 Barbell
The trade that stands out as most attractive is to go long the 10-year Gilt bullet versus selling a 7-year/30-year Gilt curve barbell – a butterfly spread that was last priced this attractively in 2013 (Chart 10). We are adding this as a new recommended trade in our Tactical Overlay portfolio, the details of which (specific bonds and weightings for each leg of the trade) can be found on page 17. Bottom Line: Tighter monetary policies will pressure global bond yields higher over the next 6-12 months, but not equally. Stay underweight countries where tapering and rate hikes are more likely (the US, the UK, Canada, New Zealand) relative to countries where policymakers will move much more slowly (euro area, Australia, Japan). Global Breakevens: How Much More Upside? The surge in global inflation this year has helped boost the performance of inflation-linked government bonds versus nominal equivalents. Yet current breakeven inflation rates have reached levels not seen in some time. Last week, the 10-year US TIPS breakeven hit a 15-year high of 2.7%, the 10-year German breakeven reached a 9-year high of 2.1%, while the 10-year UK breakeven climbed to 4.2% - the highest level since 1996 (!). With market-based inflation expectations reaching such historically high levels, how much more can breakevens widen – especially with central banks incrementally moving towards tighter monetary policies? To answer that question, we turn to our Comprehensive Breakeven Indicators (CBIs). The CBIs measure the upside/downside potential for breakevens for the US, Germany, France, Italy, Japan, the UK, Canada and Australia. The CBIs incorporate the following three measures: The residuals from our 10-year breakeven inflation spread fair value models, as a measure of valuation. The spread between 10-year breakevens and survey-based measures of inflation expectations, as a measure of the inflation risk premium embedded in breakevens The gap between headline inflation and the central bank inflation target, as an indication of the existing inflation backdrop and of future monetary policy moves in response to an inflation trend that can help to reverse that trend. Each of the three measures is standardized and added together to produce a single CBI. A higher reading on CBI suggests less potential for additional increases in breakevens, and vice versa. The latest readings from our CBIs are shown in Chart 11. The red diamonds for each country are the actual CBI, while the stacked bars show the individual CBI components. The highest CBI readings are in Germany and the US, while the lowest are in Canada and France. Importantly, no country has a CBI significantly below zero, indicative of the more limited upside potential for breakevens after the big run-up since mid-2020.
Chart 11
As a way to assess the usefulness of the CBIs as an indicator of the future breakeven moves, we constructed a simple backtest. We looked at how 10-year breakevens performed in the twelve months after the CBI hit certain thresholds (Chart 12). The backtest results show that the CBIs work as intended, signaling reversals of existing trends once the CBIs climb above +0.5 or below -0.5. The average (mean) size of the breakeven reversal gets larger as the CBI moves further to extremes.
Chart 12
Based on the latest reading from the CBIs, we are making significant changes to the recommended allocations (Chart 13) to inflation-linked bonds (ILBs) in our model bond portfolio on pages 14-15: Chart 13No Overweights In Our Revised Allocations To Global Linkers
No Overweights In Our Revised Allocations To Global Linkers
No Overweights In Our Revised Allocations To Global Linkers
Downgrading ILBs to underweight (versus nominal government bonds) in Germany, France, Italy & Spain from the current overweight allocation. The backtested CBI history for those countries suggests breakevens are more likely to fall over the next twelve months. Furthermore, realized euro area inflation is more likely to fall in 2022, given the lack of underlying euro area inflation described earlier in this report. Downgrade Japan ILBs to neutral from overweight. While the CBI is not at a stretched level, realized Japanese core inflation has struggled to stay in positive territory – even in the current environment of soaring commodity and durable goods prices. Upgrade ILBs in Canada and Australia to neutral from underweight. The former has a CBI that is still below zero, while the latter benefits from the lack of RBA hawkishness compared to other central banks. We are maintaining our other ILB allocations in the UK (underweight vs. nominals) and the US (neutral vs. nominals). In the UK, stretched breakevens are at risk from the hawkish turn by the BoE, which is a clear response to the higher UK inflation expectations. While the US CBI is at a high level, we see better value in playing for narrowing TIPS breakevens at shorter maturity points that are even more exposed to a likely slowing of commodity fueled inflation in 2022 than longer maturity TIPS breakevens. In other words, we see a steeper US breakeven curve, but a flatter real yield curve as the Fed tightens. Bottom Line: An update of our Comprehensive Breakeven Indicators shows limited scope for a further widening of breakeven inflation rates between nominal and index-linked government bonds in most developed economies, most notably in Europe. Robert Robis, CFA Chief Fixed Income Strategist rrobis@bcaresearch.co Recommendations Duration Regional Allocation Spread Product Tactical Trades GFIS Model Bond Portfolio Recommended Positioning Active Duration Contribution: GFIS Recommended Portfolio Vs. Custom Performance Benchmark
Image
The GFIS Recommended Portfolio Vs. The Custom Benchmark Index
Highlights Chart 1Buy The 2-Year, Sell The 10-Year
Buy The 2-Year, Sell The 10-Year
Buy The 2-Year, Sell The 10-Year
Treasury yields have been volatile of late, but the biggest move has been a flattening of the yield curve led by a sell-off at the front-end. Our recommended yield curve positioning (short the 5-year bullet / long a duration-matched 2/10 barbell) was well suited to profit from this move but has now run its course. The solid lines in the bottom panel of Chart 1 show the paths discounted in the forward curve for the 2-year and 10-year yields. The dashed lines show the fair value paths for each yield in a scenario where the Fed starts hiking in December 2022 and proceeds at a pace of 100 bps per year until reaching a 2.08% terminal rate. We can see that the 2-year yield looks a bit too high relative to fair value and the 10-year looks too low. Taken together, our fair value estimates show that the 2/10 Treasury slope should flatten during the next 12 months, but not by as much as is currently discounted in the forward curve (Chart 1, top panel). Investors should maintain below-benchmark portfolio duration but should shift out of 2/10 flatteners and into steepeners. Specifically, we close our prior yield curve trade and open a new one: Long the 2-year note, short a duration-matched barbell consisting of cash and the 10-year note. Feature Table 1Recommended Portfolio Specification
Curve Flatteners Are Too Expensive
Curve Flatteners Are Too Expensive
Table 2Fixed Income Sector Performance
Curve Flatteners Are Too Expensive
Curve Flatteners Are Too Expensive
Investment Grade: Neutral Chart 2Investment Grade Market Overview
Investment Grade Market Overview
Investment Grade Market Overview
Investment grade corporate bonds performed in line with the duration-equivalent Treasury index in October, leaving year-to-date excess returns unchanged at +193 bps (Chart 2). The combination of above-trend economic growth and accommodative monetary policy continues to support positive excess returns for spread product versus Treasuries. The recent flattening of the yield curve is a strong reminder that the window of outperformance for corporate bonds will eventually close, but the curve will need to be a lot flatter before we start to worry. Specifically, we are targeting a level of 50 bps for the 3-year/10-year Treasury slope as a level where we will turn more cautious on spread product relative to Treasuries. This slope currently sits at 80 bps and the pace of flattening should moderate during the next few months. A recent report presented the results of a scenario analysis for investment grade corporate bond returns during the next 12 months.1 We concluded that investment grade corporate bond total returns will be close to zero or negative during the next 12 months and that excess returns versus duration-matched Treasuries are capped at 85 bps. With that in mind, we advise investors to seek out higher returns in junk bonds, municipal bonds and USD-denominated Emerging Market sovereign and corporate bonds. We also recommend favoring long-maturity corporate bonds and those corporate sectors with elevated Duration-Times-Spread.2
Chart
Chart
High-Yield: Overweight Chart 3High-Yield Market Overview
High-Yield Market Overview
High-Yield Market Overview
High-Yield outperformed the duration-equivalent Treasury index by 14 basis points in October, bringing year-to-date excess returns up to +572 bps. A recent report looked at the default expectations that are currently priced into the junk index and considered whether they are likely to be met.3 If we demand an excess spread of 100 bps and assume a 40% recovery rate on defaulted debt, then the High-Yield index embeds an expected default rate of 3.1% (Chart 3). Using a model of the 12-month trailing speculative grade default rate that is based on gross corporate leverage (pre-tax profits over total debt) and C&I lending standards, we estimate that the 12-month default rate will fall between 2.3% and 2.8%, below what the market currently discounts. Notably, the corporate default rate is tracking at an annualized rate of roughly 1.6% through the first nine months of the year, well below the estimate generated by our model. Another recent report considered different plausible scenarios for junk bond returns during the next 12 months.4 We concluded that junk bond total returns will fall into a range of -0.29% to +1.80% during the next 12 months and that excess returns versus duration-matched Treasuries will be between +0.94% and +1.84%. MBS: Underweight Chart 4MBS Market Overview
MBS Market Overview
MBS Market Overview
Mortgage-Backed Securities underperformed the duration-equivalent Treasury index by 1 basis point in October, dragging year-to-date excess returns down to -44 bps. The nominal spread between conventional 30-year MBS and equivalent-duration Treasuries tightened 16 bps in October. The spread looks tight relative to levels seen during the past year and relative to the pace of mortgage refinancings (Chart 4). The conventional 30-year MBS option-adjusted spread (OAS) tightened 3 bps in October to reach 29 bps (panel 3). This is only just above the 28 bps offered by Aaa-rated consumer ABS but below the 54 bps offered by Aa-rated corporate bonds and the 30 bps offered by Agency CMBS. In a recent report we looked at MBS performance and valuation across the coupon stack.5 We noted that the higher convexity of high-coupon MBS makes them likely to outperform lower-coupon MBS in a rising yield environment. Higher coupon MBS also have greater OAS than lower coupons. This makes the high-coupon MBS more likely to outperform in a flat bond yield environment as well. Given our view that bond yields will be higher in 6-12 months, we recommend favoring high coupons (4%, 4.5%) over low coupons (2%, 2.5%, 3%) within an overall underweight allocation to Agency MBS. Government-Related: Neutral Chart 5Government-Related Market Overview
Government-Related Market Overview
Government-Related Market Overview
The Government-Related index performed in-line with the duration-equivalent Treasury index in October, leaving year-to-date excess returns unchanged at 68 bps. Sovereign debt outperformed duration-equivalent Treasuries by 23 basis points October, bringing year-to-date excess returns up to -65 bps. Foreign Agencies underperformed the Treasury benchmark by 5 bps on the month, dragging year-to-date excess returns down to +44 bps. Local Authority bonds outperformed by 16 bps in October, bringing year-to-date excess returns up to +423 bps. Domestic Agency bonds underperformed by 15 bps, dragging year-to-date excess returns down to +9 bps. Supranationals underperformed by 11 bps, dragging year-to-date excess returns down to +16 bps. The investment grade Emerging Market Sovereign bond index outperformed the equivalent-duration US corporate bond index by 35 bps in October. The Emerging Market Corporate & Quasi-Sovereign index delivered 8 bps of outperformance versus duration-matched US corporates (Chart 5). Despite this outperformance, both indexes continue to offer significant yield advantages versus US corporate bonds with the same credit rating and duration. We continue to recommend overweighting USD-denominated EM sovereigns and corporates versus investment grade US corporates with the same credit rating and duration.6 Within EM sovereigns, attractive countries include: Russia, Mexico, Indonesia, Saudi Arabia, UAE and Qatar. Municipal Bonds: Overweight Chart 6Municipal Market Overview
Municipal Market Overview
Municipal Market Overview
Municipal bonds outperformed the duration-equivalent Treasury index by 48 basis points in October, bringing year-to-date excess returns up to +341 bps (before adjusting for the tax advantage). The economic and policy back-drop remains favorable for municipal bond performance. Trailing 4-quarter net state & local government savings are incredibly high (Chart 6) and individual tax hikes will only increase the attractiveness of tax-exempt munis if they are included in the upcoming reconciliation bill. Last week’s report showed that the average duration of municipal bond indexes has fallen significantly during the past few decades, a trend that has implications for how we should perceive municipal bond valuation.7 Specifically, the trend makes municipal bonds more attractive relative to both Treasury securities and investment grade corporates. Long-maturity municipal bonds are especially compelling. We calculate that 17-year+ maturity General Obligation Munis offer a before-tax yield pick-up relative to credit rating and duration-matched corporate credit. The same goes for 17-year+ Revenue bonds. High-yield muni spreads are reasonably attractive relative to high-yield corporates (panel 4), but we recommend only a neutral allocation to high-yield munis versus high-yield corporates. The deep negative convexity of high-yield munis makes them susceptible to extension risk if bond yields rise. Treasury Curve: Buy 2-Year Bullet Versus Cash/10 Barbell Chart 7Treasury Yield Curve Overview
Treasury Yield Curve Overview
Treasury Yield Curve Overview
The Treasury curve bear-flattened dramatically in October. The 2-year/10-year Treasury slope flattened 17 bps to end the month at 107 bps. The 5-year/30-year slope flattened 35 bps to end the month at 75 bps. As is mentioned on the first page of this report, the large flattening of the yield curve has led us to take profits on our prior 2/10 flattener (short 5-year bullet versus 2/10 barbell) and to initiate a 2/10 curve steepener (long 2-year bullet versus cash/10 barbell). We also noted on the front page that we still expect the 2/10 slope to flatten during the next 12 months, just not by as much as what is currently priced into the forward curve. The 2/5/10 butterfly spread has risen a lot during the past few weeks and it now looks extremely high, both in absolute terms and relative to our fair value model (Chart 7). The 2/5/10 butterfly spread can rise because of either 2/5 steepening or 5/10 flattening. We contend that the current elevated 2/5/10 butterfly is mostly the result of a 5/10 slope that is too flat, not a 2/5 slope that is too steep. The bottom two panels of Chart 7 show the 2/5 and 5/10 slopes along with dashed lines indicating where those slopes were on prior Fed liftoff dates in 2015 and 2004. We see that the 2/5 slope is not unusually steep compared to those prior liftoff dates, but the 5/10 slope is unusually flat. For this reason, we want long exposure to the 2-year note and short exposure to the 10-year note between now and Fed liftoff in late-2022. The best way to achieve this exposure is to buy the 2-year note and short a duration-matched barbell consisting of the 10-year note and cash. TIPS: Neutral Chart 8TIPS Market Overview
TIPS Market Overview
TIPS Market Overview
TIPS outperformed the duration-equivalent nominal Treasury index by 106 basis points in October, bringing year-to-date excess returns up to +740 bps. The 10-year TIPS breakeven inflation rate rose 15 bps on the month and the 5-year/5-year forward TIPS breakeven inflation rate fell 10 bps. At 2.54%, the 10-year TIPS breakeven inflation rate is now slightly above the 2.3% to 2.5% range that is consistent with inflation expectations being well-anchored around the Fed’s target (Chart 8). Meanwhile, at 2.14%, the 5-year/5-year forward TIPS breakeven inflation rate has dipped below the Fed’s target range (panel 3). The divergence between 10-year and 5-year/5-year breakeven rates underscores the flatness of the inflation curve (bottom panel). Near-term inflation expectations are extremely high, but they decline sharply further out the curve. Our view is that inflationary pressures will wane during the next 6-12 months and this will lead to a steep decline in short-maturity TIPS breakeven inflation rates.8 Breakeven rates at the long-end should remain relatively close to the Fed’s target range. We recommend positioning for this outcome by entering inflation curve steepeners or real yield curve (aka TIPS curve) flatteners. We also advise entering an outright short position in 2-year TIPS. The 2-year TIPS yield has a lot of room to rise as the cost of 2-year inflation compensation falls and the 2-year nominal yield remains close to its fair value. ABS: Overweight Chart 9ABS Market Overview
ABS Market Overview
ABS Market Overview
Asset-Backed Securities underperformed the duration-equivalent Treasury index by 7 basis points in October, dragging year-to-date excess returns down to +35 bps. Aaa-rated ABS underperformed by 8 bps on the month, dragging year-to-date excess returns down to +25 bps. Non-Aaa ABS underperformed by 5 bps, dragging year-to-date excess returns down to +93 bps. The stimulus from last year’s CARES Act led to a significant increase in household savings when individual checks were mailed in April 2020. That excess savings has still not been spent and the most recent round of stimulus checks has only added to the stockpile (Chart 9). The extraordinarily large stock of household savings means that the collateral quality of consumer ABS is also extraordinarily high. Indeed, many households have been using their windfalls to pay down consumer debt (bottom panel). Investors should remain overweight consumer ABS and should also take advantage of the high quality of household balance sheets by moving down the quality spectrum. Non-Agency CMBS: Neutral Chart 10CMBS Market Overview
CMBS Market Overview
CMBS Market Overview
Non-Agency Commercial Mortgage-Backed Securities outperformed the duration-equivalent Treasury index by 1 basis point in October, bringing year-to-date excess returns up to +196 bps. Aaa Non-Agency CMBS underperformed Treasuries by 3 bps in October, dragging year-to-date excess returns down to +93 bps. Non-Aaa Non-Agency CMBS outperformed Treasuries by 17 bps, bringing year-to-date excess returns up to +543 bps (Chart 10). Though returns have been strong and spreads remain attractive, particularly for lower-rated CMBS, we continue to recommend only a neutral allocation to the sector because of the structurally challenging environment for commercial real estate. Agency CMBS: Overweight Agency CMBS outperformed the duration-equivalent Treasury index by 12 basis points in October, bringing year-to-date excess returns up to +105 bps. The average index option-adjusted spread tightened 3 bps on the month. It currently sits at 30 bps (bottom panel). Though Agency CMBS spreads have recovered to well below their pre-COVID levels, they still look attractive compared to other similarly risky spread products. Stay overweight. Appendix A: Butterfly Strategy Valuations The following tables present the current read-outs from our butterfly spread models. We use these models to identify opportunities to take duration-neutral positions across the Treasury curve. The following two Special Reports explain the models in more detail: US Bond Strategy Special Report, “Bullets, Barbells And Butterflies”, dated July 25, 2017, available at usbs.bcaresearch.com US Bond Strategy Special Report, “More Bullets, Barbells And Butterflies”, dated May 15, 2018, available at usbs.bcaresearch.com Table 4 shows the raw residuals from each model. A positive value indicates that the bullet is cheap relative to the duration-matched barbell. A negative value indicates that the barbell is cheap relative to the bullet. Table 4Butterfly Strategy Valuation: Raw Residuals In Basis Points (As Of October 29th, 2021)
Curve Flatteners Are Too Expensive
Curve Flatteners Are Too Expensive
Table 5 scales the raw residuals in Table 4 by their historical means and standard deviations. This facilitates comparison between the different butterfly spreads. Table 5Butterfly Strategy Valuation: Standardized Residuals (As Of October 29th, 2021)
Curve Flatteners Are Too Expensive
Curve Flatteners Are Too Expensive
Table 6 flips the models on their heads. It shows the change in the slope between the two barbell maturities that must be realized during the next six months to make returns between the bullet and barbell equal. For example, a reading of -60 bps in the 5 over 2/10 cell means that we would expect the 5-year to outperform the 2/10 if the 2/10 flattens by less than 60 bps during the next six months. Otherwise, we would expect the 2/10 barbell to outperform the 5-year bullet. Table 6Discounted Slope Change During Next 6 Months (BPs)
Curve Flatteners Are Too Expensive
Curve Flatteners Are Too Expensive
Appendix B: Excess Return Bond Map The Excess Return Bond Map is used to assess the relative risk/reward trade-off between different sectors of the US bond market. It is a purely computational exercise and does not impose any macroeconomic view. The Map’s vertical axis shows 12-month expected excess returns. These are proxied by each sector’s option-adjusted spread. Sectors plotting further toward the top of the Map have higher expected returns and vice-versa. Our novel risk measure called the “Risk Of Losing 100 bps” is shown on the Map’s horizontal axis. To calculate it, we first compute the spread widening required on a 12-month horizon for each sector to lose 100 bps or more relative to a duration-matched position in Treasury securities. Then, we divide that amount of spread widening by each sector’s historical spread volatility. The end result is the number of standard deviations of 12-month spread widening required for each sector to lose 100 bps or more versus a position in Treasuries. Lower risk sectors plot further to the right of the Map, and higher risk sectors plot further to the left.
Chart 11
Ryan Swift US Bond Strategist rswift@bcaresearch.com Footnotes 1 Please see US Bond Strategy Weekly Report, “Expected Returns In Corporate Bonds”, dated September 21, 2021. 2 Please see US Bond Strategy Weekly Report, “The Collapsing Credit Risk Premium”, dated July 20, 2021. 3 Please see US Bond Strategy Weekly Report, “The Post-FOMC Credit Environment”, dated June 29, 2021. 4 Please see US Bond Strategy Weekly Report, “Expected Returns In Corporate Bonds”, dated September 21, 2021. 5 Please see US Bond Strategy Weekly Report, “A New Conundrum”, dated April 20, 2021. 6 For more details please see US Bond Strategy Weekly Report, “Damage Assessment”, dated September 28, 2021. 7 Please see US Bond Strategy Weekly Report, “The Best & Worst Spots On The Yield Curve”, dated October 26, 2021. 8 Please see US Bond Strategy Weekly Report, “Right Price, Wrong Reason”, dated October 19, 2021.
Image
The markets were deluged by a lot of information in late October. Several central banks made surprise moves towards tightening (the Bank of Canada, for example, ended asset purchases, and the Reserve Bank of Australia effectively abandoned its yield-curve control). Inflation continued to surprise on the upside (headline CPI in the US is now 5.4% year-on-year). But, at the same time, there were signs of faltering growth with, for example, US real GDP growth in Q3 coming in at only 2.0% quarter-on-quarter annualized, compared to 6.7% in Q2. This caused a flattening of the yield curve in many countries, as markets priced in faster monetary tightening but lower long-term growth (Chart 1). Nonetheless, equities shrugged off the barrage of news, with the S&P500 ending the month at a new high. All this highlights what we discussed in our latest Quarterly: That the second year of a bull market is often tricky, resulting in lower (but still positive) returns from equities and higher volatility. For risk assets to continue to outperform, our view of a Goldilocks environment needs to be “just right”: The economy must not be too hot or too cold. We think it will be – and so stay overweight equities versus bonds. But investors should be aware of the risks on either side. How too hot? Inflation is broadening out (at least in the US, UK, Australia and Canada, though not in the euro zone and Japan) and is no longer limited to items which saw unusually strong demand during the pandemic but where supply is constrained (Chart 2). Chart 1What Is The Message Of Flattening Yield Curves?
What Is The Message Of Flattening Yield Curves?
What Is The Message Of Flattening Yield Curves?
Chart 2Inflation Is Broadening Out In The US
Inflation Is Broadening Out In The US
Inflation Is Broadening Out In The US
There is a risk that this turns into a wage-price spiral as employees, amid a tight labor market, push for higher wages to offset rising prices. We find that wages tend to follow prices with a lag of 6-12 months (Chart 3). The Atlanta Fed Wage Tracker (good for gauging underlying wage pressures since it looks only at employees who have been in a job for 12 months or more) is already at 3.5% and looks set to rise further. On the back of these inflationary moves, the market has significantly pulled forward the date of central bank tightening. Futures now imply that the Fed will raise rates in both July and December next year (Chart 4) and that other major developed central banks will also raise multiple times over the next 14 months (Table 1). Breakeven inflation rates have also risen substantially (Chart 5). Chart 3Wages Tend To Rise After Prices Rise
Wages Tend To Rise After Prices Rise
Wages Tend To Rise After Prices Rise
Chart 4Will The Fed Really Hike This Soon?
Will The Fed Really Hike This Soon?
Will The Fed Really Hike This Soon?
Table 1Futures Implied Path Of Rate Hikes
Monthly Portfolio Update: The Risks To Goldilocks
Monthly Portfolio Update: The Risks To Goldilocks
Chart 5Breakevens Suggest Higher Inflation
Breakevens Suggest Higher Inflation
Breakevens Suggest Higher Inflation
We think these moves are a little excessive. There are several reasons why inflation might cool next year. Companies are rushing to increase capacity to unblock supply bottlenecks. For example, semiconductor production has already begun to increase, bringing down DRAM prices over the past few months (Chart 6). Another big contributor to broad-based inflation has been a 126% increase in container shipping costs since the start of the year (Chart 7). But currently the number of container ships on order is at a 10-year high; these new ships will be delivered over the next two years. Such deflationary forces should pull down core inflation next year (though we stick to our longstanding view that for multiple structural reasons – demographics, the end of globalization, central bank dovishness, the transition away from fossil fuels – inflation will trend up over the next five years). Chart 6DRAM Prices Falling As Production Ramps Up
DRAM Prices Falling As Production Ramps Up
DRAM Prices Falling As Production Ramps Up
Chart 7All Those Ships On Order Should Bring Down Shipping Costs
All Those Ships On Order Should Bring Down Shipping Costs
All Those Ships On Order Should Bring Down Shipping Costs
The Fed, therefore, will not be in a rush to raise rates. It does not see the labor market as anywhere close to “maximum employment” – it has not defined what it means by this, but we would see it as a 3.8% unemployment rate (the median FOMC dot for the equilibrium unemployment rate) and the prime-age participation rate back to its 2019 level (Chart 8). We continue to expect the first rate hike only in December next year. The Fed will feel the need to override its employment criterion only if long-term inflation expectations become unanchored – but the 5-year 5-year forward breakeven rate is only at 2.3%, within the Fed’s effective CPI target range of 2.3-2.5% (Chart 5). We remain comfortable with our view of only a moderate rise in long-term rates, with the US 10-year Treasury yield at 1.7% by end-2021, and reaching 2-2.25% at the time of the first Fed rate hike. It is also worth emphasizing that even a fairly sharp rise in long-term rates has historically almost always coincided with strong equity performance (Chart 9 and Table 2). This has again been evident in the past 12 months: When rates rose between August 2020 and March 2021, and then from July 2021, equities performed strongly. Chart 8We Are Not Back To "Maximum Employment"
We Are Not Back To "Maximum Employment"
We Are Not Back To "Maximum Employment"
Chart 9Rising Rates Are Usually Accompanied By A Rising Stock Market
Rising Rates Are Usually Accompanied By A Rising Stock Market
Rising Rates Are Usually Accompanied By A Rising Stock Market
Table 2Episodes Of Rising Long-Term Rates Since 1990
Monthly Portfolio Update: The Risks To Goldilocks
Monthly Portfolio Update: The Risks To Goldilocks
But could the economy get too cold? We would discount the weak US GDP reading: It was mostly due to production shortages, especially in autos, which pushed down consumption on durable goods by 26% QoQ annualized, and by some softness in spending on services due to the delta Covid variant, the impact of which is now fading. US growth should continue to be supported by a combination of the $2.5 trillion of excess household savings, strong capex as companies boost their production capacity, and a further 5% of GDP in fiscal stimulus that should be passed by Congress by year-end. Similar conditions apply in other developed economies. Chart 10Real Estate Is A Big Part Of Chinese GDP
Real Estate Is A Big Part Of Chinese GDP
Real Estate Is A Big Part Of Chinese GDP
We see three principal risks to this positive outlook: A new strain of Covid-19 that proves resistant to current vaccines – unlikely but not impossible. Our geopolitical strategists worry about Iran, which may have a nuclear bomb ready by December, prompting Israel to bomb the country. Iran would likely react by hampering oil supplies, even blocking the Strait of Hormuz, through which 25% of global oil flows. Chinese growth has been slowing and the impact from the problems at Evergrande is still unclear. Real estate is a major part of the Chinese economy, with residential investment comprising 10% of GDP (Chart 10) and, broadly defined to include construction and building materials, real estate overall perhaps as much as one-third. Our China strategists don’t expect the government to launch a major stimulus which would bail out the industry, since it is happy with the way that property-related lending has been shrinking in recent years (Chart 11). We expect the slowdown in Chinese credit growth to bottom out over the coming few months, but economic activity may have further to slow (Chart 12), and there is a risk that the authorities are unable to control the fallout from the property market. Chart 11Chinese Authorities Are Happy To See Slowing Property Lending
Chinese Authorities Are Happy To See Slowing Property Lending
Chinese Authorities Are Happy To See Slowing Property Lending
Chart 12When Will Credit Growth Bottom?
When Will Credit Growth Bottom?
When Will Credit Growth Bottom?
Fixed Income: Given the macro environment described above, we remain underweight bonds and short duration. If we assume 1) a Fed liftoff in December 2022, 2) 100 basis points of rate hikes over the following year, and 3) a terminal Fed Funds Rate of 2.08% (the median forecast from the New York Fed’s Survey of Market Participants), 10-year US Treasurys will return -0.2% over the next 12 months, and 2-year Treasurys +0.3%.1 TIPs have overshot fair value and, although we remain neutral since they a tail-risk hedge against high inflation over the next five years, we would especially avoid 2-year TIPS which look very overvalued. We see some pockets of selective value in lower-quality high-yield bonds, specifically US Ba- and Caa-rated issues, which are still trading at breakeven spreads around the 35th historical percentile, whereas higher-rated bonds look very expensive (Chart 13). For US tax-paying investors, municipal bonds look particularly attractive at the moment, with general-obligation (GO) munis trading at a duration-matched yield higher than Treasurys even before tax considerations (Chart 14). Our US bond strategists have recently gone maximum overweight.
Chart 13
Chart 14Muni Bonds Are A Steal
Muni Bonds Are A Steal
Muni Bonds Are A Steal
Equities: We retain our longstanding preference for US equities over other Developed Markets. US equities have outperformed this year, irrespective of whether rates were rising or falling, or how US growth was surprising relative to the rest of the world, emphasizing the much stronger fundamentals of the US market (Chart 15). Analysts’ forecasts for the next few quarters look quite cautious, and so earnings surprises can push US stock prices up further (Chart 16). We reiterate the neutral on China but underweight on Emerging Markets ex-China that we initiated in our latest Quarterly. Our sector overweights are a mixture of cyclicals (Industrials), rising-interest-rate plays (Financials), and defensives (Heath Care). Chart 15US Equites Outperformed This Year Whatever Happened
US Equites Outperformed This Year Whatever Happened
US Equites Outperformed This Year Whatever Happened
Chart 16Analysts Are Pessimistic About The Next Couple Of Quarters
Analysts Are Pessimistic About The Next Couple Of Quarters
Analysts Are Pessimistic About The Next Couple Of Quarters
Currencies: We continue to expect the US dollar to be stuck in its trading range and so stay neutral. Recent moves in prospective relative monetary policy bring us to change two of our currency recommendations. We close our underweight on the Australian dollar. The recent rise in Australian inflation (with both trimmed mean and 10-year breakevens now above 2% – Chart 17) has brought forward the timing of the first rate hike and should push up relative real rates (Chart 18). We lower our recommendation on the Japanese yen from overweight to neutral. The Bank of Japan will not raise rates any time soon, even when other central banks are tightening. This will push real-rate differentials against the yen (Chart 18, panel 2). Chart 17Australian Inflation Is Picking Up
Australian Inflation Is Picking Up
Australian Inflation Is Picking Up
Chart 18Real Rates Moving In Favor Of The AUD And Against The JPY
Real Rates Moving In Favor Of The AUD And Against The JPY
Real Rates Moving In Favor Of The AUD And Against The JPY
Chart 19Chinese-Related Metals' Prices Are Falling
Chinese-Related Metals' Prices Are Falling
Chinese-Related Metals' Prices Are Falling
Commodities: We remain cautious on those industrial metals which are most sensitive to slowing Chinese growth and its weakening property market. The fall in iron ore prices since July is now being followed by aluminum. However, metals which are increasingly driven by investment in alternative energy, notably copper, are likely to hold up better (Chart 19). We are underweight the equity Materials sector and neutral on the commodities asset class. The Brent crude oil price has broadly reached our energy strategists’ forecasts of $80/bbl on average in 2022 and $81 in 2023 (Chart 20). Although the forward curve is lower than this, with December-22 Brent at only $75/bbl, it is a misapprehension to characterize this as the market forecasting that the oil price will fall. Backwardation (where futures prices are lower than spot) is the usual state of affairs for structural reasons (for example, producers hedging production forward). The market typically moves to contango only when the oil price has fallen sharply and reserves are high (Chart 21). We remain neutral on the equities Energy sector. Chart 20Brent Has Reached Our 2022 And 2023 Forecast Level
Brent Has Reached Our 2022 And 2023 Forecast Level
Brent Has Reached Our 2022 And 2023 Forecast Level
Chart 21Lower Oil Futures Don't Mean Oil Price Is Forecast To Fall
Lower Oil Futures Don't Mean Oil Price Is Forecast To Fall
Lower Oil Futures Don't Mean Oil Price Is Forecast To Fall
Garry Evans, Senior Vice President Global Asset Allocation garry@bcaresearch.com GAA Asset Allocation