Monetary

Highlights Monetary Policy: It’s all but certain that tapering will begin next month and conclude by the middle of next year, but the FOMC is currently split right down the middle on whether it will be appropriate to lift rates in H2 2022. We present five factors to track to decide when the Fed will hike rates. Yield Curve: A bear-flattening of the nominal yield curve remains the most likely scenario for the next 6-12 months. Maintain a position short the 5-year bullet versus a duration-matched 2/10 barbell. TIPS: Investors should enter 2/10 steepeners on the inflation compensation curve and/or 2/10 flatteners on the real (TIPS) curve. The 2-year real yield, in particular, has a lot of upside during the next 6-12 months. EM Bonds: US bond investors should shift some allocation out of expensive US investment grade corporate bonds and into USD-denominated investment grade EM Sovereigns and Corporates where valuation is more compelling. Feature This past week was quite eventful for US bond investors. First, the Fed presented its September update on Wednesday, offering some hints about the timing and pace of asset purchase tapering alongside its updated economic and interest rate forecasts. Then, bonds sold off sharply on Thursday, Friday and Monday with the 10-year Treasury yield rising all the way to 1.49%. The first section of this week’s report looks at what we learned from last week’s FOMC meeting and opines on some monetary policy questions that remain unanswered. The second section updates our views on portfolio duration, the yield curve and TIPS in light of last week’s large market moves. Finally, we conclude with an update on the outlook for USD-denominated Emerging Market bonds. Powell Answers Some Small Questions, Avoids The Big One The Small Questions The start date for asset purchase tapering is the first small question that the Fed answered last week. A new sentence was added to the post-meeting statement saying that “a moderation in the pace of asset purchases may soon be warranted” and, in his press conference, Chair Powell clarified that the purpose of the new language is “to put notice out there that [tapering] could come as soon as the next meeting”. After this statement from the Fed, we expect asset purchase tapering to be announced at the next FOMC meeting on November 3rd. A delay until December is possible if September’s employment report is a massive disappointment, but the bar for delaying tapering beyond November appears high. Chair Powell also shed some light on a second small question related to the Fed’s balance sheet. Specifically, the pace of asset purchase tapering. In his press conference the Chair said that “participants generally view that, so long as the recovery remains on track, a gradual tapering process that concludes around the middle of next year is likely to be appropriate.” The information about the pace of tapering is slightly more interesting than the start date, if only because Fed policymakers have expressed a desire for net purchases to reach zero before the first interest rate increase. The fact that the Fed is planning to reach net zero purchases by the middle of next year suggests that it wants to leave the door open for a possible rate hike in the second half of 2022. This message was confirmed by the Fed’s updated interest rate projections (Chart 1). The projections revealed an even split (9 vs. 9) on the Committee between those that expect at least one 25 basis point rate increase before the end of 2022 and those that do not expect to lift rates next year. It’s also notable that, out of the 9 participants that don’t expect a rate hike in 2022, 8 anticipate lifting rates in 2023. Chart 1Rate Expectations
Rate Expectations
Rate Expectations
Of course, as Chair Powell often points out, the Fed’s interest rate projections are contingent on the future state of the economy and will almost certainly be revised as the outlook evolves. What’s more important from a forecasting perspective is knowing how the Fed will react to different economic conditions. The Big Question With that in mind, we know that the Fed has promised not to lift rates until the labor market reaches “maximum employment”. However, as we noted in a recent report, the Fed hasn’t provided much detail on what “maximum employment” actually means.1 Powell’s comments last week didn’t add much clarity, but we can hunt for clues in the Summary of Economic Projections (SEP). In the SEP, we first notice that 13 FOMC participants expect the unemployment rate to be 3.8% - 3.9% or lower by the end of 2022 (Chart 2A). It is logical to assume that this group includes the 9 participants who expect to lift rates in 2022 and 4 additional ones. We also observe that 17 out of 18 participants anticipate an unemployment rate of 3.8% - 3.9% or lower by the end of 2023 (Chart 2B), exactly matching the number of participants who expect to lift rates by then. We can therefore infer that the Fed views an unemployment rate of roughly 3.8% as consistent with “maximum employment”. That is, FOMC participants tend to have rate hikes penciled into their forecasts once the unemployment rate is below 3.8%. Chart 2AFOMC 2022 Unemployment Rate Projection Distribution
Damage Assessment
Damage Assessment
Chart 2BFOMC 2023 Unemployment Rate Projection Distribution
Damage Assessment
Damage Assessment
The SEP’s inflation forecasts are less illuminating than the unemployment ones. All but 4 participants expect core PCE inflation to be above the Fed’s 2% target at the end of 2022 (Chart 3A) and no FOMC participant is forecasting below-2% core PCE at the end of 2023 (Chart 3B).2 The most we can take away from these forecasts is that 14 FOMC participants expect inflation to be above target in 2022, but five of those participants don’t see the labor market as being tight enough to lift rates by then. Chart 3AFOMC 2022 Core PCE Inflation Rate Projection Distribution
Damage Assessment
Damage Assessment
Chart 3BFOMC 2023 Core PCE Inflation Rate Projection Distribution
Damage Assessment
Damage Assessment
The revelation that FOMC participants view a 3.8% unemployment rate as consistent with “maximum employment” is illuminating, but it doesn’t tell the entire story. We don’t know, for example, what assumptions about labor force participation the different Fed officials are using. Our sense is that the following five criteria will ultimately determine when the Fed starts to lift interest rates: An unemployment rate in the neighborhood of 3.8%. Prime-age (25-54) labor force participation close to its pre-pandemic level (Chart 4, top panel). Accelerating wage growth (Chart 4, bottom 2 panels). Long-dated inflation expectations at or above target levels (Chart 5, top 2 panels). Non-transitory inflation at or above target levels (Chart 5, bottom panel). Bottom Line: The FOMC is currently split right down the middle on whether it will be appropriate to lift rates in 2022, but these forecasts aren’t set in stone and next year’s economic data – particularly the five factors listed above – will determine which group is correct. Chart 4Part Rate & Wage Growth
Part Rate & Wage Growth
Part Rate & Wage Growth
Chart 5Inflation & Inflation Expectations
Inflation & Inflation Expectations
Inflation & Inflation Expectations
Our own view is that the labor market will be sufficiently tight for the Fed to deliver its first rate hike in December 2022, and that rate hikes will proceed more quickly than what is currently priced in the yield curve. US bond investors should maintain below-benchmark portfolio duration. The Fallout In Bond Markets Bonds sold off sharply last Thursday and again yesterday morning. At the time of publication, the 30-year Treasury yield had risen from 1.81% on Wednesday to 2.02% (Chart 6). The 10-year Treasury yield had risen from 1.30% to 1.49% (Chart 6, panel 2). The 5-year yield is up to 0.98% from 0.85% on Wednesday (Chart 6, panel 3), and the 2-year yield is up to 0.28% from 0.24% (Chart 6, panel 4). The yield curve has also steepened since Wednesday, though the 2/10 slope remains well below its March peak (Chart 7). The trend during the past few months has been one of curve steepening out to the 5-year maturity point (Chart 7, panel 2) and flattening beyond that point (Chart 7, bottom 2 panels). Recent market action has led to some steepening beyond the 5-year maturity, but so far that steepening is minor compared to the flattening move we’ve witnessed since the spring. Chart 6Treasury Yield Trends
Treasury Yield Trends
Treasury Yield Trends
Chart 7Treasury Curve Trends
Treasury Curve Trends
Treasury Curve Trends
Nominal Curve We have been recommending a position short the 5-year bullet and long a duration-matched barbell consisting of the 2-year and 10-year notes, and we think this trade will continue to outperform. First, the 5-year/5-year forward Treasury yield is back above 2%, consistent with median estimates of the long-run neutral fed funds rate from the New York Fed’s Surveys of Market Participants (2%) and Primary Dealers (2.25%) (Chart 6, bottom panel). We think it will be difficult for the 5-year/5-year forward yield to rise much above these levels, which makes curve flattening more likely than steepening going forward.3 Second, we updated our work on yield curve scenarios to incorporate recent market action and some new information gleaned from last week’s SEP. In this analysis we estimate fair value levels for different parts of the yield curve as of the end of 2022 based on a scenario for the path of the fed funds rate. For example, if we assume that Fed liftoff occurs in December 2022 and rate hikes proceed at a pace of 75 bps per year (the median pace in the SEP) until the fed funds rate levels-off at 2.08% (consistent with a 2%-2.25% range for the long-run neutral fed funds rate), we calculate that the 2-year yield has 74 bps of upside between now and the end of 2022. This is slightly more than the 65 bps of upside in the 5-year yield and much more than the 37 bps of upside in the 10-year yield (Table 1). Comparing this expected change to what is already discounted in the forward curve, we see that both the 2-year and 10-year yields are expected to exceed their forwards by 6 bps. The 5-year yield is expected to exceed its forward by 16 bps. Table 1Treasury Curve Scenario Analysis
Damage Assessment
Damage Assessment
To us, the message is clear. We want to remain short the 5-year note versus a duration-matched 2/10 barbell. Real & Inflation Curves Chart 8Real & Inflation Curves
Real & Inflation Curves
Real & Inflation Curves
The increase in the 10-year nominal yield since last Wednesday was roughly evenly split between the real and inflation compensation components. Interestingly, inflation drove a greater proportion of the increase at the front-end of the curve, and the 2-year real yield actually fell. We maintain a neutral recommendation on TIPS versus nominal Treasuries, but this week we recommend taking advantage of recent market action by implementing some curve trades across the real and inflation curves. Specifically, we note that the cost of short-maturity inflation compensation remains well above the cost of long-maturity inflation compensation (Chart 8). Going forward, the cost of front-end inflation compensation will fall as inflation moderates from its current extremely high level. Meanwhile, the cost of long-maturity inflation compensation will remain sticky near the Fed’s target levels. This will lead to a steepening of the inflation curve (Chart 8, panel 2). The combination of a steeper inflation curve and a flatter nominal curve will lead to a much flatter real yield curve (Chart 8, bottom 2 panels). The 2-year real yield, in particular, has a lot of upside if inflation moderates, as we expect, and the 2-year nominal yield rises in line with the projections shown in Table 1. Bottom Line: Investors should remain short the 5-year bullet versus a duration-matched 2/10 barbell on the nominal Treasury curve. Investors should also enter 2/10 steepeners on the inflation compensation curve and/or 2/10 flatteners on the real (TIPS) curve. A Quick Update On Emerging Market Bonds The collapse of Chinese real estate behemoth Evergrande dominated headlines for most of the past week, though so far there has been little contagion into USD-denominated credit markets. Unsurprisingly, the spread on Chinese corporate and quasi-sovereign bonds has widened, and there has been some passthrough into both the High-Yield EM USD Corporate & Quasi-Sovereign Index and the High-Yield EM USD Sovereign Index (Chart 9). However, investment grade EM credit spreads have been relatively unaffected by the turmoil, as have US corporate bond spreads (both IG and HY) (Chart 9, bottom 2 panels). While the Evergrande drama – and weakening Chinese economic growth in general – could weigh on USD-denominated EM bond performance in the near-term, we see an excellent buying opportunity in investment grade EM bonds on a 6-12 month horizon. Investment grade EM Sovereigns outperformed credit rating and duration-matched US corporate bonds in the early months of the recovery but have lagged during the past few months (Chart 10). The same is true for the investment grade EM Corporate and Quasi-Sovereign index (Chart 10, panel 3). This is not to say that EM bond performance has been poor – the EM Sovereign index is still up 97 bps versus duration-matched Treasuries on the year – it has simply failed to keep pace with the stellar performance of US corporate bonds. Chart 9No Contagion
No Contagion
No Contagion
Chart 10EM Bonds Versus US Corporates
EM Bonds Versus US Corporates
EM Bonds Versus US Corporates
But that recent stellar performance of US investment grade corporate bonds has left spreads in the sector near historically tight levels. In last week’s report we ran some scenarios for US investment grade corporate bond returns during the next 12 months and concluded that excess returns versus Treasuries are probably capped at 85 bps.4 This makes the current spread advantage in EM Sovereigns (Chart 10, panel 2) and EM Corporates & Quasi-Sovereigns (Chart 10, bottom panel) very compelling. This will be especially true if Emerging Market growth accelerates in 2022 on the back of increased Chinese stimulus and a COVID vaccination campaign that is already picking up steam.5 Bottom Line: US bond investors should shift some allocation out of expensive US investment grade corporate bonds and into USD-denominated investment grade EM Sovereigns and Corporates where valuation is more compelling. Ryan Swift US Bond Strategist rswift@bcaresearch.com Footnotes 1 Please see US Bond Strategy Weekly Report, “2022 Will Be All About Inflation”, dated September 14, 2021. 2 Chart 3B shows that 4 participants expect core PCE inflation of 1.9%-2.0% in 2023, but the SEP also reveals that the minimum forecast for core PCE in 2023 is 2.0%. In other words, all 4 participants in that range are forecasting 2.0%, not 1.9%. 3 For more details on the relationship between our 5-year/5-year forward yield target and the yield curve please see US Bond Strategy Weekly Report, “A Bump On The Road To Recovery”, dated July 27, 2021. 4 Please see US Bond Strategy Weekly Report, “Expected Returns In Corporate Bonds”, dated September 21, 2021. 5 For a recent debate about the outlook for Emerging Market assets please see last Friday’s Webcast: https://www.bcaresearch.com/webcasts/detail/458 Recommended Portfolio Specification Other Recommendations Treasury Index Returns Spread Product Returns
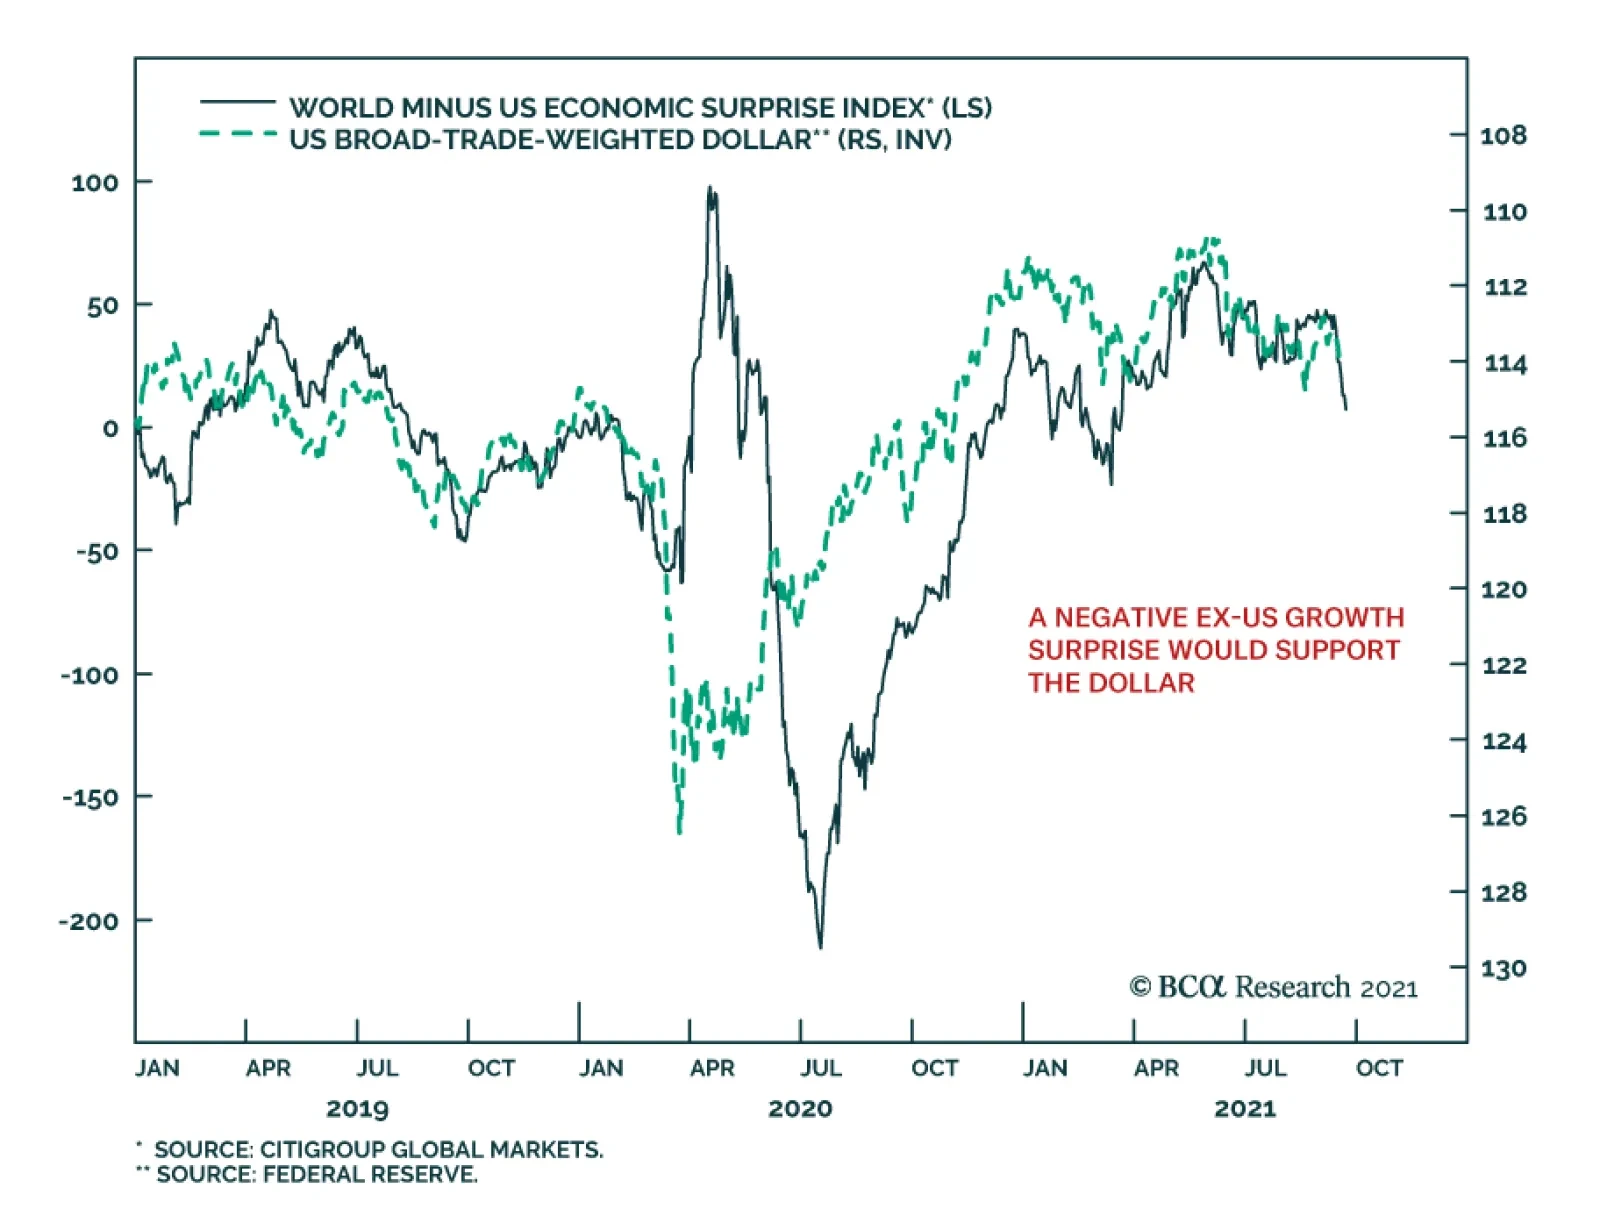
Although the US dollar has appreciated this year, our foreign exchange strategists highlight that from a big picture perspective, dynamics remain tilted against the dollar. True, the DXY is off its May low of 89.6. However, it has failed to break above 94,…
Highlights Economy – We find the leading arguments for why households’ excess savings won’t be spent to be wanting: US households do not commonly demonstrate the detached foresight that Ricardian equivalence takes as given and the trauma-will-change-behavior thesis fails to account for the absence of widespread financial trauma. Markets – Public equities account for a record portion of household wealth, but their share gains are not a sign of a budding mania: Our analysis of the Fed’s Flow of Funds data argues that much of equities’ relative share gains have been driven by structural rather than cyclical factors. Strategy – It would be premature to shift to defensive asset allocation settings if monetary policy is going to remain accommodative for another three years: The rate hike progression envisioned by FOMC participants’ dot-plot projections suggests policy won’t become tight until late 2024 at the earliest. Feature The US Investment Strategy team has been at the more bullish end of the continuum within BCA, and among the broader strategist community, since the spring of 2020. Our view was premised on the idea that the fiscal and monetary policy responses to the pandemic were (and would continue to be) so large that they would overwhelm its adverse effects on the economy and markets. That view came to pass as Congress augmented the CARES Act’s fiscal largesse with two subsequent rounds of direct payments to households earning up to $100,000 per adult and a renewed federal supplement to unemployment insurance (UI) benefits. With the expiration of the UI benefit program at the beginning of the month and the Fed poised to end asset purchases by the middle of next year, clients have begun to ask if our underlying bullish premise still applies. We believe that it does, on the grounds that policy remains on an emergency footing even though the emergency has passed. The fiscal transfers may have ended, but their full effect has yet to be felt. They will support the economy on an ongoing basis as households direct their excess pandemic savings toward consumption. No one knows for sure how much of the excess savings will be spent or when, but the arguments citing Ricardian equivalence or consumer trauma as impediments to consumption are flawed. What If Today’s Income Is Taxed Tomorrow? British classical economist David Ricardo is best known to introductory economics students for comparative advantage, but he also posited that deficit spending may fail to boost aggregate demand because taxpayers, anticipating that they will be tapped in the future to repay state loans, may increase savings to cover future taxes. Despite its theoretical appeal, empirical data in support of Ricardian equivalence is elusive. Two centuries and an ocean removed from Ricardo’s England, we submit that Americans are not known for parsimony, studied caution or a tendency to see the glass as half-empty. Although American households began to rebuild savings after the global financial crisis, an additional dollar has tended to burn a hole in their pockets ever since the baby boomers began reaching adulthood (Chart 1). Chart 1The Searing Trauma Of The Depression Weighed On Consumption Decisions
The Searing Trauma Of The Depression Weighed On Consumption Decisions
The Searing Trauma Of The Depression Weighed On Consumption Decisions
Even if Americans were wont to consider future tax burdens, it may be rational for the households who received the fiscal transfers to assume they will largely escape them unless their relative income surges. Per the most recent adjusted gross income (AGI) distribution data (for tax year 2018), 70% of taxpayers earn $75,000 or less (Chart 2). Single taxpayers meeting that threshold (and married taxpayers earning $150,000 or less) received the full amount of the economic impact payments authorized by the CARES Act and subsequent legislation. That bottom 70% paid just 5.1% of AGI in federal taxes (Chart 3), and the current political climate points in the direction of an increasingly progressive tax system, so they may not have to worry about being called upon to cover the expanding deficit down the road. Chart 2The Income Distribution Is Top Heavy ...
Post-Traumatic Bliss
Post-Traumatic Bliss
Chart 3…But So Is The Tax Burden
Post-Traumatic Bliss
Post-Traumatic Bliss
The (Not So Traumatic) Economic Trauma Of COVID-19 While we are confident that Ricardian equivalence will not act as an impediment to consumption, the ultimate disposition of households’ excess pandemic savings is unknown. Our working assumption has been that half of the savings will be spent across 2021 and 2022. Though we do not have any close antecedents for what households might do with a savings windfall equivalent to 10% of a year’s GDP amassed over a thirteen-month span, we reject the notion that those who experienced COVID-19 will behave like the many shell-shocked survivors of the Great Depression who became lifelong precautionary savers. However terrible the human cost of COVID, it did not ravage American households’ financial position; as the Fed’s latest Flow of Funds report showed, their balance sheets flourished, allowing the vast majority of them to escape any sense of financial trauma. Per the Flow of Funds, American household wealth grew by nearly $6 trillion in the second quarter, extending the last five quarters’ gains to $31 trillion since financial markets cratered when the pandemic burst forth in the first quarter of 2020. The 22% annualized five-quarter gain is nearly four standard deviations above the mean and blows away 4Q03 through 4Q04’s 14% second-place mark by two full standard deviations (Chart 4, top panel). The current run sets a record even when it’s stretched to six quarters to include 1Q20, the worst quarter in series history, and the five- and six-quarter gains are also pacesetters after adjusting for inflation (Chart 4, bottom panel). Chart 4Recessions Aren't So Bad When Congress And The Fed Throw Everything They Have At Them
Recessions Aren't So Bad When Congress And The Fed Throw Everything They Have At Them
Recessions Aren't So Bad When Congress And The Fed Throw Everything They Have At Them
Changes in household net worth lead consumption growth with a two-quarter lag (Chart 5), though the four quarters before the most recent one (the red dots with negative consumption growth) were notable outliers. 2Q21 consumption was just a little more than a percentage point below the best-fit line, however, so it is closing in on its modeled value and we expect it will overshoot it in coming quarters upon the release of pent-up demand. We do not believe that the pandemic will dampen household spending simply because the broad mass of consumers did not experience financial trauma on a scale that would alter future behavior. As household wealth and income data have shown, this recession has been a boon for most Americans. Chart 5Consumption Overshoots Are On The Way
Post-Traumatic Bliss
Post-Traumatic Bliss
Chart 6Fiscal Shock And Awe
Post-Traumatic Bliss
Post-Traumatic Bliss
We additionally reject the notion that households have learned a lesson that will make them want to hold more savings. The financial lesson of the pandemic seems to be that policymakers will do their utmost to shelter them from calamity. Between the economic impact payments (Chart 6, top panel) and the UI benefit supplement (Chart 6, middle panel), Congress directly sent nearly $1.5 trillion to US households to offset $300 billion of lost wages (Chart 6, bottom panel). COVID-19 inflicted terrible distress on those who lost loved ones and witnessed or experienced near fatal suffering, but it boosted the lower three quartiles of households who received transfers and the top decile of households who reveled in the financial markets’ advance. Those who experienced it will not hoard their pennies and shun debt like many of the Depression’s survivors; they are more likely to have experienced post-traumatic bliss than stress when it comes to their financial outlook. Too Much Of A Good Thing? We periodically check in on the Flow of Funds for insight into the evolution of households’ asset allocations and the share of net worth accounted for by homes. Directly owned equities and mutual funds have taken share from the other major categories throughout the pandemic run (Chart 7) and now account for a record share of household financial assets after having surpassed their 2000 highs (Chart 8, top panel). It is sensible to approach any equity milestone that invokes the dot-com bubble with some trepidation, but structural factors go a long way toward explaining the new allocation peak. The financialization of the economy has steadily advanced since the Flow of Funds data began to be compiled in 1951, promoting public equity ownership, and consolidation has supported the transfer of commercial ownership from mom-and-pop operations to corporate interests, many of which are publicly traded. Overall equity in businesses as a share of household net worth is merely in line with its ‘50s levels (Chart 8, bottom panel). Chart 7The Running Of The Bulls
The Running Of The Bulls
The Running Of The Bulls
Chart 8From Mom And Pop To Broad And Wall
From Mom And Pop To Broad And Wall
From Mom And Pop To Broad And Wall
Home price appreciation has picked up, but it is not out of the ordinary (Chart 9). Home equity gains have outstripped home price gains, relative to each series’ history, testifying to prudent behavior on the part of borrowers and lenders. The low aggregate mortgage loan-to-value ratio (Chart 10) suggests that slowing home price appreciation, or even an outright decline, would not be a source of economic instability. Chart 9Home Price Gains Are Not Out Of The Ordinary ...
Home Price Gains Are Not Out Of The Ordinary ...
Home Price Gains Are Not Out Of The Ordinary ...
Chart 10... And Leverage Levels Are Not A Concern
... And Leverage Levels Are Not A Concern
... And Leverage Levels Are Not A Concern
The Fed Signals That Tapering Is Near Though the FOMC did not adjust the pace of its asset purchases last week, it indicated that tapering will most likely begin after its November meeting. Chair Powell noted that the economy has made substantial further progress toward reaching the committee’s inflation goal and expressed that “many” members feel that it has made substantial progress toward achieving its full employment objective as well, going so far as to volunteer his personal view that the employment test has been “all but met.” Per the committee’s discussions, the purchases will likely end around the middle of next year if the economy progresses in line with its expectations. The committee would not be talking about reducing the accommodation it’s providing the economy if it weren’t secure in the sense that it is on solid footing. Powell expressed satisfaction with the evolution of inflation expectations (Chart 11) and although the real GDP forecast for this year was lowered in the summary of economic projections (the “dots”), next year’s forecast was raised and slightly higher inflation expectations imply that nominal GDP growth will remain quite robust. A shift in two members’ fed funds rate projections brought the median member’s liftoff date to 2022 from 2023, in line with our view. Chart 11The Fed Has Succeeded In Firming Up Inflation Expectations
The Fed Has Succeeded In Firming Up Inflation Expectations
The Fed Has Succeeded In Firming Up Inflation Expectations
The chair reiterated that tapering – slowing the pace of accommodation – and hiking the fed funds rate – slowing the economy – are distinct actions subject to separate criteria. We see liftoff as a more significant action than tapering, but much will depend on the pace at which the committee lifts the fed funds rate. It is too soon to speculate on the pace, but we stress that the big move for financial markets will occur once the policy rate exceeds the neutral rate. If the latter is somewhere around 2%, the rate hike pace embedded in the dots suggests that it may take until the end of 2024 or early 2025 before monetary policy becomes restrictive. Investment Implications If monetary policy is not going to become tight for another three years, it is premature to shift a portfolio to more defensive settings, especially for anyone sharing our three-to-twelve-month cyclical timeframe. Growth will be robust in the near term, supported by the income boost that the lower three quartiles of taxpayers received from fiscal transfers and the way wealthier households cleaned up as financial asset prices soared. We expect that a hearty portion of the newly minted wealth will be spent, as Ricardian equivalence requires a longer attention span than Americans typically exhibit, and the pandemic was largely trauma-free for most households from a financial perspective. The clearest policy lesson that a citizen should have taken from COVID is that Congress and the Fed have his/her back in a big way. We are staying the course with our risk-friendly asset allocation recommendations. Doug Peta, CFA Chief US Investment Strategist dougp@bcaresearch.com
Highlights The Evergrande crisis is not China’s Lehman moment. Nonetheless, Chinese construction activity will decelerate further in response to this shock. Global equities are frothy enough that a weaker-than-expected Chinese construction sector will remain a near-term risk to stocks prices. European markets are more exposed to this risk than US ones. Tactically, this creates a dangerous environment for cyclicals in general and materials in particular. Healthcare and Swiss stocks would be the winners. Despite these near-term hurdles, we maintain a pro-cyclical portfolio stance, which we will protect with some temporary hedges. We will lift these hedges if the EURO STOXX corrects into the 430-420 zone. A busy week for European central banks confirms our negative stance on EUR/GBP, EUR/SEK, and EUR/NOK. While EUR/CHF has upside, Swiss stocks should outperform Euro Area defensives. Stay underweight UK Gilts in fixed-income portfolios. Feature The collapse of property developer Evergrande creates an important risk for European markets. It threatens to slow Chinese construction activity further, which affects European assets that are heavily exposed to the Chinese real estate sector, directly and indirectly. This risk is mostly frontloaded, as Chinese authorities cannot afford a complete meltdown of the domestic property sector. Moreover, this economy has slowed significantly and more policy support is bound to take place. Additionally, forces outside China create important counterweights that will allow Europe to thrive despite the near-term clouds. While we see more short-term risk for European stocks and cyclical sectors, the 18-month cyclical outlook remains bright. Similarly, European stocks will not outperform US ones when Chinese real estate activity remains a source of downside surprise; but they will afterward. China’s Construction Slowdown Is Not Over The Evergrande crisis is not China’s Lehman moment. Beijing has the resources to prevent a systemic meltdown and understands full well what is at stake. At 160% of GDP, China’s nonfinancial corporate debt towers well above that of other major emerging markets and even that of Japan in the 1980s (Chart 1). If an Evergrande bankruptcy were allowed to topple this debt mountain, China would experience the kind of debt-deflation trap that proved so disastrous in the 1930s. A further deterioration of conditions in Chinese real estate activity is nonetheless in the cards, even if the country avoids a global systemic financial shock. First, the inevitable restructuring of Evergrande will result in losses for bond holders, especially foreign ones. Consequently, risk premia in the Chinese off-shore corporate bonds market will remain wide following the resolution of the Evergrande debacle. While Chinese banks are likely to recover a large proportion of the funds they lent to the real estate giant, they too will face higher risk premia. At the margin, the rising cost of capital will curtail the number of projects real estate developers take on over the coming two to three years. Second, the eventual liquidation of Evergrande will hurt confidence among real estate developers. This process may take many forms, but, as we go to press, the most discussed outcome is a breakup and restructuring where state-owned enterprises and large local governments absorb Evergrande’s operations. Evergrande’s employees, suppliers, and clients who have deposited funds while pre-ordering properties will be made whole one way or the other. However, shareholders and management will not. Wiping out shareholders and senior management will send a message to the operators of other developers, which will negatively affect their risk taking (Chart 2). Chart 1China Cannot Afford A Lehman Moment
China Cannot Afford A Lehman Moment
China Cannot Afford A Lehman Moment
Chart 2Downside To Chinese Construction Activity
Downside To Chinese Construction Activity
Downside To Chinese Construction Activity
Third, one of President Xi Jinping’s key policy objectives is to tame rampant income inequality in the Chinese economy. Rapidly rising real estate prices and elevated unaffordability only worsen this problem. Hence, Beijing wants to avoid blind stimulus that mostly pushes house prices higher but that would have also boosted construction activity. Thus, if credit growth is pushed through the system, the regulatory tightening in real estate will not end. This process is likely to result in further contraction in floor space sold and started. Bottom Line: The Evergrande crisis is unlikely to morph into China’s Lehman moment. However, its fallout on the real estate industry means that Chinese construction activity will continue to contract in the coming six to twelve months or so. Chinese Construction Matters For European Equities The risk of further contraction in Chinese construction activity implies a significant near-term risk for European equities, especially relative to US ones. Even after the volatility of the past three weeks, global equities remain vulnerable to more corrective action. Speculative activity continues to grip the bellwether US market. Our BCA Equity Speculation Index is still around two sigma. Previous instances of high readings did not necessarily herald the end of bull markets; however, they often resulted in sideways and volatile trading, until the speculative excesses dissipated (Chart 3). The case for such volatile trading is strong. The Fed is set to begin its taper at its November meeting. Moreover, an end of the QE program by the middle of next year and the upcoming rotation of regional Fed heads on the FOMC will likely result in a first rate hike by the end of 2022. Already, the growth rate of the global money supply has declined, and the real yield impulse is not as supportive as it once was. Therefore, the deterioration in our BCA Monetary Indicator should perdure (Chart 4), which will heighten the sensitivity of global stocks to bad news out of China. Chart 3Rife With Speculation
Rife With Speculation
Rife With Speculation
Chart 4Liquidity Deterioration At The Margin
Liquidity Deterioration At The Margin
Liquidity Deterioration At The Margin
Chart 5Still Too Happy
Still Too Happy
Still Too Happy
Investor sentiment is also not as washed out as many news stories ascertain. The AAII survey shows that the number of equity bulls has fallen sharply, but BCA’s Complacency-Anxiety Index, Equity Capitulation Indicator and Sentiment composite are still inconsistent with durable market bottoms. Moreover, the National Association of Active Investment Managers’ Exposure Index is still very elevated. When this gauge is combined with the AAII bulls minus bears indicator, it often detects floors in the US dollar-price of the European MSCI index (Chart 5). For now, this composite sentiment measure is flashing further vulnerability for European equities, especially if China remains a source of potential bad news in the coming months. Economic linkages reinforce the tactical risk to European stocks. Chinese construction activity affects the Euro Area industrial production because machinery and transportation goods represent 50% of Europe’s export to China (Chart 6). This category is very sensitive to Chinese real estate activity. Moreover, Europe’s exports to other nations are also indirectly affected by the demand from Chinese construction. Financial markets bear this footprint. Excavator sales in China are a leading indicator of construction activity. Historically, they correlate well with both the fluctuations of EUR/USD and the performance of Eurozone stocks relative to those of the US (Chart 7). Hence, if we anticipate that the problems Evergrande faces will weigh on excavator sales in the coming months, then the euro will suffer and Euro Area stocks could continue to underperform. Chart 6Europe's Exports To China Are Sensitive To Construction Activity
Europe's Exports To China Are Sensitive To Construction Activity
Europe's Exports To China Are Sensitive To Construction Activity
Chart 7A Near-Term Risk To European Assets
A Near-Term Risk To European Assets
A Near-Term Risk To European Assets
Similarly, the fallout from Evergrande’s problem will extend to the performance of European equity sectors. The sideways corrective episode in cyclical relative to defensive shares is likely to continue in the near term. This sector twist remains frothy, and often declines when Chinese credit origination is soft (Chart 8). Materials stocks are the most likely to suffer due to their tight correlation with Chinese excavator sales (Chart 9); meanwhile, healthcare equities will reap the greatest benefit as a result of their appealing structural growth profile and their strong defensive property. Geographically, Swiss stocks should perform best (Chart 9, bottom panel), because they strongly overweigh healthcare and consumer staple names. Moreover, as we recently argued, the SNB’s monetary policy is an advantage for Swiss stocks compared to Eurozone defensives.1 Additionally, Dutch equities, with their 50% weighting in tech and their small 12% combined allocation to industrials and materials, could also enjoy a near-term outperformance as investors digest the sectoral impact of weaker Chinese construction activity. Chart 8The Vulnerability Of Cyclicals/Defensives Remains
The Vulnerability Of Cyclicals/Defensives Remains
The Vulnerability Of Cyclicals/Defensives Remains
Chart 9Responses To Weaker Construction
Responses To Weaker Construction
Responses To Weaker Construction
Bottom Line: No matter how the Evergrande story unfolds, its consequence on Chinese construction activity may still cause market tremors. Global equity benchmarks may be rebounding right now, but, ultimately, they remain vulnerable to this slowdown. Any negative surprise out of China is likely to cause Europe to underperform because of its greater exposure to Chinese construction activity. Investment Conclusion: This Too Shall Pass The risks to the European equity market and its cyclicals sectors will prove transitory and will finish by the end of the year. Beijing will tolerate some pain to the real estate sector, but the stakes are too high to let the situation fester for long. The main problem is China’s large debt. Already sequential GDP growth in the first half of 2021 was worse than the same period in 2020, and credit accumulation is just as weak as in early 2018 (Chart 10). In this context, if real estate activity deteriorates too much, aggregate profits will contract and, in turn, will hurt the corporate sector’s ability to service its debt. Employment and social tensions create another stress point that will force Beijing’s hand. At 47, the non-manufacturing PMI employment index is already well into the contraction zone (Chart 11). Weakness in construction activity will hurt the labor market further. In an environment where protests have been springing up all over China, the Communist Party does not want to see more stress applied to workers. Chart 10In The End, Stimulus Will Come
In The End, Stimulus Will Come
In The End, Stimulus Will Come
Chart 11Worsening Chinese Employment Conditions
Worsening Chinese Employment Conditions
Worsening Chinese Employment Conditions
These two constraints will force Beijing to alleviate the pain caused by a weaker construction sector. As a result, we still expect the Chinese credit and fiscal impulse to re-accelerate by Q2 2022. Developments outside of China will create another important offset that will allow risk assets to thrive once their immediate froth has receded. Strong DM capex will be an important driver of global activity next year. As Chart 12 shows, capex intentions in the US and the Euro Area are rapidly expanding, which augurs well for global investments. Moreover, re-building depleted inventories (Chart 13) will be a crucial component of the solution to global supply bottlenecks. Both activities will add to global demand. As an example, ship orders are already surging. Chart 12DM Capex Intentions Are Firming
DM Capex Intentions Are Firming
DM Capex Intentions Are Firming
Chart 13Don't Forget About Inventories
Don't Forget About Inventories
Don't Forget About Inventories
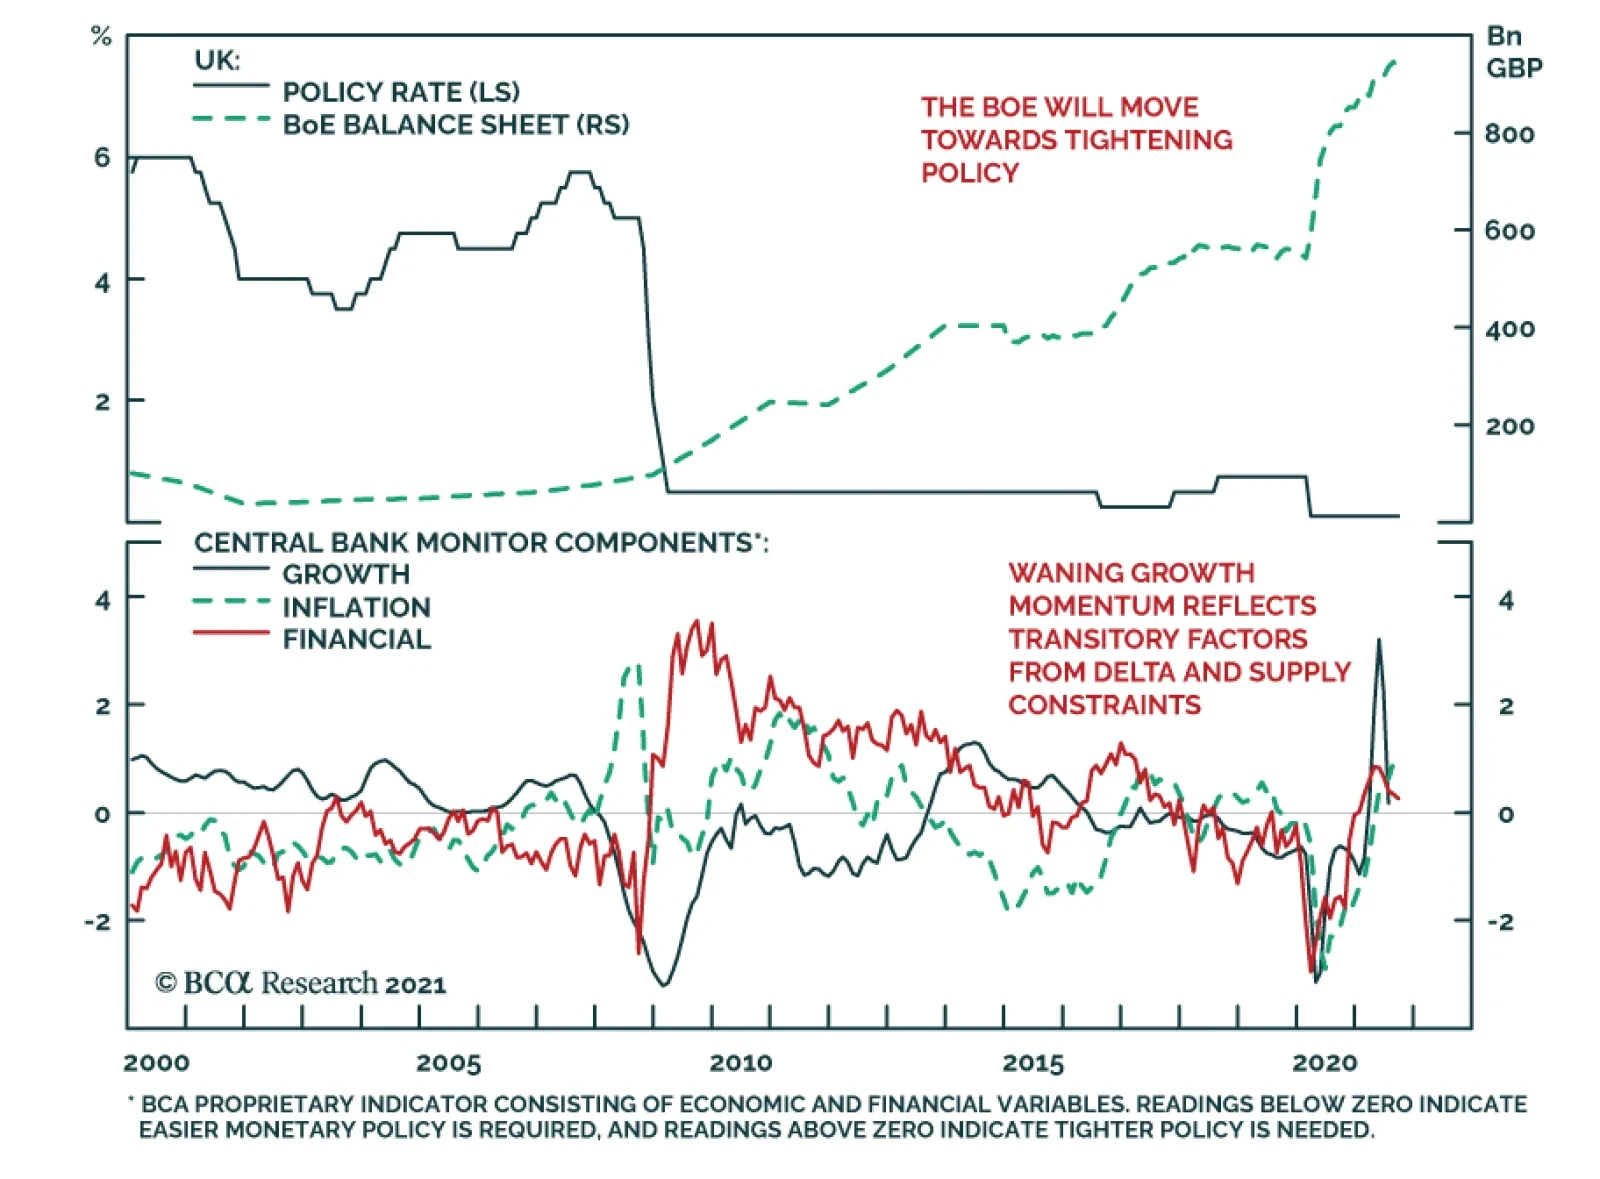
We maintain a pro-cyclical stance in European markets after weighing the near-term negatives against the underlying positive forces. For now, hedging the tactical risk still makes sense and our long telecommunication / short consumer discretionary equities remain the appropriate vehicle – so does being long Swiss stocks versus Euro Area defensives. However, we will use any correction in the EURO STOXX (Bloomberg: SXXE Index) to the 430-420 zone to unload this protection. Bottom Line: The potential market stress created by a slowdown in Chinese construction activity will be a temporary force. Beijing will not tolerate a much larger hit to the economy, especially as tensions are rising across the country. Thus, even if the stimulus response to the Evergrande crisis will not be immediate, it will eventually come, which will support Chinese economic activity. Additionally, the capex upside and inventory rebuilding in advanced economies will create an offset for slowing Chinese growth. Consequently, while we maintain a pro-cyclical bias over the medium term, we are also keeping in place our hedges in the near term, looking to shed them if SXXE hits the 430-420 zone. A Big Week For Central Banks Chart 14The BoE's Is Listening To The UK's Economic Conditions...
The BoE's Is Listening To The UK's Economic Conditions...
The BoE's Is Listening To The UK's Economic Conditions...
Last week, four European central banks held their policy meetings: The Riksbank, the Swiss National Bank, the Norges Bank, and the Bank of England. No major surprises came out of these meetings, with central banks discourses and policy evolving in line with their respective economies. The BoE veered on the hawkish side, highlighting that rates could rise before its QE program is over. This implies a small possibility of a rate hike by the end of 2021. However, our base case remains that the initial hike will be in the first half of 2022. The BoE is behaving in line with the message from our UK Central Bank Monitor (Chart 14). Moreover, the combination of rapid inflation and strong house price appreciation is incentivizing the BoE to remove monetary accommodation, especially because UK financial conditions are extremely easy (Chart 14, bottom panel). One caution advanced by the MPC is the uncertainty surrounding the impact of the end of the job furlough scheme this month. However, the global economy will be strong enough next spring to mitigate the risks to the UK. The results of last week’s MPC meeting and our view on the global and UK business cycles support the short EUR/GBP recommendation of BCA’s foreign exchange strategist,2 as well as the underweight allocation to UK Gilts of our Global Fixed Income Strategy group.3 The Norges Bank is the first central bank in the G-10 to hike rates and is likely to do so again later this year. While Norwegian core inflation remains low, house prices are strong, monetary conditions are extremely accommodative, and our Norway Central Bank Monitor is surging (Chart 15). The Norwegian central bank will continue to focus on these positives, especially in light of our Commodity and Energy team’s view that Brent will average more than $80/bbl by 2023.4 In this context, we anticipate the NOK to outperform the euro over the coming 24 months. Nonetheless, the near-term outlook for Norwegian stocks remains fraught with danger. Materials account for 17% of the MSCI Norway index and are the sector most vulnerable to a deterioration in Chinese construction activity. The Riksbank continues to disregard the strength of the Swedish economy. Relative to economic conditions, it is one of the most dovish central banks in the world. The Swedish central bank is completely ignoring the message from our Sweden Central Bank Monitor, which has never been as elevated as it is today (Chart 16). Moreover, the inexpensiveness of the SEK means that Swedish financial conditions are exceptionally accommodative. At first glance, this picture is bearish for the SEK. However, easy monetary conditions will cause Sweden’s real estate bubble to expand. Expanding real estate prices and transaction volumes will boost the profits of Swedish financials, which account for 27% of the MSCI Sweden index. Moreover, Swedish industrials remain one of our favorite sectors in Europe, and they represent 38% of the same index. As a result, equity flows into Sweden should still hurt the EUR/SEK cross. Chart 15...And The Norges Bank, To Norway's
...And The Norges Bank, To Norway's
...And The Norges Bank, To Norway's
Chart 16The Riksbank Is Blowing Real Estate Bubbles
The Riksbank Is Blowing Real Estate Bubbles
The Riksbank Is Blowing Real Estate Bubbles
Chart 17The CHF Still Worries The SNB
The CHF Still Worries The SNB
The CHF Still Worries The SNB
Finally, the SNB proved reliably dovish. Our Switzerland Central Bank Monitor is rising fast as inflation and house prices improve (Chart 17). However, the SNB is rightfully worried about the expensiveness of the CHF, which generates tight Swiss financial conditions (Chart 17, bottom panel). Consequently, the SNB will keep fighting off any depreciation in EUR/CHF. Thus, the SNB will be forced to expand its balance sheet because the ECB is likely to remain active in asset markets longer than many of its peers. This process will be key to the outperformance of Swiss stocks relative to other European defensive equities. Mathieu Savary, Chief European Strategist Mathieu@bcaresearch.com Footnotes 1 Please see European Investment Strategy “The ECB’s New Groove,” dated July 19, 2021, available at eis.bcarsearch.com 2 Please see Foreign Exchange Strategy “Why Are UK Interest Rates Still So Low?,” dated March 10, 2021, available at fes.bcarsearch.com 3 Please see European Investment Strategy “The UK Leads The Way,” dated August 11, 2021, available at eis.bcarsearch.com 4 Please see Commodity & Energy Strategy “Upside Price Risk Rises For Crude,” dated September 16, 2021, available at fes.bcarsearch.com Tactical Recommendations
Europe’s Evergrande Problem
Europe’s Evergrande Problem
Cyclical Recommendations
Europe’s Evergrande Problem
Europe’s Evergrande Problem
Structural Recommendations
Europe’s Evergrande Problem
Europe’s Evergrande Problem
Closed Trades
Europe’s Evergrande Problem
Europe’s Evergrande Problem
Currency Performance Fixed Income Performance Equity Performance
BCA Research’s Foreign Exchange Strategy service expects the Fed’s tapering of asset purchases to be a non-event for the US dollar. While the Fed is still considering tapering asset purchases (and would very likely do so) by year-end, other…
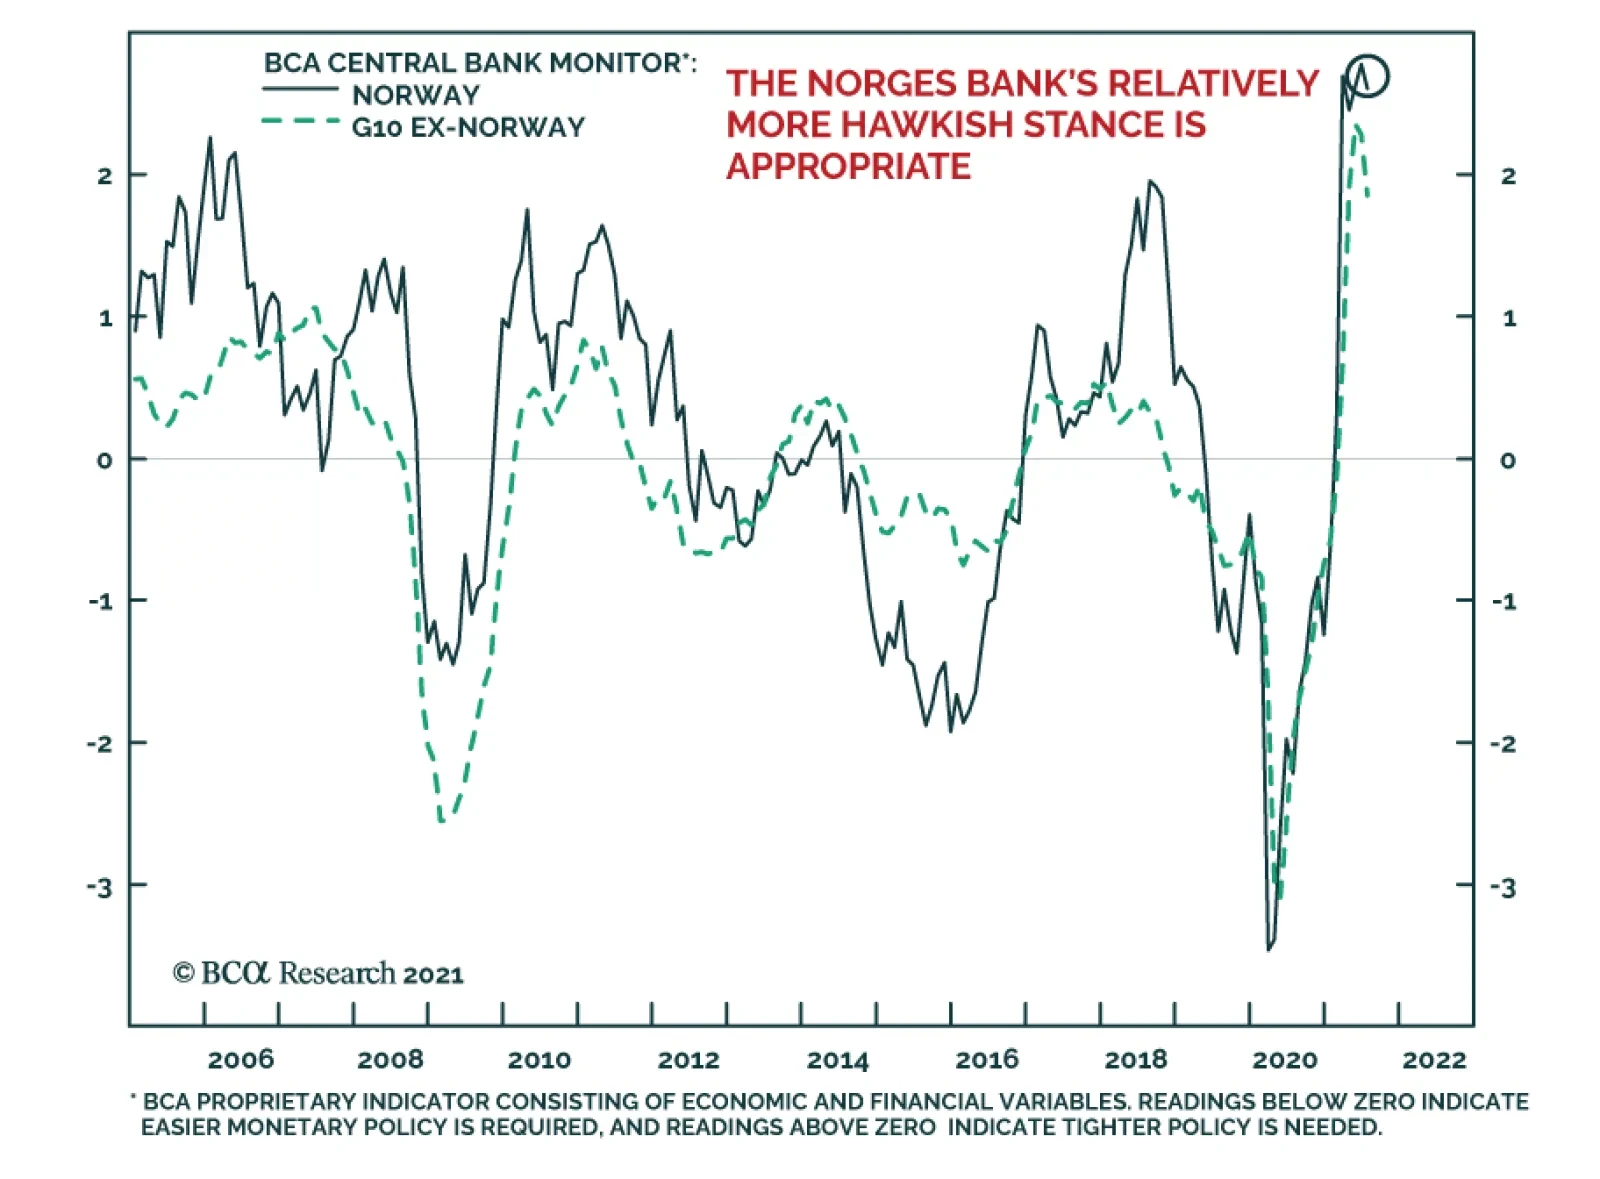
As expected, the Norges Bank delivered its first rate hike on Thursday, bringing its benchmark policy rate to 0.25%. It is the first developed market central bank to raise rates in the post-COVID-19 crisis period. The central bank statement revealed that…
Dear client, There will be no weekly bulletin next week. Instead, I will be hosting a webcast, with my colleague, Matt Gertken, titled “Currencies And Geopolitics: A Discussion.” I hope you will tune in so that we can have an interactive session. Also, we will be revamping the traditional backsections that FX has been publishing and will send a mockup in the coming weeks. Feedback on the new format will be greatly appreciated. Finally, I hosted a webcast this week with Japanese clients titled “A Guide To Currency Management For Japanese Corporates.” For those who are interested but were unable to attend, I encourage you to consult your sales representative for a replay. Kind regards, Chester Highlights The Fed will taper asset purchases this year, but it could be a non-event for the US dollar. The reason is that the Fed is lagging other G10 central banks in tapering asset purchases. Many will end QE even before the Fed begins tapering. The two big exceptions are the ECB and the BoJ. But while dovish monetary policy is well priced into both the interest rate curve and their currencies, upside surprises are not. Most global central banks will remain data dependent. So the key to gauging the move in currencies is to observe (and forecast) economic data. On that front, the current evidence is that US growth is robust, but is losing momentum to other developed markets. Volatility in currencies will be on the rise. We went long CHF/NZD on this basis last week and maintain long yen positions. But our bias is that any rally in the DXY will fizzle out at the 94-95 level. Feature This week was a busy one for central bankers. We kicked off with the Riksbank on Tuesday, the Bank of Japan and the Federal Reserve on Wednesday, and concluded with the Swiss National Bank, the Bank of England, and the Norges bank on Thursday. The highlight was the Fed, but the general message from most central banks is that less monetary accommodation will be forthcoming, as economic activity picks up. Most central bankers also admitted that inflation was proving a bit more sticky than initially anticipated. The key question therefore for currency strategists is whether the Federal Reserve will be more or less orthodox with monetary policy, compared to other developed market central banks, and what that means for the dollar. Our bias is that while the Fed was slightly more hawkish this week, it will continue to lag other G10 central banks in curtailing monetary accommodation. The Message From The FOMC Chart I-1The Market Has Priced Fed Hawkishness
The Market Has Priced Fed Hawkishness
The Market Has Priced Fed Hawkishness
The key development from the Fed meeting this week was an upgrade to the dot plot. Half of the committee now expects at least one interest rate hike in 2022, with perhaps 7-8 hikes by the end of 2024. This is a more aggressive path of interest rate increases compared to the June FOMC meeting. The Fed also suggested tapering could begin at the next policy meeting and end towards the middle of next year, in time for rate increases. The immediate market response to the FOMC meeting did certainly suggest a hawkish undertone. The two-year US Treasury yield rose by 4 bps, which boosted the DXY index from a low of 93 to a high of 93.5 (intraday). Stocks rose and the 10-year Treasury yield edged mildly lower. The 30/2-year Treasury slope flattened by almost 10 bps. In our view, this was a rather muted response. For one, most of these moves are fading as we go to press. More importantly, going into the meeting, the market was already priced for a liftoff in 2022. This will suggest that the market was well positioned for Fed tapering at a minimum, and possibly an upgrade to the dots (Chart I-1). The Message From Other Central Banks While the Fed is still considering tapering asset purchases (and would very likely do so) by year-end, other central banks are well ahead in exiting emergency monetary settings. Just this week: The Norges bank hiked interest rates by 25 bps. We are particularly bullish on the krone, as highlighted in our Norwegian Method report; The Riskbank will end asset purchases this year. Its balance sheet is slated to be flat for 2022. It also closed all lending facilities launched during the pandemic. The offer for USD loans via the Fed’s swap facility will expire this month; The Bank of England kept monetary policy unchanged, but has already purchased £852bn of its £895bn target for government and corporate bonds. In fact, two of its members voted this week to reduce this target by £35bn, which would have effectively ended QE on a majority vote; The Swiss National Bank said in its introductory statement that it is fighting against an expensive franc, but modestly upgraded its inflation forecasts for 2022; The sole dovish central bank (aside from the SNB) was the Bank of Japan, but with elections on the horizon, and the possibility (or not) of a big fiscal package, their policy stance made sense. Chart I-2Central Bank Holdings Of Government Bonds
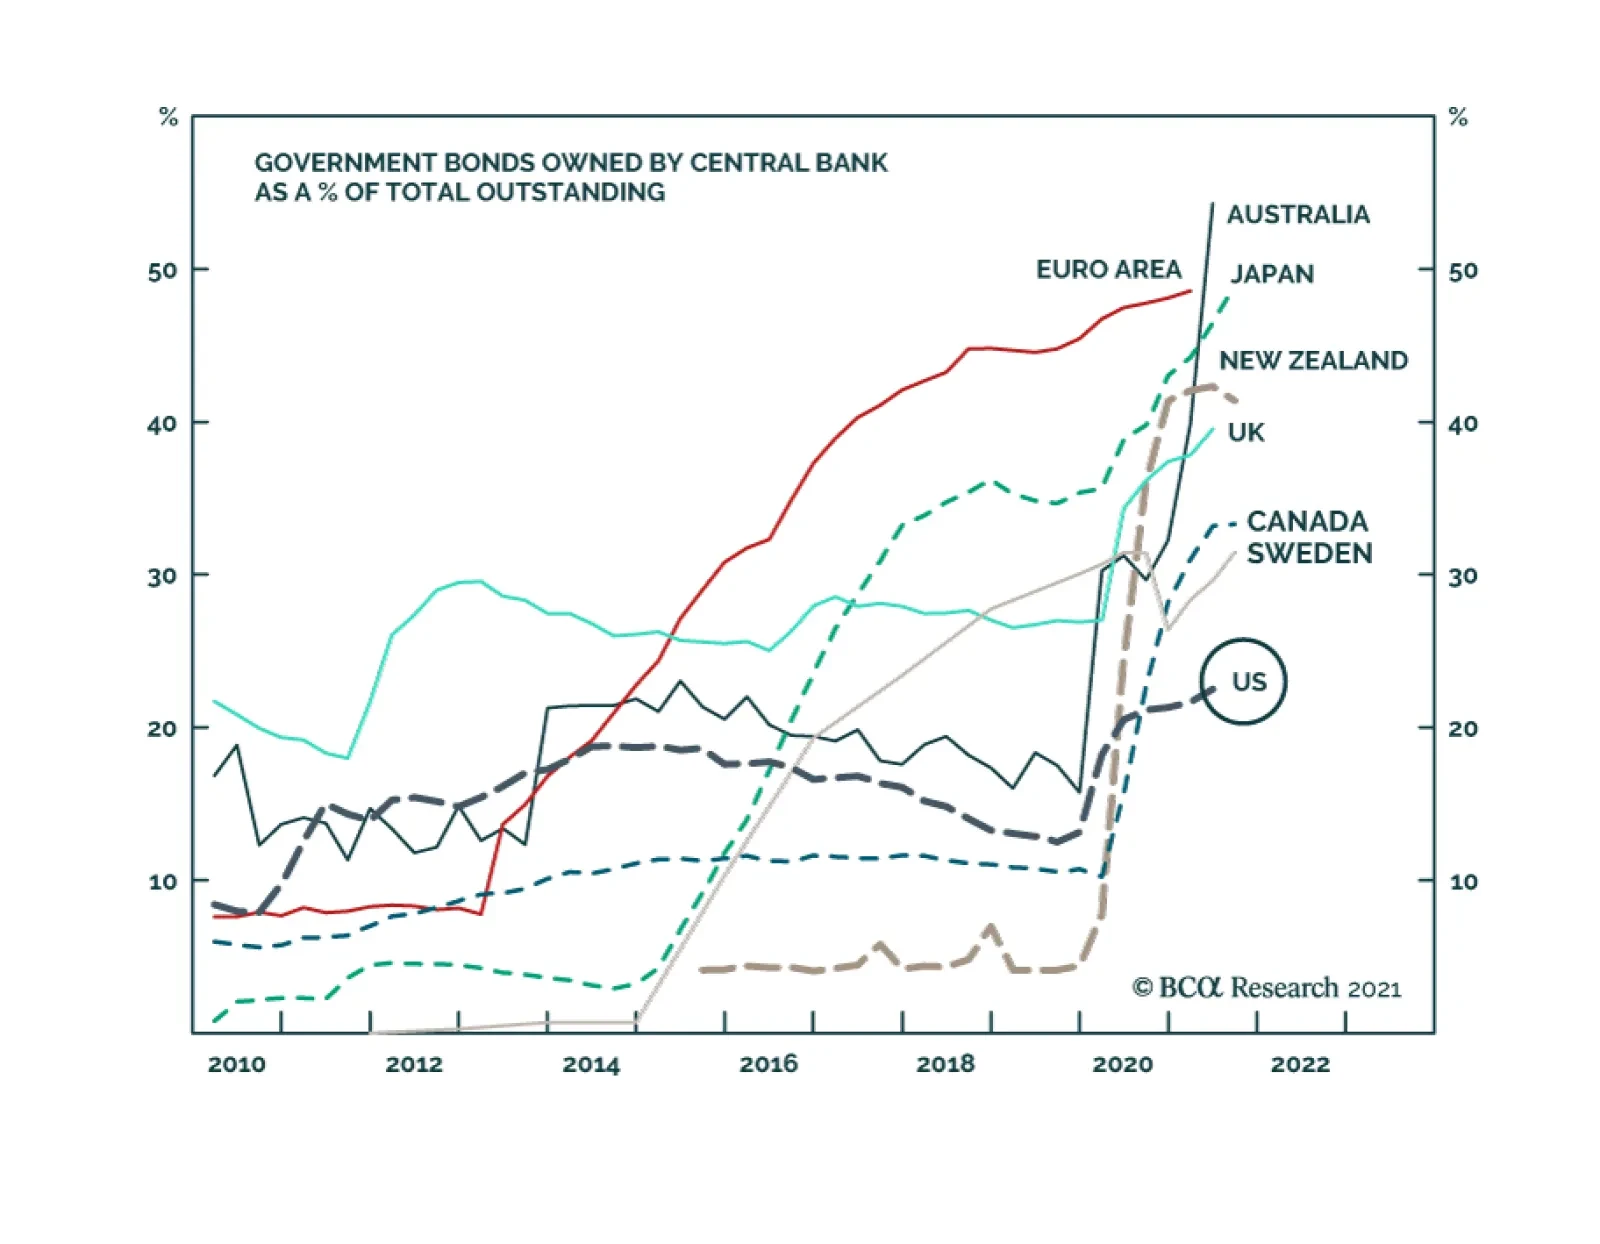
Central Bank Holdings Of Government Bonds
Central Bank Holdings Of Government Bonds
Elsewhere, the Bank of Canada has already cut its asset purchases in half, the Reserve Bank of New Zealand has ended QE, and the Reserve Bank of Australia has already been tapering asset purchases. In a nutshell, a Fed tapering at this point is well behind the actions of other G10 central banks. This is one key reason why the DXY index has failed to punch above the 94-95 level, and is relapsing as we go to press. From a bird’s eye view, many G10 central banks already have bloated balance sheets and a strong incentive to curtail asset purchases as growth recovers. Within the G10, the US central bank has the smallest holdings of outstanding bonds (Chart I-2). This not only means that, ceteris paribus, the incentive to taper asset purchases is bigger for other central banks, but the scope for the Federal Reserve to ease monetary policy is quite substantial should another shock occur. This might explain why there is unease among other central bankers, to exit emergency settings. Admittedly, this week, traditionally dovish central banks such as the Bank of Japan and the Swiss National Bank kept policy on hold and telegraphed a message that they will keep doing so for the foreseeable future. With a slightly more hawkish Federal Reserve, this should be a negative for these currencies. The same will apply to the ECB (Chart I-3). However, it is important to note that relatively dovish policy settings are well priced into both interest rate curves and their currencies, while upside surprises are not. The market does not expect any interest rate increases in the euro area or Japan before 2024, while it is priced for an aggressive pace of Fed rate hikes (Chart I-4). The starting point for any currency investor is an extremely dovish ECB and BoJ, relative to the Fed. Chart I-3A Pickup In US Yields Has Boosted The Dollar
A Pickup In US Yields Has Boosted The Dollar
A Pickup In US Yields Has Boosted The Dollar
Chart I-4Markets Expect A More Aggressive Fed
Markets Expect A More Aggressive Fed
Markets Expect A More Aggressive Fed
What Could Change? Global central banks are clearly focused on two goals – the outlook for growth and what that means for their maximum employment objective, and the long-run rate of inflation. These two objectives are interlinked. On the growth front, central bankers are justifiably admitting that the outlook remains clouded due to the Delta variant of COVID-19 and supply disruptions that are muddling the manufacturing outlook. However, it is important to remember that this is a global phenomenon. On a relative basis, there has been a growth rotation from the US to other economies that has historically supported the performance of DM currencies (Chart I-5). The primary reason is that many economies outside the US were in various forms of a lockdown over the last several months. As these economies reopen, so will economic activity. Chart I-5ARelative Growth And Currencies
Relative Growth And Currencies
Relative Growth And Currencies
Chart I-5BRelative Growth And Currencies
Relative Growth And Currencies
Relative Growth And Currencies
On the inflation front, the most acute problem has been tied to supply bottlenecks and this is not a US-centric problem. Inflation in the euro area, Sweden, the UK, Canada, or New Zealand are all above central bank targets (Table I-1). While all these central banks view the current overshoot as temporary, most have already pared back emergency monetary settings, as we highlighted above. Table I-1Inflation In The G10
A Misconception About Fed Tapering And The Dollar
A Misconception About Fed Tapering And The Dollar
The key takeaway is that most central banks view inflation risks as symmetric, while the Fed has telegraphed it is willing to tolerate an inflation overshoot following downturns (Chart I-6). During the Fed’s last two meetings, it has been clear that there is a limit to how much of an overshoot they will tolerate. However, it still suggests that the Fed remains well behind the inflation curve, with one of the most negative 2-year rates in the G10 (Chart I-7). Chart I-6The Fed And Inflation Overshoots
A Misconception About Fed Tapering And The Dollar
A Misconception About Fed Tapering And The Dollar
Chart I-7Real Yields In The US Are Very Low
A Misconception About Fed Tapering And The Dollar
A Misconception About Fed Tapering And The Dollar
In a nutshell, if our bias turns out to be correct that growth does recover more earnestly outside the US, and other central banks remain more orthodox than the Fed, this will be a headwind for a stronger US dollar. A Final Note On Canada Canada re-elected a Liberal minority government on September 20. Prime Minister Justin Trudeau’s bet on a majority government, given an astute handling of the pandemic, and massive fiscal stimulus, failed. The implication is a continuation of the status quo in Canada. The good news is that the status quo is actually bullish for the loonie. As we highlighted in our recent report, minority governments tend to be positive for the loonie, while majority governments generally nudge the CAD lower post election (Chart I-8). The rationale is that fiscal policy is slated to stay easy, but not overly so, providing gentle room for the BoC to hike interest rates. Easy fiscal but tighter monetary policy is usually bullish for a currency. Chart I-8Historically, The CAD Likes A Minority Government
Historically, The CAD Likes A Minority Government
Historically, The CAD Likes A Minority Government
Given our view on the US dollar, we expect the CAD/USD to punch above the recent 82-cent high, towards 85 and eventually 90 cents. While this view might take time to play out, both rising relative interest rates in Canada (our base case) and high oil prices will be the key catalysts. Chester Ntonifor Foreign Exchange Strategist chestern@bcaresearch.com Trades & Forecasts Forecast Summary
A Misconception About Fed Tapering And The Dollar
A Misconception About Fed Tapering And The Dollar
Strategtic View
A Misconception About Fed Tapering And The Dollar
A Misconception About Fed Tapering And The Dollar
Cyclical Holdings (6-18 months) Tactical Holdings (0-6 months) Limit Orders Closed Trades
Highlights Global Inflation: Most central banks, led by the Fed, have stuck to the narrative that surging inflation is a temporary phenomenon that will not require an aggressive monetary policy response. However, global supply chain disruptions are lasting for much longer than originally expected, while faster realized global inflation is feeding through into higher longer-term consumer inflation expectations, most notably in the US. This raises the risk that the 2021 inflation pickup will prove to be longer lasting, leading to higher global bond yields. Real Bond Yields: Global bond markets have made a collective bet on the “transitory” inflation narrative by driving yields on government bonds, and even the riskier parts of the corporate credit universe like US and European high-yield, below actual inflation. Markets will have to reprice those negative real bond yields higher if inflation proves to be more persistent than expected - particularly with central banks likely to respond with faster tapering and, in some cases, eventual rate hikes. Feature The month of September has often not been kind to financial markets and September 2021 is already providing many reasons for investors to be nervous. Slowing global growth momentum, uncertainty over the Delta variant, yet another US Debt Ceiling debate in D.C. and worries about excessive Chinese corporate leverage and contagion risks from the looming Evergrande default are all valid reasons for market participants to become more risk averse. On top of that, the monetary policy backdrop is threatening to become less overwhelmingly supportive for markets with the Fed set to begin tapering its asset purchases. Chart of the WeekInflation Expected To Slow But Remain Above Bond Yields
Inflation Expected To Slow But Remain Above Bond Yields
Inflation Expected To Slow But Remain Above Bond Yields
One other source of angst that markets seem less concerned about is inflation. Markets have generally come around to the view of most major central banks, led by the Fed, that the surge in inflation seen this year has been all pandemic related - base effect comparisons to 2020 and temporary supply chain squeezes – and will not last into 2022. Yet we have seen very strong realized global inflation readings in the August data, beyond the point of maximum base effect comparisons versus a year ago, while supply squeezes and soaring shipping costs are showing no signs of slowing as we approach the fourth quarter. Global bond markets have made a collective bet that current high rates of inflation will prove to be temporary. Developed market bond yields are all trading well below actual inflation, as are riskier fixed income asset classes like US and European high-yield (Chart of the Week). While consensus expectations are calling for some rise in government bond yields in 2022, yields are expected to remain below inflation. Those persistent negative real yield expectations remain the biggest source of vulnerability for global bond markets. If inflation turns out to be “less transitory” than expected, nominal bond yields will need to move higher to reprice both real yields and the risk of more hawkish central bank responses to sustained high inflation. A Persistent Inflation Threat From Supply Chain Disruptions Chart 2A Broad-Based Surge In Global Inflation
A Broad-Based Surge In Global Inflation
A Broad-Based Surge In Global Inflation
Our base-case view remains that global inflation will slow in 2022, but not by enough to prevent the major developed market central banks from tapering asset purchases. We expect the Fed to begin buying fewer bonds in January. Central banks that have already begun to slow the pace of quantitative easing (QE) like the Bank of Canada and Bank of England will likely continue to taper as fast, if not even faster, than the Fed. Even the ECB will likely not roll the full amount of the expiring Pandemic Emergency Purchase Program (PEPP) into the existing pre-COVID asset purchase programs, resulting in a mild form of tapering next year. Our view on global inflation has been predicated on an expected shift away from more externally-driven inflation towards more sustainable domestic price pressures stemming from tightening labor markets and the closing of pandemic output gaps (Chart 2). So the mix of inflation in most developed market countries will be more “core” and less “non-core” inflation driven by higher commodity prices and global supply chain disruptions. Yet there is little sign that those non-core inflation pressures are slowing, particular in price gauges most exposed to supply chains like producer price indices (PPI). US PPI inflation climbed to 15-year high of 8.3% on a year-over-year basis in August, while annual growth in the euro area PPI hit 12.1% in July – the fastest pace in the 30-year history of that data series (Chart 3). Surging PPI inflation reflects global price pressures, with import prices expanding at double-digit rates in both the US and Europe. Some of that more externally driven price pressure stems from commodity markets. While the prices for some notable commodities like lumber and iron ore have seen significant retracements from pandemic-era highs over the past several months, more economically sensitive commodities like aluminum and natural gas have all seen very strong price increases (Chart 4). Copper and oil prices are also holding firm, although both are off 2021 highs. Chart 3No Sign Of Slowing Global Inflation At The Producer Level
No Sign Of Slowing Global Inflation At The Producer Level
No Sign Of Slowing Global Inflation At The Producer Level
The price momentum of overall commodity price indices like the CRB Raw Industrials has clearly rolled over, but has held up much better than would be expected given signs of slowing global growth. Chart 4Commodity Markets Still More Inflationary Than Disinflationary
Commodity Markets Still More Inflationary Than Disinflationary
Commodity Markets Still More Inflationary Than Disinflationary
The current depressed level of the China credit impulse, and the flat year-over-year change of the global PMI, would typically be associated with flat commodity prices rather than the current 34% annual growth rate (Chart 5). A lack of sustained upward pressure on the US dollar is likely helping keep commodity prices, which are priced in dollars, more elevated than expected. Even more important, however, are the low inventories for many commodities relative to firm demand (which largely explains the current surge in aluminum and natural gas prices). This mirrors a broader global economic trend towards companies running lower inventories relative to sales, which has been exacerbated by the economic uncertainties of the COVID-19 pandemic. The US overall business inventory-to-sales ratio is now at the lowest level in the history of the series (Chart 6). Chart 5Commodity Price Inflation Peaking, But Not Slowing Much
Commodity Price Inflation Peaking, But Not Slowing Much
Commodity Price Inflation Peaking, But Not Slowing Much
Chart 6Supply Squeezes Are Likely To Persist
Supply Squeezes Are Likely To Persist
Supply Squeezes Are Likely To Persist
Before the pandemic, firms have gotten away with running very lean inventories because of globalized supply chains that allow firms to maintain the minimum amount of inventory to meet demand. Yet “just-in-time” inventory management only works when suppliers can deliver raw materials or finished goods in a timely fashion at low cost. The pandemic has blown up that model, making it much harder to deliver products and materials from critical countries like China. Global shipping costs have exploded higher and are showing no signs of slowing (bottom panel), while supplier delivery times remain well above historical averages according to measures like the US ISM index. Those higher costs are feeding through into overall inflation measures, particularly for the components most exposed to supply chain disruption. In Chart 7, we show a breakdown of the overall CPI inflation data for the US, euro area, UK and Canada. The groupings shown in the chart are based on an analysis done by the Bank of Canada back in August to measure pandemic impacts on Canadian inflation.1 The top panel of the chart shows the contribution to overall inflation for elements most exposed to supply constraints (like autos and durable goods). The second panel of the chart shows the contribution from sectors more exposed to increased demand as economies reopen from pandemic restrictions, like dining at restaurants and travel. The remaining panels of the chart show the contributions from energy prices and all other components not covered in the top three panels. Chart 7Fed's Transitory Narrative At Risk From Lingering Supply Chain Disruption
Fed's Transitory Narrative At Risk From Lingering Supply Chain Disruption
Fed's Transitory Narrative At Risk From Lingering Supply Chain Disruption
Chart 8High US Inflation May Not Prove To Be So Transitory
High US Inflation May Not Prove To Be So Transitory
High US Inflation May Not Prove To Be So Transitory
The conclusion from our chart is that supply disruptions have added more to US and Canadian inflation so far in 2021, while reopening demand has been more meaningful for UK and US inflation. The pickup in euro area inflation has been mostly an energy price story, although reopening demand has started to contribute to the rising trend of overall inflation. The implication from this analysis is that persistent supply chain disruptions could become a bigger issue for future inflation – and monetary policy decisions – in the US and Canada. The acceleration of US realized inflation in 2021 has already begun to broaden out from the most volatile components, according to measures like the Dallas Fed Trimmed Mean PCE (Chart 8). Faster inflation is also feeding through into higher US consumer inflation expectations according to surveys from the New York Fed and the University of Michigan. Those increases are not deemed to be temporary, with longer-term inflation expectations now moving higher. The New York Fed’s survey shows that inflation is expected to be 4% over the next three years, two full percentage points above the Fed’s target, which must be ringing some alarm bells on the FOMC. Chart 9European Consumers Are Waking Up To Higher Inflation
European Consumers Are Waking Up To Higher Inflation
European Consumers Are Waking Up To Higher Inflation
Consumer inflation expectations are also starting to perk up outside the US. The YouGov/Citigroup survey shows an expectation of UK inflation over the next 5-10 years of 3.5%, while the Bank of England/Kantar survey is at 3% over the next five years (Chart 9, top panel). Both are above the Bank of England’s 2% inflation target. The European Commission confidence surveys have shown a sharp increase in the net share of respondents expecting higher inflation in the coming months (bottom panel), while the Bundesbank’s August consumer survey shows that Germans now expect 3.5% inflation over the next 12 months, up from 2% back in March. Bottom Line: Supply chain disruptions are lasting for much longer than originally expected, while faster realized global inflation is feeding through into higher longer-term consumer inflation expectations, most notably in the US. This raises the risk that the 2021 inflation pickup will last much longer than expected and force a bond-bearish repricing of future interest rate expectations. Negative Real Yields – The Achilles Heel For Bond Markets It is clear that supply chain disruptions are having a more lasting effect on global inflation than investors, and policymakers, expected earlier this year. Yet while both market-based and survey-based measures of inflation expectations are moving higher, interest rate markets are still pricing in a very dovish future path for policy rates of the major developed market central banks. For example, our 24-month discounters, which measure the change in interest rates over the next two years discounted in overnight index swap (OIS) curves, show that only 71bps, 61bps and 13bps of rate hikes are expected in the US, UK and euro area, respectively, by September 2023 (Chart 10). This continues a trend that we have highlighted in recent reports – the persistence of negative real interest rate expectations in the developed markets that is also keeping real bond yields in sub-0% territory. In the US, the OIS forward curve shows that the first Fed rate hike is expected in early 2023 with a very slow pace of rate increases over the following 2-3 years (Chart 11). The funds rate is expected to level off at 1.75% and stay there through 2030. At the same time, the CPI swap forward curve has inflation falling steadily over the next couple of years, but leveling off around 2.35% for the rest of the upcoming decade. Combining those two forward projections comes up with an implied path for the real fed funds rate that is persistently negative for the next ten years, “settling” at -0.6% by the end of the decade. Chart 10Bond Markets Exposed To More Hawkish Central Banks
Bond Markets Exposed To More Hawkish Central Banks
Bond Markets Exposed To More Hawkish Central Banks
Chart 11US Real Yields Priced For Extended Fed Dovishness
US Real Yields Priced For Extended Fed Dovishness
US Real Yields Priced For Extended Fed Dovishness
An even more deeply negative real rate path is discounted in the euro area forward curves. The ECB is expected to begin lifting rates in 2023, eventually moving out of negative (nominal) territory in 2026 before climbing to +0.5% by 2030 (Chart 12). Euro area CPI swaps are priced for a fall in inflation back below 2% over the next two years, eventually stabilizing at 1.75% over the latter half of the next decade. The real ECB policy rate is therefore expected to settle at -1.25% by 2030. In the UK, markets are discounting much of what has been seen in the years since the 2008 financial crisis – a Bank of England that does very little with interest rates. The central bank is expected to begin lifting rates in 2023, but only a handful of rate hikes are expected in the following years with Bank Rate only climbing to 1% and settling there for most of the upcoming decade. The UK CPI swap curve is discounting relatively high inflation over the next decade, settling at 3.6% in 2030. Thus, the market is discounting a long-run real Bank of England policy rate of -2.6%. This pricing of negative real policy rates so far into the future goes a long way to explain why longer-term real government bond yields have also been consistently negative in the US, Germany, UK and elsewhere in the developed markets. That can be seen in Charts 11, 12 and 13, where we have added the 10-year inflation-linked (real) bond yield for US TIPS, French OATis and UK index-linked Gilts. In all three cases, the 10-year real yield has “gravitated” towards the realized path of the real policy rate – the nominal rate minus headline CPI inflation – over the past two decades. Chart 12Negative Real Rates Forever In Europe?
Negative Real Rates Forever In Europe?
Negative Real Rates Forever In Europe?
Chart 13BoE Not Expected To Do Much Over The Next Decade
BoE Not Expected To Do Much Over The Next Decade
BoE Not Expected To Do Much Over The Next Decade
Chart 14Nominal Yields Will Move Higher If Negative Real Yields Persist
Nominal Yields Will Move Higher If Negative Real Yields Persist
Nominal Yields Will Move Higher If Negative Real Yields Persist
Persistent low government bond yields, both in nominal and inflation-adjusted terms, have resulted in lower yields across the global fixed income markets as investors have been forced to take on more risk to find acceptable yields. This has resulted in a situation where nominal yields on riskier assets like US high-yield corporate bonds and Italian government debt are trading below prevailing headline inflation rates in the US and Europe (Chart 14). Bond investors would likely only be comfortable accepting such negative real yields on the riskier parts of the fixed income universe if a) inflation was expected to decline, and/or b) real yields on risk-free government bonds were expected to stay negative for longer as central banks stay dovish. In either case, the “bet” made by investors is that the inflation surge seen this year will indeed prove to be transitory, as central banks are forecasting. If that benign outlook proves to be incorrect and inflation stays resilient for longer – potentially because of the risk of lingering supply chain disruptions described earlier in this report - nominal bond yields will have to reprice higher to account for faster realized inflation (and, most likely, rising inflation expectations). This process will start in government bond markets, as global central banks will be forced to respond to stubbornly high inflation by turning more hawkish, first with faster tapering of QE bond buying and, later, with interest rate hikes. We continue to see persistent negative real yields as the biggest source of risk in developed economy bond markets over the next couple of years. Those yields discount a benign path for both inflation and future monetary policy that is looking increasingly less likely – especially with tightening labor markets and rising consumer inflation expectations already forcing central banks, led by the Fed, to move incrementally towards less accommodative policy settings. Bottom Line: Global bond markets have made a collective bet on the “transitory” inflation narrative by driving yields on government bonds, and even the riskier parts of the corporate credit universe like US and European high-yield, below actual inflation. Markets will have to reprice those negative real bond yields higher if inflation proves to be more persistent than expected - particularly with central banks likely to respond with faster tapering and, in some cases, eventual rate hikes. Stay below-benchmark on overall global duration exposure in fixed income portfolios. Robert Robis, CFA Chief Fixed Income Strategist rrobis@bcaresearch.com Footnotes 1 We have attempted to match the groupings shown in the Bank of Canada analysis as much as possible for the other countries, although there are some minor differences based on how each country’s consumer price index sub-indices are defined. Recommendations The GFIS Recommended Portfolio Vs. The Custom Benchmark Index
What If Higher Inflation Is Not Transitory?
What If Higher Inflation Is Not Transitory?
Duration Regional Allocation Spread Product Tactical Trades Yields & Returns Global Bond Yields Historical Returns
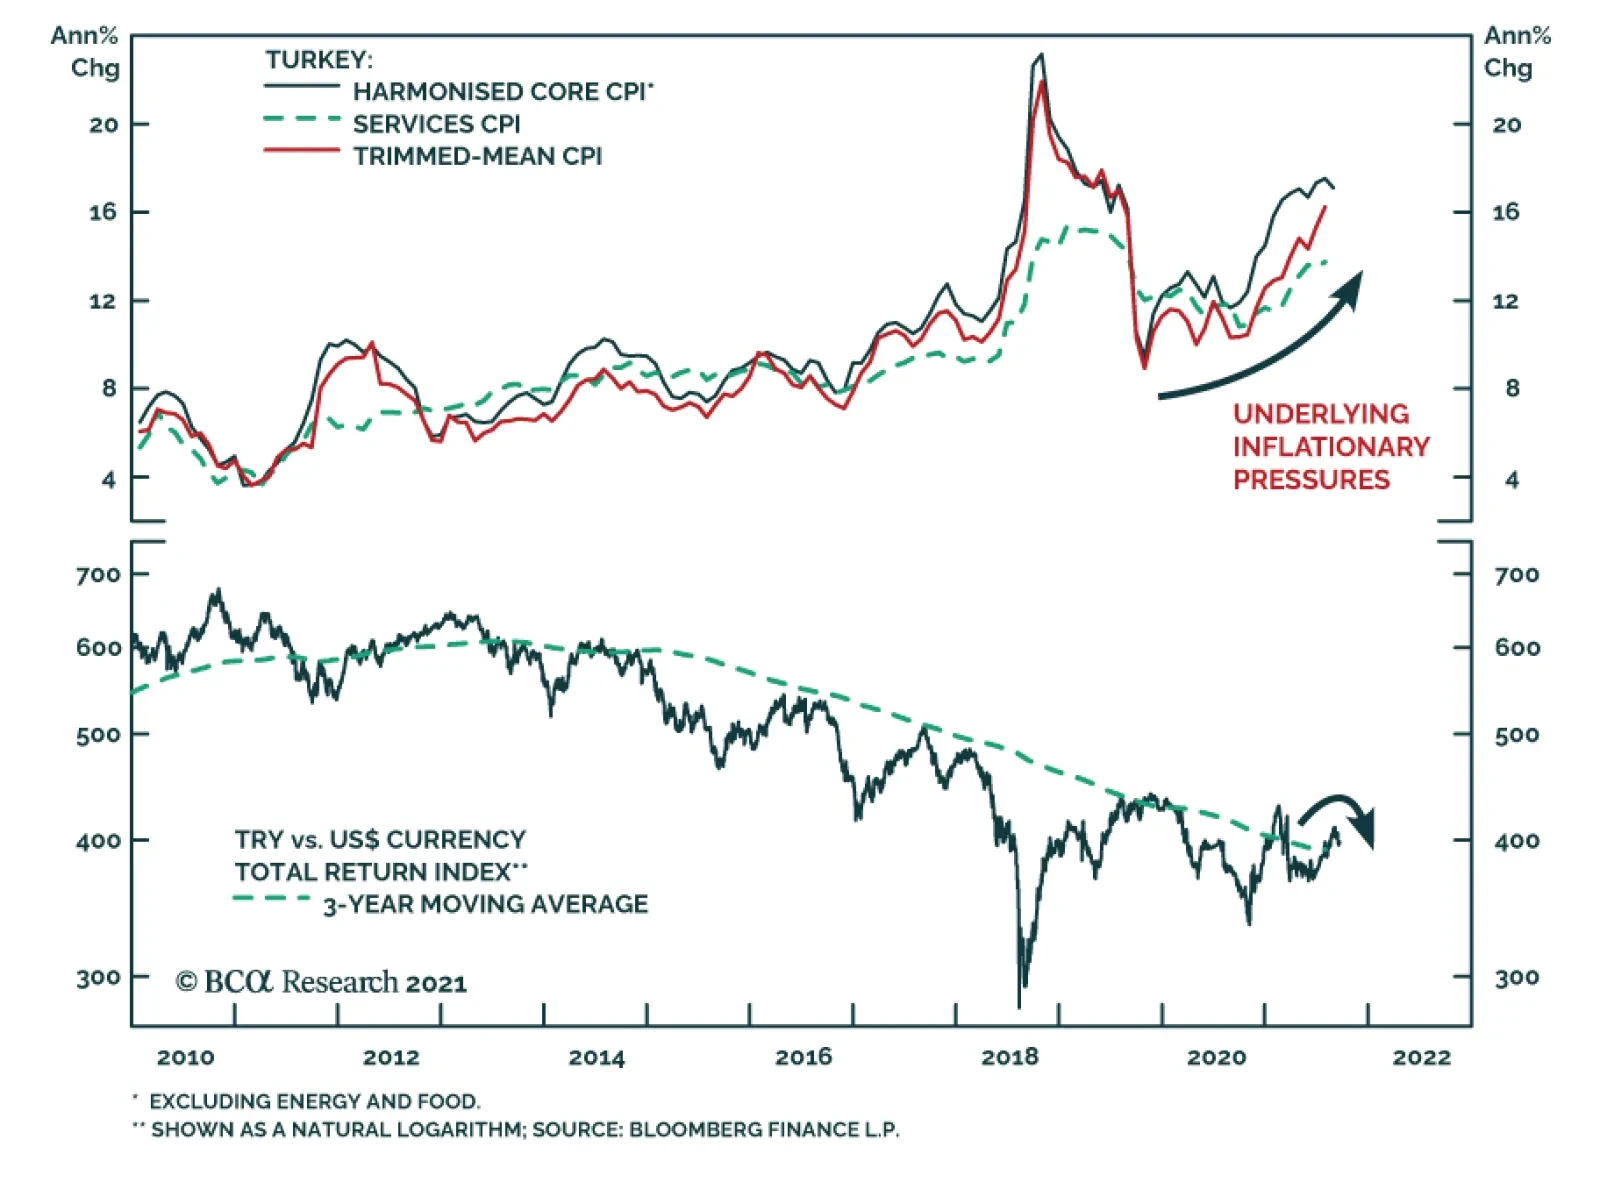
The Turkish central bank surprised investors with a 100-basis point rate cut on Thursday, bringing the one-week repo rate down to 18%. The decision comes despite rising inflation. Headline CPI has been steadily climbing since late-2019 and reached 19.25% in…
The Bank of England kept policy unchanged at its meeting on Thursday. Instead, it revised down its Q3 growth outlook to 2.1% from last month’s 2.9%. However, it highlighted that this revision largely reflects the dampening effect of supply constraints on…