Monetary

Highlights It is too early to conclude that the PBoC’s surprise rate cut last Friday to its reserve requirement ratio (RRR) marks the beginning of another policy easing cycle. Historically it took more than a single RRR reduction to lower interest rates and to boost credit growth. Overall economic conditions do not yet suggest that Chinese policymakers will initiate a broad-based policy easing to spur demand. The end-of-July Politburo meeting will shed more light on whether there is a decisive turn in China’s overall policy stance. In previous cycles, consecutive RRR cuts led to bond market rallies, but were not good leading indicators for equities, which have been more closely correlated with cyclical swings in credit and business cycle. We recommend patience. Chinese onshore stocks are richly valued and their prices can still correct in Q3 when corporate profits and economic growth slow further. Feature The speed and magnitude of the PBoC’s 50-basis point trim in its RRR rate last week exceeded market expectations. The RRR rate drop, combined with June’s better-than-expected credit data, sparked speculation that China’s macroeconomic policy had shifted to an easier mode. A single RRR cut does not indicate that another policy easing cycle is underway. Rather, the PBoC’s intention is to prevent rising demand for liquidity in 2H21 from significantly pushing up interest rates. In addition, we do not expect that the credit impulse will decisively turn around until later this year. We will remain alert to any signs of additional policy easing, particularly because policymakers will face more pressure to maintain trend growth next year. The July Politburo meeting may provide more information on the direction of Chinese macro policy going forward. Meanwhile, investors should stay the course. In previous cycles there were long lags between the first RRR cut and sustained rallies in China’s onshore stock markets. We will continue to maintain an underweight stance towards Chinese stocks through the next three months, given that economic data and corporate profits will likely weaken further in Q3. Surprise, Surprise! The PBoC lowered the RRR rate only two days after the State Council mentioned the possibility, which exceeded the consensus. Historically, the PBoC has always made more than one RRR reduction during easing cycles, separated by about three months. Are more RRR cuts pending and does the initial decrease mark the beginning of another policy easing cycle? It is too early to conclude that a broad-based easing cycle has started, for the following reasons: First, economic fundamentals do not suggest an urgent need for policy easing. The economy is softening, but it is softening from a very elevated level (Chart 1). Importantly, production is weakening at a faster pace than demand and partially due to COVID-related idiosyncrasies. This supply-side issue cannot be solved by monetary easing. For example, the production subcomponent of the manufacturing PMI fell in June while new orders increased (Chart 2). Since its trough in April last year, the gap between new orders and production has consistently narrowed for 11 of the past 15 months, highlighting that the demand-side recovery has been outpacing the supply-side. The recent resurgence in COVID-19 cases and local lockdowns in Guangdong province, which is China’s manufacturing and export powerhouse, may have curbed June’s manufacturing production and new export orders. Global supply shortages in raw materials and chips also add to the sluggishness in manufacturing production. Chart 1Chinese Economy Is Slowing, But Not Too Slow
Chinese Economy Is Slowing, But Not Too Slow
Chinese Economy Is Slowing, But Not Too Slow
Chart 2Demand Not As Soft Compared With Production
Demand Not As Soft Compared With Production
Demand Not As Soft Compared With Production
Similarly, China’s service PMI slipped notably in June and has closely tracked the country’s domestic COVID-19 situation. The decline is an issue that policy easing and boosting demand will not solve (Chart 3). Secondly, global supply chains are still impaired and commodity prices remain elevated. Even though China’s PPI on a year-over-year basis rolled over in June, it is at its highest level since 2008 (Chart 4). As such, spurring demand through monetary easing would only exacerbate inflationary pressures among producers. Chart 3Slow Recovery In Services Largely Due To Lingering COVID Effects
Slow Recovery In Services Largely Due To Lingering COVID Effects
Slow Recovery In Services Largely Due To Lingering COVID Effects
Chart 4Producer Prices Remain Elevated
Producer Prices Remain Elevated
Producer Prices Remain Elevated
Apart from COVID-related disruptions, the weakness in China’s economy this year has been driven by slower growth in infrastructure and real estate investment due to tightened regulatory oversights that were put in place late last year (Chart 5). Construction PMI declined sharply from its peak in March and both excavator sales and loader sales have plummeted since Q1 this year (Chart 5, bottom panel). However, regulatory tightening towards the housing market and infrastructure projects remain firmly in place, suggesting that policymakers are not looking to stimulate the old economy sectors to support growth. Lastly, despite weaker home sales, housing prices in tier-one cities continue to escalate (Chart 6). The rising prices will keep authorities vigilant about excessive liquidity in the market. Chart 5It Has Been Chinese Policymakers' Intention To Slow The 'Old Economy' Sectors
It Has Been Chinese Policymakers' Intention To Slow The 'Old Economy' Sectors
It Has Been Chinese Policymakers' Intention To Slow The 'Old Economy' Sectors
Chart 6Housing Market Mania Remains Authorities' Pressure Point
Housing Market Mania Remains Authorities' Pressure Point
Housing Market Mania Remains Authorities' Pressure Point
Bottom Line: Supply-demand dynamics in the global economy and China’s domestic inflationary pressures suggest that it is premature to assume that the RRR cut marks the beginning of another policy easing cycle. Why Now? Chart 7More 'Pain' Needed For Broad Easing
More 'Pain' Needed For Broad Easing
More 'Pain' Needed For Broad Easing
The drop in the RRR highlights the PBoC’s determination to maintain a low interest-rate environment without any further easing, and does not indicate that the central bank has shifted its current policy setting framework. The PBoC has been reactive rather than proactive in the past as it typically waits for severe signs of economic weakness before broadly relaxing its policy (Chart 7). The PBoC cited two main reasons for the RRR cut. One is to ease liquidity pressures of small to medium enterprises (SMEs), which have been struggling with rising input prices and subdued output prices (Chart 8). This motive is consistent with the PBoC’s monetary position so far this year –the central bank has kept rates at historical low levels while scaling back credit creation (Chart 9). Chart 8SMEs Under Elevated Pricing Stress
SMEs Under Elevated Pricing Stress
SMEs Under Elevated Pricing Stress
Chart 9The PBoC Has Kept Rates At Historic Low Levels
The PBoC Has Kept Rates At Historic Low Levels
The PBoC Has Kept Rates At Historic Low Levels
Demand for liquidity will rise meaningfully in the second half of the year due to an acceleration in local government bond issuance and the large number of expiring medium-term lending facility (MLF) loans and bonds. The liquidity gap could significantly push up interbank and market-based interest rates without the central bank’s intervention. The amount of maturing MLF and government bonds could be more than RMB1 trillion in July. Thus, the 50bp RRR cut, which the PBoC indicates will free up about RMB1 trillion of liquidity to the banking system, will ensure that interest rates remain stable. Chart 10Bank Lending Rates Have Not Declined With Policy Rates
Bank Lending Rates Have Not Declined With Policy Rates
Bank Lending Rates Have Not Declined With Policy Rates
The PBoC also stated that it intends to keep down financing costs for both banks and SMEs. The statement is vague, but the PBoC may mean it plans to guide bank lending rates lower for SMEs and, at the same time, provide banks (particularly smaller banks) with enough liquidity to encourage lending to those enterprises. To achieve this goal, a broad-based RRR cut would be more effective than other monetary policy tools, such as open-market operations or MLF injections, which normally benefit large commercial banks more than their smaller counterparts. While interbank rates have been sliding since Q4 last year, the weighted average lending rates moved sideways and even ticked up slightly this year (Chart 10). As of Q1 2021, more than half of bank loans charged higher interest rates than the loan prime rate (LPR), highlighting a distribution matrix unfavorable to SMEs (Chart 11). Loan demand from SMEs, as shown in the PBoC survey, peaked much earlier and tumbled more rapidly than their large peers (Chart 12). Chart 11SMEs Face Rising Input And Funding Costs
China’s Monetary Policy: Easy, But Not Easing
China’s Monetary Policy: Easy, But Not Easing
Chart 12Waning SMEs' Demand For Bank Credit
Waning SMEs' Demand For Bank Credit
Waning SMEs' Demand For Bank Credit
Lowering lending rates for SMEs is usually at the cost of the banks by bearing higher default risks and lower profits. A RRR reduction, coupled with recent changes in banks’ deposit rate pricing mechanisms,1 are measures that can potentially reduce the banks’ liability costs. Bottom Line: The PBoC is using a RRR cut to avoid a sudden jump in interest rates from their low levels in 1H21, and to reduce funding costs for the SMEs and banks. What About Credit Growth? Chart 13Credit Numbers In June Beat Market Expectations
Credit Numbers In June Beat Market Expectations
Credit Numbers In June Beat Market Expectations
Credit numbers beat the market’s expectations in June. Both credit growth and impulse rose slightly after a fast deceleration in much of 1H21 (Chart 13). We continue to expect the credit impulse to hover at a low level throughout Q3. Local government bond issuance will pick up in 2H21, but the acceleration will not necessarily lead to a reversal in credit growth (Chart 14). On a year-over-year basis, high base during Q3 last year will depress credit growth and impulse in the next three months. Moreover, in the past couple years, on average local government bonds account for only about 18% of annual total social financing. As such, the pace of bank loan expansion would need to substantially accelerate to reverse the slowdown in credit growth in the next three months. In previous cycles, on average it took more than one RRR cut and about two quarters for credit growth to turn around (Chart 15). Therefore, even if monetary policy is on an easing path, we expect credit growth to pick up in Q4 at the earliest. Chart 14LG Bonds Only A Small Part Of Total Credit Creation
China’s Monetary Policy: Easy, But Not Easing
China’s Monetary Policy: Easy, But Not Easing
Chart 15Credit Growth Lags RRR Cuts By About Two Quarters
Credit Growth Lags RRR Cuts By About Two Quarters
Credit Growth Lags RRR Cuts By About Two Quarters
Furthermore, policymakers are unlikely to deviate from targeting credit growth in line with nominal GDP this year. Based on our estimate, the target suggests that the overall credit impulse relative to 2020 will be negative this year (Chart 16). Chart 16Negative Credit Impulse In 2021 Relative To 2020
Negative Credit Impulse In 2021 Relative To 2020
Negative Credit Impulse In 2021 Relative To 2020
Chart 17The Credit Structure, Rather Than Volume, Will Improve In 2H21
The Credit Structure, Rather Than Volume, Will Improve In 2H21
The Credit Structure, Rather Than Volume, Will Improve In 2H21
Meanwhile, we think that the PBoC will focus on improving the structure of credit creation by continuing to encourage medium- to long-term lending, while scaling back shadow banking and short-term loans (Chart 17). Corporate bond financing improved slightly in June. However, room for further improvement in corporate bond issuance is small this year, given tightened financing reglations on local government financing vehicles. Downside potential for corporate bond yields is also limited in 2H21, when the economy slows and corporate bond default risks are rising (Chart 18). Given elevated housing prices and tightened regulations to contain the property sector’s leverage, bank lending to real estate developers and mortgages will continue to trend down in the foreseeable future, regardless the direction of interest rates (Chart 19). Chart 18Limited Upsides For Corporate Bond Issuance In 2H21
Limited Upsides For Corporate Bond Issuance In 2H21
Limited Upsides For Corporate Bond Issuance In 2H21
Chart 19Bank Loans To Property Market Unlikely To Pick Up In 2H21
Bank Loans To Property Market Unlikely To Pick Up In 2H21
Bank Loans To Property Market Unlikely To Pick Up In 2H21
Bottom Line: Regardless changes in monetary policy, credit growth will not decisively bottom until later this year. Investment Implications Chart 20Chinese Stock Prices Failed To Break Out
Chinese Stock Prices Failed To Break Out
Chinese Stock Prices Failed To Break Out
Chinese stocks in both onshore and offshore equity markets failed to reverse their trend of underperformance relative to global stocks (Chart 20). Investors should be patient in upgrading their allocation to Chinese stocks from underweight to overweight, in both absolute terms and within a global equity portfolio. Historically, there has been a long lag between an initial RRR trim and a trough in Chinese onshore stock prices (Chart 21). Although prices moved up along with RRR cut announcements in the past, the price upticks were short lived. Stock prices in previous cycles troughed when the credit impulse and/or the economy bottomed. Given our view that a single RRR decrease does not indicate a broad-based policy easing and the credit impulse is unlikely to pick up until later this year, investors should wait for more price setbacks in Q3 before favoring Chinese stocks again. Chart 21Long Lags Between First RRR Cut And Stock Market Troughs
Long Lags Between First RRR Cut And Stock Market Troughs
Long Lags Between First RRR Cut And Stock Market Troughs
We are slightly more optimistic than last month about Chinese bonds because the RRR cut has reduced the possibility for any substantial rise in interest rates in 2H21. However, we maintain a cautious view on Chinese government and corporate bonds in Q3. In previous cycles, onshore bond yields often fluctuated sideways or even climbed a bit following the first RRR reduction. It often took several RRR drops, more policy easing signals and sure signs of economic weakening for the bond market to enter a tradable bull run (Chart 22). Therefore, we recommend investors stay on the sidelines for a better entry price point. Chart 22It Takes More Than One RRR Cut To Start A Bond Market Bull Run
It Takes More Than One RRR Cut To Start A Bond Market Bull Run
It Takes More Than One RRR Cut To Start A Bond Market Bull Run
It is also unrealistic to expect the RRR cut will lead to significant and sustained devaluation in the RMB relative to the US dollar. We expect the dollar index to rebound somewhat in Q3 on the back of positive US employment data surprises which will push US bond yields higher. However, following previous RRR cuts, the RMB had sizeable depreciations only when geopolitical events (the US-China trade war in 2018/19) or drastic central bank intervention (the August 2015 de-pegging from the USD) coincided with the RRR cuts. These scenarios are not likely to play out in the next six months (Chart 23). As such, we maintain our view that the CNY will slightly weaken against the USD in Q3 but will end the year at around 6.4. Chart 23Expect Muted And Short-Lived Movements In The USDCNY From A Single RRR Cut
Expect Muted And Short-Lived Movements In The USDCNY From A Single RRR Cut
Expect Muted And Short-Lived Movements In The USDCNY From A Single RRR Cut
Jing Sima China Strategist jings@bcaresearch.com Qingyun Xu, CFA Associate Editor qingyunx@bcaresearch.com Footnotes 1The reform changes the way banks calculate and offer deposit rates. The upper limit is set on their deposit interest rates by adding basis points to the central bank’s benchmark deposit rates, rather than multiplying the benchmark rates by a specific number. Exclusive: Banks Prepare to Lower Deposit Rates as Rate Cap Reform Takes Effect (caixinglobal.com) Cyclical Investment Stance Equity Sector Recommendations
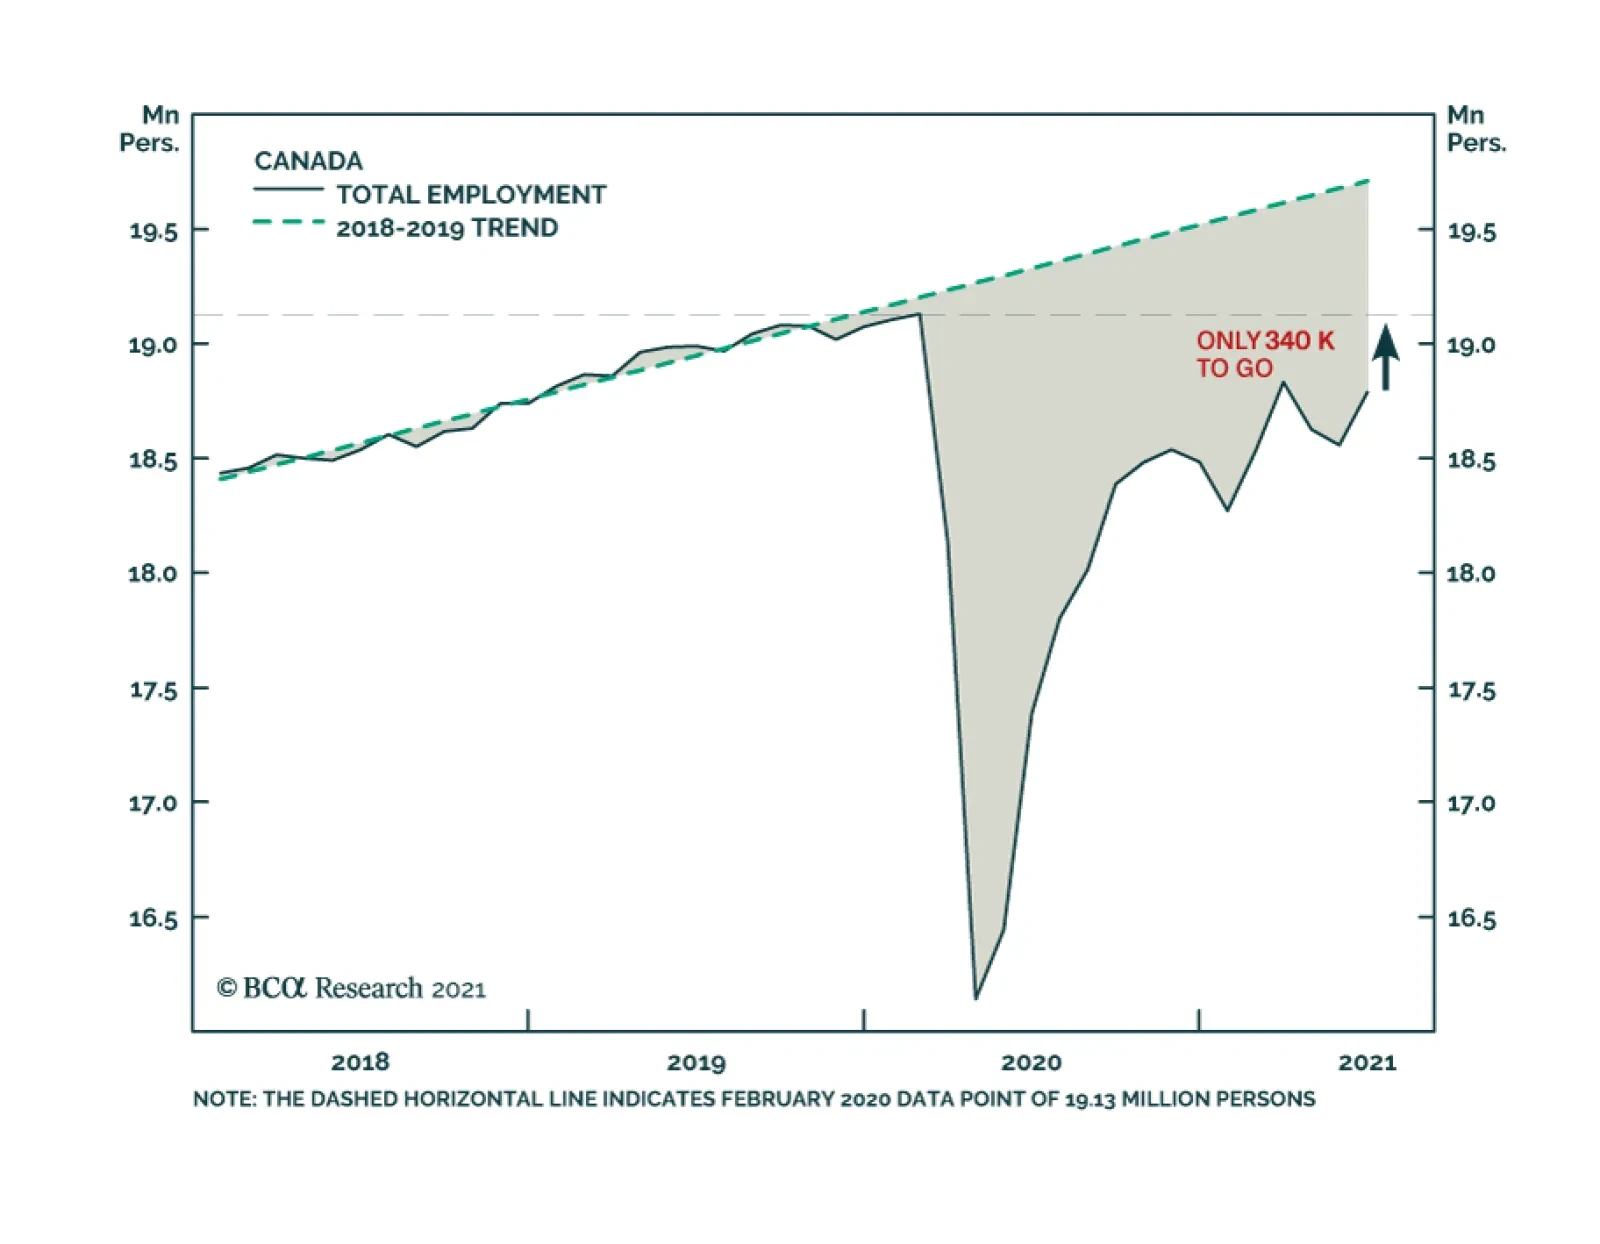
Canadian employment growth in June was robust at 231,000, a big improvement over the losses incurred over the prior two months. The latest month’s growth was driven mainly by a 264,000 increase in part-time jobs: full-time workers fell by 33,000. The recovery…
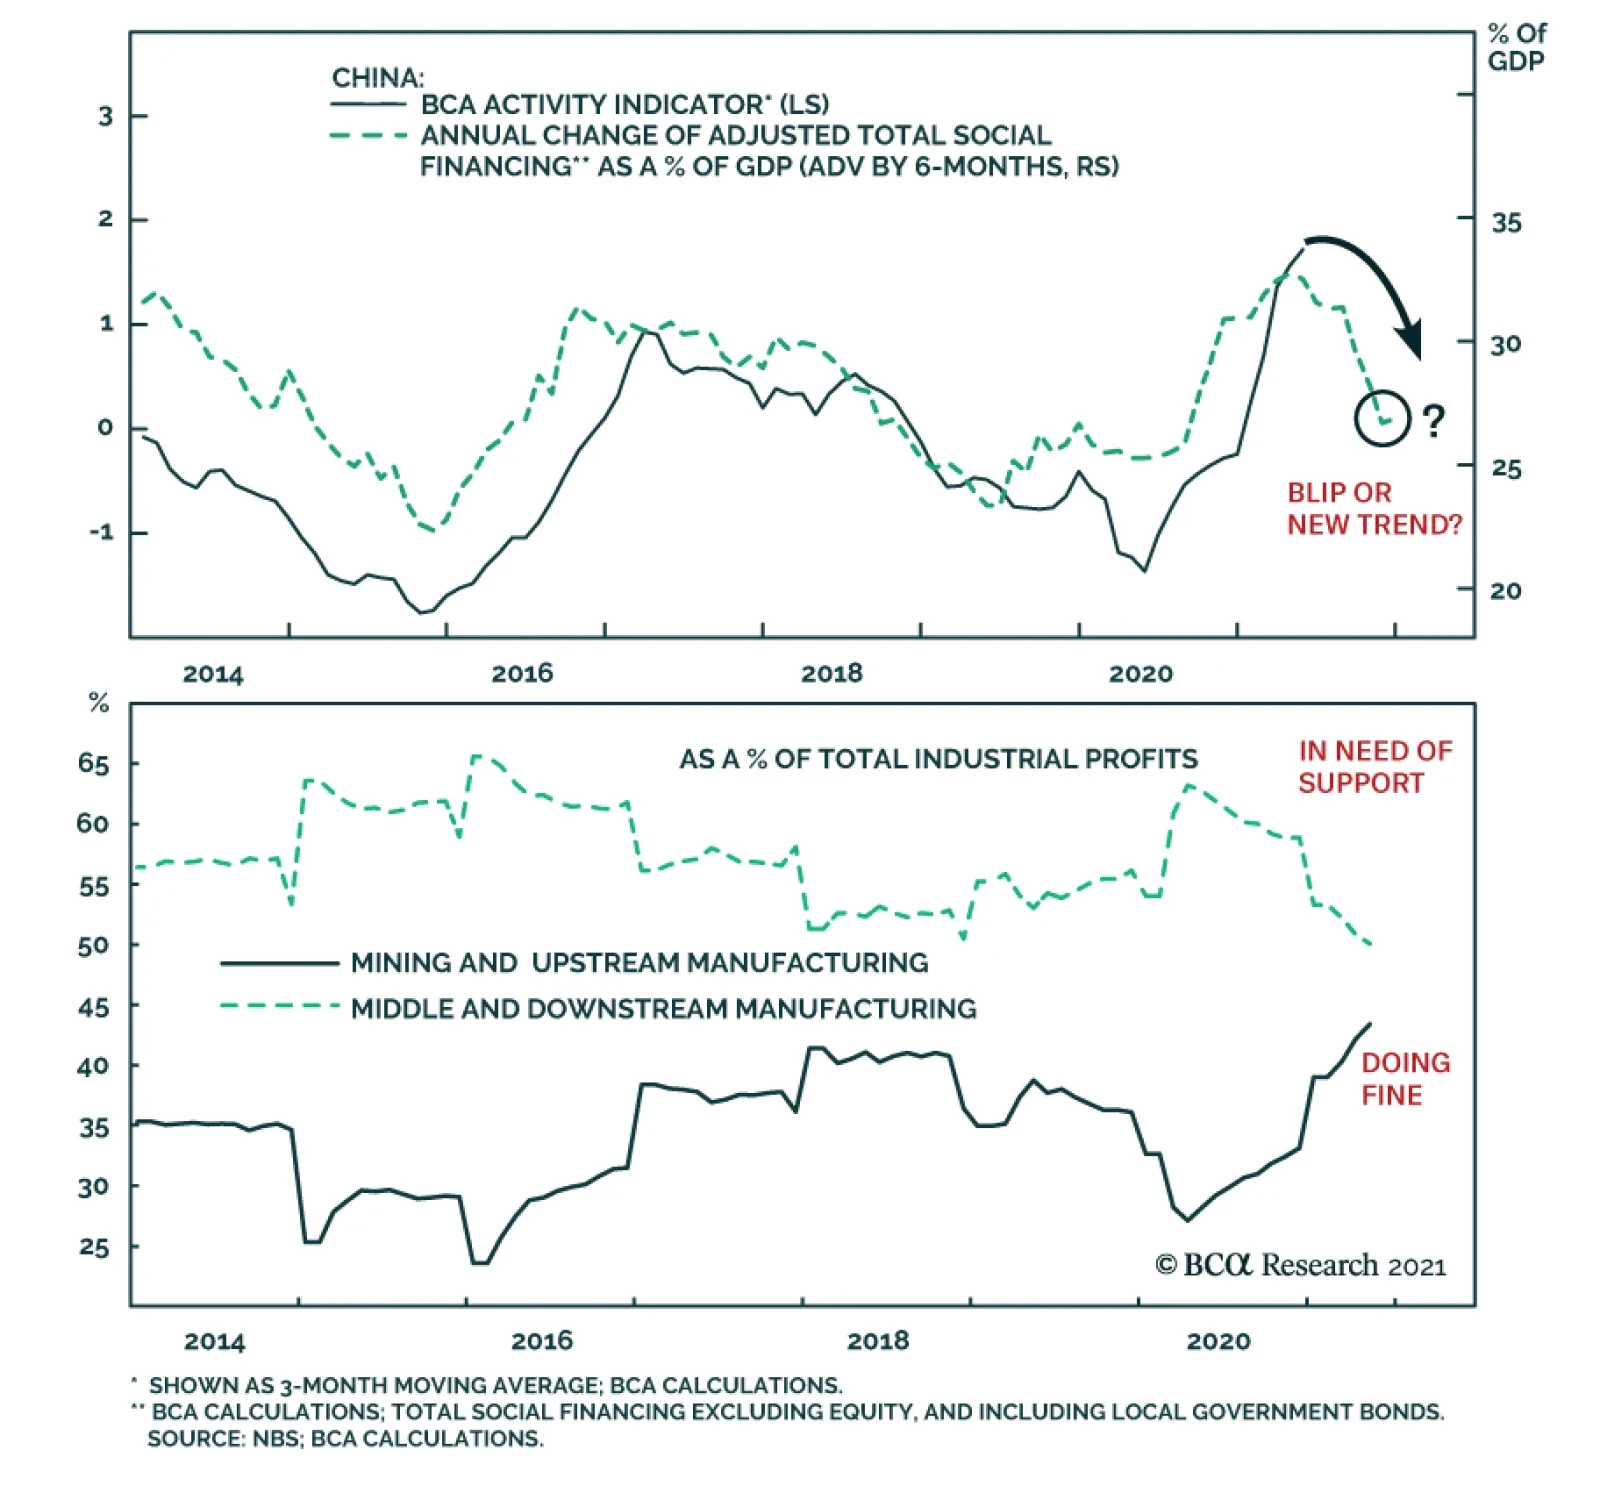
Chinese credit numbers came in rather higher than expected. Total Social Finance (TSF) grew by RMB3.7 trillion in June, compared to RMB1.9 trillion in May and expectations of RMB2.9 trillion. At the same time, outstanding loan growth accelerated to 12.3%…
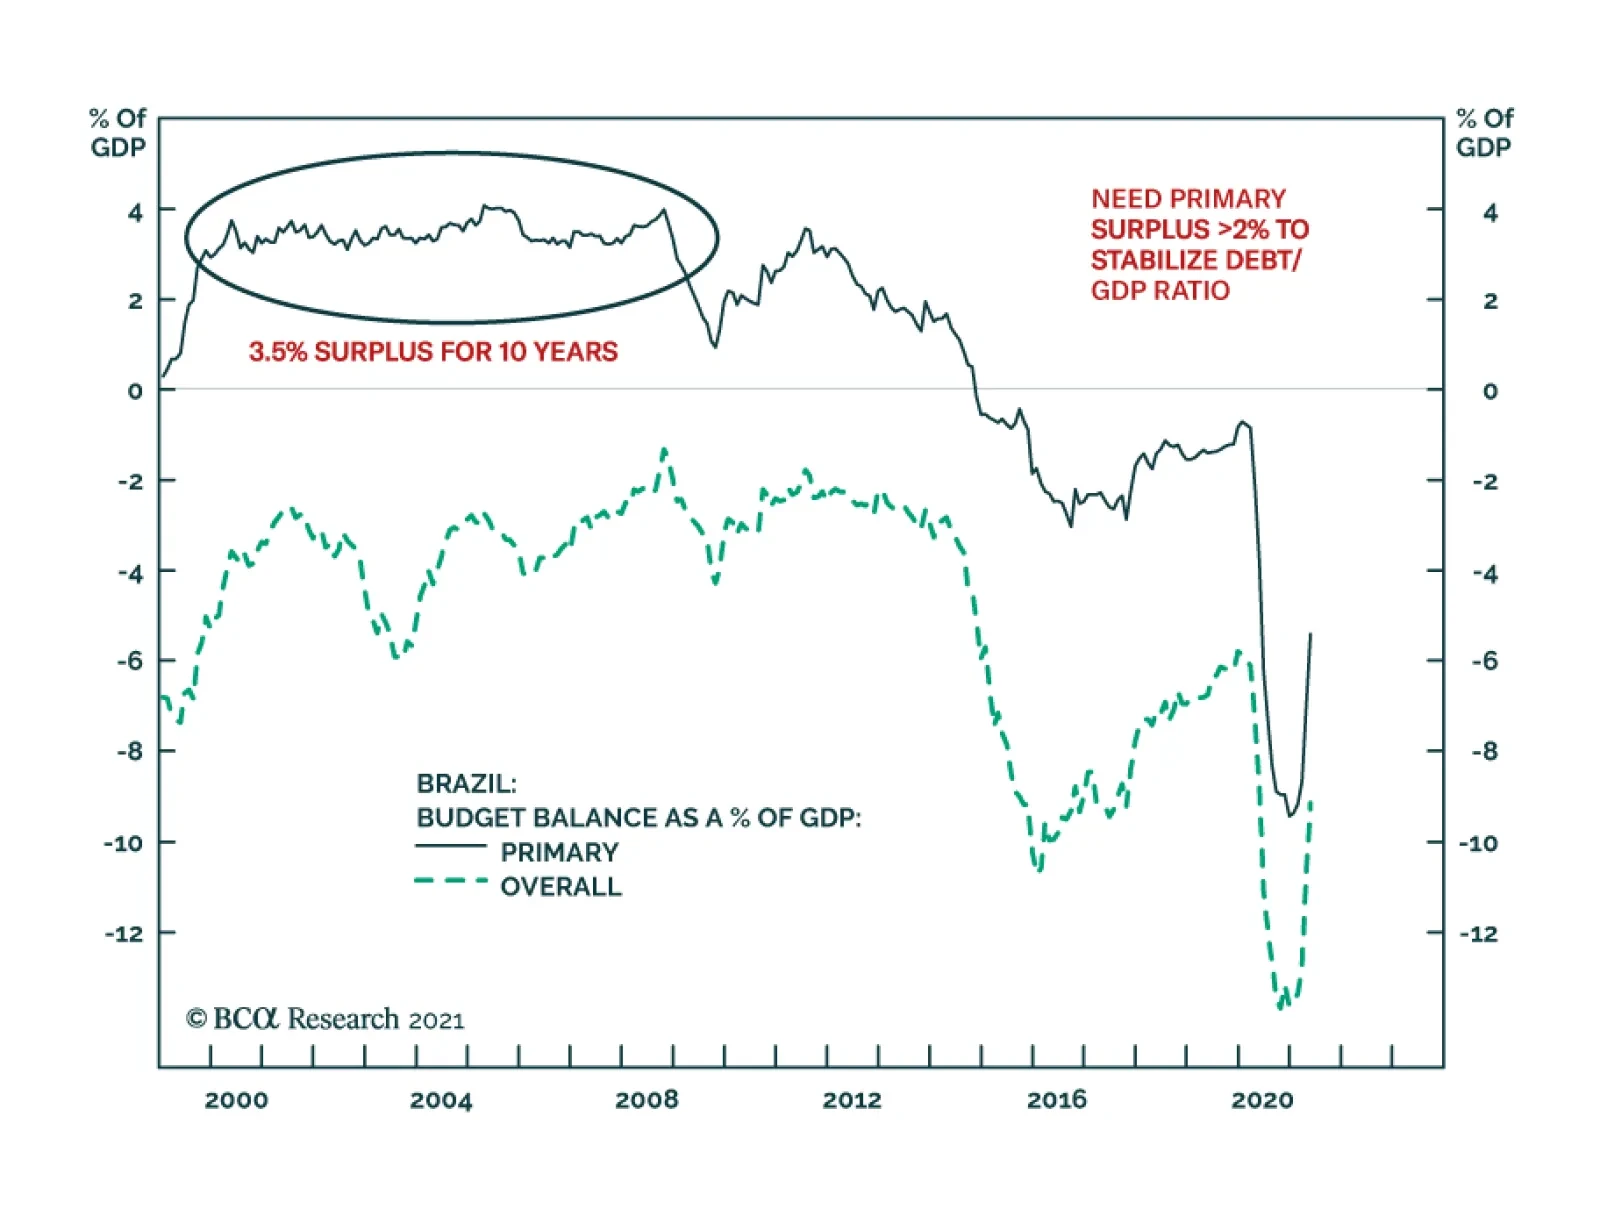
One of the structural challenges Brazil faces is its public debt overhang. The authorities have responded by periodically embarking on fiscal and monetary austerity. Yet, such austerity depresses nominal growth and has in fact worsened public debt dynamics. …
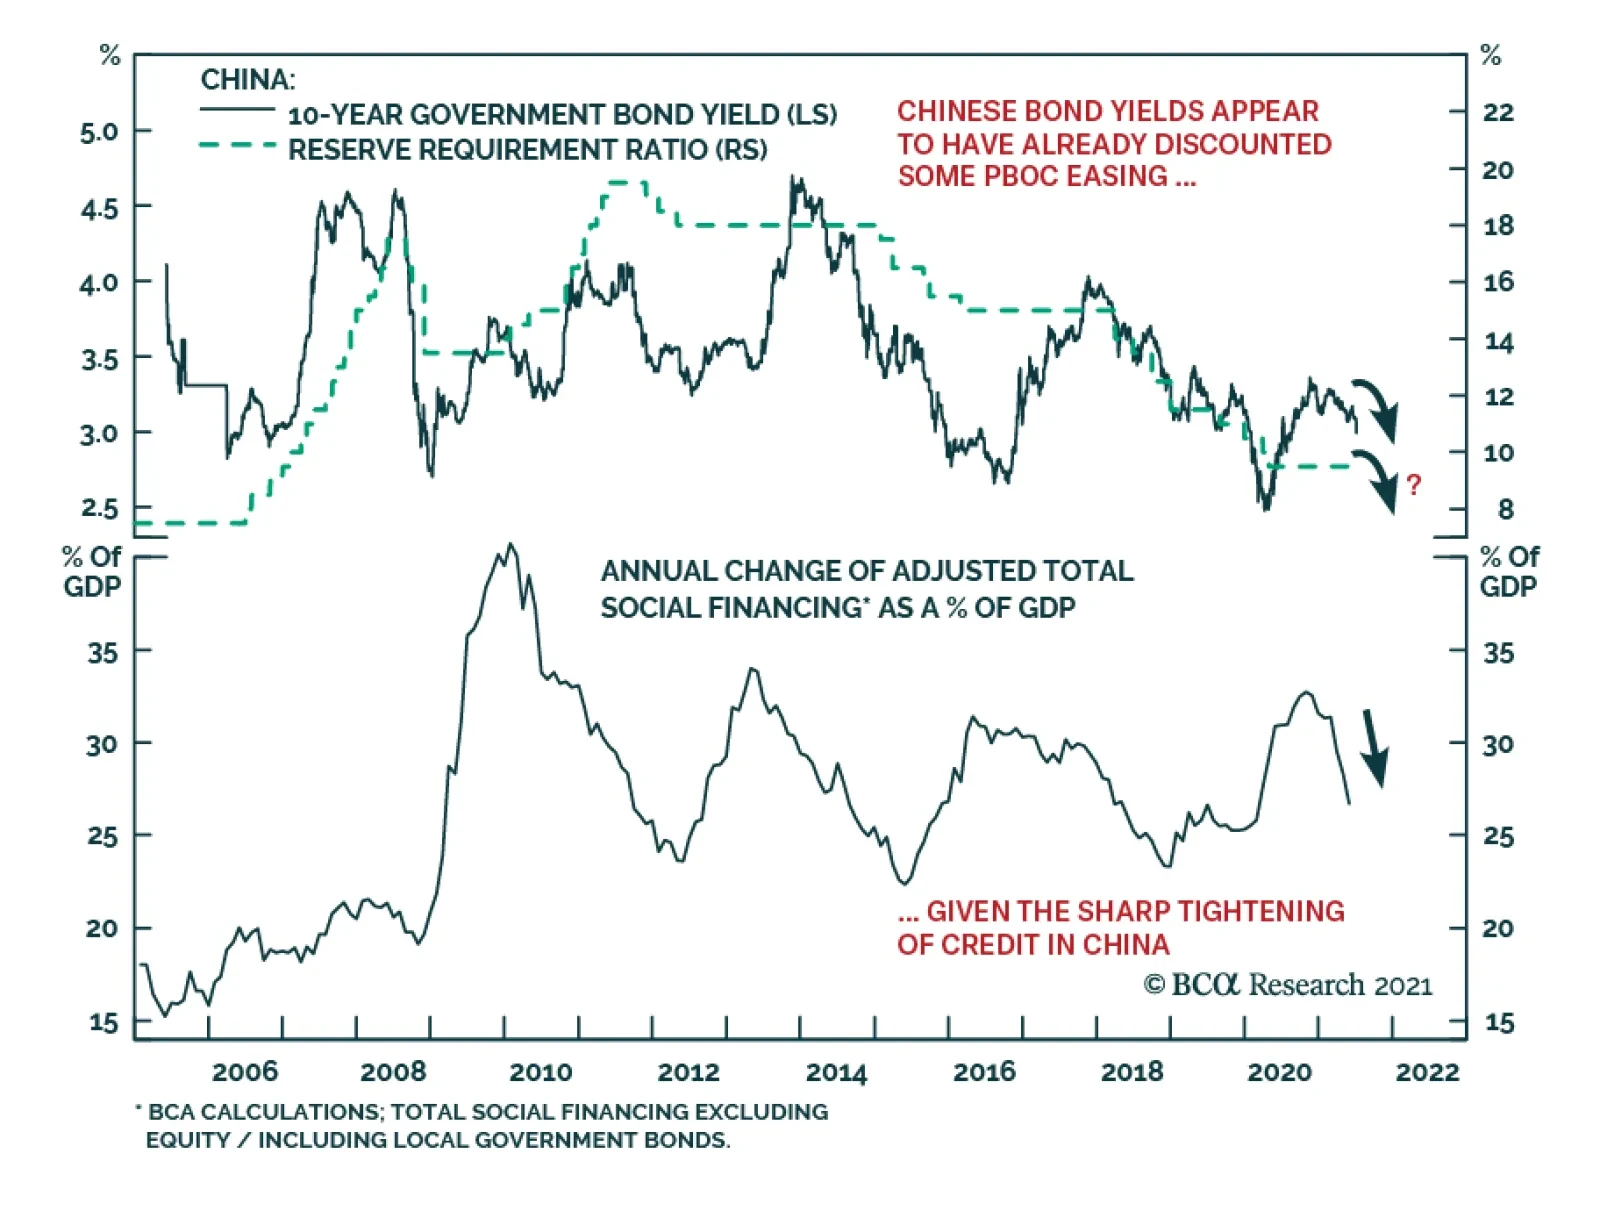
The China State Council meeting on July 7, chaired by Premier Li Keqiang, sent a somewhat ambiguous message on the direction of China’s monetary policy. The press release from the meeting stated that the country will “use monetary policy tools in a timely…
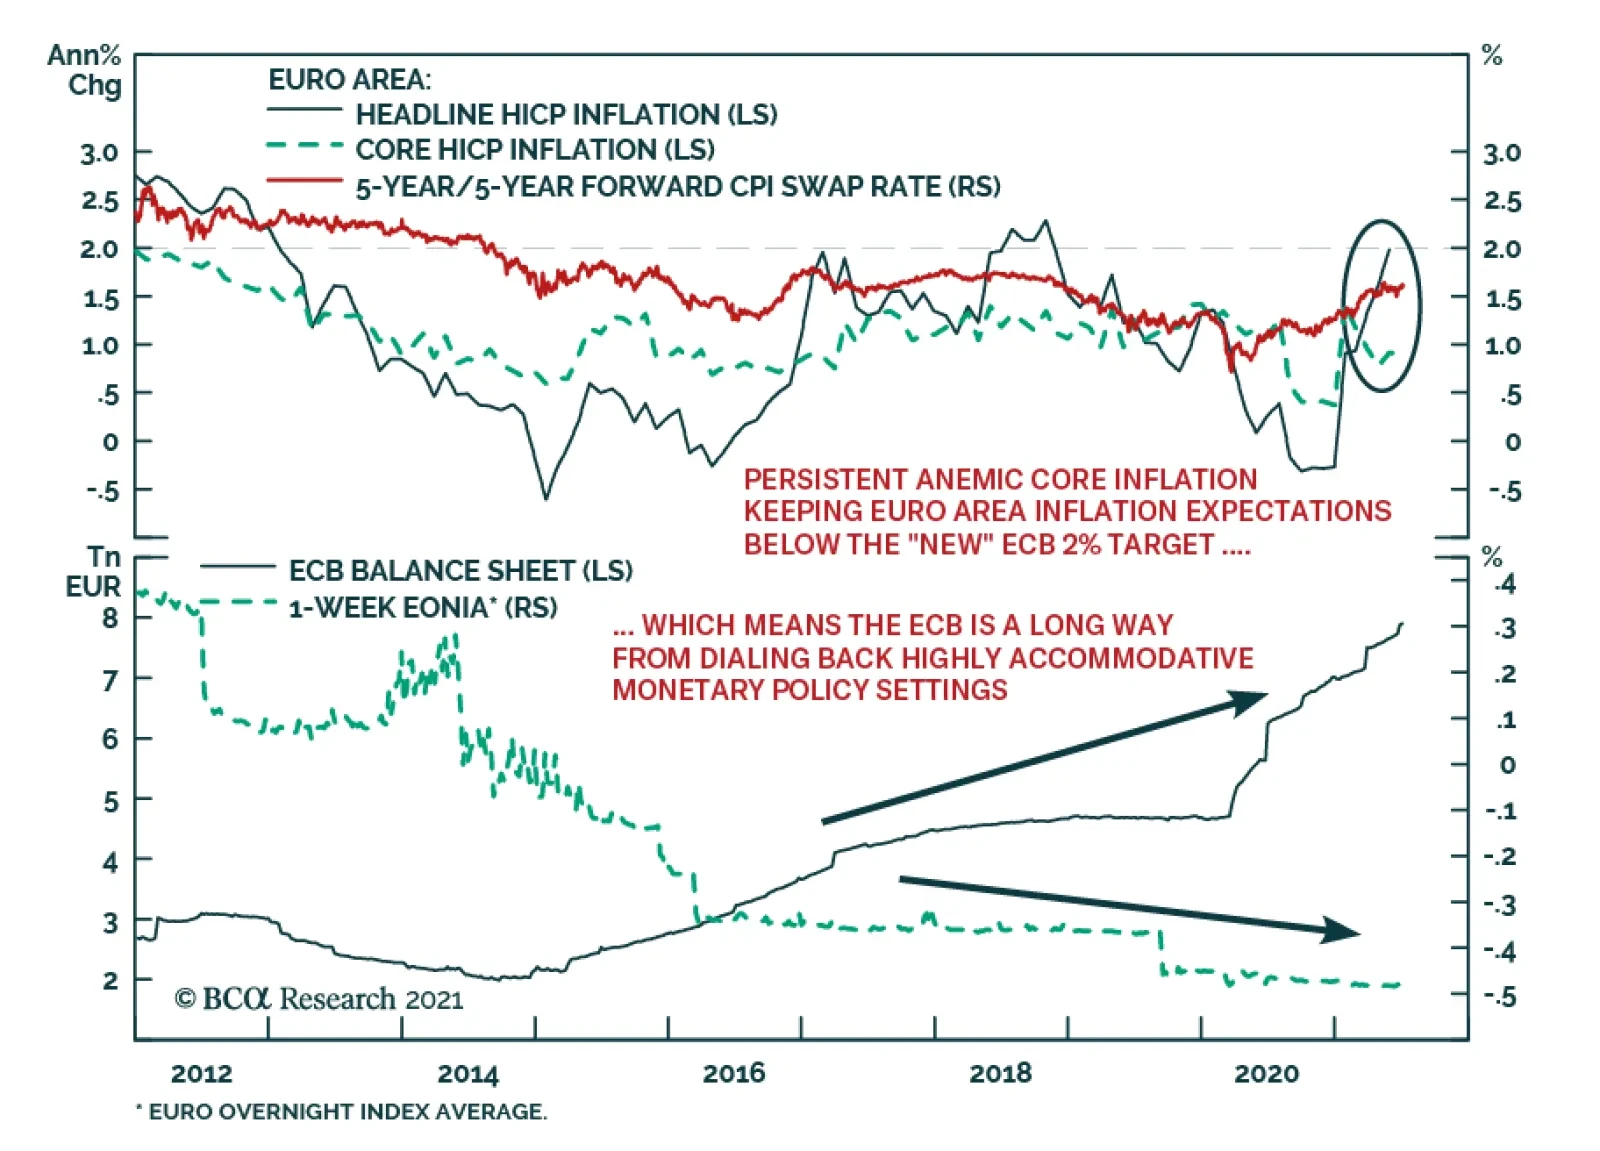
The ECB unveiled the results of its strategic review yesterday, with some noteworthy tweaks to the policy framework. The central bank shifted to a symmetric inflation target of 2%, a change from the prior goal of aiming for inflation “just below” 2%.…

In their Q2/2021 model bond portfolio performance review, BCA Research’s Global Fixed Income Strategy team updated their recommended positioning for the next six months. Firstly, the team changed its US Treasury curve exposure to have more of a flattening…
GFIS Model Bond Portfolio Q2/2021 Performance Review & Current Allocations: Hitting A Few Roadblocks
Highlights Q2/2021 Performance Breakdown: Our recommended model bond portfolio underperformed the custom benchmark index by -6bps during the second quarter of the year. Winners & Losers: The government bond side of the portfolio underperformed by -21bps, led overwhelmingly by our underweight to US Treasuries (-18bps). Spread product allocations outperformed by +15bps, primarily due to overweights on US high-yield (+11bps) and US CMBS (+3bps). Portfolio Positioning For The Next Six Months: We are maintaining an overall below-benchmark portfolio duration stance, against a backdrop of persistent above-trend global growth and a highly stimulative fiscal/monetary policy mix. We are maintaining a moderate overweight to global spread product versus government debt, concentrated on an overweight to US high-yield where valuations look the least stretched. We are making two changes to the portfolio allocations heading into Q3: shifting the Treasury curve exposure to have more of a flattening bias, while downgrading EM USD-denominated corporates to neutral. Feature The trend in global bond yields so far in 2021 has been a tale of two quarters. The first three months of the year saw a surge in yields worldwide on the back of rapidly improving economic data, the rollout of COVID-19 vaccines and supply squeezes triggering rapid increases in inflation. During the second three months of the year, however, global yields drifted a bit lower in response to more mixed economic data, the spread of the Delta variant and slightly hawkish shifts from a few key central banks – most notably, the Fed – even with economic confidence measures remaining upbeat across the developed economies. The decline in yields has not been seen across the maturity spectrum, though. The yield-to-maturity of the Bloomberg Barclays Global and US Treasury 10+ year indices fell by -12bps and -30bps, respectively, from recent peaks. At the same time, shorter term bond yields have been relatively stable as central banks continue to signal that interest rate hikes are still well off into the future. In contrast to government bonds, credit markets have remained calm with spreads tight for developed market corporates and emerging market (EM) debt. With that in mind, we present our quarterly review of the BCA Research Global Fixed Income Strategy (GFIS) model bond portfolio during the second quarter of 2021. We also present our recommended positioning for the portfolio for the next six months (Table 1), as well as portfolio return expectations for our base case and alternative investment scenarios. The latter half of 2021 should prove to be even more challenging for bond investors, who must disentangle less consistent messages across countries on the Delta variant, vaccinations, inflation and the outlook for both monetary and fiscal policy. Table 1GFIS Model Bond Portfolio Recommended Positioning For The Next Six Months
GFIS Model Bond Portfolio Q2/2021 Performance Review & Current Allocations: Hitting A Few Roadblocks
GFIS Model Bond Portfolio Q2/2021 Performance Review & Current Allocations: Hitting A Few Roadblocks
As a reminder to existing readers (and to new clients), the model portfolio is a part of our service that complements the usual macro analysis of global fixed income markets. The portfolio is how we communicate our opinion on the relative attractiveness between government bond and spread product sectors. We do this by applying actual percentage weightings to each of our recommendations within a fully invested hypothetical bond portfolio. Q2/2021 Model Bond Portfolio Performance: Mixed Returns Chart 1Q2/2021 Performance: Credit Gains & Duration Losses
Q2/2021 Performance: Credit Gains & Duration Losses
Q2/2021 Performance: Credit Gains & Duration Losses
The total return for the GFIS model portfolio (hedged into US dollars) in the second quarter was +1.13%, slightly underperformed the custom benchmark index by -6bps (Chart 1).1 In terms of the specific breakdown between the government bond and spread product allocations in our model portfolio, the former generated -21bps of underperformance versus our custom benchmark index while the latter outperformed by +15bps. We have remained significantly underweight US Treasuries and positioned for a bearish steepening of the US Treasury curve since just before last year's US presidential election. That tilt was a big contributor to the excess return of the portfolio in Q1 (+63bps) that was partially given back (-18bps) in Q2 as longer maturity Treasury yields fell during the quarter. Our inflation-linked bond allocations in the US and Europe (+5bps) helped mitigate the loss on the government bond side from our below-benchmark duration stance and general curve steepening bias in most countries in the portfolio (Table 2). Table 2GFIS Model Bond Portfolio Q2/2021 Overall Return Attribution
GFIS Model Bond Portfolio Q2/2021 Performance Review & Current Allocations: Hitting A Few Roadblocks
GFIS Model Bond Portfolio Q2/2021 Performance Review & Current Allocations: Hitting A Few Roadblocks
The sum of excess returns during the quarter from countries that we overweighted (Germany, France, Italy, Spain, and Japan) was zero. Improving growth momentum and stronger economic confidence helped push yields higher in those countries. Therefore, those positions could not offset the losses from the underweight to US Treasuries. We did make two shifts in the country allocation within the government bond portion of the portfolio during Q2, downgrading Canada to underweight on April 20 and upgrading Australia to overweight on June 9. Neither change meaningfully contributed to the return of the portfolio. Meanwhile, our moderate overall overweight tilt on spread product versus government bonds fueled the outperformance from the credit side of the portfolio, led by US high-yield (+11bps) and US CMBS (+3bps). Overall gains from spread product were impressive in both USD-hedged total return terms (+95bps) and relative to our custom benchmark (+15bps), despite spreads entering Q2 at fairly tight levels. In the second quarter, improving economic confidence and easing credit conditions allowed spreads to narrow even further for corporate debt in the US and Europe, as well as for EM USD-denominated credit. The bar charts showing the total and relative returns for each individual government bond market and spread product sector are presented in Charts 2 & 3. Chart 2GFIS Model Bond Portfolio Q2/2021 Government Bond Performance Attribution
GFIS Model Bond Portfolio Q2/2021 Performance Review & Current Allocations: Hitting A Few Roadblocks
GFIS Model Bond Portfolio Q2/2021 Performance Review & Current Allocations: Hitting A Few Roadblocks
Chart 3GFIS Model Bond Portfolio Q2/2021 Spread Product Performance Attribution By Sector
GFIS Model Bond Portfolio Q2/2021 Performance Review & Current Allocations: Hitting A Few Roadblocks
GFIS Model Bond Portfolio Q2/2021 Performance Review & Current Allocations: Hitting A Few Roadblocks
Biggest Outperformers: Overweight US high-yield: Ba-rated (+5bps), B-rated (+4bps), and Caa-rated (+3bps) Overweight US TIPS (+4bps) Overweight US CMBS (+3bps) Overweight Euro Area high-yield (+1bps) Biggest Underperformers: Underweight US Treasuries with a maturity greater than 10 years (-17bps), Underweight US Treasuries with a maturity between 7 and 10 years (-3bps) Underweight US Treasuries with a maturity between 5 and 7 years (-2bps) Underweight EM USD sovereigns (-1bps) Underweight UK GIlts with a maturity greater than 10 years (-1bps) Chart 4 presents the ranked benchmark index returns of the individual countries and spread product sectors in the GFIS model bond portfolio for Q2/2021. Returns are hedged into US dollars (we do not take active currency risk in this portfolio) and adjusted to reflect duration differences between each country/sector and the overall custom benchmark index for the model portfolio. We have also color coded the bars in each chart to reflect our recommended investment stance for each market during Q2 (red for underweight, dark green for overweight, gray for neutral). Chart 4Ranking The Winners & Losers From The GFIS Model Bond Portfolio Universe In Q2/2021
GFIS Model Bond Portfolio Q2/2021 Performance Review & Current Allocations: Hitting A Few Roadblocks
GFIS Model Bond Portfolio Q2/2021 Performance Review & Current Allocations: Hitting A Few Roadblocks
Ideally, we would look to see more green bars on the left side of the chart where market returns are highest, and more red bars on the right side of the chart were returns are lowest. In Q2, the picture on that front was mixed. We were only neutral some of the biggest outperformers like UK Gilts (+312bps in USD-hedged duration-matched total return terms) and investment grade credit in the US (+430bps) and UK (+231bps). Our relative value allocation within EM, overweight corporates (+430bps) versus sovereigns (+527bps), also underperformed during Q2. We remained overweight government debt markets in the euro area which were the worst performers during the quarter (Germany: -25bps, Spain: -59bps, Italy: -67bps, and France: -83bps). The news was better on the credit side, where our significant overweight to US high-yield (+146bps) was a big positive contributor, as were overweights to US CMBS (+137bps) and euro area high-yield (+92bps). Bottom Line: Our model bond portfolio slightly underperformed its benchmark index in the second quarter of the year by -6bps – a negative result mainly driven by our underweight allocation to the US Treasury market but with an overweight to US high-yield providing a meaningful offset. Future Drivers Of Portfolio Returns & Scenario Analysis Looking ahead, the performance of the model bond portfolio will continue to be driven primarily by swings in global government bond yields, most notably US Treasuries. Our most favored cyclical indicators for global bond yields are still, in aggregate, signaling more upside potential over at least the next six months, although the nature of the signal is changing (Chart 5). Our Global Duration Indicator, comprised of leading economic indicators and measures of future economic sentiment, remains elevated but appears to have peaked. At the same time, the global manufacturing PMI, which typically leads global real bond yields by around six months, continues to climb to new cyclical highs. This suggests that the recent downdraft in global real bond yields could prove to be short-lived. Our Global Central Bank Monitor is climbing steadily, indicating greater upward pressure on bond yields from the combination of strong growth, rising inflation and loose financial conditions. Admittedly, bond yields are lagging the upward trajectory implied by the Monitor with central banks deliberately responding far more slowly to the cyclical pressures that would have triggered bond-bearish monetary tightening in the past. Nonetheless, the Monitor, the Global Duration Indicator and the global manufacturing PMI and all sending the same message – global bond yields remain too low, suggesting a below-benchmark overall portfolio duration stance remains appropriate. With regards to country allocation within the government bond side of our model portfolio, we continue to overweight countries where central banks are less likely to begin normalizing pandemic-era monetary policy quickly (Germany, France, Italy, Spain, Japan, Australia), while underweighting countries where normalization is expected to begin within the next 6-12 months (the US and Canada). We remain neutral the UK, although we have them on “downgrade watch” until there is greater clarity on how severely the spread of the Delta variant is impacting UK growth. The US remains the biggest underweight. The modestly hawkish turn by the Fed at the June FOMC meeting likely marked the end of the cyclical bear-steepening trend of the US Treasury curve. A full-blown turn to a bear-flattening of the US curve will be slow to develop, but we fully expect the cyclical pressures that drove the underperformance of longer-maturity US Treasuries over the past year to begin leaking into shorter-maturity bonds. That trend already appears to be underway with 5-year US yields starting to drift upward at a faster pace compared to other developed market peers (Chart 6). Chart 5Cyclical Indicators Suggest Global Yields Still Have More Upside
Cyclical Indicators Suggest Global Yields Still Have More Upside
Cyclical Indicators Suggest Global Yields Still Have More Upside
Chart 6UST Underperformance Will Shift To Shorter Maturities
UST Underperformance Will Shift To Shorter Maturities
UST Underperformance Will Shift To Shorter Maturities
This leads us to make a change to our model portfolio allocations this week, reducing the exposure to the belly of the US Treasury curve (the 3-5 year and 5-7 year maturity buckets), while modestly increasing the allocation to the 7-10 year bucket. To neutralize the duration-extending implication of that marginal shift, we added a new allocation to US Treasury bills, thus turning this US Treasury shift into a “butterfly” trade, essentially selling the 5-year bullet for a cash/10-year barbell. Longer-term Treasury yields, however, are still in the process of working off an oversold condition that developed in Q1 (Chart 7). Duration positioning remains quite short, according to the JP Morgan survey of bond investors, while speculators are still working off a huge net short position in 30-year Treasury futures according to data from the CFTC. We anticipate that it will take another month or two to work off such an extreme oversold condition for US Treasuries, based on similar episodes over the past two decades. After that, longer-maturity Treasury yields will begin to begin climbing again, to the benefit of the US underweight (and below-benchmark duration stance) in our model portfolio. Chart 7Longer-Maturity USTs Working Off Oversold Condition
Longer-Maturity USTs Working Off Oversold Condition
Longer-Maturity USTs Working Off Oversold Condition
Chart 8A Sharply Diminished Impulse From Global QE
A Sharply Diminished Impulse From Global QE
A Sharply Diminished Impulse From Global QE
Outside the US, the bond-friendly impact of quantitative easing programs is fading, on the margin, with the growth of central bank balance sheets slowing (Chart 8). While outright tapering of bond buying has only occurred in Canada and the UK (within our model bond portfolio universe), we expect the Fed to begin tapering in early 2022. Financial stability concerns are expected to play an increasingly important role in future tapering decisions, with house prices booming in many countries, most notably Canada which supports our underweight stance on Canadian government debt. Australia is the notable exception to this trend towards slowing balance sheet growth, with the Reserve Bank of Australia (RBA) maintaining a healthy pace of bond buying given underwhelming realized inflation. The recent wave of COVID-19 cases, which has left half of Australia under lockdowns that were largely avoided in 2020, will ensure that the RBA stays dovish for longer, to the benefit of our overweight stance on Australian government bonds. We continue to see the overall dovish stance of global central bankers as being conducive to the outperformance of inflation-linked bonds versus nominal government debt. However, inflation breakevens in most countries have largely completed the rebound from the depressed levels reached during the 2020 COVID-19 global recession. Our Comprehensive Breakeven Indicators combine three measures to determine the upside potential for 10-year inflation breakevens: the distance from fair value based on our models, the spread between headline inflation and central bank target inflation, and the gap between market-based and survey-based measures of inflation expectations. Those indicators suggest that the most attractive markets to position for further upside potential for breakevens are in Italy and France, with breakevens looking more stretched in the US, Canada and Australia (Chart 9). On the back of this, we are maintaining our allocations to inflation-linked bonds in the euro area in our model portfolio. Chart 9Less Scope For Wider Global Inflation Breakevens
Less Scope For Wider Global Inflation Breakevens
Less Scope For Wider Global Inflation Breakevens
Chart 10Fading Support For Credit Markets From Global QE
Fading Support For Credit Markets From Global QE
Fading Support For Credit Markets From Global QE
Moving our attention to the credit side of our model portfolio, we feel that a moderate overweight stance on overall global corporates versus governments remains appropriate. However, the slowing trend in developed market central bank balance sheets, as an indicator of the incremental shift away from the COVID-era monetary policies from 2020, is flashing a warning sign for the performance of global spread product. The annual growth rate of the combined balance sheets of the Fed, ECB, Bank of Japan and Bank of England has been an excellent leading indicator of the excess returns of both global investment grade and high-yield corporates over the past decade (Chart 10). That growth rate peaked back in February of this year, suggesting a peak of global corporate bond excess returns around February 2022 Although given the current tight level of global corporate bond spreads, both for investment grade and high-yield, we expect future return outperformance from corporates versus government debt to come from carry rather than spread compression. Our preferred measure of the attractiveness of credit spreads is the historical percentile ranking of 12-month breakeven spreads, which measure how much spreads would need to widen to eliminate the carry advantage over duration-matched government bonds on a one-year horizon. Currently, only the lower-rated high-yield credit tiers in the US and euro area offer 12-month breakeven spreads above the bottom quartile of their history, within the credit sectors of our model portfolio (Chart 11). Chart 11Lower-Rated High-Yield Offers Relatively Attractive Spreads
GFIS Model Bond Portfolio Q2/2021 Performance Review & Current Allocations: Hitting A Few Roadblocks
GFIS Model Bond Portfolio Q2/2021 Performance Review & Current Allocations: Hitting A Few Roadblocks
Given the sharply reduced default risks on both sides of the Atlantic, and with nominal growth in good shape amid low borrowing rates, we are maintaining our overweights to high-yield bonds in both the US and euro area. At the same time, we are sticking with only a neutral stance on investment grade corporates in the US, euro area and the UK. We do anticipate starting to reduce the overall corporate bond exposure later this year, however, based on the ominous leading signal from the growth of central bank balance sheets – and what that signals about the future path for global monetary policy. Within the euro area, we continue to prefer owning Italian government bonds (and to a lesser extent, Spanish government debt) over investment grade corporates, given the more explicit support for the sovereigns through ECB quantitative easing (Chart 12). We expect the ECB to be the most accommodative central bank within our model portfolio universe over at least the next year, with even tapering of any kind unlikely in 2022. Chart 12Favor Italian BTPs Over Euro Area Investment Grade
Favor Italian BTPs Over Euro Area Investment Grade
Favor Italian BTPs Over Euro Area Investment Grade
One area of the spread product universe where we are starting to reduce risk in the model portfolio is EM USD-denominated credit. EM debt has benefited from a bullish combination of global policy stimulus, a weakening US dollar and rising commodity prices over the past year. We have positioned for that in our model portfolio through an overall overweight stance on EM USD-denominated debt, but one that favors investment grade corporates over sovereigns. Now, all of those supportive factors for EM credit are fading. Chinese policymakers have reigned in both credit stimulus and fiscal stimulus this year, with the combined impulse suggesting a slower pace of Chinese economic growth in the latter half of 2021 (Chart 13). Given China’s huge share of the global consumption of industrial commodities, slowing Chinese growth should cool the momentum of commodity prices over the next few quarters. A slowing liquidity impulse from global central bank asset purchases is also a negative for EM debt performance, on the margin. The same can be said for the US dollar, which is no longer depreciating as markets start to pull forward the expected future path for US interest rates (Chart 14). A stronger US dollar typically correlates with softer commodity prices and wider EM credit spreads. Chart 13Major EM Risks: China Tightening & Global QE Tapering
Major EM Risks: China Tightening & Global QE Tapering
Major EM Risks: China Tightening & Global QE Tapering
Chart 14EM Supportive USD Weakness Is Fading
EM Supportive USD Weakness Is Fading
EM Supportive USD Weakness Is Fading
In response to these growing risks to the bullish EM backdrop - including the rapid spread of the Delta variant made worse by the less-effective vaccines available in those countries - we are downgrading our overall EM USD credit exposure in the model bond portfolio to underweight from neutral. We are doing this by cutting the EM corporate exposure from overweight to neutral, while maintaining an underweight tilt on EM USD sovereigns. We expect to further cut the EM exposure in the coming months by moving to a full underweight on EM corporates. Summing it all up, our overall allocations and risks in our model portfolio leading into Q3/2021 look like this: An overall below-benchmark stance on global duration, equal to nearly one full year versus the custom index (Chart 15) A moderate overweight stance on global spread product versus government debt, equal to five percentage points of the portfolio (Chart 16). This overweight comes almost entirely from overweight allocations to US and euro area high-yield corporate debt. Chart 15Overall Portfolio Duration: Stay Below Benchmark
Overall Portfolio Duration: Stay Below Benchmark
Overall Portfolio Duration: Stay Below Benchmark
Chart 16Overall Portfolio Allocation: Small Spread Product Overweight
GFIS Model Bond Portfolio Q2/2021 Performance Review & Current Allocations: Hitting A Few Roadblocks
GFIS Model Bond Portfolio Q2/2021 Performance Review & Current Allocations: Hitting A Few Roadblocks
After the changes made to our US Treasury and EM positions, the tracking error of the portfolio, or its expected volatility versus that of the benchmark index, is quite low at 34bps (Chart 17). The main reason for this is that our positioning remains focused heavily on the US (Treasury underweight, high-yield overweight), with much of the other positioning close to neutral or largely offsetting other positions in a relative value sense (overweight Australia vs underweight Canada, overweight US CMBS versus underweight US Agency MBS). This fits with our desire to maintain only a moderate level of overall portfolio risk. The yield of the portfolio is now slightly higher than that of the benchmark, with a small “positive carry”, hedged into USD, of 13bps (Chart 18). Chart 17Overall Portfolio Risk: Moderate
Overall Portfolio Risk: Moderate
Overall Portfolio Risk: Moderate
Chart 18Overall Portfolio Yield: Small Positive Carry Vs. Benchmark
Overall Portfolio Yield: Small Positive Carry Vs. Benchmark
Overall Portfolio Yield: Small Positive Carry Vs. Benchmark
Scenario Analysis & Return Forecasts After making the shifts to our model bond portfolio allocations in the US and EM, we now turn to scenario analysis to determine the return expectations for the portfolio for the next six months. On the credit side of the portfolio, we use risk-factor-based regression models to forecast future yield changes for global spread product sectors as a function of four major factors - the VIX, oil prices, the US dollar and the fed funds rate (Table 2A). For the government bond side of the portfolio, we avoid using regression models and instead use a yield-beta driven framework, taking forecasts for changes in US Treasury yields and translating those in changes in non-US bond yields by applying a historical yield beta (Table 2B). For our scenario analysis over the next six months, we use a base case scenario plus two alternate “tail risk” scenarios. We see global growth momentum and the Fed monetary policy outlook as the two most important factors for fixed income markets in the second half of 2021, thus our scenarios are defined along those lines. Table 2AFactor Regressions Used To Estimate Spread Product Yield Changes
GFIS Model Bond Portfolio Q2/2021 Performance Review & Current Allocations: Hitting A Few Roadblocks
GFIS Model Bond Portfolio Q2/2021 Performance Review & Current Allocations: Hitting A Few Roadblocks
Table 2BEstimated Government Bond Yield Betas To US Treasuries
GFIS Model Bond Portfolio Q2/2021 Performance Review & Current Allocations: Hitting A Few Roadblocks
GFIS Model Bond Portfolio Q2/2021 Performance Review & Current Allocations: Hitting A Few Roadblocks
Base Case Global growth stays above-trend in both Q3 and Q4, putting downward pressure on unemployment rates and keeping realized inflation elevated. Ongoing global vaccinations lead to more of the global economy fully reopening, with the Delta variant not having serious widespread impact on economic confidence outside of parts of the emerging world. Excess savings built up during the pandemic are run down by both consumers and businesses as optimism stays ebullient within the developed economies. China credit tightening slows growth enough to cool off upward commodity price momentum. At the same time, falling US unemployment and surprisingly “sticky” domestic US realized inflation embolden the Fed to signal a move to begin tapering its bond purchases starting in January 2022. Real bond yields globally bottom out, while inflation expectations recover some of the pullback seen in Q2/2021. The entire US Treasury curve shifts higher, led by the 10-year reaching 1.65% and a modest bear-flattening of the 5-year/30-year curve. The VIX stays near 15, the US dollar rises +3%, the Brent oil price goes nowhere and the fed funds rate is unchanged at 0% Upside Growth Surprise The Delta variant proves to be far less deadly than feared. A rapid pace of global vaccinations leads to booming growth led by the US but including a fully reopened euro area. Chinese policymakers begin to reverse some of the H1/2021 credit tightening. Unemployment rates rapidly fall worldwide, while supply bottlenecks persist, keeping upward pressure on realized inflation. Markets pull forward the timing and pace of future central bank interest rate hikes, most notably in the US when the Fed begins tapering bond purchases sooner than expected before year-end. Real bond yields drift higher globally, but inflation breakevens stay elevated with the earlier surge in realized inflation proving not to be “transitory”. The US Treasury curve modestly bear-flattens, with the 10-year reaching 1.9% and the 5-year/30-year spread narrowing by 25bps. The VIX rises to 25 as risk assets struggle in response to rising bond yields even with faster growth. The US dollar falls -5% on the back of improving global growth expectations, the Brent oil price climbs +5% and the fed funds rate stays unchanged. Downside Growth Surprise The global economy gets hit on multiple fronts: the rapid spread of the Delta variant overwhelms the positive momentum on vaccinations, most notably in EM countries; Europe struggles to fully reopen; China policy tightening results in a larger-than-expected drag on global growth; and US households are reluctant to draw down on excess savings after government income support measures expire in September. Diminished economic optimism leads to a pullback in global equity values, lower government bond yields and wider global credit spreads. The US Treasury curve bull flattens as longer-maturity yields fall in a risk-off move, with the 10-year yield moving back down to 1.25% alongside lower inflation breakevens. The VIX rises to 30, the safe-haven US dollar rises +5%, the Brent oil price falls -10% and the fed funds rate stays at 0%. Chart 19Risk Factor Assumptions For The Scenario Analysis
Risk Factor Assumptions For The Scenario Analysis
Risk Factor Assumptions For The Scenario Analysis
Chart 20US Treasury Yield Assumptions For The Scenario Analysis
US Treasury Yield Assumptions For The Scenario Analysis
US Treasury Yield Assumptions For The Scenario Analysis
The inputs into the scenario analysis are shown in Chart 19 (for the USD, VIX, oil and the fed funds rate), while the US Treasury yield scenarios are in Chart 20. The excess return scenarios for the model bond portfolio, using the above inputs in our simple quantitative return forecast framework, are shown in Table 3A (the scenarios for the changes in US Treasury yields are shown in Table 3B). Table 3AGFIS Model Bond Portfolio Scenario Analysis For The Next Six Months
GFIS Model Bond Portfolio Q2/2021 Performance Review & Current Allocations: Hitting A Few Roadblocks
GFIS Model Bond Portfolio Q2/2021 Performance Review & Current Allocations: Hitting A Few Roadblocks
Table 3BUS Treasury Yield Assumptions For The 6-Month Forward Scenario Analysis
GFIS Model Bond Portfolio Q2/2021 Performance Review & Current Allocations: Hitting A Few Roadblocks
GFIS Model Bond Portfolio Q2/2021 Performance Review & Current Allocations: Hitting A Few Roadblocks
The model bond portfolio is expected to deliver a positive excess return over the next six months of +46bps in the base case scenario and +28bps in the optimistic growth scenario, but is projected to underperform by -36bps in the pessimistic growth scenario. Bottom Line: We are maintaining an overall below-benchmark portfolio duration stance, against a backdrop of persistent above-trend global growth and a highly stimulative fiscal/monetary policy mix. We are maintaining a moderate overweight to global spread product versus government debt, concentrated on an overweight to US high-yield where valuations look the least stretched. We are making two changes to the portfolio allocations heading into Q3: shifting the Treasury curve exposure to have more of a flattening bias, while downgrading EM USD-denominated corporates to neutral. Robert Robis, CFA Chief Fixed Income Strategist rrobis@bcaresearch.com Ray Park, CFA Research Analyst ray@bcaresearch.com Footnotes 1 The GFIS model bond portfolio custom benchmark index is the Bloomberg Barclays Global Aggregate Index, but with allocations to global high-yield corporate debt replacing very high-quality spread product (i.e. AA-rated). We believe this to be more indicative of the typical internal benchmark used by global multi-sector fixed income managers. Recommendations The GFIS Recommended Portfolio Vs. The Custom Benchmark Index
GFIS Model Bond Portfolio Q2/2021 Performance Review & Current Allocations: Hitting A Few Roadblocks
GFIS Model Bond Portfolio Q2/2021 Performance Review & Current Allocations: Hitting A Few Roadblocks
Duration Regional Allocation Spread Product Tactical Trades Yields & Returns Global Bond Yields Historical Returns
Highlights Economy – The endpoint of easier-for-longer monetary policy may be coming into view: Elevated inflation readings and discomfort among more hawkish FOMC members may signal that a monetary policy inflection is on the way. Markets – Volatility should pick up as investors reprice financial assets to reflect the end of emergency accommodation: The rumblings in bond, currency and precious metals markets that followed the June FOMC meeting are likely to spread as investors pull their liftoff date expectations forward. Strategy – Maintain below-benchmark duration positioning and ensure that portfolios can withstand increased volatility: Don’t be lulled to sleep by the 10-year Treasury yield’s backing and filling or by the VIX’s foray into the low teens. It is a more auspicious time to be buying insurance than selling it. Feature After fourteen years, investors may be weary of focusing so much attention on the Fed, but there’s been no avoiding its impact since the global financial crisis (GFC) emerged. Zero interest rate policy (ZIRP), large-scale asset purchases and other emergency measures have exerted a strong pull on financial markets as they have been switched on and off. The extended turn of rushing to the rescue appears to be weighing on the Fed as well. Last August’s revisions to its Statement on Longer-Run Goals and Monetary Policy Strategy explicitly acknowledged the challenges of operating in a ZIRP world in which its ability to deploy its primary tool for countering economic weakness – cutting the fed funds rate – is constrained by the zero lower bound. The Fed responded by adjusting its approach to each element of its dual mandate. It adopted an average-inflation-targeting framework that seeks to remediate past inflation shortfalls and indicated that it would only intervene to mitigate shortfalls from its maximum employment estimate. The latter move marked a break with the previous four decades, when the Fed, unwilling to give inflation pressures a chance to take root, proactively tightened policy when it judged that the labor market might be getting too strong. Taken together, the changes amounted to a significant break from doing whatever it took to keep inflation from gaining a foothold to making sure it didn’t completely vanish from households’, businesses’ and investors’ consciousness. If the changes were implemented as outlined, the effects could be wide-ranging. Inflation would be able to gain more traction, all else equal, leading to higher bond yields as markets anticipated that a higher terminal fed funds rate would be required to bring it to heel. A higher terminal fed funds rate might lead to a deeper economic slowdown, ushering in lower bond yields than otherwise would have prevailed. By inducing higher highs and lower lows in Treasury yields, the revisions to the Fed’s framework could promote increased financial market volatility, depending on FOMC members’ ongoing commitment to them and the way that commitment interacted with investors’ expectations. Although the revised framework is eleven months old, it is freshly relevant as the interaction between its implementation and investors’ expectations may be approaching an inflection point. When the FOMC announced the framework revisions last August, it didn’t have any immediate monetary policy implications and investors and committee members could reasonably have figured they would cross the new-framework bridge when they came to it. Elevated inflation readings and some differences in views within the FOMC suggest the bridge might now have to be crossed soon enough to fit within most institutional investors’ time horizons. Volatility may well rise as markets attempt to reprice assets against the backdrop of a novel monetary policy approach. End Of An Era The aforementioned changes that the FOMC made to its monetary policy strategy represented a watershed moment for US monetary policy. Beginning with Paul Volcker’s tenure as Fed chair near the end of the high-inflation ‘70s, the Fed has kept a sharp lookout for inflation pressures (Chart 1). Though it only introduced an annual inflation target in the aftermath of the GFC, its one-way view of inflation was well established. Signs that it might be emerging could be grounds for tighter monetary conditions while dormant readings were nothing to worry about. Chart 1Upholding Volcker's Mantle
Upholding Volcker's Mantle
Upholding Volcker's Mantle
The average inflation target indicates that inflation shortfalls will henceforth be as much of a concern as inflation overshoots and the Fed will attempt to remediate them with an eye towards keeping inflation expectations from slipping below 2%. On the other hand, the new framework shifts from a two-way to a one-way perspective on employment. Where the committee had previously attempted to conduct policy in a way that mitigated any deviations from its maximum-employment assessment, the new framework seeks only to mitigate shortfalls. Citing the post-crisis experience, when inflation remained in check despite a half-century low in the unemployment rate, and a desire to see expansion gains spread more widely across households, Chair Powell has repeatedly emphasized that too much employment is not a concern. Easier Said Than Done When the Fed announced the changes to its approach, we noted that they would be significant for investors provided it were to follow through on them. It is one thing to promise wide-reaching changes in the indefinite future but quite another to execute them in real time under duress. Financial markets seemed to be aware that turning on a dime would be easier said than done and did not bother to adjust their fed funds rate expectations (Chart 2) or reprice assets that might be most affected by the new policy framework. Among investors with a time frame of a year or less, the talk was all theoretical, anyway – of course policy was going to remain extremely easy when the US and the rest of the world were still knee-deep in a once-in-a-century pandemic and the development of an effective vaccine was a ways off. Chart 2Until Recently, Markets Saw Little Chance Of Rate Hikes On A Two-Year Horizon
Until Recently, Markets Saw Little Chance Of Rate Hikes On A Two-Year Horizon
Until Recently, Markets Saw Little Chance Of Rate Hikes On A Two-Year Horizon
In other words, talk was cheap when the FOMC unveiled its new framework. Its plans would only matter once the pandemic’s grip eased and central banks regained some discretion. The committee’s resolve to adhere to the new framework would only be tested in the face of uncomfortably high inflation prints and/or inflation expectations that threatened to anchor at levels above its target range. Investors wouldn’t bother to reprice financial assets in line with the new framework until they were certain it would apply. Inoculating Against Deflation As it turned out, effective vaccines appeared on the horizon sooner than anticipated. Pfizer and BioNTech announced the enormously encouraging results from their vaccine’s Phase III trials before the New York open on November 9th, and the Moderna vaccine’s similar clinical successes followed shortly thereafter. Vaccine distribution would begin in January, and the long end of the Treasury curve would begin to reprice, nudged along by rising inflation expectations. Agita sparked by March CPI data caused expectations to peak ahead of the April release, and 10-year breakevens briefly edged above the levels consistent with the Fed’s goals (Chart 3, top panel). Chart 3Coloring Within The Lines
Coloring Within The Lines
Coloring Within The Lines
Chart 4Unsustainable Outliers
Unsustainable Outliers
Unsustainable Outliers
We share the view of most mainstream economists that the upside surprises in the March and April inflation prints resulted from transitory reopening factors and do not mark an inflection point. Increases in used car prices will slow once rental car companies rebuild their fleets to match burgeoning demand and new car production can resume at its intended pace, lumber prices will continue to ease as sawmills ramp up operations to capture outsized profits, and the pace of increases in airfares will settle down once staffing bottlenecks can be resolved and more flights can be added to meet resurgent demand (Chart 4). Easier For How Much Longer? Markets’ collective shrug upon the release of the revisions to the Fed’s monetary policy framework reflected the view that they did not amount to a meaningful change over most investors’ time horizons. The second wave of COVID-19 infections had peaked a month before, but at least one other was likely in store as students returned to college campuses, and a vaccine was not yet on the horizon. According to Good Judgment’s professional superforecasters, there was roughly an equal 40% probability that 25 million vaccine doses would be available for distribution in the US between October 1st, 2020 and March 31st, 2021 or between April 1st and September 30th, 2021 (Chart 5). The more optimistic estimate turned out to be right, albeit not quite optimistic enough: nearly 25 million doses were administered by the end of February and nearly 50 million by the March 31/April 1 midpoint of the two periods (Chart 6). Chart 5Vaccine Development And Distribution Wound Up Beating August's Expectations ...
Transitioning Away From Auto-Pilot
Transitioning Away From Auto-Pilot
Chart 6... By A Considerable Margin
... By A Considerable Margin
... By A Considerable Margin
The vaccine outlook was relevant because it was hard to envision any incremental tightening of monetary policy while the country was still in the throes of the pandemic. Treasury yields at the longer end of the curve weren’t likely to go anywhere in the absence of increases in the fed funds rate (Chart 7) or increases in inflation or real growth expectations. Just as a still-raging virus was likely to keep the FOMC from hiking rates, it would also put a lid on inflation pressures and economic growth. With economic activity sharply limited by social distancing mandates and individuals’ innate reluctance to risk exposure, it was certain that capacity would continue to surpass aggregate demand. Chart 7Treasury Yields Move With Fed Funds Expectations
Treasury Yields Move With Fed Funds Expectations
Treasury Yields Move With Fed Funds Expectations
To the extent investors thought about the FOMC’s new framework when it was unveiled, they seem to have taken it as confirmation that monetary policy would remain easier for longer, consistent with the theme that has prevailed since the Bernanke Fed led the charge to counter the GFC. Treasury yields were subdued even after the vaccine news broke in November (Chart 8, top panel), and with the interest rate structure remaining quiet, there was no major repricing in other rate-sensitive markets. Gold, which might have been expected to benefit from more accommodative policy, slipped nearly 15%, from the mid-$1,900s to the high $1,600s, between the release of the new framework and its March trough. After retracing half of its post-August decline, it shed a fresh 5% following the FOMC’s June meeting (Chart 8, second panel). Chart 8Growth Prospects, Not Fed Prospects
Growth Prospects, Not Fed Prospects
Growth Prospects, Not Fed Prospects
Commodity currencies had added 10% versus the US dollar before ceding half of those gains in the wake of the June FOMC meeting, but their rally appears to have been driven by the increased global growth expectations that followed the positive vaccine news as they went nowhere in September and October (Chart 8, third panel). Similarly, the DXY Index had taken its post-revision cue from global growth prospects, moving inversely with pandemic news (rising when bad, falling when good), before rallying after the June meeting (Chart 8, bottom panel). The rise in measured inflation has encouraged some committee members to bring forward their anticipated liftoff dates and accelerate their individual dot plots, as disclosed last month. Now that the Fed no longer seems to be of one mind on the easier-for-longer path, investors have begun to reassess the scene. Prices are moving as capital reportedly exits pro-inflation positions and the money markets now call for two-and-a-half rate hikes by mid-2023 (Chart 2). More volatility could be in store amidst a shift in the Fed consensus as markets pull forward or push back their expected liftoff date and the expected pace of hikes speeds up or slows down. Investment Implications With the moves in measured inflation and inflation expectations seeming to have met the FOMC’s first two criteria for hiking rates (Table 1), a return to full employment looms as the final hurdle to liftoff. We reiterate our view that hiring progress is the swing factor that investors should be watching to anticipate the coming shift in monetary policy settings. Net payrolls expanded by 850,000 in June, topping estimates and putting the three-month moving average, 567,000, ahead of the 375-485,000 pace required to return the economy to full employment by the second half of 2022.1 That may sound like an overly ambitious target on its face, but we contend that annualized monthly payroll expansion of 4% for fourteen months or 3.1% for eighteen months is attainable given the magnitude of the pandemic job losses (Chart 9). Table 1A Checklist For Liftoff
Transitioning Away From Auto-Pilot
Transitioning Away From Auto-Pilot
Chart 9A 2H22 Return To Full Employment Is Entirely Possible
A 2H22 Return To Full Employment Is Entirely Possible
A 2H22 Return To Full Employment Is Entirely Possible
Our outlook for sustained net payroll expansion remains near the optimistic end of the expectations continuum, though the money market consensus has lately caught up with our sometime-before-the-end-of-2022 liftoff date view (Chart 10). Given that we expect that the yield curve will steepen as the hiring strength shows itself, we advise maintaining below-benchmark duration in Treasury portfolios. The optimism embedded in our hiring view implies robust growth over the next twelve months and we therefore recommend overweighting spread product within fixed income portfolios via a high-yield overweight, and overweighting equities within multi-asset portfolios. Hot growth will eventually induce the Fed to start pumping the monetary brakes, slowing the economy and investment returns, but the twelve-month outlook remains favorable for risk assets. Chart 10Looking For At Least One Hike By The End Of 2022
Looking For At Least One Hike By The End Of 2022
Looking For At Least One Hike By The End Of 2022
Doug Peta, CFA Chief US Investment Strategist dougp@bcaresearch.com Footnotes 1 Making the simplifying (and overly conservative) assumption that returning to full employment will require recovering February 2020’s level of nonfarm payrolls, the US is currently short 6.8 million jobs. Regaining those jobs by August 2022 (14 months from now) will require a monthly average of 485,000 net job gains; regaining them by December 2022 (18 months hence) will require a 375,000 monthly average.
Highlights Gold is – and always will be – exquisitely sensitive to Fed policy and forward guidance, as last month's "Dot Shock" showed (Chart of the Week). Its price will continue to twitch – sometimes violently – as the widening dispersion of views evident in the Fed dots keeps markets on edge and pushes forward rate expectations in different directions. Fed policy is important but will remain secondary to fundamentals in oil markets. Increasingly inelastic supply will force refiners to draw down inventories, which will keep forward curves backwardated. OPEC 2.0's production-management policy is the key driver here, followed closely by shale-oil's capital discipline. Between these market bookends are base metals, which will remain sensitive to Fed policy, but increasingly will be more responsive to tightening supply-demand fundamentals, as the pace of the global renewables and EV buildout challenges supply. The one thing these markets will share going forward is increasing volatility. Gold volatility will remain elevated as markets are forced to parse sometimes-cacophonous Fed forward guidance; oil volatility will increase with steeper backwardation; and base metals volatility will rise as fundamentals continue to tighten. We remain long commodity-index exposure (S&P GSCI and COMT ETF) and equity exposure (PICK ETF). Feature Gold markets still are processing last month's "Dot Shock" – occasioned by the mid-June move of three more Fed bankers' dots into the raise-rates-in-2022 camp at the Fed – and the sometimes-cacophonous forward guidance of post-FOMC meetings accompanying these projections. Following last month's meeting, seven of the 18 central bankers at the June meeting now favor an earlier rate hike. This dot dispersion fuels policy uncertainty. When policy uncertainty is stoked, demand for the USD typically rises, which generally – but not always – contributes to liquidation of dollar-sensitive positions in assets like commodities. This typically leads to higher price volatility.1 This is most apparent in gold, which is and always will be exquisitely sensitive to Fed guidance and the slightest hint of a change in course (or momentum building internally for such a change). This is what markets got immediately after the June meeting. When this guidance reflects a wide dispersion of views inside the Fed, it should come as no surprise that price volatility increases among assets that are most responsive to monetary policy. This dispersion of market expectations – as a matter of course – is intensified by discordant central-bank forward guidance.2 Fundamentals Reduce Oil's Sensitivity To Fed Policy Fed policy will always be important for the evolution of the USD through time, which makes it extremely important for commodities, since the most widely traded commodities are priced in USD. All else equal, an increase in the value of the USD raises the cost of commodities ex-US, and vice versa. Chart of the WeekGold Still Processing Dot Shock
Gold Still Processing Dot Shock
Gold Still Processing Dot Shock
Chart 2Oil Market Remains Tight...
Oil Market Remains Tight...
Oil Market Remains Tight...
The USD's impact is dampened when markets are fundamentally tight – e.g., when the level of demand exceeds supply, as is the case presently for oil (Chart 2).3 When this occurs, refiner inventories have to be drawn down to make up for supply deficits (Chart 3). This leads to a backwardation in the oil forward curves – i.e., prices of prompt-delivery oil are higher than deferred-delivery oil – reflecting the fact that the supply curve is becoming increasingly inelastic (Chart 4). This backwardation benefits OPEC 2.0 member states, as most of them have long-term supply contracts with customers indexed to spot prices, and investors who are long commodity-index exposure, as it is the source of the roll yield for these products.4 Chart 3Forcing Inventories To Draw...
Forcing Inventories To Draw...
Forcing Inventories To Draw...
Chart 4...And Backwardating Forward Curves
...And Backwardating Forward Curves
...And Backwardating Forward Curves
Copper's Sensitivity To Fed Policy Declining Supply-demand fundamentals in base metals – particularly in the bellwether copper market – are tightening, which, as the oil market illustrates, will make prices in these markets less sensitive to USD pressures going forward (Chart 5). We expect the copper forward curve to remain backwardated for an extended period (Chart 6), which will distance the evolution of copper prices from Fed policy variables (e.g., interest rates and the USD). Chart 5Copper USD Sensitivity Will Diminish As Balances Tighten
Copper USD Sensitivity Will Diminish As Balances Tighten
Copper USD Sensitivity Will Diminish As Balances Tighten
Chart 6Expect Persistent Backwardation In Copper
Expect Persistent Backwardation In Copper
Expect Persistent Backwardation In Copper
Indeed, our modeling suggests this already is occurring in the metals markets, as can be seen from the resilience of copper prices during 1H21, when China's fiscal and monetary stimulus was waning and, recently, during the USD's recent rally, which was an unexpected headwind generated by the Fed's June meeting. If, as appears likely, China re-engages in fiscal and monetary stimulus in 2H21, the global demand resurgence for metals, copper in particular, will receive an additional fillip. Like oil, copper inventories will have to be drawn down over the next two years to make up for physical deficits, which have been a persistent problem for years (Chart 7). Capex in copper markets has yet to be incentivized by higher prices, which means these physical deficits likely will widen as the world gears up for expanded renewables generation and the grids required to support them, not to mention higher electric vehicle (EV) demand. If, as we expect, copper miners do not invest in new greenfield mine projects – choosing instead to stay with their brownfield expansion strategies – the market will tighten significantly as the world ramps up its demand for renewable energy. This means copper's supply curve will, like oil's, become increasingly inelastic. At the limit – i.e., if new mining capex is not incentivized – price will be forced to allocate limited supply, and may even have to get to the point of destroying demand to accommodate the renewables buildout. Chart 7Supply-Demand Balance Tightening In Copper
Supply-Demand Balance Tightening In Copper
Supply-Demand Balance Tightening In Copper
A Word On Spec Positioning We revisited our modeling of speculative influence on these markets over the past couple of weeks, in anticipation of the volatility we expect and the almost-certain outcry from public officials that will ensue. Our modeling continues to support our earlier work, which found fundamentals are determinant to the evolution of industrial commodity prices. Using Granger-Causality and econometric analysis, we find prices mostly explain spec positioning in oil and copper, and not the other way around.5 We do find spec positioning – via Working's T Index – to be important to the evolution of volatility in WTI crude oil options, along with other key variables (Chart 8).6 That said, other variables are equally important to this evolution, including the St. Louis Fed's Financial Stress Index, EM equity volatility, VIX volatility and USD volatility. These variables are not useful in modeling copper volatility, where it appears fundamental and financial variables are driving the evolution of prices and, by extension, price volatility. We will continue to research this issue, and will continue to subject our results to repeated trials in an attempt to disprove them, as any researcher would do. Chart 8Oil Volatility Drivers
Oil Volatility Drivers
Oil Volatility Drivers
Investment Implications Gold will remain hostage to Fed policy, but oil and base metals increasingly will be charting a path that is independent of policy-related variables, chiefly the USD. There is no escaping the fact that gold volatility will increasingly be in the thrall of US monetary policy – particularly during the next two years as the Fed attempts to guide markets toward something resembling normalization of that policy.7 However, as the events of the most recent FOMC meeting illustrate, gold price volatility will remain elevated as markets are forced to parse oftentimes-cacophonous Fed forward guidance. This would argue in favor of using low-volatility episodes as buying opportunities in gold options – particularly calls, as we continue to expect gold prices to end the year at $2,000/oz. We also favor silver exposure via calls, expecting price to go to $30/oz this year. In oil and base metals, we continue to expect supply-demand fundamentals in these markets to tighten, which predisposes us to favor commodity index products. For this reason, we remain long commodity-index exposure – specifically the S&P GSCI index, which is up 6.8% since inception, and the COMT ETF, which is up 8.7% since inception. We expect the base metals markets to remain very well bid going forward, and remain long equity exposure in these markets via the PICK ETF, which we re-entered after a trailing stop was elected that left us with a 24% gain since inception at the end of last year. Robert P. Ryan Chief Commodity & Energy Strategist rryan@bcaresearch.com Ashwin Shyam Research Associate Commodity & Energy Strategy ashwin.shyam@bcaresearch.com Commodities Round-Up Energy: Bullish US crude oil stocks (ex SPR) fell 6.7mm barrels in the week ended 25 June 2021, according to the US EIA. Total crude and product stocks were down 4.6mm barrels. Domestic crude oil production was unchanged at 11.1mm b/d over the reporting week. Total refined-product demand surpassed the comparable 2019 reporting period, led by higher distillate consumption (4.2mm b/d vs 3.8mm b/d). Gasoline consumption remains a laggard (9.2mm b/d vs 9.5mm b/d), as does jet fuel (1.4mm b/d vs 1.9mm b/d). Propane and propylene demand surged over the period, likely on the back of petchem demand (993k b/d vs 863k b/d). Base Metals: Bullish Base metals prices are moving higher in anticipation of tariffs being imposed by Russia to discourage exports beyond the Eurasian Economic Union, according to argusmedia.com. In addition to export tariffs on copper, aluminum and nickel, steel exports also will face levies to discourage material from leaving the EAEU (Chart 9). The tariffs are expected to remain in place from August through December 2021. Separately, premiums paid for high-quality iron ore in China (65% Fe) reached record highs earlier this week, as steelmakers scramble for supply, according to reuters.com. The premium iron ore traded close to $36/MT over benchmark material (62% Fe) this week. Precious Metals: Bullish Gold prices continue to move lower following the FOMC meeting on June 16. The yellow metal was down 0.6% y-o-y at $1762.80/oz as of Tuesday’s close after being up a little more than 13% y-o-y before the FOMC meeting earlier this month (Chart 10). We believe the USD rally, which, based on earlier research we have done, could be benefitting from safe-haven demand arising from global concern over the so-called Delta variant of COVID-19, which has spread to at least 85 countries. Public-health officials are fearful this could cause a resurgence in COVID-19 cases and additional mutations in the virus if vaccine distribution in EM states is not increased. Ags/Softs: Neutral Widely disparate weather conditions in the US west and east crop regions – drought vs cooler and wetter weather – appear to be on track to produce average crop yields for corn and beans this year, according to agriculture.com's Successful Farming. In regions where hard red spring wheat is grown, states experiencing low rainfall likely will have poor crops this year. Chart 9
"Dot Shock" Continues To Roil Gold; Oil … Not So Much
"Dot Shock" Continues To Roil Gold; Oil … Not So Much
Chart 10
US Dollar To Keep Gold Prices Well Bid
US Dollar To Keep Gold Prices Well Bid
Footnotes 1 We model gold prices as a function of financial variables sensitive to Fed policy – e.g., real rates and the broad trade-weighted USD – and uncertainty, which is conveyed via the Global Economic Policy Uncertainty (GEPU) index published by Baker, Bloom & Davis. 2 Please see Lustenberger, Thomas and Enzo Rossib (2017), "Does Central Bank Transparency and Communication Affect Financial and Macroeconomic Forecasts?" SNB Working Papers, 12/2017. The Swiss central bank researchers find "… the verdict about the frequency of central bank communication is unambiguous. More communication produces forecast errors and increases their dispersion. … Stated differently, a central bank that speaks with a cacophony of voices may, in effect, have no voice at all. Thus, speaking less may be beneficial for central banks that want to raise predictability and homogeneity among financial and macroeconomic forecasts. We provide some evidence that this may be particularly true for central banks whose transparency level is already high." (p. 26) 3 Please see OPEC 2.0 Vs. The Fed, published on February 8, 2018, for additional discussion. 4 Please see The Case For A Strategic Allocation To Commodities As An Asset Class, a Special Report we published on March 11, 2021 on commodity-index investing. It is available at ces.bcaresearch.com. 5 The one outlier we found was Brent prices, for which non-commercial short positioning does Granger-Cause price. Otherwise, price was found to Granger-Cause spec positioning on the long and short sides of the market. 6 Please see BCA Research's Commodity & Energy Strategy Weekly Report, "Specs Back Up The Truck For Oil," published on April 26, 2018, in which we introduce Holbrook Working's "T Index," a measure of speculative concentration in futures and options markets. It is available at ces.bcaresearch.com. Briefly, Working's T Index shows how much speculative positioning exceeds the net demand for hedging from commercial participants in the market. 7 Please see How To Re-Shape The Yield Curve Without Really Trying published by our US Bond Strategy group on June 22 for a deeper discussion of the outlook for Fed policy. Investment Views and Themes Strategic Recommendations Tactical Trades Commodity Prices and Plays Reference Table Trades Closed in 2021 Summary of Closed Trades
Image