Monetary

Highlights Duration: The coronavirus outbreak will cause our preferred global growth indicators to move lower during the next couple of months. Bond yields will also stay low until the daily number of new cases approaches zero, at which point a sell-off is likely. Monetary Policy: A preemptive rate cut designed to offset the economic impact of the coronavirus is unlikely. In fact, investors should short August 2020 fed funds futures and maintain below-benchmark portfolio duration on the view that the Fed will keep the policy rate stable in 2020. TIPS: Our improved Adaptive Expectations Model suggests that the 10-year TIPS breakeven inflation rate will rise by 19 bps during the next 12 months, bringing it up to 1.84%. Investors should remain overweight TIPS versus nominal Treasuries in US bond portfolios. Recovery Delayed A little more than two months into the year and, despite elevated market volatility, a couple trends have become apparent. First, it is now clear that global economic growth bottomed near the end of last year. Second, any lift that bond yields might have received from that rebound has been more than offset by the spike in uncertainty surrounding the 2019 novel Coronavirus (2019-nCoV) outbreak. Case in point, the US Economic Surprise Index recently jumped deep into positive territory, but the 10-year Treasury yield remains muted, below its level from three months ago (Chart 1). Chart 1Bond Yields Have De-Coupled From The Economic Data
Bond Yields Have De-Coupled From The Economic Data
Bond Yields Have De-Coupled From The Economic Data
It’s not just the Surprise index that is signaling a growth upturn. Our three preferred global growth indicators – the Global Manufacturing PMI, the US ISM Manufacturing PMI and the CRB Raw Industrials index – have all decisively bottomed (Chart 2). Chart 2Global Growth Indicators Hooking Up
Global Growth Indicators Hooking Up
Global Growth Indicators Hooking Up
The Global PMI moved up to 50.4 in January, from a July low of 49.3. As of January, 45% of countries now have PMIs above 50 compared to 34% in August (Chart 2, top panel). The US ISM Manufacturing PMI shot higher in January, from 47.8 to 50.9. It is moving closer to the Services PMI, which remains very healthy at 55.5 (Chart 2, panel 2). The CRB Raw Industrials index is also now well off its 2019 low (Chart 2, bottom panel). The overall message from our three favorite indicators is that economic growth remains sluggish, but is clearly on an improving trend. A trend we would have expected to continue until the 2019-nCoV outbreak hit. Our Global Investment Strategy team estimates that the virus could trim 1.6% from global growth in the first quarter, cutting the IMF’s Q1 global GDP growth projection of 3.3% in half.1 The hit to growth will unwind once the virus’ spread is contained, but it is difficult to know how long that will take. In the meantime, we anticipate some weaker readings from our preferred global growth indicators during the next couple of months. The coronavirus could trim 1.6% from global GDP growth in the first quarter. However, it’s important to note that bond yields have already de-coupled from trends in the global growth data and are now taking their cues from news about 2019-nCoV. We noted in last week’s report that this also happened during the 2003 SARS crisis.2 Bond yields fell initially but then recovered sharply once the number of daily new SARS cases hit zero. If we map this experience to the present day, we see that the number of confirmed 2019-nCoV cases continues to rise, but the daily number of new cases has rolled over (Chart 3). Further, our China Investment Strategy team points out that it might be more market-relevant to focus on cases outside of Hubei province where the virus started, and which has now been quarantined.3 Already, we see that the daily number of new cases outside Hubei province is approaching zero (Chart 3, bottom panel). Chart 3Tracking The Coronavirus
Tracking The Coronavirus
Tracking The Coronavirus
Bottom Line: The coronavirus outbreak will cause our preferred global growth indicators to move lower during the next couple of months. Bond yields will also stay low until the daily number of new cases approaches zero, at which point a bond sell-off is likely. Will The Fed Respond? Chart 4Go Short August 2020 Fed Funds Futures
Go Short August 2020 Fed Funds Futures
Go Short August 2020 Fed Funds Futures
Markets have already moved to price-in a Federal Reserve reaction to the 2019-nCoV outbreak. Our 12-month Fed Funds Discounter is down to -43 bps, meaning that the overnight index swap curve is priced for 43 bps of rate cuts during the next year (Chart 4). Last Monday our Discounter hit -51 bps, meaning that the market was looking for slightly more than 2 rate cuts during the next year. Turning to the fed funds futures market, we also see that investors are pricing-in significant odds of a rate cut between now and the end of the summer (Chart 4, bottom 2 panels). Odds of a March rate cut are low, but the futures market is priced for a 30% chance of a rate cut between now and the end of the April FOMC meeting. Investors also see 52% chance of a rate cut between now and the end of the June FOMC meeting and 72% chance of a cut between now and the end of the July meeting. But will the Fed actually respond to the nCoV outbreak by easing policy? Other central banks have taken different approaches to that question during the past week. The Reserve Bank of Australia left its policy rate unchanged on Tuesday, noting that “it is too early to determine how long-lasting the impact [from the coronavirus] will be.” In contrast, the Bank of Thailand did cut rates last week while citing the nCoV outbreak as one of several reasons for the move. The market is priced for 72% chance of a rate cut between now and August. But perhaps the most interesting example is last week’s rate cut in the Philippines. There, the central bank cited “a firm outlook for the domestic economy”, but ultimately concluded that the “manageable inflation environment allowed room for a preemptive reduction in the policy rate.” Chart 5A High Bar For Rate Cuts
A High Bar For Rate Cuts
A High Bar For Rate Cuts
If the Fed were to justify a rate cut in the coming months, it would have to use a similar logic as the Philippines. Something along the lines of: The domestic US economy is solid, but inflation is low enough that an additional rate cut carries little risk. A proactive rate cut could also help lean against any potential headwinds from the coronavirus. Our sense is that the Fed will not be eager to make that argument, and that things will have to get a lot worse before a rate cut is considered. The Fed was well aware that the US/China trade war could have negative economic effects in 2019, but it didn’t cut rates until after the S&P 500 dropped by 20% and the yield curve became deeply inverted (Chart 5). We would monitor those same two indicators to assess the odds of a rate cut this year. So far, neither suggests that a cut is forthcoming. Investors should consider shorting the August 2020 fed funds futures contract. If the economic fall-out from 2019-nCoV only lasts for a few months, then the Fed will stand pat through July and the August contract will earn an un-levered 18 bps between now and the end of August. Our Golden Rule of Bond Investing also dictates that below-benchmark portfolio duration positioning will profit if the Fed delivers less than the 43 bps of rate cuts that are currently priced for the next 12 months. Towards A Better Breakeven Model At BCA we track long-maturity TIPS breakeven inflation rates very closely. Not only because TIPS are an interesting investment vehicle in their own right, but also because elevated long-maturity TIPS breakevens (above 2.3%) will be an important trigger for us to recommend a more defensive US bond portfolio – favoring Treasuries over spread product.4 For those reasons, it’s extremely important for us to have a framework for forecasting long-maturity TIPS breakeven inflation rates. A little more than one year ago, we unveiled a framework for thinking about TIPS breakevens based on the concept of adaptive expectations.5 We also applied that framework to a fair value model for the 10-year TIPS breakeven inflation rate. We still think that the adaptive expectations framework is the best way to think about breakevens, but this week we present an improved application of that framework, i.e. a new model for forecasting the 10-year TIPS breakeven inflation rate. Adaptive Expectations The theory of adaptive expectations essentially says that today’s long-run inflation expectations are formed based on peoples’ recent experiences with inflation. For example, the 10-year TIPS breakeven inflation rate is currently 1.67%, well below the 2.3%-2.5% range that we view as consistent with the Fed’s target. We posit that today’s inflation expectations are depressed because realized inflation has been so low during the past decade (CPI inflation has averaged only 1.75% during the past 10 years). This experience makes it very difficult for investors to believe that inflation might be high (say, above 2%) during the next decade. Building A Better Model To apply the adaptive expectations theory to a specific model, we need to make a decision about which specific inflation measures to use. For this week’s report, we tested annualized rates of change of headline CPI ranging from 1 year to 10 years. We also looked at survey measures of long-run inflation expectations from the Survey of Professional Forecasters and the University of Michigan. The 10-year TIPS breakeven inflation rate is 50 bps below 1-year headline CPI inflation. To test the different measures, we looked at the difference between the 10-year TIPS breakeven inflation rate and each inflation measure. We then looked at how successfully each difference predicted changes in the 10-year TIPS breakeven inflation rate during the subsequent 12 months. We identified the following three measures as the best performers (Charts 6A & 6B): Chart 6A10-Year TIPS Breakeven Versus Fair Value
10-Year TIPS Breakeven Versus Fair Value
10-Year TIPS Breakeven Versus Fair Value
Chart 6BDeviation From Fair Value
Deviation From Fair Value
Deviation From Fair Value
The 1-year rate of change in headline CPI The 6-year rate of change in headline CPI Median 10-year inflation expectations from the Survey of Professional Forecasters Table 1 shows the results of our test on 1-year headline CPI inflation. It shows that, historically, when the 10-year TIPS breakeven inflation rate has been more than 25 bps above the 1-year rate of change in headline CPI it has tended to fall during the next 12 months. At present, the 10-year breakeven is about 50 bps below the 1-year rate of change in headline CPI. Table 1Deviation Of 10-Year TIPS Breakeven Inflation Rate From 1-Year Rate Of Change In Headline CPI
How Are Inflation Expectations Adapting?
How Are Inflation Expectations Adapting?
Table 2 shows the results of our test on 6-year headline CPI inflation. Here, we see that the 10-year TIPS breakeven inflation rate becomes much more likely to fall when it exceeds 6-year CPI inflation by more than 10 bps. The current deviation is +14 bps. Table 2Deviation Of 10-Year TIPS Breakeven Inflation Rate From 6-Year Annualized Rate Of Change In Headline CPI
How Are Inflation Expectations Adapting?
How Are Inflation Expectations Adapting?
Finally, Table 3 shows the results of our test on median 10-year inflation expectations from the Survey of Professional Forecasters. In this case, the 10-year breakeven rate has rarely exceeded the survey measure historically. But we find evidence that the breakeven is much more likely to rise when it is more than 50 bps below the survey measure. Currently, the 10-year TIPS breakeven inflation rate is 56 bps below the survey measure. Table 3Deviation Of 10-Year TIPS Breakeven Inflation Rate From SPF* 10-Year Median Inflation Forecast
How Are Inflation Expectations Adapting?
How Are Inflation Expectations Adapting?
Making A Prediction Chart 7Our New Adaptive Expectations Model
Our New Adaptive Expectations Model
Our New Adaptive Expectations Model
The final step is to combine our three chosen factors into a model that will predict the future 12-month change in the 10-year TIPS breakeven inflation rate. This model is presented in Chart 7, and it tells us that, based on the current deviation of the 10-year TIPS breakeven inflation rate from our three different inflation measures, the 10-year breakeven should rise by 19 bps during the next 12 months. This would bring the rate up to 1.84% (Chart 7, bottom panel). We will continue to experiment with different inflation measures in the coming weeks (i.e. core and trimmed mean measures) in an effort to improve our model further. Bottom Line: Our improved Adaptive Expectations Model suggests that the 10-year TIPS breakeven inflation rate will rise by 19 bps during the next 12 months, bringing it up to 1.84%. Investors should remain overweight TIPS versus nominal Treasuries in US bond portfolios. Ryan Swift US Bond Strategist rswift@bcaresearch.com Footnotes 1 Please see Global Investment Strategy Weekly Report, “From China To Iowa”, dated February 7, 2020, available at gis.bcaresearch.com 2 Please see US Bond Strategy Portfolio Allocation Summary, “Contagion”, dated February 4, 2020, available at usbs.bcaresearch.com 3 Please see China Investment Strategy Weekly Report, “Recovery, Temporarily Interrupted”, dated February 5, 2020, available at cis.bcaresearch.com 4 For more details on why TIPS breakeven inflation rates are an important trigger for our spread product allocation please see US Bond Strategy Special Report, “2020 Key Views: US Fixed Income”, dated December 10, 2019, available at usbs.bcaresearch.com 5 Please see US Bond Strategy Weekly Report, “Adaptive Expectations In The TIPS Market”, dated November 20, 2018, available at usbs.bcaresearch.com Fixed Income Sector Performance Recommended Portfolio Specification
Highlights Malaysian businesses and households have been deleveraging and the economy risks entering a debt deflation spiral. This macro-backdrop is bond bullish. EM fixed income-dedicated investors should keep an overweight position in both local currency and US dollar government bonds. In Peru, the central bank does not want its currency to depreciate rapidly; it will therefore defend the sol at the cost of slower economic growth. The outperformance of the Peruvian sol heralds an overweight stance in domestic and US dollar government bonds versus EM peers. Malaysia: In Deleveraging Mode Malaysian businesses and households have been deleveraging. The top panel of Chart I-1 illustrates that commercial banks’ domestic claims on the private sector – both companies and households – relative to nominal GDP have been flat to down in recent years. This measure is produced by the central bank and includes both bank loans as well as securities held by banks (Chart I-1, bottom panel). It does not include borrowing from non-banks or external borrowing. Other measures of indebtedness from the Bank of International Settlements (BIS) – which includes non-bank credit as well as foreign currency borrowing – portend similar dynamics: Household and corporate debt seem to have topped out as a share of GDP (Chart I-2). Chart I-1Malaysian Banks' Claims On The Private Sector Have Rolled Over
Malaysian Banks' Claims On The Private Sector Have Rolled Over
Malaysian Banks' Claims On The Private Sector Have Rolled Over
Chart I-2Malaysia's Business And Household Total Leverage Has Peaked
Malaysia's Business And Household Total Leverage Has Peaked
Malaysia's Business And Household Total Leverage Has Peaked
Chart I-3Malaysia: The GDP Deflator Is About To Turn Negative
Malaysia: The GDP Deflator Is About To Turn Negative
Malaysia: The GDP Deflator Is About To Turn Negative
The message is that after years of an unrelenting credit boom, households’ and companies’ appetite for new borrowing has diminished, and at the same time, creditors have become less willing to finance them. At 136% of GDP, the combined total of household and company debt is non-trivial. If deleveraging among debtors intensifies, the economy risks entering a debt deflation spiral. To prevent such an ominous outcome, aggressive central bank rate cuts, sizable fiscal stimulus, some currency devaluation or a combination of all of the above is required. Not only is real growth very sluggish in Malaysia, but deflationary pressures are intensifying. Chart I-3 shows the GDP deflator is flirting with contraction. Moreover, headline and core consumer price inflation are both weak, while trimmed-mean inflation is at 1.1% (Chart I-4). Last year's spike in consumer inflation was due to low base effects from the abolishment of the country’s goods and services tax back in June 2018. Going forward, these base effects will dissipate, making deflation in consumer prices a likely threat. If prices or wages begin deflating, the highly-indebted Malaysian economy will fall into debt deflation. The latter is a phenomenon that occurs when falling level of prices and wages cause the real value of debt to rise. In such a case, demand for credit will plummet and banks could become unwilling to lend. A vicious cycle of further falling prices, income and credit retrenchment could grip the economy. Household and corporate debt seem to have topped out as a share of GDP. Nominal GDP growth has already dropped slightly below average lending rates (Chart I-5). When such a phenomenon occurs amid elevated debt levels, it can produce a lethal cocktail – namely, the debt-servicing ability of borrowers deteriorates, causing both demand for credit to evaporate and non-performing loans (NPLs) to rise. Chart I-4Malaysia: Consumer Price Inflation Is Very Low
Malaysia: Consumer Price Inflation Is Very Low
Malaysia: Consumer Price Inflation Is Very Low
Chart I-5Malaysia: Nominal GDP Growth Dipped Below Lending Rates
Malaysia: Nominal GDP Growth Dipped Below Lending Rates
Malaysia: Nominal GDP Growth Dipped Below Lending Rates
Critically, falling inflation has caused real borrowing costs to rise. Lending rates in real terms are elevated, from a historical perspective (Chart I-6, top panel).1 Not surprisingly, loan growth has been decelerating sharply, posting a 13-year low (Chart I-6, bottom panel). Even though government expenditure growth has been accelerating over the past year or so and the central bank has cut interest rates twice in the past 8 months, economic conditions remain extremely feeble: Consumer spending has been teetering. Chart I-7 shows that retail sales are dwindling in nominal terms and have plummeted in volume terms. Chart I-6Malaysia: Real Lending Rates Have Risen & Credit Has Slowed
Malaysia: Real Lending Rates Have Risen & Credit Has Slowed
Malaysia: Real Lending Rates Have Risen & Credit Has Slowed
Chart I-7Malaysia: Consumer Spending Is Teetering
Malaysia: Consumer Spending Is Teetering
Malaysia: Consumer Spending Is Teetering
Malaysian exports – which account for a 67% share of the economy – are still contracting 2.5% from a year ago, adding an additional unwelcome layer of deflation to the Malaysian economy. After years of travails, the property sector is not yet out of the woods. Residential property unit sales remain sluggish (Chart I-8, top panel). In turn, the number of unsold residential properties remains elevated and residential construction approvals are rolling over at lower levels (Chart I-8, second & third panels). As a result, residential property prices are beginning to deflate across various segments in nominal terms (Chart I-8, bottom panel). Listed companies’ earnings-per-share (EPS) in local currency terms are contracting (Chart I-9, top panel). Chart I-8Malaysia's Residential Property Market Is Struggling
Malaysia's Residential Property Market Is Struggling
Malaysia's Residential Property Market Is Struggling
Chart I-9Malaysia: Capital Spending Is Contracting
Malaysia: Capital Spending Is Contracting
Malaysia: Capital Spending Is Contracting
Chart I-10Malaysia: Weak Employment Outlook
Malaysia: Weak Employment Outlook
Malaysia: Weak Employment Outlook
All of these ominous trends have induced Malaysian businesses to cut capital spending. The bottom three panels of Chart I-9 illustrate that real gross capital goods formation, capital goods imports and commercial vehicles units sales are all contracting. Equally important, the business sector slowdown is weighing on the employment outlook (Chart I-10). This will trigger a negative feedback loop of falling household income and spending. Bottom Line: Only by bringing borrowing costs down considerably for households and businesses and introducing large fiscal stimulus measures, can the Malaysian authorities prevent the economy from slipping into a vicious debt deflation spiral. On the fiscal front, the Malaysian government is committed to reducing its overall fiscal deficit from 3.4% to 3.2% of GDP this year, further consolidating it to 2.8% of GDP by 2021. Importantly, the government is also adamant about lowering its total public debt-to-GDP ratio from 77% to below 50% in the medium term by ridding itself of the outstanding legacy liabilities and guarantees incurred by the previous government. This leaves monetary policy and some currency depreciation as the likely levers to reflate the economy. Investment Recommendations We continue to recommend EM fixed -income dedicated investors keep an overweight position in local currency bonds within an EM local currency bonds portfolio. Malaysia’s macro-backdrop is bond bullish, and the central bank will cut its policy rate further. Consumer spending has been teetering. Consistent with further rate cut expectations, we also recommend continuing to receive 2-year swap rates. We initiated this trade on October 31, 2019, and it has so far produced a profit of 29 basis points. Furthermore, fiscal discipline and the government’s resolve to reduce public debt and government liabilities as a share of GDP will help Malaysian sovereign credit – US dollar-denominated government bonds – outperform their EM peers. Chart I-11The Malaysian Ringgit Is Cheap
The Malaysian Ringgit Is Cheap
The Malaysian Ringgit Is Cheap
We recommend keeping a neutral allocation to Malaysian equities within an EM equity dedicated portfolio. In terms of the outlook for the currency, ongoing deflationary pressures are bearish for the MYR in the short-term. The basis is that the Malaysian economy needs a cheaper ringgit in order to help reflate the economy and boost exports. However, the Malaysian currency will sell off less than other EM currencies: First, foreign ownership of local bonds has declined from 36% in 2016-17 to 23% today. Likewise, foreign equity portfolios own about 31% of the stock market, which is less than in many other EMs. This has occurred because foreigners have been major net sellers of Malaysian equities. Overall, low foreign ownership of Malaysian financial assets reduces the risk of sudden portfolio outflows in case EM investors pull out en masse. Second, the current account balance is in surplus and will provide support for the Malaysian ringgit. Malaysia has become less reliant on commodities exports and more of a semiconductor exporter. We are less negative on the latter sector than on resources prices. Third, the currency is cheap, according to the real effective exchange rate, making further downside limited (Chart I-11). Finally, the ongoing purge in the Malaysian economy – deleveraging and deflation – is ultimately long-term bullish for the currency. Deflation brings down the cost structure of the economy and precludes the need for chronic currency depreciation in order to keep the economy competitive. All things considered, the risk-reward profile for shorting the MYR is no longer appealing. We are therefore closing this trade as of today. It has produced a 4% loss since its initiation on July 20, 2016. Ayman Kawtharani Editor/Strategist ayman@bcaresearch.com Peru: A Pending Policy Dilemma Investors in Peruvian financial markets are presently facing three challenging macro issues: Will the currency appreciate or depreciate? If it depreciates, will the central bank cut or hike interest rates? If policy rates drop or rise, will bank stocks rally or sell off? Chart II-1Peru: Slow Money Growth Heralds Lower Inflation
Peru: Slow Money Growth Heralds Lower Inflation
Peru: Slow Money Growth Heralds Lower Inflation
Looking forward, the central bank (also known as the BCRP) is facing a dilemma. On one hand, inflation is low and will likely drop toward the lower end of the central bank’s target band, as portrayed by narrow money (M1) growth (Chart II-1). Weak domestic demand and low and falling inflation – combined – justify additional rate cuts. On the other hand, the Peruvian currency – like most EM currencies – will likely depreciate versus the US dollar in the coming months, if our baseline view – that foreign capital will flow out of EM and industrial metals prices will drop further for a few months – transpires. In such a case, will the BCRP cut rates – i.e., will the monetary authorities choose to target the exchange rate, or inflation? If the Peruvian central bank follows its own historical footsteps, it will not cut rates, despite economic weakness and falling inflation. On the contrary, the BCRP will likely prioritize defending the nuevo sol by selling foreign currency reserves, as it has done in the past. This in turn will shrink banking system local currency liquidity and lift interbank rates (Chart II-2). Higher interbank rates will hurt the real economy as well as bank share prices. Chart II-2Peru: Selling BCRP FX Reserves Will Shrink Banking System Liquidity
Peruvian Local Rates Have Risen Peru: Selling BCRP FX Reserves Will Shrink Banking System Liquidity
Peruvian Local Rates Have Risen Peru: Selling BCRP FX Reserves Will Shrink Banking System Liquidity
Is Peru more leveraged to precious or industrial metals? Precious and industrial metals account for 17% and 40% of Peruvian exports, respectively. Hence, falling industrial metals prices will be sufficient to exert meaningful depreciation on the sol, despite high precious metals prices. Foreign investors own about 50% of both Peruvian stocks and local currency bonds. Even if a fraction of these foreign holdings flees, the exchange rate will come under significant downward pressure. Granted that Peru’s central bank does not want its currency to depreciate rapidly, it will defend the currency at the cost of the economy. All in all, the Impossible Trinity thesis is alive and well in Peru: In an economy with an open capital account, the central bank cannot target both interest rates and the exchange rate simultaneously. If the BCRP intends to achieve exchange rate stability, it needs to tolerate interest rate fluctuations. Specifically, interbank rates and other market-determined interest rates could diverge from policy rates. From a real economy perspective, it is optimal to target interest rates and allow the exchange rate to fluctuate. However, the Peruvian economy is still dollarized, albeit much less than before. Dollarization has been a motive to sustain exchange rate stability. If the Peruvian central bank follows its own historical footsteps, it will not cut rates, despite economic weakness and falling inflation. On the whole, Peru’s monetary authorities remain very mindful of exchange rate volatility. Odds are that they will sacrifice growth to avoid sharp currency fluctuations. This has ramifications for financial markets. The Peruvian sol will depreciate much less than other EM and Latin American currencies. This is why it is not in our basket of currency shorts. The central bank will not cut rates in the near term, even though the economy is weak and inflation is low. This is negative for the cyclical economic outlook. Growth will stumble further and non-performing loans (NPLs) in the banking system will rise. NPL growth (inverted) correlates with bank share prices (Chart II-3). Notably, the business cycle is already weak, as illustrated in Chart II-4. Higher interest rates and lower industrial metals prices will weigh further on the economy. Chart II-3Peru: Rising NPLs Will Depress Banks Share Prices
Peru: Rising NPLs Will Depress Banks Share Prices
Peru: Rising NPLs Will Depress Banks Share Prices
Chart II-4Peru: The Economy Is Weak
Peru: The Economy Is Weak
Peru: The Economy Is Weak
Remarkably, local currency private sector loan growth has moderated, despite the 140 basis points decline in interbank rates over the past 12 months (Chart II-5). This indicates that either interest rates are too high, or banks are reluctant to originate more loans – or a combination of both. Whatever the reason, bank loan growth will decelerate further if interest rates do not drop. Investment Recommendations The Peruvian stock market has underperformed the aggregate EM index over the past five months (Chart II-6, top panel). This underperformance has not only been due to this bourse’s large weight in mining stocks but also because of banks’ underperformance (Chart II-6, bottom panel). Chart II-5Peru: Higher Rates Will Hinder Credit Growth
Peru: Higher Rates Will Hinder Credit Growth
Peru: Higher Rates Will Hinder Credit Growth
Chart II-6Peruvian Equities Have Been Underperforming
Peruvian Equities Have Been Underperforming
Peruvian Equities Have Been Underperforming
Remarkably, bank shares have languished in absolute terms, even though their funding costs – interbank rates – have dropped significantly (Chart II-7). This is a definitive departure from their past relationship. Chart II-7Peruvian Bank Stocks Stagnated Despite Falling Interest Rates
Peruvian Bank Stocks Stagnated Despite Falling Interest Rates
Peruvian Bank Stocks Stagnated Despite Falling Interest Rates
As interbank rates rise marginally, bank share prices will be at risk of selling off. This in tandem with lower industrial metals prices warrants a cautious stance on this bourse’s absolute performance. Relative to the EM benchmark, we remain neutral on Peruvian equities. The Peruvian sol will depreciate less than many other EM currencies, which will help the stock market’s relative performance versus the EM benchmark. Currency outperformance heralds an overweight stance in domestic bonds within the EM local currency bond portfolio. Dedicated EM credit portfolios should overweight Peruvian sovereign and corporate credit as well. The key attraction is that Peru’s debt levels are low, which will make its credit market a low-beta defensive one in the event of a sell off. Arthur Budaghyan Chief Emerging Markets Strategist arthurb@bcaresearch.com Juan Egaña Research Associate juane@bcaresearch.com Footnotes 1 Deflated by the average of (1) the GDP deflator, (2) core consumer price inflation, and (3) 25% trimmed-mean consumer price inflation. Equities Recommendations Currencies, Credit And Fixed-Income Recommendations
Dear clients, Over the next couple of weeks, we will be further analyzing China’s coronavirus outbreak, its economic impact, and the likely policy response, as well as the attendant investment recommendations. We will also examine any sector-related or regional themes that stem from the outbreak. Stay tuned. Jing Sima, China Strategist Highlights The peak in the number of new cases outside of the crisis epicenter will be more market-relevant than the total number of infections. New cases outside of the epicenter continue to rise, but a peak may be in sight. Our sense is that financial markets are likely to bottom earlier than the consensus expects. The economic impact on China from the outbreak will be large, but manufacturing activities in the majority of Chinese cities should resume by the end of February. It will take longer for the service sector to recover, implying a larger hit to the economy compared with the SARS episode given that services have grown in importance. This will force Chinese policymakers to set their financial deleveraging agenda aside for the rest of the calendar year. We maintain an overweight stance on Chinese stocks both tactically and cyclically, based on our view that the outbreak will soon be contained outside of Hubei province and that China’s budding economic recovery will be delayed, but not prevented, by the crisis. Feature The coronavirus (2019-nCoV) outbreak in China has sparked a selloff in risk assets around the globe. China’s A-share equity market, after an extended Chinese New Year market closure, was in a free fall when it reopened on February 3. In the offshore market, the MSCI China Index has declined by 9% from its most recent high on January 13, 2020 (Chart 1). When attempting to forecast a turning point in bearish investor sentiment stemming from the outbreak, it is important to note that during the 2003 SARS epidemic, both global and Chinese equity markets rebounded when the number of new cases peaked in Hong Kong SAR and globally (Chart 2). Chart 1Chinese Stocks Have Been Hit Hard By The Virus Outbreak
Chinese Stocks Have Been Hit Hard By The Virus Outbreak
Chinese Stocks Have Been Hit Hard By The Virus Outbreak
Chart 2Markets Bottomed As Total SARS Infections Peaked
Markets Bottomed As Total SARS Infections Peaked
Markets Bottomed As Total SARS Infections Peaked
We maintain our long stance both tactically and cyclically on Chinese stocks, based on the following assessments: In the next three months, the panic brought on by 2019-nCoV will abate before the total number of new cases peaks, as investors focus on the turning point in the outbreak outside of the epicenter (Hubei province). Beyond the next three months, the outbreak will likely delay China’s economic recovery. However, this means that Chinese policymakers will not likely reduce the scale of their stimulative efforts this year. The Market Correction May Be Short-Lived Since the onset of the 2019-nCoV outbreak, many studies have attempted to predict the speed and magnitude of the spread of the virus. Using a mathematical model called Susceptible-Exposed-Infected-Recovered (SEIR), The Lancet,1 The University of Hong Kong,2 and Johns Hopkins CSSE3 all drew a conclusion that a peak in the current episode is likely to occur between late April and early May. The number of cases outside of the crisis epicenter will likely drive financial market sentiment. While we think this conclusion may be true for the total number of new cases, the total count will be less relevant to investors during this episode than during the 2003 SARS outbreak. Instead, it will be more useful to break down the total infection count into two sets of data: the number of new cases within the city of Wuhan and Hubei Province (the epicenter of the outbreak), and the number of new cases outside of Hubei. The latter is more likely to be the primary driver of short-term outbreak-related market sentiment. While Hubei is experiencing an acceleration in the daily rate of new cases, the number of new cases across the rest of China seems to be flattening off of late (Chart 3). We think that the number of cases outside of Hubei will peak earlier than within the epicenter. This is in contrast to the 2003 SARS outbreak when the peak of new cases in the rest of China and globally lagged the epicenter Hong Kong SAR by a month (Chart 4). Chart 3Number Of 2019-nCoV New Cases Flattening Outside The Epicenter
Recovery, Temporarily Interrupted
Recovery, Temporarily Interrupted
Chart 4SARS Outbreak Peaked Globally A Month After Peaking In The Crisis Epicenter
SARS Outbreak Peaked Globally A Month After Peaking In The Crisis Epicenter
SARS Outbreak Peaked Globally A Month After Peaking In The Crisis Epicenter
There are two reasons for the difference between the 2003 SARS peak and projections for the 2019-nCoV outbreak: Timely cutoff of virus mobility outside of epicenter: The world responded quickly to contain the virus. During the 2003 SARS episode, Chinese authorities responded with protective measures only after the outbreak had already peaked in the epicenter. This time the Chinese government intervened at an early stage of the outbreak with forceful and in some cases extreme actions, including a near-complete lockdown of Wuhan (the crisis epicenter) and restrictions on inter- and intra-city traffic in other major metropolitan areas. Foreign governments in North America, Europe, and Southeast Asia took unprecedented measures to ban or limit air traffic to/from China. Furthermore, with timely and sufficient medical care, the fatality rate outside of the epicenter has been much lower4 – a significantly underreported fact. Mishandling of the crisis within the epicenter: Within Hubei province, particularly the city of Wuhan where the virus originated, the number of infections will likely continue climbing in the next two to even three months. The abovementioned studies suggest the number of cases in the epicenter is five to seven times higher than the official count. Local hospitals are experiencing severe shortages of medical supplies, meaning that people with mild-to-medium symptoms have reportedly been turned away. These patients are not included in the official statistics as confirmed or suspect cases. The discrepancy in reporting means these cases will be confirmed and recorded at a much later date. Without quarantine and treatment, these patients may continue to transmit the virus to others within the epicenter. This will have a tragic human cost, but it will hold few consequences for financial markets. The corrections in Chinese onshore and offshore stocks, while severe, will be fleeting. Bottom Line: Market sentiment will rebound following the peak in new 2019-nCoV cases outside the epicenter of Wuhan/Hubei. We think the peak may come as early as mid to late-February, which suggests the corrections in Chinese onshore and offshore stocks, while severe, will be fleeting. Economic Recovery In Sight Beyond the near-term, our view on China’s likely policy response and the economy’s fundamentals support a positive outlook for Chinese stocks over the next 6 to 12 months. In absolute dollar terms, the scale of the economic impact from the 2019-nCoV outbreak will likely be larger than the SARS episode in 2003. Unlike with SARS, when disruptions were mild and limited to the travel and retail sectors, the extreme measures China took in response to the coronavirus outbreak have essentially placed Chinese economic activity on hold. Chart 5Service Sector Now A Larger Part Of China's Economy Compared With 2003
Service Sector Now A Larger Part Of China's Economy Compared With 2003
Service Sector Now A Larger Part Of China's Economy Compared With 2003
China’s service sector is also likely to be more affected than manufacturing, because the outbreak coincided with the Chinese New Year holiday when services are normally in high demand. In addition, the service sector accounts for a much larger share of the Chinese economy than in 2003 (Chart 5). Therefore, the reduction in services output will have a comparatively bigger economic impact. However, as we think the 2019-nCoV outbreak outside of the epicenter will likely peak in February, the majority of nationwide manufacturing activity should resume no later than the last week of February. Chinese authorities have already signaled they will speed up government-led infrastructure investment as early as March. Chart 6Service Sector Took Longer To Recover After SARS Outbreak
Service Sector Took Longer To Recover After SARS Outbreak
Service Sector Took Longer To Recover After SARS Outbreak
The service sector will take longer to recover. Following the 2003 SARS outbreak, the recovery in the service sector lagged the manufacturing and primary sectors by one quarter (Chart 6). This will likely delay the bottoming of the aggregate Chinese economy. We project a bottom in China’s economy towards the end of the second quarter of 2020. A delay in economic recovery will force Chinese policymakers to put aside their financial deleveraging agenda, and focus on economic growth for the year. 2020 marks the final year for policymakers to accomplish their goal to double GDP from 2010. This means policymakers will likely augment the amount of stimulus in order to stabilize the economy and avoid falling short of their growth target. Bottom Line: Business activities should resume in late February, with a bottoming in the economy towards the end of the second quarter of 2020. Monetary Support Already Lining Up The Chinese economy is on a structurally slowing trend, but is in an early stage of cyclically recovering from last year (Chart 7). This is in contrast with 2003 during the SARS outbreak when China’s economic growth was structurally accelerating, but the monetary environment was in a tightening cycle and industrial profit growth was downshifting (Chart 8). Chart 7Chinese Economy Is On A Structurally Slowing Trend, But Is Cyclically Recovering...
Chinese Economy Is On A Structurally Slowing Trend, But Is Cyclically Recovering...
Chinese Economy Is On A Structurally Slowing Trend, But Is Cyclically Recovering...
Chart 8...And Is In An Expansionary Monetary Cycle
...And Is In An Expansionary Monetary Cycle
...And Is In An Expansionary Monetary Cycle
As the performance of Chinese onshore stocks reflects domestic policy, Chinese A-shares, after briefly rebounded when the 2003 SARS outbreak peaked, underperformed the global benchmark during much of the 2004-2006 period when monetary policy tightened (Chart 9). Contrasting with 2003, we expect the PBoC to maintain a more accommodative monetary stance throughout 2020 (Chart 10): the PBoC cut the open market operation interest rates by 10bps on February 3. We expect this move to lead to a 5bps LPR and MLF rate cut in March. Moreover, the chance that the PBoC will cut the bank reserve requirement ratio (RRR) in Q2 is also increasing. Chart 9Chinese Onshore Equity Market Largely Driven By Domestic Policy
Chinese Onshore Equity Market Largely Driven By Domestic Policy
Chinese Onshore Equity Market Largely Driven By Domestic Policy
Chart 10Easy Monetary Stance Is Here To Stay
Easy Monetary Stance Is Here To Stay
Easy Monetary Stance Is Here To Stay
Bottom Line: Monetary policy will become more accommodative this year. Investment Conclusions Chinese stocks just went on sale, but the sale likely will not last long. Chart 11Chinese Stocks Are Priced At An Even Deeper Discount
Chinese Stocks Are Priced At An Even Deeper Discount
Chinese Stocks Are Priced At An Even Deeper Discount
Over the next 0-3 months, Chinese equities will likely rebound as soon as the peak in the number of new cases outside of Wuhan/Hubei occurs. We believe the peak will happen within the next two weeks, and manufacturing activities in the majority of Chinese cities will resume following the peak in the outbreak. Depressed valuations in Chinese stocks compared with the global benchmark and the expectation of a rebound in Chinese economic activity should provide a good buying opportunity for global investors (Chart 11). In short, Chinese stocks just went on sale, but the sale likely won’t last long. Over a cyclical time horizon, we had previously predicted that China’s authorities may reduce the scale of the stimulus in the second half of this year as the economy starts to recover in Q1. The 2019-nCoV outbreak will alter the leadership’s policy trajectory and extend pro-growth support through 2020, and both the central and regional governments have announced a slew of policies in supporting businesses, particularly for the private sector. Our expectation that the viral outbreak will not derail China’s economic recovery suggests that corporate earnings will also rebound over a 6-12 month time horizon. One risk that we will be monitoring over the coming several months is the potential for firm- or sector-specific effects on earnings. The nationwide city lockdowns are certain to reduce or halt the flow of cash to businesses, and it is unclear whether this will have any disproportionate effects on corporate earnings relative to what we expect will occur for the economy beyond Q1. However, for now, our assumption is that the trend in earnings growth is likely to match that of the economy more generally unless evidence to the contrary presents itself. This supports an overweight position in Chinese stocks compared with their global peers over the coming 6-12 months. Jing Sima China Strategist jings@bcaresearch.com Qingyun Xu, CFA Senior Analyst qingyunx@bcaresearch.com Footnotes 1 “Nowcasting and forecasting the potential domestic and international spread of the 2019-nCoV outbreak originating in Wuhan, China: a modelling study”, The Lancet, January 31, 2020. 2 “Real-time nowcast on the likely extent of the Wuhan coronavirus outbreak, and forecasts domestic and international spread”, Hong Kong University, January 27, 2020 3 “Modeling the Spreading Risk of 2019-nCoV”, John Hopkins Center For Systems Science And Engineering, January 31, 2020. 4 As of February 3, 2020, the fatality rate of 2019-nCoV outside of Hubei stands at 0.2%, compared with a 3% fatality rate in Hubei province and 5.5% in Wuhan, according to the World Health Organization (WHO). Cyclical Investment Stance Equity Sector Recommendations
Highlights Global Growth Fears: Efforts to contain the China coronavirus outbreak risk creating the outcome that investors feared most in 2019 from the US-China trade war – weaker global growth and a severe disruption to supply chains worldwide. Monetary Policy Responses: Global bond yields have plunged as investors have piled into safe haven assets and priced in additional monetary easing from major central banks. Some of that decline in yields, however, may be a repricing of future rate hike probabilities with central banks like the Fed and ECB rethinking their inflation mandates and how to achieve them. Duration Strategy: Maintain a moderate below-benchmark cyclical (6-12 months) stance on overall interest rate duration in global fixed income portfolios. Yields now discount a significant hit to global economic growth from China. This outcome is far from certain, especially if China delivers more aggressive fiscal and monetary policy easing to mitigate the deflationary effects of the public health crisis. Feature Chart of the WeekBond Yields Have "Gone Viral"
Bond Yields Have "Gone Viral"
Bond Yields Have "Gone Viral"
Global bond yields have declined sharply over the past two weeks, as investors have tried to process the potential implications of the China coronavirus outbreak. Scenes of empty streets in Chinese cities under quarantine look like something out of a Hollywood science fiction movie. Fears of a “zombie apocalypse” scenario plunging the global economy into recession are proliferating among doomsayers. The viral outbreak is interrupting global growth just as it is starting to show signs of recovery from the manufacturing slump of 2019 (Chart of the Week). Global bond yields had been slowly rising alongside that economic improvement, and risk premia in equity and credit markets had begun to narrow in earnest. Against that backdrop with markets priced for perfection, a massive public health crisis in the most marginal driver of global growth, China, was a potent trigger for a correction in risk assets. The story is obviously very fluid, with the number of infected continuing to grow in China and more cases being discovered across the world. At least 50 million Chinese citizens are now under quarantine, across several major cities. More countries are instituting travel bans to and from China, and important global companies like Apple are shuttering their China operations until further notice. The ultimate hit to global growth is yet to be determined, but measures being taken to slow the spread of the coronavirus will clearly have an impact on global trade, supply chain management and, thus, economic growth. This risks a repeat of the May-August period last year, when markets were pricing in the potential negative effects of US-China trade tariffs on global growth, triggering a major decline in global bond yields. A big driver of that bond rally last year was a shift towards expectations of easier global monetary policy. Those were largely realized as central banks cut rates while global growth was actually slowing. Bond yields now discount another round of rate cuts, most importantly from the US Federal Reserve, despite no formal indication (yet) that policymakers are looking to deliver more easing. The risk now is that investors will become too pessimistic, setting up a swing of the pendulum in the opposite direction if the hit to global growth from the virus is less than feared. On that note, a significant Chinese economic growth slowdown now appears fully priced into global bond yields. The risk now is that investors will become too pessimistic, setting up a swing of the pendulum in the opposite direction if the hit to global growth from the virus is less than feared. On that note, a significant Chinese economic growth slowdown now appears fully priced into global bond yields, as we discuss later in this Weekly Report. Breaking Down The Latest Decline In Global Bond Yields The decline in government bond yields in the developed markets (DM) has been sharpest since Chinese authorities confirmed human-to-human transmission of the coronavirus on Monday, January 20. That appears to be the date when investors began to take the outbreak much more seriously. Growth-sensitive assets like emerging market (EM) equities, copper and oil prices peaked on Friday, January 17, while measures of volatility like the US VIX index and US high-yield credit spreads troughed (Chart 2). The price of safe haven assets like gold and the Japanese yen have also increased since that “pre-virus peak” on January 17, as have bond volatility measures like the US MOVE index or European swaption volatility (Chart 3). Importantly, the increases in rates volatility have been smaller to date compared to mid-2019, when the “convexity” trade triggered an insatiable demand for duration that drove longer-maturity global bond yields sharply lower. Chart 2A Pullback In Growth-Sensitive Assets
A Pullback In Growth-Sensitive Assets
A Pullback In Growth-Sensitive Assets
Chart 3A Mild Bid For Safe Havens Compared To 2019
A Mild Bid For Safe Havens Compared To 2019
A Mild Bid For Safe Havens Compared To 2019
A breakdown of the decline in the benchmark 10-year government bond yields in the major DM countries (US, Germany, Japan, the UK, Canada and Australia) since that “pre-virus peak” is shown in Table 1. Table 1Global Bond Yield Changes Since January 17, 2020
The China Syndrome
The China Syndrome
The biggest declines were in the US (-33bps), Canada (-29bps) and Australia (-23bps) where central bank monetary policy expectations also saw the largest shift. Our 12-month discounters, which measure the change in short-term interest rates over a one-year horizon priced into Overnight Index Swap (OIS) curves, have fallen by -30bps in the US, -26bps in Canada and -22bps in Australia – indicating that markets had fully priced in a rate cutting response to the coronavirus outbreak from the Fed, Bank of Canada and Reserve Bank of Australia. Bond yields have fallen to a lesser extent in Germany (-19bps), the UK (-11bps) and Japan (-7bps), but with very modest declines in our 12-month discounters for those three countries were policy interest rates are close to, or below, 0%. Therefore, the decline global yields over the past two weeks can, on the surface, be attributed to expectations of easier monetary policy in response to the potential hit to growth, and tightening of financial conditions as risk assets sell off, from the coronavirus (Chart 4). Chart 4Falling Yields Reflect Expectations Of More Rate Cuts In 2020...
Falling Yields Reflect Expectations Of More Rate Cuts In 2020...
Falling Yields Reflect Expectations Of More Rate Cuts In 2020...
Chart 5...But Also Expectations Of Lower Rates For Longer
...But Also Expectations Of Lower Rates For Longer
...But Also Expectations Of Lower Rates For Longer
Yet when looking at our estimates of the term premium for all six countries, the decline in the nominal 10-year yields is almost equal to the reduction in the term premium. On the surface, this would be consistent with the idea that the fall in yields is due to risk aversion driving up the demand for the safety of government bonds – and can hence be unwound if the news were to turn less gloomy on the spread of the coronavirus. Yet interest rates further out the yield curve have also fallen by similar amounts in all countries shown, when looking at 1-year interest rates, 5-years forward (the bottom row of Table 1). That decline in longer-dated forwards does correlate strongly with lower inflation expectations as measured by 10-year CPI swap rates (Chart 5). This suggests an alternative explanation for the recent fall in global bond yields that is not related to worries over the coronavirus: bond markets increasingly believe that policy interest rates will be lower for a lot longer. An alternative explanation for the recent fall in global bond yields that is not related to worries over the coronavirus: bond markets increasingly believe that policy interest rates will be lower for a lot longer. With the Fed and ECB now openly discussing changing their monetary policy frameworks to manage achievement of their statutory inflation targets more proactively, the hurdle for contemplating any interest rate hikes in the future is now much higher. Thus, central banks are giving forward guidance to the markets that rates will be lower. That is a message that would also be consistent with the decline in the term premium, to the extent that the premium is compensation for the future volatility of short-term interest rates. When looking at all the components, the message from the most recent decline in global bond yields may be more complex than simple virus-driven risk aversion. Our Duration Indicator continues to improve alongside rebounding global economic sentiment, signaling cyclical upward pressure on yields (Chart 7) – assuming, of course, that the hit to Chinese growth from the coronavirus outbreak is no worse than currently discounted in financial asset prices. In the case of US Treasuries, the bond rally also has a cyclical component, with yields now down to levels more consistent with the softer pace of growth indicated by the ISM Manufacturing index and the recent softening trend in US data surprises (Chart 6). Yet with US monetary policy and financial conditions still highly accommodative, the odds still favor some improvement in the current trend-like pace for US GDP growth that will, eventually, begin to put moderate upward pressure on Treasury yields again. Chart 6Low UST Yields Are Not Just A coronavirus Story
Low UST Yields Are Not Just A coronavirus Story
Low UST Yields Are Not Just A coronavirus Story
Chart 7Global Yields Were Due For A Corrective Pullback
Global Yields Were Due For A Corrective Pullback
Global Yields Were Due For A Corrective Pullback
A similar message is given when we look at global bond yields, more generally. Our Duration Indicator continues to improve alongside rebounding global economic sentiment, signaling cyclical upward pressure on yields (Chart 7) – assuming, of course, that the hit to Chinese growth from the coronavirus outbreak is no worse than currently discounted in financial asset prices. Bottom Line: Efforts to contain the China coronavirus outbreak risk creating the outcome that investors feared most in 2019 from the US-China trade war – weaker Chinese growth and a severe disruption to global supply chains. Global bond yields have plunged as investors have piled into safe haven assets and priced in additional monetary easing from major central banks. Some of that decline in yields, however, may be a repricing of future rate hike probabilities with central banks like the Fed and ECB rethinking their inflation mandates and how to achieve them. How Much China Weakness Is Priced Into Global Bond Yields? The China coronavirus outbreak, and the response to contain it, represents a potentially severe hit to Chinese – and global – economic growth. A lot of comparisons have been made to the 2003 SARS outbreak to try and find a comparable past event. However, as our colleagues at BCA Research Emerging Markets Strategy have noted, China’s economy is so much larger now, rendering comparisons of the economic impact from SARS to that of the coronavirus far less meaningful.1 For example, China’s GDP at purchasing power parity accounts for 19.3% of world GDP compared to 8.3% in 2002 before the SARS outbreak occurred. China’s share of the global consumption of various industrial metals has surged, as well, from between 10-20% in 2002 to 50-60% today. A simple alternative way to measure the impact of any virus-driven slowing of Chinese economic growth would be to calculate the reduction in full-year 2020 GDP growth relative to consensus forecasts. In this sense, the comparison is made to current expectations rather than to a past episode – an approach that should be far more relevant for predicting the response of financial asset prices today. For example, the Bloomberg consensus expectation for Chinese nominal GDP growth for all of 2020 is currently 7.2%. Using that rate and the level of nominal GDP from 2019, we can calculate an expected level for nominal GDP for 2020. We can then make some simplifying assumptions for the impact on full-year growth from an extended period of lost output from the quarantines, government-ordered factory shutdowns and extended holidays, travel bans, etc. Assuming that one full month of expected nominal GDP growth is lost (i.e. 1/12th of the expected increase in the level of nominal China GDP), the full-year growth rate falls to 6.6% Assuming that two full months of expected nominal GDP growth are lost, the full year growth rate falls to 6.0% Global bond yields now reflect a considerable slowdown of Chinese economic activity from the coronavirus, representing between 1-2 months of expected full-year 2020 nominal GDP growth that will be lost. The last time that Chinese nominal GDP growth fell to a sub-7% pace was back in 2015 (Chart 8). The Caixin manufacturing PMI reached a low of 47.2 then, 3.9 points below the current level of 51.1. The level of global bond yields, using our “Major Countries” GDP-weighted aggregate, was at 0.72% - similar to today’s level. Global growth ex-China was also at similarly subdued levels in 2015 (i.e. the US ISM manufacturing index was below 50). Chart 8Global Yields Already Priced For A 2015-Type Slowdown In China
Global Yields Already Priced For A 2015-Type Slowdown In China
Global Yields Already Priced For A 2015-Type Slowdown In China
Chart 9New Stimulus Measures In China Are Inevitable
New Stimulus Measures In China Are Inevitable
New Stimulus Measures In China Are Inevitable
We conclude from this admittedly simple analysis that global bond yields now reflect a considerable slowdown of Chinese economic activity from the coronavirus, representing between 1-2 months of expected full-year 2020 nominal GDP growth that will be lost. The final impact on China economic growth in 2020 will likely be less than that full hit, as Chinese policymakers will surely look to ease monetary and fiscal policy to offset the hit to the economy (Chart 9). While BCA’s China strategists do not currently expect the same magnitude of policy responses as was seen in 2015/16, there will likely be enough to at least partially offset the hit to growth from containing the virus. In terms of timing, the critical point for financial markets – and bond yields – will be when the growth rate of new coronavirus cases peaks. During the 2003 SARS episode, global equity markets bottomed when that number of new cases peaked, which we believe to be a useful template for timing a potential turning point in the “fear narrative” (Chart 10). The number of new coronavirus infections continues to rise, however, suggesting that risk assets and bond yields will likely remain subdued in the near term. Chart 10Markets Bottomed In 2003 When The SARS Infection Rate Peaked
Markets Bottomed In 2003 When The SARS Infection Rate Peaked
Markets Bottomed In 2003 When The SARS Infection Rate Peaked
When that turn does happen, any potential increase in global bond yields will be driven more by unwinding the declines in real yields and term premia of the past two weeks shown earlier in this report in Table 1. Chart 11Only A Pause In The Cyclical Upturn In Yields?
Only A Pause In The Cyclical Upturn In Yields?
Only A Pause In The Cyclical Upturn In Yields?
That suggests a potential rise in the 10-year US Treasury yield of as much as 30bps, and a 23bps increase in the 10-year German bund yield. An additional increase of 5-10bps for both markets could come from higher inflation expectations, although that would likely need to be accompanied by a sizeable rebound in the price of oil and other industrial commodities. We are not seeing signs in our most favored leading indicators – like our global LEI diffusion index or the global ZEW index – suggesting that the next cyclical move in yields will be lower. We acknowledge that the recent fall in yields has gone against our expectations of a moderate grind higher global bond yields in 2020. However, we are not seeing signs in our most favored leading indicators – like our global LEI diffusion index or the global ZEW index – suggesting that the next cyclical move in yields will be lower (Chart 11). We will monitor those indicators in the coming months for any signs of a serious hit to global growth from the coronavirus outbreak. Bottom Line: Maintain a moderate below-benchmark cyclical (6-12 months) stance on overall interest rate duration in global fixed income portfolios. Yields now discount a significant hit to global economic growth from China. This outcome is far from certain, especially if China delivers more aggressive fiscal and monetary policy easing to mitigate the deflationary effects of the public health crisis. Robert Robis, CFA Chief Fixed Income Strategist rrobis@bcaresearch.com Footnotes 1 Please see BCA Research Emerging Markets Strategy Weekly Report, "Coronavirus Versus SARS: Mind The Economic Differences", dated January 30, 2020, available at ems.bcaresearch.com. Recommendations The GFIS Recommended Portfolio Vs. The Custom Benchmark Index
The China Syndrome
The China Syndrome
Duration Regional Allocation Spread Product Tactical Trades Yields & Returns Global Bond Yields Historical Returns
Highlights BCA’s “Golden Rule of Bond Investing” framework, which links developed economy government bond returns to central bank policy rate “surprises” versus market expectations, also works in China. The relationship between unexpected changes in China’s de facto short-term policy rate and government bond yields has been surprisingly strong over the past decade. Any additional easing by the PBoC this year is likely to be focused on reducing lending rates to the real economy, not interbank rates (which drive government bond yields). As such, yields at the short-end are likely to be flat until later this year at the earliest, whereas yields at the long-end are likely to move modestly higher, at most. The persistent historical gap between economic growth and bond yields in China makes it difficult to forecast the structural outlook for yields using conventional methods. To the extent that Chinese policymakers succeed at shifting the drivers of growth from investment to consumption, we believe that bond yields are more likely to structurally rise than fall. Over the coming 6-12 months, investors should underweight Chinese government bonds versus Chinese equities and onshore corporate bonds. Within a regional government bond portfolio, however, investors should overweight USD-hedged China versus US and developed markets ex-US, as well as in unhedged terms. Feature Last year’s inclusion of Chinese onshore government and policy bank bonds in the Bloomberg Barclays Global Aggregate Index was a significant milestone of China’s journey to internationalize its capital markets. Other bond benchmark providers have since followed suit, highlighting that the trend of increased passive exposure to Chinese assets is likely to continue. Over the past year, the bulk of the market discussion concerning the addition of China to the major bond indices has focused on estimating the size of potential capital inflows that could be triggered and the related impact on onshore bond yields. By contrast, comparatively little work has been done to analyze the core drivers of Chinese government bond yields, and how they compare to the factors that influence yields in the developed markets that dominate the bond indices. This Special Report attempts to fill a hole in the analysis of Chinese bonds. This Special Report attempts to fill that hole in the analysis of Chinese bonds. We look at the predictability of China’s government bond market through the lens of BCA’s “golden rule” framework, and find a surprisingly strong relationship between changes in China’s de facto short-term policy rate and government bond yields. We then present our cyclical (6-12 month) and secular outlooks for government yields given this relationship, and conclude by presenting four specific investment recommendations pertaining to China’s fixed-income market with two audiences in mind: mainland/onshore investors who are focused on returns in unhedged RMB terms, and global fixed-income investors who are primarily focused on hedged US-dollar regional bond exposure. The Golden Rule Of Bond Investing, With Chinese Characteristics In a July 2018 Special Report,1 BCA’s Chief US Bond Strategist, Ryan Swift, elegantly distilled the cyclical US government bond call into a simple question: During the next 12-months, will the Federal Reserve move interest rates by more or less than what is currently priced into the market? Chart 1The (US) Golden Rule Of Bond Investing In Practice
The (US) Golden Rule Of Bond Investing In Practice
The (US) Golden Rule Of Bond Investing In Practice
Ryan argued that a predictive framework for US Treasury returns built around the answer to this question has historically worked so well that it should be referred to as the “Golden Rule of bond investing” (Chart 1). In a follow-up report, our Global Fixed Income Strategy service confirmed that the Golden Rule also largely works in non-US developed market economies, with the exception of Japan due to the absence of any meaningful fluctuation in policy rates over the past two decades.2 The Golden Rule provides a very strong framework to aid fixed-income investors with their cyclical (i.e. 6-12 month) asset allocation decisions, by quantitatively linking government bond returns relative to cash – in other words, the excess return earned by taking duration risk - to policy rate “surprises” compared to what is discounted in shorter-term money markets. The practical application is that a decision to allocate to longer-maturity government bonds is reduced to a bet on whether a central bank will adjust policy rates by more or less than the market expects. The first question we address in this report is to what degree does the Golden Rule apply in China (in yield space rather than in return space), along with an explanation of any differences that may exist. However, we must first note why the Golden Rule of bond investing works, particularly in the US. The first reason is that there is a strong relationship between the US 3-month T-bill rate and Treasury yields of all other maturities. Conceptually, all fixed income investors have a choice when buying US government bonds: they can purchase a 3-month Treasury bill and simply perpetually roll over the position as it matures, or they can purchase a Treasury bond of a longer maturity. This means that yields on longer maturity Treasury bonds simply reflect investor expectations for the average 3-month T-bill rate over the life of the bond, plus some positive risk premium to compensate for the inherent uncertainty of the path and tendency of short-term yields. This helps explain the close link between cyclical changes in 3-month T-bill rates and yields on longer maturity Treasurys. Chart 2In The US, The 3-Month T-Bill Rate Perfectly Tracks The Fed Funds Rate
In The US, The 3-Month T-Bill Rate Perfectly Tracks The Fed Funds Rate
In The US, The 3-Month T-Bill Rate Perfectly Tracks The Fed Funds Rate
The second reason for the Golden Rule’s success is that there is a very tight relationship between the effective Fed funds rate and the 3-month T-bill rate. While it is the (higher) discount rate that is the theoretical no-arbitrage ceiling for the 3-month rate, in practice T-bill rates trade extremely close to the Fed funds rate (Chart 2). This means that Fed funds rate “surprises” (relative to traded market expectations) are akin to surprises in the 3-month rate, which in turn strongly influence the expected future path of short-term interest rates and thus yields on longer maturity Treasurys. In China, we noted in a February 2018 Special Report3 that the 7-day interbank repo rate is now the de jure short-term policy rate in China following the establishment of an interest rate corridor system in 2015. Chart 3 presents our first test of the Golden Rule in China (in yield space rather than in return space), by plotting the annual change in the level of Chinese government bond yields alongside the 7-day repo rate “surprise” over the past year from 2010 to the present. Here, we use the first principal component of zero coupon Chinese government bond yields to represent the average level of yields (rather than selecting a particular maturity), and we use the 12-month RMB swap rate (versus 7-day repo) to represent market expectations for the policy rate. The chart highlights that the fit is good, as measured by a 50% R-squared between the two series. However, deviations in the relationship do exist, with the most notable exception having occurred in 2017: Chinese government bond yields rose considerably more than what the annual surprise in the 7-day repo rate would have suggested. Chart 3In China, The Golden Rule Works Decently Well Using 7-Day Repo...
In China, The Golden Rule Works Decently Well Using 7-Day Repo...
In China, The Golden Rule Works Decently Well Using 7-Day Repo...
Chart 4...And Extremely Well Using 3-Month SHIBOR
...And Extremely Well Using 3-Month SHIBOR
...And Extremely Well Using 3-Month SHIBOR
Chart 4 helps resolve a good portion of the 2017 discrepancy, and clarifies the link between Chinese monetary policy and government bond yields. Chart 4 is similar to Chart 3, except that it replaces the 7-day repo rate surprise with that of 3-month SHIBOR (which trades very closely to the 3-month repo rate). The chart illustrates an even closer fit between the two series (with an R-squared close to 80%), and shows that the 3-month SHIBOR surprise does a meaningfully better job at explaining the 2017 rise in Chinese government bond yields. The Golden Rule of bond investing works surprisingly well in China. The fact that the annual surprise in 3-month SHIBOR has done a better job at predicting changes in bond yields over the past decade underscores that the 3-month repo rate is the de facto short-term policy rate in China, a point that we have made in several previous reports. We have noted that the spike in the 3-month/7-day repo rate spread that occurred in late-2016 and lasted until mid-2018 happened because of China’s crackdown on shadow banking activity. This crackdown caused a funding squeeze for China’s small & medium banks, which caused a material rise in lending rates and government bond yields. This episode highlights that future changes in the 3-month repo rate are likely to reflect both underlying changes in net liquidity provided to large commercial banks (measured by the 7-day repo rate), and any dislocations in the interbank market that have the potential to push up lending rates and government bond yields. Bottom Line: BCA’s “Golden Rule” framework, which links developed economy government bond returns to central bank policy rate “surprises” versus market expectations, works for China as well – using the correct measure of the PBOC policy rate. This provides a useful investment framework for Chinese government bonds, which are now significant part of major global bond market benchmarks. The Cyclical Outlook For Chinese Government Bond Yields Given the establishment of the relationship between Chinese short-term interbank rates and government bond yields detailed above, we are now able to more precisely discuss the likely cyclical trajectory of Chinese government bond yields as a function of Chinese monetary policy. Two opposing forces have the potential to affect China’s government bond market this year. The first, a stabilization and modest rebound in Chinese economic activity, may exert upward pressure on yields due to expectations of eventual policy tightening. The second, continued attempts by the PBoC to ease corporate lending rates, may exert downward pressure on yields as it will reflect not just easy but easier monetary conditions. Yields at the long-end are likely to move modestly higher this year, at most. For investors, the raises the obvious question of whether Chinese government bond yields are likely to move up, down, or trend sideways this year. In our view, yields at the short-end are likely to be flat until later this year at the earliest, whereas yields at the long-end are likely to move modestly higher, at most. Yields at the short-end of China’s government bond curve are likely to stay flat for most of this year. There are two reasons why yields at the short-end of China’s government bond curve are likely to stay flat for most of this year. The first is that the PBoC is generally a reactive central bank and has historically lagged a pickup in economic activity, as illustrated in Chart 5. The chart shows the historical path of 3-month SHIBOR in the year following a bottom in economic activity in 2009, 2012, and 2015, and makes it clear that there has been no precedent for a significant rise in interbank rates in the first nine months of an economic recovery. The 2012 episode did see a very sharp rise in 3-month SHIBOR once the PBoC shifted into tightening mode, but we doubt that this experience will be repeated again unless economic growth accelerates much more aggressively than we expect. The second reason why we expect yields at the short-end of the curve to remain muted this year is because any additional easing by the PBoC is likely to be focused on reducing corporate lending rates, not interbank rates. Chart 6 highlights that while there is a strong correlation between changes in Chinese government bond yields and average lending rates in the economy, the former leads the latter. In the past, this relationship has existed because changes in interbank rates have coincided with reductions in the now obsolete benchmark lending rate, with the former usually occurring earlier than the latter. But in a scenario where the PBoC reduces the loan prime rate (LPR) and keeps net banking sector liquidity roughly constant, the extremely tight relationship shown in Chart 4 suggests that short-term bond yields are unlikely to be affected by a reduction in lending rates. Any meaningful decline in short-term yields below short-term interbank rates would simply prompt banks to stop buying these bonds. Chart 5The PBoC Is Generally A Reactive Central Bank
The PBoC Is Generally A Reactive Central Bank
The PBoC Is Generally A Reactive Central Bank
Chart 6Average Lending Rates Lag Short-Term Bond Yields
Average Lending Rates Lag Short-Term Bond Yields
Average Lending Rates Lag Short-Term Bond Yields
Chart 7China's Yield Curve Is Generally Pro-Cyclical
China's Yield Curve Is Generally Pro-Cyclical
China's Yield Curve Is Generally Pro-Cyclical
Additional easing by the PBoC does have the potential to impact the long-end of the government bond curve if investors view these actions as a sign that interbank rates will remain low for some time. This view is reinforced by the fact that China’s yield curve is not particularly flat, and thus has room to move lower. However, Chart 7 also shows that China’s yield curve, defined here as the second principal component of zero coupon Chinese government bond yields, is positively correlated with the relative performance of investable Chinese equities. This suggests that there is a procyclical element to the curve. We suspect that this procyclical element will dominate a potential decline in expectations for future short-term interest rates, but that yields at the long-end are likely to move modestly higher this year, at most. Bottom Line: Any additional easing by the PBoC this year is likely to be focused on reducing lending rates to the real economy, not interbank rates (which drive government bond yields). As such, yields at the short-end are likely to be flat until later this year at the earliest, whereas yields at the long-end are likely to move modestly higher, at most. The Secular Outlook For Chinese Government Bond Yields A common approach to forecasting the likely structural trend for nominal government bond yields is to estimate the trajectory of real long-term potential output growth and to add the monetary authority’s inflation target. This framework is based on the idea that interest rates are in equilibrium when the cost of borrowing is roughly equal to nominal income growth, a condition that results in no change in the burden to service existing debt. Chart 8China's Potential Growth Is Likely To Trend Lower...
China's Potential Growth Is Likely To Trend Lower...
China's Potential Growth Is Likely To Trend Lower...
Based on this framework, we would expect Chinese government bond yields to trend down over time, or possibly flat if the PBoC were to tolerate higher inflation over the coming decade. Chart 8 illustrates the IMF’s forecast of falling real potential growth in China over the coming several years, which is consistent with a shift in the composition of growth from investment to consumption as well as China’s looming demographic crisis. But Chart 9highlights an obvious problem with applying this framework to forecast the secular trend in Chinese government bond yields: over the past decade, yields have persistently averaged below actual nominal GDP growth, both in China and in the developed world. In the latter case, it is an open question whether this will continue to be true in the future, but in China’s case it is clear that government bond yields have little connection (in magnitude) to the pace of GDP growth. This reflects the longstanding strategy of Chinese policymakers to promote investment via persistently low interest rates, as has occurred in other manufacturing and export-oriented Asian economies (Chart 10). Chart 9...But Bond Yields Are Well Below GDP Growth, Just Like In Developed Markets
...But Bond Yields Are Well Below GDP Growth, Just Like In Developed Markets
...But Bond Yields Are Well Below GDP Growth, Just Like In Developed Markets
Chart 10In Industrial Asian Economies, Low Bond Yields Are A Policy Choice
In Industrial Asian Economies, Low Bond Yields Are A Policy Choice
In Industrial Asian Economies, Low Bond Yields Are A Policy Choice
The persistent historical gap between economic growth and bond yields in China makes it difficult to forecast the structural outlook for yields using conventional methods, and largely limits us to inference. To the extent that Chinese policymakers succeed at shifting the drivers of growth from investment to consumption, bond yields are more likely to rise than fall over time. This is because as long as interest rates remain well below the pace of income growth, the incentive to excessively borrow (and invest) is likely to persist. Chart 11China Needs Higher Interest Rates, But Only To A Point
China Needs Higher Interest Rates, But Only To A Point
China Needs Higher Interest Rates, But Only To A Point
However, even in a scenario where Chinese government bond yields structurally trend higher, we expect the rise to be modest. Chart 11 highlights that China’s “private sector” debt service ratio is extremely elevated, underscoring that the country’s ability to tolerate significantly higher bond yields is not strong. In addition, since 2015, China’s debt service ratio has been mostly flat despite rising a rising debt-to-GDP ratio, which has been achieved through lower short-term interest rates. To the extent that policymakers fail to make meaningful progress in shifting China’s growth drivers away from investment over the coming few years, lower (potentially sharply lower) bond yields would appear to be all but inevitable to cope with what would become a permanently growing drag on economic activity from the servicing of debt. For now, we would characterize this scenario as a risk to our base case view, but it is a risk that we will be closely monitoring over the coming years. Bottom Line: The persistent gap between Chinese nominal GDP growth and government bond yields is likely contributing to the problem of excessive leveraging. To the extent that Chinese policymakers succeed at shifting the drivers of growth from investment to consumption, bond yields are more likely to structurally rise than fall. Investment Conclusions Our analysis above points to four recommendations for investors over the coming year: Overweight Chinese stocks versus Chinese government bonds in RMB and USD terms Overweight Chinese onshore corporate bonds versus duration-matched Chinese government bonds in RMB terms Overweight 7-10 year USD-hedged Chinese government bonds versus their US and developed market (DM) counterparts For offshore US dollar-based investors, long 7-10 year Chinese government bonds in unhedged terms Regarding the first two recommendations, our view that yields are likely to be flat at the short-end and modestly higher at the long-end suggests that investors can expect total returns on the order of 2-3% from Chinese government bonds this year. Barring a major and lasting economic slowdown from the 2019-nCoV outbreak, we expect Chinese domestic and investable equities to outperform government securities over the coming 6-12 months. Onshore corporate bonds have a similar outlook: onshore spreads are pricing in (massively) higher default losses than we believe is warranted, meaning that they will outperform duration-matched government equivalents without any changes in yield. Chart 12Within Global Fixed-Income, Hedged Chinese 10-Year Yields Are Relatively Attractive
Within Global Fixed-Income, Hedged Chinese 10-Year Yields Are Relatively Attractive
Within Global Fixed-Income, Hedged Chinese 10-Year Yields Are Relatively Attractive
Chart 13Unhedged Yield Spreads Predict Hedged Relative Performance Versus The US
Unhedged Yield Spreads Predict Hedged Relative Performance Versus The US
Unhedged Yield Spreads Predict Hedged Relative Performance Versus The US
For global fixed-income investors, Charts 12-14 present USD-hedged 10-year Chinese government yields versus the US and DM/DM ex-US, along with the historical relative return profile of USD-hedged Chinese bonds versus hedged and unhedged returns. In hedged space, Chinese 10-year government bond yields are modestly attractive: 2.2% versus 1.6% in the US and 1.8% in DM ex-US. China’s historically low yield beta to the overall level of global 10-year bond yields (Chart 15) suggests that Chinese yields should perform well in 2020 – a year where we expect global bond yields to drift higher as economic growth rebounds. Combined with relatively attractive valuation, this bodes well for the relative performance of Chinese debt versus DM equivalents. A low yield beta against a backdrop of drifting higher global yields implies that longer-maturity Chinese government bonds will outperform their DM equivalents. Chart 14Unhedged Yield Spreads Predict Hedged Relative Performance Versus DM
Unhedged Yield Spreads Predict Hedged Relative Performance Versus DM
Unhedged Yield Spreads Predict Hedged Relative Performance Versus DM
Chart 15China's Yield Beta Has Been Rising, But Is Still Japan-Like
China's Yield Beta Has Been Rising, But Is Still Japan-Like
China's Yield Beta Has Been Rising, But Is Still Japan-Like
We would also recommend longer-maturity Chinese government bonds in unhedged terms versus a USD-hedged global government bond portfolio. Chart 16 highlights that the relative return of this trade is strongly (negatively) linked to USD-CNY, and we expect further (albeit more modest) gains in RMB over the cyclical horizon. Chart 16Modest Further RMB Upside Means Unhedged Chinese Bonds Will Outperform
Modest Further RMB Upside Means Unhedged Chinese Bonds Will Outperform
Modest Further RMB Upside Means Unhedged Chinese Bonds Will Outperform
As a final point, investors should note that today’s report is part of a heightened focus on China’s fixed income market, in terms of both forecasting fixed income returns and analyzing the cyclical and structural implications of the increasing investability of China’s financial markets. More research on this topic is likely to come in 2020 and beyond: Stay Tuned! Jonathan LaBerge, CFA, Vice President Special Reports jonathanl@bcaresearch.com Footnotes 1 Please see US Bond Strategy Special Report "The Golden Rule Of Bond Investing," dated July 24, 2018, available at usbs.bcaresearch.com 2 Please see Global Fixed Income Strategy Special Report "The Global Golden Rule Of Bond Investing," dated September 25, 2018, available at gfis.bcaresearch.com 3 Please see China Investment Strategy Special Report "Seven Questions About Chinese Monetary Policy," dated February 22, 2018, available at cis.bcaresearch.com
Dear clients, Please note that in next week’s China Macro And Market Review, we will include a section explaining our view on the coronavirus outbreak and its economic as well as financial market implications. We maintain our overweight stance on both Chinese investable and A-share equities, over a tactical (0-3 months) and cyclical (6-12 months) time horizon. Please stay tuned. Jing Sima, China Strategist Highlights BCA’s “Golden Rule of Bond Investing” framework, which links developed economy government bond returns to central bank policy rate “surprises” versus market expectations, also works in China. The relationship between unexpected changes in China’s de facto short-term policy rate and government bond yields has been surprisingly strong over the past decade. Any additional easing by the PBoC this year is likely to be focused on reducing lending rates to the real economy, not interbank rates (which drive government bond yields). As such, yields at the short-end are likely to be flat until later this year at the earliest, whereas yields at the long-end are likely to move modestly higher, at most. The persistent historical gap between economic growth and bond yields in China makes it difficult to forecast the structural outlook for yields using conventional methods. To the extent that Chinese policymakers succeed at shifting the drivers of growth from investment to consumption, we believe that bond yields are more likely to structurally rise than fall. Over the coming 6-12 months, investors should underweight Chinese government bonds versus Chinese equities and onshore corporate bonds. Within a regional government bond portfolio, however, investors should overweight USD-hedged China versus US and developed markets ex-US, as well as in unhedged terms. Feature Last year’s inclusion of Chinese onshore government and policy bank bonds in the Bloomberg Barclays Global Aggregate Index was a significant milestone of China’s journey to internationalize its capital markets. Other bond benchmark providers have since followed suit, highlighting that the trend of increased passive exposure to Chinese assets is likely to continue. Over the past year, the bulk of the market discussion concerning the addition of China to the major bond indices has focused on estimating the size of potential capital inflows that could be triggered and the related impact on onshore bond yields. By contrast, comparatively little work has been done to analyze the core drivers of Chinese government bond yields, and how they compare to the factors that influence yields in the developed markets that dominate the bond indices. This Special Report attempts to fill a hole in the analysis of Chinese bonds. This Special Report attempts to fill that hole in the analysis of Chinese bonds. We look at the predictability of China’s government bond market through the lens of BCA’s “golden rule” framework, and find a surprisingly strong relationship between changes in China’s de facto short-term policy rate and government bond yields. We then present our cyclical (6-12 month) and secular outlooks for government yields given this relationship, and conclude by presenting four specific investment recommendations pertaining to China’s fixed-income market with two audiences in mind: mainland/onshore investors who are focused on returns in unhedged RMB terms, and global fixed-income investors who are primarily focused on hedged US-dollar regional bond exposure. The Golden Rule Of Bond Investing, With Chinese Characteristics In a July 2018 Special Report,1 BCA’s Chief US Bond Strategist, Ryan Swift, elegantly distilled the cyclical US government bond call into a simple question: During the next 12-months, will the Federal Reserve move interest rates by more or less than what is currently priced into the market? Chart 1The (US) Golden Rule Of Bond Investing In Practice
The (US) Golden Rule Of Bond Investing In Practice
The (US) Golden Rule Of Bond Investing In Practice
Ryan argued that a predictive framework for US Treasury returns built around the answer to this question has historically worked so well that it should be referred to as the “Golden Rule of bond investing” (Chart 1). In a follow-up report, our Global Fixed Income Strategy service confirmed that the Golden Rule also largely works in non-US developed market economies, with the exception of Japan due to the absence of any meaningful fluctuation in policy rates over the past two decades.2 The Golden Rule provides a very strong framework to aid fixed-income investors with their cyclical (i.e. 6-12 month) asset allocation decisions, by quantitatively linking government bond returns relative to cash – in other words, the excess return earned by taking duration risk - to policy rate “surprises” compared to what is discounted in shorter-term money markets. The practical application is that a decision to allocate to longer-maturity government bonds is reduced to a bet on whether a central bank will adjust policy rates by more or less than the market expects. The first question we address in this report is to what degree does the Golden Rule apply in China (in yield space rather than in return space), along with an explanation of any differences that may exist. However, we must first note why the Golden Rule of bond investing works, particularly in the US. The first reason is that there is a strong relationship between the US 3-month T-bill rate and Treasury yields of all other maturities. Conceptually, all fixed income investors have a choice when buying US government bonds: they can purchase a 3-month Treasury bill and simply perpetually roll over the position as it matures, or they can purchase a Treasury bond of a longer maturity. This means that yields on longer maturity Treasury bonds simply reflect investor expectations for the average 3-month T-bill rate over the life of the bond, plus some positive risk premium to compensate for the inherent uncertainty of the path and tendency of short-term yields. This helps explain the close link between cyclical changes in 3-month T-bill rates and yields on longer maturity Treasurys. Chart 2In The US, The 3-Month T-Bill Rate Perfectly Tracks The Fed Funds Rate
In The US, The 3-Month T-Bill Rate Perfectly Tracks The Fed Funds Rate
In The US, The 3-Month T-Bill Rate Perfectly Tracks The Fed Funds Rate
The second reason for the Golden Rule’s success is that there is a very tight relationship between the effective Fed funds rate and the 3-month T-bill rate. While it is the (higher) discount rate that is the theoretical no-arbitrage ceiling for the 3-month rate, in practice T-bill rates trade extremely close to the Fed funds rate (Chart 2). This means that Fed funds rate “surprises” (relative to traded market expectations) are akin to surprises in the 3-month rate, which in turn strongly influence the expected future path of short-term interest rates and thus yields on longer maturity Treasurys. In China, we noted in a February 2018 Special Report3 that the 7-day interbank repo rate is now the de jure short-term policy rate in China following the establishment of an interest rate corridor system in 2015. Chart 3 presents our first test of the Golden Rule in China (in yield space rather than in return space), by plotting the annual change in the level of Chinese government bond yields alongside the 7-day repo rate “surprise” over the past year from 2010 to the present. Here, we use the first principal component of zero coupon Chinese government bond yields to represent the average level of yields (rather than selecting a particular maturity), and we use the 12-month RMB swap rate (versus 7-day repo) to represent market expectations for the policy rate. The chart highlights that the fit is good, as measured by a 50% R-squared between the two series. However, deviations in the relationship do exist, with the most notable exception having occurred in 2017: Chinese government bond yields rose considerably more than what the annual surprise in the 7-day repo rate would have suggested. Chart 3In China, The Golden Rule Works Decently Well Using 7-Day Repo...
In China, The Golden Rule Works Decently Well Using 7-Day Repo...
In China, The Golden Rule Works Decently Well Using 7-Day Repo...
Chart 4...And Extremely Well Using 3-Month SHIBOR
...And Extremely Well Using 3-Month SHIBOR
...And Extremely Well Using 3-Month SHIBOR
Chart 4 helps resolve a good portion of the 2017 discrepancy, and clarifies the link between Chinese monetary policy and government bond yields. Chart 4 is similar to Chart 3, except that it replaces the 7-day repo rate surprise with that of 3-month SHIBOR (which trades very closely to the 3-month repo rate). The chart illustrates an even closer fit between the two series (with an R-squared close to 80%), and shows that the 3-month SHIBOR surprise does a meaningfully better job at explaining the 2017 rise in Chinese government bond yields. The Golden Rule of bond investing works surprisingly well in China. The fact that the annual surprise in 3-month SHIBOR has done a better job at predicting changes in bond yields over the past decade underscores that the 3-month repo rate is the de facto short-term policy rate in China, a point that we have made in several previous reports. We have noted that the spike in the 3-month/7-day repo rate spread that occurred in late-2016 and lasted until mid-2018 happened because of China’s crackdown on shadow banking activity. This crackdown caused a funding squeeze for China’s small & medium banks, which caused a material rise in lending rates and government bond yields. This episode highlights that future changes in the 3-month repo rate are likely to reflect both underlying changes in net liquidity provided to large commercial banks (measured by the 7-day repo rate), and any dislocations in the interbank market that have the potential to push up lending rates and government bond yields. Bottom Line: BCA’s “Golden Rule” framework, which links developed economy government bond returns to central bank policy rate “surprises” versus market expectations, works for China as well – using the correct measure of the PBOC policy rate. This provides a useful investment framework for Chinese government bonds, which are now significant part of major global bond market benchmarks. The Cyclical Outlook For Chinese Government Bond Yields Given the establishment of the relationship between Chinese short-term interbank rates and government bond yields detailed above, we are now able to more precisely discuss the likely cyclical trajectory of Chinese government bond yields as a function of Chinese monetary policy. Two opposing forces have the potential to affect China’s government bond market this year. The first, a stabilization and modest rebound in Chinese economic activity, may exert upward pressure on yields due to expectations of eventual policy tightening. The second, continued attempts by the PBoC to ease corporate lending rates, may exert downward pressure on yields as it will reflect not just easy but easier monetary conditions. Yields at the long-end are likely to move modestly higher this year, at most. For investors, the raises the obvious question of whether Chinese government bond yields are likely to move up, down, or trend sideways this year. In our view, yields at the short-end are likely to be flat until later this year at the earliest, whereas yields at the long-end are likely to move modestly higher, at most. Yields at the short-end of China’s government bond curve are likely to stay flat for most of this year. There are two reasons why yields at the short-end of China’s government bond curve are likely to stay flat for most of this year. The first is that the PBoC is generally a reactive central bank and has historically lagged a pickup in economic activity, as illustrated in Chart 5. The chart shows the historical path of 3-month SHIBOR in the year following a bottom in economic activity in 2009, 2012, and 2015, and makes it clear that there has been no precedent for a significant rise in interbank rates in the first nine months of an economic recovery. The 2012 episode did see a very sharp rise in 3-month SHIBOR once the PBoC shifted into tightening mode, but we doubt that this experience will be repeated again unless economic growth accelerates much more aggressively than we expect. The second reason why we expect yields at the short-end of the curve to remain muted this year is because any additional easing by the PBoC is likely to be focused on reducing corporate lending rates, not interbank rates. Chart 6 highlights that while there is a strong correlation between changes in Chinese government bond yields and average lending rates in the economy, the former leads the latter. In the past, this relationship has existed because changes in interbank rates have coincided with reductions in the now obsolete benchmark lending rate, with the former usually occurring earlier than the latter. But in a scenario where the PBoC reduces the loan prime rate (LPR) and keeps net banking sector liquidity roughly constant, the extremely tight relationship shown in Chart 4 suggests that short-term bond yields are unlikely to be affected by a reduction in lending rates. Any meaningful decline in short-term yields below short-term interbank rates would simply prompt banks to stop buying these bonds. Chart 5The PBoC Is Generally A Reactive Central Bank
The PBoC Is Generally A Reactive Central Bank
The PBoC Is Generally A Reactive Central Bank
Chart 6Average Lending Rates Lag Short-Term Bond Yields
Average Lending Rates Lag Short-Term Bond Yields
Average Lending Rates Lag Short-Term Bond Yields
Chart 7China's Yield Curve Is Generally Pro-Cyclical
China's Yield Curve Is Generally Pro-Cyclical
China's Yield Curve Is Generally Pro-Cyclical
Additional easing by the PBoC does have the potential to impact the long-end of the government bond curve if investors view these actions as a sign that interbank rates will remain low for some time. This view is reinforced by the fact that China’s yield curve is not particularly flat, and thus has room to move lower. However, Chart 7 also shows that China’s yield curve, defined here as the second principal component of zero coupon Chinese government bond yields, is positively correlated with the relative performance of investable Chinese equities. This suggests that there is a procyclical element to the curve. We suspect that this procyclical element will dominate a potential decline in expectations for future short-term interest rates, but that yields at the long-end are likely to move modestly higher this year, at most. Bottom Line: Any additional easing by the PBoC this year is likely to be focused on reducing lending rates to the real economy, not interbank rates (which drive government bond yields). As such, yields at the short-end are likely to be flat until later this year at the earliest, whereas yields at the long-end are likely to move modestly higher, at most. The Secular Outlook For Chinese Government Bond Yields A common approach to forecasting the likely structural trend for nominal government bond yields is to estimate the trajectory of real long-term potential output growth and to add the monetary authority’s inflation target. This framework is based on the idea that interest rates are in equilibrium when the cost of borrowing is roughly equal to nominal income growth, a condition that results in no change in the burden to service existing debt. Chart 8China's Potential Growth Is Likely To Trend Lower...
China's Potential Growth Is Likely To Trend Lower...
China's Potential Growth Is Likely To Trend Lower...
Based on this framework, we would expect Chinese government bond yields to trend down over time, or possibly flat if the PBoC were to tolerate higher inflation over the coming decade. Chart 8 illustrates the IMF’s forecast of falling real potential growth in China over the coming several years, which is consistent with a shift in the composition of growth from investment to consumption as well as China’s looming demographic crisis. But Chart 9highlights an obvious problem with applying this framework to forecast the secular trend in Chinese government bond yields: over the past decade, yields have persistently averaged below actual nominal GDP growth, both in China and in the developed world. In the latter case, it is an open question whether this will continue to be true in the future, but in China’s case it is clear that government bond yields have little connection (in magnitude) to the pace of GDP growth. This reflects the longstanding strategy of Chinese policymakers to promote investment via persistently low interest rates, as has occurred in other manufacturing and export-oriented Asian economies (Chart 10). Chart 9...But Bond Yields Are Well Below GDP Growth, Just Like In Developed Markets
...But Bond Yields Are Well Below GDP Growth, Just Like In Developed Markets
...But Bond Yields Are Well Below GDP Growth, Just Like In Developed Markets
Chart 10In Industrial Asian Economies, Low Bond Yields Are A Policy Choice
In Industrial Asian Economies, Low Bond Yields Are A Policy Choice
In Industrial Asian Economies, Low Bond Yields Are A Policy Choice
The persistent historical gap between economic growth and bond yields in China makes it difficult to forecast the structural outlook for yields using conventional methods, and largely limits us to inference. To the extent that Chinese policymakers succeed at shifting the drivers of growth from investment to consumption, bond yields are more likely to rise than fall over time. This is because as long as interest rates remain well below the pace of income growth, the incentive to excessively borrow (and invest) is likely to persist. Chart 11China Needs Higher Interest Rates, But Only To A Point
China Needs Higher Interest Rates, But Only To A Point
China Needs Higher Interest Rates, But Only To A Point
However, even in a scenario where Chinese government bond yields structurally trend higher, we expect the rise to be modest. Chart 11 highlights that China’s “private sector” debt service ratio is extremely elevated, underscoring that the country’s ability to tolerate significantly higher bond yields is not strong. In addition, since 2015, China’s debt service ratio has been mostly flat despite rising a rising debt-to-GDP ratio, which has been achieved through lower short-term interest rates. To the extent that policymakers fail to make meaningful progress in shifting China’s growth drivers away from investment over the coming few years, lower (potentially sharply lower) bond yields would appear to be all but inevitable to cope with what would become a permanently growing drag on economic activity from the servicing of debt. For now, we would characterize this scenario as a risk to our base case view, but it is a risk that we will be closely monitoring over the coming years. Bottom Line: The persistent gap between Chinese nominal GDP growth and government bond yields is likely contributing to the problem of excessive leveraging. To the extent that Chinese policymakers succeed at shifting the drivers of growth from investment to consumption, bond yields are more likely to structurally rise than fall. Investment Conclusions Our analysis above points to four recommendations for investors over the coming year: Overweight Chinese stocks versus Chinese government bonds in RMB and USD terms Overweight Chinese onshore corporate bonds versus duration-matched Chinese government bonds in RMB terms Overweight 7-10 year USD-hedged Chinese government bonds versus their US and developed market (DM) counterparts For offshore US dollar-based investors, long 7-10 year Chinese government bonds in unhedged terms Regarding the first two recommendations, our view that yields are likely to be flat at the short-end and modestly higher at the long-end suggests that investors can expect total returns on the order of 2-3% from Chinese government bonds this year. Barring a major and lasting economic slowdown from the 2019-nCoV outbreak, we expect Chinese domestic and investable equities to outperform government securities over the coming 6-12 months. Onshore corporate bonds have a similar outlook: onshore spreads are pricing in (massively) higher default losses than we believe is warranted, meaning that they will outperform duration-matched government equivalents without any changes in yield. Chart 12Within Global Fixed-Income, Hedged Chinese 10-Year Yields Are Relatively Attractive
Within Global Fixed-Income, Hedged Chinese 10-Year Yields Are Relatively Attractive
Within Global Fixed-Income, Hedged Chinese 10-Year Yields Are Relatively Attractive
Chart 13Unhedged Yield Spreads Predict Hedged Relative Performance Versus The US
Unhedged Yield Spreads Predict Hedged Relative Performance Versus The US
Unhedged Yield Spreads Predict Hedged Relative Performance Versus The US
For global fixed-income investors, Charts 12-14 present USD-hedged 10-year Chinese government yields versus the US and DM/DM ex-US, along with the historical relative return profile of USD-hedged Chinese bonds versus hedged and unhedged returns. In hedged space, Chinese 10-year government bond yields are modestly attractive: 2.2% versus 1.6% in the US and 1.8% in DM ex-US. China’s historically low yield beta to the overall level of global 10-year bond yields (Chart 15) suggests that Chinese yields should perform well in 2020 – a year where we expect global bond yields to drift higher as economic growth rebounds. Combined with relatively attractive valuation, this bodes well for the relative performance of Chinese debt versus DM equivalents. A low yield beta against a backdrop of drifting higher global yields implies that longer-maturity Chinese government bonds will outperform their DM equivalents. Chart 14Unhedged Yield Spreads Predict Hedged Relative Performance Versus DM
Unhedged Yield Spreads Predict Hedged Relative Performance Versus DM
Unhedged Yield Spreads Predict Hedged Relative Performance Versus DM
Chart 15China's Yield Beta Has Been Rising, But Is Still Japan-Like
China's Yield Beta Has Been Rising, But Is Still Japan-Like
China's Yield Beta Has Been Rising, But Is Still Japan-Like
We would also recommend longer-maturity Chinese government bonds in unhedged terms versus a USD-hedged global government bond portfolio. Chart 16 highlights that the relative return of this trade is strongly (negatively) linked to USD-CNY, and we expect further (albeit more modest) gains in RMB over the cyclical horizon. Chart 16Modest Further RMB Upside Means Unhedged Chinese Bonds Will Outperform
Modest Further RMB Upside Means Unhedged Chinese Bonds Will Outperform
Modest Further RMB Upside Means Unhedged Chinese Bonds Will Outperform
As a final point, investors should note that today’s report is part of a heightened focus on China’s fixed income market, in terms of both forecasting fixed income returns and analyzing the cyclical and structural implications of the increasing investability of China’s financial markets. More research on this topic is likely to come in 2020 and beyond: Stay Tuned! Jonathan LaBerge, CFA, Vice President Special Reports jonathanl@bcaresearch.com Footnotes 1 Please see US Bond Strategy Special Report "The Golden Rule Of Bond Investing," dated July 24, 2018, available at usbs.bcaresearch.com 2 Please see Global Fixed Income Strategy Special Report "The Global Golden Rule Of Bond Investing," dated September 25, 2018, available at gfis.bcaresearch.com 3 Please see China Investment Strategy Special Report "Seven Questions About Chinese Monetary Policy," dated February 22, 2018, available at cis.bcaresearch.com Cyclical Investment Stance Equity Sector Recommendations
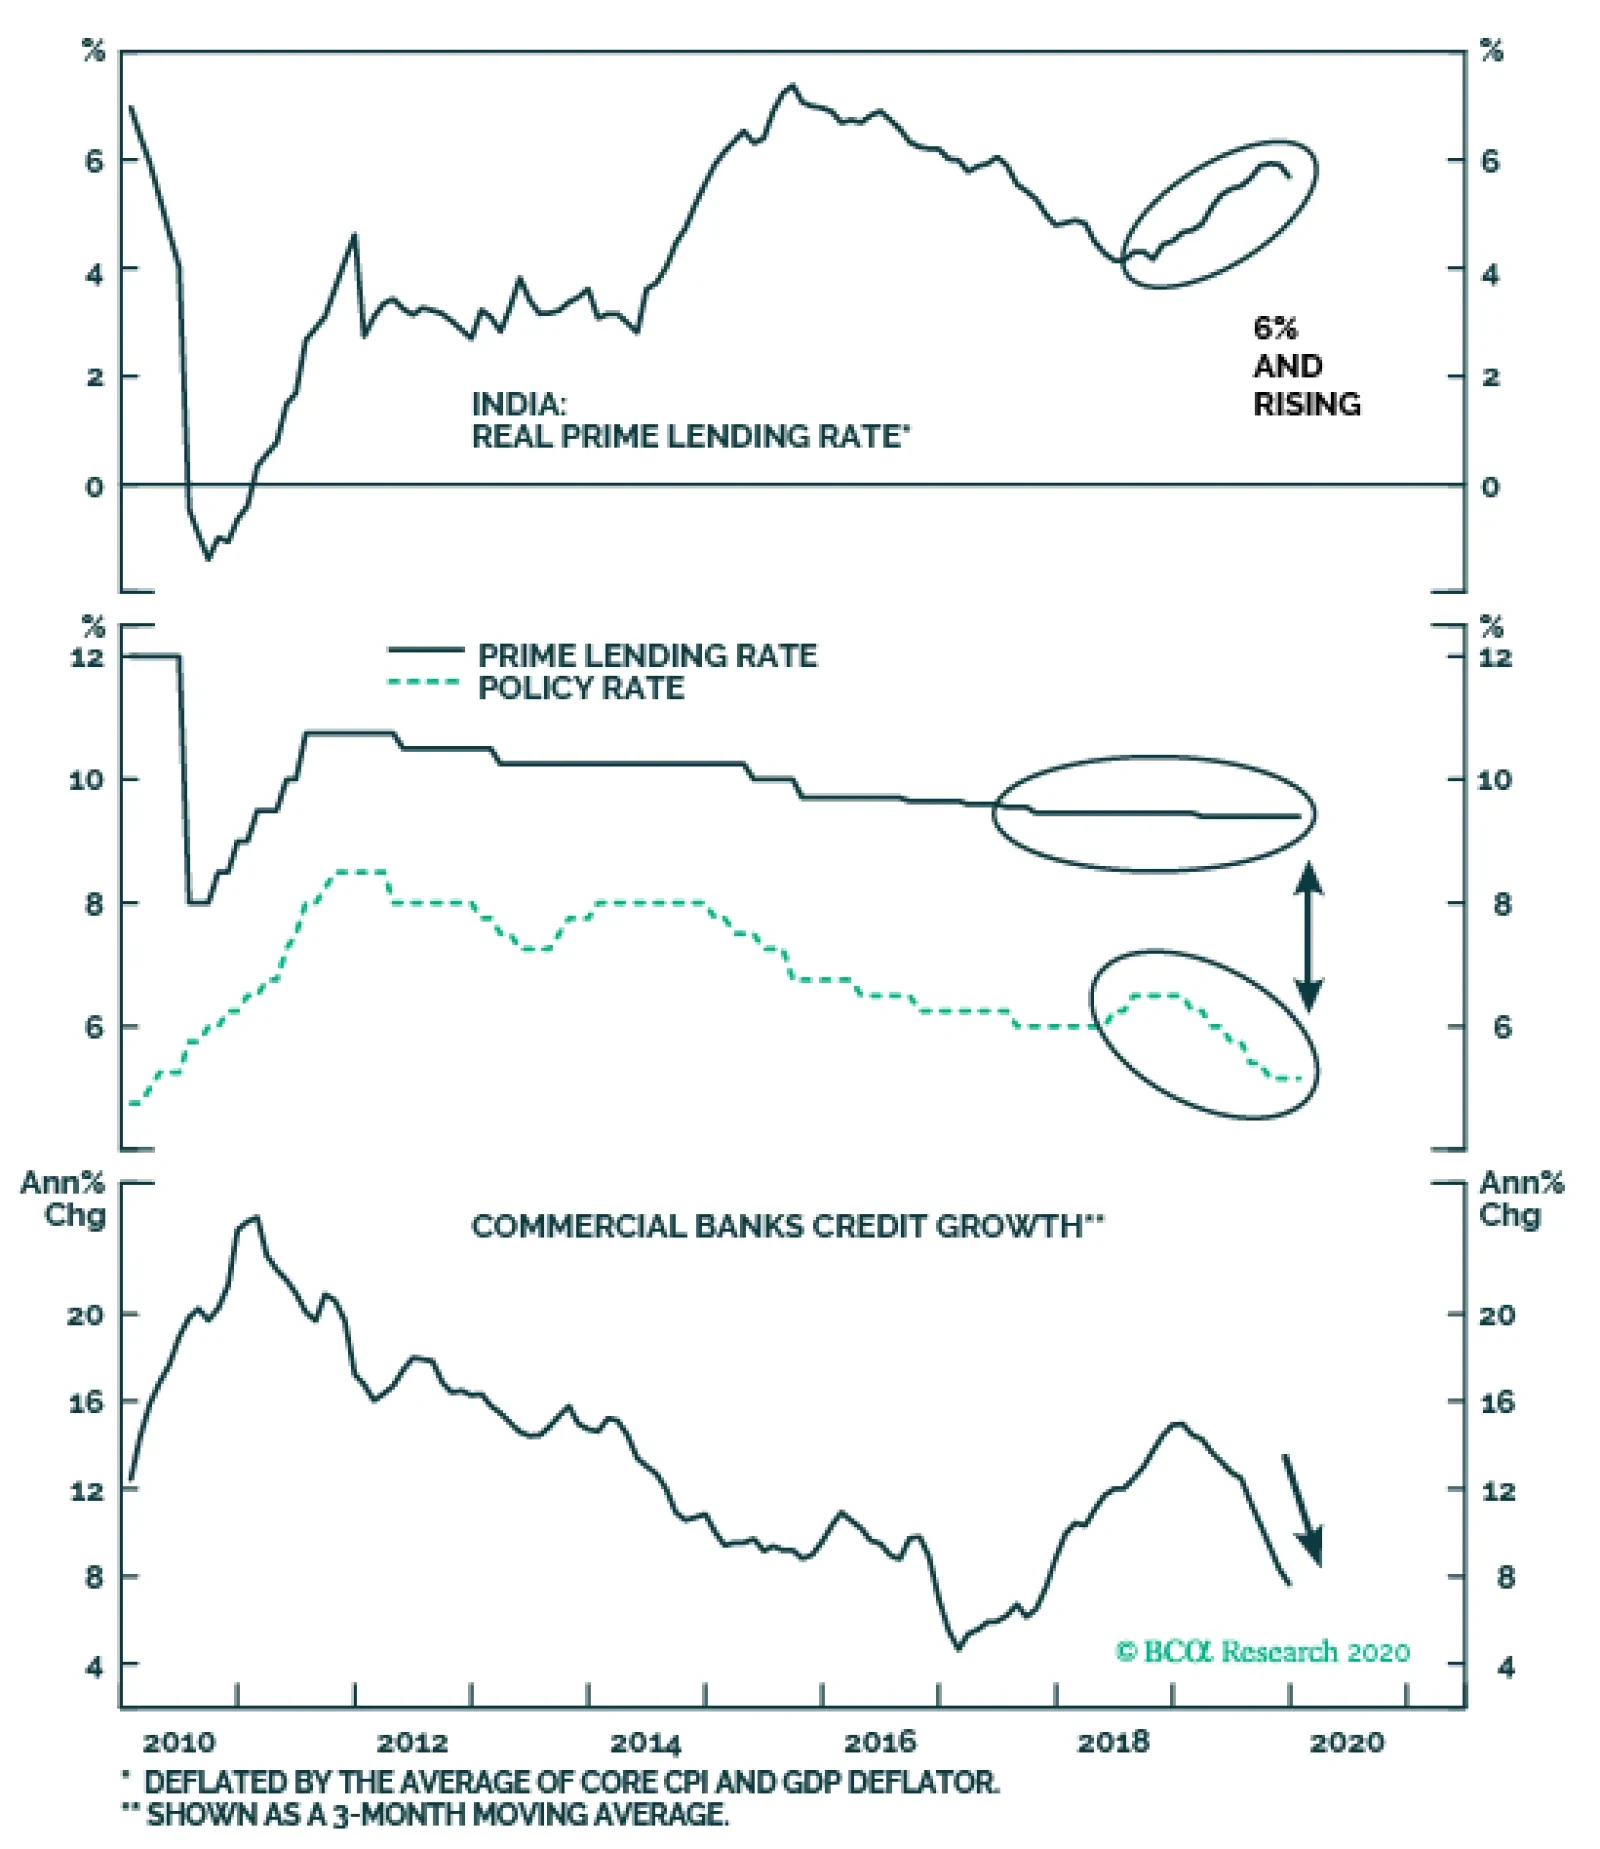
The entire Indian economy is suffering from high real borrowing costs. The monetary policy transmission mechanism has not been working effectively in India. Even though the central bank has cut its policy rate by 135 basis points in 2019, the prime lending…
Highlights Most central banks still consider economic risks asymmetrical to the downside. This means that even if global growth rebounds in earnest, policy is likely to stay pat over the next three to six months. The conclusion is that relative growth fundamentals rather than central bank policy will likely drive FX price action in the next few months. Our bias remains that the growth impulse will be strongest outside the US during the first half of this year. Stay short the DXY index. The BoJ’s inaction this week makes long yen bets cheap insurance against a rise in FX volatility. Remain short USD/JPY and go short CHF/JPY. The pound remains a buy on dips but will likely underperform the euro over the next few months. EUR/GBP should touch 0.88. The BoC kept rates on hold, but erred on the dovish side, in line with our expectations. Stay short CAD/NOK and long AUD/CAD. We were stopped out of our long NOK/SEK trade for a profit of 1.8%. We will look to rebuy the cross at lower levels. Feature Chart I-1Currency Markets Have Priced In A Benign Recovery
Currency Markets Have Priced In A Benign Recovery
Currency Markets Have Priced In A Benign Recovery
The powerful bounce in global equity markets since the August lows has pushed many stock indices into overbought territory. Chart I-1 shows that the rise in global stocks has already discounted an improvement in global manufacturing in order of magnitude similar to the 2012 and 2016 episodes. However, currency markets have been discounting a much more benign outcome (bottom panel). The divergence between currency and equity performance is a marked change from what has prevailed during past cycles. For example, trough to peak, AUD/JPY, a key barometer of greed versus fear in currency markets, appreciated 40% during the 2012 episode, and 25% in 2016-2017, along with rising equity prices. The performance of even more high-octane currency pairs such as the RUB/JPY, the ZAR/JPY, or even the BRL/JPY, was explosive. More muted currency action this time around therefore calls into question the durability of this recovery. Perhaps given that equities are long-duration assets, it is quite plausible that the drop in interest rates in 2019 has increased their relative appeal, boosting nominal values. While that makes sense, most bond markets have also seen higher yields over the past few months, making this explanation questionable. Alternatively, the easing in trade tensions and/or the Federal Reserve’s liquidity injections may have rekindled animal spirits among domestic investors. Or perhaps, a synchronized recovery has narrowed G10 growth differentials, muting currency performance in the process but boosting share prices. The rise in global stocks has already discounted an improvement in global manufacturing. However, currency markets have been discounting a much more benign outcome. Either way, the resolution to this dissonance will be either through marked improvement in global economic data in the coming months (which will support pro-cyclical currencies), or a period of indigestion for stock markets (which will lift volatility) – or a combination of both. At a minimum, this suggests tweaking currency portfolios in anticipation of these dynamics. On Volatility And The Dollar Everyone understands that currency markets are about relative trends. Therefore, the implicit assumption that the dollar will weaken as global growth picks up is that the epicenter of this recovery will be outside the US. Chart I-2 shows that economic data is not yet surprising to the upside outside the US, even though there has been marked improvement on a rate-of-change basis. Beneath the surface, the strongest data surprises have been in the euro area, Switzerland, New Zealand and Australia, while disappointments have been in Canada and the UK. In hindsight, the chart also highlights why the Canadian dollar was the best performing G10 currency in 2019, while the Swedish krona was the weakest. Chart I-2Growth Dispersion Has Fallen
Growth Dispersion Has Fallen
Growth Dispersion Has Fallen
The drop in economic dispersion has pushed currency volatility near record lows (Chart I-3). Every seasoned investor does and should pay attention to low volatility. This is because what destroys portfolios is not exuberance, but complacency. This might sound like a tautology, but during the last three episodes of volatility dropping to these levels, the dollar soared and pro-cyclical currencies suffered severe losses. Everyone remembers 1997-1998, 2007-2008 and 2014-2015. Will this time be the same? While a rise in volatility is usually associated with a higher dollar, there are three key differences this time around. First, real rates turned positive in the US relative to its G10 counterparts in 2014 (Chart I-4). This meant the US dollar, which has typically been a funding currency (not least because it is a reserve currency), became the object of carry trades. It is a fair contention that any capital that wanted to find its way into US Treasurys has had more than five years of positive real carry to do so. With real relative yields in the US now rolling over, which way will capital gravitate? Chart I-3Volatility Near Record Lows
Volatility Near Record Lows
Volatility Near Record Lows
Chart I-4Real Rates Lower In The US
Real Rates Lower In The US
Real Rates Lower In The US
The dollar has been in a bull market since 2011, which has shifted valuations towards expensive quartiles. This is a key difference from previous low-volatility episodes when the dollar was much earlier into bull-market territory (Chart I-5). The dollar tends to run in long cycles, and a spike in volatility can either mark the beginning or the end of a cycle. As we have emphasized numerous times in previous reports, being long the US dollar is a consensus trade. Our primary basis for this is CFTC positioning data. However, a timelier leading indicator to watch is the gold-to-bond ratio. Currencies are about confidence, and a key measure of confidence in the US dollar is the total return in the US 10-year Treasury compared to gold bullion, which has collapsed (Chart I-6). The budget deficit in the US is about to explode, while it was low and falling during prior dollar riot points. Chart I-5The Dollar Is Expensive
The Dollar Is Expensive
The Dollar Is Expensive
Chart I-6Tug Of War Between US Bonds And Gold
Tug Of War Between US Bonds And Gold
Tug Of War Between US Bonds And Gold
More importantly, currency markets are likely to gyrate with relative fundamentals. The slowdown in the global economy was driven by the manufacturing sector, so it is fair to assume that this is the part of the economy that is ripe for mean reversion. Historically, cyclical swings in most economies tend to be driven by manufacturing and exports rather than services (and consumption). More specifically, the currencies that have borne the brunt of the manufacturing slowdown should logically be the ones to experience the quickest reversals. This is already being manifested in a very steep rise in their bond yields vis-à-vis those in the US. For example, yields in Norway, Sweden, Switzerland and Japan have risen significantly versus those in the US since the bottom. A synchronized recovery in global growth will go a long way in further eroding the US’ yield advantage. Currencies are about confidence, and a key measure of confidence in the US dollar is the total return in the US 10-year Treasury compared to gold bullion. Bottom Line: Remain short the DXY index with an initial target of 90 and a stop loss at 100. The Yen As Portfolio Insurance Should our thesis that the dollar is in a downtrend for 2020 be correct, it is unlikely to occur in a straight line. This argues for having some portfolio insurance. The Bank of Japan’s inaction this week may have been a red herring, since one of the most potent moves in asset markets in recent months has been the +130-basis-point move in favor of Japanese yields (Chart I-7). The gap between the USD/JPY and real rates has opened up a rare arbitrage opportunity. Should a selloff in global risk assets materialize, the yen will strengthen. On the other hand, if global growth does eventually accelerate, the yen could weaken on its crosses but strengthen vis-à-vis the dollar. This keeps short USD/JPY bets in an enviable “heads I win, tails I do not lose too much” position. The rise in Japanese yields has been driven by three key pivotal developments: For most of the past five years, the BoJ was one of the most aggressive central banks in terms of asset purchases. This was a huge catalyst for a downturn in the trade-weighted yen (Chart I-8). With a renewed expansion in the Fed’s balance sheet, monetary policy is tightening on a relative basis in Japan. Total annual asset purchases by the BoJ are currently running at about ¥20 trillion, while JGB purchases are running at ¥15 trillion. This is a far cry from the central bank’s soft target of ¥80 trillion, and unlikely to change anytime soon. Chart I-7Japanese Bond Yields Have Surged
Japanese Bond Yields Have Surged
Japanese Bond Yields Have Surged
Chart I-8The Yen And QE
The Yen And QE
The Yen And QE
Movements in the yen are as influenced by external conditions as what is happening domestically, given Japan’s huge export sector. Credit default swap spreads of cyclical sectors are collapsing to new lows, symptomatic of an improving profit outlook (Chart I-9). This suggests it is the growth component driving Japanese yields higher (Japanese CPI swaps have indeed been flat). This also mirrors the recent outperformance of Asian cyclical sectors relative to defensive ones. The Abe government announced a huge fiscal package last year, in part driven by the disastrous typhoons as well as the upcoming Olympics. This allowed the BoJ to upgrade its growth forecasts in its latest policy minutes. The relative performance of construction and engineering stocks are an important barometer for when the funds are flowing into the economy (Chart I-10). Chart I-9Default Risk Easing In Japan
Default Risk Easing In Japan
Default Risk Easing In Japan
Chart I-10Fiscal Stimulus And Construction Stocks
Fiscal Stimulus And Construction Stocks
Fiscal Stimulus And Construction Stocks
As a defensive currency, the yen tends to weaken as global growth improves, given it is usually used to fund carry trades. That said, our contention is that the yen will surely weaken at the crosses, but could still strengthen versus the dollar. As mentioned above, one catalyst is the divergence from the traditional relationship with real rates. More importantly, the USD/JPY and the DXY tend to have a positive correlation, because the dollar drives the yen most of the time. Meanwhile, net short positioning in the yen versus the dollar makes it attractive from a contrarian standpoint (Chart I-11). Given extremely low volatility, this places short USD/JPY bets as an attractive vehicle to play a rise in volatility. Chart I-11Investors Are Short The Yen
Investors Are Short The Yen
Investors Are Short The Yen
More conservative investors could go short CHF/JPY. The recent rise in the Swiss franc threatens the nascent recovery in inflation (Chart I-12), while weakness in the Japanese yen will help lift domestic tradeable goods prices. This puts more pressure on the Swiss National Bank rather than the BoJ. Meanwhile, as a safe haven, the yen is cheaper than the franc. This is confirmed by many of our in-house models. In simple terms, relative inflation with the US has been lower in Japan over the last several decades, but the franc has been stronger. In simple terms, relative inflation with the US has been lower in Japan over the last several decades, but the franc has been stronger (Chart I-13). Meanwhile, over the last two years, a rise in volatility has benefited the yen more than the franc. Chart I-12Strong Franc Is A Headwind For Swiss Inflation
Strong Franc Is A Headwind For Swiss Inflation
Strong Franc Is A Headwind For Swiss Inflation
Chart I-13The Yen Is Cheaper ##br##Insurance
The Yen Is Cheaper Insurance
The Yen Is Cheaper Insurance
Bottom Line: The yen is the most attractive safe-haven currency at the moment. Remain short USD/JPY and sell CHF/JPY. Housekeeping We were stopped out of our long NOK/SEK trade for a profit of 1.8%. We will look to rebuy this cross at lower levels. The trade is mostly about carry, and we are both positive on the NOK and SEK. This makes market timing important. NOK/SEK at 1.04 will be attractive. There were no new insights from the Norges bank this week, in the context of all the central bank meetings. We will also be looking to opportunistically buy the pound, but buying EUR or GBP volatility might be a better bet. For now, despite the robust labor report, economic surprises in the UK remain negative (Chart I-14). Stay tuned. Chart I-14GBP Is Vulnerable
GBP Is Vulnerable
GBP Is Vulnerable
Chester Ntonifor Foreign Exchange Strategist chestern@bcaresearch.com Currencies U.S. Dollar Chart II-1USD Technicals 1
USD Technicals 1
USD Technicals 1
Chart II-2USD Technicals 2
USD Technicals 2
USD Technicals 2
Recent data in the US have been mixed: Industrial production fell by 1% year-on-year in December. The preliminary Michigan consumer sentiment index fell slightly to 99.1 in January. MBA mortgage applications fell by 1.2% for the week ended January 17th. However, existing home sales surprised to the upside, rising 3.6% month-on-month in December. Chicago Fed national activity index fell to -0.35 from 0.41 in December. Initial jobless claims increased to 211K for the week ended January 17th, better than expectations. The DXY index increased by 0.4% this week. There are growing concerns over whether China's coronavirus would significantly drag down global growth. While this is a hiccup in the short term, we remain positive and believe that global growth will accelerate this year on easy financial conditions and faded trade war risks. Report Links: On Oil, Growth And The Dollar - January 10, 2020 Updating Our Balance Of Payments Monitor - November 29, 2019 Place A Limit Sell On DXY At 100 - November 15, 2019 The Euro Chart II-3EUR Technicals 1
EUR Technicals 1
EUR Technicals 1
Chart II-4EUR Technicals 2
EUR Technicals 2
EUR Technicals 2
Recent data in the euro area have been mostly positive: The current account balance came in at €33.9 billion in November. Headline and core inflation were both unchanged at 1.3% year-on-year respectively in December. The ZEW economic sentiment survey soared to 25.6 from 11.2 in January. The euro fell by 0.8% against the US dollar this week. On Thursday, the ECB maintained interest rates at -0.5%. The key takeaway from the ECB is that they are grappling with a review of their monetary policy objective in a manner that might increase accommodation. A switch to an explicit 2% inflation target and/or including a climate change objective into quantitative easing decisions heralds a much more dovish ECB. We are tightening our stop on long EUR/CAD to 1.42. Report Links: Updating Our Balance Of Payments Monitor - November 29, 2019 On Money Velocity, EUR/USD And Silver - October 11, 2019 A Few Trade Ideas - Sept. 27, 2019 Japanese Yen Chart II-5JPY Technicals 1
JPY Technicals 1
JPY Technicals 1
Chart II-6JPY Technicals 2
JPY Technicals 2
JPY Technicals 2
Recent data in Japan have been negative: Industrial production fell by 8.2% year-on-year in November. The trade deficit widened to ¥152.5 billion in December. Imports and exports both fell by 4.9% and 6.3% year-on-year, respectively. All industry activity index increased by 0.9% month-on-month in November. Both the coincident index and the leading economic index fell to 94.7 and 90.8, respectively in November. The Japanese yen appreciated by 0.3% against the US dollar this week. The BoJ kept interest rates unchanged, in line with expectations. More importantly, the outlook report revised the growth forecast upward to 0.9% from 0.7% for the fiscal year 2020. Moreover, the BoJ revised down the inflation forecast by 10 bps due to lower crude oil prices. Please refer to our front section this week for a more in-depth analysis on the Japanese yen. Report Links: Updating Our Balance Of Payments Monitor - November 29, 2019 Signposts For A Reversal In The Dollar Bull Market - November 1, 2019 A Few Trade Ideas - Sept. 27, 2019 British Pound Chart II-7GBP Technicals 1
GBP Technicals 1
GBP Technicals 1
Chart II-8GBP Technicals 2
GBP Technicals 2
GBP Technicals 2
Recent data in the UK have been positive: Retail sales grew by 0.9% year-on-year in December. The Rightmove house price index increased by 2.7% year-on-year in January. The ILO unemployment rate was unchanged at 3.8% in November. Average earnings grew by 3.2% year-on-year in November. This followed a 3-month improvement in employment of 208K, after what had been a dismal employment report for most of 2019. The British pound appreciated by 0.7% against the US dollar this week. The biggest volatility in European currencies in the next few weeks is likely to emerge in the EUR/GBP cross. European economic data has had the best positive surprises in the last few weeks, in part due to base effects. However, the ECB’s transcript this week suggests leaning against any currency strength. In the UK, the pound will still trade partly on politics for now. Buying GBP and EUR volatility looks like a good bet. Report Links: Updating Our Balance Of Payments Monitor - November 29, 2019 A Few Trade Ideas - Sept. 27, 2019 United Kingdom: Cyclical Slowdown Or Structural Malaise? - Sept. 20, 2019 Australian Dollar Chart II-9AUD Technicals 1
AUD Technicals 1
AUD Technicals 1
Chart II-10AUD Technicals 2
AUD Technicals 2
AUD Technicals 2
Recent data in Australia have been positive: The Westpac consumer confidence index fell by 1.8% in January. Consumer inflation expectations increased to 4.7% from 4% in January. 28.9K new jobs were created in December, above consensus. This was a combination of 29.2K part-time jobs but a loss of 0.3K full-time jobs. The participation rate was unchanged at 66% in December, while the unemployment rate fell further to 5.1%. The Australian dollar fell by 0.6% against the US dollar this week. The positive jobs report placed a bid under AUD, but that quickly dissipated as the coronavirus scare started to dominate headlines. We discussed AUD in depth last week and are buyers at 68 cents. Our primary rationale is that this is a potent contrarian bet. Report Links: On AUD And CNY - January 17, 2020 Updating Our Balance Of Payments Monitor - November 29, 2019 A Contrarian View On The Australian Dollar - May 24, 2019 New Zealand Dollar Chart II-11NZD Technicals 1
NZD Technicals 1
NZD Technicals 1
Chart II-12NZD Technicals 2
NZD Technicals 2
NZD Technicals 2
Recent data in New Zealand have been negative: Visitor arrivals fell by 3.5% year-on-year in November. Net migration fell to 2610 from 3400 in November. The performance services index fell to 51.9 from 52.9 in December. The New Zealand dollar fell by 0.5% against the US dollar this week. While we believe that the kiwi dollar will outperform the US dollar this year amid improving global growth, domestic constraints including decreasing net migration might limit upside potential. Stay long AUD/NZD and SEK/NZD. Report Links: Updating Our Balance Of Payments Monitor - November 29, 2019 Place A Limit Sell On DXY At 100 - November 15, 2019 USD/CNY And Market Turbulence - August 9, 2019 Canadian Dollar Chart II-13CAD Technicals 1
CAD Technicals 1
CAD Technicals 1
Chart II-14CAD Technicals 2
CAD Technicals 2
CAD Technicals 2
Recent data in Canada have been soft: Manufacturing sales fell by 0.6% month-on-month in November. Headline inflation was unchanged at 2.2% year-on-year in December. Core inflation however, fell to 1.7% from 1.9% in December. New house prices grew by 0.1% year-on-year in December. The Canadian dollar fell by 0.8% against the US dollar this week. On Wednesday, the BoC decided to put interest rates on hold, while opening the door for possible rate cuts later this year if the Canadian data disappointed. In short, like most other central banks, the BoC is data dependent. Our story for CAD is simple – if the epicenter of a growth rebound is outside the US, CAD will underperform its antipodean counterparts. Stay long AUD/CAD. Report Links: The Loonie: Upside Versus The Dollar, But Downside At The Crosses Updating Our Balance Of Payments Monitor - November 29, 2019 Making Money With Petrocurrencies - November 8, 2019 Swiss Franc Chart II-15CHF Technicals 1
CHF Technicals 1
CHF Technicals 1
Chart II-16CHF Technicals 2
CHF Technicals 2
CHF Technicals 2
There have been scant data from Switzerland this week: Producer prices fell by 1.7% year-on-year in December, compared with a decrease of 2.5% the previous month. Money supply (M3) grew by 0.7% year-on-year in December. The Swiss franc has been more or less flat against the US dollar this week. We continue to favor the Swiss franc as global risks persist, including concerns about the coronavirus. However, as discussed in the front section of this report, the yen is a better hedge than the franc at the current juncture. Report Links: Updating Our Balance Of Payments Monitor - November 29, 2019 Notes On The SNB - October 4, 2019 What To Do About The Swiss Franc? - May 17, 2019 Norwegian Krone Chart II-17NOK Technicals 1
NOK Technicals 1
NOK Technicals 1
Chart II-18NOK Technicals 2
NOK Technicals 2
NOK Technicals 2
There was scant data out of Norway this week: The Labor Force Survey recorded an increase in the unemployment rate to 4% in November. The Norwegian krone fell by 1.3% against the US dollar this week amid lower energy prices. On Thursday, the Norges Bank kept interest rates on hold at 1.5%, as widely expected. Moreover, the Bank Governor Øystein Olsen said that "The Committee’s current assessment of the outlook and the balance of risks suggests that the policy rate will most likely remain at the present level in the coming period," implying no change in the policy rate in the near-term. This suggests that going forward, relative fundamentals rather than policy decisions will dictate NOK’s path. Our bias is that a valuation cushion offers a margin of safety for long NOK positions. Remain short USD/NOK and CAD/NOK. Report Links: On Oil, Growth And The Dollar - January 10, 2020 Updating Our Balance Of Payments Monitor - November 29, 2019 Making Money With Petrocurrencies - November 8, 2019 Swedish Krona Chart II-19SEK Technicals 1
SEK Technicals 1
SEK Technicals 1
Chart II-20SEK Technicals 2
SEK Technicals 2
SEK Technicals 2
There was scant data out of Sweden this week: After rising from 6% to 6.8% in November, the unemployment rate fell back to 6% in December. The Swedish krona fell by 0.2% against the US dollar this week. Going forward, improving global growth, diminished trade tensions, and fewer concerns about a near-term recession all underpin the Swedish economy and the krona. SEK is the most potent G10 cross to play a global manufacturing rebound. Report Links: Updating Our Balance Of Payments Monitor - November 29, 2019 Where To Next For The US Dollar? - June 7, 2019 Balance Of Payments Across The G10 - February 15, 2019 Trades & Forecasts Forecast Summary Core Portfolio Tactical Trades Limit Orders Closed Trades
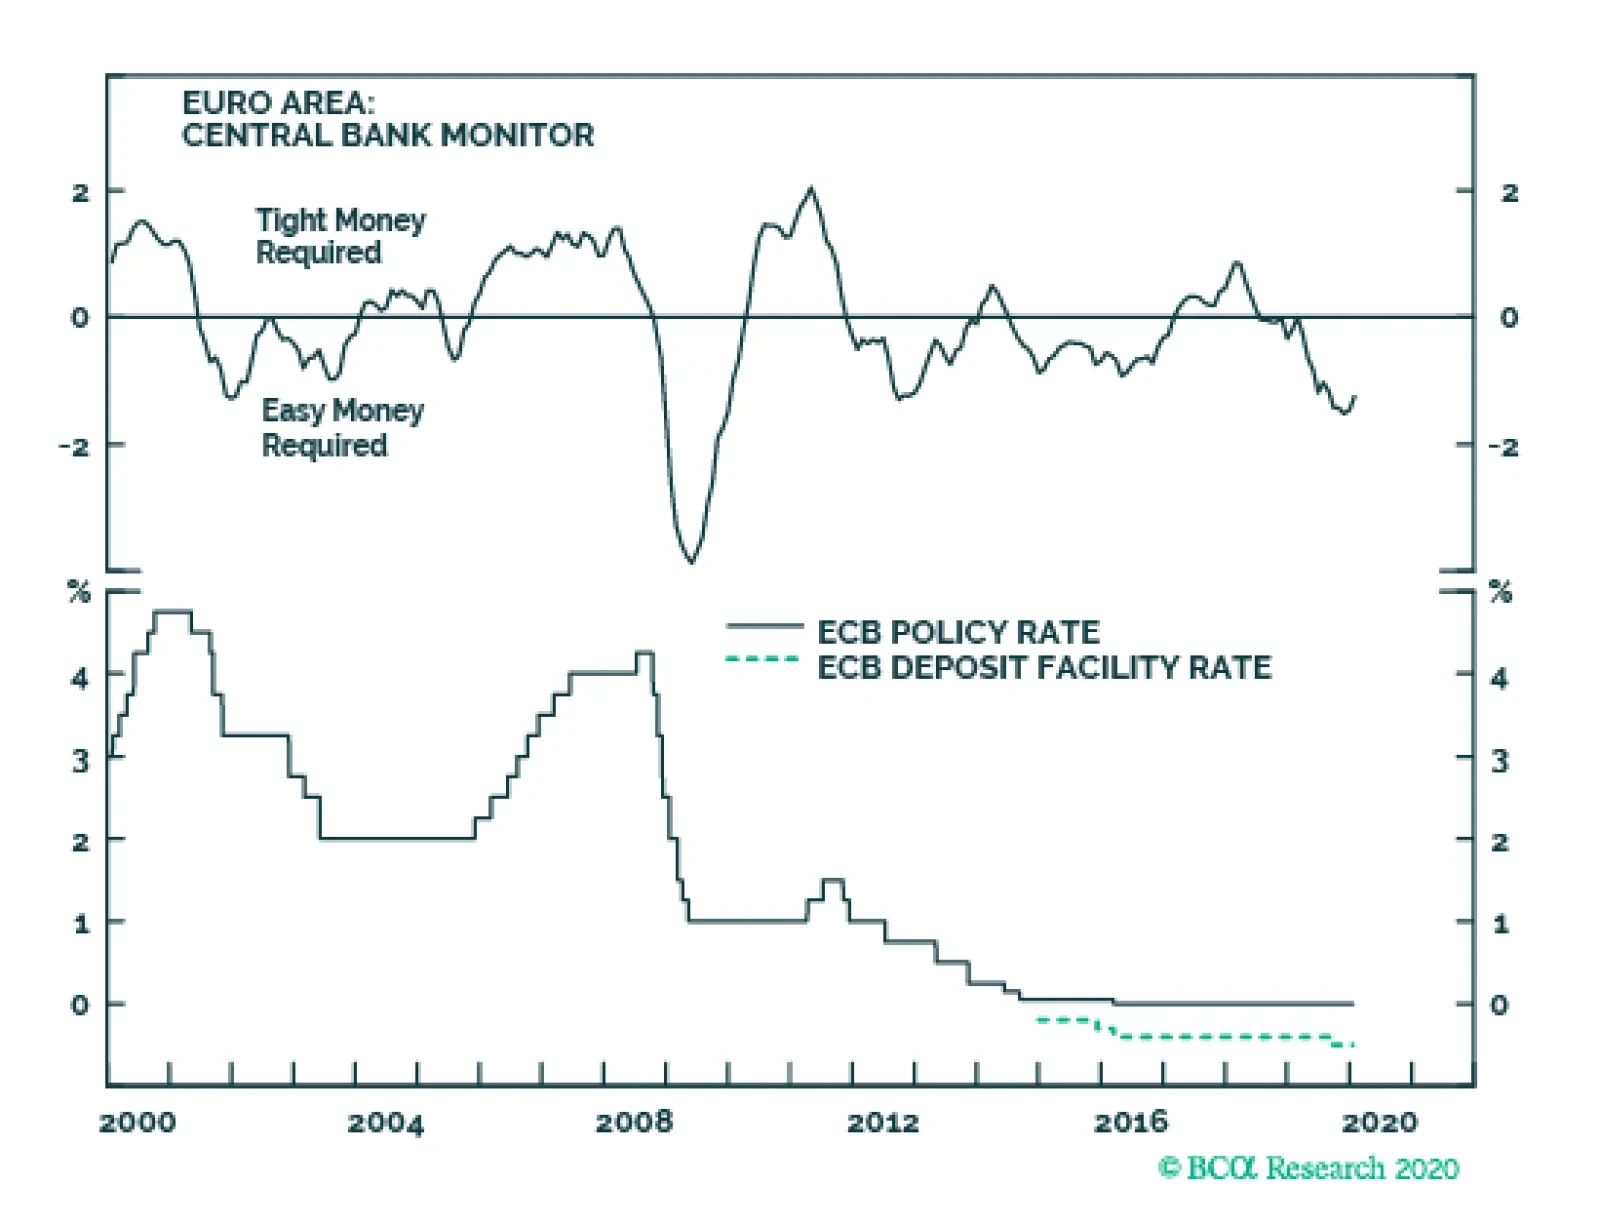
Today, the major development of the ECB’s policy meeting was the announcement of the new monetary strategy policy review. Following the press conference where the program was announced, the euro fell 0.6% and bunds outperformed Treasury Notes. The policy…
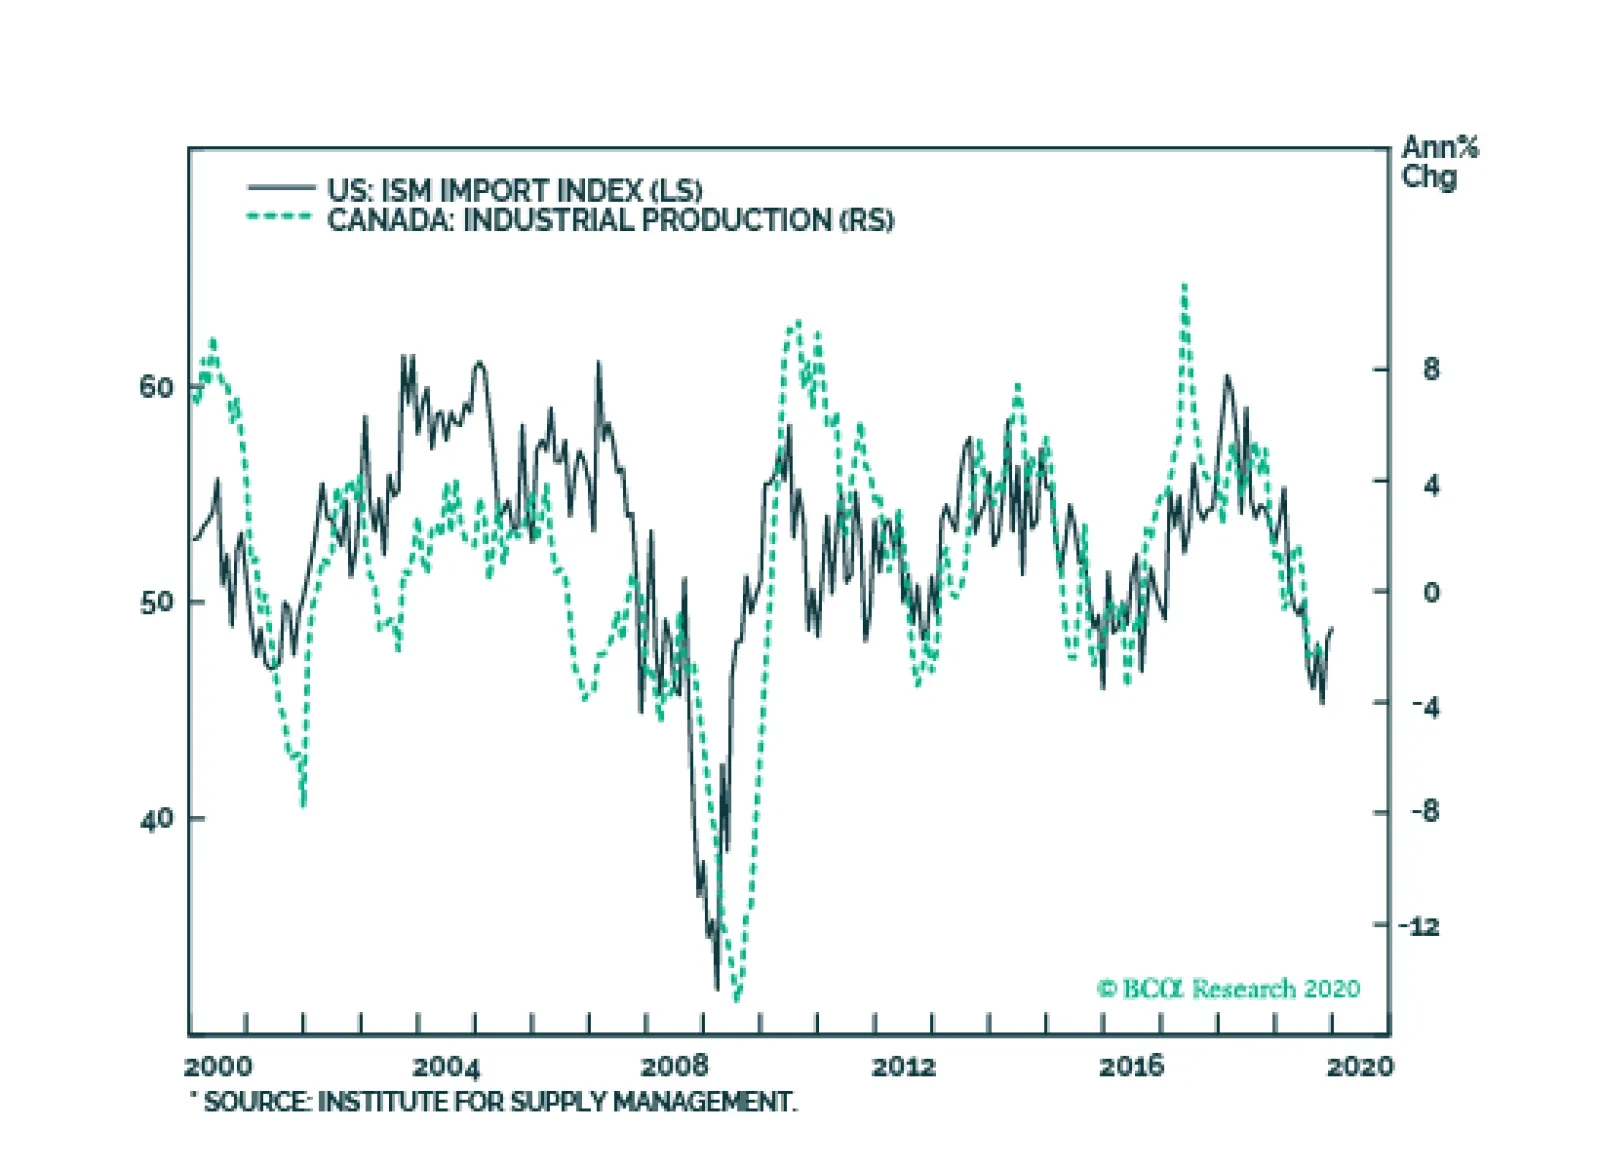
As expected, the BoC kept interest rates at 1.75%. While the BoC highlighted that the economy possesses more slack than originally estimated, it refrained from committing policy to any path this year. After all, while the Canadian economy continues to suffer…