Monetary

Highlights The currency market is bifurcated in terms of shorter-term expectations versus longer-term factors. The Swedish krona, Norwegian krone, and British pound are solid long-term buys, but could remain very volatile in the short term. We continue to focus on the crosses rather than outright dollar bets. Remain long SEK/NZD, GBP/JPY, and NOK/SEK. Tighten stops on long GBP/JPY to protect profits. EUR/SEK should top out once global growth improves. Sell the gold/silver ratio at 90, as recommended in last week’s report.1 Feature Chart I-1One Way Street Since 2018
One Way Street Since 2018
One Way Street Since 2018
Of all the G10 currencies we follow, the Swedish krona is probably the one that is the most perplexing. The Riksbank is one of the few central banks to have raised rates this year, but the krona remains the weakest G10 currency. Admittedly, the performance of the Swedish manufacturing sector has been dismal, and was especially so in September, but this has not been a story specific to Sweden alone. The euro area, which is also experiencing a deep manufacturing recession, has seen better currency performance despite a more dovish European Central Bank (ECB). The underperformance of the krona begs the question of whether it signals a much prolonged global manufacturing recession, or is indicative of something more endogenous to Sweden. Put another way, has the driver of USD/SEK (and even USD/NOK) strength been an appreciating dollar, or more domestic factors (Chart I-1)? And if it is the latter, what are the important signposts to look out for should a turnaround be around the corner? The Soft Versus Hard Data Debate The big question for Sweden is whether the manufacturing sector is just in a volatile bottoming process, or about to contract much further. Industrial production is currently growing at 4% year-over-year, but the signal from the soft data is that it should be contracting in the double digits (Chart I-2, top panel). As such there is either a big disconnect between the perception of investors and reality, or we are on the verge of a much deeper manufacturing slump. Exchange rates tend to be extremely fluid in discounting a wide swath of economic data, and in the case of Sweden, in discounting the outcome for global growth. However, with EUR/SEK at 10.8 and USD/SEK at 9.7 – the latter well above its 2008 highs – it is fair to assume that anything other than a deep recession will justify a stronger SEK. One of the more consistent ratios in calling a bottom in the Swedish manufacturing sector in particular (and that of the Eurozone in general) is the manufacturing new orders-to-inventories ratio (Chart I-2, bottom panel). The tick down in September was disconcerting. However, unlike the manufacturing PMI, this ratio is not hitting new lows, tentative evidence that we might be in a volatile bottoming process rather than a protracted slump. The last time we encountered such a divergence was in 2011/2012, at the height of the European debt crisis; in that instance, Swedish hard data ended up sending the right signal for the overall economy. The deterioration in the manufacturing sector has yet to hit domestic consumption in general or the labor market in particular. The deterioration in the manufacturing sector has yet to hit domestic consumption in general or the labor market in particular. The import component of the PMI index remains well above that of exports. Meanwhile, the employment component of the PMI index began to stabilize around the middle of this year, meaning employment growth should bottom at around 1% or so (Chart I-3). Swedish exports are higher up the manufacturing food chain than in most other developed economies, and autos are quite important. But so far, the Swedish economy has weathered the auto slowdown quite well, with production still clocking in at 7% per year. Chart I-2Soft Data Is Much Worse
Soft Data Is Much Worse
Soft Data Is Much Worse
Chart I-3Domestic Demand Is Holding Up Well
Domestic Demand Is Holding Up Well
Domestic Demand Is Holding Up Well
The tick up in the Swedish unemployment rate is problematic, but we do not believe it constitutes a major change in labor market dynamics. Sweden has a long history of higher openness toward asylum seekers and refugees than many other European countries. The Syrian crisis a couple of years ago led to an exceptional surge, where the number of asylum seekers skyrocketed to over 150,000 or almost 1.5% of the total population (Chart I-4). Historically, immigration has provided a big labor dividend to Sweden, allowing growth to outpace both the U.S. and the euro area. But this has also been a source of frictional unemployment, as new migrants integrate into the labor force. Chart I-4A New Pool Of Labor That Has To Be Integrated
A New Pool Of Labor That Has To Be Integrated
A New Pool Of Labor That Has To Be Integrated
Foreign-born workers now constitute about 20% of the total population, a big portion of which need to learn a new language and adopt new skills (Chart I-5A). This growth dividend will be reaped for many years to come. Integration is a politically contentious issue, and so the highly restrictive asylum and reunification law adopted in mid-2016 probably means the immigration boom is behind us. The rise of the anti-immigration Sweden Democrats in the September 2018 elections is a case in point. However, the pivot of the democratic population towards the right has been a global phenomenon, and so is not as negative for Sweden on a relative basis. All that to say, compared to most developed nations, Sweden still enjoys a relatively positive demographic outlook (Chart I-5B). Chart I-5AA Huge Labor Dividend
A Huge Labor Dividend
A Huge Labor Dividend
Chart I-5BNo Apparent Demographic Cliff
No Apparent Demographic Cliff
No Apparent Demographic Cliff
The inflow of migrants has a mixed impact on inflation. While there is downward pressure on wages, due to an increase in the share of employment that pays lower wages, there is still upward pressure on housing and consumption in response to the increased number of workers. This comes on top of a fiscal boost as the government spends more on social services. Meanwhile, the unemployment rate among foreign-born people is around 15%. This means that the Phillips curve is flat for the first few years, before it starts to steepen. But as the new labor force is finally absorbed into the economy, it should start to generate meaningful wage pressures. The Riksbank clearly understands these dynamics, which is why over the prior years, its stance has been dovish even when the Swedish economy has been holding up well. Interest rates were cut to negative territory in 2015 and held at -0.5% (lower than the ECB policy rate) all through the global recovery in 2016 and 2017. Quantitative easing has also been extended up until 2020, well ahead of the ECB’s renewed asset purchase program announcement. Both have tremendously eased monetary conditions in Sweden, including via a weaker currency. Going forward, there are a few key reasons to believe the path of least resistance for the krona is now up: A weak krona has typically helped the manufacturing sector with a lag of twelve months. A weak krona has typically helped the manufacturing sector with a lag of twelve months. Negative divergences only tend to happen ahead of deep recessions. Unless we are in that particular situation now, better demand for relatively cheaper Swedish goods (think Volvo versus BMW) should lead to a stronger krona (Chart I-6). Yes, the Riskbank has been conducting QE, but the pace of expansion in its balance sheet has been slowing in recent quarters. USD/SEK has tended to track relative balance sheet trends between the Riksbank and the Fed, but a gaping wedge has opened up in favor of the krona (Chart I-7). Meanwhile, with the Fed about to re-expand its balance sheet, this should also favor a stronger SEK versus the USD. Chart I-6Swedish Krona And Manufacturing
Swedish Krona And Manufacturing
Swedish Krona And Manufacturing
Chart I-7USD/SEK And Relative Balance Sheets
USD/SEK And Relative Balance Sheets
USD/SEK And Relative Balance Sheets
The Swedish housing market is becoming a thorn in the Riksbank’s side. When negative rates were introduced in 2015, growth in house prices exploded to the tune of 15% year-on-year (Chart I-8). More recently, a curb on migration has allowed a cooling of sorts, but Swedish household leverage remains very elevated. With the memory of the 1990s housing crisis still fresh in their minds, this is making the Riksbank quite uncomfortable with its current policy stance. The carry cost is lower from being short NZD compared to being short the U.S. dollar. Our bias is that though Governor Stefan Ingves prefers to renormalize policy as quickly as possible, given that he is managing a small-open economy with trade a whopping 45% of GDP, but is held hostage to external conditions. The SEK is the cheapest currency in the G10 universe, and could bounce sharply on even the softest evidence indicating global growth has bottomed. Furthermore, rising global growth will tighten resource utilization, which should begin to boost underlying inflationary pressures in Sweden (Chart I-9) Chart I-8House Prices In Sweden##br## Are Bubbly
House Prices In Sweden Are Bubbly
House Prices In Sweden Are Bubbly
Chart I-9Resource Utilization And Inflation In Sweden
Resource Utilization And Inflation In Sweden
Resource Utilization And Inflation In Sweden
In terms of SEK trading strategy, USD/SEK and NZD/SEK tend to be highly correlated; since the SEK has a higher beta to global growth than the kiwi (Sweden exports 45% of its GDP versus 27% for New Zealand). On a relative basis, the Swedish economy appears to have bottomed relative to that of the U.S., making the SEK/NZD an attractive way to play USD/SEK downside. Meanwhile, the carry cost is lower from being short NZD compared to being short the U.S. dollar (Chart I-10). As for EUR/SEK, the cross could consolidate at current levels before heading lower but will ultimately peak once global growth reaccelerates. Chart I-10Remain Long SEK/NZD
Remain Long SEK/NZD
Remain Long SEK/NZD
Bottom Line: We remain long the SEK/NZD as a relative value play, but the true upside lies in the SEK/USD cross. Our bias is that SEK weakness has been driven by the market’s focus on disappointing soft data, while hard data remains relatively resilient. Once it becomes clearer that the global growth environment is not as precarious as the surveys suggest, the krona could bounce sharply. Housekeeping Our long GBP/JPY position hit 5% this week. We are tightening stops to 138 in order to protect profits. We were also stopped out of short EUR/NOK for a 2% loss. We are standing aside for now. EUR/NOK is now trading above 2008 recession levels, which is only justifiable by a prolonged growth recession, but risk management warrants patience for now. Stay tuned. Chester Ntonifor, Foreign Exchange Strategist chestern@bcaresearch.com Footnotes 1 Please see Foreign Exchange Strategy Weekly Report, titled “On Money Velocity, EUR/USD And Silver,” dated October 11, 2019, available at fes.bcaresearch.com Currencies U.S. Dollar Chart II-1USD Technicals 1
USD Technicals 1
USD Technicals 1
Chart II-2USD Technicals 2
USD Technicals 2
USD Technicals 2
Recent data in the U.S. have been soft: Retail sales contracted by 0.3% month-on-month in September. Industrial production fell by 0.4% month-on-month. Both export and import prices fell by 1.6% year-on-year in September. Michigan Consumer Sentiment Index grew to 96 in October, up from 93.2 in the previous month. NY Empire State Manufacturing Index increased to 4 in October, up from 2 in September. Building permits and housing starts both fell by 2.7% and 9.4% month-on-month in September, but the housing recovery remains intact. Initial jobless claims increased to 214K for the week ended Oct 11th. The DXY index depreciated by 0.7% this week. The latest Beige Book summarized that the U.S. economy expanded at a slight-to-modest pace. The slowdown in the manufacturing sector remains the biggest risk to the economy, while trade tensions continue to weigh on business sentiment and capex intensions. The most recent “entente” in trade discussions might represent a pivotal shift from heightened uncertainty that has prevailed throughout the summer. Report Links: On Money Velocity, EUR/USD And Silver - October 11, 2019 Preserving Capital During Riot Points - September 6, 2019 Has The Currency Landscape Shifted? - August 16, 2019 The Euro Chart II-3EUR Technicals 1
EUR Technicals 1
EUR Technicals 1
Chart II-4EUR Technicals 2
EUR Technicals 2
EUR Technicals 2
Recent data in the euro area remain subdued: Headline inflation fell to 0.8% year-on-year in September, the slowest in nearly three years. Core inflation however, increased to 1% year-on-year. Industrial production in the euro area continued to contract, by 2.8% year-on-year in August. The ZEW sentiment in the euro area fell further to -23.5 in October, however this is well above expectations of -33. The ZEW sentiment for Germany also fell to -22.8 in October. It is worth noting that expectations continue to improve relative to the current situation. The trade balance in the euro area improved to €20.3 billion in August, up from the downward-revised €17.5 billion in July. However, this is mostly due to a contraction in imports. EUR/USD rose by 0.9% this week, in part helped by broad dollar weakness. The trade dynamics in the euro area remain worrisome: exports fell by 2.2% year-on-year in August, while imports plunged by 4.1% year-on-year. Notably, year-to-date, the EU’s trade surplus with U.S. grew to €103 billion, up from €91 billion a year earlier, while the trade deficit with China widened further to €127 billion from €116 billion. Report Links: On Money Velocity, EUR/USD And Silver - October 11, 2019 A Few Trade Ideas - Sept. 27, 2019 Battle Of The Central Banks - June 21, 2019 Japanese Yen Chart II-5JPY Technicals 1
JPY Technicals 1
JPY Technicals 1
Chart II-6JPY Technicals 2
JPY Technicals 2
JPY Technicals 2
Recent data in Japan continue to disappoint: Industrial production fell by 4.7% year-on-year in August. Capacity utilization decreased by 2.9% month-on-month in August. The Japanese yen fell by 0.8% against the U.S. dollar this week. Kuroda has again emphasized that the BoJ will not hesitate to act if economic developments continue to deteriorate. On the other hand, while the Fed and the ECB are both on course to expand their balance sheets through asset purchases, it is an open question as to how much more the BoJ can do, beyond yield curve control. We remain long the yen in anticipation that it will require a “Lehman moment” for the BoJ to act aggressively. Report Links: A Few Trade Ideas - Sept. 27, 2019 Has The Currency Landscape Shifted? - August 16, 2019 Portfolio Tweaks Into Thin Summer Trading - July 5, 2019 British Pound Chart II-7GBP Technicals 1
GBP Technicals 1
GBP Technicals 1
Chart II-8GBP Technicals 2
GBP Technicals 2
GBP Technicals 2
Recent data in the U.K. have been mostly negative: The ILO unemployment rate slightly increased to 3.9% in August. Average earnings quarterly growth slowed to 3.8%, however this was above expectations of 3.7%. The Retail price index grew by 2.4% year-on-year in September, a slowdown from 2.6% in the previous month. Headline inflation was unchanged at 1.7% year-on-year in September, while core inflation jumped to 1.7% from 1.5%. Retail sales grew by 3.1% year-on-year in September, up from 2.6% in the previous month. GBP/USD surged by 3.3% this week on optimism towards the European Council Summit on Brexit. From a valuation perspective, the pound is trading at a large discount to its fair value. Should positive Brexit news continue to hit the headlines, the pound could continue to soar. We are long GBP/JPY, which is above 5% in the money. Tighten stop to 138. Report Links: A Few Trade Ideas - Sept. 27, 2019 United Kingdon: Cyclical Slowdown Or Structural Malaise? - Sept. 20, 2019 Battle Of The Central Banks - June 21, 2019 Australian Dollar Chart II-9AUD Technicals 1
AUD Technicals 1
AUD Technicals 1
Chart II-10AUD Technicals 2
AUD Technicals 2
AUD Technicals 2
Recent data in Australia have been modest: NAB business confidence fell further to -2, while conditions improved to 1 in Q3. On the labor market front, the unemployment rate fell further to 5.2% in September. 14.7K jobs were created, consisting of 26.2K full-time jobs and a loss of 11.4K part-time jobs. AUD/USD increased by 0.4% this week. RBA minutes were released earlier this week. Interestingly, it presents a sharp debate about the effects of low rates. On the one hand, lower rates have been theoretically justified to achieve full employment and the inflation target. On the other hand, some RBA members fear that low rates could fuel already inflated house prices. The probability for another rate cut has thus decreased post RBA minutes. Report Links: A Contrarian View On The Australian Dollar - May 24, 2019 Beware Of Diminishing Marginal Returns - April 19, 2019 Not Out Of The Woods Yet - April 5, 2019 New Zealand Dollar Chart II-11NZD Technicals 1
NZD Technicals 1
NZD Technicals 1
Chart II-12NZD Technicals 2
NZD Technicals 2
NZD Technicals 2
Recent data in New Zealand have been negative: Visitor arrivals increased by 1.8% year-on-year in August, slightly down from 2% in the previous month. Headline inflation slowed to 1.5% year-on-year in Q3. NZD/USD has been more or less flat this week. Closely tied to global growth, the New Zealand dollar has been fluctuating with the ebb and flow of the U.S.-China trade headlines. The two countries have agreed on a partial deal last week, however the details remain vague. While the kiwi is a high beta currency, it should unerperform at the crosses. We continue to play the kiwi weakness through the Aussie dollar and the Swedish Krona. Report Links: USD/CNY And Market Turbulence - August 9, 2019 Where To Next For The U.S. Dollar? - June 7, 2019 Not Out Of The Woods Yet - April 5, 2019 Canadian Dollar Chart II-13CAD Technicals 1
CAD Technicals 1
CAD Technicals 1
Chart II-14CAD Technicals 2
CAD Technicals 2
CAD Technicals 2
Recent data in Canada have been relatively strong: The unemployment rate decreased further to 5.5% in September. Moreover, average hourly wages continued to grow by 4.3% year-on-year, up from 3.8% in the previous month. Lastly, 53.7K jobs were created in September, well above expectations of 10K. Both headline and core inflation were unchanged at 1.9% year-on-year in September. The Canadian dollar has appreciated by 1% against the U.S. dollar, on the back of the positive employment data last Friday. All eyes are on the federal election this month, which could be crucial for the future of the Canadian energy sector and environment policies. Report Links: Preserving Capital During Riot Points - September 6, 2019 Portfolio Tweaks Into Thin Summer Trading - July 5, 2019 On Gold, Oil And Cryptocurrencies - June 28, 2019 Swiss Franc Chart II-15CHF Technicals 1
CHF Technicals 1
CHF Technicals 1
Chart II-16CHF Technicals 2
CHF Technicals 2
CHF Technicals 2
Recent data in Switzerland have been positive: The trade surplus (excluding precious metals) widened sharply to CHF 2.88 billion in September. Notably, Swiss exports grew by 8.2% month-on-month to CHF 20.3 billion, led by higher sales of chemical and pharmaceutical products. Swiss imports slightly dropped by 1.4% month-on-month to CHF 17.4 billion. Producer and import prices continued to fall by 2% year-on-year in September. USD/CHF fell by 1% this week. The Swiss franc will continue to fight a tug-of-war between being a defensive currency, but a tool of manipulation by the SNB. Our guestimate is that EUR/CHF 1.06 is an ultimate stress point. Global portfolios should hold the Swiss franc as insurance, for the simple reason that the currency is a structural outperformer. Report Links: Notes On The SNB - October 4, 2019 What To Do About The Swiss Franc? - May 17, 2019 Beware Of Diminishing Marginal Returns - April 19, 2019 Norwegian Krone Chart II-17NOK Technicals 1
NOK Technicals 1
NOK Technicals 1
Chart II-18NOK Technicals 2
NOK Technicals 2
NOK Technicals 2
Recent data in Norway have been depressed: The trade balance shifted to a deficit of NOK 1.2 billion in September. That’s a decrease of NOK 24 billion year-on-year. The Norwegian krone has depreciated by nearly 1% against the U.S. dollar this week. Energy prices remain subdued over the past few weeks. Moreover, the Norwegian trade balance has shifted to a deficit for the first time since November 2017. Exports plunged by 19.5% year-on-year, due to lower sales of energy products, while imports jumped by 12.9% year-on-year. The message is clear – Norway continues to hold up well domestically, but dependence on petroleum exports is introducing volatility into any growth forecasts. BCA has lowered its oil price projections for 2019, which has dampened the appeal of the Norwegian Krone. Stay tuned. Report Links: A Few Trade Ideas - Sept. 27, 2019 Portfolio Tweaks Into Thin Summer Trading - July 5, 2019 On Gold, Oil And Cryptocurrencies - June 28, 2019 Swedish Krona Chart II-19SEK Technicals 1
SEK Technicals 1
SEK Technicals 1
Chart II-20SEK Technicals 2
SEK Technicals 2
SEK Technicals 2
Recent data in Sweden have been neutral: The unemployment rate was unchanged at 7.1% in September. USD/SEK fell by 1.1% this week. As the worst performing G-10 currency this year, the Swedish krona is now trading at a large discount to its fair value. Please refer to our front section this week which presents an in-depth analysis on the Swedish economy and the krona. Report Links: Where To Next For The U.S. Dollar? - June 7, 2019 Balance Of Payments Across The G10 - February 15, 2019 A Simple Attractiveness Ranking For Currencies - February 8, 201 Trades & Forecasts Forecast Summary Core Portfolio Tactical Trades Limit Orders Closed Trades
Highlights The interim “phase 1” trade agreement reached last week represents a significant step forward towards reaching a détente in the China-U.S. trade war. Regardless of what happens next in the Brexit negotiations, a hard exit will be avoided. Stay long the pound. U.S. earnings growth is likely to be flat in the third quarter, in contrast to bottom-up expectations of a year-over-year decline. Earnings growth should pick up as global growth reaccelerates by year end. Stronger global growth will put downward pressure on the U.S. dollar. Remain overweight global equities relative to bonds over a 12-month horizon. Cyclical stocks should start to outperform defensives. Financials will finally have their day in the sun. Favorable Tradewinds In our Fourth Quarter Strategy Outlook published two weeks ago, we argued that global equities had entered a “show me” phase, meaning that tangible evidence of a de-escalation in the trade war and a recovery in global growth would be necessary for stock indices to move higher.1 We received some positive news on the trade front last Friday. In exchange for suspending the planned October 15th hike in tariffs from 25% to 30% on $250 billion of Chinese imports, China agreed to purchase $40-$50 billion of U.S. agricultural products per year, improve market access for U.S. financial services companies, and enhance the transparency of currency management. Admittedly, there is still much to be done. The text of the agreement has yet to be finalized. Both sides are aiming to conclude the deal by the time of the APEC summit in Santiago, Chile on November 16-17. Considering that a number of key issues remain unresolved, including what sort of enforcement and resolution mechanisms will be included in the deal, further delays or even a breakdown in the talks are possible. The interim deal agreed upon last week also punts the thorny issue of how to handle intellectual property protections to a “phase 2” of the negotiations slated to begin soon after “phase 1” is wrapped up. According to the independent and bipartisan U.S. Commission on the Theft of American Intellectual Property, U.S. producers lose between $225 and $600 billion annually from IP theft.2 China has often been considered among the worst offenders. Given the importance of the IP issue, meaningful progress will be necessary to ensure that tariffs of 15% on about $160 billion of Chinese imports are not introduced on December 15th. Trump Wants A Deal Despite the many hurdles that remain, last week’s developments significantly raise the prospects of a détente in the 18 month-long trade war. As a self-professed “master negotiator,” President Trump has put his credibility on the line by describing the negotiations as a “love fest,” calling the trade pact “the greatest and biggest deal ever made for our Great Patriot Farmers,” and saying that he has “little doubt” that a final agreement will be reached. Just as he did with NAFTA’s successor USMCA – a deal that is substantively similar to the one it replaced – Trump is likely to shift into marketing mode, trumpeting the “tremendous” new deal that he has negotiated on behalf of the American people. From a political point of view, this makes perfect sense. Rightly or wrongly, President Trump gets better marks from voters on his handling of the economy than anything else (Chart 1). A protracted trade war would undermine the U.S. economy, thereby hurting Trump’s re-election prospects. Chart 1Trump Gets Reasonably High Marks On His Handling Of The Economy, But Not Much Else
Kumbaya
Kumbaya
Chart 2Chinese Business Are Not Paying The Bulk Of The Tariffs
Kumbaya
Kumbaya
Notwithstanding his claims to the contrary, the evidence firmly suggests that U.S. consumers, rather than Chinese businesses, are paying the bulk of the tariffs. Chart 2 shows that U.S. import prices from China have barely declined, even as tariff rates on Chinese imports have risen. To the extent that the latest rounds of tariffs are focused on Chinese goods for which there is little U.S. or third-country competition, the ability of Chinese producers to pass on the cost of the tariffs will only increase. If all the tariff hikes that have been announced were implemented, the effective tariff rate on Chinese imports would rise from around 15% as of late August to as high as 25% in December (Chart 3). Such a tariff rate would reduce U.S. household disposable incomes by over $100 billion, wiping out most of the gains from the 2017 tax cuts. Trump can’t let the trade war reach this point. Chart 3Successive Rounds Of Tariffs Have Started To Add Up
Successive Rounds Of Tariffs Have Started To Add Up
Successive Rounds Of Tariffs Have Started To Add Up
Will China Play Hardball? One risk to a favorable resolution to the trade war is that China will increasingly see Trump as desperate to make a deal. This could lead the Chinese to take a hardline stance in the negotiations. While this risk cannot be dismissed, we would downplay it for three reasons: First, even though China’s exporters have been able to maintain some degree of pricing power during the trade war, trade volumes have still suffered, with exports to the U.S. down nearly 22% year-over-year in September. Second, as the crippling sanctions against ZTE have demonstrated, China remains highly dependent on U.S. technologies. This gives Trump a lot of leverage in the trade negotiations. Chart 4Who Will Win The 2020 Democratic Nomination?
Kumbaya
Kumbaya
Third, as Trump himself likes to say, China will find it easier to negotiate with him in his first term in office than in his second. Hoping that Trump would lose his re-election bid might have made sense for China a few months ago when Joe Biden was riding high in the polls; but now that Elizabeth Warren has emerged as the favorite to secure the Democratic nomination, that hope has been dashed (Chart 4). As we noted several weeks ago, China is likely to find Warren no less vexing on trade matters than Trump.3 All this suggests that China, just like Trump, will look for ways to cool trade tensions over the coming weeks. Brexit Breakthrough? As we go to press, the prospects for a Brexit deal have brightened. Although the details have yet to be released, the proposed deal would effectively put Northern Ireland in a veritable quantum superposition where it is both in the European common market and in the U.K. at the same time. This feat will be achieved by keeping Northern Ireland within the U.K. political jurisdiction but still aligned with EU regulatory standards. Negotiations could still go awry. Despite Prime Minister Boris Johnson’s assurance that he secured “a great new deal,” the Conservative’s coalition partner, the Northern Irish Democratic Unionist Party, is still withholding its support for the accord. Labour leader Jeremy Corbyn has also rejected the deal, saying that it is even worse than Theresa May’s originally proposed pact. Regardless of what transpires over the coming days, we continue to think that a hard Brexit will be avoided. Throughout the entire Brexit ordeal, we have argued that there was insufficient political support within the British ruling class for a no-deal Brexit. That conviction has only grown as polling data has revealed that an increased share of voters would choose to stay in the EU if another referendum were held (Chart 5). We have been long the pound versus the euro since August 3, 2017. The trade has gained 6.6% over this period. Investors should stick with this position. Based on real interest rate differentials, GBP/EUR should be trading near 1.30 rather than the current level of 1.16 (Chart 6). We expect the cross to move towards its fair value as hard Brexit risks diminish further. Chart 5Brexit Angst: A Case Of Bremorse
Brexit Angst: A Case Of Bremorse
Brexit Angst: A Case Of Bremorse
Chart 6Substantial Upside In The Pound
Substantial Upside In The Pound
Substantial Upside In The Pound
Global Growth Prospects Improving Chart 7Growth Slowdown Has Been More Pronounced In The Soft Data
Growth Slowdown Has Been More Pronounced In The Soft Data
Growth Slowdown Has Been More Pronounced In The Soft Data
Chart 8Manufacturing Output Rebounds Amid The ISM Slump
Manufacturing Output Rebounds Amid The ISM Slump
Manufacturing Output Rebounds Amid The ISM Slump
A détente in the trade war and a resolution to the Brexit saga should help support global growth. The weakness in the economic data has been much more pronounced in so-called “soft” measures such as business surveys than in “hard” measures such as industrial production (Chart 7). Notably, U.S. manufacturing output has stabilized over the past three months, even as the ISM manufacturing index has swooned (Chart 8). As sentiment rebounds, the soft data should improve. Global financial conditions have eased significantly over the past five months, thanks in large part to the dovish pivot by most central banks (Chart 9). The net number of central banks cutting rates generally leads the global manufacturing PMI by 6-to-9 months (Chart 10). In addition, the Fed’s decision to start buying Treasurys again will increase dollar liquidity, thus further contributing to looser financial conditions. Chart 9Easier Financial Conditions Will Boost Global Growth
Easier Financial Conditions Will Boost Global Growth
Easier Financial Conditions Will Boost Global Growth
Chart 10The Effects Of Easing Monetary Policy Should Soon Trickle Down To The Economy
The Effects Of Easing Monetary Policy Should Soon Trickle Down To The Economy
The Effects Of Easing Monetary Policy Should Soon Trickle Down To The Economy
Stepped-up Chinese stimulus should also help jumpstart global growth. Chinese money and credit growth both came in above expectations in September. The PBoC has been cutting reserve requirements, which has helped bring down interbank rates. Further cuts to the medium-term lending facility are likely over the remainder of this year. Changes in Chinese credit growth lead global growth by about nine months (Chart 11). Chart 11Chinese Credit Should Support The Recovery In Global Growth
Chinese Credit Should Support The Recovery In Global Growth
Chinese Credit Should Support The Recovery In Global Growth
Stay Overweight Global Equities While the road to finalizing a “phase 1” trade deal in time for the APEC summit is likely to be a bumpy one, we continue to reiterate our recommendation that investors overweight global stocks relative to bonds over a 12-month horizon. We expect to upgrade EM and European equities over the coming weeks once we see a bit more evidence that global growth is bottoming out. Ultimately, the trajectory of stocks will hinge on what happens to earnings. The U.S. earnings season began this week. As of last week, analysts expected S&P 500 EPS to decline by 4.6% in Q3 relative to the same quarter last year according to data compiled by FactSet. Keep in mind, however, that EPS growth has beaten estimates by around four percentage points since 2015 (Chart 12). Thus, a reasonable bet is that U.S. earnings will be flat this quarter, clearing a low bar of expectations. Chart 12Actual EPS Has Generally Beaten Estimates
Kumbaya
Kumbaya
Chart 13Earnings And Nominal GDP Growth Tend To Move In Lock-Step
Earnings And Nominal GDP Growth Tend To Move In Lock-Step
Earnings And Nominal GDP Growth Tend To Move In Lock-Step
The fact that 83% of the 63 S&P 500 companies that have reported earnings thus far have beaten estimates – better than the historic average of 64% – supports the view that current Q3 estimates are too dour. Looking out, earning growth should pick up as nominal GDP growth accelerates (Chart 13). European and EM equities generally outperform the global benchmark when global growth is speeding up (Chart 14). This is due to the more cyclical nature of their stock markets. In addition, as a countercyclical currency, the dollar tends to weaken in a faster growth environment. A weaker dollar disproportionately benefits cyclical stocks (Chart 15). Chart 14EM And Euro Area Equities Usually Outperform When Global Growth Improves
EM And Euro Area Equities Usually Outperform When Global Growth Improves
EM And Euro Area Equities Usually Outperform When Global Growth Improves
Chart 15Cyclical Stocks Will Outperform If The Dollar Weakens
Cyclical Stocks Will Outperform If The Dollar Weakens
Cyclical Stocks Will Outperform If The Dollar Weakens
We would include financials in our definition of cyclical sectors. As global growth improves, long-term bond yields will increase at the margin. Since central banks are in no hurry to raise rates, yield curves will steepen. This will boost bank profits and share prices (Chart 16). Cyclical stocks are currently quite cheap compared to defensives (Chart 17). Likewise, non-U.S. equities are quite inexpensive compared to their U.S. peers, even if one adjusts for differences in sector composition across regions. While U.S. stocks trade at 17.5-times forward earnings, international stocks trade at a more attractive forward PE ratio of 13.7. The combination of higher earnings yields and lower interest rates abroad implies that the equity risk premium is roughly two percentage points higher outside the United States (Chart 18). Chart 16Steeper Yield Curves Will Benefit Financials
Steeper Yield Curves Will Benefit Financials
Steeper Yield Curves Will Benefit Financials
Chart 17Cyclical Stocks Are More Attractive Than Defensives
Cyclical Stocks Are More Attractive Than Defensives
Cyclical Stocks Are More Attractive Than Defensives
Chart 18The Equity Risk Premium Is Quite High, Especially Outside The U.S.
The Equity Risk Premium Is Quite High, Especially Outside The U.S.
The Equity Risk Premium Is Quite High, Especially Outside The U.S.
We expect to upgrade EM and European equities over the coming weeks once we see a bit more evidence that global growth is bottoming out. Peter Berezin, Chief Global Strategist Global Investment Strategy peterb@bcaresearch.com Footnotes 1Please see Global Investment Strategy, “Fourth Quarter 2019 Strategy Outlook: A ‘Show Me’ Market,” dated October 4, 2019. 2 “Update to IP Commission Report: The Report of the Commission on the Theft of American Intellectual Property,” The National Bureau of Asian Research, 2017. 3Please see Global Investment Strategy Weekly Report, “Elizabeth Warren And The Markets,” dated September 13, 2019. Strategy & Market Trends MacroQuant Model And Current Subjective Scores
Kumbaya
Kumbaya
Strategic Recommendations Closed Trades
Highlights Duration & Fed: Our late-1990s & 2015/16 roadmap for the economy still holds, but risks are mounting. Despite the risks, we expect that trade tensions will calm enough for the economic data to improve during the next few months. The result will be one more Fed rate cut this month, followed by an extended on-hold period. Investors should keep portfolio duration low in that environment. Junk Quality Spreads: This year’s divergence between the Caa/Ba quality spread and the high-yield index spread is highly unusual, but has more to do with movements in Treasury yields and changing index duration than with broader concerns about corporate credit quality. Investment Grade Risk & Reward: We present a novel approach for assessing the risk/reward trade-off among investment grade corporate bond sectors. We note that Saudi Arabian and Mexican Sovereign bonds, Foreign Agency bonds and Conventional 30-year Agency MBS look particularly attractive in risk-adjusted terms. Feature Contagion? This publication has repeatedly pointed to the late-1990s and the 2015/16 periods as appropriate comparables for today’s global growth slowdown. That is, we expect that the current spate of weakness will stay confined within the manufacturing sector and will not spread into the broader economy, leading the U.S. into recession. This call is important from an investment perspective because it implies that the Fed is not currently engaged in an easing cycle that will bring the funds rate back to zero. Rather, we anticipate only three rate cuts this year (we’ve already seen two), followed by the eventual resumption of hikes. Bond yields will not make new lows in that environment. Chart 1Manufacturing Weakness Spreading?
Manufacturing Weakness Spreading?
Manufacturing Weakness Spreading?
Chart 2"Hard" Data Still Firm
"Hard" Data Still Firm
"Hard" Data Still Firm
But some data received this month challenge our economic narrative. Specifically, September’s drop in the ISM Non-Manufacturing PMI from 56.4 to 52.6 and the year-over-year decline in the Conference Board’s survey of consumer confidence (Chart 1). Both are sending tentative signals that economic weakness might be spreading from the manufacturing sector into the broader U.S. economy. The Fed is worried about the same thing, as evidenced by this passage from the September FOMC minutes: One risk that the economy faced was that the softness recorded of late in firms’ capital formation, manufacturing, and exporting activities might spread to their hiring decisions, with adverse implications for household income and spending. Participants observed that such an eventuality was not embedded in their baseline outlook; however, a couple of them indicated that this was partly because they assumed that an appropriate adjustment to the policy rate path would help forestall that eventuality. This passage makes two important points. First, it stresses the risk of contagion from manufacturing into services and consumer spending as a precondition for recession. This risk has clearly increased, but we are not yet ready to abandon our base case outlook. For one thing, Chart 1 shows that the ISM Non-Manufacturing survey printed at 51.8 for one month in 2016, before rebounding sharply. Second, the “hard” economic data paint a much rosier picture that the “soft” survey data (Chart 2). Industrial production has already bounced off its lows and, unlike the ISM Manufacturing PMI, has not yet approached 2015/16 levels. Similarly, new orders for capital goods are much stronger than during the 2015/16 period. As for consumer spending, it continues to grow at a rapid pace despite the drop in confidence. Chart 3Expect One Rate Cut In October
Expect One Rate Cut In October
Expect One Rate Cut In October
The most logical explanation for the divergence between “hard” and “soft” data is that business and consumer sentiment are being pulled down by concerns about the ongoing trade war. Our sense is that some positive news on that front is now required to bring the survey data back into line with the “hard” numbers. On that note, we anticipate that the looming 2020 election will provide enough incentive for President Trump to reach some sort of détente with China. In fact, as we go to press, optimism about a potential trade deal has pushed the 10-year Treasury yield up above 1.70%. If this optimism is not vindicated, then weak survey data will eventually drag the “hard” data lower. The economy is at a critical and highly uncertain juncture. Amidst so much uncertainty, and with so much hinging on near-term political decisions, how should we expect the Fed to respond? The above passage from the September FOMC minutes gives us a strong clue. It illustrates that the Fed believes that sufficiently accommodative monetary policy will help mitigate the risk of contagion from manufacturing into services and consumer spending. In other words, the Fed must help weather the current storm by ensuring that financial conditions remain supportive. This means refraining from delivering hawkish surprises to market expectations.1 The Fed believes that sufficiently accommodative monetary policy will help mitigate the risk of contagion from manufacturing into services and consumer spending. With that in mind, we note that the market has mostly priced-in an October rate cut (Chart 3), and we expect the Fed to deliver on that expectation. Assuming an October cut, the market is only pricing-in a 28% chance of another cut in December. Overall, the market is priced for 59 basis points of rate cuts during the next 12 months. We anticipate a 25 bps cut this month, followed by an improvement in the economic data that will make further cuts unnecessary. Bottom Line: Our late-1990s & 2015/16 roadmap for the economy still holds, but risks are mounting. Despite the risks, we expect that trade tensions will calm enough for the economic data to improve during the next few months. The result will be one more Fed rate cut this month, followed by an extended on-hold period. Investors should keep portfolio duration low in that environment. High-Yield Quality Spreads: Less Than Meets The Eye Corporate bonds have generally performed quite well this year, but oddly, the lowest tier of junk has not kept pace (Chart 4). Investment grade excess returns have followed a typical risk-on pattern. That is, the lowest rated / riskiest credit tiers have performed best in a bull market. However, in the high-yield space, Caa-rated debt has bucked the trend and actually underperformed the duration-matched Treasury index by 33 bps. Chart 4Caa-Rated Junk Is Not Keeping Pace
Caa-Rated Junk Is Not Keeping Pace
Caa-Rated Junk Is Not Keeping Pace
Is this a potentially worrying sign for corporate spreads more generally? To consider the question, we looked at the historical relationships between quality spreads – the spread differential between low-rated and high-rated credit tiers – and the overall index spreads for both investment grade and high-yield. We found a strong positive correlation in both cases, but no leading or lagging properties. That is, quality spreads tend to follow the same trend as the overall index spread, but do not flag signs of trouble before the overall index. Nonetheless, the current divergence between the Caa/Ba quality spread and the high-yield index spread is highly unusual (Chart 5). Our sense, however, is that the divergence has less to do with concerns about credit quality and more to do with this year’s large moves in Treasury yields and changes to bond index duration. Chart 5De-Coupling In Quality Spreads...
De-Coupling In Quality Spreads...
De-Coupling In Quality Spreads...
Chart 6...Is Due To Duration
...Is Due To Duration
...Is Due To Duration
Specifically, we note that this year’s large decline in Treasury yields has caused junk index duration to plunge, but the drop has been greater for the Ba credit tier than the Caa credit tier (Chart 6). Ba index duration has fallen by 0.8 this year (from 4.4 to 3.5), while Caa index duration has fallen by 0.6 (3.4 to 2.8). The result is that if we control for changes in duration by looking at a 12-month breakeven spread instead of the average index option-adjusted spread (OAS), we see that the quality spread widening is roughly consistent with the overall index (Chart 6, panel 3).2 In other words, the steep drop in Treasury yields has not led to the same reduction in risk in the Caa credit tier as it has in the other junk credit tiers. Caa spreads have widened on a relative basis, as a result. This year’s large decline in Treasury yields has caused junk index duration to plunge. It’s also interesting to note that the opposite dynamic is afoot within the investment grade corporate space. The Baa/Aa quality spread is more or less consistent with the overall index spread in OAS terms (Chart 5, top panel), but the quality spread widening is exacerbated when the impact of changing duration is considered (Chart 6, panels 1 & 2). That is, index duration has lengthened by more for the upper credit tiers than it has for the Baa credit tier. This makes Baa corporates look particularly attractive in risk-adjusted terms, as we have noted in prior research.3 From a big picture perspective, it is unusual for Treasury yields to fall so much without a concurrent widening in credit risk premiums. Eventually, this anomaly will be resolved by either: Higher Treasury yields in the event that recession is avoided, or Wider credit spreads in the event of a contraction in U.S. economic activity But in the meantime, negatively convex sectors such as high-yield corporates and Agency MBS look particularly attractive on a risk-adjusted basis. These sectors have benefited from the drop in Treasury yields by seeing their durations fall. They should perform well as long as the current environment of low Treasury yields and stable credit spreads persists. We take a more detailed look at the prospects for risk-adjusted performance within the different investment grade bond sectors in the next section. Risk And Reward In Investment Grade Bond Sectors As mentioned above, in this week’s report we present a novel approach for considering the risk/reward trade-off between different investment grade sectors of the U.S. bond market. We consider 23 sectors in total: 4 corporate credit tiers Conventional 30-year Agency MBS and Agency CMBS Aaa-rated non-Agency CMBS, credit card ABS and auto loan ABS Domestic and Foreign Agency bonds Supranationals Local Authority bonds (mostly taxable munis and USD-denominated Canadian provincial debt) USD-denominated Sovereign bonds for 10 different emerging markets Reward First, we consider the reward side of the equation. We do not impose any macro view, but instead, use the average index OAS as the best estimate for each sector’s 12-month expected excess returns relative to a duration-matched position in Treasuries. Chart 7 shows the expected excess returns for each sector. Right away, the attractiveness of Mexican sovereign debt is apparent. Mexico carries an A rating, but offers a greater spread than the Baa corporate index. Chart 7Expected Returns
A Perspective On Risk And Reward
A Perspective On Risk And Reward
Risk We decided to assess risk using a breakeven spread framework. We calculate a 12-month breakeven spread for each sector. This spread represents the basis point spread widening required for each sector to break even with a duration-matched position in Treasury securities on a 12-month horizon. We calculate the breakeven spread using the following equation: 0 = OAS – D(B) + 0.5*CVXs*(dYs)2 - 0.5*CVXT*(dYT)2 Where: OAS = the sector’s option-adjusted spread D = the sector’s duration B = the breakeven spread CVXs = the sector’s convexity CVXT = the convexity of a duration-matched Treasury security dYs = trailing 1-year volatility of the sector’s yield dYT = trailing 1-year volatility of the duration-matched Treasury yield Chart 8 shows each sector’s 12-month breakeven spread, and it illustrates that the breakeven spread is a sub-optimal measure of risk. In theory, the highest breakeven spreads should be the least likely to see losses, but this is obviously not the case. Baa-rated South African Sovereign debt carries the largest breakeven spread, but it should be among the riskiest of the sectors. Chart 812-Month Breakeven Spreads
A Perspective On Risk And Reward
A Perspective On Risk And Reward
The missing piece of the puzzle is spread volatility. South African sovereign spreads need to widen by 39 bps before losses are incurred, while Aaa-rated credit card ABS spreads only need to widen by 13 bps. However, if spread volatility is much higher for South African sovereigns than for credit card ABS, then the sovereign sector still might be more likely to see losses. To control for this difference we calculate the standard deviation of annual spread changes for each sector, starting from May 2014 when all sectors have available data. We then divide each sector’s breakeven spread by the result. This calculation gives us a volatility-adjusted 12-month breakeven spread. In other words, it is the number of standard deviations of spread widening required for each sector to see losses on a 12-month horizon (Chart 9). Chart 912-Month Volatility-Adjusted Breakeven Spreads
A Perspective On Risk And Reward
A Perspective On Risk And Reward
Risk & Reward We bring risk and reward together in Charts 10-12. Chart 10 shows expected returns on the y-axis and the vol-adjusted 12-month breakeven spread on the x-axis. Sectors plotting near the top-right of the chart give the best returns and lowest risk of losses, while sectors plotting near the bottom-left provide low expected returns and high risk of losses. Immediately, Saudi Arabian sovereigns and Foreign Agency debt stand out as offering high expected returns for their risk levels. Note that South African sovereigns plot off the charts, toward the top-left of Charts 10-12, as indicated by the arrows. Chart 10Expected Returns Vs. Risk Of Negative Excess Returns
A Perspective On Risk And Reward
A Perspective On Risk And Reward
Chart 11Expected Returns Vs. Risk Of Losing 100 BPs
A Perspective On Risk And Reward
A Perspective On Risk And Reward
Chart 12Expected Returns Vs. Risk Of Losing 200 BPs
A Perspective On Risk And Reward
A Perspective On Risk And Reward
In Charts 11 and 12 we make one further refinement to our risk measure. In these charts, instead of calculating 12-month breakeven spreads, we calculate the spread change necessary for each sector to underperform Treasuries by 100 bps and 200 bps, respectively. Saudi Arabian sovereigns and Foreign Agency debt stand out as offering high expected returns for their risk levels. This adjustment arguably gives a more useful perspective on risk. For example, because spreads are quite narrow in the Supranational and Domestic Agency sectors, the risk of negative returns versus Treasuries is quite elevated. However, these sectors also carry high credit ratings and low spread volatility, making it exceedingly unlikely that they would deliver losses of 100 bps or more. Considering Charts 11 and 12, we look for sectors that clearly dominate other ones, i.e. plotting both higher and further to the right. Once again, Foreign Agencies and Saudi Arabian sovereigns both look very appealing. Mexican sovereign debt also offers very high expected return, and less risk that the Baa corporate sector. We would also like to point out the attractiveness of Agency MBS. As we noted in a recent report, Agency MBS offer considerably less risk than high-rated corporate debt, and similar expected returns. Note that this analysis doesn’t impose any macroeconomic view, and our sense is that the macro back-drop is more favorable for MBS spreads than for corporates.4 All in all, we reiterate our recommendation to favor Agency MBS over Aaa-, Aa- and A-rated corporate bonds. We will continue to refine this approach to measuring the risk/reward trade-off in the coming weeks, including incorporating high-yield debt into our analysis. Stay tuned. Ryan Swift, U.S. Bond Strategist rswift@bcaresearch.com Footnotes 1 For further discussion on this topic please see U.S. Bond Strategy Weekly Report, “Act As Appropriate”, dated August 27, 2019, available at usbs.bcaresearch.com 2 The 12-month breakeven spread is the spread widening required on a 12-month horizon to break even with a duration-matched position in Treasury securities. It can be approximated by dividing the option-adjusted spread by duration, as is done in Chart 6. 3 Please see U.S. Bond Strategy Weekly Report, “Two Themes And Two Trades”, dated October 1, 2019, available at usbs.bcaresearch.com 4 Please see U.S. Bond Strategy Weekly Report, “Two Themes And Two Trades”, dated October 1, 2019, available at usbs.bcaresearch.com Fixed Income Sector Performance Recommended Portfolio Specification
Highlights In this Weekly Report, we present our semi-annual chartbook of the BCA Central Bank Monitors. All of the Monitors are now below the zero line, indicating a growing need to ease global monetary policy (Chart of the Week). Central bankers have already gone down that path in several countries over the past few months (the U.S., the euro area, Australia and New Zealand), helping sustain the powerful 2019 rally in global bond markets. Feature With the global manufacturing & trade downturn now threatening to spill over into domestic demand in the major developed markets, policymakers will need to stay dovish to stave off recession. This will keep global bond yields at depressed levels in the near term, at least until widely-followed data like manufacturing PMIs stabilize and/or there is positive news on U.S.-China trade negotiations. Chart of the WeekStrong Pressures To Ease Global Monetary Policy
Strong Pressures To Ease Global Monetary Policy
Strong Pressures To Ease Global Monetary Policy
Yields already discount a lot of bad economic news, however, and there is a ray of hope visible in the bottoming out of our global leading economic indicator. A sustainable bottom in global bond yields, though, will require some change in the current downward growth or inflation momentum highlighted in our Central Bank Monitors. Yields already discount a lot of bad economic news, however, and there is a ray of hope visible in the bottoming out of our global leading economic indicator. A sustainable bottom in global bond yields, though, will require some change in the current downward growth or inflation momentum highlighted in our Central Bank Monitors. An Overview Of The BCA Central Bank Monitors* Chart 2Low Bond Yields Are Consistent With Our CB Monitors
Low Bond Yields Are Consistent With Our CB Monitors
Low Bond Yields Are Consistent With Our CB Monitors
The BCA Central Bank Monitors are composite indicators designed to measure the cyclical growth and inflation pressures that can influence future monetary policy decisions. The economic data series used to construct the Monitors are not the same for every country, but the list of indicators generally measure the same things (i.e. manufacturing cycles, domestic demand strength, commodity prices, labor market conditions, exchange rates, etc). The data series are standardized and combined to form the Monitors. Readings above the zero line for each Monitor indicate pressures for central banks to raise interest rates, and vice versa. Through the nexus between growth, inflation, and market expectations of future interest rate changes, the Monitors do exhibit broad correlations to government bond yields in the Developed Markets (Chart 2). All of the Monitors are currently pointing in a bond-bullish direction, making them less useful as a country allocation tool within global bond portfolios. With easing pressures most intense in the euro area, given that the ECB Monitor has the lowest reading, our recommended overweight stance on core euro area government bonds (hedged into U.S. dollars) remains well supported. In each BCA Central Bank Monitor Chartbook, we include a new chart for each country that we have not shown previously. In this edition, we show the components of the Monitors, grouped into those focusing on economic growth and inflation, plotted against our central bank discounters that indicate the amount of rate cuts/hikes priced into global Overnight Index Swap (OIS) curves. Fed Monitor: Signaling A Need For More Cuts Our Fed Monitor has fallen below the zero line (Chart 3A), indicating that the Fed’s summer rate cuts were justified with more easing still required. The Monitor, however, has not yet fallen to levels seen during U.S. recessions and is more consistent with the below-trend growth periods in 2016 and the late-1990s. The views of the FOMC on U.S. monetary policy are more deeply divided now than has been seen in many years. The doves can point to slumping global growth, persistent trade uncertainty, contracting capital spending and falling inflation expectations as reasons to continue cutting rates. The hawks can look at continued labor market tightness, elevated asset prices and realized inflation rates holding near the Fed’s 2% inflation target (Chart 3B) as reasons to keep monetary policy steady. That mixed picture can be seen in the components of our Fed Monitor, with the growth components showing the biggest pressure for more rate cuts compared to more stable readings from the inflation and financial components (Chart 3C). Chart 3AU.S.: Fed Monitor
U.S.: Fed Monitor
U.S.: Fed Monitor
Chart 3BU.S. Realized Inflation Holding Firm
U.S. Realized Inflation Holding Firm
U.S. Realized Inflation Holding Firm
Chart 3CGreatest Pressure For Fed Rate Cuts From Growth Components Of Our Fed Monitor
Greatest Pressure For Fed Rate Cuts From Growth Components Of Our Fed Monitor
Greatest Pressure For Fed Rate Cuts From Growth Components Of Our Fed Monitor
The U.S. Treasury market may have gotten ahead of itself after the latest decline in yields, which looks stretched versus the Fed Monitor. The U.S. Treasury market may have gotten ahead of itself after the latest decline in yields, which looks stretched versus the Fed Monitor (Chart 3D). We still expect the Fed to deliver just one more rate cut at the FOMC meeting at the end of October, as the “hard” U.S. data is outpeforming the “soft” data like the weak ISM surveys. That leaves Treasury yields vulnerable to some rebound if global growth stabilizes, although that is conditional on no new breakdown of the U.S.-China trade negotiations – a factor that continues to weigh on U.S. business confidence. Chart 3DTreasury Yields More Than Fully Discount Fed Easing Pressures
Treasury Yields More Than Fully Discount Fed Easing Pressures
Treasury Yields More Than Fully Discount Fed Easing Pressures
BoE Monitor: Easier Policy Needed Our Bank of England (BoE) Monitor, which was in the “tighter money required” zone from 2016-18, has been below the zero line since April of this year (Chart 4A). The market agrees with the message from the Monitor and is now pricing in -12bps of rate cuts over the next twelve months. The relentless uncertainty surrounding Brexit has triggered sharp downgrades of growth expectations and weakened business confidence, which the BoE is now factoring into its own projections. In the August Inflation Report, the BoE lowered its 2020 inflation forecast to below 2% - no surprise given the sharp fall in realized inflation that has already occurred even as economic growth has still not yet fallen substantially below trend (Chart 4B). Chart 4AU.K.: BoE Monitor
U.K.: BoE Monitor
U.K.: BoE Monitor
Chart 4BFalling U.K. Inflation Opens The Door To A BoE Ease
Falling U.K. Inflation Opens The Door To A BoE Ease
Falling U.K. Inflation Opens The Door To A BoE Ease
Still, weakening growth components have been the main driver of the BoE Monitor into rate cut territory (Chart 4C). While a strong jobs market is helping support consumer spending, the Brexit turmoil is having a lasting impact on future growth. Since the 2016 Brexit referendum, business confidence and real business investment have collapsed which, in turn, has hurt productivity growth, as we discussed in a Special Report last month.1 Chart 4CBrexit Uncertainty + Slumping Growth = Pressure For BoE Rate Cuts
Brexit Uncertainty + Slumping Growth = Pressure For BoE Rate Cuts
Brexit Uncertainty + Slumping Growth = Pressure For BoE Rate Cuts
The uncertainty around Brexit dominates the economic outlook and any future BoE decisions. Our Geopolitical Strategy service anticipates that Brexit will be delayed beyond October 31st. As a result, uncertainty will continue to weigh on Gilt yields, even though yields have already fallen in line with our BoE Monitor (Chart 4D). We continue to recommend an overweight stance on U.K. Gilts. Chart 4DGilt Yields Have Fallen In Line With Our BoE Monitor
Gilt Yields Have Fallen In Line With Our BoE Monitor
Gilt Yields Have Fallen In Line With Our BoE Monitor
ECB Monitor: Intense Pressure For Easier Monetary Policy Our European Central Bank (ECB) Monitor is now well below the zero line, signaling a strong need for easier monetary policy (Chart 5A). The global manufacturing downturn has hit the export-dependent economies of the euro area hard, with Germany now likely in a technical recession. Our European Central Bank (ECB) Monitor is now well below the zero line, signaling a strong need for easier monetary policy. Despite the weaker growth momentum, there remains far less spare capacity in the euro area economy than at any time since before the 2009 global recession (Chart 5B). This is keeping realized inflation in positive territory, in contrast to what was seen during the previous downturn in 2015-16. Chart 5AEuro Area: ECB Monitor
Euro Area: ECB Monitor
Euro Area: ECB Monitor
Chart 5BEuro Area Inflation Is Subdued, Despite Tight Labor Markets
Euro Area Inflation Is Subdued, Despite Tight Labor Markets
Euro Area Inflation Is Subdued, Despite Tight Labor Markets
The ECB has already responded to the weakening growth & inflation pressures, introducing a new TLTRO program back in March and then cutting the overnight deposit rate and restarting its Asset Purchase Program in September. The latest policy moves were reported to be more contentious, with the “hard money” northern euro area countries opposed to restarting bond purchases. The new incoming ECB President, Christine Lagarde, will likely have her hands full trying to gain consensus on any further easing measures from here, even as both the growth and inflation components of our ECB Monitor indicate that more stimulus is needed (Chart 5C). Chart 5CA Consistent Message On The Need For Future ECB Easing From Growth & Inflation
A Consistent Message On The Need For Future ECB Easing From Growth & Inflation
A Consistent Message On The Need For Future ECB Easing From Growth & Inflation
The big decline in euro area bond yields, which has pushed large swaths of sovereign yields into negative territory, does not look particularly stretched relative to the plunge in the ECB Monitor (Chart 5D). Without signs that the global manufacturing downturn is ending, however, euro area yields will stay mired at current deeply depressed levels. We recommend a moderate overweight on core European government bonds, on a currency-hedged basis into U.S. dollars. Chart 5DBund Rally Looks In Line With The ECB Monitor
Bund Rally Looks In Line With The ECB Monitor
Bund Rally Looks In Line With The ECB Monitor
BoJ Monitor: A Rate Cut On The Horizon? Our Bank of Japan (BoJ) Monitor has drifted slightly below the zero line into “rate cut required” territory (Chart 6A). Over the past few years, the BoJ’s monetary policy has remained unchanged for the most part and its messaging has grown less dovish, citing an expanding economy. However, recent Japanese economic data shows widespread deterioration in growth momentum, as the nation has been hit hard by the global manufacturing and trade recession. Yet even with weaker growth, Japan’s unemployment rate keeps hitting all-time lows. This has not helped boost inflation much, though, with Japan’s CPI inflation still struggling to reach even the 1% level (Chart 6B). Still, the latest leg lower in our BoJ Monitor has been driven by the growth, rather than inflation, components (Chart 6C). Chart 6AJapan: BoJ Monitor
Japan: BoJ Monitor
Japan: BoJ Monitor
Chart 6BNo Spare Capacity In Japan, But Still No Inflation
No Spare Capacity In Japan, But Still No Inflation
No Spare Capacity In Japan, But Still No Inflation
Weakening confidence has resulted in significant declines in both consumer spending and business investment. Due to the struggling domestic economy, it was expected that the Abe government would postpone the scheduled consumption tax hike, but it was finally initiated on October 1st. The timing could not be worse given the ongoing contraction in global manufacturing and trade activity that has clearly spilled over into Japan’s export and industrially-focused economy. Chart 6CThe Slumping Japanese Economy Could Use Some More BoJ Assistance
The Slumping Japanese Economy Could Use Some More BoJ Assistance
The Slumping Japanese Economy Could Use Some More BoJ Assistance
The BoJ will likely try and deliver some sort of easing in the next few months, but its options are limited after years of already hyper-easy policy. A modest rate cut is likely all that will be delivered, on top of a continuation of the Yield Curve Control policy. That will be enough to keep JGB yields at depressed levels (Chart 6D), even if global yields were to begin climbing. Chart 6DJGB Yields Look Fairly Valued Vs The BoJ Monitor
JGB Yields Look Fairly Valued Vs The BoJ Monitor
JGB Yields Look Fairly Valued Vs The BoJ Monitor
BoC Monitor: Rate Cuts Needed, But Will The BoC Deliver? The Bank of Canada (BoC) Monitor has been below zero since April of this year, indicating a need for easier monetary policy (Chart 7A). Although the BoC has maintained its policy rate at 1.75%, dovish Fed policy and softening domestic economic growth are making it harder for the BoC to continue sitting on its hands Although the Canadian labor market remains solid, household consumption has continued to weaken alongside falling consumer confidence. However, the inflation rate for both headline and core CPI measures is still hovering near the mid-point of BoC 1-3% target range (Chart 7B). Chart 7ACanada: BoC Monitor
Canada: BoC Monitor
Canada: BoC Monitor
Chart 7BRising Inflation Making The BoC’s Job Harder
Rising Inflation Making The BoC's Job Harder
Rising Inflation Making The BoC's Job Harder
At the moment, our BoC Monitor is more influenced by weaker growth components than stabilizing inflation components (Chart 7C). Similar mixed messages are also evident in other data. According to the latest BoC Business Outlook Survey, the overall outlook has edged up to the historical average,2 but real capex growth remains in negative territory and manufacturing new orders are still falling. In contrast, the Canadian labor market remains tight and both wage and price inflation are holding firm. Chart 7CBoC Growth & Inflation Components Signaling Moderate Pressure To Ease
BoC Growth & Inflation Components Signaling Moderate Pressure To Rise
BoC Growth & Inflation Components Signaling Moderate Pressure To Rise
Canadian government bonds have rallied strongly this year, but the yield momentum has appeared to overshoot the decline in our BoC Monitor (Chart 7D). The Canadian OIS curve is discounting -27bps of rate cuts over the next twelve months, but the BoC is not signaling that they will ease. We upgraded our recommended stance on Canadian government bonds to neutral back in May, and we see no need to alter that view without further evidence of more deterioration in Canadian growth or inflation data.3 Chart 7DCanadian Bond Rally Looks A Bit Stretched
Canadian Bond Rally Looks A Bit Stretched
Canadian Bond Rally Looks A Bit Stretched
RBA Monitor: Expect Another Cut The Reserve Bank of Australia (RBA) Monitor has been below the zero line since September 2018, indicating a need for easier monetary policy (Chart 8A). The RBA has already delivered on that signal this year, cutting the Cash Rate twice to an all-time low of 0.75%. Markets are still expecting more, with the Australian OIS curve discounting another -29bps of cuts over the next year, although most of those cuts are expected to occur within the next six months. The signal from our RBA Monitor suggests that Australian bond yields should remain under downward pressure, although the yield momentum has been excessive relative to the fall in the Monitor. Both headline and core CPI inflation remain below the RBA’s 2-3% target range (Chart 8B), and the central bank continues to lower its inflation forecasts, suggesting an entrenched dovish bias. Chart 8AAustralia: RBA Monitor
Australia: RBA Monitor
Australia: RBA Monitor
Chart 8BNo Inflation For The RBA To Worry About
No Inflation For The RBA To Worry About
No Inflation For The RBA To Worry About
The latest downturn in our RBA Monitor is related to declines in both the inflation and growth components (Chart 8C). The weakness in the growth components is led by falling exports to Asia, in addition to the sharp drop in house prices in the major cities. The fall in the inflation components reflects both weak inflation expectations and spare capacity in labor markets. Chart 8CA Loud & Clear Message On The Need For RBA Easing
A Loud & Clear Message On The Need For RBA Easing
A Loud & Clear Message On The Need For RBA Easing
The signal from our RBA Monitor suggests that Australian bond yields should remain under downward pressure, although the yield momentum has been excessive relative to the fall in the Monitor (Chart 8D). Australia’s economy will not begin to outperform again, however, until China’s current growth slump starts to bottom out, which is unlikely to occur until the first quarter of 2020 at the earliest. Thus, we expect the RBA to deliver another rate cut before the end of the year, justifying a continued overweight stance on Australian government bonds. Chart 8DA Lot Of Bad News Discounted In Australian Bond Yields
A Lot Of Bad News Discounted In Australian Bond Yields
A Lot Of Bad News Discounted In Australian Bond Yields
RBNZ Monitor: More Easing To Come Our Reserve Bank of New Zealand (RBNZ) monitor remains well below zero, indicating that easier monetary policy is still required (Chart 9A). The central bank has already delivered two rate cuts this year: a -25bps cut in May and, more importantly, a shock rate cut of -50bps in August. Forward guidance remains dovish, with RBNZ Governor Adrian Orr signaling more easing is likely and even hinting at negative rates in the future. This rhetoric is reflected in the NZ OIS curve, which is pricing in a further -42bps of easing over the next twelve months. High inflation is not a constraint for the RBNZ. Both headline and core measures of inflation are currently at 1.7% (Chart 9B). As the RBNZ targets a 1-3% range over the medium term, the prospect of overshooting the 2% longer-term target will not restrict policymakers from acting as appropriate to boost growth. Chart 9ANew Zealand: RBNZ Monitor
New Zealand: RBNZ Monitor
New Zealand: RBNZ Monitor
Chart 9BNZ Inflation Creeping Higher
NZ Inflation Creeping Higher
NZ Inflation Creeping Higher
Most of the pressure to ease has come from the continued deterioration in the growth component of our RBNZ Monitor (Chart 9C), reflecting weakness in manufacturing and consumption. The manufacturing PMI is currently in contractionary territory at 48.4, having fallen almost five points since February of this year. Annual growth in retail sales has been slowing for the past two years while consumer confidence is at 7-year lows. Chart 9CWeak Growth Is The Reason RBNZ Rate Cuts Are Needed
Weak Growth Is The Reason RBNZ Rate Cuts Are Needed
Weak Growth Is The Reason RBNZ Rate Cuts Are Needed
We feel confident in reiterating our bullish recommendation on NZ government bonds versus U.S. and German sovereign debt. The RBNZ Monitor suggests that policy will stay dovish for some time, while NZ yields still offer a relatively attractive yield, unlike deeply overbought Treasuries and Bunds (Chart 9D). Chart 9DStill A Bullish Case For New Zealand Government Bonds
Still A Bullish Case For New Zealand Government Bonds
Still A Bullish Case For New Zealand Government Bonds
Riksbank Monitor: Watching And Waiting Our Riksbank Monitor remains very slightly below zero and the market is currently priced for -4bps of rate cuts over the next year (Chart 10A). The Riksbank has decided to hold the Repo Rate constant at -0.25% while forecasting a hike towards the end of this year or the beginning of 2020. Given the policy environment, rate cuts remain unlikely. At most, the Riksbank can further delay rate hikes if the data continues to disappoint. The Riksbank noted in its September Monetary Policy Report that the unexpectedly weak development of the labor market indicates that resource utilization will normalize sooner than expected. This is reflected in Chart 10B, where the unemployment gap is now negative. Meanwhile, inflation readings are giving a mixed signal for the central bank. While the headline CPI measure has declined precipitously year-to-date, owing to the dramatic fall in oil prices, core inflation has continued to climb steadily. Chart 10ASweden: Riksbank Monitor
Sweden: Riksbank Monitor
Sweden: Riksbank Monitor
Chart 10BMixed Messages From Swedish Inflation
Mixed Messages From Swedish Inflation
Mixed Messages From Swedish Inflation
As a result, the inflation components of our Riksbank monitor - driven by a spike in the Citigroup Inflation Surprise Index, wage growth hooking upward and inflation expectations holding firm around 2% - are signaling the need for tighter monetary policy (Chart 10C). However, the growth components – led by weak exports, employment, and manufacturing data - are exerting pressure in the opposite direction. This is evident in the Swedish Manufacturing PMI, which tumbled from 51.8 to 46.3 in September, deep into contractionary territory. Chart 10CThere Is A Reason Why The Riksbank Has Been On Hold
There Is A Reason Why The Riksbank Has Been On Hold
There Is A Reason Why The Riksbank Has Been On Hold
Keeping in mind the inflation constraint, it remains unlikely that the Riksbank will cut rates unless the economic data disappoints more significantly to the downside. This should help put a floor under Swedish bond yields in the near term (Chart 10D). Chart 10DSwedish Yields Have Fallen Too Far, Too Fast
Swedish Yields Have Fallen Too Far, Too Fast
Swedish Yields Have Fallen Too Far, Too Fast
Robert Robis, CFA Chief Fixed Income Strategist rrobis@bcaresearch.com Ray Park, CFA Research Analyst ray@bcaresearch.com Shakti Sharma Research Associate shaktis@bcaresearch.com Footnotes * NOTE: All information in this report reflects our knowledge of global events as of Thursday, October 10. 1 Please see BCA Global Fixed Income Strategy Special Report “United Kingdom: Cyclical Slowdown Or Structural Malaise?” dated September 20, 2019, available at gfis.bcaresearch.com. 2https://www.bankofcanada.ca/2019/06/business-outlook-survey-summer-2019/ 3 Please see BCA Global Fixed Income Weekly Report, “Reconcilable Differences” dated May 8, 2019, available at gfis.bcaresearch.com. Recommendations The GFIS Recommended Portfolio Vs. The Custom Benchmark Index
BCA Central Bank Monitor Chartbook: Intensifying Pressure To Ease
BCA Central Bank Monitor Chartbook: Intensifying Pressure To Ease
Duration Regional Allocation Spread Product Tactical Trades Yields & Returns Global Bond Yields Historical Returns
The LPR rate is essentially the MLF rate plus bank profit margins. The market will guide the top line lending rate, while the PBoC will have control over the floor rate (MLF) through open market operations. The fact that the PBoC is keeping the MLF rate…
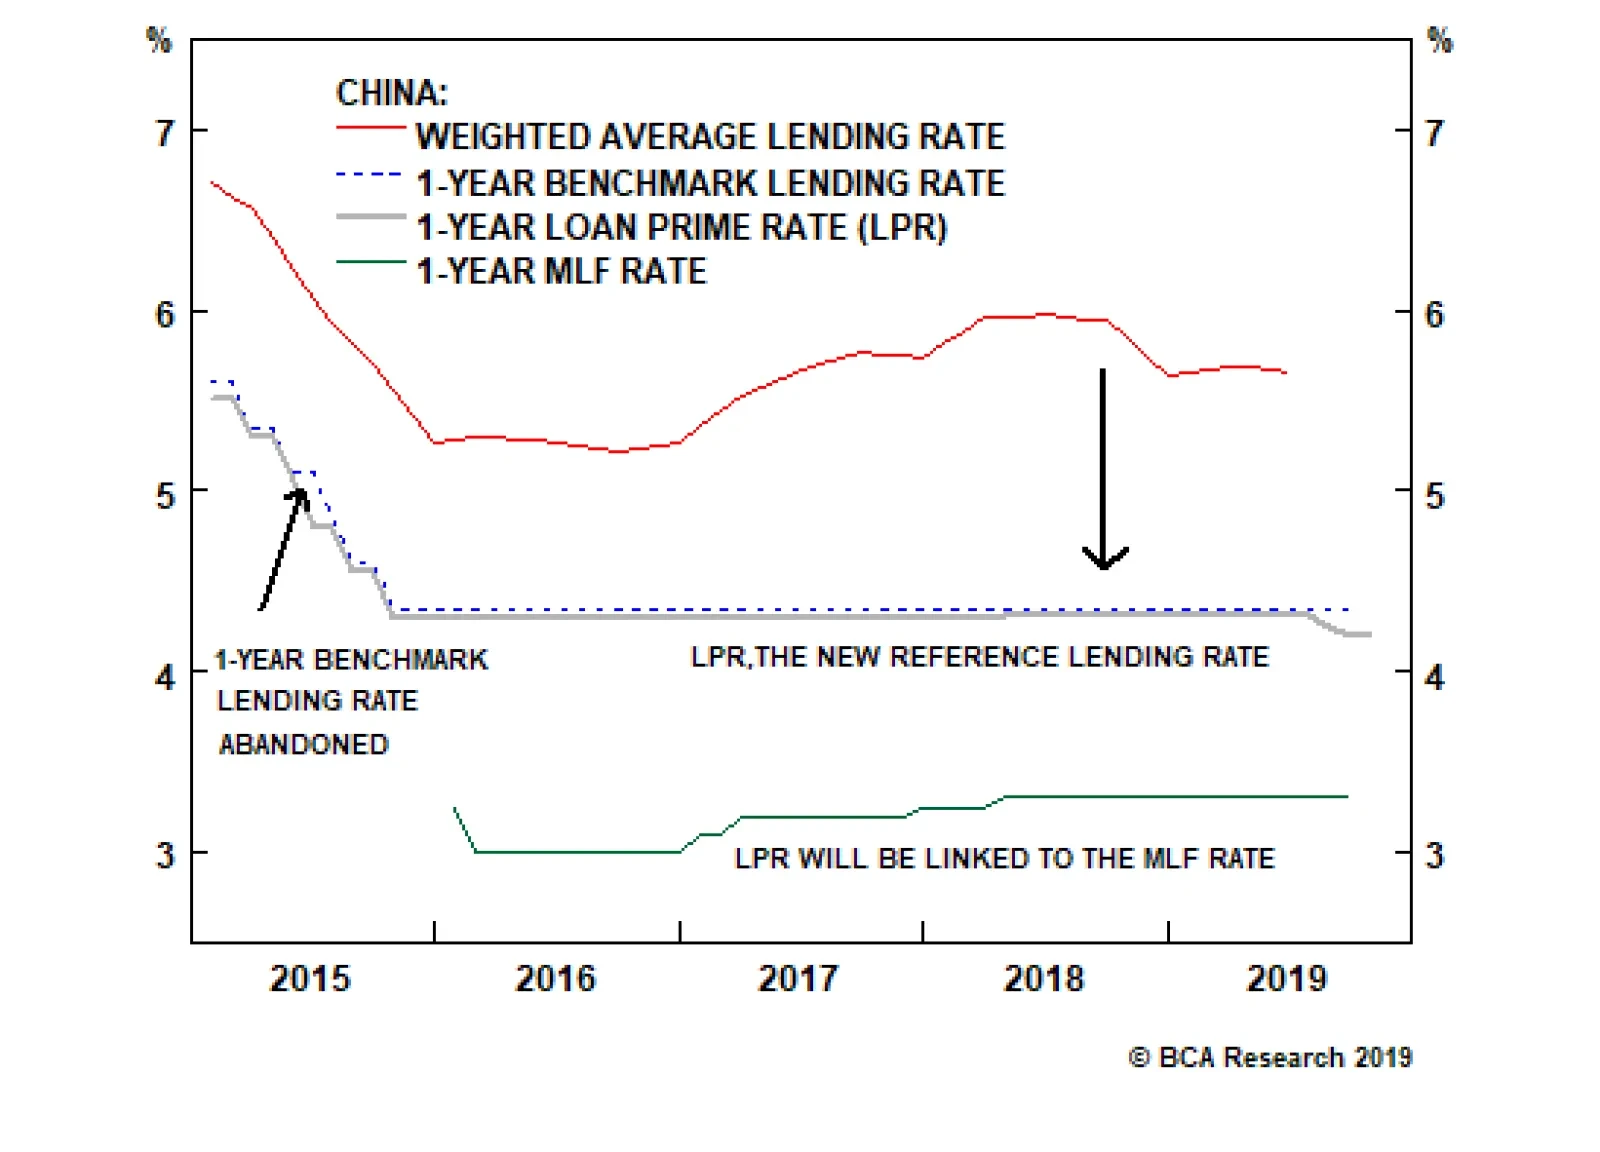
On August 20th, the PBoC launched a new loan prime rate (LPR) system, a revamped reference regime for setting bank loan interest rates. In September, the new LPR rate for one-year bank loans was lowered by five basis points. The new LPR reform is designed…
Highlights The Chinese economy is still slowing, and there is not yet enough evidence from forward-looking economic data to suggest a turnaround is imminent. Deflation has returned to China’s industrial sector. Even though overall price deceleration has been relatively mild, it is further squeezing already deteriorating industrial profit growth. We do not expect deflation to spiral into a 2015/2016-style episode, which removes at least one risk to our growth outlook. At the same time, a mild deceleration in prices will not provide enough incentive for Chinese policymakers to hit the stimulus button. The People’s Bank of China’s new interest rate-setting regime, the LPR, will not provide much in the way of stimulus over the next few months. But it has the potential to improve China’s monetary policy transmission mechanism over the coming year, increasing the odds that policymakers will succeed in stabilizing economic activity. Short-term downside risks to growth have not abated, and we remain tactically bearish on Chinese stocks. Cyclically, we continue to recommend an overweight stance, on the basis of an eventual reacceleration in economic activity. Feature Chart 1The Chinese Economy Is Still Slowing
The Chinese Economy Is Still Slowing
The Chinese Economy Is Still Slowing
China’s economy is at a critical juncture: “Half-measured” stimulus so far has been able to keep the domestic economy in better shape than in the 2015-2016 down cycle, but overall economic activity has not bottomed (Chart 1). The Sino-America trade talk has resumed at the moment, but the two sides have yet to make any substantive progress towards a deal. In the meantime, the global economy has also reached a critical point where the degree of economic weakness has the potential to feed on itself, possibly triggering a recession.1 This underscores our tactically bearish stance towards Chinese stocks versus the global equity benchmark. Barring more forceful stimulus or resolution on the trade front, any external shock and/or internal policy missteps could easily tip the Chinese economy into a deeper growth slowdown. Hence, downside risks remain elevated for Chinese stocks over the next 3- to 6-months. The “D” Word Returns, But Won’t Spur Aggressive Further Easing Chart 2Industrial Price Deflation Returns
Industrial Price Deflation Returns
Industrial Price Deflation Returns
Economic data over the past two months have provided mixed signals. Readings from both China’s National Bureau of Statistics (NBS) PMI and from the Caixin PMI show an improvement in the manufacturing sector. However, industrial deflation has returned to China: Three years after the country declared victory against a prolonged industrial destocking cycle, producer price inflation (PPI) relapsed into negative territory in July and declined further in August (Chart 2). While prices are typically lagging indicators and reflect lingering effects from past economic conditions, there is not enough evidence in forward-looking economic data right now to suggest a turnaround in the economy is imminent.2 A deflationary PPI is not a trivial source of concern for Chinese policymakers. Last time growth in China’s PPI turned negative, it took policymakers four and a half years and an annualized 28% of GDP worth of credit expansion to pull the industrial sector out of its deflationary cycle. Chart 3Deflation Threatens Recovery In Industrial Profit Growth
Deflation Threatens Recovery In Industrial Profit Growth
Deflation Threatens Recovery In Industrial Profit Growth
For investors, deflation has pernicious effects on profits, and we have received several client inquiries concerning the topic since PPI growth turned negative. The historical relationship suggests profit growth for both the A-share and investable markets is highly linked to fluctuations in producer prices (Chart 3), and China’s industrial sector profit growth has already been rapidly deteriorating over the past 12 months. The good news is that we do not expect the current episode of PPI deflation to become as protracted as it did in 2012-2016, or as severe as in 2015-2016. Two reasons underpin our view: Since early-2018, monetary policy has been much easier than during past deflationary episodes. Monetary policy in the past year and half has been much more accommodative than in the three years leading to the deep industrial deflationary cycle in 2015, particularly on the exchange rate front. The RMB was soft-pegged to a rising U.S. dollar before it was decoupled by the PBoC in August 2015, and was appreciating against its trading partners throughout most of 2012-2015. Bank lending rates were also kept at historically high levels during this period (Chart 4). This time, even though money and credit growth has not returned to the same pace as in 2015-2016, current ultra-loose monetary conditions should spur enough credit growth to keep prices from deflating aggressively. Chart 4Monetary Conditions Easier Than Last Cycle
Monetary Conditions Easier Than Last Cycle
Monetary Conditions Easier Than Last Cycle
Inventory levels are low, and capacity levels do not appear to be overly excessive. After years of industrial consolidation, China’s industrial capacity does not appear to be particularly excessive compared to the past cycle. This is distinctively different from the prolonged contraction in PPI between 2012 and 2016, when China’s industrial inventories were coming off a five-year-long destocking cycle, and capacity utilization fell markedly (Chart 5). This is not the case today. Moreover, even though final demand has been weak, production has retrenched even more, drawing down inventories to the point where the pace of inventory destocking may have reached a cyclical bottom (Chart 6). A re-stocking of industrial goods should boost producers’ pricing power. Chart 5Capacity Is Not Excessively Underutilized
Capacity Is Not Excessively Underutilized
Capacity Is Not Excessively Underutilized
Chart 6Inventory Destocking May Be Bottoming Out
Inventory Destocking May Be Bottoming Out
Inventory Destocking May Be Bottoming Out
But the bad news (for investors), is that contained, or mild producer price deflation will not be reason alone to spur aggressive further easing from policymakers. This means that the re-emergence of price deflation, even mild and short-lived, will weigh on earnings and investor sentiment. Bottom Line: This episode of producer price deflation is unlikely to become as pernicious as occurred in the past, but policymakers are thus unlikely to act aggressively to counter it. While this removes some of the downside risks for Chinese stocks, even mild deflation will weigh on earnings growth (and thus sentiment) which underscores our tactically bearish stance on Chinese stocks. Demystifying China’s New Loan Prime Rate: Not The Stimulus You Are Looking For On August 20th, the PBoC launched a new loan prime rate (LPR) system, a revamped reference regime for setting bank loan interest rates3 (Chart 7). In September, the new LPR rate for one-year bank loans was lowered by five basis points. Since then, the market has been fixated on predicting whether the PBoC will cut the Medium-Lending Facility (MLF) rate next, which would be perceived as a change in China’s monetary stance. Chart 7China's New LPR: A Shadow 'Tax Cut'
China's New LPR: A Shadow "Tax Cut"
China's New LPR: A Shadow "Tax Cut"
PBoC will increase its control of the pricing of credit, while tight financial regulations will restrict the size and speed of credit growth. The new LPR reform, in our view, is designed to force state-owned (and better-capitalized) commercial banks to hand out a “tax cut” to struggling small- and medium-sized enterprises (SMEs) by lowering bank lending rates. At the same time, it allows the PBoC to take back control of the pricing of credit from commercial banks, “killing two birds with one stone.” There are three main market implications from this approach: The new LPR is likely to gradually narrow the gap between corporate bond yields (i.e. “market rates”) and bank lending rates; A cut in the MLF rate in the near term should be interpreted as a “reward” to commercial banks rather than a stimulus for the economy; Most importantly, the new LPR system does not mean rapid credit expansion is in the cards. Quite the opposite, in the near term, banks may tighten their lending. The wide spread between the 3-month interbank repo rate and average bank lending rate illustrates the reason why the PBoC has introduced the LPR.4 This gap is also evident when comparing the yield of AAA-rated corporate bonds and the average bank lending rate (Chart 8). These gaps exist because Chinese commercial banks have largely manipulated the 1-year bank lending rate set by the PBoC when lending to their “preferred customers,” usually state-owned enterprises and real estate developers, by offering significantly discounted loan rates. Banks then charge substantial “risk premiums” on loans to the private sector, mostly SMEs, to make up for the narrower profit margins on loans to SOEs (Chart 9). Chart 8An Impaired Monetary Policy Transmission Mechanism
An Impaired Monetary Policy Transmission Mechanism
An Impaired Monetary Policy Transmission Mechanism
Chart 9Evidence Of Asymmetrical Lending Practices
Evidence Of Asymmetrical Lending Practices
Evidence Of Asymmetrical Lending Practices
The new LPR system is designed to minimize this discrepancy, since the new LPRs are more market based and are quoted based on the price of loans banks charge their prime clients. By design, the new LPR system should force the average bank lending rate closer to the rate companies borrow in the bond market. This means bank lending rates will be guided lower, including lending rates for SMEs. However, the new system will be implemented in phases, and the PBoC is likely to gradually guide LPRs lower to allow banks to readjust their pricing models. The LPR rate is essentially the MLF rate plus bank profit margins (the added basis points above the MLF rate). The market will guide the top line lending rate, while the PBoC will have control over the floor rate (MLF) through open market operations. The fact that the PBoC is keeping the MLF rate unchanged while allowing the LPR to drop (albeit slightly) sends an explicit message: The PBoC is forcing banks to lower lending rates first before boosting their now-narrowed profit margins by lowering the MLF rate. In contrast to expectations of market participants that the LPR system will ease credit conditions, banks may actually tighten their lending in the coming months. While the PBoC will increase its control of the pricing of bank loans by the rate reform plan, the strengthening in financial regulations that has occurred over the past year will restrict the size and speed of credit growth. This combination has created more room for monetary easing without unleashing “animal spirits.” Borrowing costs to risky institutions have been higher since the Baoshang Bank takeover and are likely to remain elevated even if interest rates are lower (Chart 10). More importantly, mortgage and real estate developer loans together account for nearly 30% of total bank credit. Unless policymakers ease the brakes on lending restrictions to the property sector, bank lending growth is unlikely to pick up meaningfully (Chart 11). In fact, the PBoC has explicitly excluded mortgage and property-related lending from benefitting from the LPR rate cut.5 Barring a significant worsening in economic data, we do not expect the PBoC to lower mortgage lending and real estate-related loan rates in the coming months. Chart 10Tightened Financial Regulations Will Keep Cost Of Risky Lending High
Tightened Financial Regulations Will Keep Cost Of Risky Lending High
Tightened Financial Regulations Will Keep Cost Of Risky Lending High
Chart 11Mortgage Rate Unlikely To Return To Its 2016 Low
Mortgage Rate Unlikely To Return To Its 2016 Low
Mortgage Rate Unlikely To Return To Its 2016 Low
Finally, in the next two- to three-quarter mandatory implementation period, banks will be readjusting their pricing and credit risk-assessing models. During the transition, we expect more cautious sentiment among both lenders and borrowers. Hence, in the short term, bank loan growth may actually moderate. Bottom Line: The new LPR system may lower China’s banking sector profits in the short term. But in the next 6- to 12-months, we expect the PBoC to compensate commercial banks by keeping ample liquidity in the interbank system and by eventually lowering the MLF rate. The new LPR system may slow bank credit growth in the next few months, but after its full implementation (by the second quarter of 2020), it will have the potential to make PBoC’s policy more effective. Investment Conclusions We expect two phases of Chinese equity relative performance over the coming year: one phase of flat-to-potentially seriously down performance to last from now until sometime in the first quarter of 2020 when the economy bottoms, and then a phase of outperformance. Our expectation that the economy will bottom in Q1 2020 rests on the existing reflationary response by Chinese policymakers and an improved monetary transmission mechanism. Chart 12We Expect The Chinese Economy To Bottom In Q1 2020
We Expect The Chinese Economy To Bottom In Q1 2020
We Expect The Chinese Economy To Bottom In Q1 2020
Our expectation that the economy will bottom in the first quarter of 2020 continues to rest on the existing reflationary response by Chinese policymakers (Chart 12), and the fact that China’s new LPR system has the potential to improve what is currently a seriously impaired monetary transmission mechanism beyond the next two or three quarters. But the existing response of policymakers has been considerably more measured when compared to past economic cycles, meaning that equity investors are unlikely to be as forward-looking as they otherwise might be. Weak producer price deflation will weigh on investor sentiment, and it is unlikely to be weak enough to spur aggressive further easing. The potential for further escalation of the U.S.-China trade war also compellingly argues against an overweight stance in the near-term, even if we expect economic growth to subsequently improve. Consequently, we remain tactically bearish and cyclically bullish towards Chinese stocks: medium-term investors who are already positioned in favor of China-related assets should stay long, whereas investors who have not yet moved to an overweight stance should wait for a better buying opportunity to emerge over the coming few months. Jing Sima China Strategist JingS@bcaresearch.com Footnotes 1 Please see Global Investment Strategy Outlook “Fourth Quarter 2019 Strategy Outlook: A “Show Me” Market”, dated October 4, 2019, available at gis.bcaresearch.com 2 Please see China Investment Strategy Weekly Report “China Macro And Market Review”, dated October 2, 2019, available at cis.bcaresearch.com 3 Announcement of the People’s Bank of China on Improving Loan Prime Rate (LPR) Formation Mechanism, August 19, 2019, available at http://www.pbc.gov.cn/en/3688110/3688172/3877490/index.html 4 PBC Official Answers Press Questions on Improving Loan Prime Rate (LPR) Formation Mechanism, August 20, 2019, available at http://www.pbc.gov.cn/en/3688110/3688172/3877865/index.html 5 Announcement of the People’s Bank of China No.16, August 27, 2019, available at http://www.pbc.gov.cn/en/3688110/3688172/3881177/index.html Cyclical Investment Stance Equity Sector Recommendations
Highlights The slowdown in the U.S. manufacturing sector is at risk of becoming deeper than elsewhere. This is not bearish for the U.S. dollar, given that it is a countercyclical currency, but it is not a constructive development, either. This impasse can be solved by an easier Federal Reserve, which would knock down the dollar. For now, we are maintaining our trade focus on the crosses rather than on outright dollar bets. The Swiss National Bank is likely to start weaponizing its currency, given the domestic slowdown: Go long EUR/CHF at 1.06. Long yen positions have become a consensus trade, but we will await a better exit point for our short USD/JPY positions. Feature The Swiss economy is slowly stepping into deflation. The latest inflation print this week stood at 0.1%, well below the SNB’s central forecast of 0.4% for this year. Goods inflation has completely ground to a halt, while service inflation is now at the lowest level since 2016. If left unchecked, this could begin to un-anchor inflation expectations, leading to a negative feedback loop that the SNB will likely find very difficult to lean against (Chart I-1). Chart I-1The SNB Will Have To Lean ##br##Against This
The SNB Will Have To Lean Against This
The SNB Will Have To Lean Against This
Chart I-2A Strong Franc Is Exerting A Powerful Deflationary Impulse
A Strong Franc Is Exerting A Powerful Deflationary Impulse
A Strong Franc Is Exerting A Powerful Deflationary Impulse
Global disinflationary trends are definitely playing a role, but the strong currency has been front and center at exacerbating these trends. As a small, open economy, tradeable goods prices are important for Switzerland. Import prices are deflating by over 3% year-on-year, in part driven by a strong trade-weighted currency (Chart I-2). This is increasing the odds that the SNB will begin to use the currency to stimulate monetary conditions. Operation Weak Franc Chart I-3How Long Can You Defy The Pull Of Gravity?
How Long Can You Defy The Pull Of Gravity?
How Long Can You Defy The Pull Of Gravity?
Domestically, the Swiss economy is holding up well, but it is an open question as to how much longer it will continue to defy the pull of a slowing external sector. The KOF employment indicator is at its highest level since 2010, and the expectations component continues to exceed the current assessment. During normal times, this is a bullish development. However, for a highly export-driven economy, the manufacturing sector usually dictates trends in the overall economy (Chart I-3). The manufacturing PMI print is currently sitting at 44.6, the worst since the financial crisis. These levels have usually rung loud alarm bells along SNB corridors. Back in 2011, Switzerland was rapidly stepping back into deflation, having just barely escaped it a year earlier. The SNB quickly realized that for a small, open economy, the exchange rate often dictates the trend in domestic inflation. Ergo, sitting and watching the trade-weighted Swiss franc continue to appreciate, especially given the euro was in a cascading downdraft, appeared to be a recipe for disaster. This sounds eerily similar to today. With the European Central Bank resuming quantitative easing and with an SNB that left rates unchanged at its most recent policy meeting, the signal is that interest rates have probably hit a floor. This view is further reinforced by the SNB’s additional tiering of reserves. In other words, rates have probably begun to teeter on the edge of financial stability. This leaves the currency as the policy tool of choice. Our bias is that the whisper floor of 1.08-1.10 for EUR/CHF will continue to persist until the Swiss economy decisively exits deflation. However, markets can tilt the Swiss exchange rate to an overshoot. If that happens, four key factors suggest the Swiss economy needs a weaker currency, especially versus the euro: The Swiss trade balance has held up well in the face of the global slowdown, but this has been largely driven by terms of trade. The Swiss trade balance has held up well in the face of the global slowdown, but this has been largely driven by terms of trade (Chart I-4). However, in a downturn, while commoditized goods prices are the first shoe to drop, the slowdown eventually starts to infect more specialized goods prices. Swiss goods are not easily substitutable, but other countries such as Sweden that have dropped their currency will benefit more from any recovery. Chart I-4Rising Terms Of Trade Have Helped ##br##Support Exports
Rising Terms Of Trade Have Helped Support Exports
Rising Terms Of Trade Have Helped Support Exports
Chart I-5A Gold ##br##Haven
A Gold Haven
A Gold Haven
Part of the improvement in the Swiss trade balance has been driven by precious metals exports. For example, exports of precious metals to the U.K. are soaring towards new highs as storage demand for ETF accounts rises (Chart I-5). However, there has been a lack of physical demand in Asia, while the riots in Hong Kong are causing gold to be rerouted to Switzerland, then London. This might soon end. Our models suggest the franc is now almost 10% overvalued versus the euro. Over the history of the model, franc overvaluation peaks at a high of 15%, and is often followed by intervention by the SNB (Chart I-6). While the unemployment rate is at 2.3%, domestic wage pressures are none existent. It will be difficult for service inflation to pick up without a build-up in wage pressures. This is unlikely to happen over the next six to nine months. Part-time employment continues to dominate job gains, meaning the need for precautionary savings will continue to restrain spending. Meanwhile, the manufacturing sector is unlikely to start raising wages before a recovery is in sight. However, more recently, foreign exchange reserves have started reaccelerating and the stability in the monetary base suggests some spectre of sterilization. It has been surprising that in the global race towards lower rates and amidst the potential for global currency devaluation, the SNB has been sitting and watching other central banks like the ECB and the Riksbank eat part of its lunch. The message from SNB Central Bank Chair Thomas Jordan has been very clear: Interest rates could be lowered further, along with powerful intervention in the foreign exchange market if necessary. This might slightly suggest disagreement within the governing council. Chart I-6The Franc Is ##br##Expensive
The Franc Is Expensive
The Franc Is Expensive
Chart I-7Is The SNB Sterilizing Reserve Accumulation?
Is The SNB Sterilizing Reserve Accumulation?
Is The SNB Sterilizing Reserve Accumulation?
Interestingly, the SNB has not had to ramp up its balance sheet significantly in recent years. Part of the reason is that the slowdown in global trade eased natural demand for francs, which meant the SNB was no longer accumulating foreign exchange reserves at a rampant pace. This has helped drain excess liquidity from the system and somewhat renormalize policy. This means that the wiggle room for more FX intervention has reopened. However, more recently, foreign exchange reserves have started reaccelerating, and the stability in the monetary base suggests some spectre of sterilization (Chart I-7). Economically, the SNB has to walk a fine line between a predominantly deflationary backdrop in Switzerland and a rising debt-to-GDP ratio that pins it among the highest in the G-10. Too little stimulus and the economy runs the risk of entering a debt-deflation spiral, as inflation expectations continue to be anchored strongly to the downside. Too much stimulus, and the result will be a build-up of imbalances, leading to an eventual bust. Currency Cap Post-Mortem While the SNB may favor stealth depreciation of the franc, there are both political and economic constraints to an outright cap. The good news is that the economic forces are ebbing as the economy slows down. Meanwhile, there had already been a rising chorus of discontent among right-wing politicians in 2014, specifically those within the Swiss People’s Party (SVP) who wanted the central bank to stop buying foreign currencies and significantly lift its gold holdings instead. With the SVP currently ahead in opinion polls ahead of this month’s elections, this is likely to remain a constraint. The good news is that new issues such as climate change have taken the fore, rather than whether Switzerland should start backing it reserves via gold (Chart I-8). The key risk to a cap is that if the euro drops substantially, it will invite speculation back into the Swiss economy. This risk is clearly unpalatable for both Swiss politicians and the SNB, which is why two-way asymmetry was reintroduced into the system in 2015. Chart I-8The Swiss People's Party Will ##br##Like This Up!
The Swiss People's Party Will Like This Up!
The Swiss People's Party Will Like This Up!
Chart I-9A Healthy ##br##Rebalancing
A Healthy Rebalancing
A Healthy Rebalancing
On a positive note, housing market speculation has been somewhat cleansed. Growth in rental housing units, which usually constitutes the bulk of investment homes, has grown to a standstill, and this is positively deviating from growth in owner-occupied homes. The message from this is clear: Macro-prudential measures such as a cap on second homes as well as stricter lending standards have helped (Chart I-9). Back in 2015, the SNB smartly surprised the market by abandoning the EUR/CHF floor. This helped rebalance the market as European investors who used the SNB put to speculate on properties in Zurich and Geneva were dis-incentivized once the euro collapsed. Demand for Swiss real estate has largely stabilized since then, eliminating this key source of risk for the SNB. The SVP’s curb on immigration has neutered a meaningful source of demand. Vacancy rates for rental properties have started to inflect meaningfully higher. More importantly, vacancy rates for rental properties have started to inflect meaningfully higher. This has usually led to lower housing prices, with a lag of about 12 months (Chart I-10). With the SVP unlikely to become more pro-immigration anytime soon, this will likely remain a headwind (Chart I-11). This suggests the political capital for the SNB to use stealth depreciation of the currency to stimulate the economy is high, especially as the global economy remains mired in a manufacturing downturn. A history of budget surpluses suggests that the SVP is unlikely to pass any significant pro-fiscal policies at any time soon. Chart I-10Slowing Migration Is Curbing Housing Demand
Slowing Migration Is Curbing Housing Demand
Slowing Migration Is Curbing Housing Demand
Chart I-11A Slowing Workforce Is Curbing Housing Demand
A Slowing Workforce Is Curbing Housing Demand
A Slowing Workforce Is Curbing Housing Demand
Claims on bank balance sheets from foreigners are relatively low, meaning the risk from an inflow of capital into the housing market on a lower exchange rate is low (Chart I-12). With bank lending margins likely to be depressed for the next few years, some foreign inflows into the real estate sector would help, alongside stricter macro prudential measures. Chart I-12Banks Have Low Foreign Mortgage Liabilities
Banks Have Low Foreign Mortgage Liabilities
Banks Have Low Foreign Mortgage Liabilities
On EUR/CHF And USD/CHF Switzerland ticks off all the characteristics of a safe-haven currency. Its large net international investment position of 115% of GDP generates huge income inflows. Meanwhile, rising productivity over the years has led to a structural surplus in its trading balance and a rising fair value for the currency. Consequently, the franc has tended to have an upward bias over the years, supercharged during periods of risk aversion (Chart I-13). Meanwhile, hedging costs for short CHF trades are less attractive than a year ago. They might get more prohibitive but until then, we suggest prudence in going short the franc versus the euro or USD (Chart I-14). Our bias however, is that the SNB will significantly start to lean against the franc at 1.06. Chart I-13Risk: Swiss Franc Tends ##br##To Appreciate
Risk: Swiss Franc Tends To Appreciate
Risk: Swiss Franc Tends To Appreciate
Chart I-14Hedging Costs Are ##br##Prohibitive
Hedging Costs Are Prohibitive
Hedging Costs Are Prohibitive
Investment Conclusions Chart I-15Major Dollar Tailwinds Have Peaked
Major Dollar Tailwinds Have Peaked
Major Dollar Tailwinds Have Peaked
We continue to focus on trades at the crosses, and holding portfolio insurance such as the Swiss franc remains what the doctor ordered. Our objective in this week’s report was to highlight that investors and traders may not want to overstay their welcome, and as such keep a watchful eye on tentative signs of a reversal. Typically, the growth divergence between the U.S. and the rest of the world has been a good explanatory variable for medium-term fluctuations in the dollar. Ergo, the deceleration in the U.S. manufacturing PMI usually foretells a bad omen for the dollar (Chart I-15). The franc tends to do well at the crosses during dollar bull markets and poorly during dollar bear markets. However, there are benign adjustments and malignant ones, and a drop in the U.S. manufacturing PMI, driven by much slower global growth, looks like the malignant type. What we will need to see, if the weak dollar narrative is to pan out, is stabilization in the U.S. manufacturing sector, as the rest of the world’s manufacturing sector inflects higher. This will also weaken the franc at the crosses. Stay tuned. Chester Ntonifor, Foreign Exchange Strategist chestern@bcaresearch.com Currencies U.S. Dollar Chart II-1USD Technicals 1
USD Technicals 1
USD Technicals 1
Chart II-2USD Technicals 2
USD Technicals 2
USD Technicals 2
There was a flurry of U.S. data releases, the balance of which was negative: Headline PCE was unchanged at 1.4% year-on-year in August. Core PCE increased to 1.8% year-on-year. Chicago purchasing managers’ index fell to 47.1 in September from 50.4 in August. Dallas Fed manufacturing business index fell to 1.5 in September from 2.7 in August. ISM manufacturing PMI plunged to 47.8 in September, the second consecutive month below 50. Moreover, ISM non-manufacturing PMI fell to 52.6 in September from 56.4, well below expectations of 55. Admittedly, the Markit composite PMI was up at 51 versus 50.7 the prior month. ADP non-farm payrolls were below expectations at 135K in September, versus 157K in August. Durable goods orders monthly growth slowed to 0.2% in August. Factory orders contracted by 0.1% month-on-month in August. DXY index rose by 0.6% initially, then plunged, losing 0.4% this week. The deterioration in both ISM manufacturing and non-manufacturing PMIs spurred worry about an imminent recession. We get the jobs report this Friday, which is one of the last pillars of support for a relatively hawkish Fed policy. On the monetary policy front, the Fed will resume the balance sheet expansion. The increase in supply of dollars will add to the forces that might eventually pull the dollar lower. Report Links: Preserving Capital During Riot Points - September 6, 2019 Has The Currency Landscape Shifted? - August 16, 2019 USD/CNY And Market Turbulence - August 9, 2019 The Euro Chart II-3EUR Technicals 1
EUR Technicals 1
EUR Technicals 1
Chart II-4EUR Technicals 2
EUR Technicals 2
EUR Technicals 2
Recent data in the euro area have been negative: Inflation remains subdued across euro area countries in August. Headline inflation in the euro area fell to 0.9% year-on-year from 1%. In France, the headline inflation declined to 1.1% year-on-year from 1.3%. In Spain, it fell to 0.1% year-on-year from 0.3%. In Germany, it also decreased to 1.2% year-on-year from 1.4%. The unemployment rate in the euro area marginally decreased to 7.4% in August from 7.5%. The economic sentiment indicator in the euro area fell to 101.7 in September from 103.1. Producer price index fell by 0.8% year-on-year in August. Retail sales growth was little changed at 2.1% year-on-year in August. EUR/USD increased by 0.6% this week. On the inflation front, the steeper drop in CPI for core countries rather than the peripheral ones suggests that the redistributive efforts needed to hold the euro area together are somewhat working. ECB president Mario Draghi called for an “investment-led stimulus at the euro area level” in a speech in Athens on Tuesday evening, but the reality is that the peripheral countries are already using lower rates to deploy capital. J.P. Morgan analysts have upgraded European equities this week. If equity fund flows start to rise, the euro is likely to rebound against the U.S. dollar. Report Links: A Few Trade Ideas - Sept. 27, 2019 Battle Of The Central Banks - June 21, 2019 EUR/USD And The Neutral Rate Of Interest - June 14, 2019 Japanese Yen Chart II-5JPY Technicals 1
JPY Technicals 1
JPY Technicals 1
Chart II-6JPY Technicals 2
JPY Technicals 2
JPY Technicals 2
Recent data in Japan have been disappointing: The all-important Tankan survey came out this week. There was deterioration in both the manufacturer and service outlook in Q3, but it was admittedly above expectations. Plans for capex remained relatively elevated. Industrial production contracted by 4.7% year-on-year in August. Retail sales increased by 2% year-on-year in August, but we are downplaying this because of the consumption tax hike. Housing starts decreased by 7.1% year-on-year in August. Construction orders fell by 25.9% year-on-year (the latter being extremely volatile). The unemployment rate was unchanged at 2.2% in August. Jobs-to-applicants ratio was also unchanged at 1.59. Consumer confidence fell to 35.6 in August, from 37.1 in July. We have discussed in length the significance of this in a Ricardian equivalence framework. Services PMI fell to 52.8 in September, while still above the 50 expansionary territory. USD/JPY fell by 1% this week. In the recent Summary of Opinions, the BoJ highlighted risks of lower external demand due to delayed economic growth. On the positive side, various countermeasures are set to mitigate the negative effects of the tax hike. We remain positive on the safe-haven Japanese yen as a hedge with limited downside. Report Links: A Few Trade Ideas - Sept. 27, 2019 Has The Currency Landscape Shifted? - August 16, 2019 Portfolio Tweaks Into Thin Summer Trading - July 5, 2019 British Pound Chart II-7GBP Technicals 1
GBP Technicals 1
GBP Technicals 1
Chart II-8GBP Technicals 2
GBP Technicals 2
GBP Technicals 2
Recent data in the U.K. have been mixed: GDP growth increased to 1.3% year-on-year in Q2. On a quarter-on-quarter basis however, GDP growth contracted by 0.2% in Q2. Current account deficit narrowed to £25.2 billion in Q2, from £33.1 billion in Q1. Nationwide house prices grew by 0.2% year-on-year in September, compared with 0.6% in August. Markit manufacturing PMI increased to 48.3 in September from 47.4; Construction PMI fell to 43.3 from 45; Services PMI fell below 50 to 49.5. GBP/USD increased by 0.8% this week. PM Boris Johnson gave a speech this week and introduced the details of a Brexit proposal that was an easy target for the firing squads in this imbroglio. Another Brexit delay and re-election seem highly likely. The improvement in the Markit manufacturing PMI reflects higher confidence over the lower probability of a hard Brexit in our view. We recently upgraded the outlook for U.K. and went long the GBP/JPY. Stay with it. Report Links: A Few Trade Ideas - Sept. 27, 2019 United Kingdon: Cyclical Slowdown Or Structural Malaise? - Sept. 20, 2019 Battle Of The Central Banks - June 21, 2019 Australian Dollar Chart II-9AUD Technicals 1
AUD Technicals 1
AUD Technicals 1
Chart II-10AUD Technicals 2
AUD Technicals 2
AUD Technicals 2
Recent data in Australia have been mixed: Headline inflation slowed from 1.7% to 1.5% year-on-year in September. Private sector credit grew by 2.9% year-on-year in August. AiG manufacturing PMI increased to 54.7 in September from 53.1 in August. AiG services PMI marginally increased to 51.5 from 51.4. Commonwealth manufacturing PMI fell slightly to 50.3, from an upward-adjusted 50.9 in August. Commonwealth services PMI was little changed at 52.4. Building permits keep contracting by 21.5% year-on-year in August. Exports fell by 3% month-on-month in August, while imports were unchanged. The trade surplus narrowed to A$5.9 billion from A$7.3 billion. AUD/USD fell by 1.3% initially post RBA, then recovered with broad U.S. dollar weakness, returning flat this week. The RBA lowered interest rates by another 25 basis points on Tuesday, and stated that “the Australian economy is at a gentle turning point.” Lower rates, though not fully transferred to mortgage rates, could help to stabilize the housing market to some extent, and lift wage growth. We maintain a pro-cyclical stance and remain positive on the Australian dollar. Report Links: A Contrarian View On The Australian Dollar - May 24, 2019 Beware Of Diminishing Marginal Returns - April 19, 2019 Not Out Of The Woods Yet - April 5, 2019 New Zealand Dollar Chart II-11NZD Technicals 1
NZD Technicals 1
NZD Technicals 1
Chart II-12NZD Technicals 2
NZD Technicals 2
NZD Technicals 2
Recent data in New Zealand have been mostly negative: Building permits increased by 0.8% month-on-month in August. Activity outlook fell by 1.8% month-on-month in September. Business confidence fell further to -53.5 in September, from -52.3 in August. NZD/USD increased by 0.3% this week. The latest Quarterly Survey of Business Opinion, conducted by the New Zealand Institute of Economic Research, has shown that business conditions point to further slowing in economic activity. The manufacturing sector remains the most problematic. Moreover, firms are cautious about expanding, due to the combination of intense cost pressures, and weak pricing power. Australia has lowered interest rates giving ammunition to their antipodean neighbors to follow suit. The probability of rate cuts by RBNZ in its next policy meeting on November 13th reached 100%: 90% for a 25 bps cut and 10% for 50 bps. Report Links: USD/CNY And Market Turbulence - August 9, 2019 Where To Next For The U.S. Dollar? - June 7, 2019 Not Out Of The Woods Yet - April 5, 2019 Canadian Dollar Chart II-13CAD Technicals 1
CAD Technicals 1
CAD Technicals 1
Chart II-14CAD Technicals 2
CAD Technicals 2
CAD Technicals 2
Recent data in Canada have been mixed: On a month-on-month basis, the GDP stagnated in July. On a year-on-year basis, GDP growth slowed from 1.5% to 1.3% in July. Markit manufacturing PMI increased to 51 in September, from 49.1 in August. Bloomberg Nanos confidence increased to 57.8 for the week ended September 27th. Raw material prices fell by 1.8% month-on-month in August. USD/CAD increased by 0.5% this week. Canadian GDP growth in July was led by the services sector. The divergence was 2.5% year-on-year in July for services GDP, while goods GDP continued to deteriorate, contracting by 1.8% year-on-year. GDP in the energy sector, a focal industry in the country, fell by 3.4% year-on-year in July, affected by the fluctuations in oil prices. Moreover, as our colleagues in Commodity & Energy Strategy point out, the price differential between Canadian crude oil and WTI would likely to deepen further, possibly reaching a discount of $20/bbl into 1Q20, due to transportation constraints in the west. Report Links: Preserving Capital During Riot Points - September 6, 2019 Portfolio Tweaks Into Thin Summer Trading - July 5, 2019 On Gold, Oil And Cryptocurrencies - June 28, 2019 Swiss Franc Chart II-15CHF Technicals 1
CHF Technicals 1
CHF Technicals 1
Chart II-16CHF Technicals 2
CHF Technicals 2
CHF Technicals 2
Recent data in Switzerland have been negative: KOF leading indicator fell to 93.2 in September. Real retail sales contracted by 1.4% year-on-year in August. Manufacturing PMI fell to 44.6 in September from 47.2 in August. Headline inflation decreased to 0.1% year-on-year in September, from 0.3%. USD/CHF increased by 0.7% this week. While the Swiss economy is highly linked to global developments, especially those in the euro area, the positive current account balance makes it less vulnerable on a relative basis. We continue to favor the franc as a safe-haven hedge. We discuss the franc in this week’s front section. Report Links: What To Do About The Swiss Franc? - May 17, 2019 Beware Of Diminishing Marginal Returns - April 19, 2019 Balance Of Payments Across The G10 - February 15, 2019 Norwegian Krone Chart II-17NOK Technicals 1
NOK Technicals 1
NOK Technicals 1
Chart II-18NOK Technicals 2
NOK Technicals 2
NOK Technicals 2
There are scant data from Norway this week: Retail sales were unchanged in August. USD/NOK appreciated by 0.3% this week. The recent decline in oil prices has pushed our petrocurrency basket trade offside, weighed by the quick oil facility recovery in Saudi and demand concerns over a possible recession. That said, we continue to overweight energy prices and the Norwegian krone. The looming tension in the Middle East could lead to further escalation, which will again disrupt oil supplies and lift oil prices. Report Links: A Few Trade Ideas - Sept. 27, 2019 Portfolio Tweaks Into Thin Summer Trading - July 5, 2019 On Gold, Oil And Cryptocurrencies - June 28, 2019 Swedish Krona Chart II-19SEK Technicals 1
SEK Technicals 1
SEK Technicals 1
Chart II-20SEK Technicals 2
SEK Technicals 2
SEK Technicals 2
Recent data in Sweden have been negative: Retail sales grew by 2.7% year-on-year in August, compared to a 3.9% yearly growth in July. Manufacturing PMI plunged to 46.3 in September, from 52.4 in August. USD/SEK increased by 0.5% this week. While the PMI employment component increased to 52.4 from 51.9, the new orders index plunged below 50 to 45.8. The new orders-to-inventory ratio also continues to decrease, which usually leads the euro area manufacturing PMI by a few months. This is one of the key data points we follow, so are heeding to the message from this indicator. Report Links: Where To Next For The U.S. Dollar? - June 7, 2019 Balance Of Payments Across The G10 - February 15, 2019 A Simple Attractiveness Ranking For Currencies - February 8, 2019 Trades & Forecasts Forecast Summary Core Portfolio Tactical Trades Limit Orders Closed Trades
Highlights The global manufacturing cycle is likely to bottom soon, and consumption and services remain robust. The risk of recession over the next 12 months is low. This suggests that equities will continue to outperform bonds. But the risks to this optimistic scenario are rising. A denting of consumer confidence and worsening of geopolitical tensions could hurt risk assets. We hedge this by overweighting cash. China remains reluctant for now to use aggressive monetary easing. Until it does, the less cyclical U.S. equity market should outperform. We may shift into EM and European equities when China ramps up stimulus and the manufacturing cycle clearly bottoms. To hedge against this upside risk, we go tactically overweight Financials, and reiterate our overweight on Industrials and neutral on Australia. Bond yields should continue their rebound. We recommend an underweight on duration and favor TIPS. Credit should outperform on the cyclical horizon, but high corporate debt is a risk – we recommend a neutral position. Recommendations
Quarterly Portfolio Outlook: Hedges All Around
Quarterly Portfolio Outlook: Hedges All Around
Feature Overview Hedges All Around This is a particularly uncertain time for the global economy – and so a tricky one for asset allocators. Will manufacturing activity bottom soon, or will it drag down the services sector and consumption with it? Will bond yields continue their strong rebound? Is the Fed done cutting rates? Will China now ramp up monetary stimulus? Will Iran escalate a confrontation with Saudi Arabia? What will President Trump tweet about next? This is the sort of environment in which portfolio construction comes into its own. We have our view on all these questions, but our level of conviction is somewhat lower than usual. The way for investors to react is to plan asset allocation in such a way that a portfolio is robust in all the most probable scenarios. We expect the global manufacturing cycle to bottom soon. The Global Leading Economic Indicator is already picking up, and the Global PMI shows some signs of bottoming (Chart 1). The shortest-term lead indicator, the Citigroup Economic Surprise Index, has recently jumped in every region except Europe (Chart 2). (See also What Our Clients Are Asking on page 7 for some more esoteric indicators of cycle bottoms.) The bottoming-out is due to easier financial conditions over the past nine months, a stabilization in Chinese growth, and simply time – the down-leg in manufacturing cycles typically last 18 months, and this one peaked in H1 2018. Chart 1First Signs Of Bottoming
First Signs Of Bottoming
First Signs Of Bottoming
Chart 2Surprisingly Strong Surprises
Surprisingly Strong Surprises
Surprisingly Strong Surprises
At the same time, government bond yields should have further to rise. The Fed may cut rates once more but, given the resilient U.S. economy, no more than that. This is less than the 59 basis points of cuts over the next 12 months priced in by the Fed Fund futures. The recent pick-up in economic surprises suggests that the 10-year U.S. Treasury yield should return at least to where it was six months ago, 2.3-2.4% (Chart 3). This might be delayed, however, if there is an increase in political tensions, for example a break-up of the U.S./China trade talks (Chart 4). Chart 3Long-Term Rates To Rebound Further...
Long-Term Rates To Rebound Further...
Long-Term Rates To Rebound Further...
Chart 4...But Geopolitical Tensions Remain A Risk
...But Geopolitical Tensions Remain A Risk
...But Geopolitical Tensions Remain A Risk
This implies that equities are likely to continue to outperform bonds over the next few quarters, and so we remain overweight global equities and underweight global bonds on the 12-month investment horizon. However, the risks to this rosy scenario are rising. We remain concerned about the inverted yield curve, which has accurately forecast every recession since World War II, usually about 18 months in advance (Chart 5). The 3-month/10-year curve inverted in the middle of this year. We also worry that the weakness in the manufacturing sector may dent consumer confidence. There are some signs of this in Europe and Japan – but none significant yet in the U.S. (Chart 6). Accordingly last month, as a hedge against an economic downturn, we went overweight cash, which we see as a more attractive hedge, from a risk/reward point-of-view, than bonds. Chart 5Can We Ignore The Message From The Yield Curve?
Can We Ignore The Message From The Yield Curve?
Can We Ignore The Message From The Yield Curve?
Chart 6Some Signs Of Weaker Consumer Confidence
Some Signs Of Weaker Consumer Confidence
Some Signs Of Weaker Consumer Confidence
We also remain overweight U.S. equities, which are lower-beta and have fewer structural headwinds than equities in other regions. However, we continue to look for an entry point into the more cyclical equity markets which would also be beneficiaries of bolder China stimulus. China’s monetary easing remains more tepid than in previous stimulus episodes. It has probably been enough to stabilize domestic activity (Chart 7) but not to trigger a rally in industrial commodity prices, EM assets, and euro area equities, as it did in 2016. A pick-up in global PMIs and signs of stronger Chinese credit growth would clearly help EM and Europe (Chart 8) but we need higher conviction that these things are indeed happening before making that move. In the meantime, we are hedging the upside risk by raising the global Financials sector tactically to overweight, since it would likely do well if euro area stocks started to outperform. Earlier this year, we raised the Industrials sector to overweight and Australian equities to neutral, also to hedge against the upside risk from more aggressive Chinese stimulus. Chart 7Chinese Stimulus Has Merely Stabilized Growth
Chinese Stimulus Has Merelyy Stabilized Growth
Chinese Stimulus Has Merelyy Stabilized Growth
Chart 8Europe And EM Are The Most Cyclical Markets
Europe And EM Are The Most Cyclical Markets
Europe And EM Are The Most Cyclical Markets
Chart 9Oil Price Spikes Often Precede Recessions
Oil Price Spikes Often Precede Recessions
Oil Price Spikes Often Precede Recessions
The biggest geopolitical risk to our sanguine scenario is the situation in the Middle East, after the attacks on Saudi oil refineries. Every recession in the past 50 years has been preceded by a 100% year-on-year spike in the crude oil price (though note that Brent would need to rise to over $100 a barrel by year-end, from $61 today, for that to eventuate (Chart 9)). A short-term oil shortage is not the problem since strategic reserves are ample. But the attack demonstrates the vulnerability of the Saudi installations. And a reprisal attack on Iran could lead it to block the Strait of Hormuz, through which more than 20% of global oil passes. We have an overweight on the Energy sector, partly as a hedge against these risks. BCA’s oil strategists expected Brent crude to rise to $70 this year, and average $74 in 2020, even before the recent attack. They argue that the risk premium in the oil price (the residual in Chart 10) is too low, given not only tensions with Iran, but also other potential supply disruptions in Iraq, Libya, Venezuela and elsewhere. Chart 10Is The Oil Risk Premium Too Low?
Quarterly Portfolio Outlook: Hedges All Around
Quarterly Portfolio Outlook: Hedges All Around
Garry Evans, Senior Vice President Chief Global Asset Allocation Strategist garry@bcaresearch.com What Our Clients Are Asking Which Leading Indicators Should Investors Watch To Time The Rebound In Global Growth? Chart 11Positive Signals For Global Growth
Is Eurozone Manufacturing Close To A Bottom? Positive Signals For Global Growth
Is Eurozone Manufacturing Close To A Bottom? Positive Signals For Global Growth
During 2019, the global growth decline was a key driver of the bond rally and the outperformance of defensive assets. Thus, timing when this decline will reverse will be crucial, since it would also result in a change of leadership from defensive to cyclical assets. But how can this be done? Below we list three of our favorite indicators that have provided reliable leading signals on the global economy in the past: Carry-trade performance: The performance of EM currencies with very high carry versus the yen tends to be a leading indicator for global growth (Chart 11, panel 1). In general, carry trades distribute liquidity from countries where funds are plentiful but rates of return are low (like Japan), to places with savings shortfalls and high risk, but where prospective returns are high. Positive performance of these currencies tends to signal a positive shift in global liquidity, which usually fuels global growth. Swedish inventory cycle: The Swedish new-orders-to-inventories ratio is a leading indicator of the global manufacturing cycle (panel 2). Why? Sweden is a small open economy that is very sensitive to global growth dynamics. Moreover, Swedish exports are weighted towards intermediate goods, which sit early in the global supply chain. This makes the Swedish inventory cycle a good early barometer of the health of the global manufacturing cycle. G3 monetary trends: G3 excess money supply – measured as the difference between money supply growth and loan growth – is a leading indicator of global industrial production (panel 3). As base money and deposits become more plentiful in the banking system relative to the pool of existing loans, the liquidity position of commercial banks improves. This provides banks with the necessary fuel to generate more loan growth, a development which eventually provides a boon to economic activity. Importantly, all these leading indicators are sending a positive signal on the global economy. This confirms our view that rates should go up as global growth strengthens. Therefore, investors should remain overweight equities and underweight bonds in their portfolios. Is It Time To Buy Euro Area Banks? In a Special Report on euro area banks in December 2018, we noted that “Historically, when the relative P/B discount hits the lower band and the relative dividend yield hits the upper band, a rebound in relative return performance could be expected”.1 Our recommendation back then was that “long-term investors should avoid banks in the region, but investors with a more tactical mandate and much nimbler style could use the valuation indicators to ‘time’ their entry into and exit out of banks as a short-term trade.” Since then, banks have continued to underperform the overall market by over 10%, further pushing down relative valuation metrics. Currently, both relative P/B and relative dividend yield are at extreme levels that have historically heralded at least a short-term bounce. The euro area PMI is still below 50, but there are signs that the euro area economy could rebound later this year, which should be positive for banks’ relative earnings. Already, forward EPS growth has been stabilizing relative to the broad market (Chart 12, panel 4). In addition, two of the key concerns back in December 2018 were Italian government debt and the unwinding of QE. Now Italian debt is no longer in crisis and the ECB has relaunched QE. As such, investors with a tactical mandate and a nimble style should buy (overweight) banks in the euro area. Long-term investors should still avoid such a short-term trade because structural issues remain. Chart 12Tactically Upgrade Euro Area Banks
Tactically Upgrade Euro Area Banks
Tactically Upgrade Euro Area Banks
Is The Gold Rally Over? Spot gold prices have increased 17% year-to-date, on the back of global growth weakness, dovish central banks, and rising political tensions. Should investors now pare back their gold exposure? Common sense would suggest they should. However, these are not ordinary times. In the short term, gold prices might suffer from some profit-taking due to overbought technicals and excessively positive sentiment (Chart 13, panel 1). Moreover, gold prices have moved this year due to increased market expectations of central bank easing (panel 2). We expect that markets will be disappointed going forward by only limited rate cuts, which could put downward pressure on gold. On the other hand, with approximately 27%, or $14.9 trillion, of global debt with negative yields at the moment, investors will continue to shift to the next best asset – zero-yielding gold (panel 3). This is clear from the rise in holdings of gold over the past few years by both central banks and investors (panels 4 & 5). We expect this trend to persist as investors continue their search to avoid negative yields and focus on capital preservation. Geopolitical tensions have intensified since the beginning of the year: ongoing yet inconclusive trade negotiations between the U.S. and China, implementation of further tariffs, Brexit uncertainty, and the recent military attacks in the Middle East (panel 6). This environment should also continue to push gold prices higher. We continue to recommend gold as a hedge against inflation – which we see picking up over the next 12 months – as well as against any further deterioration in global growth and the geopolitical situation. Chart 13Gold: Sell Or Hold?
Gold: Sell Or Hold?
Gold: Sell Or Hold?
Risks to the rosy scenario are rising. We remain concerned about the inverted yield curve, which has accurately forecast every recession since World War II. How Low Can Rates Go? The zero lower bound is a thing of the past. Last month, Denmark’s central bank cut rates to -0.75%, and 10-year government bonds in Switzerland hit a historic low for any major country, -1.12%. In the next recession, how much further could interest rates theoretically fall? For individuals, cash rates might be limited by the cost of storing paper currency, which has a zero yield (unless governments find a way to ban cash or charge an annual fee on it). A bank safety deposit box costs about $300 a year, and a professional-quality safe big enough to store $1 million (which would be a pile of $100 bills 31 x 55 cms, weighing 10 kg) costs $2,000 with installation costs. Amortize the latter over 10 years, and the cost of storing $1 million is about 0.2%-0.3% a year. Swiss franc bills – maximum denomination CHF1,000 – would cost less to store. But storage costs for physical gold are around 2% a year. Since rates have fallen below this, there must be other constraints. Individuals would find storing money in cash possibly dangerous and certainly very inconvenient (imagine having to transport the cash to a bank to pay a tax bill). And the cost for a rich individual or company of storing, say, $1 billion (weighing 10 tonnes) would be much higher. Given the history in even low-rate countries (Chart 14, panel 1), we suspect around -1% is the level at which cashholders would seek alternatives to bank deposits of government bills. Chart 14How Low Can They Go?
How Low Can They Go?
How Low Can They Go?
Chart 15Yield Curves When Rates Are At Zero Or Below
Yield Curves When Rates Are At Zero Or Below
Yield Curves When Rates Are At Zero Or Below
At the long end, the yield curve does not typically invert much when short-term rates are zero or negative (Chart 15). The biggest 3-month/10-year inversion was in Switzerland earlier this year, -0.05%. This points then to the absolute lowest level for 10-year bonds anywhere, even in the middle of a nasty recession, at around -1.1%. That is a worry for asset allocators. It means that the maximum mathematical upside for Swiss government bonds from their current level (-0.8%) is 3% while it is 5% for German bonds (currently -0.5%). This is not much of a hedge. Only the U.S. looks better: if the 10-year Treasury yield falls to 0%, the total return is 18%. Global Economy Chart 16U.S. Growth Remains Solid
U.S. Growth Remains Solid
U.S. Growth Remains Solid
Overview: Industrial-sector growth globally has been weak, with the manufacturing PMI in most countries falling below 50. But consumption and services almost everywhere have remained resilient, even in the manufacturing-heavy euro area. And there are tentative signs of a bottoming-out in manufacturing. However, a full-scale rebound will depend on further monetary stimulus in China, where the authorities still seem cautious about rolling out easing on the scale of what was done in 2016. U.S.: U.S. manufacturing has now followed the rest of the world into contraction, with the ISM manufacturing index slipping below 50 in August (Chart 16, panel 2). However, consumption and services are holding up well. Employment continues to expand (albeit at a slightly slower pace than last year, perhaps because of a lack of jobseekers), there is no sign of a rise in layoffs, and consumer confidence remains close to a historical high (though it slipped slightly in September). Housing has recovered after last year’s slowdown, and the recent congressional budgetary agreement means fiscal policy will be mildly expansionary over the coming 12 months. Only capex (panel 5) has slowed, as companies postpone investment decisions due to uncertainty surrounding the trade war. The consensus expects U.S. real GDP growth of 2.2% this year, above most estimates of trend growth. Euro Area: Given its higher concentration in manufacturing, European growth is weaker than in the U.S. The manufacturing PMI has been below 50 since February, and fell further to 45.6 in August. Industrial production is shrinking by 2% year-on-year. Italy has experienced two negative quarters of growth, and Germany may also enter a technical recession in Q3 (GDP shrank by 0.1% in Q2). However, there are some tentative signs that manufacturing is bottoming: the ZEW survey in September, for example, surprised on the upside. And, like the U.S., consumption remains strong. Even in manufacturing-heavy Germany, employment continues to grow, and retail sales in July were up 4.4% year-on-year. In the U.K., however, uncertainty surrounding Brexit has damaged business investment, though employment has been strong.2 Chart 17First Signs Of A Rebound In The Rest Of The World?
First Signs Of A Rebound In The Rest Of The World?
First Signs Of A Rebound In The Rest Of The World?
Japan: Consumption has already slipped, even before the consumption tax hike scheduled in October. Retail sales in July fell 2% year-on-year, due to negative wage growth and consumer sentiment falling to a five-year low. Manufacturing continues to suffer from China’s slowdown and the strong yen (up 6% over the past 12 months), with exports falling 6% and industrial production down 2% year-on-year over the past three months. The effect of the consumption tax hike may be cushioned by government measures (lowering taxes on autos and making high-school education free, for example). And a pickup in Chinese growth would boost exports. But there are scant signs yet of a bottoming in activity. Emerging Markets: China’s growth appears to have stabilized, with both manufacturing and non-manufacturing PMIs above 50 (Chart 17, panel 3). But confidence remains fragile, with retail sales growth slowing to a 20-year low and car sales down 7% in August, despite the introduction of cars compliant with new emissions standards. The authorities have responded with further easing measures (including a further cut in the reserve requirement in September) but seem reluctant to launch a full-scale monetary stimulus, similar to what they did in 2016. Elsewhere in EM, growth has slowed in countries with structural issues (latest year-on-year real GDP growth in Argentina is -5.7%, in Turkey -1.5% and in Mexico -0.8%) but remains fairly resilient elsewhere (India 5%, Indonesia 5%, Poland 4.2%, Colombia 3.4%). Interest Rates: Central banks almost everywhere have turned dovish, with the Fed cutting rates for a second time, the ECB restarting asset purchases, and the Bank of Japan signaling it will ease in October. But further monetary accommodation will probably be less than the market expects. The Fed signaled that its cuts were just a mid-cycle correction and that further easing is unlikely. And the ECB and BoJ have little ammunition left. With signs of growth bottoming, and the market understanding that central banks’ dovish turn is reaching its end, long-term rates, which have already risen in the U.S. from 1.45% to 1.72% in September, are likely to move higher. Investors should also carefully watch U.S. inflation, which is showing signs of underlying strength, with core CPI inflation rising 2.4% year-on-year in August (and as much as 3.4% annualized over the past three months). Global Equities Chart 18Has Earnings Growth Bottomed?
Has Earnings Growth Bottomed?
Has Earnings Growth Bottomed?
Still Cautious, But Adding An Upside Hedge: Global equities registered a small loss of 8 basis points in Q3 (Chart 18) despite all the headline risks from geopolitics and weakening economic data. Overall, our defensive country allocation worked well in Q3, since DM equities outperformed EM by 4.5%, and the U.S. outperformed the euro area by 2.8%. Our sector positioning did not do as well since underweights in Utilities and Consumer Staples and overweights in Industrials, Energy and Health Care all went in the wrong direction, even though the underweight in Materials did help to offset the loss. During the quarter, however, both sector and country rotations were evident within the global equity universe, in line with the wild swings in bond yields. September saw some reversals in DM/EM, U.S./euro area and cyclical/defensives. Going forward, BCA’s House View remains that global economic growth will begin to recover over the coming months, albeit a little later than we previously expected. As such, our defensive country allocation remains appropriate. We did put euro area and EM equities on upgrade watch in April,3 but the delay in the global recovery also implies that it is still not the time to trigger this call. With our view that bond yields have hit bottom,4 we are making one adjustment in our global sector allocation by upgrading Financials to overweight from neutral. We are financing this by cutting in half the double overweight in Health Care to overweight (see next page for more details). This adjustment also acts as a hedge against two possible outcomes: 1) that the euro area outperforms the U.S., and 2) that Elizabeth Warren wins in the upcoming U.S. presidential election.5 Upgrade Global Financials To Overweight From Neutral Chart 19Upgrade Global Financials
Upgrade Global Financials
Upgrade Global Financials
The relative performance of global Financials to the overall equity market has been hugely affected by the movements in global bond yields (Chart 19, panel 1). As bond yields made a sharp reversal in September, so did the relative performance of Financials, even though it is barely evident on the chart given how much Financials have underperformed the broad market over recent years. It’s not clear how sustainable the sharp reversal in bond yields will be, but BCA’s House View is that bond yields will move higher over the next 9-12 months. As such, we are upgrading Financials to overweight from neutral, for the following additional reasons: Valuations are extremely attractive as shown in panel 2. More importantly, the relative valuation is now at an extreme level that historically heralded a bounce in Financials’ relative performance. Loan quality has improved. The U.S. non-performing loan (NPL) ratio is nearing the lows reached before the Global Financial Crisis (GFC). Even in Spain and Italy, NPL ratios have fallen significantly, though they remain higher than they were prior to the GFC (panel 3). U.S. consumption has been strong, housing has rebounded, and demand for loans is getting stronger (panel 4), in line with data such as the Citi Economic Surprise Index, suggesting that economic data may have hit bottom. To finance this upgrade, we cut the double overweight of Health Care to overweight, as a hedge against Elizabeth Warren winning next year’s U.S. presidential election and tightening rules on drug pricing. Government Bonds Maintain Slight Underweight On Duration. Our below-benchmark duration call was severely challenged by the global bond markets in the first two months of the third quarter. The U.S. 10-year Treasury yield hit 1.43% on September 3 in response to the weaker-than-expected ISM manufacturing index in the U.S., 57 bps lower than the level at the end of previous quarter, and just a touch higher than the historical low of 1.32% reached on July 6, 2016. The rebound in bond yields since September 5, however, was driven not only by the ebb and flow in the U.S./China trade policy dynamics, but also by the positive surprises in economic data releases, as shown in Chart 20. BCA’s Global Duration Indicator, constructed by our Global Fixed Income Strategy team using various leading economic indicators, is also pointing to higher yields globally going forward. Investors should maintain a slight underweight on duration over the next 9-12 months. Favor Linkers Vs. Nominal Bonds. Global inflation expectations have also rebounded after continuing their downtrend in the first two months of the quarter. This largely reflects the acceleration in August in realized inflation measures such as core CPI, core PCE, and average hourly earnings. In addition, historically, the change in the crude oil price tends to have a good correlation with inflation expectations. The oil price jumped initially by 20% following the attack on the Saudi Arabian oil production facilities. While it’s not clear how the geopolitical tensions will evolve in the Middle East, a conservative assumption of a flat oil price until the end of the year still points to much higher inflation expectations, supporting our preference for inflation-linked bonds over nominal bonds. We also favor linkers in Japan and Australia over their respective nominal bonds (Chart 21). Chart 20Bond Yields Have Hit Bottom
Bond Yields Have Hit Bottom
Bond Yields Have Hit Bottom
Chart 21Favor Inflation Linkers
Favor Linkers
Favor Linkers
We continue to look for an entry point into more cyclical markets which would benefit from a bolder Chinese stimulus. Corporate Bonds Since we turned cyclically overweight on credit within a fixed-income portfolio, investment-grade bonds and high-yield bonds have produced 220 and 73 basis points, respectively, of excess return over duration-matched government bonds. We remain bullish on the outlook for credit over the next 12 months, as we expect global growth to accelerate before the end of the year. Historically, improving global growth has resulted in sustained outperformance of credit over government bonds. Moreover, default rates should remain subdued over the next year given that lending standards continue to ease (Chart 22, panel 1). How long will we remain overweight credit? High levels of leverage, declining interest coverage ratios, and the high share of Baa-rated debt in the U.S. corporate debt market continue to make credit a risky proposition on a structural basis. However, with inflation expectations still very low, the Fed has a strong incentive to keep monetary policy easy. This dovish monetary policy should keep interest costs at bay, helping credit outperform over the next year. That said, we believe that there are some credit categories that are more attractive than others. Specifically, we recommend investors favor Baa-rated and high yield securities, given that there is still room for further credit compression in these credit buckets (panel 2 and panel 3). On the other hand, investors should stay away from the highest credit categories, as they no longer offer value (panel 4). Chart 22Baa-rated And High-Yield Credit Offer The Most Value
Baa-rated And High-Yield Credit Offer The Most Value
Baa-rated And High-Yield Credit Offer The Most Value
Commodities Chart 23No Supply Shock In The Oil Market
Quarterly Portfolio Outlook: Hedges All Around
Quarterly Portfolio Outlook: Hedges All Around
Energy (Overweight): September’s drone attack on Saudi crude facilities sent oil prices soaring as much as 20% in the days following, before falling back to pre-attack levels. Initial estimates estimated the supply disruption at 5.7 million barrels a day – approximately 5.5% of global supply – making it the largest crude supply outage in history. However, assuming the Saudis can return 70% of the lost output back online as they claim, OPEC’s spare capacity, approximately 1.8 million barrels a day, should be able to balance the market and cover the remaining lost production.6,7 In the longer-term, a pick-up in global oil demand, as economic growth rebounds, plus supply tightness should keep oil price elevated, with Brent reaching $70 this year and averaging $74 in 2020 (Chart 23, panels 1 & 2). Industrial Metals (Neutral): A combination of half-hearted year-to-date stimulus by Chinese authorities and a stronger USD in the second and third quarters of 2019 have driven industrial metals spot prices lower. However, the Chinese government announced additional stimulus in September, with further bond issuance to finance infrastructure projects and an easing of monetary policy (panel 3). This should give some upside for industrial metal prices over the coming six-to-12 months. Precious Metals (Neutral): We remain positive on gold, despite its strong performance year-to-date, since we see it as a good hedge against recession, inflation, and geopolitical risks. We discuss gold in detail in the What Our Clients Are Asking section on page 9. Silver also looks attractive in the short term. The nature of the use of silver has changed over the past two decades, from being mostly a base metal for industrial fabrication to becoming more of a precious metal viewed as a safe haven. The correlation between gold and silver prices has increased since the Global Financial Crisis from an average of 0.5 pre-crisis to 0.8 post-crisis (panels 4 & 5). Global growth and political uncertainty should support silver prices in the coming months. Currencies U.S. Dollar: The trade-weighted dollar has appreciated by 2.5% since we turned neutral in April. We expect that the steep drop in yields will continue to ease financial conditions and help global growth in the last quarter of the year. Given that the dollar is a counter-cyclical currency, an environment where global growth rallies have historically been negative for the greenback. Euro: Since we turned bullish in April, EUR/USD has depreciated by 2.7%. Overall, we continue to be positive on EUR/USD on a cyclical timeframe. After the ECB cut rates by 10 basis points and announced further rounds of quantitative easing, there is not much room left for the euro area to keep easing relative to the U.S. (Chart 24, panel 1). Moreover, improving expectations of profit growth in the euro area vis-à-vis the U.S. will drive money flows towards Europe, pushing EUR/USD up in the process (panel 2). Emerging Market Currencies: We remain bearish on emerging market currencies for the time being. That being said, they remain on upgrade watch for the end of the year. There are multiple signs that global growth is turning up, a consequence of the easy financial conditions caused by some of the lowest bond yields on record. Moreover, the marginal propensity to spend (proxied by M1 growth relative to M2 growth) in China, the main engine of EM growth, continues to point to further appreciation in emerging market currencies (panel 3). Chart 24Interest Rate And Profit Expectation Differentials Favor The Euro
The Euro Might Soon Pop Interest Rate And Profit Expectations Differentials Favor The Euro
The Euro Might Soon Pop Interest Rate And Profit Expectations Differentials Favor The Euro
Alternatives Chart 25Favor Hedge Funds Untill Global Growth Bottoms
Favor Hedge Funds Untill Global Growth Bottoms
Favor Hedge Funds Untill Global Growth Bottoms
Return Enhancers: Over the past 12 months, we have recommended investors pare back on private equity and increase allocations to hedge funds – macro hedge funds in particular. This was due to our judgement that we are late in the economic cycle. While we expect growth to pick up over the coming months, this is not yet clear in the data (Chart 25, panel 1). This uncertain macro outlook will prove tough for private equity funds, especially given an environment of rising multiples and increasing competition for deals. We continue to see global macro hedge funds as the best hedge ahead of the next recession and would advise investors to allocate funds now, given the time it takes to move allocations in the illiquid space. Inflation Hedges: In the current environment, TIPS are likely a better inflation hedge than illiquid alternative assets. Our May 2019 Special Report 8 showed that TIPS produce a particularly attractive risk-adjusted return during times when inflation is rising, but still fairly low (below 2.3%). TIPS should do well, therefore, in the environment we expect over the next few months, where the Fed remains dovish, cutting rates perhaps once more, while condoning a moderate acceleration of inflation (panel 2). Volatility Dampeners: Structured products – mostly Mortgage-Backed Securities (MBS) – have had an excellent record of reducing portfolio volatility (panel 3). Despite that, we do not recommend more than a neutral allocation to MBS currently due to a less-than-attractive valuation picture. Despite Treasury yields falling by more than 100 basis points this year and refinancing activity picking up, nominal MBS spreads remained near their all-time lows. However, as Treasury yields bottom, we expect refinancing to slow, putting downward pressure on spreads. Risks To Our View The most likely upside risk comes from the Fed being too dovish and falling behind the curve. Underlying inflation pressures in the U.S. remain strong (with core CPI up 3.4% annualized over the past three months). After two rate cuts, the Fed Funds rate is now comfortably below the neutral rate: 0.1% in real terms compared to a Laubach-Williams r* of 0.8% (Chart 26). Tightness in the money markets have pushed the Fed to start expanding its balance sheet again. If manufacturing growth accelerates next year, and wages and profits begin to rise, a stock market melt-up, similar to that in 1999, would be possible. Eventually, though, the Fed would need to raise rates (perhaps sharply) to kill inflation, which could usher in the next recession. There are a broader range of possible downside risks. As argued throughout this Quarterly, there are various possible triggers of recession: failure of China to stimulate, and a loss of confidence by consumers, in particular. Some models of recession put the risk over the next 12 months as high as 30% (Chart 27). Structurally, the biggest risk is probably the high level of corporate debt in the U.S. (Chart 28). A breakdown in the junk bond market, as seen briefly last December, could lead to companies failing to refinance the large amount of debt maturing over the next 18 months. Geopolitical risks also remain elevated and are, by nature, hard to forecast. The outcome of Brexit remains highly uncertain – though we see low risk of a no-deal exit. We expect trade talks between the U.S. and China to drag on, without a comprehensive deal, while a clear breakdown would be negative. Impeachment of President Trump is probably not a significant market event, but might hurt market sentiment briefly (particularly if it makes the election of Elizabeth Warren more likely). The Iran/Saudi conflict could escalate. Risk premiums may need to rise to take into account these threats. Chart 26Is The Fed Turning Too Dovish?
Is The Fed Turning Too Dovish?
Is The Fed Turning Too Dovish?
Chart 27What Risk Of Recession?
What Risk Of Recession?
What Risk Of Recession?
Chart 28Is Corporate Debt The Biggest Risk?
Is Corporate Debt The Biggest Risk?
Is Corporate Debt The Biggest Risk?
Footnotes 1Please see Global Asset Allocation Special Report, titled "Euro Area Banks: Value Play Or Value Trap?" dated December 14, 2018, available at gaa.bcaresearch.com. 2 Please see Foreign Exchange Strategy Special Report, “United Kingdom: Cyclical Slowdown Or Structural Malaise?”, dated 20 September 2019, available at fes.bcaresearch.com. 3Please see Global Asset Allocation Quarterly, titled "Quarterly - April 2019" dated April 1, 2019, available at gaa.bcaresearch.com. 4Please see Global Investment Strategy Weekly Report, titled "Bond Yields Have Hit Bottom," dated September 6, 2019, available at gis.bcaresearch.com. 5Please see Global Investment Strategy Weekly Report, titled "Elizabeth Warren And The Markets," dated September 13, 2019, available at gis.bcaresearch.com. 6Dmitry Zhdannikov and Alex Lawler “Exclusive: Saudi oil output to return faster than first thought - sources,” Reuters, dated Sepetmber 17, 2019. 7Please see Geopolitical Strategy Special Alert titled, “Attacks On Critical Infrastructure In KSA Raises Questions About U.S. Response,” dated September 16, 2019, available at gps.bcaresearch.com. 8Please see Global Asset Allocation Special Report, titled “Investors’ Guide To Inflation Hedging: How To Invest When Inflation Rises,” dated May 22, 2019, available at gaa.bcaresearch.com GAA Asset Allocation
Highlights The fundamentals of the U.S. economy remain strong but investors’ skittishness has caused stocks to fluctuate with the ebb and flow of news headlines. With investor sentiment playing a leading role, we introduce a simple framework for tracking the course of animal spirits. Earnings expectations are undemanding, risk appetite remains robust and the monetary policy backdrop is supportive of the expansion. However, geopolitical unpredictability and potential irrational exuberance send warning signals. We continue to believe that recession worries are overblown, but there is no rule that says bear markets can only occur alongside recessions. Although there are some areas of concern, our overall assessment of other potential bear market triggers does not suggest that trouble is at hand. Feature A bear can find plenty to worry about these days. The trade war is still casting a shadow over global trade prospects, global manufacturing activity is slowing, the U.K. and German economies contracted in the second quarter and recent attacks demonstrated that Middle Eastern oil facilities were more vulnerable than investors realized. The R-word has abounded in the financial press all summer and the number of Google searches for the term “recession” surged to levels last reached in the months leading to the Great Financial Crisis. The summer anxiety did not last, though. Powered by a perceived cooling of trade tensions and monetary support from the Fed, the S&P 500 has already recouped all of its summer losses. The market swings were not driven by the domestic macroeconomic backdrop, which remained largely unremarkable. The U.S. economy is slowing after 2018’s sugar rush, but is still getting enough fiscal support to grow at or above trend despite the global slowdown. To this point, the slowdown has been confined to manufacturing, and the history of past industrial production cycles suggests it has almost run its course. The service sector is resilient across the developed world and the fundamentals for U.S. consumption remain strong. Fundamentals are not the whole story, however, and they have lately taken a backseat to politicians’ whims. The resulting anxiety has made it relatively easy to surpass downwardly revised expectations (Chart 1), and we have little concern that the bottom is about to drop out of S&P 500 earnings. But earnings are only half of the equation. The multiple investors are willing to pay for those earnings is the other half, and they could be the key swing factor if earnings growth is going to remain in the low single digits. Chart 1Markets And Economic Data Are Out Of Sync
Markets And Economic Data Are Out Of Sync
Markets And Economic Data Are Out Of Sync
We introduce a simple framework for tracking animal spirits. Multiples are largely a function of investor enthusiasm, and we attempt to track it via the Ex-Recession Bear Market Checklist developed by our sister Global ETF Strategy service (Table 1). It seeks to measure animal spirits across six dimensions: expectations, prices, appetite, euphoria, policy and geopolitics. Constructing the checklist is necessarily subjective, and as such we consider it a welcome complement to our fundamental analysis. We remain deeply invested in searching out the coming equity market inflection point, and delving into animal spirits allows us to track a wider range of potential catalysts. Table 1Ex-Recession Bear Market Checklist
Euphoric Angst
Euphoric Angst
Expectations Chart 2Back To Sustainable Levels...
Back To Sustainable Levels...
Back To Sustainable Levels...
After calling for unusually strong late-cycle profits growth last year on the back of the cut in corporate tax rates, earnings expectations are undemanding relative to history (Chart 2). Consensus S&P 500 earnings estimates for the full year project just 1.5% growth over 2018. As of the beginning of last week, analysts had penciled in a 3% year-over-year decline in 3Q earnings for the S&P 500. Those estimates are likely to be revised even lower as corporations make sure they’ve underpromised in the final two weeks before 3Q earnings season kicks off. Perhaps the consensus is a bit too conservative. Even though the year-over-year benefits of corporate tax cuts are gone, the dovish pivots by the Fed and other major central banks will support earnings growth. In the U.S. in particular, where the economy is still strong, easier financial conditions should help extend the shelf life of the current expansion through 2020. Bottom Line: Earnings growth is not going to blast higher, but profits are unlikely to contract as long as the Fed continues to support the expansion. The earnings bar has been set very low, and it will be rather easy for S&P 500 companies to exceed it. Prices We keep close tabs on valuation metrics, though we try not to get too wrapped up in them. Expensive (cheap) stocks can get more expensive (cheaper) as investors can remain irrational for a while. Valuations only become prone to mean-revert when they reach extreme levels. Chart 3Restored Normal Mirror-Image Relationship
Restored Normal Mirror-Image Relationship
Restored Normal Mirror-Image Relationship
Forward multiples offer greater insight when considered in conjunction with forward earnings estimates. It is unusual for both earnings estimates and forward multiples to be extended at the same time, as they were in 2018, because investors are typically unwilling to pay high multiples when they suspect that earnings may be peaking. The more normal mirror-image relationship has restored itself this year, as projected earnings growth has slipped below its mean level, balancing out the above-mean forward multiple (Chart 3). Chart 4Definitely Elevated, But Not Problematic Yet
Definitely Elevated, But Not Problematic Yet
Definitely Elevated, But Not Problematic Yet
Other conventional valuation measures remain elevated but valuations within one standard deviation of the mean are far from extreme (Chart 4). The S&P 500 price-to-sales ratio is the only metric nearing the two-standard-deviation level that marks what we view as the beginning of extreme territory. It is worth noting valuations have only eroded modestly in the current global geopolitical backdrop. Though they slid in the wake of the first tariff announcement, they have mostly recovered and have seemed somewhat inured to subsequent escalations, which may suggest that investors are becoming complacent about trade threats. Bottom Line: Stocks are fully priced and the fact that valuations were only modestly affected by tariff uncertainty has gotten our attention. One-sigma deviations do not point to an immediate reversal, however, so we will wait for more metrics to approach the two-sigma threshold before raising a red flag on valuations. Appetite IPO activity is a proxy for animal spirits. Well-received IPOs are a sign that investors still have a hearty appetite for what the future might hold and suggests that they do not fear the imminent end of the bull market. If new issues are too well received, however, IPO appetite becomes a contrary indicator. When an IPO frenzy takes hold, it’s a sign that optimism has reached unsustainable levels and the end of the cycle must be near. For now, we judge that the IPO market is healthy but not too healthy. Chart 5Improved Corporate Health Or Heightened Risk Appetite?
Improved Corporate Health Or Heightened Risk Appetite?
Improved Corporate Health Or Heightened Risk Appetite?
We consider it healthy that the number of IPO deals has remained stable since 2017, though the fact that their average value has more than doubled over that time could be a sign that investors are willing to grant increasingly higher values to private and newly-public companies (Chart 5). The fact that a steadily increasing share of the companies commanding larger valuations have yet to turn a profit is somewhat unsettling (please see the “Euphoria” section, below). We are therefore encouraged that investors pushed back so vigorously against the IPO of We Work’s parent company. Media reports suggesting that the sub-lessor of office space may be valued around a quarter of management’s initial estimates indicates that institutional investors are not blindly chasing the next hot deal. The companies that have completed offerings this year have fared well. 60% of the U.S. companies that have gone public so far this year are trading above their initial offering price. The median “successful” IPO in 2019 has returned 50% since inception, while the median “unsuccessful” IPO lost 23%. This asymmetry and the larger number of “successful” IPOs suggests that IPOs continue to be generally well-received. Bottom Line: Investors’ appetite for new issues has held up despite a challenging geopolitical and global growth backdrop, while We Work’s struggles to attract a public ownership base suggests they have maintained some healthy skepticism. As it relates to the near-term outlook, we rate investor appetites as light green. Euphoria IPO activity can also offer a window into investor euphoria. The share of companies going public with negative earnings has reached levels last observed in the years preceding the dot-com crash. The fact that profitless IPOs are currently better received by investors than IPOs of profitable companies is a concern (Chart 6). Chart 6Getting Carried Away
Getting Carried Away
Getting Carried Away
While we noted that aggregate S&P 500 valuations are within normal ranges, valuations among the most highly valued stocks suggest that some exuberance has broken out. Using the backtest functionality of BCA’s Equity Trading Strategy platform,1 we devised baskets of the top deciles of stocks ranked by Price-to-Earnings, Forward Price-to-Earnings, Price-to-Tangible Book Value, Price-to-Sales and Price-to-Operating Cash Flow. Chart 7The Most Expensive Stocks Are Getting More Expensive
The Most Expensive Stocks Are Getting More Expensive
The Most Expensive Stocks Are Getting More Expensive
The rising median P/E ratio of the top-decile P/E stocks suggests that investors continue to support the highest valuations by piling into the most richly valued firms. The same pattern prevails for the top deciles of stocks ranked on the four other multiples (Chart 7). Four out of the five metrics we track are now at or above two standard deviations from their mean. Bottom Line: Demand for unprofitable companies’ IPOs and the extreme valuations of the highest-valued companies on a range of metrics suggest that investors have gotten a little carried away. We rate this dimension orange. Policy We previously noted that restrictive monetary policy has been a precondition for every recession in the last 50 years. Consistent with its repeated pledge to sustain the expansion as long as possible, the Fed delivered its second rate cut earlier this month, and central banks around the world have embarked on what is turning into a synchronized dovish pivot. Despite unanimous expectations of easier policy at its September meeting, the ECB managed to surprise somewhat dovishly with the announcement of an open-ended bond purchase program, dubbed “QE Infinity”. Other developed-economy central banks like the already accommodative Reserve Bank of New Zealand have been delivering dovish surprises in the form of larger-than-expected rate cuts. Bottom Line: Uber-dovish U.S. and global central banks should prolong the shelf life of the expansion. Geopolitics The U.S.-China trade war continues to loom as the biggest risk to the global economy and the main source of investor angst. The Iranian attack on critical Saudi Arabian infrastructure also has the potential to destabilize markets and exacerbate investor concerns. Our Geopolitical Strategy service could see U.S.-China tensions receding in the near term, but fear that Iran will be an ongoing irritant. The motivations on the U.S. side are straightforward: first and foremost, the current administration wants to be re-elected next November. It is way too early to call the election – we won’t know who will face off until next summer – but one ironclad law of presidential elections is surely on the administration’s mind. The incumbent party always loses the White House if a recession occurs during the campaign (Chart 8). If hard-nosed trade policy appeared to be pushing the economy in the direction of a recession, it is likely the administration would dial down its aggressiveness. Chart 8A 2020 Recession Is The Biggest Threat To Trump's Reelection Prospects
A 2020 Recession Is The Biggest Threat To Trump's Reelection Prospects
A 2020 Recession Is The Biggest Threat To Trump's Reelection Prospects
Enter the Iranians. Their (apparent) attack on critical Saudi oil facilities2 signals that Middle Eastern tensions could intensify and crude prices could blast higher. As we wrote last week, the U.S. economy is far less exposed to an oil price shock than it was in the ‘70s, due mainly to its emergence as the world’s largest oil producer, but the rest of the world is vulnerable. An oil price shock could induce a global ex-U.S. recession. The U.S. is a comparatively closed economy, and it regularly responds to global forces with a longer lag than other economies. It does eventually respond to them, however, and if an oil price shock leads to recessions in major economies in the rest of the world, it will ultimately threaten the U.S. economy. Keeping the expansion going through November 2020 may require U.S. policymakers to focus carefully on the Middle East to defuse the potential implications of Iranian belligerence. The administration may need to cool tensions with China to free up the bandwidth to deal with Iran, and also to prevent trade tensions’ marginal pressure on global growth from making the global economy more vulnerable to an oil price spike. Our overall assessment of bear market triggers does not suggest that trouble is imminent. The U.S.-China pause our geopolitical colleagues have been calling for would not be as beneficial for markets as a holistic trade settlement, but it appears to be materializing. In deference to China’s National Day celebrations, the U.S. will delay the tariff hike that was supposed to begin October 1st (from 25% to 30% on $250 billion worth of Chinese imports). China, for its part, has issued waivers for tariffs and promised to increase purchases of U.S. farm goods. A trade deal with Japan has also been agreed in principle and is slated to be signed any day, while U.S. relations with Europe are marginally improving.3 Bottom Line: The latest pause in trade tensions is boosting investor sentiment and risk-asset performance but the unpredictability of the current administration’s actions and public communications still have the potential to rattle markets. We rate this dimension orange. Investment implications We continue to believe that worries of a recession are overblown, but it might also take time for investors to overcome all of their concerns. A lot of fear is already discounted in the 2019 earnings estimates correction, bringing the bar quite low for corporate earnings to beat expectations. Coupled with an accommodative policy backdrop and still-robust investor appetites, the expansion still has room to run. Equities are not a slam dunk at this point in the cycle. Valuations are full, global growth is uncertain, and geopolitics are a wild card. Volatility is likely to be elevated and subject to sporadic spikes. We remain positive on the U.S. economy and continue to expect global growth will pick up later this year, however, so we continue to recommend that investors remain at least equal weight equities in balanced portfolios. Jennifer Lacombe, Senior Analyst jenniferl@bcaresearch.com Doug Peta, CFA Chief U.S. Investment Strategist dougp@bcaresearch.com Footnotes 1 Available at https://ets.bcaresearch.com/ 2 Abqaiq is the most important oil-processing facility in the world, and the Khurais oil field is adjacent to the Ghawar oil field, the world’s largest. 3 Please see BCA Research Geopolitical Strategy Weekly Report “Trump’s Tactical Retreat”, published September 13, 2019. Available at gps.bcaresearch.com.