Money Trends / Liquidity
BCA Research’s Global Fixed Income Strategy service recommends investors underweight government bonds where markets are discounting a path for future policy rates over the next two years that is too flat: the US, UK, Canada, and Norway Last week…
Market moves since the beginning of September have been characterized by a selloff in US Treasurys and a deterioration in US equity returns. The spectacular performance of US stocks thus far during the pandemic has stretched multiples to an extreme. These…

Dear client, There will be no weekly bulletin next week. Instead, I will be hosting a webcast, with my colleague, Matt Gertken, titled “Currencies And Geopolitics: A Discussion.” I hope you will tune in so that we can have an interactive session. Also, we will be revamping the traditional backsections that FX has been publishing and will send a mockup in the coming weeks. Feedback on the new format will be greatly appreciated. Finally, I hosted a webcast this week with Japanese clients titled “A Guide To Currency Management For Japanese Corporates.” For those who are interested but were unable to attend, I encourage you to consult your sales representative for a replay. Kind regards, Chester Highlights The Fed will taper asset purchases this year, but it could be a non-event for the US dollar. The reason is that the Fed is lagging other G10 central banks in tapering asset purchases. Many will end QE even before the Fed begins tapering. The two big exceptions are the ECB and the BoJ. But while dovish monetary policy is well priced into both the interest rate curve and their currencies, upside surprises are not. Most global central banks will remain data dependent. So the key to gauging the move in currencies is to observe (and forecast) economic data. On that front, the current evidence is that US growth is robust, but is losing momentum to other developed markets. Volatility in currencies will be on the rise. We went long CHF/NZD on this basis last week and maintain long yen positions. But our bias is that any rally in the DXY will fizzle out at the 94-95 level. Feature This week was a busy one for central bankers. We kicked off with the Riksbank on Tuesday, the Bank of Japan and the Federal Reserve on Wednesday, and concluded with the Swiss National Bank, the Bank of England, and the Norges bank on Thursday. The highlight was the Fed, but the general message from most central banks is that less monetary accommodation will be forthcoming, as economic activity picks up. Most central bankers also admitted that inflation was proving a bit more sticky than initially anticipated. The key question therefore for currency strategists is whether the Federal Reserve will be more or less orthodox with monetary policy, compared to other developed market central banks, and what that means for the dollar. Our bias is that while the Fed was slightly more hawkish this week, it will continue to lag other G10 central banks in curtailing monetary accommodation. The Message From The FOMC Chart I-1The Market Has Priced Fed Hawkishness
The Market Has Priced Fed Hawkishness
The Market Has Priced Fed Hawkishness
The key development from the Fed meeting this week was an upgrade to the dot plot. Half of the committee now expects at least one interest rate hike in 2022, with perhaps 7-8 hikes by the end of 2024. This is a more aggressive path of interest rate increases compared to the June FOMC meeting. The Fed also suggested tapering could begin at the next policy meeting and end towards the middle of next year, in time for rate increases. The immediate market response to the FOMC meeting did certainly suggest a hawkish undertone. The two-year US Treasury yield rose by 4 bps, which boosted the DXY index from a low of 93 to a high of 93.5 (intraday). Stocks rose and the 10-year Treasury yield edged mildly lower. The 30/2-year Treasury slope flattened by almost 10 bps. In our view, this was a rather muted response. For one, most of these moves are fading as we go to press. More importantly, going into the meeting, the market was already priced for a liftoff in 2022. This will suggest that the market was well positioned for Fed tapering at a minimum, and possibly an upgrade to the dots (Chart I-1). The Message From Other Central Banks While the Fed is still considering tapering asset purchases (and would very likely do so) by year-end, other central banks are well ahead in exiting emergency monetary settings. Just this week: The Norges bank hiked interest rates by 25 bps. We are particularly bullish on the krone, as highlighted in our Norwegian Method report; The Riskbank will end asset purchases this year. Its balance sheet is slated to be flat for 2022. It also closed all lending facilities launched during the pandemic. The offer for USD loans via the Fed’s swap facility will expire this month; The Bank of England kept monetary policy unchanged, but has already purchased £852bn of its £895bn target for government and corporate bonds. In fact, two of its members voted this week to reduce this target by £35bn, which would have effectively ended QE on a majority vote; The Swiss National Bank said in its introductory statement that it is fighting against an expensive franc, but modestly upgraded its inflation forecasts for 2022; The sole dovish central bank (aside from the SNB) was the Bank of Japan, but with elections on the horizon, and the possibility (or not) of a big fiscal package, their policy stance made sense. Chart I-2Central Bank Holdings Of Government Bonds
Central Bank Holdings Of Government Bonds
Central Bank Holdings Of Government Bonds
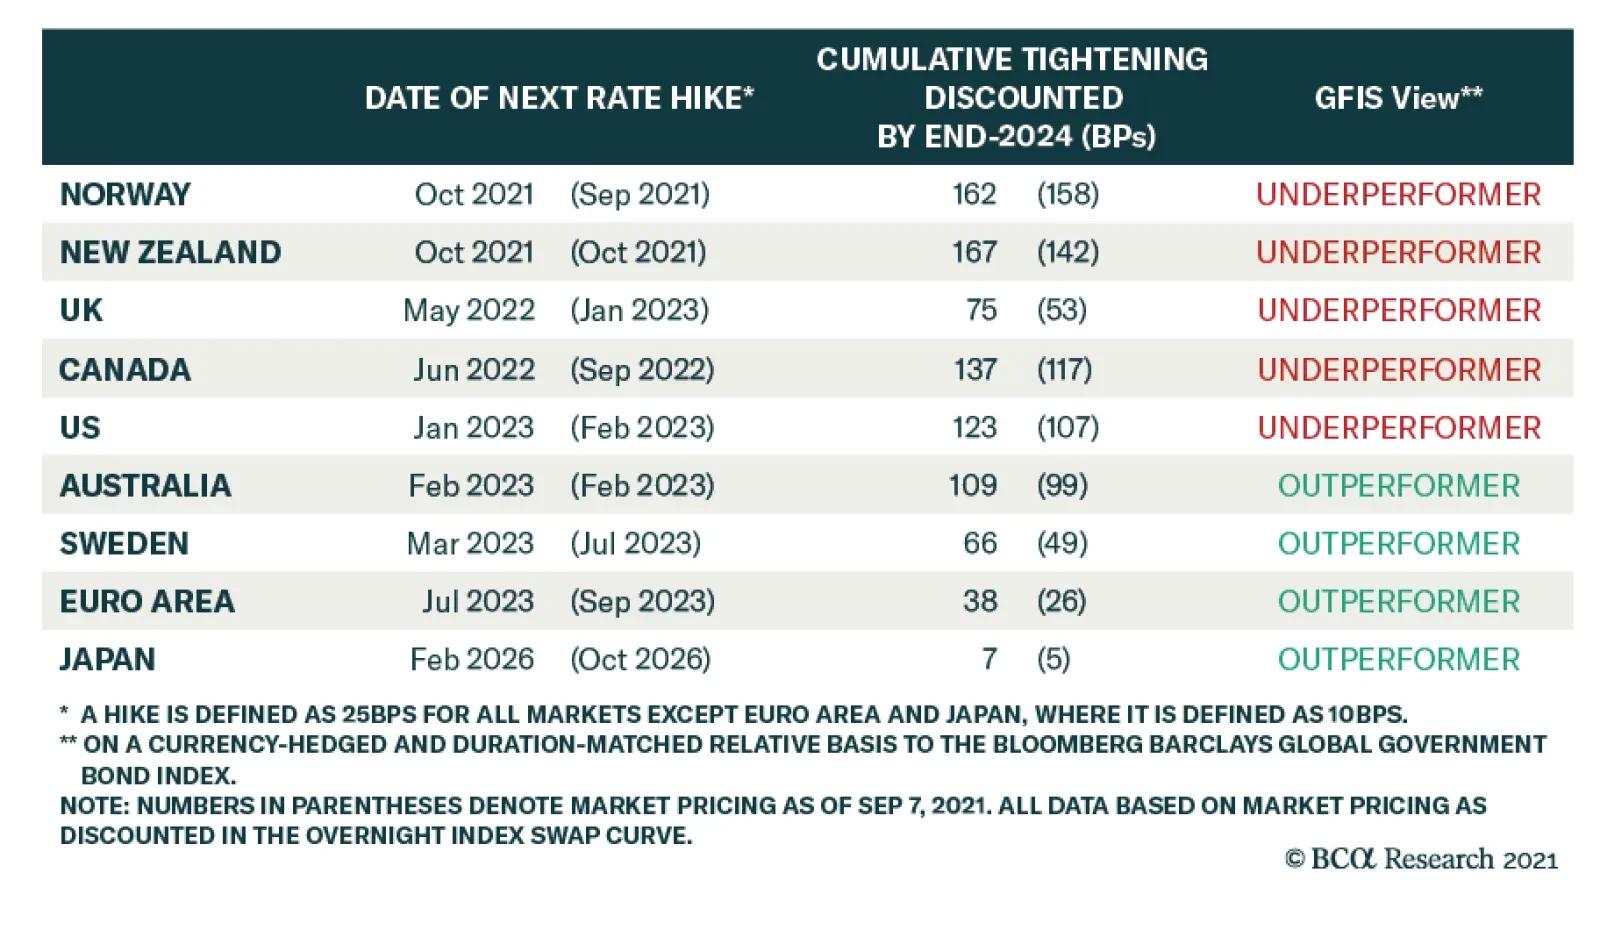
Elsewhere, the Bank of Canada has already cut its asset purchases in half, the Reserve Bank of New Zealand has ended QE, and the Reserve Bank of Australia has already been tapering asset purchases. In a nutshell, a Fed tapering at this point is well behind the actions of other G10 central banks. This is one key reason why the DXY index has failed to punch above the 94-95 level, and is relapsing as we go to press. From a bird’s eye view, many G10 central banks already have bloated balance sheets and a strong incentive to curtail asset purchases as growth recovers. Within the G10, the US central bank has the smallest holdings of outstanding bonds (Chart I-2). This not only means that, ceteris paribus, the incentive to taper asset purchases is bigger for other central banks, but the scope for the Federal Reserve to ease monetary policy is quite substantial should another shock occur. This might explain why there is unease among other central bankers, to exit emergency settings. Admittedly, this week, traditionally dovish central banks such as the Bank of Japan and the Swiss National Bank kept policy on hold and telegraphed a message that they will keep doing so for the foreseeable future. With a slightly more hawkish Federal Reserve, this should be a negative for these currencies. The same will apply to the ECB (Chart I-3). However, it is important to note that relatively dovish policy settings are well priced into both interest rate curves and their currencies, while upside surprises are not. The market does not expect any interest rate increases in the euro area or Japan before 2024, while it is priced for an aggressive pace of Fed rate hikes (Chart I-4). The starting point for any currency investor is an extremely dovish ECB and BoJ, relative to the Fed. Chart I-3A Pickup In US Yields Has Boosted The Dollar
A Pickup In US Yields Has Boosted The Dollar
A Pickup In US Yields Has Boosted The Dollar
Chart I-4Markets Expect A More Aggressive Fed
Markets Expect A More Aggressive Fed
Markets Expect A More Aggressive Fed
What Could Change? Global central banks are clearly focused on two goals – the outlook for growth and what that means for their maximum employment objective, and the long-run rate of inflation. These two objectives are interlinked. On the growth front, central bankers are justifiably admitting that the outlook remains clouded due to the Delta variant of COVID-19 and supply disruptions that are muddling the manufacturing outlook. However, it is important to remember that this is a global phenomenon. On a relative basis, there has been a growth rotation from the US to other economies that has historically supported the performance of DM currencies (Chart I-5). The primary reason is that many economies outside the US were in various forms of a lockdown over the last several months. As these economies reopen, so will economic activity. Chart I-5ARelative Growth And Currencies
Relative Growth And Currencies
Relative Growth And Currencies
Chart I-5BRelative Growth And Currencies
Relative Growth And Currencies
Relative Growth And Currencies
On the inflation front, the most acute problem has been tied to supply bottlenecks and this is not a US-centric problem. Inflation in the euro area, Sweden, the UK, Canada, or New Zealand are all above central bank targets (Table I-1). While all these central banks view the current overshoot as temporary, most have already pared back emergency monetary settings, as we highlighted above. Table I-1Inflation In The G10
A Misconception About Fed Tapering And The Dollar
A Misconception About Fed Tapering And The Dollar
The key takeaway is that most central banks view inflation risks as symmetric, while the Fed has telegraphed it is willing to tolerate an inflation overshoot following downturns (Chart I-6). During the Fed’s last two meetings, it has been clear that there is a limit to how much of an overshoot they will tolerate. However, it still suggests that the Fed remains well behind the inflation curve, with one of the most negative 2-year rates in the G10 (Chart I-7). Chart I-6The Fed And Inflation Overshoots
A Misconception About Fed Tapering And The Dollar
A Misconception About Fed Tapering And The Dollar
Chart I-7Real Yields In The US Are Very Low
A Misconception About Fed Tapering And The Dollar
A Misconception About Fed Tapering And The Dollar
In a nutshell, if our bias turns out to be correct that growth does recover more earnestly outside the US, and other central banks remain more orthodox than the Fed, this will be a headwind for a stronger US dollar. A Final Note On Canada Canada re-elected a Liberal minority government on September 20. Prime Minister Justin Trudeau’s bet on a majority government, given an astute handling of the pandemic, and massive fiscal stimulus, failed. The implication is a continuation of the status quo in Canada. The good news is that the status quo is actually bullish for the loonie. As we highlighted in our recent report, minority governments tend to be positive for the loonie, while majority governments generally nudge the CAD lower post election (Chart I-8). The rationale is that fiscal policy is slated to stay easy, but not overly so, providing gentle room for the BoC to hike interest rates. Easy fiscal but tighter monetary policy is usually bullish for a currency. Chart I-8Historically, The CAD Likes A Minority Government
Historically, The CAD Likes A Minority Government
Historically, The CAD Likes A Minority Government
Given our view on the US dollar, we expect the CAD/USD to punch above the recent 82-cent high, towards 85 and eventually 90 cents. While this view might take time to play out, both rising relative interest rates in Canada (our base case) and high oil prices will be the key catalysts. Chester Ntonifor Foreign Exchange Strategist chestern@bcaresearch.com Trades & Forecasts Forecast Summary
A Misconception About Fed Tapering And The Dollar
A Misconception About Fed Tapering And The Dollar
Strategtic View
A Misconception About Fed Tapering And The Dollar
A Misconception About Fed Tapering And The Dollar
Cyclical Holdings (6-18 months) Tactical Holdings (0-6 months) Limit Orders Closed Trades
Highlights We cannot predict how China will manage Evergrande precisely but we have a high conviction that it will do whatever it takes to prevent contagion across the property sector. However, China’s stimulus tools are losing their effectiveness over time. The country is due for a prolonged struggle with financial and economic instability regardless of whether Evergrande defaults. A messy default would obviously exacerbate the problem. China’s regulatory crackdowns target private companies and will continue to weigh on animal spirits in the private sector. The government will be forced to use fiscal policy to compensate. The US’s and China’s switch from engagement to confrontation poses a persistent headwind for investor sentiment toward China. The new consensus that investors should buy into China’s “strategic sectors” to avoid arbitrary regulatory crackdowns is vulnerable to its own logic and to sanctions by the US and its allies. Feature China poses a unique confluence of domestic and foreign political risks and global markets are now pricing them. Property giant Evergrande could default on $120 million in onshore and offshore interest payments as early as September 23, or next month, prompting investors to run for cover. Is this crisis fleeting or part of a larger systemic failure? It is a larger systemic failure. We expect a slow-motion, Japanese-style crisis over the coming decade, marked with periodic bailouts and stimulus packages. We recommend investors stay the course: steer clear of China and stay short the renminbi and Taiwanese dollar. Tactically, stick with large caps, defensive sectors, and developed markets within the global equity universe. Strategically, prefer emerging markets that benefit from forthcoming Chinese (and American) stimulus. 1. A “Minsky Moment” Cannot Be Ruled Out The chief fear is whether the approaching default of Evergrande marks China’s “Minsky Moment.” Hyman Minsky’s financial instability hypothesis held that long periods of stable revenues lead to risky financial deals and large accumulations of systemic risk that are underpriced. When revenues cannot cover interest payments, a crash ensues followed by deleveraging. Minsky’s hypothesis speaks to debt crises in an entire economy, yet nobody knows for sure whether China’s economy has reached such a breaking point. China’s national savings rate stands at 45.7% of GDP and nominal growth exceeds the long-term government bond yield. However, a sharp drop in asset prices, especially in the property sector, could change everything, as it could lead to balance sheet recession among corporates and a fall in national income. Evergrande is supposed to make an $84 million interest payment on offshore debt and a $36 million payment on onshore debt this week, and after 30 days it would default. It owes $37 billion in debt payments over the next 12 months but only has $13 billion cash on hand (as of June 30, 2021). Authorities can opt for a full bailout or a partial bailout, in which the company defaults on offshore bonds but not onshore. They could even let the company fail categorically, though that would produce exactly the kind of precipitous drop in property asset prices that would lead to wider financial contagion. State intervention to smooth the crisis is more likely – and the government can easily pressure other companies into acquiring Evergrande’s assets and business divisions. Chart 1Yes, This Could Be China's Minsky Moment
Yes, This Could Be China's Minsky Moment
Yes, This Could Be China's Minsky Moment
Chart 1 shows that China’s corporate debt-to-GDP ratio stands head and shoulders above other countries that experienced financial crises in recent decades, courtesy of our Emerging Markets Strategy. While China can undoubtedly bear large debts due to its savings, the implication is that China has large enough financial imbalances to suffer a full-fledged financial crisis, even if the timing is hard to predict. Household credit is also elevated at 61.7% of GDP, and the household debt-to-disposable-income ratio is now higher than in the United States. About two-thirds of China’s corporate debt is held by state-owned or state-controlled entities, prompting some investors to dismiss the gravity of the risk. However, financial crises often involve the transfer of debt from the state to private sector or vice versa. 59% of bond defaults in H1 2021 have involved state companies. Total debt is the main concern. Don’t take our word for it: China’s Communist Party has warned for the past decade about the danger of “implicit guarantees” and “moral hazard” that encourage financial excesses in the corporate sector. The Xi Jinping administration has tried to induce a deleveraging process since it came to power in 2012-13. Xi’s “three red lines” for the property sector precipitated the current turmoil. Even if Evergrande’s troubles are managed, China’s systemic risks will continue to boil over as its potential growth rate slows and the government continues trying to wring out financial excesses. Chart 2Policy Uncertainty, Financial Stress Can Rise Higher
Policy Uncertainty, Financial Stress Can Rise Higher
Policy Uncertainty, Financial Stress Can Rise Higher
More broadly China is experiencing an unprecedented overlap of economic and political crises: The population is aging and labor force is shrinking; The economic model since 2009 has been changing from export-manufacturing to domestic-oriented, investment-driven growth; Indebtedness is spreading from corporates to households and ultimately the government; The governance model is shifting from “single-party rule” to “single-person rule” or autocracy; The population is reaching middle class status and demanding better quality of life; The international trade environment is turning from hyper-globalization to hypo-globalization; The geopolitical backdrop is darkening with the US and its allies attempting to contain China’s ambitions of regional supremacy. Almost all of these changes bring more risks than opportunities to China over the long haul. The need for rapid policy shifts provides the ostensible reasoning for President Xi Jinping’s decision not to step down but to remain president for the foreseeable future. He will clinch this position at the twentieth national party congress in fall 2022. The implication is that policy uncertainty will continue climbing up to at least 2019 peaks while offshore equity markets will continue to trend lower, as they have done since the onset of the US trade war (Chart 2). Credit default swap rates have so far been subdued but they are showing signs of life. A sharp rise in policy uncertainty and property sector stress would pull them up. Domestic equities (A-shares) have rallied since 2019 but we would expect them to fall back given China’s historic confluence of structural and cyclical challenges, which will create further negative surprises (Chart 2, bottom panel). 2. Beijing Will Provide Bailouts And Stimulus Ad Nauseum Evergrande’s future may be in doubt but Beijing will throw all its power at stopping nationwide financial contagion. True, a policy miscalculation is possible. A tardy or failed intervention cannot be ruled out. However, investors should remember that a clear pattern of bailouts and stimulus has emerged over the course of the Xi Jinping administration whenever a “hard landing” or financial collapse loomed. The government tightens controls on bloated sectors until the financial fallout threatens to undermine general economic and social stability, at which point the government eases policy. It is often forced to stimulate the economy aggressively. Chart 3 shows these cycles in two ways: China’s control of credit through the state-controlled banks, and the frequency of news stories mentioning important terms associated with financial and economic distress: defaults, layoffs, and bankruptcies. These three terms used to be unheard of among China watchers. Under the Xi administration, a higher tolerance of creative destruction has served as the way to push forward reform. The current rise in distress is not extended, suggesting that more bad news is coming, but it also shows that the government has repeatedly been forced to provide stimulus even under the Xi administration. Chart 3Xi Jinping Has Bailed Out System Three Times Already
Xi Jinping Has Bailed Out System Three Times Already
Xi Jinping Has Bailed Out System Three Times Already
Could this time be different? Not likely. The American experience and the pandemic will also force China’s government to ease policy: China learns from US mistakes. The US lurched from Lehman’s failure into a financial crisis, an impaired credit channel, a sluggish economic recovery, a spike in polarization, policy paralysis, a near-default on the national debt, a surge in right- and left-wing populism, the tumultuous Trump presidency, widespread social unrest, a contested leadership succession, and a mob storming the nation’s capitol (Chart 4). This is obviously the nightmare of any Chinese leader and a trajectory that the Xi administration will avoid at any cost. Chart 4Lehman Brothers A Powerful Disincentive For China To Let Evergrande Fail
Lehman Brothers A Powerful Disincentive For China To Let Evergrande Fail
Lehman Brothers A Powerful Disincentive For China To Let Evergrande Fail
Chinese households store their wealth in the property sector, so any attempt at policy restraint or austerity faces a massive constraint. Only a few countries are comparable to China with respect to the share of non-financial household wealth (property and land) within total household wealth. All of them are hosts of property sector bubbles, including the bubbles in Spain and Ireland back in 2007 (Chart 5). A property collapse would destroy the savings of the Chinese people over four decades of prosperity. Chart 5Property Is The Bedrock Of Chinese Households
Five Points On China’s Crisis
Five Points On China’s Crisis
Social instability is already flaring up. Almost all China experts agree that “social stability” is the Communist Party’s bottom line. But note that the Evergrande saga has already led to protests, not only at the company’s headquarters in Shenzhen but also in other cities such as Shenyang, Guangzhou, Chongqing. Protests were filmed and shown on social media (posts have been censored). Protesters demanded repayment for wealth management products gone sour and properties they are owed that have not been built. This is only a taste of the cross-regional protests that would emerge if the broader property sector suffered. The lingering COVID-19 pandemic is still relevant. Investors should not underrate the potential threat that the pandemic poses to the regime. Severe epidemics have occurred about 11% of the time over the course of China’s history and they often have major ramifications. Disease has played a role in the downfall of six out of ten dynasties – and in four cases it played a major role. It would be suicidal for any regime to add self-inflicted economic collapse to a lingering pandemic (Table 1). Table 1Disease Threatens Chinese Dynasties – Not A Time To Self-Inflict A Recession
Five Points On China’s Crisis
Five Points On China’s Crisis
Easing policy does not necessarily mean bringing out the “bazooka” and splurging on money and credit growth, though that is increasingly likely as the crisis intensifies. Notably the July Politburo statement specifically removed language that said China would “avoid sharp turns in policy.” In other words, sharp turns might be necessary. That can only mean sharp reflationary turns, as there is very little chance of doubling down on policy tightening. A counterargument holds that the Chinese government is now exclusively focused on power consolidation to the neglect of financial and economic stability. Perhaps the leadership is misinformed, overconfident, or thinks a financial collapse will better purge its enemies – along the lines of the various political purges under Chairman Mao Zedong. Wealthy tech magnates and property owners could conceivably challenge the return of autocracy. After all, the US political establishment almost “fell” to a rich property baron – why couldn’t China’s Communist Party? Political purges should certainly be expected ahead of next year’s party congress. But not to the point of killing the economy. The government would not be trying to balance policy tightening and loosening so carefully if it sought to induce chaos. It must be admitted, however, that the change to autocracy means that the odds of irrational or idiosyncratic policy have gone up substantially and permanently. Of course, the high likelihood that Beijing will provide bailouts and stimulus should not be read as a bullish investment thesis, even though it would create a pop in oversold assets. The Chinese system is saturated with money and credit, which have been losing their effectiveness in driving growth. Financial imbalances get worse, not better, with each wave of credit stimulus. Beijing is caught between a rock and a hard place. Hence stimulus comes only reluctantly and reactively. But it does come in the end because a financial crash would threaten the life of the regime and preclude all other policy priorities, domestic and foreign. 3. Yes, China’s Regulatory Crackdown Targets The Private Sector Global growth and other emerging economies will get most of the benefit once China stimulates, since China’s own firms will still face a negative domestic political backdrop. Bullish investors argue that the government’s regulatory tightening is misunderstood and overblown. The claim is that China is not targeting the private sector generally but only isolated sectors causing social problems. Costs need to be reduced in property, education, and health to improve quality of life. China shares the US’s and EU’s desire to rein in tech giants that monopolize their markets, abuse consumer data and privacy, and benefit from distorted tax systems. Most of these arguments are misleading. China does not have a strong record on data privacy, equality, social safety nets, rule of law, or “sustainable” growth (as opposed to “unsustainable,” high-debt, high-polluting growth). China actively encourages state champions that monopolize key sectors. Many developed markets have better records in these areas, notably in Europe, yet China is eschewing these regulatory models in preference for an approach that is arbitrary and absolutist, i.e. negative for governance. As for the private sector, animal spirits have been in a long decline throughout the past decade. This is true whether judging by money velocity – i.e. the pace of economic activity relative to the increase in money supply – or by households’ and businesses’ marginal propensity to save (Chart 6). The 2015-16 period shows that even periodic bouts of government stimulus have not reversed the general trend. Regulatory whack-a-mole and financial turmoil will not improve the situation. Chart 6Private Sector Animal Spirits Depressed Throughout Xi Era
Private Sector Animal Spirits Depressed Throughout Xi Era
Private Sector Animal Spirits Depressed Throughout Xi Era
Chart 7Even Official Data Shows Consumer Confidence Flagging
Even Official Data Shows Consumer Confidence Flagging
Even Official Data Shows Consumer Confidence Flagging
Surveys of sentiment confirm that the latest developments will have a negative effect (Chart 7). Cumulatively, the changes in China’s domestic and international policy context are being interpreted as negative for business, entrepreneurship, and economic freedom – notwithstanding the government’s claims to expand opportunity in its “common prosperity” plan. 4. The Withdrawal Of US Friendship Is A Headwind For China Chart 8Other Asians Sought US Friendship, Not Conflict, When Export Models Expired
Other Asians Sought US Friendship, Not Conflict, When Export Models Expired
Other Asians Sought US Friendship, Not Conflict, When Export Models Expired
All of the successful Asian economies – including China for most of the past forty years of prosperity – have tried to stay on the good side of the United States. By contrast, China and the US today are shifting from engagement to confrontation and breaking up their economic ties (Chart 8). This is a problem for China because the US and to some extent its allies will seek to undermine China’s economy and its autocratic model as part of this great power competition. The rise in geopolitical risk is underscored by the Australia-UK-US (AUKUS) agreement, by which the US will provide Australia with nuclear submarines over the next decade. This was a clear demonstration of the US’s “pivot to Asia” and the fact that the US and China are preparing for war – if only to deter it. China’s return to autocracy and clash with the US and Asian neighbors is also leading to a deterioration of its global image, particularly over issues of transparency and information sharing. The dispute over the origins of COVID-19 is a major source of division with the US and other countries. Transparency is important for investors. The World Bank has discontinued its “Ease of Doing Business” rankings after a scandal was revealed in which China’s ranking was artificially bumped up. The last-published trend is still downward (Chart 9). Most recently China has stepped up censorship of its financial news media amid the current market turmoil, which makes it harder for investors to assess the full extent of property and financial risks.1 The US political factions agree on China-bashing if nothing else. The Biden administration has little political impetus to eschew tariffs and export controls. One important penalty will come from the Securities and Exchange Commission, which is likely to ban Chinese firms from US stock exchanges unless they conform to common accounting standards. Hence the dramatic fall in the share prices of Chinese companies listed via American Depository Receipts (ADRs), in both absolute and relative terms (Chart 10, top panel). This threat prompted China’s recent crackdown on its own firms that were attempting to hold initial public offerings on US exchanges. Chart 9US Conflict Exposes China’s Global Influence Campaign
Five Points On China’s Crisis
Five Points On China’s Crisis
The Quadrilateral Forum – the US, Japan, Australia, and India – has agreed to link the semiconductor supply chain to human rights standards, foreclosing China’s participation in that supply chain. US semiconductor firms are among the most exposed to China but they have not suffered over the course of the US-China tech war, suggesting that US vulnerabilities are limited (Chart 10, bottom panel). Chart 10US Regulators Will Kick Chinese Firms While They Are Down
US Regulators Will Kick Chinese Firms While They Are Down
US Regulators Will Kick Chinese Firms While They Are Down
The point is not to exaggerate the strength of the US and its allies but rather the costs to China of actively opposing them. The US has a difficult enough time cobbling together a coalition of states to impose sanctions on Iran over its nuclear program, not to mention forming any coalition that would totally exclude and isolate China. China is far more important to US allies than Iran – it is irreplaceable in the global economy (Chart 11). The EU and China’s Asian neighbors will typically restrain the US’s more aggressive impulses so as not to upset the global recovery or end up on the front lines of a war.2 Chart 11No Substitute For China In Global Economy
Five Points On China’s Crisis
Five Points On China’s Crisis
This diplomatic constraint on the US is probably positive for global growth but not for China per se. American allies are still able to increase the costs on China for pursuing its own state-backed development path and geopolitical sphere of influence. Japan, Australia, and others are likely to veto China’s application to join the Comprehensive and Progressive Trans-Pacific Partnership (CPTPP), while the UK and eventually the US are likely to join it. Investors should view US-China ties as a headwind at least until the two powers manage to negotiate a diplomatic thaw, i.e. substantial de-escalation of tensions. A thaw is unlikely in the lead-up to Xi Jinping’s consolidation of power and the US midterm elections in fall 2022. Presidents Biden and Xi are still working on a bilateral summit, not to mention a more substantial improvement in ties. We doubt a diplomatic thaw would be durable anyway but the important point is that until it happens China will face periodic bouts of negative sentiment from the emerging cold war. Other Asian economies thrived under US auspices – China is sailing in uncharted waters. 5. Global Investors Cannot Separate Civilian From State And Military Investments The word on Wall Street is that investors should align their strategies with those of China’s leaders so as not to run afoul of arbitrary and draconian regulators. For example, instead of “soft tech” or consumer-oriented companies – like those that give people rides, deliver food, or make creative video games – investors should invest in “hard tech” or strategic companies like those that make computer chips, renewable energy, biotechnologies, pharmaceuticals, and capital equipment. There is no question that the trend in China – and elsewhere – is for governments to become more active in picking winners and losers. Industrial policy is back. Investors have no choice but to include policy analysis in their toolbox. However, for global investors, an investment strategy of buying whatever the government says is far from convincing. The most basic investment strategy in keeping with the Xi administration’s goals would be to invest in state-owned enterprises in domestic equity markets. So SOEs should have outperformed the market, right? Wrong. They were in a downtrend prior to the 2015 bubble, the burst of which caused a further downtrend (Chart 12, top panel). Similarly, the preference for “hard tech” over “soft tech” is promising in theory but complicated in practice: hard tech is flat-to-down over the decade and down since COVID-19 (Chart 12, middle panel). It has underperformed its global peers (Chart 12, bottom panel). China’s policy disposition should be beneficial for industrials, health care, and renewable energy. First, China is doubling down on its manufacturing economy. Second, the population is aging and health care is a critical part of the common prosperity plan. Third, green energy is a way of diversifying from dependency on imported oil and natural gas. However, the profile of these sectors relative to their global counterparts is only unambiguously attractive in the case of industrials, which began to outperform even during the trade war (Chart 13). Chart 12State Approved' Trades Still Bring Risks
State Approved' Trades Still Bring Risks
State Approved' Trades Still Bring Risks
Chart 13Beware 'State Approved' Trades
Beware 'State Approved' Trades
Beware 'State Approved' Trades
In Table 2 we outline the valuations and political risks of onshore equity sectors. Valuations are not cheap. Domestic and foreign risks are not fully priced. Table 2China Onshore Equities, Valuations, And (Geo)Political Risks
Five Points On China’s Crisis
Five Points On China’s Crisis
There is a bigger problem for global investors, especially Americans: investing in China’s strategic sectors directly implicates investors in the Communist Party’s domestic human rights practices, state-owned enterprises, and national security goals. “Civil-military fusion” is a well-established doctrine that calls for the People’s Liberation Army to have access to the cutting-edge technology developed by civilians and vice versa. These investments will eventually be subject to punitive measures since the US policy establishment believes it can no longer afford to let US wealth buttress China’s military and technological rise. Investment Takeaways China may or may not work out a partial bailout for Evergrande but it will definitely provide state assistance and fiscal stimulus to try to prevent contagion across the property sector and financial system. Bad news in the coming weeks and months will be replaced by good news in this sense. However, the fact that China will eventually be forced to undertake traditional stimulus yet again will increase its systemic financial risks, in a well-established pattern. The best equity opportunities will lie outside of China, where companies will benefit from global recovery yet avoid suffering from China’s unique confluence of domestic and foreign political risks. We prefer developed markets and select emerging markets in Latin America and Asia-ex-China. Chinese households and businesses are downbeat. This behavior cannot be separated from the historic changes in the economy, domestic politics, and foreign policy. It is hard to see an improvement until the government boosts growth and the 2022 political reshuffle is over. American opposition is a bigger problem for China than global investors realize. Not only are the two economies divorcing but other democracies will distance themselves from China as well – not because of US demands but because their own manufacturing, national security, and ideological space is threatened by China’s reversion to autocracy and assertive foreign policy. Investing in China’s “hard tech” and strategic sectors with government approval is not a simple solution. This approach will directly funnel capital into China’s state-owned enterprises, domestic security forces, and military. As such the US and West will eventually impose controls. Investments may not be liquid since China would suffer if capital ever fled these kinds of projects. Both American and Chinese stimulus is looming this winter but the short run will see more volatility. We are closing our long JPY-KRW tactical trade for a gain of 4.4% Matt Gertken Vice President Geopolitical Strategy mattg@bcaresearch.com Footnotes 1 We have often noted in these pages over the past decade that multilateral organizations overrated improvements in China’s governance based on policy pronouncements rather than structural changes. 2 Still, tensions among the allies should not be overrated since they share a fundamental concern over China’s increasing challenge to the current global order. The EU is pursuing trade talks with Taiwan, and there are ways that the US can compensate France over the nullification of its submarine sales to Australia (most of which are detrimental to China’s security).
Highlights An Iran crisis is imminent. We still think a US-Iran détente is possible but our conviction is lower until Biden makes a successful show of force. Oil prices will be volatile. Fiscal drag is a risk to the cyclical global macro view. But developed markets are more fiscally proactive than they were after the global financial crisis. Elections will reinforce that, starting in Germany, Canada, and Japan. The Chinese and Russian spheres are still brimming with political and geopolitical risk. But China will ease monetary and fiscal policy on the margin over the coming 12 months. Afghanistan will not upset our outlook on the German and French elections, which is positive for the euro and European stocks. Feature Chart 1Bull Market In Iran Tensions
Biden's Show Of Force (GeoRisk Update)
Biden's Show Of Force (GeoRisk Update)
Iran is now the most pressing geopolitical risk in the short term (Chart 1). The Biden administration has been chastened by the messy withdrawal from Afghanistan and will be exceedingly reactive if it is provoked by foreign powers. Nuclear weapons improve regime survivability. Survival is what the Islamic Republic wants. Iran is surrounded by enemies in its region and under constant pressure from the United States. Hence Iran will never ultimately give up its nuclear program, as we have maintained. Chart 2Biden Unlikely To Lift Iran Sanctions Unilaterally
Biden's Show Of Force (GeoRisk Update)
Biden's Show Of Force (GeoRisk Update)
However, Supreme Leader Ali Khamenei could still agree to a deal in which the US reduces economic sanctions while Iran allows some restrictions on uranium enrichment for a limited period of time (the 2015 nuclear deal’s key provisions expire from 2023 through 2030). This would be a stopgap measure to delay the march into war. The problem is that rejoining the 2015 deal requires the US to ease sanctions first, since the US walked away from the deal in 2018. Iran would need domestic political cover to rejoin it. Biden has the executive authority to ease sanctions unilaterally but after Afghanistan he lacks the political capital to do so (Chart 2). So Biden cannot ease sanctions until Iran pares back its nuclear activities. But Iran has no reason to pare back if the US does not ease sanctions. Iran is now enriching some uranium to a purity of 60%. Israeli Defense Minister Benny Gantz says it will reach “nuclear breakout” capability – enough fissile material to build a bomb – within 10 weeks, i.e. mid-October. Anonymous officials from the Biden administration told the Associated Press it will be “months or less,” which could mean September, October, or November (Table 1). Table 1Iran Nearing "Breakout" Nuclear Capability
Biden's Show Of Force (GeoRisk Update)
Biden's Show Of Force (GeoRisk Update)
Meanwhile the new Iranian government of President Ebrahim Raisi, a hardliner who is tipped to take over as Supreme Leader once Ali Khamenei steps down, is implying that it will not rejoin negotiations until November. All of these timelines are blurry but the implication is that Iran will not resume talks until it has achieved nuclear breakout. Israel will continue its campaign of sabotage against the regime. It may be pressed to the point of launching air strikes, as it did against nuclear facilities in Iraq in 1981 and Syria in 2007 under what is known as the “Begin Doctrine.” Chart 3Israel Cannot Risk Losing US Security Guarantee
Biden's Show Of Force (GeoRisk Update)
Biden's Show Of Force (GeoRisk Update)
The constraint on Israel is that it cannot afford to lose America’s public support and defense alliance since it would find itself isolated and vulnerable in its region (Chart 3). But if Israeli intelligence concludes that the Iranians truly stand on the verge of achieving a deliverable nuclear weapon, the country will likely be driven to launch air strikes. Once the Iranians test and display a viable nuclear deterrent it will be too late. Four US presidents, including Biden, have declared that Iran will not be allowed to get nuclear weapons. Biden and the Democrats favor diplomacy, as Biden made clear in his bilateral summit with Israeli Prime Minister Naftali Bennett last week. But Biden also admitted that if diplomacy fails there are “other options.” The Israelis currently have a weak government but it is unified against a nuclear-armed Iran. At very least Bennett will underscore red lines to indicate that Israel’s vigilance has not declined despite hawkish Benjamin Netanyahu’s fall from power. Still, Iran may decide it has an historic opportunity to make a dash for the bomb if it thinks that the US will fail to support an Israeli attack. The US has lost leverage in negotiations since 2015. It no longer has troops stationed on Iran’s east and west flanks. It no longer has the same degree of Chinese and Russian cooperation. It is even more internally divided. Iran has no guarantee that the US will not undergo another paroxysm of nationalism in 2024 and try to attack it. The faction that opposed the deal all along is now in power and may believe it has the best chance in its lifetime to achieve nuclear breakout. The only reason a short-term deal is possible is because Khamenei may believe the Israelis will attack with full American support. He agreed to the 2015 deal. He also fears that the combination of economic sanctions and simmering social unrest will create a rift when he dies or passes the leadership to his successor. Iran has survived the Trump administration’s “maximum pressure” sanctions but it is still vulnerable (Chart 4). Chart 4Supreme Leader Focuses On Regime Survival
Supreme Leader Focuses On Regime Survival
Supreme Leader Focuses On Regime Survival
Moreover Biden is offering Khamenei a deal that does not require abandoning the nuclear program and does not prevent Iran from enhancing its missile capabilities. By taking the deal he might prevent his enemies from unifying, forestall immediate war, and pave the way for a smooth succession, while still pursuing the ultimate goal of nuclear weaponization. Bringing it all together, the world today stands at a critical juncture with regard to Iran and the unfinished business of the US wars in the Middle East. Unless the US and Israel stage a unified and convincing show of force, whether preemptively or in response to Iranian provocations, the Iranians will be justified in concluding that they have a once-in-a-generation opportunity to pursue the bomb. They could sneak past the global powers and obtain a nuclear deterrent and regime security, like North Korea did. This could easily precipitate a war. Biden will probably continue to be reactive rather than proactive. If the Iranians are silent then it will be clear that Khamenei still sees the value in a short-term deal. But if they continue their march toward nuclear breakout, as is the case as we go to press, then Biden will have to make a massive show of force. The goal would be to underscore the US’s red lines and drive Iran back to negotiating table. If Biden blinks, he will incentivize Iran to make a dash for the bomb. Either way a crisis is imminent. Israel will continue to use sabotage and underscore red lines while the Iranians will continue to escalate their attacks on Israel via militant proxies and attacks on tankers (Map 1). Map 1Secret War Escalates In Middle East
Biden's Show Of Force (GeoRisk Update)
Biden's Show Of Force (GeoRisk Update)
Bottom Line: After a crisis, either diplomacy will be restored, or the Middle East will be on a new war path. The war path points to a drastically different geopolitical backdrop for the global economy. If the US and Iran strike a short-term deal, Iranian oil will flow and the US will shift its strategic focus to pressuring China, which is negative for global growth and positive for the dollar. If the US and Iran start down the war path, oil supply disruptions will rise and the dollar will fall. Implications For Oil Prices And OPEC 2.0 The probability of a near-term conflict is clear from our decision tree, which remains the same as in June 2019 (Diagram 1). Diagram 1US-Iran Conflict: Critical Juncture In Our Decision Tree
Biden's Show Of Force (GeoRisk Update)
Biden's Show Of Force (GeoRisk Update)
Shows of force and an escalation in the secret war will cause temporary but possibly sharp spikes in oil prices in the short term. OPEC 2.0 remains intact so far this year, as expected. The likelihood that the global economic recovery will continue should encourage the Saudis, Russians, Emiratis and others to maintain production discipline to drain inventories and keep Brent crude prices above $60 per barrel. OPEC 2.0 is a weak link in oil prices, however, because Russians are less oil-dependent than the Gulf Arab states and do not need as high of oil prices for their government budget to break even (Chart 5). Periodically this dynamic leads the cartel to break down. None of the petro-states want to push oil prices up so high that they hasten the global green energy transition. Chart 5OPEC 2.0 Keeps Price Within Fiscal Breakeven Oil Price
Biden's Show Of Force (GeoRisk Update)
Biden's Show Of Force (GeoRisk Update)
Chart 6Oil Price Risks Lie To Upside Until US-Iran Deal Occurs
Oil Price Risks Lie To Upside Until US-Iran Deal Occurs
Oil Price Risks Lie To Upside Until US-Iran Deal Occurs
As long as OPEC 2.0 remains disciplined, average Brent crude oil prices will gradually rise to $80 barrels per day by the end of 2024, according to our Commodity & Energy Strategy (Chart 6). Imminent firefights will cause prices to spike at least temporarily when large amounts of capacity are taken offline. Global spare capacity is probably sufficient to handle one-off disruptions but an open-ended military conflict in the Persian Gulf or Strait of Hormuz would be a different story. After the next crisis, everything depends on whether the US and Israel establish a credible threat and thus restore diplomacy. Any US-Iran strategic détente would unleash Iranian production and could well motivate the Gulf Arabs to pump more oil and deny Iran market share. Bottom Line: Given that any US-Iran deal would also be short-term in nature, and may not even stabilize the region, some of the downside risks are fading at the moment. The US and China are also sucking in more commodities as they gear up for great power struggle. The geopolitical outlook is positive for oil prices in these respects. But OPEC 2.0 is the weak link in this expectation so we expect volatility. Global Fiscal Taps Will Stay Open Markets have wavered in recent months over softness in the global economic recovery, COVID-19 variants, and China’s policy tightening. The world faces a substantial fiscal drag in the coming years as government budgets correct from the giant deficits witnessed during the crisis. Nevertheless policymakers are still able to deliver some positive fiscal surprises on the margin. Developed markets have turned fiscally proactive over the past decade. They rejected austerity because it was seen as fueling populist political outcomes that threatened the established parties. Note that this change began with conservative governments (e.g. Japan, UK, US, Germany), implying that left-leaning governments will open the fiscal taps further whenever they come to power (e.g. Canada, the US, Italy, and likely Germany next). Chart 7Global Fiscal Taps Will Stay Open
Biden's Show Of Force (GeoRisk Update)
Biden's Show Of Force (GeoRisk Update)
Chart 7 updates the pandemic-era fiscal stimulus of major economies, with light-shaded bars highlighting new fiscal measures that are in development but have not yet been included in the IMF’s data set. The US remains at the top followed by Italy, which also saw populist electoral outcomes over the past decade. Chart 8US Fiscal Taps Open At Least Until 2023
US Fiscal Taps Open At Least Until 2023
US Fiscal Taps Open At Least Until 2023
The Biden administration is on the verge of passing a $550 billion bipartisan infrastructure bill. We maintain 80% subjective odds of passage – despite the messy pullout from Afghanistan. Assuming it passes, Democrats will proceed to their $3.5 trillion social welfare bill. This bill will inevitably be watered down – we expect a net deficit impact of around $1-$1.5 trillion for both bills – but it can pass via the partisan “budget reconciliation” process. We give 50% subjective odds today but will upgrade to 65% after infrastructure passes. The need to suspend the debt ceiling will raise volatility this fall but ultimately neither party has an interest in a national debt default. The US is expanding social spending even as geopolitical challenges prevent it from cutting defense spending, which might otherwise be expected after Afghanistan and Iraq. The US budget balance will contract after the crisis but then it will remain elevated, having taken a permanent step up as a result of populism. The impact should be a flat or falling dollar on a cyclical basis, even though we think geopolitical conflict will sustain the dollar as the leading reserve currency over the long run (Chart 8). So the dollar view remains neutral for now. Bottom Line: The US is facing a 5.9% contraction in the budget deficit in 2022 but the blow will be cushioned somewhat by two large spending bills, which will put budget deficits on a rising trajectory over the course of the decade. Big government is back. Developed Market Fiscal Moves (Outside The US) Chart 9German Opinion Favors New Left-Wing Coalition
Biden's Show Of Force (GeoRisk Update)
Biden's Show Of Force (GeoRisk Update)
Fiscal drag is also a risk for other developed markets – but here too a substantial shift away from prudence has taken place, which is likely to be signaled to investors by the outperformance of left-wing parties in Germany’s upcoming election. Germany is only scheduled to add EUR 2.4 billion to the 25.6 billion it will receive under the EU’s pandemic recovery fund, but Berlin is likely to bring positive fiscal surprises due to the federal election on September 26. Germany will likely see a left-wing coalition replace Chancellor Angela Merkel and her long-ruling Christian Democrats (Chart 9). The platforms of the different parties can be viewed in Table 2. Our GeoRisk Indicator for Germany confirms that political risk is elevated but in this case the risk brings upside to risk assets (Appendix). Table 2German Party Platforms
Biden's Show Of Force (GeoRisk Update)
Biden's Show Of Force (GeoRisk Update)
While we expected the Greens to perform better than they are in current polling, the point is the high probability of a shift to a new left-wing government. The Social Democrats are reviving under the leadership of Olaf Scholz (Chart 10). Tellingly, Scholz led the charge for Germany to loosen its fiscal belt back in 2019, prior to the global pandemic. Chart 10Germany: Online Markets Betting On Scholz
Biden's Show Of Force (GeoRisk Update)
Biden's Show Of Force (GeoRisk Update)
Chart 11Canada: Trudeau Takes A Calculated Risk
Biden's Show Of Force (GeoRisk Update)
Biden's Show Of Force (GeoRisk Update)
In June, the cabinet approved a draft 2022 budget plan supported by Scholz that would contain new borrowing worth EUR 99.7 bn ($119 billion). This amount is not included in the chart above but it should be seen as the minimum to be passed under the new government. If a left-wing coalition is formed, as we expect, the amount will be larger, given that both the Social Democrats and the Greens have been restrained by Merkel’s party. Canada turned fiscally proactive in 2015, when the institutional ruling party, the Liberals, outflanked the more progressive New Democrats by calling for budget deficits instead of a balanced budget. The Liberals saw a drop in support in 2019 but are now calling a snap election. Prime Minister Trudeau is not as popular in general opinion as he is in the news media but his party still leads the polls (Chart 11). The Conservatives are geographically isolated and, more importantly, are out of step with the median voter on the key issues (Table 3). Table 3Canada: Liberal Agenda Lines Up With Top Voter Priorities
Biden's Show Of Force (GeoRisk Update)
Biden's Show Of Force (GeoRisk Update)
Nevertheless it is a risky time to call an election – our GeoRisk Indicator for Canada is soaring (Appendix). Granting that the Liberals are very unlikely to fall from power, whatever their strength in parliament, the key point is that parliament already approved of CAD 100 billion in new spending over the coming three years. Any upside surprise would give Trudeau the ability to push for still more deficit spending, likely focused on climate change. Chart 12Japan: Suga Will Go, LDP Will Stimulate
Japan: Suga Will Go, LDP Will Stimulate
Japan: Suga Will Go, LDP Will Stimulate
Japanese politics are heating up ahead of the Liberal Democrats’ leadership election on September 29 and the general election, due by November 28. Prime Minister Yoshihide Suga’s sole purpose in life was to stand in for Shinzo Abe in overseeing the Tokyo Olympics. Now they are done and Suga will likely be axed – if he somehow survives the election, he will not last long after, as his approval rating is in freefall. The Liberal Democrats are still the only game in town. They will try to minimize the downside risks they face in the general election by passing a new stimulus package (Chart 12). Rumor has it that the new package will nominally be worth JPY 10-15 trillion, though we expect the party to go bigger, and LDP heavyweight Toshihiro Nikai has proposed a 30 trillion headline number. It is extremely unlikely that the election will cause a hung parliament or any political shift that jeopardizes passage of the bill. Abenomics remains the policy setting – and consumption tax hikes are no longer on the horizon to impede the second arrow of Abenomics: fiscal policy. Not all countries are projecting new spending. A stronger-than-expected showing by the Christian Democrats would result in gridlock in Germany. Meanwhile the UK may signal belt-tightening in October. Bottom Line: Germany, Canada, and Japan are likely to take some of the edge off of expected fiscal drag next year. Emerging Market Fiscal Moves (And China Regulatory Update) Among the emerging markets, Russia and China are notable in Chart 7 above for having such a small fiscal stimulus during this crisis. Russia has announced some fiscal measures ahead of the September 19 Duma election but they are small: $5.2 billion in social spending, $10 billion in strategic goals over three years, and a possible $6.8 billion increase in payments to pensioners. Fiscal austerity in Russia is one reason we expect domestic political risk to remain elevated and hence for President Putin to stoke conflicts in his near abroad (see our Russian risk indicator in the Appendix). There are plenty of signs that Belarussian tensions with the Baltic states and Poland can escalate in the near term, as can fighting in Ukraine in the wake of Biden’s new defense agreement and second package of military aid. China’s actual stimulus was much larger than shown in Chart 7 above because it mostly consisted of a surge in state-controlled bank lending. China is likely to ease monetary and fiscal policy on the margin over the coming 12 months to secure the recovery in time for the national party congress in 2022. But China’s regulatory crackdown will continue during that time and our GeoRisk Indicator clearly shows the uptick in risk this year (Appendix). Chart 13China Expands Unionization?
China Expands Unionization?
China Expands Unionization?
The regulatory crackdown is part of a cyclical consolidation of Xi Jinping’s power as well as a broader, secular trend of reasserting Communist Party and centralization in China. The latest developments underscore our view that investors should not play any technical rebound in Chinese equities. The increase in censorship of financial media is especially troubling. Just as the government struggles to deal with systemic financial problems (e.g. the failing property giant Evergrande, a possible “Lehman moment”), the lack of transparency and information asymmetry will get worse. The media is focusing on the government’s interventions into public morality, setting a “correct beauty standard” for entertainers and limiting kids to three hours of video games per week. But for investors what matters is that the regulatory crackdown is proceeding to the medical sector. High health costs (like high housing and education costs) are another target of the Xi administration in trying to increase popular support and legitimacy. Central government-mandated unionization in tech companies will hurt the tech sector without promoting social stability. Chinese unions do not operate like those in the West and are unlikely ever to do so. If they did, it would compound the preexisting structural problem of rising wages (Chart 13). Wages are forcing an economic transition onto Beijing, which raises systemic risks permanently across all sectors. Bottom Line: Political and geopolitical risk are still elevated in China and Russia. China will ease monetary and fiscal policy gradually over the coming year but the regulatory crackdown will persist at least until the 2022 political reshuffle. Afghanistan: The Refugee Fallout September 2021 will officially mark the beginning of Taliban’s second bout of power in Afghanistan. Will Afghanistan be the only country to spawn an outflux of refugees? Will the Taliban wresting power in Afghanistan trigger another refugee crisis for Europe? How is the rise of the Taliban likely to affect geopolitics in South Asia? Will Afghanistan Be The Last Major Country To Spawn Refugees? Absolutely not. We expect regime failures to affect the global economy over the next few years. The global growth engine functions asymmetrically and is powered only by a fistful of countries. As economic growth in poor countries fails to keep pace with that of top performers, institutional turmoil is bound to follow. This trend will only add to the growing problem of refugees that the world has seen in the post-WWII era. History suggests that the number of refugees in the world at any point in time is a function of economic prosperity (or the lack thereof) in poorer continents (Chart 14). For instance, the periods spanning 1980-90 and 2015-20 saw the world’s poorer continents lose their share in global GDP. Unsurprisingly these phases also saw a marked increase in the number of refugees. With the world’s poorer continents expected to lose share in global GDP again going forward, the number of refugees in the world will only rise. Chart 14Refugee Flows Rise When Growth Weak In Poor Continents
Biden's Show Of Force (GeoRisk Update)
Biden's Show Of Force (GeoRisk Update)
Citizens of Syria, Venezuela, Afghanistan, South Sudan, and Myanmar today account for two-thirds of all refugees globally. To start with, these five countries’ share in global GDP was low at 0.8% in the 1980s. Now their share in global GDP is set to fall to 0.2% over the next five years (Chart 15). Chart 15Refugee Exporters Hit All-Time Low In Global GDP Share
Biden's Show Of Force (GeoRisk Update)
Biden's Show Of Force (GeoRisk Update)
Per capita incomes in top refugee source countries tend to be very low. Whilst regime fractures appear to be the proximate cause of refugee outflux, an economic collapse is probably the root cause of the civil strife and waves of refugee movement seen out of the top refugee source countries. Another factor that could have a bearing is the rise of multipolarity. Shifting power structures in the global economy affect the stability of regimes with weak institutions. Instability in Afghanistan has been a direct result of the rise and the fall of the British and Russian empires. American imperial overreach is just the latest episode. If another Middle Eastern war erupts, the implications are obvious. But so too are the implications of US-China proxy wars in Southeast Asia or Russia-West proxy wars in eastern Europe. Bottom Line: With poorer continents’ economic prospects likely to remain weak and with multipolarity here to stay, the world’s refugee problem is here to stay too. Is A Repeat Of 2015 Refugee Crisis Likely In 2021? No. 2021 will not be a replica of 2015. This is owing to two key reasons. First, Afghanistan has long witnessed a steady outflow of refugees – especially at the end of the twentieth century but also throughout the US’s 20-year war there. The magnitude of the refugee problem in 2021 will be significantly smaller than that in 2015. Secondly, voters are now differentiating between immigrants and refugees with the latter entity gaining greater acceptance (Chart 16). Chart 16DM Attitudes Permissive Toward Refugees
Biden's Show Of Force (GeoRisk Update)
Biden's Show Of Force (GeoRisk Update)
Chart 17Refugees Will Not Change Game In German/French Elections
Biden's Show Of Force (GeoRisk Update)
Biden's Show Of Force (GeoRisk Update)
Concerns about refugees will gain some political traction but it will reinforce rather than upset the current trajectory in the most important upcoming elections, in Germany in September and France next April. True, these countries feature in the list of top countries to which Afghan refugees flee and will see some political backlash (Chart 17). But the outcome may be counterintuitive. In the German election, any boost to the far-right will underscore the likely underperformance of the ruling Christian Democrats. So the German elections will produce a left-wing surprise – and yet, even if the Greens won the chancellorship (the true surprise scenario, looking much less likely now), investors will cheer the pro-Europe and pro-fiscal result. The French election is overcrowded with right-wing candidates, both center-right and far-right, giving President Macron the ability to pivot to the left to reinforce his incumbent advantage next spring. Again, the euro and the equity market will rise on the status quo despite the political risk shown in our indicator (Appendix). Of course, immigration and refugees will cause shocks to European politics in future, especially as more regime failures in the third world take place to add to Afghanistan and Ethiopia. But in the short run they are likely to reinforce the fact that European politics are an oasis of stability given what is happening in the US, China, Brazil, and even Russia and India. Bottom Line: 2021 will not see a repeat of the 2015 refugee crisis. Ironically Afghan refugees could reinforce European integration in both German and French elections. The magnitude of the Afghan crisis is smaller than in the past and most Afghan refugees are likely to migrate to Pakistan and Iran (Chart 17). But more regime failures will ensure that the flow of people becomes a political risk again sometime in the future. What Does The Rise Of Taliban Mean For India? The Taliban first held power in Afghanistan from 1996-2001. This was one of the most fraught geopolitical periods in South Asia since the 1970s. Now optimists argue that Taliban 2.0 is different. Taliban leaders are engaging in discussions with an ex-president who was backed by America and making positive overtures towards India. So, will this time be different? It is worth noting that Taliban 2.0 will have to function within two major constraints. First, Afghanistan is deeply divided and diverse. Afghanistan’s national anthem refers to fourteen ethnic groups. Running a stable government is inherently challenging in this mountainous country. With Taliban being dominated by one ethnic group and with limited financial resources at hand, the Taliban will continue to use brute force to keep competing political groups at bay. Chart 18Taliban In Line With Afghanis On Sharia
Biden's Show Of Force (GeoRisk Update)
Biden's Show Of Force (GeoRisk Update)
At the same time, to maintain legitimacy and power, the Taliban will have to support aligned political groups operating in Afghanistan and neighboring Pakistan. Second, an overwhelming majority of Afghani citizens want Sharia law, i.e. a legal code based on Islamic scripture as the official law of the land (Chart 18). Hence if the Taliban enforces a Sharia-based legal system in Afghanistan then it will fall in line with what the broader population demands. It is against this backdrop that Taliban 2.0 is bound to have several similarities with the version that ruled from 1996-2001. Additionally, US withdrawal from Afghanistan will revive a range of latent terrorist movements in the region. This poses risks for outside countries, not least India, which has a long history of being targeted by Afghani terrorist groups. The US will remain engaged in counter-terrorism operations. To complicate matters, India’s North has an even more unfavorable view of Pakistan than the rest of India. With the northern voter’s importance rising, India’s administration may be forced to respond more aggressively to a terrorist event than would have been the case about a decade ago. It is also possible that terrorism will strike at China over time given its treatment of Uighur Muslims in Xinjiang. China’s economic footprint in Afghanistan could precipitate such a shift. Bottom Line: US withdrawal from Afghanistan is bound to add to geopolitical risks as latent terrorist forces will be activated. India has a long history of being targeted by Afghani terrorist movements. Incidentally, it will take time for transnational terrorism based in Afghanistan to mount successful attacks at the West once again, given that western intelligence services are more aware of the problem than they were in 2000. But non-state actors may regain the element of surprise over time, given that the western powers are increasingly focused on state-to-state struggle in a new era of great power competition. Matt Gertken Vice President Geopolitical Strategy mattg@bcaresearch.com Ritika Mankar, CFA Editor/Strategist ritika.mankar@bcaresearch.com Section II: GeoRisk Indicator China
China: GeoRisk Indicator
China: GeoRisk Indicator
Russia
Russia: GeoRisk Indicator
Russia: GeoRisk Indicator
United Kingdom
UK: GeoRisk Indicator
UK: GeoRisk Indicator
Germany
Germany: GeoRisk Indicator
Germany: GeoRisk Indicator
France
France: GeoRisk Indicator
France: GeoRisk Indicator
Italy
Italy: GeoRisk Indicator
Italy: GeoRisk Indicator
Canada
Canada: GeoRisk Indicator
Canada: GeoRisk Indicator
Spain
Spain: GeoRisk Indicator
Spain: GeoRisk Indicator
Taiwan
Taiwan: GeoRisk Indicator
Taiwan: GeoRisk Indicator
Korea
Korea: GeoRisk Indicator
Korea: GeoRisk Indicator
Turkey
Turkey: GeoRisk Indicator
Turkey: GeoRisk Indicator
Brazil
Brazil: GeoRisk Indicator
Brazil: GeoRisk Indicator
Australia
Australia: GeoRisk Indicator
Australia: GeoRisk Indicator
Section III: Geopolitical Calendar
Highlights The US dollar’s reserve status will remain intact for the foreseeable future. While this privilege is fraying at the edges, there are no viable alternatives just yet. There is an overarching incentive for any country to hold onto its currency’s power. For the US, it is still well within their ability to keep this “exorbitant privilege.” That said, there will be rolling doubts about the ability of the US to maintain its large currency sphere. This will create tidal waves in the currency’s path, providing plenty of trading opportunities for investors. China is on track to surpass the US in economic size, but it is far from dethroning the US in the military realm. However, it is gradually gaining the ability to deny the US access to its immediate offshore areas and may already be capable of winning a war over nearby islands like Taiwan. Watch the RMB over the next few decades. From a macro and cyclical perspective, the dollar is likely to decline as global growth picks up and the Fed lags market expectations in raising rates. From a geopolitical perspective, however, the backdrop is neutral-to-bullish for the dollar over the next three to five years. Feature Having the world’s reserve currency comes with a few advantages, which any governments would be loath to give up. The most important advantage is the ability to settle one’s balance of payments in one’s own currency. This not only facilitates trade for the reserve nation, it also reinforces the turnover of the reserve currency internationally. The value of this privilege is as much symbolic as economic. This “first mover advantage” or adoption of one’s currency internationally automatically ordains the resident central bank as the world’s bank. The primary advantage here is being able to dictate global financial conditions, expanding and contracting money supply to address domestic and global funding pressures. As compensation for this task, the world provides one with non-negligible seigniorage revenue. Being the world’s central bank also comes with another crucial advantage: being able to choose which international projects will be funded, while using cheaply issued local debt to finance these investments. Of course, any sensible society will earn more on its investments than it pays on the debt issued. There is a geopolitical angle to having the world’s reserve currency. A nation’s currency is widely held because of strategic depth—its ability to secure the people who trade in that currency and the property denominated in it. Deposits and transactions can be monitored, secured, or even halted at the behest of the sovereign. Holding the currency means one can maintain one’s purchasing power, given that it is backed by the most powerful country in the world. As the reserve currency becomes the de facto international medium of exchange, having stood the test of time through various crises, this allows the resident country to alter its purchasing power to achieve both national and international goals. Throughout history, having the world’s reserve currency has been the pursuit of many governments and kingdoms. In the current paradigm, the US enjoys this privilege. But could that change? And if so, how and when? Our goal in this report is threefold. First, why would any country want to maintain reserve status? Second, does the US still possess the apparatus to keep the dollar as a reserve asset over the next decade? And finally, are there any identifiable threats to the US dollar reserve status beyond a ten-year horizon? The Imperative To Maintain Status Quo Global trade is still largely conducted in US dollars. According to the BIS triennial central bank survey, 88.3% of transactions globally were in dollars just before the pandemic, a percentage that has been rather resilient over the last two decades (Chart I-1). It is true that currencies such as the Chinese renminbi have been gaining international acceptance, but displacing a currency that dominates almost 90% of global transactions is a herculean task. Surprisingly, the world has been transacting less often in euros and Japanese yen, currencies that also commanded international appeal in recent history. Chart I-1The US Dollar Still Dominates Global Transactions
Is The Dollar’s Reserve Status Under Threat?
Is The Dollar’s Reserve Status Under Threat?
The big benefit for the US comes from being able to settle its balance of payments in dollars. This not only lowers transaction costs (by lowering exchange rate risk), but it also provides the ability to cheaply borrow in your own currency to pay for imports. Having global trade largely denominated in US dollars also establishes a network of systems that make it much easier to settle trade in that currency. It is remarkable that, despite running a persistent current account deficit, the US dollar has tended to appreciate during crises, a privilege other deficit countries do not enjoy (Chart I-2). Strong network effects make the US dollar the currency of choice during crises. Chart I-2Despite Running A Current Account Deficit, The Dollar Tends To Rise During Crises
Is The Dollar’s Reserve Status Under Threat?
Is The Dollar’s Reserve Status Under Threat?
Chart I-3The US Generates Non-Negligible Seignorage Revenue
The US Generates Non-Negligible Seignorage Revenue
The US Generates Non-Negligible Seignorage Revenue
Being at the center of the global financial architecture comes with an important benefit beyond trade: the ability to dictate financial conditions both domestically and globally. Consider a scenario in which the US and the global economy are facing a downturn. In this scenario, the Federal Reserve can be instrumental in turning the tide: To stimulate the US economy, the Fed lowers interest rates and/or runs a wider fiscal deficit. The central bank helps finance this fiscal deficit by expanding the monetary base (benefitting from seigniorage revenue). As the Fed drops interest rates, the yield curve steepens. Banks use the positive term structure to borrow at the short end of the curve and lend at the longer end. This boosts the US money supply. As firms borrow to invest, this increases demand for imports (machinery, commodities, consumer goods), widening the US current account deficit. US trade is settled in dollars, increasing the international supply of the greenback. To maintain competitiveness, other central banks purchase these dollars from the private sector, in exchange for their local currency. As global USD reserves rise, they can be reinvested back into Treasuries and held in custody at the Fed. In essence, the US can finance its budget deficit through a strong capital account surplus. The seigniorage revenue that the US enjoys by easing both domestic and international financing conditions is about $100 billion a year or roughly 0.5% of GDP (Chart I-3). But the goodwill from being able to dictate both domestic and international financial conditions is far greater. At BCA, one of our favorite measures of global dollar liquidity is the sum of the Fed’s custody holdings together with the US monetary base. Every time this measure has severely contracted in the past, the shortage of dollars has triggered a financial crisis somewhere, typically among other countries running deficits (Chart I-4), a highlight of the importance of the US as a global financier. Chart I-4US Money Supply And Global Liquidity
US Money Supply And Global Liquidity
US Money Supply And Global Liquidity
Chart I-5Despite A Liability Shortfall, US Assets Generate A Net Profit
Despite A Liability Shortfall, US Assets Generate A Net Profit
Despite A Liability Shortfall, US Assets Generate A Net Profit
Beyond seigniorage revenue, the US enjoys another advantage—being able to earn much more on its international investments than it pays on its liabilities. The US generates an excess return of 1% of GDP from its external assets, despite having a net liability shortfall of 67% of GDP (Chart I-5). The ability to issue debt that will be gobbled up by foreigners, and in part use these proceeds to generate a higher overall return on investments made abroad, does indeed constitute an “exorbitant privilege.” In a nutshell, there is a very strong incentive for the US to keep the dollar as the world’s reserve currency. One short-term implication is that the Fed might only taper asset purchases and/or raise interest rates in an environment in which both global and US growth are strong, or it could otherwise trigger a global liquidity crisis. This will be particularly the case given the Delta variant of COVID-19 is still hemorrhaging global economic activity. An Overreach In The Dollar’s Influence There is a political advantage to the US dollar’s reserve status that is often overlooked: transactions conducted in US dollars anywhere in the world fall under US law. In simple terms, if a company in any country buys energy from Iran and the transaction is done in US dollars, the Treasury has powers to sanction the parties involved. Since most companies across the world cannot afford to be locked out of the US financial system, they will tend to comply with US sanctions. Even companies that operate under the umbrella of great powers, such as China and Russia, still tend to adhere to US sanctions, because they do not want to jeopardize their trade with US allies, such as the European Union. Of course, China, Russia, and Iran are actively seeking alternative transaction systems to bypass the dollar and US sanctions. But they do not yet trust each other’s currencies. Chart I-6A Deep And Liquid Pool Of Treasurys
A Deep And Liquid Pool Of Treasurys
A Deep And Liquid Pool Of Treasurys
The euro is the only viable alternative; however, the euro’s share of global transactions has fallen, despite the EU’s solidification as a monetary union over the past decade and despite the unprecedented deterioration of US relations with China and Russia. The EU could do great damage to the USD’s standing if it joined Russia’s and China’s efforts wholeheartedly, but the EU is still a major trading partner of the US and shares many of the same foreign policy aims. It is also chronically short of aggregate demand and runs trade and current account surpluses, depriving trade partners of euro savings or a debt market to recycle those savings (Chart I-6). Historically, having the world’s reserve currency allows the US to conduct international accords that serve both domestic and foreign interests. The Plaza Accord, signed in the 1980s to depreciate the US dollar, served both US interests in rebalancing the deficit and international interests in financing global trade. The 1980s were golden years for Japan and the Asian tigers on the back of a weak USD, allowing entities to borrow in greenbacks and profitably invest in Asian growth. Once the US dollar had depreciated by a fair amount, threatening its store of value, the US engineered the Louvre Accord to stabilize exchange rates. Ultimately, when various Asian bubbles popped, investors thought of nowhere better to flee than to the safety of the US dollar. The same thing happened after the emerging market boom of the 2000s and the eventual bust of the 2010s. Today, the US may not be able to organize an international intervention, if one should be necessary in the coming years. Past experience shows that countries act unilaterally and coordinated interventions lack staying power. Neither Europe nor Japan is in the position today to allow currency appreciation, as they were in the past. And the US has shown itself unable to combat its trading partners’ depreciation, as in the case of China, whose renminbi remains below 2014 levels. The bottom line is that there is nothing to stop the US from attempting to stretch its overreach too far, which would create a backlash that diminishes the dollar’s status. This is especially the case given trust in the US government is quite low by historical standards, which for now points to a lower dollar cyclically (Chart I-7). Chart I-7Trust In The US Government And The Dollar
Is The Dollar’s Reserve Status Under Threat?
Is The Dollar’s Reserve Status Under Threat?
This is not to say that other countries with reserve aspirations can tolerate sustained appreciation. China has recommitted to manufacturing supremacy in its latest five-year plan, as it fears the political consequences of rapid deindustrialization. As such, the renminbi will be periodically capped to maintain competitiveness. Can The US Maintain Status Quo? Chart I-8A Lifespan Of Reserve Currencies
Is The Dollar’s Reserve Status Under Threat?
Is The Dollar’s Reserve Status Under Threat?
Over the last few centuries, reserve currencies have tended to have a lifespan of about 100 years (Chart I-8). The reason is that global wars tend to knock the leading power off its geopolitical pedestal, devaluing its currency and giving rise to a new peace settlement with a new ascendant country whose currency then becomes the basis for international trade. Such was the case for Spain, France, the UK, and the United States in a pattern of war and peace since the sixteenth century. Granting that the US dollar took the baton from sterling in the 1920s and that the post-World War II peace settlement is eroding in the face of escalating geopolitical competition, it is reasonable to ask whether or not the US might lose its grip on this power. To assess this possibility, it is instructive to revisit the anatomy of a reserve currency: Typically, a reserve currency tends to be that of the “greatest” nation. For the same reason, the reserve nation tends to be the wealthiest, which ensures that its currency is a store of value and that it can act as a buyer of last resort during crisis (Chart I-9). This reasoning is straightforward when a global empire is recognizable and unopposed. But in the current context of multipolarity, or great power competition, the paradigm could start to shift. Global trade is slowing globally, but it is accelerating in Asia (Chart I-10). China is a larger trading partner than the US for many emerging markets and is slated to surpass the US economy over the next decade. The renminbi has a long way to go to rival the dollar, but it is gradually rising and its place within the global reserve currency basket is much smaller than its share of global trade or output, implying room for growth (Chart I-11). Chart I-9Wealth And Reserve Currency Status Go Hand-In-Hand
Is The Dollar’s Reserve Status Under Threat?
Is The Dollar’s Reserve Status Under Threat?
Chart I-10Trade In Asia Is Booming
Is The Dollar’s Reserve Status Under Threat?
Is The Dollar’s Reserve Status Under Threat?
Chart I-11Adoption Of The RMB Has Room To Grow
Adoption Of The RMB Has Room To Grow
Adoption Of The RMB Has Room To Grow
To maintain hegemonic power (especially controlling the vital supply routes of prosperity), the reserve nation needs military might above and beyond everyone else. It helps that US military spending remains the biggest in the world, in part financed by US liabilities (Chart I-12). China is far from dethroning the US in the military realm. But it is gradually gaining the ability to deny the US access to its immediate offshore areas and may already be capable of winning a war over nearby islands like Taiwan. Moreover, its naval power is set to grow substantially between now and 2030 (Table I-1). Already, over the past decade, the US stood helplessly by when Russia and China annexed Crimea and the reefs of the South China Sea. It is possible to imagine a series of events that erode US security guarantees in the region, even as the US loses economic primacy. Chart I-12The US Still Maintains Military Might
Is The Dollar’s Reserve Status Under Threat?
Is The Dollar’s Reserve Status Under Threat?
Table I-1China’s Economic And Naval Growth Slated To Reduce American Primacy In Asia Pacific
Is The Dollar’s Reserve Status Under Threat?
Is The Dollar’s Reserve Status Under Threat?
The reserve currency nation needs to run deficits to finance activity in the rest of the world. That requires having deep and liquid capital markets to absorb global savings. There is considerable trust or “goodwill” that makes the US Treasury market the most liquid debt exchange pool in the world. This remains the case today (previously mentioned Chart I-6). Even so, this trend is shifting. The growth in euro- and yen-denominated debt is exploding. This mirrors the gradual shift in the allocation of FX reserves away from dollars into other currencies. If the US began to use the dollar as a geopolitical weapon recklessly, foreign entities may have no other choice but to rally into other currency blocks, including the euro (and perhaps eventually the yuan). This will take years, but it is worth noting that global allocation to FX reserves have fallen from around 80% toward USDs in the 70s to around 60% today (Chart I-13). Chart I-13The Dollar Reserve Status Has Been Ebbing
The Dollar Reserve Status Has Been Ebbing
The Dollar Reserve Status Has Been Ebbing
On the political front, there is some evidence that public opinion on the dollar is fading, although it is far from damning. A Pew survey on the trust in the US government is near decade lows and has tracked the ebb and flow of changes in the dollar (previously shown Chart I-7). Trust in government will probably not get much worse in the coming years, as the pandemic will wane and stimulus will secure the economic recovery, but too much stimulus could conceivably ignite an inflation problem that weighs on trust. True, populism has driven the US government under two administrations into extreme deficit spending. With the pandemic as a catalyst, US deficits have reached WWII levels despite the absence of a war. However, the Biden administration’s $3.5 trillion spending bill will be watered down heavily – and the 2022 midterms will likely restore gridlock in Congress, freezing fiscal policy through at least 2025. In other words, fiscal policy is negative for the dollar in the very near term, but the fiscal outlook is not yet so extravagant as to suggest a loss of reserve currency status. After all, there is some positive news for the US. The US demonstrated its leadership in innovation with the COVID-19 vaccines; it survived its constitutional stress test in the 2020 election; it is now shifting from failed “nation building” abroad to nation building at home; and its companies remain the most innovative and efficient, judging by global equity market capitalization (Chart I-14). China, meanwhile, is facing the most severe test of its political and economic system since it marketized its economy in 1979. Investors should not lose sight of the fact that, since the rise of President Xi Jinping and Russia’s invasion of Ukraine, global policy uncertainty has tended to outpace US policy uncertainty, attracting flows into the dollar (Chart I-15). Given that China and Russia are both pursuing autocratic governments at the expense of the private economy, it would not be surprising to see global policy uncertainty take the lead once again, confirming the decade trend of global flows favoring the US when uncertainty rises. Chart I-14American Primacy Still Clear In Equity Market
American Primacy Still Clear In Equity Market
American Primacy Still Clear In Equity Market
Chart I-15Higher Policy Uncertainty Good For Dollar
Higher Policy Uncertainty Good For Dollar
Higher Policy Uncertainty Good For Dollar
The bottom line is that the US dollar is gradually declining as a share of the global currency reserve basket, just as the US economy and military are gradually declining as a share of global output and defense spending. Yet the US will remain the first or second largest economy and premier military power for a long time, and the dollar still lacks a viable single replacement. A major war or geopolitical crisis is probably necessary to precipitate a major breakdown. The Iranian Revolution and September 11 attacks both had this kind of effect (see 1979 and 2001 in Chart I-13 above). But COVID-19 is less clear. If China and Europe emerge as more stable than the US, then the post-pandemic aftermath will bring more bad news for the dollar. Investment Implications From a geopolitical perspective, the backdrop is neutral for the dollar beyond the next twelve to eighteen months. An escalating conflict with Iran—which is possible in the near term—would echo the early 2000s and weigh on the currency. But a deal with Iran and a strategic pivot to Asia would compound China’s domestic political problems and likely boost the greenback. Chart I-16US Twin Deficits And The Dollar
US Twin Deficits And The Dollar
US Twin Deficits And The Dollar
From a macro and cyclical perspective, however, the view is clearly negative for the dollar. Over the next five years, the U.S. Congressional Budget Office (CBO) estimates that the U.S. budget deficit will shrink and then begin expanding again to -5% of GDP. If one assumes that the current account deficit will widen somewhat, then stabilize, the twin deficits will be pinned at around -10% of GDP. Markets have typically punished the dollar on rising twin deficits (Chart I-16). This suggests near-term pressure on the dollar’s reserve status is to the downside. EM currencies may hold a key to the performance of the dollar. While most EM economies remain hostage to the virus, a coiled-spring rebound cannot be ruled out as populations become vaccinated. China’s Politburo signaled in July that it will no longer tighten monetary and fiscal policy. We would expect policy easing over the next twelve months to ensure the economy is stable in advance of the fall 2022 party congress. If the virus wanes and China’s economy is stimulated, global growth will improve and the dollar will fall. Chester Ntonifor Foreign Exchange Strategist chestern@bcaresearch.com Matt Gertken Geopolitical Strategist mattg@bcaresearch.com
Highlights The post-pandemic investment phase is just a continuation of the post-credit boom investment phase. This is because the pandemic has just accelerated the pre-existing shifts to a more remote way of working, shopping and interacting as well as the de-carbonisation of the economy. Combined with no new credit boom, these ongoing trends will structurally weigh on the profits of old economy sectors, consumer prices, and bond yields. At the same time, these trends are a continuing structural tailwind for the profits in those sectors that facilitate the shift to a more digital and cleaner world. Our high-conviction recommendation is to stay structurally overweight growth sectors versus old economy sectors… …and to stay structurally overweight the US stock market versus the non-US stock market. Fractal analysis: PLN/USD, Hungary versus Emerging Markets, and sugar versus soybeans. Feature Chart of the WeekUS And Non-US Profits Go Their Starkly Separate Ways
US And Non-US Profits Go Their Starkly Separate Ways
US And Non-US Profits Go Their Starkly Separate Ways
Many people use the US stock market as a proxy for the world stock market. Intuitively, this makes sense, because the US stock market is the largest in the world, and the S&P 500 and Dow Jones Industrials are well-known indexes that we can monitor in real time. In contrast, world equity indexes such as the MSCI All Country World are less familiar and do not move in real time. Yet to use the US stock market as a proxy for the world stock market is a mistake. Although the US comprises makes up half of the world stock market capitalisation, the other half is so different – the non-US yan to the US yin – that the US cannot represent the world. As we will now illustrate. US Profits Have Doubled While Non-US Profits Have Shrunk Over the past ten years, US and non-US stock market profits have gone their starkly separate ways. While US profits have nearly doubled, non-US profits languish 10 percent below where they were in 2011! (Chart of the Week) While US profits have nearly doubled, non-US profits languish 10 percent below where they were in 2011. Of course, in any comparison of this sort, a key issue is the starting point. In this first part of our analysis, we are defining the starting point as the point at which profits had recouped all their global financial crisis losses. For both US and non-US profits this point was in March 2011 (Chart I-2 and Chart I-3). Chart I-2Comparing Profit Growth Since The Full Recovery From The Financial Crisis
Comparing Profit Growth Since The Full Recovery From The Financial Crisis
Comparing Profit Growth Since The Full Recovery From The Financial Crisis
Chart I-3Comparing Valuation Expansion Since The Full Recovery From The Financial Crisis
Comparing Valuation Expansion Since The Full Recovery From The Financial Crisis
Comparing Valuation Expansion Since The Full Recovery From The Financial Crisis
Because the issue of the starting point of the analysis is contentious, we will look at a much earlier starting point later in the report. But first, here are the decompositions of the US and non-US stock market moves from March 2011. US stock market profits are up 93 percent, while the multiple paid for those profits (valuation) is up 75 percent. Compounding to a total price gain of 235 percent (Chart I-4). Chart I-4US Profits Up 93 Percent, Valuation Up 75 Percent
US Profits Up 93 Percent, Valuation Up 75 Percent
US Profits Up 93 Percent, Valuation Up 75 Percent
Non-US stock market profits are down -9 percent, while the multiple paid for those profits is up 38 percent. Compounding to a total price gain of a measly 25 percent (Chart I-5). Chart I-5Non-US Profits Down -9 Percent, Valuation Up 38 Percent
Non-US Profits Down -9 Percent, Valuation Up 38 Percent
Non-US Profits Down -9 Percent, Valuation Up 38 Percent
The aggregate world stock market profits are up 24 percent, while the multiple paid for those profits is up 57 percent. Compounding to a total price gain of 94 percent (Chart I-6). Chart I-6World Profits Up 24 Percent, Valuation Up 57 Percent
World Profits Up 24 Percent, Valuation Up 57 Percent
World Profits Up 24 Percent, Valuation Up 57 Percent
The Post-Credit Boom Phase Favours The US Over The Non-US Stock Market In the post-credit boom phase, several important features of stock market performance are worth highlighting. In absolute terms, valuation expansion has lifted US stocks by twice as much as non-US stocks, 75 percent versus 38 percent. Yet even the 75 percent expansion in the US stock market valuation has played second fiddle to the 93 percent expansion in US stock market profits. Absent valuation expansion, non-US stocks would stand lower today than in 2011. But for non-US stocks, whose structural profit growth has been non-existent, valuation expansion has been the only instrument for structural gains. Indeed, absent valuation expansion, non-US stocks would stand lower today than in 2011. And absent valuation expansion at a world level, the world stock market would lose three quarters of its ten-year gain. What can explain the startling performance differential between US and non-US stocks on both profit and valuation expansions? As we have argued before, most of the difference does not come from the underlying (US versus non-US) economies, but instead comes from the company and sector compositions of the stock markets. The US stock market is heavily over-weighted to global growth companies and sectors – such as technology and healthcare (Chart I-7) – which, by definition, have experienced structural growth in their profits. In contrast, the non-US stock market is heavily over-weighted to global old economy companies and sectors – such as financials, energy, and resources (Chart I-8) – whose profits have stagnated, or entered structural downtrends (Chart I-9). Chart I-7The US Stock Market Is Heavily Over-Weighted To Growth Sectors
The US Stock Market Is Heavily Over-Weighted To Growth Sectors
The US Stock Market Is Heavily Over-Weighted To Growth Sectors
Chart I-8The Non-US Stock Market Is Heavily Over-Weighted To Old Economy Sectors
The Non-US Stock Market Is Heavily Over-Weighted To Old Economy Sectors
The Non-US Stock Market Is Heavily Over-Weighted To Old Economy Sectors
Chart I-9Old Economy Sector Profits Have Gone Nowhere
Old Economy Sector Profits Have Gone Nowhere
Old Economy Sector Profits Have Gone Nowhere
At the same time, when bond yields decline, companies whose profits are growing (and time-weighted into the distant future) see a greater increase in their net present values. Hence, companies in the global growth sectors have experienced a larger valuation expansion than those in the old economy sectors. In this way, the US stock market has outperformed the non-US stock market on both profit growth and valuation expansion. The key question is, will these post-credit boom trends continue? The answer depends on whether the post-pandemic world marks a new phase for investment, or whether it is just a continuation of the post-credit boom phase. The Post-Pandemic Phase Is A Continuation Of The Post-Credit Boom Phase Let’s now address the issue of the starting point of our analysis by panning out to 1990. This bigger picture from 1990 shows three distinct phases for investors (Chart I-10 and Chart I-11). Chart I-10Since 1990, There Have Been Three Distinct Investment Phases
Since 1990, There Have Been Three Distinct Investment Phases
Since 1990, There Have Been Three Distinct Investment Phases
Chart I-11The Post-Pandemic Investment Phase Is A Continuation Of The Post-Credit Boom Phase
The Post-Pandemic Investment Phase Is A Continuation Of The Post-Credit Boom Phase
The Post-Pandemic Investment Phase Is A Continuation Of The Post-Credit Boom Phase
The first phase was the 1990s build-up to the dot com boom. This phase clearly favoured growth sectors, and thereby the US stock market versus the non-US stock market. The second phase was the early 2000s credit boom. This phase clearly favoured sectors that facilitated the credit boom or benefited from its spending – notably, the old economy sectors of financials, energy, and resources. Thereby it favoured the non-US stock market versus the US stock market. The third and most recent phase is the post-credit boom phase. This phase has flipped the leadership back to growth sectors as the absence of structural credit growth has stifled financials as well as the capital-intensive old economy sectors that had previously benefited from the credit boom. Additionally, the structural disinflation that has comes from weak credit growth has dragged down bond yields and – as already discussed – given a much bigger boost to growth sector valuations. Since 1990, there have been three distinct phases for investors: the dot com boom; the credit boom; and the post-credit boom. Now we come to the key question. Did 2020 mark the end of the post-credit boom phase and the start of a new ‘post-pandemic’ phase? On the evidence so far, the answer is an emphatic no. Crucially, there is no new credit boom. A still highly indebted private sector is neither willing nor able to borrow. And although public sector debt surged during the pandemic, governments are now keen to temper or rein in deficits. In any case, Japan teaches us that government borrowing – which is bond rather than bank financed – does nothing for the banks or the broader financial sector. An equally important question is, has the pandemic reversed the societal and economic trends of the post-credit boom phase? The answer is no. Quite the contrary, the pandemic has accelerated the pre-existing shifts to a more remote way of working, shopping and interacting as well as the de-carbonisation of the economy. Combined with no new credit boom, these ongoing trends are structurally disinflationary for the profits of old economy sectors as well as for consumer prices. Thereby, they will continue to weigh on bond yields. At the same time, the trends are a continuing structural tailwind for the profits in those sectors that facilitate and enable the shift to a more digital and cleaner world. While we are open to the evolving evidence, the post-pandemic investment phase seems an extension of the post-credit boom phase. This means that structurally, there is no reason to flip out of growth sectors back to old economy sectors. It also means that structurally, there is no reason to switch from US to non-US stocks. Fractal Analysis Update This week’s fractal analysis highlights three potential countertrend moves based on fragile fractal structures. First, the recent rally in the US dollar could meet near-term resistance given its weakening 65-day fractal structure. A good way of playing this would be long PLN/USD (Chart I-12). Chart I-12PLN/USD Could Rebound
PLN/USD Could Rebound
PLN/USD Could Rebound
Second, the strong outperformance of Hungary versus Emerging Markets – largely driven by one stock, OTP Bank – has become a crowded trade based on its 130-day fractal structure. This would suggest underweighting Hungary versus the Emerging Markets index (Chart I-13). Chart I-13Underweight Hungary Versus EM
Underweight Hungary Versus EM
Underweight Hungary Versus EM
Finally, the sugar price has skyrocketed as extreme weather has disrupted output in the world’s top producer, Brazil. Given that supply bottlenecks ultimately ease, a recommended trade would be to short sugar versus soybeans, using ICE versus CBOT futures contracts (Chart I-14). Set the profit target and symmetrical stop-loss at 8 percent. Chart I-14Short Sugar Versus Soybeans
Short Sugar Versus Soybeans
Short Sugar Versus Soybeans
Dhaval Joshi Chief Strategist dhaval@bcaresearch.com Fractal Trading System Fractal Trades 6-Month Recommendations Structural Recommendations Closed Fractal Trades Closed Trades Asset Performance Equity Market Performance Indicators To Watch - Bond Yields Indicators To Watch - Bond Yields ##br##- Euro Area
Indicators To Watch - Bond Yields - Euro Area
Indicators To Watch - Bond Yields - Euro Area
Indicators To Watch - Bond Yields ##br##- Europe Ex Euro Area
Indicators To Watch - Bond Yields - Europe Ex Euro Area
Indicators To Watch - Bond Yields - Europe Ex Euro Area
Indicators To Watch - Bond Yields ##br##- Asia
Indicators To Watch - Bond Yields - Asia
Indicators To Watch - Bond Yields - Asia
Indicators To Watch - Bond Yields ##br##- Other Developed
Indicators To Watch - Bond Yields - Other Developed
Indicators To Watch - Bond Yields - Other Developed
Indicators To Watch - Interest Rate Expectations Indicators To Watch - Interest Rate Expectations
Indicators To Watch - Interest Rate Expectations
Indicators To Watch - Interest Rate Expectations
Indicators To Watch - Interest Rate Expectations
Indicators To Watch - Interest Rate Expectations
Indicators To Watch - Interest Rate Expectations
Indicators To Watch - Interest Rate Expectations
Indicators To Watch - Interest Rate Expectations
Indicators To Watch - Interest Rate Expectations
Indicators To Watch - Interest Rate Expectations
Indicators To Watch - Interest Rate Expectations
Indicators To Watch - Interest Rate Expectations
Highlights China’s new plan for “common prosperity” is a long-term strategic plan to bulk up the middle class that will strengthen China – if it is implemented successfully. The record on implementing reforms is mixed. Large budget deficits to provide subsidies for households and key industries are inevitable. But fiscal reforms will be more difficult. Implementation will proceed gradually and some provinces will move faster than others. Cyclically, the common prosperity plan will not be allowed to interfere with the post-pandemic economic recovery. Beijing will have to ease monetary and fiscal policy to secure the recovery. But large debt levels create a limit on the ability to push through key reforms. Macro policy easing is beneficial for the rest of the world but Chinese investors must deal with a rise in uncertainty and an anti-business turn in the policy environment. Beijing has centralized political power to move rapidly on reforms. However, centralization creates new structural problems while antagonizing foreign nations. Feature Chinese President Xi Jinping laid out a plan on August 18 for “common prosperity” in China that will help guide national policy over the coming decades. The plan seeks to reduce social and economic imbalances and hence strengthen China and reinforce the Communist Party’s rule. The plan confirms our top key view for the year – China’s confluence of internal and external risks – as well as our long-running theme that Chinese domestic political risk is greater than it looks because of underlying problems like inequality and weak governance. The market has woken up to these views and themes (Chart 1). Now Beijing is turning to address these problems, which is positive if it follows through. But investors will have to cope with new policies and laws that reverse the pro-business context of recent decades. In this report we review the new plan and its implications in the context of overall Chinese economic policy. The chief investment takeaway is that while China will push forward various reforms, Beijing cannot afford to self-inflict an economic collapse. Monetary and fiscal policy will ease over the coming 12 months. As such China policy tightening will not short-circuit the global recovery. However, Chinese corporate earnings and the renminbi will not benefit from the country’s anti-business turn. Chart 1Market Wakes Up To China's Political Risk
Market Wakes Up To China's Political Risk
Market Wakes Up To China's Political Risk
What Is In The Common Prosperity Plan? The first thing to understand about Beijing’s new plan for “common prosperity” is that it is aspirational: it contains few specific targets or concrete policies. It builds on existing policy goals set for 2049, the hundredth anniversary of the People’s Republic. Implementation will be gradual. The plan is consistent with the Xi administration’s previous emphasis on improving the country’s quality of life and tackling systemic risks. It takes aim at social immobility, income and wealth inequality, poor public services, a weak social safety net, and other problems that did not receive enough attention during China’s rapid growth phase over the past forty years. Left unattended, China’s socioeconomic imbalances could fester and eventually destabilize the regime. From the beginning, the Xi administration has tackled the most pressing popular concerns to try to rebuild the party’s legitimacy, increase public support, and avoid crises. Crackdowns on pollution and excessive debt are prime examples. China does indeed suffer from high income inequality and low social mobility, as we have highlighted in key reports. It is comparable to the United States as well as Italy, Argentina, and Chile, all of which have suffered from significant social and political upheaval in recent memory (Chart 2). By contrast, Japan, Germany, and Australia have been relatively politically stable. Chart 2China Risks Social Unrest Like The Americas
China Spreads The Wealth Around
China Spreads The Wealth Around
Table 1 summarizes the common prosperity plan. The key takeaways are the long 2049 deadline, the emphasis on “mixed ownership” in the corporate sphere (retaining a big role for state control and state-owned enterprises but attracting private capital), the redistribution of household income (reform the tax code), the establishment of property rights, the censorship of media/discourse, and the need to reduce rural disparity. The most important point of all is that Beijing intends to grow the size and wellbeing of the middle class – the foundation of a country’s strength. Table 1China’s “Common Prosperity” Plan For 2049
China Spreads The Wealth Around
China Spreads The Wealth Around
Coastal China today has reached Taiwanese and Korean levels of per capita income and has slightly exceeded their levels of wealth inequality (Chart 3). These countries witnessed social unrest and regime change in the 1980s due to such problems. The urban-rural gap is even more problematic in China due to its large rural population and territory. The Chinese public is expected to become more demanding as it evolves. Hence Beijing is pledging to redistribute wealth, grow the middle class, speed up income growth among the poorest, reduce rural disparities, expand access to elderly care, medicine, and housing, and establish a better legal framework for business. These goals are positive in principle, especially for household sentiment, social stability, and political support for the administration. But they also entail a higher tax/wage/regulation environment for business and corporate earnings. The question for investors centers on implementation. Chart 3China's Wealth Disparities Outstrip Comparable Neighbors
China's Wealth Disparities Outstrip Comparable Neighbors
China's Wealth Disparities Outstrip Comparable Neighbors
What About Vested Interests? Table 1 above shows that the super-committee that issued the common prosperity plan also addressed China’s ongoing battle against financial risk. The financial policy statement was neither new nor surprising but it highlights something important: “preventing risks” will have to be balanced with “ensuring stable growth.” This balancing of reform and growth is essential to Chinese government and will guide the implementation of the common prosperity plan just as it has guided President Xi’s crackdown on shadow banking. This is an especially pertinent point today, as Beijing runs the risk of overtightening monetary, fiscal, and regulatory policies. While Beijing’s vision of a better regulated, more heavily taxed, and higher-wage society should not be underrated, reform initiatives will be delayed if they threaten to derail the post-pandemic recovery. Time and again the Xi administration has ruled against a rapid, resolute, and disruptive approach to reform, such as the “assault phase of reform” spearheaded by Premier Zhu Rongji in the late 1990s. In the plan’s own words: “achieving common prosperity will be a long-term, arduous, and complicated task and it should be achieved in a gradual and progressive manner.” Having said that, the pattern of reform has been a vigorous launch, a market riot, and then backtracking or delay. This means markets face more volatility first before things settle down. An initial volley of policy actions should be expected between now and spring of 2023, when the National People’s Congress solidifies the plans of the twentieth National Party Congress in fall 2022. As with the ongoing regulatory crackdown on Big Tech, the market may experience a technical rebound but the political assessment suggests government pressure will be sustained for at least the next 12 months. We do not recommend bottom feeding in Chinese equities. Will the reforms be effective over time? When the Xi administration took power in 2012-13, it issued a visionary policy document calling for wide-ranging reforms to China’s economy (“Decision on Several Major Questions About Deepening Reform”).1 Over the past decade these reforms have had mixed success. Rhodium Group maintains a reform tracker to monitor progress – the results are lackluster (Table 2). Some core principles, such as the claim that China would make market forces “decisive” in allocating resources, have been totally reversed. Table 2China’s Progress On Reforms Over Past Decade
China Spreads The Wealth Around
China Spreads The Wealth Around
While China’s government model is absolutist, there are still social and economic limits on what the government can achieve. Beijing cannot raise a nationwide property tax, estate tax, and capital gains tax overnight just to reduce inequality. In fact, the long saga of the property tax tells a very different story. Beijing is limited in how it can tax the bubbling property sector because Chinese households store their wealth in houses and because any sustained price deflation would lead to a national debt crisis. Officials have pledged to advance a nationwide property tax in the past three five-year plans with little progress. A serious effort to impose the tax in 2014 was only implemented in two provinces, notably Shanghai’s tax on second or third homes owned by the same household.2 The common prosperity plan entails that the government will revive the property tax but the rollout will still be gradual and step-by-step reform. The tax will focus on major urban areas, not minor ones where population decline could weigh on prices. The government work report in early 2023 will be a key watchpoint for where and when the property tax will be levied but there can be little doubt that it will gradually be levied for top-tier cities. Other aspects of the common prosperity plan will be implemented with provincial trial runs. It all begins with a “demonstration zone,” namely Zhejiang province, a wealthy coastal state where President Xi Jinping once served as party secretary and first army secretary. Zhejiang is expected to make some progress by 2025 and achieve most the goals by 2035 (in keeping with Xi’s 2035 strategic vision). The Zhejiang plan includes concrete numerical targets and as such sheds light on the broader national plan and how other provinces will implement it. The most important target is the desire to have 80% of the population earn an annual disposable income of CNY 100,000-500,000 ($15,400-77,000). The labor share of output should be greater than 50%, compared to a national average of 35%-40%. The urbanization rate should hit 75%, up from 72%. Urban incomes should be capped at just short of twice that of rural income. Enrollment rates in higher education will go up, life expectancy should reach above 80 years, pollution should be further controlled, and the unemployment rate should stay below 5.5%. A host of other goals, ranging from technology to fertility and the social safety net, are shown in Table 3. Table 3China: Zhejiang Province As Bellwether For “Common Prosperity” Plan
China Spreads The Wealth Around
China Spreads The Wealth Around
Some of the plan’s intentions will be undermined by Chinese governance. It is difficult to improve social fairness and property rights in the context of autocracy because the central and local governments create distortions and cannot be held to account for their own mistakes and abuses. The immediate political context of the common prosperity plan should not be missed: the president is outlining a bright future to justify the fact that he will not step down from power as earlier term limits required in fall 2022. The president’s 2035 vision implies an important strategic window in which to accomplish ambitious goals but the lack of checks and balances suggests that the next 14 years could be very similar to the last 10 years, in which arbitrary and absolutist decisions govern policy. The problem is highlighted by China’s recent 10-point plan on government under rule of law, which is undercut by the arbitrary actions of regulators in the tech crackdown (see Appendix). In other words, while social stability may improve in many ways, the shift away from consensus rule, toward rule of a single person, will increase policy uncertainty and create new governance problems at the same time that could produce greater instability over the long run. Having said all that, it is essential to acknowledge that a comprehensive plan to grow the middle class and expand the social safety net could be very positive for China if implemented. A Global Social Justice Race? If investors are thinking that the Xi administration’s calls for “social fairness and justice” and big new investments in “elderly care, medical security, and housing supply” resemble those of US President Joe Biden in his American Families Plan, then they are right. But while the US is already at historic levels of social division after failing to deal with inequality, China is attempting to learn from the US’s problems and rebalance society before polarization, factionalization, and social unrest occur. The Communist Party tends to take major action in response to American crises. Beijing’s crackdown on extremism and domestic terrorism in the early 2000s followed from the September 11 attacks. Its crackdown on local government debt and shadow banking stemmed from the 2008 financial crisis. And its crackdown on Big Tech, social media, and inequality today responds to the rise of populism in the US and Europe. The fact that deindustrialization has led to political crises in the developed world, and that social media companies can both exacerbate social unrest and silence a sitting president, is not lost on the Chinese administration. Unfortunately, China’s approach will probably escalate conflict with the West. First, Beijing is coupling its new social agenda with an aggressive campaign of military modernization and technological acquisition. It is doubling down on advanced manufacturing as its future economic model. The liberal democracies will not only be forced to defend their own political systems and governance models but will also be pressured into more hawkish stances on foreign, trade, and defense policy toward China. So far China is still attractive to foreign investors but the combination of socialist policy, import substitution, and foreign protectionism should put a cap on investment flows over time (Chart 4). What is the net effect of social largesse at home and great power competition abroad? Larger budget deficits. Fiscal expansionism is the key mechanism for the US and China to reboot their economies, reduce social pressures, secure supply chains, and compete with other each other. And expansionary fiscal policies will boost inflation expectations on the margin. One thing is clear: China’s regime will be imperiled if instead of common prosperity and “national rejuvenation” it gets economic collapse. Beijing is already seeing capital outflows reminiscent of the crisis period in 2014-15 when aggressive reforms triggered a collapse in risk appetite and a stock market crash (Chart 5). The implication is that monetary and fiscal easing will accompany the reform agenda. Chart 4China's New Policies Will Deter Foreign Investment
China's New Policies Will Deter Foreign Investment
China's New Policies Will Deter Foreign Investment
Chart 5Capital Flight And Capital Controls A Risk If Implementation Aggressive
Capital Flight And Capital Controls A Risk If Implementation Aggressive
Capital Flight And Capital Controls A Risk If Implementation Aggressive
That would be marginally positive for global growth and EM countries that export to China. Investors in China, however, will have to deal with greater policy uncertainty as China attempts to redistribute wealth while waging a cold war abroad. Investment Takeaways None of Beijing’s social goals can be met if overall growth and job creation slow too much. Reforms are constantly subject to the ultimate constraint of maintaining overall stability. Already in 2021 Beijing is verging on excessive monetary and fiscal policy tightening (Chart 6). The Politburo signaled in July that it would take its foot off the brakes but policy uncertainty is still wreaking havoc in the equity market and overall animal spirits are downbeat. We expect policy to ease over the coming year to ensure stability ahead of the twentieth national party congress. This would be marginally good news for global growth, contingent on the effects of the global pandemic. Of course we cannot deny that more bad news for global risk assets may be necessary in the very near term to prompt the policy easing that we expect. Policymakers will backtrack on various policies when the market revolts or when the risk of debt-deflation rears its ugly head. Corporate and even household debt have expanded so much in recent years that Chinese policymakers have their hands tied when they try to push reforms too aggressively (Chart 7). A Japanese-style combination of a shrinking and graying population could create a feedback loop with debt deleveraging in the event of a sharp drop in asset prices. On the whole we maintain a pessimistic outlook on Chinese currency and assets. Chart 6China Runs Risk Of Overtightening Policy
China Runs Risk Of Overtightening Policy
China Runs Risk Of Overtightening Policy
Chart 7Debt Trap Must Be Avoided - Monetary/ Fiscal Policy Will Stay Accommodative
Debt Trap Must Be Avoided - Monetary/ Fiscal Policy Will Stay Accommodative
Debt Trap Must Be Avoided - Monetary/ Fiscal Policy Will Stay Accommodative
Matt Gertken Vice President Geopolitical Strategist mattg@bcaresearch.com Appendix Table A1China: 10-Point Guidelines On Government Under Rule Of Law (2021-25)
China Spreads The Wealth Around
China Spreads The Wealth Around
Footnotes 1 See Arthur R. Kroeber, “Xi Jinping’s Ambitious Agenda for Economic Reform in China,” Brookings, November 17, 2013, brookings.edu. 2 Chongqing’s property tax only affects luxury houses. Shenzhen and Hainan are the next pilot projects.
Highlights China’s July Politburo meeting signaled that policy is unlikely to be overtightened. The Biden administration is likely to pass a bipartisan infrastructure deal – as well as a large spending bill by Christmas. Geopolitical risk in the Middle East will rise as Iran’s new hawkish president stakes out an aggressive position. US-Iran talks just got longer and more complicated. Europe’s relatively low political risk is still a boon for regional assets. However, Russia could still deal negative surprises given its restive domestic politics. Japan will see a rise in political turmoil after the Olympic games but national policy is firmly set on the path that Shinzo Abe blazed. Stay long yen as a tactical hedge. Feature Chart 1Rising Hospitalizations Cause Near-Term Jitters, But UK Rolling Over?
China’s Khodorkovsky Moment? And Other Questions From Clients
China’s Khodorkovsky Moment? And Other Questions From Clients
Our key view of 2021, that China would verge on overtightening policy but would retreat from such a mistake to preserve its economic recovery, looks to be confirmed after the Politburo’s July meeting opened the way for easier policy in the coming months. Meanwhile the Biden administration is likely to secure a bipartisan infrastructure package and push through a large expansion of the social safety net, further securing the American recovery. Growth and stimulus have peaked in both the US and China but these government actions should keep growth supported at a reasonable level and dispel disinflationary fears. This backdrop should support our pro-cyclical, reflationary trade recommendations in the second half of the year. Jitters continue over COVID-19 variants but new cases have tentatively peaked in the UK, US vaccinations are picking up, and death rates are a lot lower now than they were last year, that is, prior to widescale vaccination (Chart 1). This week we are taking a pause to address some of the very good client questions we have received in recent weeks, ranging from our key views of the year to our outstanding investment recommendations. We hope you find the answers insightful. Will Biden’s Infrastructure Bill Disappoint? Ten Republicans are now slated to join 50 Democrats in the Senate to pass a $1 trillion infrastructure bill that consists of $550 billion in new spending over a ten-year period (Table 1). The deal is not certain to pass and it is ostensibly smaller than Biden’s proposal. But Democrats still have the ability to pass a mammoth spending bill this fall. So the bipartisan bill should not be seen as a disappointment with regard to US fiscal policy or projections. The Republicans appear to have the votes for this bipartisan deal. Traditional infrastructure – including broadband internet – has large popular support, especially when not coupled with tax hikes, as is the case here. Both Biden and Trump ran on a ticket of big infra spending. However, political polarization is still at historic peaks so it is possible the deal could collapse despite the strong signs in the media that it will pass. Going forward, the sense of crisis will dissipate and Republicans will take a more oppositional stance. The Democratic Congress will pass President Joe Biden’s signature reconciliation bill this fall, another dollop of massive spending, without a single Republican vote (Chart 2). After that, fiscal policy will probably be frozen in place through at least 2025. Campaigning will begin for the 2022 midterm elections, which makes major new legislation unlikely in 2022, and congressional gridlock is the likely result of the midterm. Republicans will revert to belt tightening until they gain full control of government or a new global crisis erupts. Table 1Bipartisan Infrastructure Bill Likely To Pass
China’s Khodorkovsky Moment? And Other Questions From Clients
China’s Khodorkovsky Moment? And Other Questions From Clients
Chart 2Reconciliation Bill Also Likely To Pass
China’s Khodorkovsky Moment? And Other Questions From Clients
China’s Khodorkovsky Moment? And Other Questions From Clients
Chart 3Biden Cannot Spare A Single Vote In Senate
China’s Khodorkovsky Moment? And Other Questions From Clients
China’s Khodorkovsky Moment? And Other Questions From Clients
Hence the legislative battle over the reconciliation bill this fall will be the biggest domestic battle of the Biden presidency. The 2021 budget reconciliation bill, based on a $3.5 trillion budget resolution agreed by Democrats in July, will incorporate parts of the American Jobs Plan that did not pass via bipartisan vote (such as $436 billion in green energy subsidies), plus a large expansion of social welfare, the American Families Plan. This bill will likely pass by Christmas but Democrats have only a one-seat margin in the Senate, which means our conviction level must be medium, or subjectively about 65%. The process will be rocky and uncertain (Chart 3). Moderate Democratic senators will ultimately vote with their party because if they do not they will effectively sink the Biden presidency and fan the flames of populist rebellion. US budget deficit projections in Chart 4 show the current status quo, plus scenarios in which we add the bipartisan infra deal, the reconciliation bill, and the reconciliation bill sans tax hikes. The only significant surprise would be if the reconciliation bill passed shorn of tax hikes, which would reduce the fiscal drag by 1% of GDP next year and in coming years. Chart 4APassing Both A Bipartisan Infrastructure Bill And A Reconciliation Bill Cannot Avoid Fiscal Cliff In 2022 …
China’s Khodorkovsky Moment? And Other Questions From Clients
China’s Khodorkovsky Moment? And Other Questions From Clients
Chart 4B… The Only Major Fiscal Surprise Would Come If Tax Hikes Were Excluded From This Fall’s Reconciliation Bill
China’s Khodorkovsky Moment? And Other Questions From Clients
China’s Khodorkovsky Moment? And Other Questions From Clients
Chart 5Biden Stimulus Overshadowed By China Policy Tightening ... But China Is Now Marginally Easing
Biden Stimulus Overshadowed By China Policy Tightening ... But China Is Now Marginally Easing
Biden Stimulus Overshadowed By China Policy Tightening ... But China Is Now Marginally Easing
There are two implications. First, government support for the economy has taken a significant step up as a result of the pandemic and election in 2020. There is no fiscal austerity, unlike in 2011-16. Second, a fiscal cliff looms in 2022 regardless of whether Biden’s reconciliation bill passes, although the private economy should continue to recover on the back of vaccines and strong consumer sentiment. This is a temporary problem given the first point. Monetary policy has a better chance of normalizing at some point if fiscal policy delivers as expected. But the Federal Reserve will still be exceedingly careful about resuming rate hikes. President Biden could well announce that he will replace Chairman Powell in the coming months, delivering a marginally dovish surprise (otherwise Biden runs the risk that Powell will be too hawkish in 2022-23). Inflation will abate in the short run but remain a risk over the long run. Essentially the outlook for US equities is still positive for H2 but clouds are forming on the horizon due to peak fiscal stimulus, tax hikes in the reconciliation bill, eventual Fed rate hikes (conceivably 2022, likely 2023), and the fact that US and Chinese growth has peaked while global growth is soon to peak as well. All of these factors point toward a transition phase in global financial markets until economies find stable growth in the post-pandemic, post-stimulus era. Investors will buy the rumor and sell the news of Biden’s multi-trillion reconciliation bill in H2. The bill is largely priced out at the moment due to China’s policy tightening (Chart 5). The next section of this report suggests that China’s policy will ease on the margin over the coming 12 months. Bottom Line: US fiscal policy is delivering, not disappointing. Congress is likely to pass a large reconciliation bill by Christmas, despite no buffer in the Senate, because Democratic Senators know that the Biden presidency hangs in the balance. China’s Khodorkovsky Moment? Many clients have asked whether China’s crackdown on private business, from tech to education, is the country’s “Khodorkovsky moment,” i.e. the point at which Beijing converts into a full, autocratic regime where private enterprise is permanently impaired because it is subject to arbitrary seizure and control of the state. The answer is yes, with caveats. Yes, China’s government is taking a more aggressive, nationalist, and illiberal stance that will permanently impair private business and investor sentiment. But no, this process did not begin overnight and will not proceed in a straight line. There is a cyclical aspect that different investors will have to approach differently. First a reminder of the original Khodorkovsky moment. After the Soviet Union’s collapse, extremely wealthy oligarchs emerged who benefited from the privatization of state assets. When President Putin began to reassert the primacy of the state, he arbitrarily imprisoned Khodorkovsky and dismantled his corporate energy empire, Yukos, giving the spoils to state-owned companies. Russia is a petro state so Putin’s control of the energy sector would be critical for government revenues and strategic resurgence, especially at the dawn of a commodity boom. Both the RUB-USD and Russian equity relative performance performed mostly in line with global crude oil prices, as befits Russia’s economy, even though there was a powerful (geo)political risk premium injected during these two decades due to Russia’s centralization of power and clash with the West (Chart 6). Investors could tactically play the rallies after Khodorkovsky but the general trend depended on the commodity cycle and the secular rise of geopolitical risk. Chart 6Russia's 'Khodorkovsky Moment' Was A Geopolitical Turning Point...But Russian Assets Benefited From Oil Bull Market For A While Longer
Russia's 'Khodorkovsky Moment' Was A Geopolitical Turning Point...But Russian Assets Benefited From Oil Bull Market For A While Longer
Russia's 'Khodorkovsky Moment' Was A Geopolitical Turning Point...But Russian Assets Benefited From Oil Bull Market For A While Longer
President Xi Jinping is a strongman and hardliner, like Putin, but his mission is to prevent Communist China from collapsing like the Soviet Union, rather than to revive it from its ashes. To that end he must reassert the state while trying to sustain the country’s current high level of economic competitiveness. Since China is a complex economy, not a petro state, this requires the state-backed pursuit of science, technology, competitiveness, and productivity to avoid collapse. Therefore Beijing wants to control but not smother the tech companies. Hence there is a cyclical factor to China’s regulatory crackdown. A crackdown on President Xi Jinping’s potential rivals or powerful figures was always very likely to occur ahead of the Communist Party’s five-year personnel reshuffle in 2022, as we argued prior to tech exec Jack Ma’s disappearance. Sackings of high-level figures have happened around every five-year leadership rotation. Similarly a crackdown on the media was expected. True, the pre-party congress crackdowns are different this time around as they are targeted at the private sector, innovative businesses, tech, and social media. Nevertheless, as in the past, a policy easing phase will follow the tightening phase so as to preserve the economy and the mobilization of private capital for strategic purposes. The critical cyclical factor for global investors is China’s monetary and credit impulse. For example, the crackdown on the financial sector ahead of the national party congress in 2017 caused a global manufacturing slowdown because it tightened credit for the entire Chinese economy, reducing imports from abroad. One reason Chinese markets sold off so heavily this spring and summer, was that macroeconomic indicators began decelerating, leaving nothing for investors to sink their teeth into except communism. The latest Politburo meeting suggests that monetary, fiscal, and regulatory policy is likely to get easier, or at least stay just as easy, going forward (Table 2). Once again, the month of July has proved an inflection point in central economic policy. Financial markets can now look forward to a cyclical easing in regulation combined with easing in monetary and fiscal policy over the next 12-24 months. Table 2China’s Politburo Prepares To Ease Policy, Secure Recovery
China’s Khodorkovsky Moment? And Other Questions From Clients
China’s Khodorkovsky Moment? And Other Questions From Clients
Despite all of the above, for global investors with a lengthy time horizon, the government’s crackdown points to a secular rise of Communist and Big Government interventionism into the economy, with negative ramifications for China’s private sector, economic freedoms, and attractiveness as a destination for foreign investment. The arbitrary and absolutist nature of its advances will be anathema to long-term global capital. Also, social media, unlike other tech firms, pose potential sociopolitical risks and may not boost productivity much, whereas the government wants to promote new manufacturing, materials, energy, electric vehicles, medicine, and other tradable goods. So while Beijing cannot afford to crush the tech sector, it can afford to crush some social media firms. Chart 7China's Crackdown On Private Sector Reinforces Past Decade's Turn Away From Liberal Reform
China's Crackdown On Private Sector Reinforces Past Decade's Turn Away From Liberal Reform
China's Crackdown On Private Sector Reinforces Past Decade's Turn Away From Liberal Reform
China’s equity market profile looks conspicuously like Russia’s at the time of Khodorkovsky’s arrest (Chart 7). Chinese renminbi has underperformed the dollar on a multi-year basis since Xi Jinping’s rise to power, in line with falling export prices and slowing economic growth, as a result of economic structural change and the administration’s rolling back Deng Xiaoping’s liberal reform era. We expect a cyclical rebound to occur but we do not recommend playing it. Instead we recommend other cyclical plays as China eases policy, particularly in European equities and US-linked emerging markets like Mexico. Bottom Line: The twentieth national party congress in 2022 is a critical political event that is motivating a cyclical crackdown on potential rivals to Communist Party power. Chinese equities will temporarily bounce back, especially with a better prospect for monetary and fiscal easing. But over the long run global investors should stay focused on the secular decline of China’s economic freedoms and hence productivity. What Happened To The US-Iran Deal? Our second key view for 2021 was the US strategic rotation from the Middle East and South Asia to Asia Pacific. This rotation is visible in the Biden administration’s attempt to withdraw from Iraq and Afghanistan while rejoining the 2015 nuclear deal with Iran. However, Biden here faces challenges that will become very high profile in the coming months. The Biden administration failed to rejoin the 2015 deal under the outgoing leadership of the reformist President Hassan Rouhani. This means a new and much more difficult negotiation process will now begin that could last through Biden’s term or beyond. On August 5, President Ebrahim Raisi will take office with an aggressive flourish. The US is already blaming Iran for an act of sabotage in the Persian Gulf that killed one Romanian and one Briton. Raisi will need to establish that he is not a toady, will not cower before the West. The new Israeli government of Prime Minister Naftali Bennett also needs to demonstrate that despite the fall of his hawkish predecessor Benjamin Netanyahu, Jerusalem is willing and able to uphold Israel’s red lines against Iranian nuclear weaponization and regional terrorism. Hence both Iran and its regional rivals, including Saudi Arabia, will rattle sabers and underscore their red lines. The Persian Gulf and Strait of Hormuz will be subject to threats and attacks in the coming months that could escalate dramatically, posing a risk of oil supply disruptions. Given that the Iranians ultimately do want a deal with the Americans, the pressure should be low-to-medium level and persistent, hence inflationary, as opposed to say a lengthy shutdown of the Strait of Hormuz that would cause a giant spike in prices that ultimately kills global demand. Short term, the US attempt to reduce its commitments in Iraq and Afghanistan will invite US enemies to harass or embarrass the Biden administration. The Taliban is likely to retake control of Afghanistan. The US exit will resemble Saigon in 1975. This will be a black eye for the Biden administration. But public opinion and US grand strategy will urge Biden to be rid of the war. So any delays, or a decision to retain low-key sustained troop presence, will not change the big picture of US withdrawal. Long term, Biden needs to pivot to Asia, while President Raisi is ultimately subject to the Supreme Leader Ali Khamenei, who wants to secure Iran’s domestic stability and his own eventual leadership succession. Rejoining the 2015 nuclear deal leads to sanctions relief, without requiring total abandonment of a nuclear program that could someday be weaponized, so Iran will ultimately agree. The problem will then become the regional rise of Iranian power and the balancing act that the US will have to maintain with its allies to keep Iran contained. Bottom Line: The risk to oil prices lies to the upside until a US-Iran deal comes together. The US and Iran still have a shared interest in rejoining the 2015 deal but the time frame is now delayed for months if not years. We still expect a US-Iran deal eventually but previously we had anticipated a rapid deal that would put downward pressure on oil prices in the second half of the year. What Comes After Biden’s White Flag On Nord Stream II? Our third key view for 2021 highlighted Europe’s positive geopolitical and macro backdrop. This view is correct so far, especially given that China’s policymakers are now more likely to ease policy going forward. But Russia could still upset the view. Italy has been the weak link in European integration over the past decade (excluding the UK). So the national unity coalition that has taken shape under Prime Minister Mario Draghi exemplifies the way in which political risks were overrated. Italy is now the government that has benefited the most from the overall COVID crisis in public opinion (Chart 8). The same chart shows that the German government also improved its public standing, although mostly because outgoing Chancellor Angela Merkel is exiting on a high note. Her Christian Democrat-led coalition has not seen a comparable increase in support. The Greens should outperform their opinion polling in the federal election on September 26. But the same polling suggests that the Greens will be constrained within a ruling coalition (Chart 9). The result will be larger spending without the ability to raise taxes substantially. Markets will cheer a fiscally dovish and pro-European ruling coalition. Chart 8European Political Risk Limited, But Rising, Post-COVID
China’s Khodorkovsky Moment? And Other Questions From Clients
China’s Khodorkovsky Moment? And Other Questions From Clients
The chief risk to this view of low EU political risk comes from Russia. Russia is a state in long-term decline due to the remorseless fall in fertility and productivity. The result has been foreign policy aggression as President Putin attempts to fortify the country’s strategic position and frontiers ahead of an even bleaker future. Chart 9German Election Polls Point To Gridlock?
German Election Polls Point To Gridlock?
German Election Polls Point To Gridlock?
Now domestic political unrest has grown after a decade of policy austerity and the COVID-19 pandemic. Elections for the Duma will be held on September 19 and will serve as the proximate cause for Russia’s next round of unrest and police repression. Foreign aggressiveness may be used to distract the population from the pandemic and poor economy. We have argued that there would not be a diplomatic reset for the US and Russia on par with the reset of 2009-11. We stand by this view but so far it is facing challenges. Putin did not re-invade Ukraine this spring and Biden did not impose tough sanctions canceling the construction of the Nord Stream II gas pipeline to Germany. Russia is tentatively cooperating on the US’s talks with Iran and withdrawal from Afghanistan. The US gave Germany and Russia a free point by condoning the NordStream II. Now the US will expect Germany to take a tough diplomatic line on Russian and Chinese aggression, while expecting Russia to give the US some goodwill in return. They may not deliver. The makeup of the new German coalition will have some impact on its foreign policy trajectory in the coming years. But the last thing that any German government wants is to be thrust into a new cold war that divides the country down the middle. Exports make up 36% of German output, and exports to the Russian and Chinese spheres account for a substantial share of total exports (Chart 10). The US administration prioritizes multilateralism above transactional benefits so the Germans will not suffer any blowback from the Americans for remaining engaged with Russia and China, at least not anytime soon. Russia, on the other hand, may feel a need to seize the moment and make strategic gains in its region, despite Biden’s diplomatic overtures. If the US wraps up its forever wars, Russia’s window of opportunity closes. So Russia may be forced to act sooner rather than later, whether in suppressing domestic dissent, intimidating or attacking its neighbors, or hacking into US digital networks. In the aftermath of the German and Russian elections, we will reassess the risk from Russia. But our strong conviction is that neither Russian nor American strategy have changed and therefore new conflicts are looming. Therefore we prefer developed market European equities and we do not recommend investors take part in the Russian equity rally. Chart 10Germany Opposes New Cold War With Russia Or China
China’s Khodorkovsky Moment? And Other Questions From Clients
China’s Khodorkovsky Moment? And Other Questions From Clients
Bottom Line: German and European equities should benefit from global vaccination, Biden’s fiscal and foreign policies, and China’s marginal policy easing (Chart 11). Eastern European emerging markets and Russian assets are riskier than they appear because of latent geopolitical tensions that could explode around the time of important elections in September. Chart 11Geopolitical Tailwinds To European Equities
Geopolitical Tailwinds To European Equities
Geopolitical Tailwinds To European Equities
What Comes After The Olympics In Japan? Japan is returning to an era of “revolving door” prime ministers. Prime Minister Yoshihide Suga’s sole purpose was to tie up the loose ends of the Shinzo Abe administration, namely by overseeing the Olympics. After the games end, he will struggle to retain leadership of the Liberal Democratic Party. He will be blamed for spread of Delta variant even if the Olympics were not a major factor. If he somehow retains the party’s helm, the October general election will still be an underwhelming performance by the Liberal Democrats, which will sow the seeds of his downfall within a short time (Chart 12). Suga will need to launch a new fiscal spending package, possibly as an election gimmick, and his party has the strength in the Diet to push it through quickly, which will be favorable for the economy. For the elections the problem is not the Liberal Democrats’ popularity, which is still leagues above the nearest competitor, but rather low enthusiasm and backlash over COVID. Abe’s retirement, and the eventual fall of Abe’s hand-picked deputy, does not entail the loss of Abenomics. The Bank of Japan will retain its ultra-dovish cast at least until Haruhiko Kuroda steps down in 2023. The changes that occurred in Japan from 2008-12 exemplified Japan’s existence as an “earthquake society” that undergoes drastic national changes suddenly and rapidly. The paradigm shift will not be reversed. The drivers were the Great Recession, the LDP’s brief stint in the political wilderness, the Tohoku earthquake and Fukushima nuclear crisis, and the rise of China. The BoJ became ultra-dovish and unorthodox, the LDP became more proactive both at home and abroad. The deflationary economic backdrop and Chinese nationalism are still a powerful impetus for these trends to continue – as highlighted by increasingly alarming rhetoric by Japanese officials, including now Shinzo Abe himself, regarding the Chinese military threat to Taiwan. In other words, Suga’s lack of leadership will not stand even if he somehow stays prime minister into 2022. The Liberal Democrats have several potential leaders waiting in the wings and one of these will emerge, whether Yuriko Koike, Shigeru Ishiba, or Shinjiro Koizumi, or someone else. The popular and geopolitical pressures will force the Liberal Democrats and various institutions to continue providing accommodation to the economy and bulking up the nation’s defenses. This will require the BoJ to stay easier for longer and possibly to roll out new unorthodox policies, as with yield curve control in the 2010s. Japan has some of the highest real rates in the G10 as a result of very low inflation expectations and a deeply negative output gap (Chart 13). Abenomics was bearing fruit, prior to COVID-19, so it will be justified to stay the course given that deflation has reemerged as a threat once again. Chart 12Japan: Back To Revolving Door Of Prime Ministers
China’s Khodorkovsky Moment? And Other Questions From Clients
China’s Khodorkovsky Moment? And Other Questions From Clients
Chart 13Japan To Keep Fighting Deflation Post-Abe
Japan To Keep Fighting Deflation Post-Abe
Japan To Keep Fighting Deflation Post-Abe
Bottom Line: The political and geopolitical backdrop for Japan is clear. The government and BoJ will have to do whatever it takes to stay the course on Abenomics even in the wake of Abe and Suga. Prime ministers will come and go in rapid succession, like in past eras of political turmoil, but the trajectory of national policy is set. We would favor JGBs relative to more high-beta government bonds like American and Canadian. Given deflation, looming Japanese political turmoil, and the secular rise in geopolitical risk, we continue to recommend holding the yen. These views conform with those of BCA’s fixed income and forex strategists. Investment Takeaways China’s policymakers are backing away from the risk of overtightening policy this year. Policy should ease on the margin going forward. Our number one key forecast for 2021 is tentatively confirmed. Base metals are still overextended but global reflation trades should be able to grind higher. The US fiscal spending orgy will continue through the end of the year via Biden’s reconciliation bill, which we expect to pass. Proactive DM fiscal policy will continue to dispel disinflationary fears. Sparks will fly in the Middle East. The US-Iran negotiations will now be long and drawn out with occasional shows of force that highlight the tail risk of war. We expect geopolitics to add a risk premium to oil prices at least until the two countries can rejoin the 2015 nuclear deal. Germany’s Green Party will surprise to the upside in elections, highlighting Europe’s low level of geopolitical risk. China policy easing is positive for European assets. Russia’s outward aggressiveness is the key risk. Matt Gertken Vice President Geopolitical Strategy mattg@bcaresearch.com
Highlights The dollar smile theory was valid around the COVID-19 crisis but does not stand the test of time. A more useful framework for determining the long-term trend in the dollar is observing global business cycle dynamics. The 2000s experience could provide a useful roadmap for the dollar this coming decade. We remain dollar bears over a 9-to-12-month horizon, although the dollar could stage a short-lived rally in the interim. Feature The “dollar smile” theory1 is the premise that the dollar tends to rise when the US economy is either too strong or too weak. Only in the precise environment, when the US economy is neither too hot nor too cold would you experience a dollar decline (Chart I-1). Chart I-1The Dollar Smile Theory
The Dollar Smile Theory
The Dollar Smile Theory
This theory particularly resonates with traders and financial speculators as each handle of the smile can be explained by economic theory. For example, when the US economy is running hot, this usually prompts the Federal Reserve to hike interest rates. This supports the dollar. When the US economy is entering a recession, this is generally accompanied by a flight to safety. Inflows into safe-haven US bonds and defensive sectors of the stock market would also tend to boost the dollar. The fact that the dollar can rise in these polarizing set of circumstances makes a long dollar view particularly attractive as the default position. The key questions therefore for investors are: First, how does this theory hold up in terms of evidence? and, second, how should FX portfolios be positioned in the current environment? The Evidence During the height of the COVID-19 crisis, the smile theory certainly proved correct. Chart I-2 shows that the DXY index tended to rise approximately 58% of the time when the S&P 500 was either up by 2% or down by 2%. However, when the sample size is broadened, even to a few years, the theory falls apart. From 2010-2020, the DXY index rose only 37% of the time when the S&P 500 was up 2%, while it rose almost 50% of the time when the S&P 500 was down 2% (Chart I-3). Meanwhile, this sample size is particularly biased since during that period, the dollar was in a bull market, and the US economy was quite strong. Chart I-2The Dollar Smile Around The 2020 Pandemic
The Dollar Smile Theory
The Dollar Smile Theory
Chart I-3The Dollar Smile Around Full Business Cycles
The Dollar Smile Theory
The Dollar Smile Theory
Chart I-4US Industrial Production And The Dollar: No Correlation
The Dollar Smile Theory
The Dollar Smile Theory
In economic terms, we get a similar picture. The relationship between US industrial production and the greenback is weak at best, with little evidence of a smile (Chart I-4). For example, there was no discernable trend in the dollar when US industrial production was between 0-5%, or even 5-10%. Admittedly, the dollar does rise when US manufacturing is in recession. A More Useful Framework Chart I-5US Relative Growth And The Dollar: Linear Correlation
The Dollar Smile Theory
The Dollar Smile Theory
While the dollar is a complex variable, explaining its longer-term trend boils down to two simple rules of thumb: Is the global economy recovering or contracting? And if so, is the US leading or lagging this recovery? Chart I-5 shows that the dollar tends to rise when US economic activity is picking up relative to the world, but tends to fall otherwise, albeit with a few outliers. Meanwhile, one of the reasons the US dollar has done well during recessions is that the US economy generally has had more shallow recessions than other advanced economies in recent years. Through this lens, the US performs comparatively better during global downturns (Chart I-6). Going forward, the IMF predicts that non-US growth should fare better than growth in the US over the next few years. We side with the IMF: The global economic recovery will remain intact and will rotate from the US to other economies. Chart I-6US Growth Usually Outperforms During Recessions
The Dollar Smile Theory
The Dollar Smile Theory
Chart I-7Spectacular Recovery In Vaccinations Outside The US
Spectacular Recovery In Vaccinations Outside The US
Spectacular Recovery In Vaccinations Outside The US
The primary rationale is that most G10 countries lagged the US in their vaccination campaigns in 2020 and earlier this year. That is starting to change now, as vaccinations in the rest of the G10 are ramping up (Chart I-7). Meanwhile, vaccinations are proving effective against death and hospitalizations for the Delta variant of the COVID-19 virus. A turnaround in the vaccination campaign would not only boost public opinion about the COVID-19 response but would also be a welcome fillip to much subdued consumer and business sentiment outside the US. Taking a step back, there is a strong case to be made that cyclically, both eurozone and Japanese growth could surprise to the upside due to pent-up demand. For the eurozone, the debt crisis from 2010-2012 was a severe blow to the recovery. In Japan, rolling crises from the Fukushima disaster in 2011 to the consumption tax hikes both in 2014 and 2019 were growth handicaps. Chinese monetary tightening in 2015 caused a sharp manufacturing recession that was a severe blow to non-US economies, including Japan and the eurozone. This time around, coordinated monetary and fiscal stimulus could allow for a few years of a genuine growth recovery. In a nutshell, the dollar smile that occurred around the pandemic last year was due to the uncertainty about the future path of growth, while the US was leading the world in both monetary and fiscal stimulus. The US also led in the vaccination campaign. As other economies adopt this template, the smile should fade, as has empirically been the case over time. Echoes From The 2000s The 2000s experience could provide a useful roadmap for the dollar in this coming decade (Chart I-8). US growth was underperforming the rest of the world during that time. The primary driver was a commodity boom driven by massive infrastructure spending in China. This time around, a concerted push towards green energy will sustain bull markets in metals such as copper, nickel, cobalt, aluminum, and silver, benefiting the economies of producer countries (Chart I-9). Leaders in building renewable energy infrastructure, such as Europe, could also see a boom as demand for their goods and services rise. Chart I-8A Roadmap For The Dollar In The Next Decade
A Roadmap For The Dollar In The Next Decade
A Roadmap For The Dollar In The Next Decade
Chart I-9At The Cusp Of A New Commodity Super Cycle?
At The Cusp Of A New Commodity Super Cycle?
At The Cusp Of A New Commodity Super Cycle?
The aftermath of the tech bubble bust created extremely easy policy settings for the US. The Federal Reserve cut interest rates to a low of 1% in 2003. Meanwhile, fiscal policy was much more accommodative than what was needed to close the output gap. The combination led to a massive expansion in the US twin deficits, a similar situation to today (Chart I-10). Chart I-10A 2000s Roadmap
A 2000s Roadmap
A 2000s Roadmap
Chart I-11Real Yields: Now Versus Then
Real Yields: Now Versus Then
Real Yields: Now Versus Then
Excess demand in the US started to create inflationary pressures, with headline inflation consistently between 2-4% from 2000-2008. Real rates in the US cratered, which hurt the dollar. This time around, inflation is rising fastest in the US (even if it is transitory). Meanwhile, The Fed is the only central bank that has an asymmetric inflation target. Other central banks (such as the Reserve Bank of New Zealand, the Bank of Canada or Norges Bank) have stated they will normalize policy, even though they also view their inflation as transitory. So real rates are and will be rising faster outside the US (Chart I-11). In short, most of the conditions that have usually characterized a dollar bear market for a decade or so are in place today. The Federal Reserve is committed to staying easy, US real rates are depressed, and growth should be stronger outside the US compared to within it, a similar template to what we saw in the 2000s. From A Dollar Shortage To An Avalanche The dollar smile theory works particularly well when there is a shortage of dollars, like in 2020. The lack of dollar liquidity was a tailwind behind the dollar bull market during the last decade. Today, the Fed’s balance sheet is still expanding, and the massive liquidity injection from quantitative easing has tremendously improved the global supply of dollars. One measure of global dollar liquidity is the sum of the Federal Reserve’s custody holdings together with the US monetary base. Every time this measure has severely contracted in the past, the shortage of dollars has exacerbated a blow-up somewhere, typically among other countries running twin deficits (Chart I-12). For example, since the global financial crisis, a deceleration in this measure coincided with the European debt crisis, the China slowdown, and more recently, the COVID-19 crisis, with steep depreciation in many procyclical currencies and a vicious rally in the dollar. Chart I-12An Explosion In The US Monetary Base
An Explosion In The US Monetary Base
An Explosion In The US Monetary Base
Fast forward to today and it is difficult to imagine such a scenario playing out over the next 9-12 months. The Fed has swap lines with many foreign developed and emerging market central banks that can draw on dollar liquidity until the end of this year. These lines are likely to be extended if the economic environment deteriorates before year-end. Meanwhile, the lack of uptake from these lines suggests foreign central banks are flush with dollars (Chart I-13). The Federal Reserve’s custody holdings also argue that there is little shortage of dollars internationally, compared to 2008 or 2020 (Chart I-14). With the US current account deficit widening, outflows of US dollars will continue to keep global dollar liquidity flush. Chart I-13Swap Lines Are Not Being Tapped
Swap Lines Are Not Being Tapped
Swap Lines Are Not Being Tapped
Chart I-14Custody Holdings Are Picking Up
Custody Holdings Are Picking Up
Custody Holdings Are Picking Up
Cross-currency basis swaps are well contained, suggesting no US dollar funding pressures abroad. Chart I-15Rising Non-USD Debt
Rising Non-USD Debt
Rising Non-USD Debt
It is important to note that euro- and yen-denominated debt are also expanding (Chart I-15). These are smaller in outstanding amounts than US-denominated debt but reflect the gradual shift in the allocation of currencies away from dollars. In a nutshell, the system is awash with both dollars and other international reserve currencies, limiting the negative feedback loop that dollar shortages have usually triggered. Concluding Thoughts We made the case last week that the dollar is experiencing a countertrend bounce, likely to continue over the next month or so. Beyond that, however, the dollar should depreciate towards the end of the year into next year. Meanwhile, our analysis suggests the dollar smile theory works best near recessions when the US economy is likely to outperform and the safe-haven status of US Treasuries is likely to buffet the greenback. Outside of these periods which represent only 5% of the last four decades, the dollar smile theory falls apart. Chester Ntonifor Foreign Exchange Strategist chestern@bcaresearch.com Currencies US Dollar Chart II-1USD Technicals 1
USD Technicals 1
USD Technicals 1
Chart II-2USD Technicals 2
USD Technicals 2
USD Technicals 2
There were a few strong data releases out of the US: Inflation continues to inflect higher in the US. Headline CPI came out at 5.4% versus expectations of 4.9% in June. Core came in at 4.5% versus expectations of 4.0%. The PPI report was equally robust, with core prices rising well above expectations to the tune of 5.6%. The NFIB small business optimism survey jumped from 99.6 to 102.5. Empire manufacturing data for July was 43 versus 17.4 the prior month. The US dollar DXY index is up 0.4% this week. The big data release was the increase in US inflation but relative calm in bond markets seems to cement the view that financial participants consider it transitory. There is still scope for the US dollar to work off oversold conditions, but our bias is that it will be lower in the next 9-12 months. Report Links: Arbitrating Between Dollar Bulls And Bears - March 19, 2021 The Dollar Bull Case Will Soon Fade - March 5, 2021 Are Rising Bond Yields Bullish For The Dollar? - February 19, 2021 The Euro Chart II-3EUR Technicals 1
EUR Technicals 1
EUR Technicals 1
Chart II-4EUR Technicals 2
EUR Technicals 2
EUR Technicals 2
There was scant data out of the eurozone this week: The Bloomberg GDP survey showed that both Q2 and Q3 GDP growth were revised higher. 2022 growth was also revised higher from 4.2% to 4.3%. In the same survey, there was no change expected in policy rates in the foreseeable future. CPI across eurozone countries was in line with expectations: 2.5% in Spain, 2.1% in Germany and 1.9% in France for the month of June. Over the weekend, in a Bloomberg interview, Christine Lagarde told us to expect a significant update to the eurozone’s monetary policy and forward guidance in the July 22 meeting. Our bias is that given the new symmetric inflation target, PEPP will be rolled over into a new program, revised asset purchases will be announced to accommodate for climate change, and possibly more forward guidance that gives us a window into when the ECB will exit negative rates. Report Links: Relative Growth, The Euro, And The Loonie - April 16, 2021 The Euro Dance: One Step Back, Two Steps Forward - April 2, 2021 On Japanese Inflation And The Yen - January 29, 2021 The Yen Chart II-5JPY Technicals 1
JPY Technicals 1
JPY Technicals 1
Chart II-6JPY Technicals 2
JPY Technicals 2
JPY Technicals 2
There was some positive news out of Japan this week: Core machine orders rose 12.2% year on year in May, versus an expectation of a 6.3% increase. PPI came in at 5% year on year in June, in line with expectations. Machine tool orders rose 97% year on year in June. Importantly, domestic orders grew faster. The yen was down 0.14% against the dollar this week, after a stellar performance last week. The yen continues to sit in a sweet spot among G10 currencies. Falling nominal yields elsewhere are increasing the appeal of yen cash in real terms. Meanwhile, there is the upshot of cyclical improvement in Japan, which will benefit inflows into yen assets. Report Links: The Case For Japan - June 11, 2021 The Dollar Bull Case Will Soon Fade - March 5, 2021 On Japanese Inflation And The Yen - January 29, 2021 British Pound Chart II-7GBP Technicals 1
GBP Technicals 1
GBP Technicals 1
Chart II-8GBP Technicals 2
GBP Technicals 2
GBP Technicals 2
There was significant data out of the UK this week: The 3-month-on-3-month GDP release for May came in at 3.6%, below expectations. Industrial production growth for May was 20.6% year on year, below the 27.5% increase in April. The trade deficit improved from GBP 11bn to GBP 8.5bn. CPI was above target in June, with core at 2.3% and the RPI at 3.9%. The house price index rose 10% year on year in May. Employment increased 25K in May, which disappointed expectations of a 91K increase. The pound rose 0.5% against the US dollar this week. The market reacted positively to the upside surprise in inflation, suggesting the BoE might normalize policy sooner than expected. Report Links: Why Are UK Interest Rates Still So Low? - March 10, 2021 Portfolio And Model Review - February 5, 2021 Thoughts On The British Pound - December 18, 2020 Australian Dollar Chart II-9AUD Technicals 1
AUD Technicals 1
AUD Technicals 1
Chart II-10AUD Technicals 2
AUD Technicals 2
AUD Technicals 2
There were a few important data releases out of Australia this week: NAB business conditions deteriorated. The conditions component fell from 37 to 24 in June, while the confidence component fell from 20 to 11. Westpac consumer confidence rose slightly to 108.8 from 107.2 in July. The employment report was better than expected. There were 29.1K jobs added in June, pushing the unemployment rate down to 4.9%. The mix was also great with 51.6K full-time jobs added versus a loss of 22.5K part-time jobs. The AUD was up 0.13% this week against the USD. Melbourne has joined Sydney in the lockdown, and so there is room for economic data to keep disappointing over the next few weeks. In hindsight, the RBA’s decisively dovish bias relative to other central banks seemed to be the appropriate strategy. In the end, if the COVID-19 crisis proves transient, it will create a coiled spring response for the AUD. Report Links: The Dollar Bull Case Will Soon Fade - March 5, 2021 Portfolio And Model Review - February 5, 2021 Australia: Regime Change For Bond Yields & The Currency? - January 20, 2021 New Zealand Dollar Chart II-11NZD Technicals 1
NZD Technicals 1
NZD Technicals 1
Chart II-12NZD Technicals 2
NZD Technicals 2
NZD Technicals 2
The was scant data out of New Zealand this week: REINZ house prices rose 6.2% year on year in June. Net migration for May was 1182 versus 1087 the prior month. The NZD was up 60bps versus the US dollar this week. While the RBNZ kept interest rates at 0.25%, it signaled QE will end on July 23, a full year ahead of schedule. Markets are now priced for a rate hike as early as August. Our long CHF/NZD position was offside in this environment. Our conviction on this trade has fallen given the hawkish shift from the RBNZ, but we recommend holding onto this trade, as a reset in global asset prices could increase currency volatility and hurt the pair. Report Links: How High Can The Kiwi Rise? - April 30, 2021 Portfolio And Model Review - February 5, 2021 Currencies And The Value-Versus-Growth Debate - July 10, 2020 Canadian Dollar Chart II-13CAD Technicals 1
CAD Technicals 1
CAD Technicals 1
Chart II-14CAD Technicals 2
CAD Technicals 2
CAD Technicals 2
Data out of Canada this week has been robust: The employment report was stellar. 231K new jobs were added in June. The unemployment rate fell from 8.2% to 7.8%. The participation rate also increased from 64.6% to 65.2%. The BoC kept interest rates on hold at 0.25% but cut its weekly asset purchases from C$3 billion to C$2 billion. The Bloomberg Nanos Confidence index held steady at 66.4. The CAD fell by 0.2% this week and was flat on the announcement. The loonie has softened since the bottom in the DXY index, as overbought conditions are being worked off. There was no new information out of the recent BoC meeting – the central bank is on pace to start lifting rates ahead of the Fed as long as Canada approaches full employment and inflation remains above target. This will limit downside on the CAD. Report Links: Relative Growth, The Euro, And The Loonie - April 16, 2021 Will The Canadian Recovery Lead Or Lag The Global Cycle? - February 12, 2021 The Outlook For The Canadian Dollar - October 9, 2020 Swiss Franc Chart II-15CHF Technicals 1
CHF Technicals 1
CHF Technicals 1
Chart II-16CHF Technicals 2
CHF Technicals 2
CHF Technicals 2
The was scant data out of Switzerland this week: Producer prices rose by 2.9% year on year in June. Total sight deposits were unchanged at CHF 712 bn for the week of July 9. The Swiss franc was down 0.3% this week, after a nice run-up last week. Falling yields will continue to improve the relative appeal of the franc, like the yen. The franc will also benefit from safe-haven inflows if equity markets correct. We are long the CHF/NZD cross on this basis and are sticking with this recommendation. Report Links: An Update On The Swiss Franc - April 9, 2021 Portfolio And Model Review - February 5, 2021 The Dollar Conundrum And Protection - November 6, 2020 Norwegian Krone Chart II-17NOK Technicals 1
NOK Technicals 1
NOK Technicals 1
Chart II-18NOK Technicals 2
NOK Technicals 2
NOK Technicals 2
Data out of Norway is improving: June CPI came in at 2.9% as expected. Underlying CPI was also 1.4%. PPI came in at 37.1% year on year in June, driven by high oil prices. The trade balance improved from NOK 15.5bn to NOK 25bn in June. The NOK was down by 1.7% this week against the dollar. We have a limit-buy on the Scandinavian currencies at -1.4% from current levels, on expectation that the sell-off is short lived. Report Links: The Norwegian Method - June 4, 2021 Portfolio And Model Review - February 5, 2021 Revisiting Our High-Conviction Trades - September 11, 2020 Swedish Krona Chart II-19SEK Technicals 1
SEK Technicals 1
SEK Technicals 1
Chart II-20SEK Technicals 2
SEK Technicals 2
SEK Technicals 2
Recent data from Sweden have been somewhat soft: Headline CPI fell from 1.8% in May to 1.3% in June. The core measure also fell from 2.1% to 1.6% but was better than expectations. The core core measure came in at 0.9% as expected. The SEK was the weakest G10 currency this week, falling by 0.7%. A disappointment in Swedish inflation is a surprise, given the inflationary overshoots we are seeing elsewhere. As Sweden is a small, open economy, inflation there will pick up (via imported inflation), which will lift expectations that the Riksbank will normalize policy. Report Links: Revisiting Our High-Conviction Trades - September 11, 2020 More On Competitive Devaluations, The CAD And The SEK - May 1, 2020 Sweden Beyond The Pandemic: Poised To Re-leverage - March 19, 2020 Footnotes 1The theory was proposed by Stephen Jen, a former IMF economist and now a hedge fund manager at Eurizon SLJ Capital in London. Trades & Forecasts Forecast Summary Core Portfolio Tactical Trades Limit Orders Closed Trades