Money Trends / Liquidity

Highlights In China, “helicopter” money and the socialist put are positive for growth in the medium term but will prove harmful for the economy over the long run. In the socialist put scenario, a buy-and-hold strategy is inappropriate for Chinese stocks. The enormous amount of money supply in China is “the sword of Damocles” on the yuan’s exchange rate. A new equity trade: Short Chinese banks / long U.S. banks. Take profits on our short Chinese property developers / long U.S. homebuilders equity position. Feature Last week’s China credit and money data affirmed that Chinese banks have engaged in another round of massive credit and money injection into the economy. In the first quarter alone, aggregate credit rose by RMB 8.5 trillion (US$1.3 trillion). Aggregate credit growth accelerated to 11.6%, well above first-quarter nominal GDP growth of 8% (Chart I-1). This is in spite of numerous pledges by many of China’s top policymakers that they have no plans to resort to “floodgate irrigation” style stimulus, and that credit/money growth will be kept on par with nominal GDP growth. Our credit and fiscal spending impulse has spiked up, pointing to a potential improvement in economic data in the months ahead (Chart I-2). Chart I-1China: No Deleveraging At All
China: No Deleveraging At All
China: No Deleveraging At All
What’s more, there is anecdotal evidence of a revival of housing demand in March, and that property developers have once again commenced bidding up land prices in certain parts of the country. Chart I-2China: Leading Economic Indicators
China: Leading Economic Indicators
China: Leading Economic Indicators
Regarding investment strategy, two weeks ago we put a stop-buy limit on the MSCI EM stock index at 1125. If this index breaks above this level we will turn tactically positive on EM risk assets. There is anecdotal evidence of a revival of housing demand in March, and that property developers have once again commenced bidding up land prices in certain parts of the country. Below are the pros and cons of upgrading the EM outlook at the current juncture. Pros The credit impulse in China leads both the mainland’s business cycle and the global manufacturing cycle by an average of nine months. Given its bottom was in December 2018, the trough in the mainland business and global industrial cycles should have been around August 2019 (Chart I-3). Chart I-3Global Manufacturing PMI Has Not Led Global Stocks
Global Manufacturing PMI Has Not Led Global Stocks
Global Manufacturing PMI Has Not Led Global Stocks
Our assessment has been that the bottom in EM equities that occurred in late December 2018 was too early. Our basis has been that the Chinese and global manufacturing cycles were not likely to bottom before August 2019, according to their previous relationship with China’s credit and fiscal spending impulse. Consequently, we have been expecting China-related plays in financial markets to experience a setback before a more sustainable buying opportunity emerged. However, as China’s credit recovery is now gaining momentum and infrastructure spending financed by local government special bonds is accelerating, the window of downside risk for share prices is narrowing. There have been no recent major stimulus measures directed at China’s property market, but it appears banks have substantially boosted mortgage loan origination and their financing of property developers by loosening lending standards. Easy financing for both homebuyers and property developers makes a revival in real estate more likely. The property market and construction activity are critical to the mainland’s business cycle. If green shoots in the property market multiply, the odds of an overall growth recovery will rise substantially. Finally, if the EM equity index breaks above our stop-buy limit, it would clear an important technical resistance level, confirming the sustainability of this rally (Chart I-4). Cons EM corporate profit growth is contracting in U.S. dollar terms, and the pace of contraction will deepen into the end of this year. This assessment is based on the previous decline in China’s credit impulse. The latter suggests a bottom in EM EPS in December 2019 (Chart I-5). It is still unclear whether EM share prices can ignore this profit contraction and advance through the entire year without major bumps. Chart I-4EM Stocks Are Facing Technical Resistance
EM Stocks Are Facing Technical Resistance
EM Stocks Are Facing Technical Resistance
Chart I-5EM Profits Will Continue Contracting
EM Profits Will Continue Contracting
EM Profits Will Continue Contracting
As of March, Chinese domestic smartphone sales (Chart I-6), as well as Korean, Japanese, Singaporean and Taiwanese exports to the mainland, are all still shrinking at double-digit rates from a year ago (Chart I-7). Chart I-6China: Consumer Spending In March Was Still Weak
China: Consumer Spending In March Was Still Weak
China: Consumer Spending In March Was Still Weak
Chart I-7Exports To China Contracted At A Double-Digit Rate In March
Exports To China Contracted At A Double-Digit Rate In March
Exports To China Contracted At A Double-Digit Rate In March
Our indicators for marginal propensity to consume for Chinese households and companies remain in a downtrend as of March (Chart I-8). An upturn in these indicators is needed to validate that the fiscal and credit stimulus is accompanied by a greater multiplier effect. Chart I-8China: Marginal Propensity To Spend By Consumers And Enterprises
China: Marginal Propensity To Spend By Consumers And Enterprises
China: Marginal Propensity To Spend By Consumers And Enterprises
Chart I-9Low Vol Precedes A ##br##Regime Shift
Low Vol Precedes A Regime Shift
Low Vol Precedes A Regime Shift
Finally, financial markets’ aggregate volatility is extremely low (Chart I-9). This is especially true for the currency markets (Chart I-10, top panel). Typically, this is a sign of both complacency and a forthcoming major regime shift in financial markets. Chart I-10The Dollar Is Poised To Break Out Or Break Down
The Dollar Is Poised To Break Out Or Break Down
The Dollar Is Poised To Break Out Or Break Down
We would be much more comfortable upgrading the EM outlook if the broad trade-weighted U.S. dollar broke down, corroborating the improvement in global/EM growth. So far, the greenback has been moving sideways along its 200-day moving average (Chart I-10, bottom panel). If the dollar breaks out, it would confirm the negative outlook for EM. Investors should closely watch foreign exchange markets and adjust their investment strategy accordingly. “Helicopter” Money Forever = A Socialist Put China’s forthcoming recovery is good news for financial markets. Nonetheless, the long-term outlook for the Chinese economy is deteriorating because the credit and money, as well as property bubbles, will keep expanding. First, China holds the world record with respect to corporate sector leverage (Chart I-11). Second, households in China are more leveraged than those in the U.S. (Chart I-12). Given that borrowing costs for households are higher in China than in the U.S., interest payments take up a larger share of Chinese households’ disposable income. Chart I-11Corporate Sector Leverage: China Holds The World Record
Corporate Sector Leverage: China Holds The World Record
Corporate Sector Leverage: China Holds The World Record
Chart I-12Chinese Households Are More Leveraged Than Americans
Chinese Households Are More Leveraged Than Americans
Chinese Households Are More Leveraged Than Americans
Third, contrary to popular belief, banks do not channel savings/deposits into credit. They create deposits/money supply when they lend to or buy assets from non-banks. Money supply is the sum of deposits and cash in circulation. Financial markets’ aggregate volatility is extremely low. This is especially true for the currency markets. In a nutshell, credit and money excesses in China are not natural outcomes of the nation’s high savings rate but are the result of reckless credit origination by China’s commercial banks. We have elaborated on this point in a series of reports we have written on credit, money and savings.1 When commercial banks originate a loan, they create new money and new purchasing power “out of thin air.” Nobody needs to save for a bank to make a loan or buy assets. Consequently, new purchasing power for goods and services boosts demand in the real economy and inflates asset prices. Chinese banks have literally been dropping “helicopter” money over the past 10 years. Since January 2009 – the onset of the country’s massive credit binge – banks have created 165 trillion yuan ($25 trillion) of new broad money, based on our measure of M3 broad money. This is triple of the $8.3 trillion broad money supply created in the U.S., the euro area and Japan combined during the same period (Chart I-13, top panel). Chart I-13Helicopter Money In China
Helicopter Money In China
Helicopter Money In China
China’s broad (M3) money supply now stands at 220 trillion yuan, equivalent to $32.5 trillion. What’s astonishing is that Chinese broad money is larger than the sum of broad money in both the U.S. and the euro area (i.e. all outstanding U.S. dollars and euros in the world combined) (Chart I-13, bottom panel). Yet China’s nominal GDP is only 38% of U.S. and euro area’s GDP combined. Credit and money excesses in China are not natural outcomes of the nation’s high savings rate but are the result of reckless credit origination by China’s commercial banks. In a market-based economy, the constraints on banks doing “helicopter” money are bank shareholders, regulators and central banks. Bank shareholders are the primary and largest losers from credit booms because they are highly exposed to non-performing loans. That is why they should be the first to cut credit flows to the economy when they sense non-payments on loans could rise. In China, neither bank shareholders nor bank regulators or the People’s Bank of China have prevented banks from expanding credit/money. Moreover, the authorities have not forced banks to acknowledge non-performing loans. This scenario – whereby banks expand credit without taking responsibility for collecting the loans – only occurs in a socialist system. This is the ultimate socialist put. China’s Potential Growth Roadmaps We have been arguing for several years that China is facing a historic choice between: (1) Moving toward a more market-based economic system that entails making creditors and borrowers take responsibility for their lending/borrowing and investment decisions. If lenders and borrowers are made explicitly accountable for their business/financial decisions, then credit flows will decelerate considerably, bankruptcies will mushroom and a period of deleveraging will be inevitable. However, the quality of capital allocation will improve, enhancing the country’s productivity and potential growth in the long run (Chart I-14).
Chart I-14
This is a scenario of medium-term pain, long-term gain. The recent ramp-up in credit growth does not suggest the authorities are willing to embrace this option. Chart I-15China: Structural Growth Tailwinds Have Dissipated
China: Structural Growth Tailwinds Have Dissipated
China: Structural Growth Tailwinds Have Dissipated
(2) “Helicopter money” and a socialist put scenario entails lower potential GDP growth and rising inflation. If China continues opting to keep the socialist put in place, its potential growth rate – which is equivalent to the sum of growth rates in productivity and the labor force – will drop significantly. In the long run, this socialist put discourages innovation and breeds capital misallocation, reducing productivity growth. In fact, the industrialization ratio is 85% – not 60% as many contend(Chart I-15, top panel). Further, China’s labor force growth has stalled and will be mildly negative in the years to come (Chart I-15, bottom panel). Together, these circumstances point to a slower potential growth rate. Meanwhile, recurring stimulus via “helicopter” money will create mini-cycles around a falling potential growth rate (Chart I-16). Below we discuss the investment strategy this scenario entails.
Chart I-16
Implications Of The Socialist Put For The Currency… Slowing productivity and rampant money/purchasing power creation ultimately lead to rising inflation. Higher inflation and low interest rates - required to sustain an ever-rising debt burden - are a recipe for currency depreciation. Chinese households and businesses are eager to diversify their copious and mushrooming renminbi deposits into foreign currencies and assets. The PBoC’s foreign exchange reserves of $3 trillion are equal to only 10% of the amount of yuan deposits and cash in circulation. Foreign exchange reserves’ coverage of local currency money supply is much higher in many other EM countries, including Brazil and Russia (Chart I-17). Chart I-17China's FX Reserves Cover Less Local Currency Deposits Than Peers
China's FX Reserves Cover Less Local Currency Deposits Than Peers
China's FX Reserves Cover Less Local Currency Deposits Than Peers
The enormous amount of money supply/deposits in China is “the sword of Damocles” on the yuan’s exchange rate in the long run. It is therefore inconceivable that China can fully open its capital account in the foreseeable future. On the contrary, capital account restrictions will be further tightened. Plus, the current account will become much more regulated so that there is no leakage of capital via trade transactions – such as over-invoicing of imports or under-invoicing of exports. The inability to repatriate capital when needed and structural RMB depreciation are the key risks to long-term investors in China’s onshore capital markets. …And Chinese Stocks In the socialist put scenario, a buy-and-hold strategy is inappropriate for Chinese stocks: Investors should attempt to play the resultant mini-cycles (Chart I-16). In reality, however, economic and especially financial market mini-cycles are not symmetric, and investors can make money only if they time them properly. In fact, this decade Chinese share prices – both in absolute terms and relative to global stocks – have experience wild swings (Chart I-18). Chart I-18Chinese Stocks Are Following Mini-Cycles
Chinese Stocks Are Following Mini-Cycles
Chinese Stocks Are Following Mini-Cycles
Concerning the current outlook for Chinese investable stocks, our take is as follows: On absolute performance, we will turn positive on Chinese share prices if our stop-buy on EM equities is triggered, as per our discussion above. As for their relative performance within EM and global equity portfolios, simply because the stimulus originates in China does not warrant an overweight position in Chinese stocks. The primary losers from credit bubbles are banks and other financial companies. The basis is that they will carry the burden of potential rising non-performing loans unless the government bails them out by purchasing bad assets at par. The latter has not been the case so far this decade. Hence, an underweight position in Chinese banks/financials is currently warranted. Furthermore, the large debtors in the non-financial corporate sector should also be underweighted. When a company increases its debt but its new investments produce little net new cash flow, its equity value declines. It is difficult to find so many high-return investment projects, especially in a slowing economy. Therefore, another round of considerable capital misallocation is currently underway, and shareholders of the companies that are undertaking these investments will end up losing. In a socialist system, shareholders typically do not make money. They lose money. This is the rationale to underweight Chinese stocks within both EM and global equity portfolios. Yet, there is a caveat: This framework may not be pertinent to the two largest companies in the Chinese investable equity index Ali-Baba and Tencent - each of which accounts for 13% of the index. These two companies score well on the above issues but face different non-macro hazards including regulatory, business model and other risks. Weighing the pros and cons, we recommend maintaining a market weight allocation in Chinese equities within an EM equity portfolio. This is the view of BCA’s Emerging Markets Strategy team, which differs from the recommendations of other BCA services that are currently advocating an overweight position in Chinese stocks within a global equity portfolio. A New Trade: Short Chinese Bank / Long U.S. Bank Stocks Chinese banks’ equity value will erode as they once again expand their balance sheets aggressively, as per our discussion above. Chinese banks’ EPS have been and will continue to be diluted by the need to raise more capital. U.S. banks are better capitalized, and their asset quality is much better. Since the 2007-08 credit crisis, they have been much more prudent in expanding their balance sheets. U.S. bank stocks have underperformed the S&P 500 index since August 2018 because of falling U.S. interest rate expectations. The odds are high that U.S. bond yields are bottoming and will rise considerably – because the drag from China’s slowdown on the global economy is diminishing. This will help U.S. bank stocks. Although Chinese bank stocks optically appear undervalued, they are “cheap” for a reason. The fact that they have been “cheap” since 2011 and have failed to re-rate confirms that they suffer from chronic problems that have not been addressed yet (Chart I-19). Finally, their relative performance is facing a major resistance level, and will likely relapse (Chart I-20). Chart I-19Chinese Banks Are Cheap##br## For A Reason
Chinese Banks Are Cheap For A Reason
Chinese Banks Are Cheap For A Reason
Chart I-20A New Trade: Short Chinese Banks / Long U.S. Banks
A New Trade: Short Chinese Banks / Long U.S. Banks
A New Trade: Short Chinese Banks / Long U.S. Banks
Take Profits On Short Chinese Property Developers / Long U.S. Homebuilders Position “Helicopter” money might be temporary positive for mainland property developers. In the meantime, share prices of U.S. homebuilders will be hurt due to rising U.S. bond yields. We are closing this position to protect profits. This recommendation has produced a 90% gain since its initiation on March 6, 2012. Arthur Budaghyan Chief Emerging Markets Strategist arthurb@bcaresearch.com Footnotes 1 Please see Emerging Markets Strategy Special Report "Misconceptions About China's Credit Excesses," dated October 26, 2016 and Emerging Markets Strategy Special Report "The True Meaning Of China's Great 'Savings' Wall," dated December 20, 2017, available at ems.bcaresearch.com Equity Recommendations Fixed-Income, Credit And Currency Recommendations
Dear Client, This Special Report is the full transcript and slides of a keynote presentation I recently gave to the Sovereign Investor Institute in London titled: 'The Biggest Risks To The Global Economy Are…' The short presentation pulls together several concepts and observations which identify the ‘weak links’ in the global economy. Therefore, the presentation should serve as a useful summary of the global economy’s current vulnerabilities. The report then explains how each of the risks translates into a European investment context. I hope you find it insightful. Best regards, Dhaval Joshi, Chief European Investment Strategist
Image
Feature Full Transcript And Slides
Image
Good morning Thank you for inviting me to give today’s keynote presentation under the title: ‘The Biggest Risks To The Global Economy Are…’ (Slide 1). I will not discuss all the risks out there, but the four risks that I will present are the ones that I think are the most significant. And the biggest of these four risks I will leave to the end. So let’s begin. Risk 1 is China’s Credit Cycle (Slide 2). You can see this very clearly in this slide (Slide 3) which shows the short-term accelerations and decelerations in credit within the world’s three largest economies – Europe, the United States, and China. In essence, it is showing how much new credit was created in the last six months compared with the preceding six months. Was it more credit creation or was it less, and how much more or less? Everything is in dollars to allow a fair comparison.
Image
Image
Now look at the red line. The red line is China. Just ten years ago, China’s credit cycle was irrelevant. It simply didn’t matter. But after the GFC, China’s short-term credit expansions and contractions suddenly became as large as those in Europe and the U.S. More recently, China’s cycle is dwarfing the others, so now it is the European and the U.S. credit cycles that are irrelevant! This means that whenever China’s short-term credit cycle turns down, as it did in late 2015, early 2017, and 2018, the global economy feels a chill. The point is that this short-term cycle is a near-perfect oscillator. Down-oscillations will occur every eighteen months or so, and any of them has the potential to turn nasty. Though we are currently in an up-oscillation, the next down-oscillation is due later this year. And I predict that it will pose a big risk to the global economy. Risk 2 is Trade Imbalances (Slide 4). This slide (Slide 5) has a mischievous title ‘Where President Trump Is Right About Europe’. The red line shows where the president is absolutely right: Europe is running a massive – a record-high – trade surplus with the United States. It is an undeniable fact. But the president is wrong about the underlying cause. The underlying cause is not unfair trade practices or tariffs, the underlying cause is the other line, the blue line, which shows the divergent monetary policies of the ECB and the Fed.
Image
Image
The trade imbalance and monetary policy divergence are moving together tick for tick, and the transmission mechanism is of course the exchange rate. The divergent monetary policies have depressed the euro, and a depressed euro obviously makes German cars cheaper for American consumers. That is the reason that the president is seeing so many BMWs driving down Fifth Avenue! My point is that these record-high imbalances are being used to justify economic nationalism – retaliatory tariffs, restricted trade, and potentially all-out trade wars. Alternatively, this chart suggests that the imbalances would correct with large-scale movements of exchange rates. But to me, either of these options poses a big risk to the global economy. Risk 3 Is Technological Disruption (Slide 6). To understand why, I want to introduce you to a concept known as Moravec’s Paradox (Slide 7). A professor of robotics, Hans Moravec, noticed something odd. He realized that things that we find very hard are actually very easy for AI. Things like complex mathematics, speaking multiple languages, or advance pattern recognition. Typically, as few people have these skills, they are well-paid skills.
Image
Image
Whereas things that we find very easy are incredibly difficult for AI. Things like human movement and recognizing, and responding to, emotional signals. Typically, as everybody has these skills, they are low-paid skills. Moravec’s Paradox means that the current wave of technological progress is much more disruptive than previous waves. The steam engine destroyed low-paid jobs, forcing workers up the income ladder. But the current wave of technology, led by AI, is destroying well-paid jobs forcing workers down the income ladder.
Image
You can see it in the data. While job creation in most major economies is on the face of it very strong, just look at what type of jobs are being created (Slide 8). Food delivery, bar work, care work and social work. Now you’ll agree that this is not highly paid work with career prospects! In essence, the current wave of technology is revealing a huge misallocation of capital. You might have invested huge amounts of time and money in say, becoming a linguist. Only to find that AI can translate languages much better than you – and your employment opportunities are limited to lower-income work. Well that misallocation of capital is very disruptive. In my opinion, it’s one of the main reasons why even though economies are growing and unemployment is very low, people don’t feel good. Making them susceptible to simplistic fixes such as ‘take back control’ and economic nationalism. My point is that the current wave of AI-led job disruption has much further to run, and the populist backlash will remain a big risk to the global economy. But now I want to turn to what I believe is the biggest risk of all. Risk 4 Is Higher Bond Yields (Slide 9). Most people believe that economic downturns cause financial market downturns. But the truth is the complete opposite: the causality almost always runs the other way! In the vast majority of cases, it is financial market imbalances and mispricing that cause economic downturns and crises. Take the last three economic downturns – in 2001, in 2008 and in 2011. They all had their roots in financial mispricing – the dot com bubble, the U.S. mortgage market, and euro area sovereign debt. Likewise for the Great Depression in the 30s, Japan’s recession in the early 90s. I could go on. You get the point… What is the financial vulnerability today that could cause an economic downturn? (Slide 10) The answer is that the very rich valuation of equities and other risk-assets is highly sensitive to bond yields. Which means that substantially higher bond yields pose a very big risk to the global economy.
Image
Image
You see, at very low bond yields, the bond price can no longer go up much but it can go down massively (Slide 11). The latest advances in financial theory now conclusively show that this unattractive ‘negative’ asymmetry is what defines ‘risk’ for investors. The crucial point is that at low bond yields, bonds become as risky, or more risky, than equities (Slide 12). And this necessarily means that equities no longer need to deliver a superior return, a risk-premium, over the low bond yield (Slide 13). As bond yields decline this means equity valuations get an exponential boost because both components of the equity’s required return – the risk-free component and the risk-premium component – are collapsing simultaneously (Slide 14).
Image
Image
Image
Image
But if bond yields rise substantially, the process would go into vicious reverse and equity valuations would fall off a cliff. Other risk-assets too, and bear in mind that if we include real estate – as we should – global risk-assets are worth $400 trillion, five times the size of the global economy! Our research shows that the point of vulnerability is if the global 10-year bond yield approaches 2 percent, which is about 50 basis points above where it stands right now. And that, to me, is by far the biggest risk to the global economy.
Image
So to summarise, the biggest risks to the global economy are: China’s credit cycle; trade imbalances and technological disruption and their associated populist backlash; and the biggest risk is higher bond yields (Slide 15). In the near future I think alarm bells should start to ring if China’s credit cycle has tipped into a down-oscillation and/or the global 10-year bond yield is 50 bps higher. Don’t worry, the alarm bells are not ringing right now but they might be later this year. Finally, given the title you gave me, this presentation has necessarily focussed on the key risks. But I don’t want you to get too negative. I also have another presentation called ‘The Biggest Positives For The Global Economy Are…’ And for balance, I hope you invite me to present that next time! Thank you. How Do The Risks Translate Into A European Investment Context? Risk 1: China’s Credit Cycle, is highly relevant to European investors, for two reasons. First, the European economy is very open, meaning that exports make a substantial contribution to GDP growth. This is especially true in Europe’s engine economy, Germany, but it is also important for other major economies like Sweden. And it is evidenced in large trade surpluses as, for example, illustrated in Slide 5. Therefore, whenever China’s credit cycle enters a down-oscillation, as it did last year, Germany cannot escape the nasty chill coming through its all-important net export channel. Second, the European equity market is over-exposed to global growth sensitive sectors and companies – specifically, Industrials, Materials, and Financials. These sectors tend to have a very high operational gearing to global growth. Meaning that a small change in global growth has a disproportionate effect on these companies’ profits and share price performance. The upshot is that in a credit cycle up-oscillation, Europe’s global-growth sensitive stock markets and sectors benefit from a sharp burst of outperformance. The opposite applies in a credit cycle down-oscillation. It follows that if China’s credit cycle is due to tip into a down-oscillation later this year, it would be time to close our successful relative overweighting to European equities and to the global growth sensitive cyclical sectors. Risk 2: Trade Imbalances, is also highly relevant to European investors, for the obvious reason that European economies – especially Germany – are running huge trade surpluses. This puts these economies squarely in the cross-hairs of a retaliatory salvo involving tariffs, trade barriers, or worse, an all-out trade war. Clearly, Europe’s ‘exporting champions’ are the most vulnerable to this risk. The issue is important for the exchange rate too. We showed conclusively that Europe’s trade imbalance is the consequence of the depressed euro. It follows that another way to correct this imbalance is via a stronger euro. In this sense, the fundamentals imply euro upside from here. Risk 3: Technological Disruption, manifests through disruption in the jobs market, the lack of feel good, and the ensuing backlash leading to populism and nationalism. This is particularly relevant to Europe because its collection of nations, each with its own political processes, provides more scope for a political tail-event. A lull in the major political-event cycle is a good thing for Europe. In this regard, the upcoming EU parliamentary elections is not a big risk given the EU parliament’s inability, by itself, to drive policy. The risk increases approaching a meaningful political event, and this includes the date of Brexit. Therefore, this risk is likely to rise somewhat towards the end of the year. Risk 4: Higher Bond Yields, is clearly very relevant to Europe because many of the core euro area bond yields are at their lower bound. This means that the negative asymmetry of returns has its maximum impact on, for example, German bunds. It follows that German bunds are a sell in the near-term. Nevertheless, the upside to yields is ultimately limited given the aforementioned vulnerability of risk-asset valuations to higher bond yields. Therefore, the better long-term strategy is to short German bunds relative to U.S. T-bonds. Finally, a 50 basis points rise in 10-year yields from current levels would be a trigger to flip to underweight European equities. Fractal Trading System* Crude oil is at a technical reversal level. The best way to play this is on a hedged basis versus metals: short WTI, long LMEX. Set the profit target at 5 percent with a symmetrical stop-loss. In other trades, we are pleased to report long AUD/CNY achieved its profit target at which it was closed. This leaves five open positions. For any investment, excessive trend following and groupthink can reach a natural point of instability, at which point the established trend is highly likely to break down with or without an external catalyst. An early warning sign is the investment’s fractal dimension approaching its natural lower bound. Encouragingly, this trigger has consistently identified countertrend moves of various magnitudes across all asset classes.
Short WTI / Long LMEX
Short WTI / Long LMEX
The post-June 9, 2016 fractal trading model rules are: When the fractal dimension approaches the lower limit after an investment has been in an established trend it is a potential trigger for a liquidity-triggered trend reversal. Therefore, open a countertrend position. The profit target is a one-third reversal of the preceding 13-week move. Apply a symmetrical stop-loss. Close the position at the profit target or stop-loss. Otherwise close the position after 13 weeks. Use the position size multiple to control risk. The position size will be smaller for more risky positions. * For more details please see the European Investment Strategy Special Report “Fractals, Liquidity & A Trading Model,” dated December 11, 2014, available at eis.bcaresearch.com Dhaval Joshi, Chief European Investment Strategist dhaval@bcaresearch.com Fractal Trading Model Recommendations Asset Allocation Equity Regional and Country Allocation Equity Sector Allocation Bond and Interest Rate Allocation Currency and Other Allocation Closed Fractal Trades Trades Closed Trades Asset Performance Currency & Bond Equity Sector Country Equity Indicators Bond Yields Chart I-1Indicators To Watch - Bond Yields
Indicators To Watch - Bond Yields
Indicators To Watch - Bond Yields
Indicators To Watch - Bond Yields
Indicators To Watch - Bond Yields
Indicators To Watch - Bond Yields
Indicators To Watch - Bond Yields
Indicators To Watch - Bond Yields
Indicators To Watch - Bond Yields
Indicators To Watch - Bond Yields
Indicators To Watch - Bond Yields
Indicators To Watch - Bond Yields
Interest Rate Indicators To Watch - Interest Rate Expectations
Indicators To Watch - Interest Rate Expectations
Indicators To Watch - Interest Rate Expectations
Indicators To Watch - Interest Rate Expectations
Indicators To Watch - Interest Rate Expectations
Indicators To Watch - Interest Rate Expectations
Indicators To Watch - Interest Rate Expectations
Indicators To Watch - Interest Rate Expectations
Indicators To Watch - Interest Rate Expectations
Indicators To Watch - Interest Rate Expectations
Indicators To Watch - Interest Rate Expectations
Indicators To Watch - Interest Rate Expectations
Highlights BCA’s China Investment Strategy team recommended that investors upgrade Chinese stocks to overweight (both investable and domestic) in a Special Alert last week. Investors had a legitimate macro fundamental basis to go overweight Chinese stocks as of February 15, but we hesitated to shift our stance due to several still-present risks and out of concern that the sheer magnitude of the spike in credit could cause a regulatory response that would constrain credit growth in future months. The March credit data has confirmed that Chinese policymakers have chosen to prioritize growth for now, but we are unconvinced that a shift back to controlling leverage is out of the question over the coming year. Investors should continue to monitor this and several other risks noted below. Despite having already rallied significantly this year, Chinese investable and domestic stocks have the potential to earn double-digit relative returns (12-15%) in an optimistic scenario in US$ terms versus global stocks over the coming year. Conservatively, we expect high single-digit relative returns (6-8%). Feature BCA’s China Investment Strategy team recommended that investors upgrade Chinese stocks to overweight (both investable and domestic) in a Special Alert last week.1 In this week’s report we address several issues concerning the outlook for the economy and for Chinese stocks in a Q&A format where we answer the questions of a hypothetical, representative investor. In particular, we will discuss how much relative equity upside investors can expect over the coming year, whether the recent pace of credit growth significantly increases the chance of another credit overshoot, and when investors should expect to see a pickup in actual economic activity. Q: First, a question about timing. Why did it take so long to recommend upgrading Chinese stocks? Haven’t Chinese equities been forecasting an economic recovery for several months? A: Prior to the release of the January total social financing data on February 15, investors had no legitimate macro fundamental basis to go overweight Chinese stocks and were instead responding to a relatively less important factor for the economy – the Sino/U.S. trade war. We placed Chinese stocks on upgrade watch in late-February, and waited for confirmation that the spike in credit was not a one-off surge to be reversed by policymakers dead set against “flood irrigation-style” stimulus. As investors are surely aware, no two economic or financial market cycles are exactly alike. This is particularly true in the case of China; its economy experienced a major structural shift a decade ago, and economic and financial market oscillations since then have been highly disparate. As part of our ongoing search to identify tools that reliably predict the Chinese economy, we presented detailed evidence in a November 2017 Special Report2 that suggested monetary conditions, money, and credit growth have been among the most reliable predictors of Chinese “investment-relevant economic activity” (Chart 1). Chinese activity, in turn, has reliably led investable equity earnings growth, and we have therefore followed this framework closely when judging the economic outlook and the attendant implications for investment strategy. Chart 1Monetary Conditions, Money, And Credit Growth Reliably Lead Chinese Economic Activity
Monetary Conditions, Money, And Credit Growth Reliably Lead Chinese Economic Activity
Monetary Conditions, Money, And Credit Growth Reliably Lead Chinese Economic Activity
Given that financial markets typically lead turning points in economic activity, many market participants have incorrectly suggested that the bottom in Chinese stocks in late-October reflected prescient expectations of a durable re-acceleration in Chinese credit growth. Rather, a detailed examination of the events of the past year highlights that the opposite is true: global investors, the most influential “buyer” of Chinese investable stocks, materially lagged or ignored important developments in leading economic indicators and focused instead on a relatively less important factor for the economy – the Sino/U.S. trade war. Two important pieces of evidence support this point: We prominently discussed the risk that a trade war would pose to China’s economy in the first-half of 2018,3 but we underscored numerous times that this risk was on top of an ongoing and much more concerning slowdown in leading indicators for China’s industrial sector. By June of last year our leading indicator for the Li Keqiang index had been in a downtrend for 16 months straight (Chart 2), and yet investors only sold Chinese investable stocks once President Trump began imposing tariffs against Chinese exports to the U.S. We placed Chinese stocks on downgrade watch at the end of March 2018,4 well in advance of the selloff versus global stocks, and deftly triggered the downgrade on June 20.5 Relative to the global benchmark, November 2018 represented the largest month of relative performance for Chinese investable stocks. At that time, there was zero credible evidence to suggest that a credit upturn was underway; in fact, money and credit growth weakened on a sequential basis for most of Q4. It is true that monetary policy eased significantly following the imposition of U.S. tariffs in June, but given the extent of the decline in interbank rates, this would have led to a bottom in relative performance in July or August if investors were willing to assume that China’s monetary transmission mechanism would work without impairment. November 2nd marks the clear inflection point for Chinese investable stocks and our BCA Market-Based China Growth Indicator (Chart 3), and in our view this proves beyond a doubt that investors have been solely focused on trade: on that day, news broke that President Trump wanted to make a deal with Xi Jinping at the G20 meeting in Argentina later that month, and had instructed aides to begin “drafting terms”.6 Chart 2Until Tariffs Arrived, Investors Completely Ignored The Decline In Leading Indicators
Until Tariffs Arrived, Investors Completely Ignored The Decline In Leading Indicators
Until Tariffs Arrived, Investors Completely Ignored The Decline In Leading Indicators
Chart 3It Was News Of A Trade Deal That Caused A Bottom In China-Related Assets
It Was News Of A Trade Deal That Caused A Bottom In China-Related Assets
It Was News Of A Trade Deal That Caused A Bottom In China-Related Assets
Besides recommending a tactical overweight stance on December 5,7 we generally failed to forecast and position for a meaningful détante in the trade war, and we acknowledge that this contributed to a period of missed potential outperformance. But our research suggests that a trade deal would have been irrelevant had the drivers of China’s relevant economic activity continued to deteriorate, and investors had no concrete signs to suggest otherwise prior to the release of the January total social financing data on February 15 (Chart 4). We conservatively forecast high single-digit relative returns versus global stocks, on the order of 6-8%. There is even more upside potential in an optimistic scenario. Chart 4Before February 15, There was No Basis To Confidently Project An Upturn In Credit
Before February 15, There was No Basis To Confidently Project An Upturn In Credit
Before February 15, There was No Basis To Confidently Project An Upturn In Credit
Starting on February 15, investors did have a legitimate macro fundamental basis to go overweight Chinese stocks. We responded to the January data by placing Chinese stocks on upgrade watch,8 but we hesitated to move to an outright cyclical overweight at that time due to several still-present risks (discussed below) and out of concern that the sheer magnitude of the spike in credit could cause a regulatory response, discreet or otherwise, that would constrain credit growth in future months. The public spat between Premier Li Keqiang and the PBOC over whether the January credit spike represented “flood irrigation-style” stimulus and the disappointing February credit data were both emblematic of these concerns, but ultimately the March credit data has confirmed that a significant credit expansion is underway. This has indeed raised the odds of a major credit overshoot, although we reiterate below why policymakers are likely to remain reluctant to allow one to occur. Q: Chinese investable stocks have already rallied 22% year-to-date in US$ terms; domestic stocks are up 37%. How much further upside can investors realistically expect? A: In an optimistic scenario, Chinese investable and domestic stocks have the potential to earn double-digit relative returns (12-15%) in US$ terms versus global stocks over the coming year. Conservatively, we expect high single-digit relative returns (6-8%). Chart 5 presents our earnings recession model for the MSCI China index. The recent improvement in credit, forward earnings momentum, and the new export orders component of the official manufacturing PMI have already caused the model probability to peak. The dotted line shows that the odds of a contraction in earnings over the coming year are set to fall very sharply if credit even just continues on a moderate expansion path, and assuming that the current values of the remaining model predictors stay constant. Chart 6 shows that while there has been an earnings “response” to the ongoing economic slowdown in China, the response has so far been less intense than what might be expected. While this raises a near-term risk for Chinese stocks if Q1 & Q2 earnings disappoint (see below), it also implies that the level of 12-month trailing earnings may not trend lower over the coming year. Chart 5The Odds Of An Earnings Decline Over The Next Year Have Peaked And Will Fall Further
The Odds Of An Earnings Decline Over The Next Year Have Peaked And Will Fall Further
The Odds Of An Earnings Decline Over The Next Year Have Peaked And Will Fall Further
Chart 6The 'Response' Of Earnings To A Slowing Economy Has Been Less Intense Than Expected
The 'Response' Of Earnings To A Slowing Economy Has Been Less Intense Than Expected
The 'Response' Of Earnings To A Slowing Economy Has Been Less Intense Than Expected
If Chinese earnings are largely stable over the next year, we think it is reasonable to expect that investable Chinese stock prices will re-approach or fully return to their early-2018 high. We noted in our March 27 Weekly Report that China’s potential to command a higher multiple than global stocks is probably capped barring a major structural improvement in earnings growth,9 but Chart 7 highlights that Chinese stocks were still cheaper than their global counterparts at their peak early last year. Chart 7Even At Their 2018 High, Chinese Stocks Were Cheaper Than Global Stocks
Even At Their 2018 High, Chinese Stocks Were Cheaper Than Global Stocks
Even At Their 2018 High, Chinese Stocks Were Cheaper Than Global Stocks
It is true that the multiple expansion that occurred for Chinese stocks in 2016 and 2017 was quite large, but in our view this was due to the index addition and growth of technology companies with potential structural growth stories (such as the “BAT” stocks) rather than due to a significant decline in the risk premium assigned to Chinese stocks. These firms are still present in the investable index, and we have no reason to believe that investors over the coming year will perceive their structural earnings potential to be any different than was the case early last year, which suggests that a forward P/E ratio of 14 to 14½ is again achievable. Domestic equities do not directly benefit from the “BAT effect”, but their realized earnings growth has been somewhat superior than the investable index over the past few years. In effect, we have no strong reasons to argue against a return of both domestic and investable forward multiples back to levels seen in early-2018. Chart 8 highlights that a return to these levels would imply a relative price return of about 12% for investable stocks and 14-15% for domestic stocks, in US$ terms. Several risks (highlighted below) underscore the possibility that Chinese stocks will trend higher but not fully return to their early-2018 levels over the coming year. Given this, we conservatively forecast high single-digit relative returns versus global stocks, on the order of 6-8%. As a final point, for investors focused on A-shares, we should note that our domestic equity call is based on the MSCI China A Onshore index, not the CSI 300 or the FTSE/Xinhua A50 index. While the former very closely tracks the latter two, Chart 9 highlights that the CSI 300 and the A50 have rebounded closer to their early-2018 highs than the MSCI China A Onshore index, suggesting that there is somewhat less upside potential for the former than the latter. Chart 8There Is Meaningful Further Upside Potential For Chinese Stocks Vs. Global
There Is Meaningful Further Upside Potential For Chinese Stocks Vs. Global
There Is Meaningful Further Upside Potential For Chinese Stocks Vs. Global
Chart 9A-Shares: Favor MSCI Indexes Over The CSI300 And The A50
A-Shares: Favor MSCI Indexes Over The CSI300 And The A50
A-Shares: Favor MSCI Indexes Over The CSI300 And The A50
Q: What specific trades would you recommend as a result of your change in stance towards Chinese stocks? A: We are making five changes to our trade book, four of which are directly linked to our upgrade recommendation. In addition, we are closing another trade related to iron ore, given that prices have risen to a multi-year high. We are opening the following new trades in response to our recommendation to upgrade Chinese stocks: Open long MSCI China Index / short MSCI All Country World Index (US$) Open long MSCI China A Onshore Index / short MSCI All Country World Index (US$) Open long MSCI China Growth Index / short MSCI All Country World Index (US$) Regarding the latter trade, we noted in a previous report that value stocks have been responsible for more of the rally in China’s investable market versus the global average than their growth peers, and Chart 10 highlights that a long China growth / short broad market trade is strongly correlated with China’s relative performance trend versus global stocks. This means that a long MSCI China Growth Index / short MSCI All Country World Index trade represents a higher octane version of our long MSCI China Index position, which we offer as a riskier trade for investors seeking maximum upside potential in response to a cyclical recovery in China’s economy. Chart 10China Growth: A High Octane Version Of The MSCI China Index
China Growth: A High Octane Version Of The MSCI China Index
China Growth: A High Octane Version Of The MSCI China Index
In addition to these new trades, we are closing the following two existing positions in our trade book: Long MSCI China Low-Beta Sectors / short MSCI China trade, initiated on June 27, 2018 and closed at a modest loss of 0.7% Long September 2019 iron ore futures / short September 2019 steel rebar futures trade initiated on October 17, 2018 and closed at a substantial gain of 22% We initiated our low-beta sectors position soon after we downgraded Chinese stocks in June of last year, which acted as a defensive trade for investors to play while waiting out a selloff in Chinese relative performance. The profit from the trade peaked at approximately 11% in early-October, but has since given back most of its gains. Lastly, we are closing our iron ore / steel rebar pair trade to lock in a healthy profit from the position. An improvement in Chinese economic growth would typically be bullish for iron ore prices, but they have recently surged to a multi-year high in response to supply restrictions. This implies that stronger demand over the coming 6-12 months may not necessarily be positive for prices if it is accompanied by easier supply-side conditions. Q: What are the risks facing Chinese relative equity performance over the coming year? A: A collapse in the trade talks or an underwhelming deal, a lagged and series decline in earnings per share, a sharp slowdown in credit growth after a trade deal is signed, and a meaningful lag between the upturn in credit and an improvement in Chinese “hard data”. There are four non-trivial risks to a bullish relative stance towards Chinese stocks over the coming year. In general, these scenarios pose a risk to the magnitude of an uptrend in Chinese relative performance, but in some cases could prevent Chinese relative performance from trending higher over the coming year (and thus bear monitoring). There are still four non-trivial risks to a bullish relative stance towards Chinese stocks over the coming year. The trade deal between the U.S. and China falls through or substantially underwhelms. Despite signs continuing to point to the likelihood of a deal, a meaningful breakdown in trade talks or an underwhelming deal clearly have the potential to derail an uptrend in Chinese relative performance given that global investors have (incorrectly) treated the conflict as the primary risk factor facing the Chinese economy. A full resumption of the trade war would definitely cause Chinese stocks to actively underperform until evidence presented itself that the inevitable policy response is stabilizing economic activity. An underwhelming deal would probably weigh on the magnitude of China’s outperformance, but would probably not constitute a threat on its own to an uptrend in relative performance unless the “deal” did not result in a significant removal of tariffs (which, to us, is the point of China participating in the negotiations in the first place). Chinese earnings per share decline significantly from current levels. We noted in Chart 6 on page 6 that the earnings “response” to the ongoing economic slowdown in China has been less intense than we expected. Our earnings recession model suggests that the odds of a contraction in earnings over the coming 12 months has fallen meaningfully, but that does not rule out further near-term weakness stemming from the slowdown in activity that has already occurred. Chart 11Any Further Weakness In EPS Growth Should Be Temporary
Any Further Weakness In EPS Growth Should Be Temporary
Any Further Weakness In EPS Growth Should Be Temporary
We noted earlier that Chinese economic and financial market oscillations have been highly disparate since 2010 (when the economy experienced a clear structural shift), and as such we are unable to confidently predict the magnitude of a decline in EPS in response to a given amount of weakness in China’s old economy. For now, the meaningful uptick in net earnings revisions as well as the stabilization in forward EPS momentum (Chart 11) suggests that any further weakness in EPS growth will be temporary, but a larger or more prolonged decline should be acknowledged as a serious risk to our stance. Chinese credit growth slows meaningfully after a U.S./China trade deal is signed. To the extent that Chinese policymakers are still serious about preventing significant further leveraging, it is possible that the recent pace of credit growth will slow following the signing of a trade deal. This could occur because of a shift to tighter monetary policy, or due to the use of informal “administrative controls” to limit the pace of further lending. Chart 12 highlights that the pace of credit growth in the first quarter, if sustained, would actually imply a credit overshoot; our recommendation to upgrade Chinese stocks was based on the assumption of a moderate credit expansion, and thus we would not be surprised (or worried) if the pace of credit growth slows somewhat. However, a more meaningful slowdown, particularly if coupled with signals from policymakers that a much slower pace of growth is desired, could pose a risk to our stance. A recovery in China’s “hard data”, i.e. its coincident activity measures, meaningfully lags the pickup in credit growth. The March credit data has made us sufficiently confident that a rebound in Chinese investment-relevant economic activity is forthcoming, but it is difficult to pinpoint exactly when the data will bottom and whether further near-term weakness is likely. On the latter point, we noted in our April 3 Weekly Report that coincident economic activity sharply converged in January and February with our leading indicator for China’s economy (shown in Chart 1 on page 2), as most if not all of the previously beneficial tariff front-running effect washed out of the data.10 This implies that future changes in activity measures are now more likely to reflect actual changes in underlying economic circumstances, but a lagged response may still occur and could weigh on investor sentiment towards Chinese stocks over the coming few months. Q: What is your best estimate as to when investors can expect to see a pickup in China’s “hard” economic data? A: China’s activity data is likely to bottom between now and the middle of the year, implying that activity will pickup in 2H2019. Chart 13 presents an average correlation profile of our BCA Li Keqiang leading indicator and its main credit component (adjusted total social financing, “TSF”, as a share of GDP) with four activity measures: 1) the Bloomberg Li Keqiang index, 2) nominal manufacturing output, 3) nominal total import growth in US$, and 4) nominal total import growth in RMB. Values to the left of the zero line show that the leading indicator / TSF as a share of GDP tend to lead the four activity measures, with the x-axis values showing by how many months. Chart 12Q1 Credit Growth, If Sustained, Would Lead To An Overshoot
Q1 Credit Growth, If Sustained, Would Lead To An Overshoot
Q1 Credit Growth, If Sustained, Would Lead To An Overshoot
Chart 13Our Indicators Tend To Lead Actual Economic Activity By 4-6 Months
Our Indicators Tend To Lead Actual Economic Activity By 4-6 Months
Our Indicators Tend To Lead Actual Economic Activity By 4-6 Months
China’s activity data is likely to bottom between now and the middle of the year. The chart suggests that our predictors tend to lead actual economic activity by 4-6 months on average, depending on the predictor and the activity measure in question. Our LKI leading indicator technically bottomed in June of last year, although the rise has since been narrowly-based and it has retreated since October. TSF as a share of GDP clearly bottomed in December, which implies that China’s activity data is likely to bottom between now and the middle of the year. This is consistent with our view that the global economy will improve in the second half of the year, as well as our recommendation to overweight Chinese stocks on a cyclical basis. The risk, as noted above, is that investors react negatively to any further weakness in China’s measures of economic activity before they durably bottom. Q: Final question – In your list of potential risks facing Chinese relative equity performance, you cited the issue of whether policymakers are serious about preventing significant further leveraging. It seems as if they are stepping away from that. Will they, and is this fundamentally justified? A: For now, Chinese policymakers have chosen to prioritize growth, out of fear that the economy will decelerate significantly and possibly spiral out of control. But we are unconvinced that a shift back to controlling leverage is out of the question over the coming year. Policymakers have good economic reasons to try and shift China’s economy away from extremely high rates of investment towards more consumption, and they are likely to see the act of restraining credit growth as furthering this goal. Arguably, this is one of the most important questions facing global investors over both cyclical and secular time horizons, and it is likely to feature prominently in our research over the coming year. The question of the sustainable growth rate of China’s debt is a controversial one, even among BCA strategists. While it is by no means a conclusive answer, we tackled the question in our October 31 Weekly Report,11 and came down on the side that China’s policymakers have good economic reasons to try and shift China’s economy away from extremely high rates of investment towards more consumption. To the extent that attempts to restrain credit growth further this goal, our sense is that it is more wisdom than folly. We noted three key points in our October report: First, while there is a strong empirical cross-country relationship between average rates of investment over the past half-century and the level of real per capita GDP today, that relationship also shows that China’s current rate of investment is nearly off the scale and thus probably cannot be sustained. Second, in 2014, based on the definition of the data from the Penn World Table (GDP share of gross capital formation at current purchasing power parity), China had maintained its investment share above 30% for 12 years. At first blush, there appears to be some precedent suggesting that China’s outsized investment run can go on for longer: among the 80 countries with data available since 1950, 14 of them have experienced a longer continuous run of investment as a share of GDP. However, Chart 14 shows that most of these concurrent experiences occurred in the 1960s and 1970s, when global exports as a share of GDP were rising from a very low base. This implies that historical examples of outsized investment runs have largely reflected export-driven catch-up stories, which bodes poorly for China’s ability to continue to invest at its recent massive scale given that global exports to GDP appear to have peaked. Chart 14High And Sustained Rates Of Investment Have Been Driven By Exports
High And Sustained Rates Of Investment Have Been Driven By Exports
High And Sustained Rates Of Investment Have Been Driven By Exports
Third, the historical relationship between investment and real per capita GDP captures the potential gains of profitable and rational investment (the accumulation of a “useful” stock of capital). But an unfortunate reality facing savers is that while one can certainly choose to save or invest, one cannot necessarily choose the accompanying rate of return. If China invests heavily at very low or negative rates of return, the idea that continued heavy investment will lead China out of the middle-income trap is very likely wrong. On the third point, there is good evidence to suggest that the marginal gains from investment in China have been falling. The private sector debt-to-GDP ratio features prominently in the case against profitable investment in China: despite a massive rise in investment and debt from 2002-2007, the ratio barely rose, because this debt was used to accumulate capital that verifiably delivered nominal GDP growth (Chart 15). Yet following 2010 the ratio rose sharply, implying that the returns from the investment that has taken place over the past decade have been (at least so far) considerably lower than those of the prior decade. Also, we noted in our August 29 Special Report that state-owned enterprises (SOEs) have accounted for a sizeable portion of the private sector leveraging that occurred after 2010,12 and that the marginal net return on borrowed funds for SOEs has become negative (Chart 16). A gap between the cost/return on borrowed funds strongly implies that the investment channeled through SOEs over the past several years does not represent, on balance, the accumulation of useful capital. Chart 15A Rise In Debt-To-GDP Inherently Implies That Investment Is Increasingly Unproductive
A Rise In Debt-To-GDP Inherently Implies That Investment Is Increasingly Unproductive
A Rise In Debt-To-GDP Inherently Implies That Investment Is Increasingly Unproductive
Chart 16Strong Evidence Against Productive SOE Investment
Strong Evidence Against Productive SOE Investment
Strong Evidence Against Productive SOE Investment
We believe that Chinese policymakers now understand the risks posed with extremely high and prolonged rates of investment. Whereas most modern central banks characterize their monetary policy decisions within the context of a trade-off between growth and inflation, Chinese policymakers now appear to face a trade-off between growth and leveraging. For now, they have chosen growth, out of fear that the economy will decelerate significantly and possibly spiral out of control. But we are unconvinced that a shift back to controlling leverage is out of the question over the coming year, particularly after a trade deal has been signed with the U.S. As noted above, this is a non-trivial risk to our recommendation to overweight Chinese stocks over the coming year, and thus bears monitoring To be continued! Jonathan LaBerge, CFA, Vice President Special Reports jonathanl@bcaresearch.com Footnotes 1 Please see China Investment Strategy Special Alert, “Upgade Chinese Stocks To Overweight”, dated April 12, 2019, available at cis.bcaresearch.com. 2 Please see China Investment Strategy Special Report, “The Data Lab: Testing The Predictability Of China’s Business Cycle”, dated November 30, 2017, available at cis.bcaresearch.com. 3 Please see China Investment Strategy Weekly Reports, “The Question That Won’t Go Away”, dated April 18, 2018, “China: A Low-Conviction Overweight”, dated May 2, 2018, “The Three Pillars Of China’s Economy”, dated May 16, 2018, and “A Shaky Ladder”, dated June 13, 2018, available at cis.bcaresearch.com. 4 Please see China Investment Strategy Weekly Report, “Chinese Stocks: Trade Frictions Make For A Tenuous Overweight”, dated March 28, 2018, available at cis.bcaresearch.com. 5 Please see China Investment Strategy Special Report, “Downgrade Chinese Stocks To Neutral”, dated June 20, 2018, available at cis.bcaresearch.com. 6 Please see “Trump Said To Ask Cabinet To Draft Possible Trade Deal With Xi”, Bloomberg News, November 2, 2018. 7 Please see China Investment Strategy Weekly Report, “2019 Key Views: Four Themes For China In The Coming Year”, dated December 5, 2018, available at cis.bcaresearch.com. 8 Please see China Investment Strategy Weekly Report, “Dealing With A (Largely) False Narrative”, dated February 27, 2019, available at cis.bcaresearch.com. 9 Please see China Investment Strategy Weekly Report, “Ready, Aim, But Don’t Fire (Yet)”, dated March 27, 2019, available at cis.bcaresearch.com. 10 Please see China Investment Strategy Weekly Report, “China Macro and Market Review”, dated April 3, 2019, available at cis.bcaresearch.com. 11 Please see China Investment Strategy Weekly Report, “Is China Making A Policy Mistake?”, dated October 31, 2018, available at cis.bcaresearch.com. 12 Please see China Investment Strategy Special Report “Chinese Policymakers: Facing A Trade-Off Between Growth And Leveraging”, dated August 29, 2018, available at cis.bcaresearch.com. Cyclical Investment Stance Equity Sector Recommendations
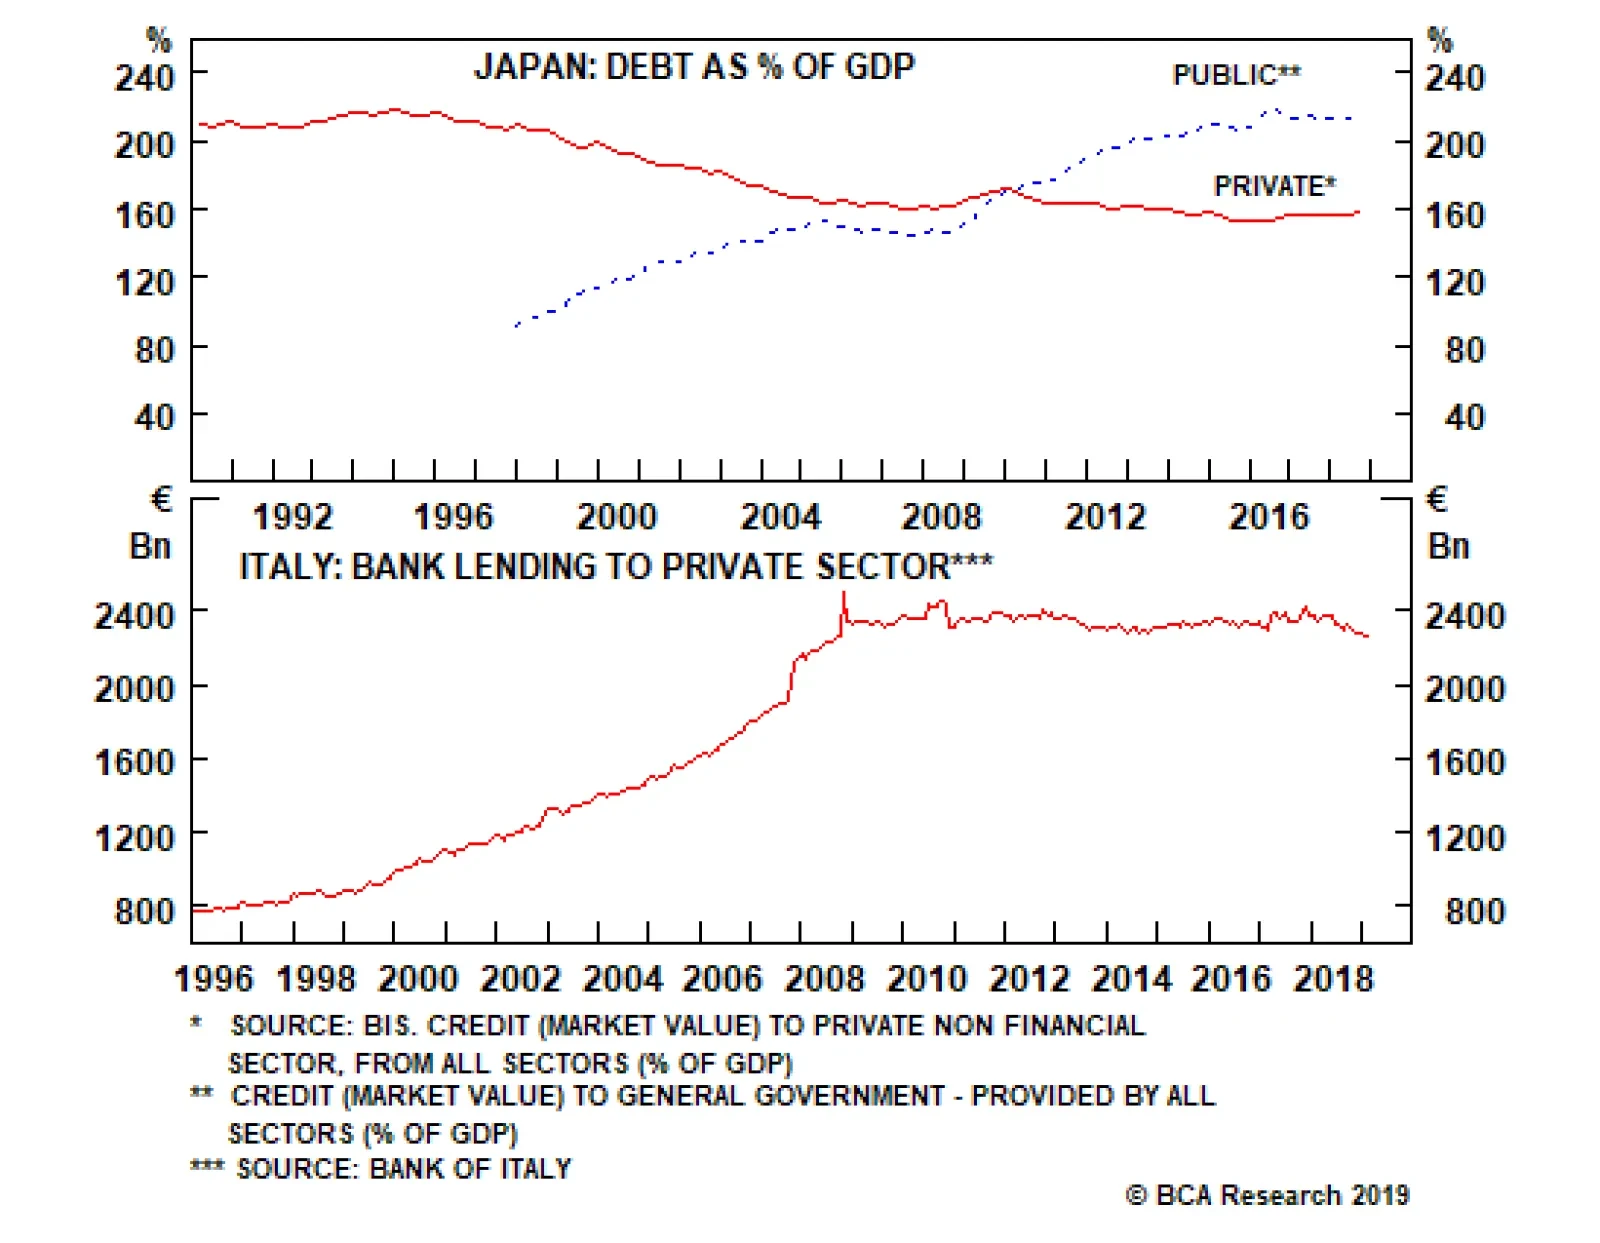
Welcome to Italy! After the 2008 global financial crisis, Italian banks’ balance sheets were left unrepaired and undercapitalized. For an individual bank whose solvency is impaired, the right thing to do is shrink its loan book relative to its equity…
Highlights As long as Chinese policymakers remain committed to their anti-pollution campaign, we believe high-grade iron ore prices will remain supported by demand from newer steelmaking technologies. A continuation of the much-needed consolidation in steelmaking capacity in China – wherein larger, more efficient operators force their less competitive rivals from the market – will reinforce this trend (Chart of the Week). Chart of the WeekChina's Steel Sector Will Continue Consolidating
China's Steel Sector Will Continue Consolidating
China's Steel Sector Will Continue Consolidating
Over time, the iron ore market will resemble other developed markets – e.g., crude oil – where higher- and lower-grades of the commodity are regularly traded against each other (Chart 2). As this develops, hedgers and investors will be able to fine tune exposures with greater precision, and prices from these markets will better reflect supply-demand fundamentals. The central and local governments also will have a valuable window on how policy is affecting fundamentals as they pursue their “blue skies” policies. We are initiating tactical spread, getting long spot high-grade 65% Fe vs. short spot 62% Fe at today’s Custeel Seaborne Iron Ore Price Index levels, consistent with our view.1 Chart 2Iron Ore Spread Markets Will Continue To Develop
Iron Ore Spread Markets Will Continue To Develop
Iron Ore Spread Markets Will Continue To Develop
Highlights Energy: Overweight. The Trump administration is reviving the Monroe Doctrine with its demand Russia remove its troops and advisors from Venezuela immediately, based on comments by the U.S. National Security Advisor John Bolton. In addition, a “senior administration official” said waivers for eight of Iran’s largest crude oil importers could be allowed to expire May 4, and that the administration is considering additional sanctions against Iran.2 Brian Hook, the special U.S. envoy for Iran, this week said three of eight countries granted waivers to U.S. sanctions agreed to take oil imports to zero.3 In a related development, OPEC crude oil output fell to a four-year low of 30.4mm b/d in March, according to a Reuters’s survey, as Venezuelan output falls and Saudi Arabia continues to over-deliver on its production cuts. Base Metals: Neutral. Codelco’s mined copper ore output fell to 1.8mm MT last year, down 1.6% vs. 2017 levels. This took refined output down almost 3% to 1.7mm MT, according to Metal Bulletin. The Chilean state-owned company cited reduced ore content in its mined production as a reason for the decline. MB’s copper treatment and refining charges index for the Asia Pacific region is at its lowest level since March 26, 2018, reflecting the lower concentrate supplies. We remain long spot copper on the back of low inventories, and an expected recovery in demand. Precious Metals: Neutral. Strength in equities has taken some of the luster off gold’s rally in the near term as investors move to increase stock exposures, but we continue to favor gold as a portfolio hedge and remain long. Agriculture: Underweight. USDA’s corn planting intentions report released last week came in much stronger than earlier estimates. Corn and soybeans traded lower following the release of the report, but recovered some this week on the back of positive news from Sino - U.S. trade talks. The USDA estimated farmers intended to plant 92mm acres of corn, and 85mm acres of soybeans this year. Ahead of the report, a Farm Bureau survey estimated corn and soybean acreage would average 91.3mm acres of corn and 86.2mm acres of beans. Trade Recommendations: Our 1Q19 trade recommendations were up an average of 41% at end-March (Quarterly Performance Table below). Including recommendations that were open at the beginning of 1Q19, the average was 31%. Feature China’s push to reduce pollution in its steelmaking sector will continue to support demand for Brazil’s high-grade ores – i.e., ores with iron (Fe) content higher than 65%. Transitory Brazilian iron ore supply losses notwithstanding, China’s push to reduce pollution in its steelmaking sector will continue to support demand for Brazil’s high-grade ores – i.e., ores with iron (Fe) content higher than 65%. This will allow the continued development of an active spread market, not unlike spread markets in commodities like oil, which will expand hedging and trading opportunities for producers, consumers and investors (Chart 2). Older, more polluting steelmaking technology in China will continue to be replaced by plants that favor Brazil’s high-grade ores, then Australia’s benchmark-type grades (62% Fe), then, as a last resort, the lower quality domestic ores. In a steelmaking market still suffering significant overcapacity, we expect policymakers will, at some point, discover the benefit of letting markets forces do the work of forcing older technology offline, as happened with the country’s domestically produced lower-quality iron ore, which has lower iron content and higher impurities than Brazilian and Aussie imports.4 We believe growth in China’s steel and steel products demand – hence iron ore demand – likely has peaked and is in the process of flattening or declining slightly, which will alter the composition of iron ore imports and tilt them in favor of high-grade Fe imports from Brazil over the next 3 - 5 years (Chart 3). This leveling off in steel demand growth will put a premium on more efficient technology to meet future demand, particularly with the pollution constraints that will, we believe, be an enduring feature of this market.5 Chart 3China's Steel Demand Growth Likely Has Peaked
China's Steel Demand Growth Likely Has Peaked
China's Steel Demand Growth Likely Has Peaked
Impurities found in lower-grade iron ore raise steelmaking costs by increasing unwanted mineral build-ups in blast furnaces, increase pollution and lower mills’ efficiency. With inventories re-building following the winter steelmaking hiatus in China, imports will continue to grow market share at the expense of indigenous lower-quality ores (Chart 4). Imports from Australia, which mostly price to the 62% Fe benchmark, will continue to grow, but we strongly believe that in China’s post-anti-pollution-campaign market, Brazilian imports will see growth increasing (i.e., the 2nd derivative) at a higher rate (Chart 5). Chart 4Chinese Iron Ore Inventories Fall Relative To Steel Production
Chinese Iron Ore Inventories Fall Relative To Steel Production
Chinese Iron Ore Inventories Fall Relative To Steel Production
Chart 5China's Brazil, Australia Import Growth Will Recover
China's Brazil, Australia Import Growth Will Recover
China's Brazil, Australia Import Growth Will Recover
These imports are lower in cost, and higher in quality than the domestic iron ore. This is particularly important when it comes to keeping costs under control – impurities found in lower-grade iron ore raise steelmaking costs by increasing unwanted mineral build-ups in blast furnaces, increase pollution and lower mills’ efficiency. Extended Output Cuts Favor High-Grade Ores The biggest reason supporting our view high-grade iron ores will continue to grow market share at the expense of lower-quality domestic supply and benchmark 62% Fe material is the recent behavior of the central government and local governments vis-a-vis pollution. Both have shown they are not averse to extending operating restrictions on high-polluting industrial plants, even in provinces where steelmaking is a large employer. Last year, major steel producing regions– Hebei, Jiangsu, Shandong, Liaoning – increased production during the winter months, likely driven by higher margins at the steelmakers (Chart 6). This indicates compliance with anti-pollution regulations fell significantly (Chart 7). In turn, this led to higher pollution, according to the latest available data from China’s National Environmental Monitoring Centre, which shows concentrations of particulate matter 2.5 micrometers or less in diameter (i.e., PM2.5) rose again this year (Chart 8). Chart 6Higher Margins, Higher Output
Higher Margins, Higher Output
Higher Margins, Higher Output
Chart 7
Consequently, Chinese authorities decided to tighten anti-pollution measures by extending production cuts beyond the heating season into 3Q and 4Q19.6 Furthermore, the top producing city, Tangshan, in the province of Hebei extended its most elevated level of smog alert on March 1 and deepened production cuts to 70% from 40%, with reported cases of complete operations being halted. Chart 8China's Pollution Is Increasing; Steelmaking Curbs Will Persist
China's Pollution Is Increasing; Steelmaking Curbs Will Persist
China's Pollution Is Increasing; Steelmaking Curbs Will Persist
Last month, Chinese Communist Party (CCP) officials in Hebei announced plans to cut steel production by 14mm MT this year and next. Going forward, China’s environment ministry said winter restrictions will be extended for a third year during the 2019-2020 winter period. As we argued last year, winter curbs likely will become a permanent feature of China’s steelmaking landscape. Combined with China’s steel de-capacity reforms, iron ore and steel markets will continue to evolve to a less-polluting presence in the country.7 As a consequence, IO grade and form differentials are now crucial input in our analysis.8 We believe a wider than usual premium will remain until new high-grades and pellets supplies come on line in the next few years. Credit Stimulus Vs. Battle For Blue Skies The reversal in China’s credit cycle and in the Fed’s monetary policy stance will be supportive of steel and iron ore prices going forward. In fact, our credit cycle proxy suggests global industrial activity will increase in the next few months (Chart 9).9 Additionally, our geopolitical strategists’ base case suggests a resolution of the Sino-U.S. trade war likely will occur this year. This will support EM income growth, which will stimulate commodity demand generally at the margin. Chart 9Upturn in China's Credit Cycle Will Support Iron Ore Prices
Upturn in China's Credit Cycle Will Support Iron Ore Prices
Upturn in China's Credit Cycle Will Support Iron Ore Prices
We believe China’s credit cycle bottomed in 1Q19 and that Chinese authorities will modestly increase stimulus in 2H19.10 As discussed previously, we do not expect this new round of stimulus to be as large as previous rounds; China’s economy is in better shape now than it was at the start of previous expansionary credit cycles, hence the magnitude of the stimulus needed to revive the economy is lower. Nonetheless, this stimulus will be sufficient to strengthen China’s and EM’s steel-intensive activities in the coming months. As long as China maintains its anti-pollution drive, high-grade iron ore will continue to grow market share. Historically, these sectors correlated positively with the 62% Fe content benchmark (Chart 10). However, the expected stimulus works against Beijing’s critically important battle for blue skies. A revival of China’s industrial activity would increase PM2.5 concentrations above targets. Chart 10China's Stimulus Will Stoke Iron Ore Demand
China's Stimulus Will Stoke Iron Ore Demand
China's Stimulus Will Stoke Iron Ore Demand
These constraints, we believe, mean China’s policymakers will have to incentivize steelmakers to favor lower-polluting high-grade iron ore (Fe > 65%), in order to maximize steel output subject to their emissions target. This will widen the form and grade premiums ahead of next year’s winter period. Bottom Line: As long as China maintains its anti-pollution drive, high-grade iron ore will continue to grow market share, as steelmakers upgrade their technology and inefficient mills are shuttered. This will favor Brazilian exports going forward, and we expect the rate of growth in these imports to increase. In line with our view, we are opening a long 65% Fe spot vs. a short 62% Fe spot position at tonight’s close. This is a tactical position, but could easily become a strategic recommendation. Robert P. Ryan, Senior Vice President Commodity & Energy Strategy rryan@bcaresearch.com Hugo Bélanger, Senior Analyst Commodity & Energy Strategy HugoB@bcaresearch.com Footnotes 1 This index is published by Beijing Custeel E-Commerce Co., Ltd. 2 We flagged this risk in our February 21, 2019, report entitled “The New Political Economy of Oil.” We noted the odds of a U.S. – Russia military confrontation are low, and that “the U.S. would revive the Roosevelt Corollary to the Monroe Doctrine, and that Russia and China most likely would concede Venezuela is within the U.S.’s sphere of influence, as neither intends to project the force and maintain the supply lines … a confrontation would require.” That said, there is always the risk such a confrontation could go kinetic, or that either or both sides could lunch a cyberattack to disable its adversary. The Roosevelt Corollary refers to U.S. President Theodore Roosevelt’s extension of the Monroe Doctrine at the beginning of the 20th century, which has been used by the U.S. to justify the use of military power in the Western Hemisphere. Our February 21 report is available at ces.bcaresearch.com, as is a Special Report on Venezuela published November 22, 2018, entitled “Venezuela: What Cannot Go On Forever Will Stop,” which discusses Venezuela’s debts to China and Russia, et al. See also “Exclusive: Trump eyeing stepped-up Venezuela sanctions for foreign companies – Bolton” and “Oil hits 2019 high on OPEC cuts, concerns over demand ease,” published by reuters.com March 29 and April 2, 2019, respectively. 3 Please see “Three importers cut Iran oil shipments to zero - U.S. envoy” published April 2, 2019, by reuters.com. 4 According to Platts, “at least half of China’s previous 300 million mt plus iron ore mining capacity has left the market for good.” Please see “China’s quest for cleaner skies drives change in iron ore market,” published January 30, 2019, by S&P Global Platts. CRU estimates average iron content in China’s ores is 30%, which means they must undergo costly upgrading to be useful to steelmakers. 5 Australian miners are expected to bring on significant volumes of high-grade iron ore beginning in 2022 - 23, with Fe content as high as 70%, according to the Department of Industry, Innovation and Science’s March 2019 Resources and Energy Quarterly. 6 Please see “Tangshan mulls output curbs for 2nd, 3rd quarters of 2019” published January 22, 2019, by metal.com. 7 Please see China to extend winter anti-smog measures for another year published March 6, 2019, by reuters.com. 8 Grade premium: The chemistry of iron ore supply varies widely in terms of Fe content. Higher Fe content reduces production cost and pollution per unit of steel output. The higher the quality, the higher the volume of steel produced relative to energy consumed. The current global benchmark iron ore is 62% Fe, but China’s evolution to a less-polluting steelmaking sector will raise the importance of higher-grade markets. Form premium: A steelmaker’s blast furnace typically consumes iron ore in pellets, fines or lumps combined with coking coal. Fines are the most common form of iron ore, and account for ~ 75% of total seaborn IO market. This form cannot be directly fed in the blast furnace and requires an extra sintering step. Sintering is highly polluting and coal-intensive process that compresses fines into a more useable form. This process is usually conducted on-site at steel mills. On the other hand, lumps and pellets are direct feedstock and therefore completely avoid the highly polluting sintering step. Both types of premium are primarily affected by environmental policies in consuming countries, coke prices and steelmills’ profitability. 9 Modeling historical iron ore prices remains difficult because of the short sample available for spot iron prices – i.e., the benchmark 62% Fe. Before 2009, iron ore prices were determined using a producer pricing system. Once a year, prices were negotiated by miners and steelmakers and would be fixed for the remaining of the year. Given that iron ore supply was plentiful relative to demand, prices were fairly stable and this mechanism was used for over four decades. The rapid rise of emerging economies – mainly China – during the 2000s forced the pricing system to adjust toward a spot-market pricing system. The short spot-price time series available for analysis increases the distortion of policy-driven exogenous shocks like China’s de-capacity and winter restriction policies. This makes it difficult to identify the underlying relationships between its price and potential explanatory variables, and forces us to rely on theory and analogous experience in other markets like crude oil. 10 Please see BCA Commodity and Energy Strategy Weekly Report titled “Bottoming Of China’s Credit Cycle Bullish For Copper Over Near Term,” published March 14, 2019. It is available at ces.bcaresearch.com Investment Views and Themes Recommendations Strategic Recommendations Tactical Trades Trade Recommendation Performance In 2019 Q1
Image
Commodity Prices and Plays Reference Table Trades Closed in 2019 Summary of Closed Trades
Image
Highlights Maintain a pro-cyclical stance for the time being – overweight equities versus bonds, long commodities, overweight industrial equities, and underweight healthcare equities. But be warned, absent a continued decline in the bond yield and/or oil price, short-term positive impulses on the economy will fade and even turn negative later in the year. Hence in the summer months, look for opportunities to take profits in these pro-cyclical positions. U.K. economy plays can outperform once a cross-party parliamentary majority is found for a course of action that leads to an orderly Brexit (or no Brexit). Feature At the end of last year, we made a bold prediction: economies and financial markets would follow the opposite path in 2019 compared to 2018. Specifically we pointed out that “through most of 2018, global growth was decelerating while inflation was accelerating. Now this configuration is flipping: global growth is rebounding while inflation is set to collapse… 2019 will present investors a mirror-image pattern to 2018” (Chart of the Week). Chart of the WeekWhy 2019 Is The Opposite Of 2018
Why 2019 Is The Opposite Of 2018
Why 2019 Is The Opposite Of 2018
Four months on, we are delighted to report that the mirror-image pattern is unfolding exactly as predicted. This year, stock markets are up sharply; bond markets have rallied; metal prices have made double-digit gains, growth-sensitive industrial shares are outperforming; while defensive healthcare shares are underperforming. All of these are the precise opposite of what happened in early 2018 (Chart 1-2 - Chart I-6). Chart I-2Equities: 2019 Is The Opposite Of 2018
Equities: 2019 Is The Opposite Of 2018
Equities: 2019 Is The Opposite Of 2018
Chart I-3Bonds: 2019 Is The Opposite Of 2018
Bonds: 2019 Is The Opposite Of 2018
Bonds: 2019 Is The Opposite Of 2018
Chart I-4Commodities: 2019 Is The Opposite Of 2018
Commodities: 2019 Is The Opposite Of 2018
Commodities: 2019 Is The Opposite Of 2018
Chart I-5Cyclicals: 2019 Is The Opposite Of 2018
Cyclicals: 2019 Is The Opposite Of 2018
Cyclicals: 2019 Is The Opposite Of 2018
Chart I-6Defensives: 2019 Is The Opposite Of 2018
Defensives: 2019 Is The Opposite Of 2018
Defensives: 2019 Is The Opposite Of 2018
Why 2019 Is The Opposite Of 2018 The basis for our bold prediction was twofold. We noted that China’s 6-month credit impulse “had gone vertical” (Chart I-7). Indeed, the rebound from the trough amounted to $500 billion (and still counting), equivalent to a near 1 percent shot in the arm for global GDP. Chart I-7China's 6-Month Credit Impulse Has Gone Vertical
China's 6-Month Credit Impulse Has Gone Vertical
China's 6-Month Credit Impulse Has Gone Vertical
We also argued back then that “a racing certainty for early 2019 is that headline inflation will collapse. This is because the plunge in the crude oil price is about to feed through into headline consumer price indexes. Inevitably, it will seep through into core inflation too, via the impact on energy dependent prices such as transport costs.” “Coming at a time that central banks have professed a much greater reliance on incoming data, we can deduce that central banks will find it hard to tighten policy in the face of weaker headline and core inflation prints. Crucially though, the ECB and BoJ were not planning on tightening policy anyway, so the plunge in reported inflation will be much more impactful on the Federal Reserve.” Lo and behold. China’s PMI has rebounded sharply, and the Fed has stopped hiking rates. Still, central banks’ enhanced ‘data-dependency’ carries perils. The high-profile hard data – such as CPI inflation and GDP growth prints – on which monetary policy ‘depends’ is a record of what happened in the past, sometimes the distant past. This year’s market moves are the precise opposite of what happened in early 2018. Hence, enhanced data-dependency means that central banks are now ‘driving by looking through the rear-view mirror’ rather than looking at the current terrain. In turn, monetary policy expectations are driving bond and equity market valuations. By contrast, equity market growth expectations are based on the here and now; they move in synch with economic activity in real-time, leading even the survey-based PMIs. This also solves the puzzle as to why bonds and equities can sometimes give conflicting messages. Last year, the configuration of accelerating inflation with decelerating global growth hit equities and with a lose-lose: heavy pressure on both valuations and growth expectations. Furthermore, when interest rates rise from low levels they undermine the support for elevated risk-asset valuations in a viciously non-linear way. Chart I-8In 2018, Higher Bond Yields Pressured Equity Valuations
In 2018, Higher Bond Yields Pressured Equity Valuations
In 2018, Higher Bond Yields Pressured Equity Valuations
At low interest rates, bond prices develop the same unattractive negative asymmetry as equities. Therefore, an extended period of ultra-low interest rates removes the need for an equity risk premium, and justifies sharply higher valuations for equities and other risk-assets. But in early 2018, as hawkish central banks pushed up 10-year global bond yield towards 2 percent, this process reversed viciously: bond prices lost their negative asymmetry, re-requiring an equity risk premium and sharply lower valuations for risk-assets at a time that growth expectations were also sliding (Chart I-8).1 By contrast, the early 2019 configuration of dovish central banks and accelerating short-term credit impulses has provided equities a ‘mirror-image’ win-win: a boost to both valuations and to growth expectations. What Happens Next In 2019? Chart I-9Headline Inflation Will Soon Tick Up
Headline Inflation Will Soon Tick Up
Headline Inflation Will Soon Tick Up
Understand that the all-important impulses to an economy do not come from the level of the bond yield, oil price, net exports, inventories, and so on. The impulse always comes from the change in these metrics. And as the metrics cannot decline (or rise) incessantly, impulses always fade and then reverse. The oil price has rebounded 30 percent from its recent lows. Necessarily, this means that headline inflation prints will soon stabilise or even tick up (Chart I-9). Furthermore, central banks’ abrupt pivot to dovish has already happened. It would be hard to repeat or continue such a move. As central banks react to the inevitably backward-looking hard data prints, our expectation is that bond yields will stabilise or even tick up. Will equity markets also react positively to the better economic data prints? Not necessarily. To repeat, equity markets’ growth expectations move in synch with economic activity in real-time, leading even the survey-based PMIs. Equity markets never wait for the backward-looking data prints. China plays are tracking its short-term credit impulse which has gone vertical (Chart I-10). Hence, in 2019 to date, U.K. mining stocks are already up 25 percent; the Shenzhen Composite is already up 40 percent! Chart I-10China Plays Have Already Surged
China Plays Have Already Surged
China Plays Have Already Surged
Still, the current win-win configuration can continue for a little while longer, given that a typical upswing in short-term credit impulses lasts around eight months. But be warned, absent a continued decline in the bond yield and/or oil price, short-term impulses will fade and even turn negative later in the year. The early 2019 configuration of dovish central banks and accelerating short-term credit impulses has provided equities a win-win. Hence, maintain a pro-cyclical stance for the time being – overweight equities versus bonds, long commodities, overweight industrial equities, and underweight healthcare equities. But our strong advice is: in the summer months, look for opportunities to take profits in all of these positions. When Will Brexit’s Groundhog Day End? We really would prefer not to talk about Brexit. It is not just that every day is Groundhog Day, every day is a shambolic Groundhog Day. Still, on a positive note this means that our investment strategy for Brexit has also remained a constant (Chart I-11). Chart I-11For Investors, Brexit Simplifies To A Binary Outcome
For Investors, Brexit Simplifies To A Binary Outcome
For Investors, Brexit Simplifies To A Binary Outcome
It is not sufficient for the U.K. parliament to express what it is against (a no-deal Brexit); parliament must express what course of action it is for, leading to an orderly Brexit, or no Brexit, and that this course of action must also be acceptable to the EU27. At that point, irrespective of the exact course of action – a customs union, Common Market 2.0, or a confirmatory referendum in which ‘remain’ is an option – buy the pound, the FTSE250, and U.K. homebuilder shares. Theresa May’s overture to engage in a national unity strategy with the Labour Party is a step in the right direction. In this regard, Theresa May’s overture to engage in a national unity strategy with the Labour Party is a step in the right direction, because it finally puts national interest above party interest. To be clear, Brexit has been trapped in Groundhog Day because there is insufficient support among Conservative and DUP MPs for a relationship with the EU27 that would: Protect the cross-border supply chains which are vital to so many U.K. businesses. Avoid a hard customs border on the island of Ireland or between Ireland and Britain. Deliver on the narrow 52:48 vote to leave the EU, which was driven by a desire to control migration and the supremacy of the European Court of Justice; rather than a desire to strike independent trade deals, which is irrelevant for a majority of voters. The ray of light is that there is potentially a broader cross-party parliamentary majority for a course of action that would meet the above three conditions. Once it is found, U.K. economy plays can look forward to the “sunlit uplands”. Fractal Trading System* In line with the main body of this report, we continue to see evidence that the recent rally in bonds is technically extended. Accordingly, this week’s recommended trade is to short the 10-year OAT. The profit target is 1.3 percent with a symmetrical stop-loss. In other trades, short INR/PKR hit its 3 percent stop-loss and is now closed, leaving five open positions. For any investment, excessive trend following and groupthink can reach a natural point of instability, at which point the established trend is highly likely to break down with or without an external catalyst. An early warning sign is the investment’s fractal dimension approaching its natural lower bound. Encouragingly, this trigger has consistently identified countertrend moves of various magnitudes across all asset classes. Chart I-12
Short the 10-Year OAT Long SEK/NOK
Short the 10-Year OAT Long SEK/NOK
The post-June 9, 2016 fractal trading model rules are: When the fractal dimension approaches the lower limit after an investment has been in an established trend it is a potential trigger for a liquidity-triggered trend reversal. Therefore, open a countertrend position. The profit target is a one-third reversal of the preceding 13-week move. Apply a symmetrical stop-loss. Close the position at the profit target or stop-loss. Otherwise close the position after 13 weeks. Use the position size multiple to control risk. The position size will be smaller for more risky positions. * For more details please see the European Investment Strategy Special Report “Fractals, Liquidity & A Trading Model,” dated December 11, 2014, available at eis.bcaresearch.com Dhaval Joshi, Chief European Investment Strategist dhaval@bcaresearch.com Footnotes 1 Please see the European Investment Strategy Weekly Report “Risk: The Great Misunderstanding Of Finance”, October 25, 2018 available at eis.bcaresearch.com Fractal Trading System Recommendations Asset Allocation Equity Regional and Country Allocation Equity Sector Allocation Bond and Interest Rate Allocation Currency and Other Allocation Closed Fractal Trades Trades Closed Trades Asset Performance Currency & Bond Equity Sector Country Equity Indicators Bond Yields Chart II-1Indicators To Watch - Bond Yields
Indicators To Watch - Bond Yields
Indicators To Watch - Bond Yields
Chart II-2Indicators To Watch - Bond Yields
Indicators To Watch - Bond Yields
Indicators To Watch - Bond Yields
Chart II-3Indicators To Watch - Bond Yields
Indicators To Watch - Bond Yields
Indicators To Watch - Bond Yields
Chart II-4Indicators To Watch - Bond Yields
Indicators To Watch - Bond Yields
Indicators To Watch - Bond Yields
Interest Rate Chart II-5Indicators To Watch - Interest Rate Expectations
Indicators To Watch - Interest Rate Expectations
Indicators To Watch - Interest Rate Expectations
Chart II-6Indicators To Watch - Interest Rate Expectations
Indicators To Watch - Interest Rate Expectations
Indicators To Watch - Interest Rate Expectations
Chart II-7Indicators To Watch - Interest Rate Expectations
Indicators To Watch - Interest Rate Expectations
Indicators To Watch - Interest Rate Expectations
Chart II-8Indicators To Watch - Interest Rate Expectations
Indicators To Watch - Interest Rate Expectations
Indicators To Watch - Interest Rate Expectations
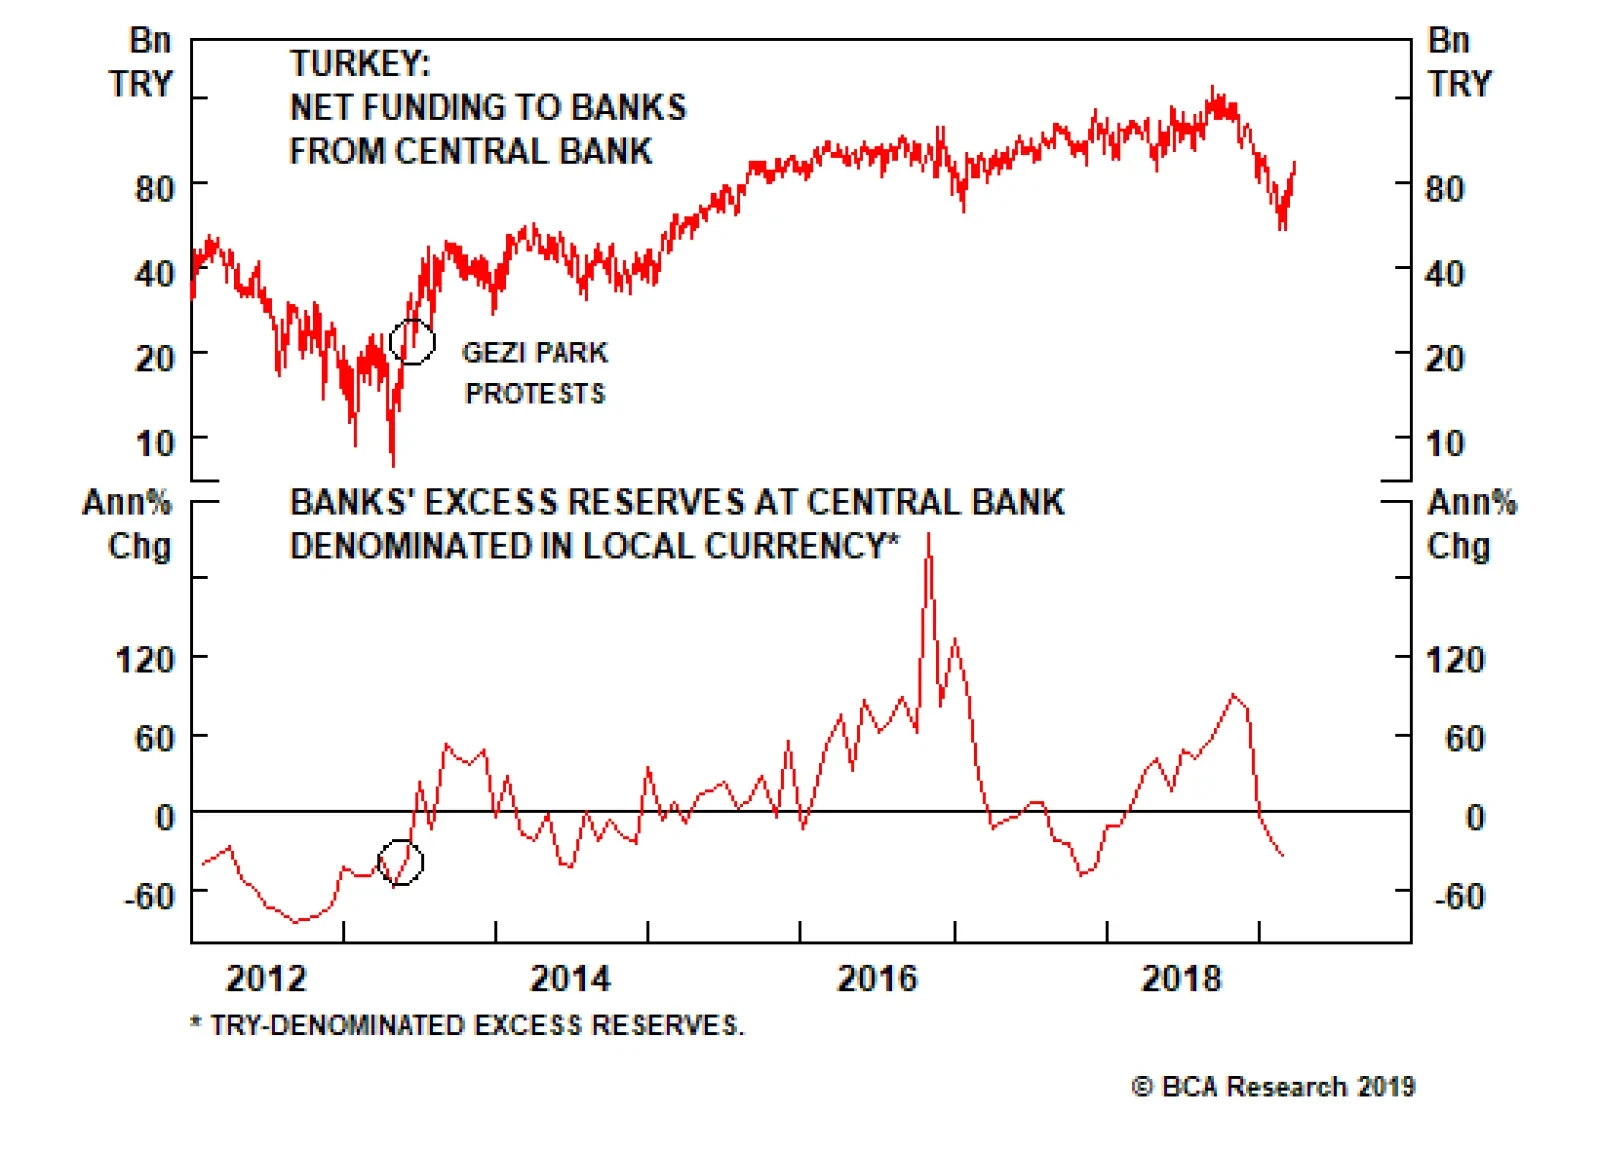
While losing the local elections will not upset the balance in parliament, it is a rebuke to Erdogan over his economic policy and a warning to the AKP for the future. Erdogan does not face general elections until 2023. But judging by his response to the first…
Highlights The meaningful improvement in the March manufacturing PMIs (both Caixin and official) all but confirms that a rebound in Chinese economic activity is forthcoming. The odds that investors will look through any near-term economic and/or earnings weakness are directly related to the likely magnitude of the expansion in credit over the coming year, and our research points to the need for the recent pace of credit growth to be sustained in order to stabilize the outlook for earnings. Barring a substantial breakdown in trade talks between China and the U.S., a strong March total social financing release would likely tip the scales in favor of a recommendation to increase Chinese investable stock exposure within a global equity portfolio to overweight. Feature Tables 1 and 2 highlight key developments in China’s economy and its financial markets over the past month. On the growth front, coincident economic activity has sharply converged with our leading indicator for China’s economy, which we highlighted was likely to occur. Looking forward, while we await the March total social financing release later this month for a better sense of the likely magnitude in credit growth over the coming year, the meaningful improvement in the March manufacturing PMIs (both Caixin and official) all but confirms that a rebound in Chinese economic activity is forthcoming. Table 1China Macro Data Summary
China Macro And Market Review
China Macro And Market Review
Table 2China Financial Market Performance Summary
China Macro And Market Review
China Macro And Market Review
The likely magnitude of the uptrend in credit is important from an investment strategy perspective, as we have highlighted that weak coincident activity raises the risk of a lagged but meaningful further decline in Chinese earnings per share over the coming few months. The odds that investors will look through any near-term economic and/or earnings weakness are directly related to the ultimate size of the expansion in credit, and our research points to the need for the recent pace of credit growth to be sustained in order to stabilize the outlook for earnings. But the bottom line for investors is that we recently placed Chinese investable stocks (i.e. the MSCI China Index) on upgrade watch, and the March PMI is a step in the direction of a recommendation to increase equity allocation to overweight within a global stock portfolio. Investors should closely watch the March total social financing data (due to be released in mid-April); a strong release, barring a substantial breakdown in trade talks between China and the U.S., would likely tip the scales in favor of a move to overweight. In reference to Tables 1 and 2, we provide several detailed observations concerning developments in China’s macro and financial market data below: Chart 1 shows that coincident economic activity sharply converged in January and February with our leading indicator for China’s economy, as we had argued many times over the past several months was likely to occur. In our view, most if not all of the previously beneficial tariff front-running effect has probably washed out of the data, implying that future changes in activity measures are now more likely to reflect actual changes in underlying economic circumstances. Chart 1A Convergence That We Predicted
A Convergence That We Predicted
A Convergence That We Predicted
The components of our LKI leading indicator continue to point to divergent outcomes for the Chinese economy (Chart 2). Monetary conditions have weakened somewhat over the past few months, but remain quite easy relative to history. The credit components bounced in January but are still weak relative to their history, whereas money growth is extremely weak and has shown no sign of improvement. Barring a major rise in the RMB, a continuation in the recent pace of credit growth would likely be enough to cause our leading indicator to trend higher, particularly if money growth begins to pick up. Chart 2An Uptrend In Credit Growth Will Push Our Leading Indicator Higher
An Uptrend In Credit Growth Will Push Our Leading Indicator Higher
An Uptrend In Credit Growth Will Push Our Leading Indicator Higher
We noted in our March 13 Weekly Report that growth in residential floor space started was unsustainably strong,1 and the January/February data update confirmed this view. Growth in starts has decelerated by 10 percentage points from December to February, highlighting that housing construction cannot permanently decouple from sales volume and that a further deceleration is possible unless sales growth (which is currently negative) begins to pick up. The PMI rebound in March registers as one of the most important macro developments since the release of the January total social financing data. Both the Caixin and official manufacturing PMI data came in solidly positive for March, rising relative to their February values and surprising consensus expectations to the upside. Chart 3 highlights that the March Caixin data has pushed the series above its post-2010 median, whereas the official PMI has risen to its 40th percentile from essentially its lowest point in the past decade. In our view, the PMI rebound registers as one of the most important macro developments since the release of the January total social financing data, in that it all but confirms that a rebound in (still depressed) Chinese economic activity is forthcoming. Chart 3A Very Sharp Rebound In Both Manufacturing PMIs
A Very Sharp Rebound In Both Manufacturing PMIs
A Very Sharp Rebound In Both Manufacturing PMIs
Despite having rallied significantly from their low, Chinese stocks (both investable and domestic) remain approximately 20% below their early-2018 high in US$ terms. This is in contrast to global stocks, which are only 7% shy of their 2018 high. If Chinese equities can avoid a major earnings recession, this discrepancy underscores that there is further upside for stock prices in relative terms over the coming 6-12 months. For the A-share market, however, Chart 4 highlights a potential near-term roadblock for continued outperformance versus global stocks. The chart highlights that the relative performance trend is now bumping up against the upper end of a declining trend channel that has been in place for almost 4 years, a bearish pattern that is in stark contrast to that of the investable market. Conversely, a break outside of this channel would warrant attention, as it could signal a secular change in trend for the domestic equity market. Chart 4Is The Four Year Downtrend In A-Share Relative Performance Over?
Is The Four Year Downtrend In A-Share Relative Performance Over?
Is The Four Year Downtrend In A-Share Relative Performance Over?
Chart 5 highlights that the strange combination of consumer staples and real estate stocks have been the clear sector winners over the past month, both in the investable and domestic markets. Signs of stabilization in consumer spending explains staples outperformance, but the rally in real estate stocks is more difficult to explain given the weakness in housing fundamentals referenced above. For now, our bias is to believe that real estate stocks are benefitting as a value play, given their deep discount relative to both their respective broad markets and their global peers. Chart 5A Sharp Rebound In Staples And Real Estate Stocks
A Sharp Rebound In Staples And Real Estate Stocks
A Sharp Rebound In Staples And Real Estate Stocks
China’s 7-day interbank repo rate has increased somewhat over the past month, raising speculation that the PBOC may soon proceed with a generalized cut to the reserve requirement ratio. In our view, the trend in the 3-month interbank repo rate has been more important over the past few years, as it has closely correlated since late-2016 with average interest rates in the economy and sharp declines in the rate last year preceded the pickup in credit growth observed in January. Still, additional easing from the PBOC could be significant for market participants, as it would likely be greeted positively by investors and could further stoke the belief that Chinese credit growth may overshoot to the upside over the coming 6-12 months. A stronger RMB versus the euro will be welcome news for European exporters. In contrast to a significant improvement in domestic equity prices and investor sentiment, Chinese onshore corporate bond spreads have actually inched higher over the past month. While the rise has been comparatively small (8 basis points), spreads now stand at roughly a third of their 12-month range. A rising trend in onshore corporate bond spreads is not consistent with a slower pace of defaults over the coming 6-12 months, suggesting that at least some headwinds facing the Chinese economy will remain over the coming year if the recent trend in spreads continues. While CNY-USD has been largely flat over the past month, CNY-EUR has continued to rise and is now within striking distance of its 2018 high (Chart 6). This is not likely welcome news for Chinese exporters with close ties to Europe, but it may help provide a much-needed trade boost to the European economy over the coming year, whose manufacturing PMI has recently fallen to a six-year low. Chart 6A Stronger CNY-EUR Cross Will Help Boost Chinese Imports From Europe
A Stronger CNY-EUR Cross Will Help Boost Chinese Imports From Europe
A Stronger CNY-EUR Cross Will Help Boost Chinese Imports From Europe
Jonathan LaBerge, CFA, Vice President Special Reports jonathanl@bcaresearch.com Footnotes 1 Please see China Investment Strategy Weekly Report, “China Macro And Market Review”, dated March 13, 2019, available at cis.bcaresearch.com Cyclical Investment Stance Equity Sector Recommendations
Dear Client, Instead of our regular Weekly Report, this week we are sending you a Special Report written on February 20 by our Geopolitical Strategy service colleagues that discusses China’s recent stimulating efforts. We have only made a few minor revisions to account for the past month’s events. We trust that you will find this Special Report useful and insightful. Best regards, Anastasios Avgeriou, U.S. Equity Strategist Highlights So What? China’s January-February credit data suggest that stimulus is here. Why? China’s early-year credit and fiscal policies suggest that stimulus risks are to the upside. January-February credit was a blowout number and fiscal spending is up. Equity bourses in South Korea and Russia are the most likely to benefit from Chinese stimulus. Industrial metals such as copper will also benefit – with a delay. Feature New credit data for China in January-February improves the chances that Beijing’s stimulus measures will overshoot this year, causing China’s economy to bottom in 2019 and jumpstart global growth. In our annual outlook for this year we argued that while China was stimulating the economy, the magnitude of stimulus would be the decisive factor for the global macro environment in 2019. We argued that the type of stimulus would remain primarily fiscal – tax cuts for households and small and medium-sized enterprises – and hence that it would be modest as fiscal easing would merely offset relatively weak credit growth. This view stemmed from our assessment of the Xi Jinping administration, highlighted in April 2017, as an “elitist” (not populist) administration. Its policy priorities are to discipline the Chinese economy, and in particular to contain systemic financial risk, which President Xi has cited as a national security threat. This view is not wrong, but the latest data clearly show that Xi has decided to pause these painful efforts at limiting leverage and rebalancing China’s economy. Witness January-February’s decisive uptick in both total social financing (total private credit) and local government bond issuance (Chart 1). Chart 1Higher Risk Of An Overshoot
Higher Risk Of An Overshoot
Higher Risk Of An Overshoot
A massive spike in new credit is the single most important criterion in our “Checklist For A Stimulus Overshoot.” Thus, from a policy perspective, we are now at higher risk of an overshoot (Table 1). Not only credit as a whole but also informal lending saw a surge in January-February, implying that the government is relenting in its crackdown on the shadow banks. The approval of local government bond issuance for early in the year – and the People’s Bank of China’s announcement of a “Central Bank Bills Swap” program – reinforce this policy shift.1 Table 1Checklist For A Chinese Stimulus Overshoot In 2019
China: Stimulating Amid The Trade Talks
China: Stimulating Amid The Trade Talks
A stimulus overshoot is positive for Chinese demand in the short run but negative for potential GDP in the long run. A “traditional” credit surge of this nature cannot be surgically targeted at SMEs or households. It will go to state-owned enterprises, privileged corporations, property developers, and the like, which have always had the advantage in China’s financial system. SOEs have taken a much larger share of new loans than private companies in recent years,2 and the only silver lining of this trend was the possibility that tighter credit controls would discipline the SOEs. That silver lining is now fading, barring some new and surprising development on the reform front. China needs to create 26 trillion renminbi in new credit over the course of the year to avoid a corporate earnings contraction. These January-February numbers put China on track to do just that (Chart 2), assuming that President Xi and U.S. President Donald Trump agree to a short-term, framework trade deal this year. Chart 2On Track To Avoid An Earnings Contraction
On Track To Avoid An Earnings Contraction
On Track To Avoid An Earnings Contraction
Of course, a few caveats are in order. First, January-February’s credit number is only one data point and credit growth is always abnormally strong in the first month of the year. Early in the year, banks seek to expand their assets rapidly in a bid to get as much market share as possible before administrative credit quotas kick in. Because of Chinese New Year, it is best to combine January and February data to get a sense of the rate of credit expansion in the first part of the year. This year’s January-February numbers are very strong relative to previous years (Chart 3) and the context is more accommodative than the 2017 January-February credit surge, when authorities were beginning to tighten rather than ease macroprudential policy. Still a rapid rate of credit expansion will have to be sustained in the coming months in order to meet the 26 trillion RMB requirement highlighted above.
Image
Second, there is some risk that China’s households and private businesses will not respond as positively today as in the past. The intensification of Communist Party control over the society and economy, President Xi’s cancellation of term limits, and the strategic confrontation with the United States have created a bearish sentiment in the private sector. Our Emerging Markets Strategy would point out that if the propensity to consume, and money velocity,3 do not accelerate, then a surge in new credit may fail to ignite a reacceleration in China (Chart 4). Chart 4Chinese Are Holding On To Their Money
Chinese Are Holding On To Their Money
Chinese Are Holding On To Their Money
Still, what we now know is that Xi Jinping and his top economic adviser, Vice Premier Liu He, are not initiating the “assault phase of reform” that their predecessors initiated in the late 1990s in order to cleanse China’s economy of bad loans and zombie companies. Instead, they are likely reestablishing the “Socialist Put” in order to reverse the current deceleration, demonstrate China’s continued economic might and face down the United States’ threat of tariffs. Bottom Line: China’s stimulus measures are increasingly likely to overshoot, with positive implications for both Chinese and global growth. China is still facing a corporate earnings recession, but the odds of averting it are increasing. Trade Deadline More Likely To Be Extended What of the trade war? First, we would warn clients that China’s annual credit origination is a much bigger factor for the global economy than China’s exports to the United States (Chart 5). The trade war can escalate from here and yet, if China’s stimulus works as it has in the past, the results will be manageable for China’s economy save for Chinese companies expressly exposed to the U.S. economy through exports. In reality, both the U.S. and China are now effectively stimulating their economies and in this sense global trade as a whole will benefit regardless of bilateral tariffs. Chart 5Watch China Credit, Not So Much The Trade War
Watch China Credit, Not So Much The Trade War
Watch China Credit, Not So Much The Trade War
But it is possible that just as global equity markets ignored China’s economic slowdown and only sold off when the tariffs were levied (Chart 6), they may not continue to rally much on China’s credit data. Given the already considerable rally in global risk assets since October, markets may not be satisfied merely with one or two months of solid credit data out of China without a clear resolution to the trade conflict. After all, if a collapse in U.S.-China trade talks portends a new Cold War, then institutional investors may be justified in taking a wait-and-see approach despite China’s credit cycle upswing. Chart 6Will Equities Ignore China Data (Again)?
Will Equities Ignore China Data (Again)?
Will Equities Ignore China Data (Again)?
In the past, we have highlighted that the U.S. and China are not economically prohibited from engaging in a trade war – the export exposure is too small – and China’s new stimulus reinforces this point. However, President Trump is concerned about causing a sell-off in the tech sector and hence the broad equity market which could translate into a bear market and raise the probability of a recession occurring prior to November 2020. Meanwhile, in China, given Beijing’s reported trade concessions, there is apparently a desire to pacify the relationship and discourage U.S. unilateral tariffs and sanctions that could become seriously destabilizing for the Chinese economy and society. The need to have a happy 2021 centenary celebration for the Communist Party may factor into policymakers’ thinking. The latest news flow is mildly positive for the odds of getting a framework deal sometime this year. President Trump visited the Chinese negotiators in Washington, D.C. while President Xi reciprocated with the American negotiators in Beijing. A new round of two-week shuttle diplomacy is beginning. Trump has extended the tariff ceasefire and the two sides reportedly have arrived at an agreement on currency and are drafting written agreements on other areas of dispute. China’s National People’s Congress has passed a new Foreign Investment Law that ostensibly guarantees many of the American demands on forced tech transfer, intellectual property theft, and discriminatory treatment of U.S. companies (Table 2). Table 2New Foreign Investment Law Would Be A Positive For U.S.-China Negotiations
China: Stimulating Amid The Trade Talks
China: Stimulating Amid The Trade Talks
However, Presidents Trump and Xi have yet to schedule a new summit, which is probably necessary for a final deal. And there are murmurs from the press suggesting that China’s new law and other concessions are not going to satisfy the U.S. negotiators on the critical point of “structural changes” and a verification process. This leaves us inclined to change our trade war probabilities to increase the odds of an extension (Table 3). The improvement in U.S. financial conditions and China’s stimulus, if anything, make it more likely that negotiations will be extended, as both sides feel their economic and financial constraints less acutely. Table 3Updated Trade War Probabilities
China: Stimulating Amid The Trade Talks
China: Stimulating Amid The Trade Talks
Bottom Line: Global and Chinese risk assets should rally on China’s credit uptick, but the lack of resolution of the trade war could continue to inhibit animal spirits – and the odds of a March 1 resolution are declining. Who Are The Equity Winners Of China’s Stimulus? China’s strong January-February credit number is supportive of global equity markets. That much is obvious. But which equity markets will benefit the most? In what follows we examine the relationship between Chinese credit and MSCI equity returns of various countries. We find that Malaysian, Australian, South Korean, and Indonesian equities are the most highly correlated with Chinese credit growth and are thus most likely to benefit from the recent upturn (Chart 7). On the other hand, France and Italy stand out as countries whose bourses are more insulated.
Chart 7
Out of the markets that are positively correlated, South Korea and Russia stand out as relatively cheap (Chart 8). Thus we expect these equities to do especially well. By contrast, while Indonesia and the Philippines are highly leveraged to China, these markets are currently relatively expensive. BCA’s Emerging Markets Strategy is currently overweight Korean and Russian equities within the EM space, neutral Turkey (although recently upgraded from underweight), and underweight Indonesia and the Philippines.
Chart 8
In addition to credit stimulus, we expect Chinese household consumption to also gain support going forward. This will likely be driven by policy stimulus targeting the consumer specifically and is best exemplified by the recently announced tax cuts (Chart 9), which we expect to trickle down to greater consumer demand and growth in retail sales. Our base case calls for 8%-10% growth in household consumption over the coming 12 months, up from the current 3.5%.
Chart 9
However, consumer sentiment in China is weak. BCA’s Emerging Markets Strategy’s proxy for household marginal propensity to spend ticked up recently, after falling since early last year (see Chart 4 above). A resumption in the decline would highlight that households are increasingly unwilling to spend, which would translate into weaker retail sales despite policy efforts to boost consumption. Such a scenario – in which credit growth accelerates without a substantial uptick in consumer spending – is plausible, given that it occurred between mid-2015 and mid-2016 (Chart 10). In any case, whether Chinese stimulus comes in the form of the traditional credit channel, or instead in the form of fiscal stimulus to household consumption, the same equity markets will generally benefit the most (Chart 11). Chart 10...But Flattish Retail Sales Are Also A Possibility
...But Flattish Retail Sales Are Also A Possibility
...But Flattish Retail Sales Are Also A Possibility
Chart 11
Indeed, global equity markets react the same way regardless of the type of stimulus implemented. For instance, MSCI returns for the Philippines, Sweden, Malaysia, Indonesia, and Turkey are more closely correlated to both Chinese credit growth and retail sales growth compared to Italy, Japan, and France. The same conclusion is reached when we look at the correlations between Chinese credit growth or consumption growth and individual MSCI sectors such as industrials and consumer discretionary (Chart 12).
Chart 12
The relatively stronger correlation between Chinese credit growth and equity returns – as opposed to Chinese retail sales and equity returns – can be put down to the nature of Chinese imports. While industrial goods account for the bulk of China’s purchases of foreign goods, consumer goods excluding autos make up only 15% of China’s imports (Table 4). However, as Chart 12 illustrates, the relationship between China’s retail sales growth and global equities is much tighter in the case of the consumer discretionary sector, whether the latter is compared to global industrials sectors or the overall MSCI index. Table 4Import Composition Of Chinese Imports
China: Stimulating Amid The Trade Talks
China: Stimulating Amid The Trade Talks
Equity market exposure to China is not always in line with the extent of each country’s trade exposure to China (Chart 13).
Chart 13
There are some clear exceptions – most notably Mexico, which has the highest correlation coefficient with Chinese credit and consumption variables since 2010. However, this is likely due to idiosyncratic factors.4 Correlation does not imply causation, and we cannot conclude with certainty that Mexican equities will outperform amid China’s new round of stimulus. Nevertheless, given that Mexico is a very deeply liquid market that benefits amid EM bull markets, this may not be entirely coincidental. The correlations between global equity markets and Chinese credit peak two months after the stimulus measures are first implemented (Chart 14). This is more or less in line with adjusted total social financing’s correlation versus industrial metals. However, BCA’s Commodity & Energy Strategy has shown that copper’s correlations versus other measures of Chinese money and credit peak after roughly three quarters (Chart 15).5 This is evident in both the 2012 and 2015-16 stimulus episodes in which the bottom in copper prices lagged the bottom in China’s credit growth. Thus we may witness a rebound in equity markets on the back of China’s credit splurge before we see an improvement in annual returns on copper prices.
Chart 14
Chart 15Copper Rallies Lag China Credit Stimulus
Copper Rallies Lag China Credit Stimulus
Copper Rallies Lag China Credit Stimulus
Bottom Line: South Korean and Russian equities are best positioned to benefit from the positive surprise in China’s credit data. France and Italy are the worst positioned. Copper prices will rebound with a delay. Investment Implications BCA’s Geopolitical Strategy recommends that investors stay long Chinese equities ex-tech relative to the emerging market benchmark. This is a tactical call initiated in August 2018 that is now becoming a cyclical call on the basis of the credit upswing. We also remain long the “China Play Index,” a basket of China-sensitive assets. A rebound in China’s credit data and stronger global growth will support copper demand. Prices are still 15% below the mid-2018 peak and are poised to benefit in this environment, especially given that global inventories are already falling. BCA’s Geopolitical Strategy recommends that investors go long copper. Meanwhile, BCA’s China Investment Strategy recommends (for now) staying only tactically overweight Chinese equities relative to the global benchmark, pending higher conviction that the pace of credit growth will be strong enough to overwhelm the negative ramifications of a continued deceleration in actual activity over the coming few months on sentiment and 12-month forward earnings expectations. Over the long run, Geopolitical Strategy would look to underweight Chinese equities, as we are not optimistic about China’s productivity and potential GDP. This is because of the negative structural consequences of continuing the Socialist Put (i.e., bad loans, zombie companies, trade protectionism). We would expect CNY/USD to remain relatively buoyant in the context of both trade negotiations with the U.S. and fiscal-and-credit stimulus. The trade talks can hardly succeed if CNY/USD is falling. Depending on whether and how soon China’s stimulus results in a durable economic bottom, global growth could stabilize and the USD could see a substantial countertrend selloff. Matt Gertken, Vice President Geopolitical Strategy mattg@bcaresearch.com Roukaya Ibrahim, Editor/Strategist roukayai@bcaresearch.com Footnotes 1 Please see Emerging Markets Strategy Special Report titled “China: Prepping A Bazooka?” dated February 14, 2019 available at ems.bcaresearch.com 2 Please see Nicholas Lardy, “The State Strikes Back: The End Of Economic Reform In China?” Peterson Institute For International Economics, January 29, 2019, available at piie.com. 3 Please see Emerging Markets Strategy Weekly Report titled “Dissecting China’s Stimulus,” dated January 17, 2019 available at ems.bcaresearch.com 4 The 2012 election of President Enrique Peña Nieto caused Mexican equities to outperform their EM counterparts. Similarly in 2015-16, U.S. outperformance relative to EM also supported Mexico relative to EM because Mexico’s economy is highly leveraged to its northern neighbor. In both periods Mexico’s outperformance was not caused by – but instead coincided with – Chinese credit stimulus. These idiosyncratic events biased the correlation between Mexico’s equity markets and Chinese credit growth to the upside. 5 Please see Commodity & Energy Strategy Weekly Report titled “Trade Wars, China Credit Policy Will Roil Global Copper Markets,” dated June 21, 2018, available at ces.bcaresearch.com.
Highlights Currency markets continue to fight a tug-of-war between deteriorating global growth and easing global financial conditions. Meanwhile, history suggests that the trade-weighted dollar should have been 10-15% higher, based on portfolio flows and interest rate differentials. The more-muted bounce is a cause for concern. As the battle unfolds, likely winners in the interim will be safe-haven currencies such as the yen. Watch the gold-to-bond ratio for cues on where the balance of forces are shifting, with a rising ratio negative for the dollar. We expect a day of reckoning to eventually arrive for the U.S. dollar, once investors shift their focus towards the rising twin deficits, de-dollarization of the global economy and low expected returns for U.S. assets. Feature The recent calm in developed currency markets seems very eerie, given the storm that has gripped global financial markets over the past week. Dismal manufacturing PMI readings from Europe and Japan last week sent equity markets into a tailspin. The closely watched U.S. 10-year versus 3-month spread inverted, triggering panic selling among investors who favor this spread as their most reliable recession indicator. Equity markets in Asia are off the year’s highs, while regional bond yields are holding close to trading lows. Outside of oil, commodity markets have also been soft. Despite these moves, the trade-weighted dollar has been relatively stable. Over the last few months, most currency pairs have been narrowly trading towards the apex of very tight wedge formations. This has severely dampened volatility (Chart 1). Over the longer term, the stability of these crosses relative to gold has spooky echoes of a fixed exchange rate regime a la Bretton Woods (Chart 2). Chart 1An Eerie Calm In Currency Markets
An Eerie Calm In Currency Markets
An Eerie Calm In Currency Markets
Chart 2Fixed Exchange Rates Versus Gold?
Fixed Exchange Rates Versus Gold?
Fixed Exchange Rates Versus Gold?
In physics, centripetal systems tend to stay in equilibrium, while centrifugal forces can explode in spectacular fashion. In the post-Bretton Woods world, it has been very rare for periods of extended currency stability to persist. This means constantly monitoring both the trend and magnitude of imbalances between economies to gauge where the pressure points are, and in what direction the corresponding exchange rates might eventually give way. The balance of forces driving the dollar outlook seems like a natural starting point for this exercise. Global Liquidity And The Dollar Judging by most measures of relative trends, the dollar should be soaring right now. The March Markit manufacturing PMI releases last week showed that while both Japan and the euro area remain in contraction territory, the U.S. reading of 52.5 puts it solidly above the rest of the world. It is true that the momentum of this leadership has been rolling over recently, but historically such large growth divergences between the U.S. and the rest of the world have generated anywhere from 10-15% rallies in the greenback over a period of six months (Chart 3). So far, the DXY dollar index is up 1.9% since October. Every time this measure has severely contracted in the past, the shortage of dollars has triggered a blowup somewhere. Until the U.S. Federal Reserve’s recent volte-face on monetary policy, relative yields also favored the greenback. The 2-year swap differential between the U.S. and the rest of the world pinned the DXY dollar index at 105, or 8% above current levels (Chart 4). Meanwhile, relative policy rates also suggest the broad trade-weighted dollar should be 6% higher. And even today, unless the Fed moves towards outright rate cuts, the dovish shift by other central banks around the world remains an immediate tailwind for the U.S. dollar. Chart 3USD Should Be Higher Based On Growth Divergences
USD Should Be Higher Based On Growth Divergences
USD Should Be Higher Based On Growth Divergences
Chart 4USD Should Be Higher Based On Swap Differentials
USD Should Be Higher Based On Swap Differentials
USD Should Be Higher Based On Swap Differentials
Internationally, the Fed’s tapering of asset purchases has been a net drain on dollar liquidity, despite a widening U.S. current account deficit. The Fed’s balance sheet peaked a nudge above US$4.5 trillion in early 2015 and has been falling ever since. This has triggered a severe contraction in the U.S. monetary base (Chart 5), and severely curtailed commercial banks’ excess reserves, which are now contracting by over 20% on a year-on-year basis. One of BCA’s favorite key measures of international liquidity is foreign central bank reserves deposited at the Fed. This is contracting at its worst pace in over 40 years. Every time this measure has severely contracted in the past, the shortage of dollars has triggered a blowup somewhere, typically among countries running twin deficits. Chart 5A Liquidity Squeeze Of Dollars
A Liquidity Squeeze Of Dollars
A Liquidity Squeeze Of Dollars
To cap it off, last year’s change in the U.S. tax code to allow for repatriation of offshore cash helped the dollar, but not to the extent that might have been expected. On a rolling 12-month basis, the U.S. has repatriated back a net of about $US400 billion in assets, or close to 2% of GDP. Historically, this is a very huge sum that would have had the potential to set the greenback on fire – circa 10% higher (Chart 6). Chart 6USD Should Be Higher On Repatriation Flows
USD Should Be Higher On Repatriation Flows
USD Should Be Higher On Repatriation Flows
Dollar liquidity shortages tend to be vicious due to their ability to trigger negative feedback loops. As the velocity of international U.S. dollars rises, offshore dollar rates begin to rise, lifting the cost of capital for borrowing countries. Debt repayment replaces capital spending and consumption once this reaches a critical threshold. The drop in output, prices, or a combination of the two, only exacerbates the debt-deflation problem. The bottom line is that looking at historical trends, the dollar should be much higher than current levels. Practical investors recognize the need to pay heed to correlation shifts. Either our favorite liquidity indicators have stopped working outright or more realistically other forces are at play, explaining the relative stability in the greenback. A Counter-Cyclical Currency The first possibility is that the recent stability in the U.S. dollar has been in anticipation of better economic data in the second half of this year. We have shown many times in the past that the greenback is a countercyclical currency that tends to do poorly when global economic momentum picks up. Many investors are now fixated on China – specifically, whether the latest credit injection will be sufficient to turn around the Chinese economy, let alone the rest of the world. Meanwhile, as the U.S.-China trade talks progress, it will likely include a currency clause to prevent depreciation of the RMB versus the dollar. In reality, there is still scant evidence to support a bottoming in global growth, making it difficult to loop this back to dollar stability. In reality, there is still scant evidence to support a bottoming in global growth, making it difficult to loop this back to dollar stability. Typical reflation indicators such as commodity prices, emerging market currencies and industrial share prices are off their lows but rolling over. March export data remained weak globally, even though compositionally there were some green shoots. Exports to China from Singapore jumped by 34% year-on-year, and those to emerging markets by 22% year-on-year. Japanese machine tool orders from China also showed some stabilization. Historically, these are necessary but not sufficient conditions to gauge whether we are entering a bottoming process (Chart 7). Another contradiction is at play: If the dollar rally is being held back by prospects of improvement in global growth, then gold should fare poorly and most currencies should be outperforming both gold and the greenback. Until yesterday’s sell off in gold, this was not the case. Suggesting some other explanation might be tempering the U.S. dollar’s rise. Chart 7Tentative Green Shoots In Global Trade?
Tentative Green Shoots In Global Trade?
Tentative Green Shoots In Global Trade?
Regime Shift? While U.S. residents have been repatriating capital domestically, foreign investors have been fleeing U.S. capital markets at among the fastest pace in recent years. On a rolling 12-month total basis, the U.S. saw an exodus of about US$200 billion in equity from foreigners, the largest on record (Chart 8). In aggregate, both foreign official and private long-term portfolio investment into the U.S. has been rolling over, with investor interest limited only to agency and corporate bonds. Foreigners are still net buyers of about $450 billion in U.S. securities, but the downtrend in purchases in recent years is evident. Interestingly, gold has also outperformed Treasurys over this period. The U.S. dollar remains the reserve currency of the world today, but that exorbitant privilege is clearly fraying on the edges. Vis-à-vis official flows, China has risen within the ranks to be the number one contributor to the U.S. trade deficit. At the same time, Beijing has been destocking its holding of Treasurys, if only as retaliation against past U.S. policies, or perhaps to make room for the internationalization of the RMB (Chart 9). In a broader sense, the fall in dollar deposits at the Fed might just represent an underlying shift in the global economy away from dollars and towards a more diversified basket of currencies. This makes sense, given a growing proportion of trading – be it in crude, natural gas, bulk commodities or even softs – is being done outside U.S. exchanges. Chart 8Foreigners Are Dumping U.S. Equities
Foreigners Are Dumping U.S. Equities
Foreigners Are Dumping U.S. Equities
Chart 9China Has Stopped Recycling Surpluses Into Treasurys
China Has Stopped Recycling Surpluses Into Treasurys
China Has Stopped Recycling Surpluses Into Treasurys
Data from the International Monetary Fund (IMF) shows that the global allocation of foreign exchange reserves towards the U.S. dollar peaked at about 72% in the early 2000s and has been in a downtrend since. Meanwhile, allocation to other currencies, notably the British pound, Swiss franc and the yen have been surging (Chart 10). At the same time, foreign central banks have been amassing tremendous gold reserves, notably Russia and China, almost to the tune of the total annual output of the yellow metal (Chart 11). This further helps explain why the dollar may not be as strong as it should be. It also explains the stability of these currency pairs relative to the price of gold. Chart 10The World Is Diversifying Away From Dollars
The World Is Diversifying Away From Dollars
The World Is Diversifying Away From Dollars
Chart 11Central Banks Are Absorbing Most Gold Production
Central Banks Are Absorbing Most Gold Production
Central Banks Are Absorbing Most Gold Production
The U.S. dollar remains the reserve currency of the world today, but that exorbitant privilege is clearly fraying on the edges as the balance-of-payments dynamics are heading in the wrong direction. Over the next five years, the U.S. Congressional Budget Office (CBO) estimates that the U.S. budget deficit will swell to 4.5% of GDP. Assuming the current account deficit widens a bit then stabilizes, this will pin the twin deficits at 8.1% of GDP. This assumes no recession, which would have the potential to swell the deficit even further (Chart 12). Chart 12A Twin Deficit Cliff For The Dollar
A Twin Deficit Cliff For The Dollar
A Twin Deficit Cliff For The Dollar
The U.S. saw its twin deficits swell to almost 13% of GDP following the financial crisis, but the difference then was that in the wake of the commodity boom the dollar was cheap (and commodity currencies overvalued). The subsequent shale revolution also greatly cushioned the U.S. trade deficit. Shale productivity remains robust and U.S. output will continue to rise, but the low-hanging fruit has already been plucked. For one reason or another, foreign central banks are diversifying out of dollars. If due to the changing landscape in trade, this is set to continue. If it is an excuse to shy away from the rapidly rising U.S. twin deficits, this will continue as well. And if the U.S. dollar cannot sufficiently rally on “good news,” expect it to sink when the bad news eventually starts rolling in. That said, the timing remains uncertain. Private Capital Flows Foreign official flows might have been fleeing the U.S. dollar because it has lost some luster as a reserve currency, but private capital will begin stampeding toward the exits when the return on invested capital (ROIC) for U.S. assets falls below their cost of capital. For investors with a long horizon, this may already be happening. Take 10-year government bonds for example. For the Japanese or German investor, borrowing in local currency and investing in the U.S. might seem like the logical course of action given negative domestic rates and a 10-year Treasury yield of 2.4%. However, this positive carry suddenly evaporates when one factors in hedging costs (Chart 13). Chart 13JGBs More Attractive Than Hedged Treasuries
JGBs More Attractive Than Hedged Treasuries
JGBs More Attractive Than Hedged Treasuries
During bull markets, countries that have negative interest rates are subject to powerful outflows from carry trades. The impact of these are difficult to measure, but it is fair to assume that periods of low hedging costs (which tend to correspond to periods of lower volatility) can be powerful catalysts. As markets get volatile and these trades get unwound, unhedged trades become victim to short-covering flows. With many yield curves around the world inverting, the danger is that the frequency of this short-covering implicitly rises, since long-bond returns are falling short of spot rates. One winner as volatility starts to rise is the yen. Investors should consider initiating short USD/JPY positions today as a hedge. Outside the fixed-income space, what matters is that relative ROICs are higher than the cost of capital. Both are difficult to measure for many emerging or even developed economies across asset classes. However, for the equity market, a good starting point has always been valuations as exchange rates tend to move to equalize returns across countries. The forward P/E on the MSCI U.S., Europe and Japan indexes is 16.5x, 12.6x and 12.3x. The skew towards the U.S. is because market participants expect U.S. profits to keep outperforming, the U.S. currency to keep appreciating, or a combination of the two. However, empirically, current U.S. valuations suggest future earning streams have already been fully capitalized today (Chart 14). Chart 14AReturn On Capital Could Be Lowest In The U.S. (1)
Return On Capital Could Be Lowest In The U.S. (1)
Return On Capital Could Be Lowest In The U.S. (1)
Chart 14BReturn On Capital Could Be Lowest In The U.S. (2)
Return On Capital Could Be Lowest In The U.S. (2)
Return On Capital Could Be Lowest In The U.S. (2)
Chart 14CReturn On Capital Could Be Lowest In The U.S. (3)
Return On Capital Could Be Lowest In The U.S. (3)
Return On Capital Could Be Lowest In The U.S. (3)
The expected 10-year annualized return for MSCI U.S. is 3.1%, versus 5.5% for MSCI Europe and 9.6% for MSCI Japan. If we assume the U.S. dollar is overvalued, as some models suggest, this will further erode future U.S. returns. Net equity portfolio flows into the U.S. are already negative, as shown in a previous chart. This means the day of reckoning for the U.S. dollar may not be far off when current tailwinds eventually fade. Chester Ntonifor, Foreign Exchange Strategist chestern@bcaresearch.com Trades & Forecasts Forecast Summary Core Portfolio Tactical Trades Closed Trades