Money Trends / Liquidity

Highlights The odds of a continued earnings contraction have not yet fallen to the point that would warrant an overweight stance towards Chinese versus global stocks over the coming 6-12 months. While we maintain Chinese stocks on upgrade watch and may recommend increasing exposure soon, the bottom line for investors is that it is still too early for us to confidently project a sustained uptrend. While most investors attribute the chronic discount of Chinese stocks relative to the global average as being due to a sizeable equity risk premium, our analysis suggests that China’s low payout ratio and mediocre earnings growth are the true causes. This implies that China’s re-rating potential is capped barring a major structural improvement in earnings growth. Investors should pay close attention to the details of a U.S./China currency stability pact that will reportedly be included in any trade deal between the two countries. Such a pact may set up an important natural experiment for CNY/USD, and could be a revelatory event for China’s exchange rate regime. Feature Last week’s FOMC meeting dominated the headlines of the financial press, and for good reason. The Fed surprised investors with a material downgrade to their expected path of the federal funds rate over the next three years, a shift that largely reflected concerns about global growth. The subsequent inversion of the U.S. 10-year / 3-month yield curve in response to the very disappointing euro area flash manufacturing PMI for March confirms that many investors remain convinced that Fed policy is too tight and that easing is likely over the coming year.1 On the positive side, investor concerns that reflationary policy is needed in the U.S. and euro area are likely overblown: the plunge in the euro area PMI at least in part reflects the near-term uncertainty over the possibility of a hard Brexit (which will probably be avoided), whereas the Fed is pausing at a level of real interest rates that is well below real GDP growth, which means that monetary policy is still stimulative for the U.S. economy (Chart 1). Chart 1U.S. Monetary Policy Is Still Stimulative
U.S. Monetary Policy Is Still Stimulative
U.S. Monetary Policy Is Still Stimulative
But Chart 2 highlights that a generalized slowdown in global growth is responsible for at least part of the sharp weakness in Chinese export growth over the past few months, which we had been mostly attributing to a catch-up phase following a (perversely and ironically) beneficial tariff front-running effect that had temporarily boosted trade growth last year. Chart 2Global Weakness At Least Partly Responsible For A Sharp Export Slowdown
Global Weakness At Least Partly Responsible For A Sharp Export Slowdown
Global Weakness At Least Partly Responsible For A Sharp Export Slowdown
Ongoing weakness in the global economy, were it to persist, would imply that China’s external demand outlook is even less encouraging than we had previously assumed. This would raise the stakes for a trade deal with the U.S. to be agreed upon soon, as well as a continued uptrend in the pace of Chinese credit growth. Investors should closely watch the new export orders component of the March NBS manufacturing PMI later this week for signs that exporter sentiment is improving, as well as the overall Caixin PMI to confirm that smaller firms continue to benefit from the PBOC’s targeted easing efforts. When Should Investors Upgrade Chinese Stocks On A Cyclical Basis? In our view, most global investors have been focused on the wrong risk factor for Chinese stocks for the better part of the past year. In the wake of the near-vertical February rise in Chinese domestic stocks, the most common question we have received from clients is whether they should be increasing their cyclical exposure to Chinese stocks in general, and A-shares in particular. In response to the January surge in credit we placed Chinese stocks on upgrade watch in our February 27 Weekly Report,2 but we are not yet ready to recommend an outright cyclical overweight. Investors should be at the ready and aiming, but should not yet fire. In our view, most global investors have been focused on the wrong risk factor for Chinese stocks for the better part of the past year. We have noted in several previous reports that investors have focused nearly exclusively on the U.S.-China trade war since the beginning of 2018, and have largely ignored a slowing domestic economy (Chart 3). Given this, it is not surprising that a sharp improvement in the odds of a deal (which occurred at the beginning of November) has led to a material rally over the past few months versus global stocks. Chart 3The Prospect Of A Trade Deal Has Been The Primary Driver Of China-Related Assets
The Prospect Of A Trade Deal Has Been The Primary Driver Of China-Related Assets
The Prospect Of A Trade Deal Has Been The Primary Driver Of China-Related Assets
In fact, we predicted in our December 5 Weekly Report that positive sentiment about a deal would boost the relative performance of Chinese stocks over the coming few months, and recommended a tactical overweight stance at that time.3 A cyclical (i.e. 6-12 month) overweight, however, is a different story. Sentiment alone rarely drives financial markets over a 1-year time horizon, meaning that investors need to have some degree of confidence that domestic demand will meaningfully improve over the next 12 months to justify a cyclical upgrade. Certainly, we acknowledge that there have been several positive developments pointing to such an outcome. Chinese monetary conditions have become extremely easy, credit is no longer contracting and surged in January, the Caixin PMI rose notably in February, and some form of a trade deal remains the most likely outcome of the ongoing talks. In addition, Chinese stocks still remain significantly below their 2018 peak (Chart 4), meaning that there is still material potential upside if Chinese earnings do not contract. Chart 4Chinese Stocks Still Have Room To Rise If The Earnings Outlook Stabilizes
Chinese Stocks Still Have Room To Rise If The Earnings Outlook Stabilizes
Chinese Stocks Still Have Room To Rise If The Earnings Outlook Stabilizes
A moderate credit expansion appears to be underway, but coincident activity continues to weaken and earnings appear to have more downside. However, there are also several reasons to be cautious cyclically: Chart 5The Past Three Months Imply A Moderate Credit Uptrend
The Past Three Months Imply A Moderate Credit Uptrend
The Past Three Months Imply A Moderate Credit Uptrend
Chart 6Chinese Coincident Economic Activity Continues To Weaken
Chinese Coincident Economic Activity Continues To Weaken
Chinese Coincident Economic Activity Continues To Weaken
Chinese and U.S. policymakers have not only failed to set a date for an agreement to be signed by President’s Xi and Trump, but recent new reports suggest that momentum may be slowing and that a meeting may be postponed until June or later.4 Even if the deal does not fall through, material further delays could cause investors to get anxious and vote with their feet. Such a selloff could be violent, given the extremely sharp rise in domestic stock prices over the past six weeks. The evidence so far points to a moderate expansion in credit (Chart 5), reflecting the fact that policymakers are still somewhat concerned about financial stability and the need to prevent significant further leveraging of the private sector. This means that the odds are not yet in favor of a credit “overshoot” like what occurred in 2015/2016, implying that the pickup in growth is likely to be comparatively weaker this time around. Since 2010, monetary conditions and money & credit growth appear to be the best predictors of investment-relevant Chinese economic activity.5 While a moderate credit expansion appears to be underway, there has been no discernable pickup in money growth.6 This discrepancy likely means that the recent improvement in credit has occurred due to non-bank financial institutions, further suggesting that this economic recovery will probably be less powerful and less broad-based than during past cycles. While a moderate expansion in credit does suggest that China’s economy will bottom at some point in the coming months, coincident economic activity continues to decelerate (Chart 6). A continuation of this trend, particularly if coupled with an investor “crisis of faith” in the trade talks, could lead to a very significant retracement in Chinese equity prices before durably bottoming for the year. Trailing EPS growth is decelerating, but it has yet to contract on a year-over-year basis as would be implied by the net earnings revisions ratio (Chart 7) and the coincident activity indicators shown in Chart 6. Chinese investable EPS fell 30% during the 2015/2016 episode (20% for domestic stocks), implying meaningful further downside even if economic activity does not weaken as significantly over the coming months. Chart 7Net Earnings Revisions Point To More Downside For Earnings
Net Earnings Revisions Point To More Downside For Earnings
Net Earnings Revisions Point To More Downside For Earnings
Chart 8 presents a helpful way for investors to make a net assessment of all of the factors highlighted above. The chart shows our earnings recession model for the MSCI China Index, and shows what is likely to occur if a trade deal causes a full recovery in Chinese exporter sentiment, China’s export-weighted RMB stays roughly at current levels, and the very recent pace of credit growth (Dec-Feb) continues along its trend. Chart 8A Trade Deal And A Moderate Credit Expansion Will Likely Stabilize The Earnings Outlook
A Trade Deal And A Moderate Credit Expansion Will Likely Stabilize The Earnings Outlook
A Trade Deal And A Moderate Credit Expansion Will Likely Stabilize The Earnings Outlook
This scenario, were it to occur, would reduce the odds of a continued earnings contraction to the point that we would be comfortable recommending an overweight stance towards Chinese versus global stocks over the coming 6-12 months. While such a recommendation could come as soon as mid-April, the bottom line for investors is that it is still too early for us to confidently project this outcome. Should Chinese Stocks Be Priced At A Premium Or A Discount To Global Stocks? Most investors attribute the discount applied to Chinese stocks to a high equity risk premium (ERP), but our work paints a different picture. Besides questions about the appropriate cyclical allocation to Chinese stocks, the recent spike in interest among global investors towards A-shares has also led to a renewed focus about the degree to which Chinese stocks are cheap versus the global average. In a world where many financial assets are chronically expensive and Chinese policymakers appear to be responding to weaker economic activity, some investors question whether Chinese stocks deserve to be priced at a discount (Chart 9). Our sense is that most investors attribute the discount to a high equity risk premium (ERP) stemming from the enormous rise in Chinese non-financial corporate debt over the past decade, but our research paints a different picture. Chart 9The Chinese Equity Discount: A High ERP, Or Something More Sinister?
The Chinese Equity Discount: A High ERP, Or Something More Sinister?
The Chinese Equity Discount: A High ERP, Or Something More Sinister?
One way of analyzing the risk premium of an equity market is to use the well-known constant Gordon growth model. Equation 1 below presents the theoretically justified 12-month trailing P/E ratio as a function of the payout ratio, the risk-free rate, the ERP, and the long-term dividend growth rate (which is equal to the long-term earnings growth rate given a constant payout ratio). Equations 2 and 3 re-arrange equation 1 to express the ERP and long-term growth rate, respectively, on the left-hand side of the equation. Equation 1: P0/E0 = (D1/E0)/(rf + ERP – g) Equation 2: ERP = [(D1/E0)/(P0/E0)] + g - rf Equation 3: g = rf + ERP-[(D1/E0)/(P0/E0)] To illustrate the approach, Chart 10 applies equation 2 to the U.S. equity market and compares it with the annual dividend discount model equity risk premium published by Professor Aswath Damodaran from New York University’s Stern School of Business,7 a well-known expert in the theory and practice of asset valuation. While there are some differences in the level of the series owing to slightly different methodologies, the overall profile of the two series is generally similar. Chart 10Our DDM Methodology For The U.S. Generates Results Similar To Other Important Estimates
Our DDM Methodology For The U.S. Generates Results Similar To Other Important Estimates
Our DDM Methodology For The U.S. Generates Results Similar To Other Important Estimates
Proxying the market’s long-term growth expectations in a large, mature economy such as the U.S. is materially easier than is the case in an emerging market such as China. As such, instead of solving for the equity risk premium directly when judging whether China’s discount is “deserved”, we use equation 3 to solve for the implied long-term growth rate given an assumed (and very conservative) ERP range of 2-3%, using the global P/E ratio. In other words, we ask the following question: what kind of earnings growth do Chinese stocks need to achieve over the long run in order to justify the same earnings multiple as the global average, given an equity risk premium of 2-3%? Chart 11 presents the answer to this question, for both the domestic and the investable market. We use domestic 10-year bond yields as the risk-free rate in the case of the A-share market, and U.S. 10-year bond yields in the case of the MSCI China index as a proxy for the global risk-free rate. Finally, in each panel, the dashed horizontal lines denote the actual compound annual growth rate in earnings per share for each market, since the year noted next to each line. Chart 11A Low But Still Difficult L/T Earnings Hurdle Rate To Be Priced In Line With Global Stocks
A Low But Still Difficult L/T Earnings Hurdle Rate To Be Priced In Line With Global Stocks
A Low But Still Difficult L/T Earnings Hurdle Rate To Be Priced In Line With Global Stocks
Two important points are apparent from the chart: The required growth rate for both markets to be priced in line with global stocks are quite low, well below Chinese nominal GDP growth. At first blush, this might suggest that the valuation discount applied to China reflects a sizeable equity risk premium that could shrink over the coming 6-12 months (i.e. a beneficial re-rating of Chinese stocks). Since 2010 or 2011, actual growth rates in EPS are materially above the required growth range in both markets. However, over more recent time horizons, particularly 2013 and later, actual earnings growth has not only been below the range but has also been extremely poor in absolute terms. This is particularly true for the investable market, which has actually recorded negative growth in 12-month trailing EPS since 2014 or 2015. A dividend discount model approach suggests that the Chinese equity market discount is justified, barring a major structural improvement in earnings growth. Chart 12 highlights the problem with China’s stock market in a nutshell. For both the investable and domestic equity markets, the dividend payout ratio is well below the global average. This is a normal circumstance for small companies with high growth potential; firms re-invest a high portion of their earnings back into the company in order to build out their asset base and deliver even higher earnings in the future. Chart 12The Chinese Discount Visualized: A Low Payout Ratio, And Mediocre Earnings Growth
The Chinese Discount Visualized: A Low Payout Ratio, And Mediocre Earnings Growth
The Chinese Discount Visualized: A Low Payout Ratio, And Mediocre Earnings Growth
But panel 2 of Chart 12 shows that relative earnings for Chinese stocks versus the global average have not trended higher over the past decade, meaning that a higher earnings retention ratio among Chinese stocks has not led to a superior earnings profile. In response, global investors have rightly discounted Chinese stocks versus their global peers, a circumstance that is likely to continue unless Chinese earnings growth materially and sustainably improves. Our analysis implies that there is a natural limit to how far Chinese equities can ultimately be re-rated barring a major structural improvement in the economy, a factor that we may eventually have to contend with were we to recommend a cyclical overweight stance. Capped re-rating potential is unlikely to prevent Chinese stocks from trending higher in relative terms if economic fundamentals warrant an uptrend, but it may suggest that the duration or magnitude of the rise may be shorter than many investors hope. A Sino-U.S. Trade Deal: A Natural Currency Experiment In The Making? What explains the link between CNY-USD and the interest rate differential between the two countries? Finally, a brief note on the RMB. Since June 2018, changes in CNY-USD appear to have been closely aligned with the magnitude of proposed tariffs as a share of Chinese exports to the U.S., as would be implied in a simple open economy model with flexible exchange rates. Chart 13shows the levels implied by this framework in a variety of tariff scenarios, calculated based on the percent decline from the peak in the exchange rate in 1H 2018. As noted in our March 13 Weekly Report,8 CNY-USD today is consistent with the current tariff regime, implying potential upside if a trade deal with the U.S. rolls back some of the tariffs that have been imposed. Chart 13A Simple Equilibrium Framework Suggests CNY-USD May Rise Materially Further If Tariffs Are Rolled Back
A Simple Equilibrium Framework Suggests CNY-USD May Rise Materially Further If Tariffs Are Rolled Back
A Simple Equilibrium Framework Suggests CNY-USD May Rise Materially Further If Tariffs Are Rolled Back
However, Chart 14 shows that CNY-USD has been closely correlated with the interest rate differential between the two countries for several years, with the relationship having recently become a leading one. Chart 14 highlights that CNY-USD has moved higher than the rate differential would imply (painting the opposite picture as that shown in Chart 13), suggesting that the currency is more likely to depreciate than appreciate over the coming 6-12 months barring tighter monetary policy in China or outright rate cuts in the U.S. Chart 14Will Policymakers Or Rate Differentials Drive CNY-USD Over The Coming Year?
Will Policymakers Or Rate Differentials Drive CNY-USD Over The Coming Year?
Will Policymakers Or Rate Differentials Drive CNY-USD Over The Coming Year?
The relationship shown in Chart 14 is surprising, and we have struggled to understand the exact dynamics at play. As we highlighted in a September report,9 many global investors take the relationship for granted, given the strong historical link between interest rate differentials and exchange rates in developed countries. However, a major problem that arises in explaining Chart 14 is the fact that uncovered interest rate arbitrage (or the “carry trade”) cannot easily occur or cannot occur at all when one or both countries involved maintains capital controls. It is an important conundrum, and one that we have not been able to solve. From our perspective, there are only two scenarios that explain the close relationship between the exchange rate and interest rate differentials between the two countries: The relationship is causal, implying that capital flows in and out of the country are sufficiently large to enable a carry trade. The two series are correlated because of a third factor related in some way to the other two. In our view, scenario 1 is not likely. Capital is flowing out of China, but at a much slower rate than before,10 and the relationship shown in Chart 14 did not break down following China’s capital crackdown in 2015/2016. Ruling out scenario 1 necessarily implies that scenario 2 is correct. Our best guess concerning the missing third factor is that Chinese policymakers are looking to the rate differential as a guide to set the exchange rate, in order to mimic a market-based exchange rate in support of China’s goals to progressively liberalize (and internationalize) the currency. If true, this implies that China has full control of their exchange rate regardless of the prevailing interest rate differential, but that they are often choosing to follow what the differential implies. This is significant, because if Chinese and U.S. negotiators do agree to a “yuan stability pact” as has been reported in the press, a trade deal may set up an important natural experiment for the currency. In our view, a major upward move in the rate differential is unlikely over the coming year, implying that CNY-USD will persistently deviate from the relationship shown in Chart 14 if President Trump is not inclined to tolerate any real weakness in the RMB over the coming year. While the details of the currency agreement and the trade agreement more generally could allow for some decline in CNY-USD if coupled with an offsetting benefit for the U.S. (such as materially higher U.S. exports to China for some period), our bias is to believe that President Trump does not want to see a stronger dollar over the coming year in the lead-up to the 2020 election. If true, investors should pay close attention to the behavior of CNY-USD, as it is stands to be a revelatory event for China’s exchange rate regime. Jonathan LaBerge, CFA, Vice President Special Reports jonathanl@bcaresearch.com 1 Please see U.S. Bond Strategy and Global Fixed Income Strategy Weekly Reports “The New Battleground For Monetary Policy” and “Forward Guidance On Steroids”, dated March 26, 2019, for a detailed update on our view for Fed rate hikes and how investors should interpret the recent inversion in the yield curve. 2 Please see China Investment Strategy Weekly Report, “Dealing With A (Largely) False Narrative”, dated February 27, 2019, available at cis.bcaresearch.com 3 Please see China Investment Strategy Weekly Report, “2019 Key Views: Four Themes For China In The Coming Year”, dated December 5, 2018, available at cis.bcaresearch.com 4 Please see “Some U.S. Officials Said To See China Walking Back Trade Pledges”, Bloomberg News, dated March 19, 2019, and “Donald Trump-Xi Jinping meeting to end US-China trade war may be pushed back to June, sources say”, South China Morning Post. 5 Please see China Investment Strategy Special Report, “The Data Lab: Testing The Predictability Of China’s Business Cycle”, dated November 30, 2017, available at cis.bcaresearch.com 6 Please see Emerging Markets Strategy Weekly Report, “EM: A Sustainable Rally Or A False Start?”, dated March 7, 2019, available at ems.bcaresearch.com 7 Please see Professor Damodoran’s website for more information on his estimates of the equity risk premium. 8 Please see China Investment Strategy Weekly Report, “China Macro And Market Review”, dated March 13, 2019, available at cis.bcaresearch.com 9 Please see China Investment Strategy Weekly Report, “Moderate Releveraging And Currency Stability: An Impossible Dream?”, dated September 5, 2018, available at cis.bcaresearch.com 10 Please see China Investment Strategy Special Report, “Monitoring Chinese Capital Outflows”, dated March 20, 2019, available at cis.bcaresearch.com Cyclical Investment Stance Equity Sector Recommendations
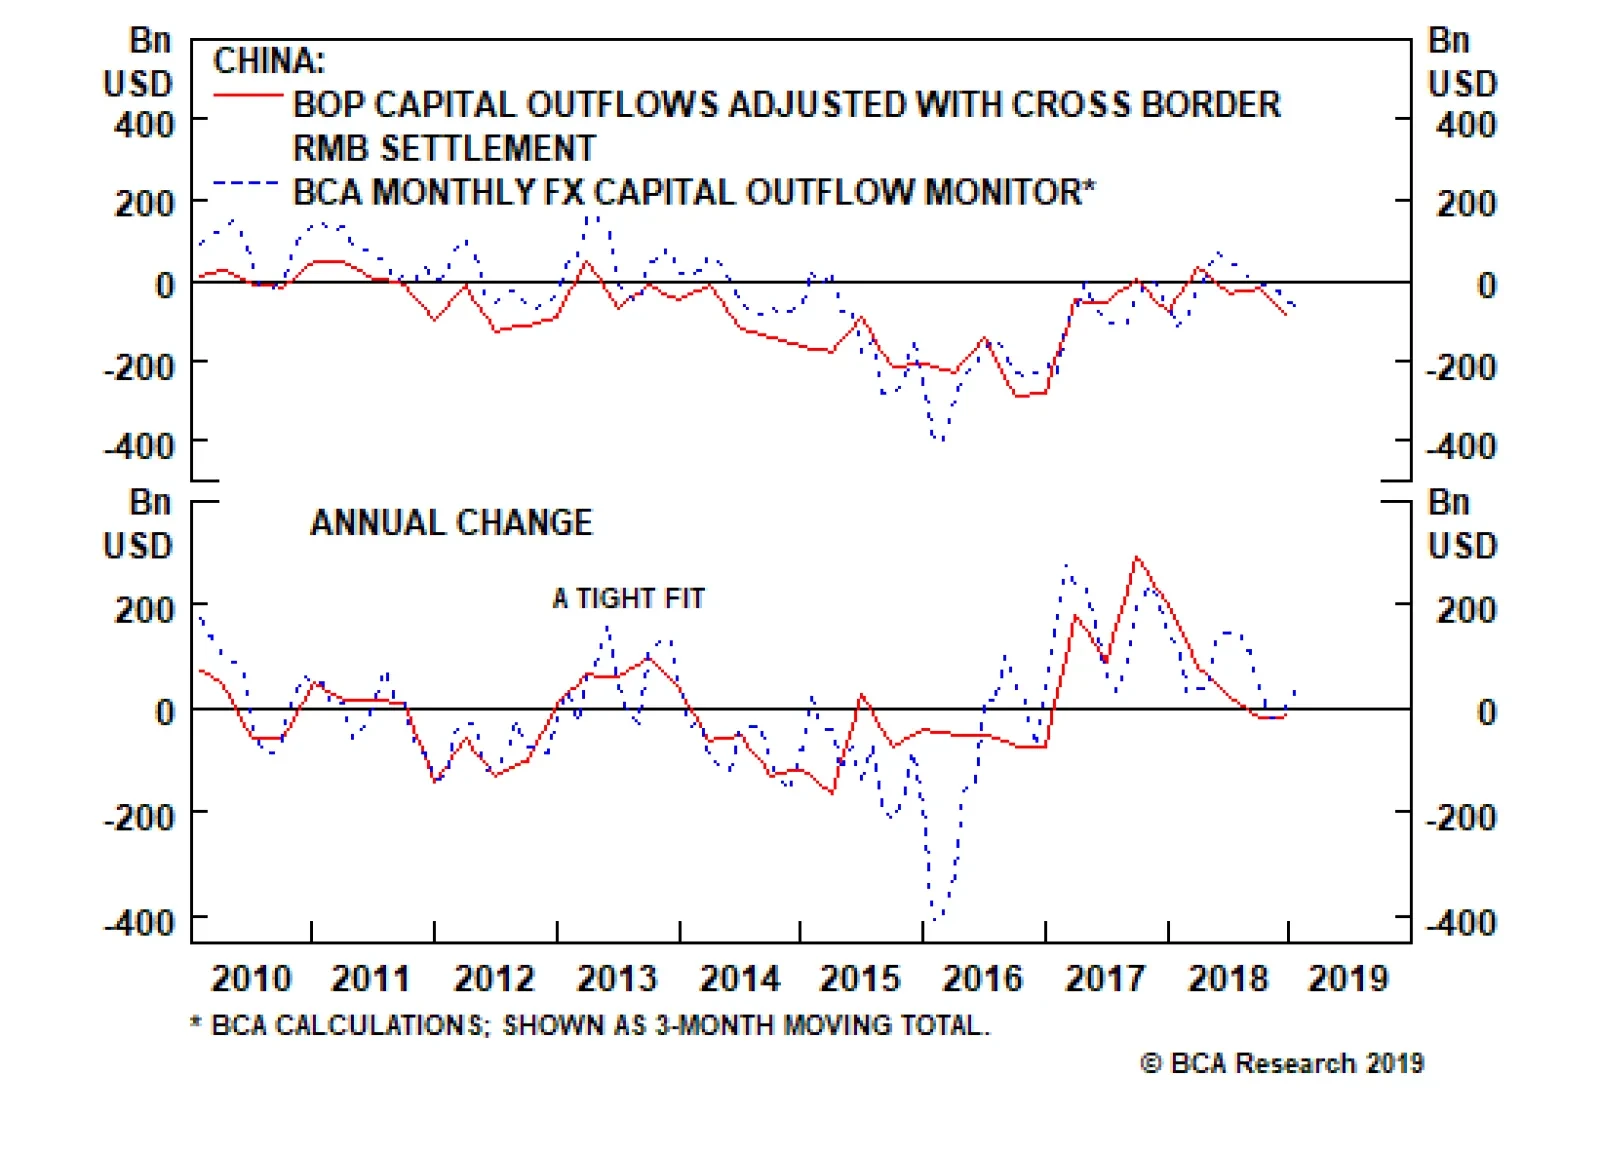
The chart above presents our China Investment Strategy team’s quarterly balance of payments-based capital flow measure (adjusted for cross-border capital flow) with our newly calculated monthly proxy. Divergences between the series exist in level terms, but…
We continue to expect copper prices to increase in the near term, as China’s credit cycle bottoms and DM central banks soften their monetary-policy stance. Fiscal and monetary stimulus in China also will be supportive of base metals prices going forward. The evolution of the Sino - U.S. trade negotiations remains a risk to our view, given how important the outcome of these talks will be for investors’ expectations and sentiment. Markets appear to be discounting a positive outcome. Anything that scuppers these talks – or results in a no-deal outcome – will be a negative for base metals, copper in particular. Our tactical long copper position is up by 1.2% since we initiated it last week. Highlights Energy: Overweight. Russian oil companies are expected to keep production lower until July, when the current OPEC 2.0 production-cutting agreement now in place expires. We expect the deal will be extended to year-end.1 Separately, the risk of a complete shutdown in Venezuela’s oil industry rose significantly, as a power failure in most of the country all but eliminated potable water supplies and significantly reduced oil exports. Base Metals/Bulks: Neutral. High-grade iron-ore prices got a boost this week as Vale was ordered to temporarily suspend exports from its primary port at Guaiba Island terminal in Rio de Janeiro state, according to Metal Bulletin’s Fastmarkets.2 The price-reporting agency’s 62% Fe Iron Ore Index rose $1.46/MT at $85.25/MT Tuesday. Precious Metals: Neutral. Spot gold is back above $1,300/oz, on the back of monetary policy easing among important central banks. This also is supporting base metals globally (see below). Ags/Softs: Underweight. Grain markets continue to drift sideways, awaiting definitive news re Sino - U.S. trade talks, specifically when presidents Xi and Trump will meet to finalize a deal (see below). Separately, wheat and corn inventories are expected to rise on the back of higher supplies and lower exports, the USDA forecast in its latest world supply-demand estimates. Feature Recent data releases confirm our view that global growth will remain weak in 1Q19 and early 2Q19. This will continue to put downward pressure on cyclical commodities – chiefly base metals and oil (Chart of the Week). Chart of the WeekGlobal Growth Slows In 1Q19
Global Growth Slows In 1Q19
Global Growth Slows In 1Q19
The persistence of the slowdown provoked major central banks to adopt a dovish stance in the short-term. This is easily seen in the recent actions by the U.S. Fed, the European Central Bank (ECB), the Bank of Canada (BoC) and the Reserve Bank of Australia (RBA), all of which have communicated a pause in their rate normalization policies.3 At the moment, the frail global growth is partly balanced by expectations of a positive outcome re the ongoing Sino - U.S. trade negotiations (Chart 2). In the coming months, we expect the effect of accommodative DM monetary policy combined with an expansion in China’s credit (more on this below) and fiscal stimulus – i.e., tax cuts announced earlier this month amounting to almost $300 billion (~ 2 trillion RMB) meant to support policymakers’ GDP growth targets – will go a long way toward reversing the earlier contraction. The effect of these policy decisions will be apparent in 2H19. Chart 2China Growth To Hook Higher
China Growth To Hook Higher
China Growth To Hook Higher
China’s Credit Cycle Bottomed In December 2018 The evolution of China’s credit cycle remains a central pillar to our view commodity demand growth in 2H19 will surpass consensus expectations. The massive growth reported in China’s January credit statistics revived investors’ expectations that China’s banks will re-open the credit valves as they did in 2016.4 In our view, this number does signal a bottom in China’s credit cycle, and implies Chinese – and indirectly EM – growth will bottom sometime this year. However, we still are not expecting a complete blowout credit expansion this year. We continue to believe Chinese policymakers will focus on stabilizing credit in 1H19 with moderate increases in supply, and start increasing stimulus in 2H19 or 2020 in order to maximize its effect later in 2020 ahead of the 100th anniversary of the founding of the Chinese Communist Party (CCP) in 2021. The soft February credit number released this week supports this argument.5 China’s Credit Cycle Matters For Base Metals Demand The relationship between China’s credit cycles and base metal prices endures and remains robust. We measure China’s aggregate credit using bank and non-bank claims on non-financial enterprises, households, local and central governments, and non-bank financial institutions. This corresponds to adding outstanding central and local government bonds to China’s Total Social Financing (TSF).6 The annual change in aggregate credit – or its impulses – do not perfectly capture the cycles in global base metal demand. These variables provide interesting signals about the direction and magnitude of movements in credit, however, they do not track base metals’ price cycles accurately and consistently (Chart 3). Chart 3Metals Price Cycles Don't Track Changed In China's Credit
Metals Price Cycles Don't Track Changed In China's Credit
Metals Price Cycles Don't Track Changed In China's Credit
To decompose this variable into its trend and cycle, we use a proxy of the credit cycle constructed using the Hodrick-Prescott and Hamilton filters, and the standardized 12-month credit impulse (Chart 4).7 Chart 4China's Credit Cycle Proxy
China's Credit Cycle Proxy
China's Credit Cycle Proxy
We find that our credit cycle proxy Granger causes base metal prices, import volume and industrial activity (Table 1).8 On average, it leads these variables by 4-6 months (Chart 5). Hence, we believe our credit cycle proxy provides valuable information about future commodity demand in China. Table 1China Credit Cycle Correlations
Bottoming Of China's Credit Cycle Bullish For Copper Over Near Term
Bottoming Of China's Credit Cycle Bullish For Copper Over Near Term
Chart 5
In fact, when regressing copper prices and the LMEX against it, we found that 60% and 58% of the variation in copper prices and the LMEX, can be explained by the linear relationship with our China credit cycle proxy, respectively (Chart 6). Chart 6China's Credit Cycle and Metals Prices
China's Credit Cycle and Metals Prices
China's Credit Cycle and Metals Prices
Given the leading property of China’s credit cycles with respect to industrial activity and metal prices, we included this new proxy in our Global Industrial Activity (GIA) index.9 This improves the correlation of our index with copper prices (Chart 7). Chart 7Credit Cycle Improves BCA's GIA
Credit Cycle Improves BCA's GIA
Credit Cycle Improves BCA's GIA
Currently, our models suggest copper prices should increase in the coming months as China’s credit cycle bottoms and DM central banks soften their monetary policy stance. The evolution of the China-U.S. trade negotiations remains a risk to our view as the outcome will weigh on investors’ expectations and sentiment. China’s Vs. DMs’ Credit Cycles Between 2009 and 2014, China’s credit cycle lagged the U.S. and EU’s broad money cycles (Chart 8). This counter-cyclicality is partly explained by its elevated level of exports to the U.S. and of hard goods to Europe. When the global economic cycle works in China’s favor – i.e., when the Fed and ECB are accommodative or fiscal stimulus is deployed in either or both regions – China’s exports rise as U.S. and EU aggregate demand increases. This typically reduces the need for endogenous fiscal or monetary stimulus within China. Chart 8China's Credit Cycle Lags U.S., EU Money Cycles
China's Credit Cycle Lags U.S., EU Money Cycles
China's Credit Cycle Lags U.S., EU Money Cycles
On the other hand, when the global economic cycle contracts and fiscal and monetary policy ex China becomes a headwind, Chinese policymakers typically need to deploy fiscal and monetary policy to keep growth going, or at least avoid a contraction in their economy. Between 2016 and 2017, DM and China credit cycles aligned and increased simultaneously. Taking into account the 4-to-6-month lag between the time credit supply is increased and commodity demand rises, this created bullish conditions for metals and oil from 2H16 to 1H18, pushing copper prices up by 60%. In 2018, both regions’ cycles rolled over. Base metals markets currently are experiencing the consequences of this contraction in credit availability and tightening of financial conditions generally. Going forward, we expect China will step in to raise domestic demand and offset the impact of the decline in credit availability elsewhere, which is affecting demand for its exports in the short-term. In the medium-term, the U.S. and EU, along with India, do not appear to be inclined to absorb Chinese exports to the extent they did in the past, which means the pivot to domestically generated growth through consumer- and services-led demand is the most viable alternative Chinese policymakers have to keep growth on target. Bottom Line: The dovish turn of major DM central banks combined with a bottoming of China’s credit cycle will support cyclical commodities at the margin in the coming months. During the second half of this year, we expect a more significant pick up in China’s credit, setting the stage for a year-end rally in base metal prices. As a consequence, the impact of China’s credit growth on base metals demand could diminish compared to previous stimulus targeting industrial demand. Hugo Bélanger, Senior Analyst Commodity & Energy Strategy HugoB@bcaresearch.com Robert P. Ryan, Chief Commodity & Energy Strategist rryan@bcaresearch.com Footnotes 1 Please see “Russia’s oil companies ready to cut output until July: TASS,” published by reuters.com March 12, 2019. 2 Please see Fastmarkets MB’s Daily Steel, March 12, 2019. 3 Please see “Pervasive Uncertainty, Persuasive Central Banks,” published by BCA Research’s Global Fixed Income Strategy March 12, 2019. It is available at gfis.bcaresearch.com. 4 Please see “China Macro And Market Review,” published by BCA Research’s China Investment Strategy March 13, 2019. It is available at cis.bcaresearch.com. 5 See footnote 4 above. 6 For more details please see “EM: A Sustainable Rally Or A False Start?” published by BCA Research’s Emerging Market Strategy March 7, 2019. It is available at ems.bcaresearch.com. 7 Hamilton notes the HP filter can be problematic. In general, we agree with critics of the filter (i.e. it results in spurious dynamics that are unrelated with the true data-generating process, it has an end-point bias which affects its real-time properties, and it is highly dependent on the parameter selection). However, there are some arguments in support of using the HP filter to proxy the credit cycle. First, as long as there are no clear theoretical foundation for an accurate measurement of the credit cycle, empirical validation should remain the number one criteria by which one selects its proxy. Second, credit cycles vary in duration and this weakens the ability to construct a reliable proxy. The usual parameter used with the HP filter favors short-term cycles (i.e. ~ 2 years) while the Hamilton filter focuses on medium-term cycles (i.e. ~ 5 years). Therefore, both can convey useful information. Third, China’s aggregate credit variable in level has a quasi-linear trend and is roughly approximated by a trend-stationary process with breaks in the trend and constant. Such a process should converge in limit when decomposed using the HP filter. Please see James D. Hamilton (2018), “Why You Should Never Use the Hodrick-Prescott Filter,” The Review of Economics and Statistics, vol 100(5), pages 831-843. and Phillips, Peter C. B. and Jin, Sainan (2015), “Business Cycles, Trend Elimination, and the HP filter,” Cowles Foundation Discussion Paper No. 2005. 8 Granger causality refers to a statistical technique developed by Clive Granger, the 2003 Nobel Laureate in Economics, which is used to determine whether one variable can be said to have caused (or predicted) another variable, given the past performance of each. Using standard econometric techniques, Granger showed one variable can be shown to have “caused” another, and that two-way causality also can be demonstrated (i.e., a feedback loop between the variables can exist based on the historical performance of each). 9 Please see “Oil, Copper Demand Worries Are Overdone,” published by BCA Research’s Commodity & Energy Strategy February 14, 2019. It is available at ces.bcaresearch.com. Investment Views and Themes Recommendations Strategic Recommendations Tactical Trades Commodity Prices and Plays Reference Table Trades Closed in 2019 Summary of Trades
Image
Highlights Analysis on Indonesia is available below. EM financial markets have diverged from the global growth indicators they have historically correlated with. This raises doubts about the sustainability of this rally. In China, broad bank credit has not accelerated at all, while non-bank credit growth rose sharply in January. The lack of recovery in broad bank credit growth is corroborated by lingering sluggishness in broad money growth. This refutes widespread perception in the global investment community that Chinese banks have re-opened the credit spigots again. Feature The headline news has all been positive for emerging markets over the past two months: The Federal Reserve is going on hold, China is stimulating its economy, the U.S. and China are nearing a trade agreement and risk-on market dynamics are permeating worldwide. Nevertheless, EM stocks have failed to outperform the global equity benchmark (Chart I-1, top panel). Notably, EM relative equity performance rolled over in late December when global share prices bottomed. Chart I-1EM Stocks Have Underperformed DM Ones Since Late December
EM Stocks Have Underperformed DM Ones Since Late December
EM Stocks Have Underperformed DM Ones Since Late December
In absolute terms, EM equities have been attempting to break above their 200-day moving average, but have so far failed to do so decisively (Chart I-1, bottom panel). When a market struggles to break out or outperform amid favorable news flows and buoyant investor sentiment, the odds are that it is facing formidable headwinds under the surface, and is at risk of relapsing. We sense EM currently fits this profile. Needless to say, investor consensus is very bullish on EM, and dominated by the above-mentioned narrative, specifically the Fed turning dovish and China stimulating, which is reminiscent of 2016 when EM staged a cyclical rally. Consequently, investors have rushed to pile into EM stocks and fixed-income. Chart I-2 illustrates that asset managers’ net holdings of EM ETF (EEM) futures have doubled since October 2018. Chart I-2Investor Consensus Is Very Bullish On EM
Investor Consensus Is Very Bullish On EM
Investor Consensus Is Very Bullish On EM
As of mid-February, EMs were by far the most overweight region within global equity portfolios, according to the most recent Bank of America/Merrill Lynch survey. The survey states that net 37% of global equity investors - who participated in the survey - were overweight EM. One of our clients that we met with on the road last week summed it up like this: “Investors have ‘recency bias’.” In other words, investors believe that 2019 will resemble 2016, and in turn have no appetite to bet against Chinese stimulus. We are in accord with this interpretation of investor behavior and the EM/China rally. Yet there are some noteworthy differences between today and 2016. First, in 2016, there was massive stimulus for China’s property market. At the time, the People’s Bank of China (PBoC) monetized the unsold housing stock in Tier-3 and -4 cities via its Pledged Supplementary Lending facility. At present, there is no stimulus for real estate. Second, by early 2016 EM profits had already contracted substantially. EM profits have yet to shrink in the current downtrend. Our thesis is that EM profits will contract this year for reasons we elaborated on in depth in our previous report, Mind The Time Gap. China’s credit and fiscal impulse leads EM/Chinese profits by about 12 months, and the recent improvement in this indicator, if sustained, suggests that a trough in EM/Chinese corporate earnings will only be reached in late 2019 (Chart I-3). Therefore, as EM profits shrink, investors will likely sell EM risk assets. Chart I-3EM Corporate Earnings Are Beginning To Contract
EM Corporate Earnings Are Beginning To Contract
EM Corporate Earnings Are Beginning To Contract
Altogether, these differences with 2016 make us reluctant to chase the current EM rally, and we continue to expect a meaningful reversal in EM risk assets in the months ahead. Monitoring Global Growth We maintain that EM is much more leveraged to global trade and China’s growth than to Fed policy. For a detailed discussion on this matter, please refer to EM: A Replay of 2016 or 2001? report from February 7, 2019. Therefore, the Fed’s dovish turn is not a sufficient reason to buy EM risk assets. To buy EM cyclically, we would need to change our outlook on global trade and Chinese imports. China influences the rest of the world via its imports. A closer look at the indicators that correlate with EM risk assets and commodities do not justify the recent EM rebound. In particular: The import sub-component of China’s NBS manufacturing PMI strongly correlates with EM share prices, excess returns in EM sovereign credit, and industrial metals prices and suggest that investors should fade this rebound (Chart I-4). Chart I-4EM Stocks, EM Credit Markets, As Well As Commodities Prices Are Driven By Chinese Imports
EM Stocks, EM Credit Markets, As Well As Commodities Prices Are Driven By Chinese Imports
EM Stocks, EM Credit Markets, As Well As Commodities Prices Are Driven By Chinese Imports
The Caixin manufacturing PMI for China was up in February, but the NBS manufacturing PMI fell. In turn, manufacturing PMI indexes in Korea, Taiwan, Japan and Singapore are all plunging, with several of them dropping well below the 50 boom-bust mark (Chart I-5). Chart I-5Asian Manufacturing Is Contracting
Asian Manufacturing Is Contracting
Asian Manufacturing Is Contracting
Korean, Taiwanese, Japanese and Singaporean shipments to China were shrinking in January, while their exports to the U.S. were resilient (Chart I-6). This confirms that global trade has been weak due to China, and that there are no signs of its reversal. Chart I-6Asian Exports To China And U.S.
Asian Exports To China And U.S
Asian Exports To China And U.S
Moreover, Korea released its February export data, and its aggregate outbound shipments are contracting (Chart I-7). Chart I-7Korean Exports: Deepening Contraction
Korean Exports: Deepening Contraction
Korean Exports: Deepening Contraction
Further, China’s container freight index – the price to ship containers – has rolled over again after picking-up late last year due to front-loading of shipments to the U.S. which were induced by the U.S. import tariffs. This signals ongoing weakness in global demand, and does not justify the latest rebound in EM financial markets in general and currencies in particular (Chart I-8). Chart I-8Global Trade Is A Risk To EM Currencies
Global Trade Is A Risk To EM Currencies
Global Trade Is A Risk To EM Currencies
Finally, even in the U.S. where manufacturing has been the most resilient globally, the odds point to notable weakness in this sector. Specifically, the continuous underperformance of U.S. high-beta industrial stocks to U.S. overall industrials beckons a further slowdown in American manufacturing (Chart I-9). Chart I-9U.S. Manufacturing Is In A Soft Spot
U.S. Manufacturing Is In A Soft Spot
U.S. Manufacturing Is In A Soft Spot
Bottom Line: Although financial markets are forward-looking, the recent rally has been too fast and has already gone too far. This has created conditions for a material setback as global/China growth will continue to disappoint in the months ahead. China: Credit Versus Money Growth We have been receiving questions from clients as to whether investors should heed to the message from China’s money or credit data, given they are presently sending contradictory messages (Chart I-10). Chart I-10China: Narrow, Broad Money, And Aggregate Credit
China: Narrow, Broad Money, And Aggregate Credit
China: Narrow, Broad Money, And Aggregate Credit
Even though narrow money (M1) has historically been an excellent indicator for China/EM business cycles, the most recent (January) print – M1 annual growth rate registered a record low – was distorted due to technical/seasonal factors, and should be ignored. Specifically, deposits by enterprises plunged in January and household deposits surged as companies paid out bonuses to employees in late January ahead of the Chinese New Year that began on February 5 (Chart I-11). Provided enterprise demand deposits are in M1 but household demand deposits are a part of M2, M1 was artificially depressed in January. It will rebound in February. Chart I-11China: Technical Reasons For M1 Plunge In January
China: Technical Reasons For M1 Plunge In January
China: Technical Reasons For M1 Plunge In January
Broad money provides a more comprehensive picture of money creation in China. As such, it is more relevant to compare broad money with aggregate credit. To compute aggregate credit, we add outstanding central and local government bonds to Total Social Financing (TSF). Chart I-12 illustrates the latest improvement in aggregate credit is not confirmed by either the PBoC’s broad money measure, M2, or our measure, M3 (M3 = M2 plus other deposits plus banks’ other liabilities excluding bonds). We created this M3 measure of broad money supply because in our opinion, M2 has been underestimating the extent of money creation in China in recent years due to financial engineering. Chart I-12The Recent Uptick In Aggregate Credit Is Not Confirmed By Broad Money
The Recent Uptick In Aggregate Credit Is Not Confirmed By Broad Money
The Recent Uptick In Aggregate Credit Is Not Confirmed By Broad Money
As discussed in Box I-1 on pages 12-13, lending or purchasing of securities by banks simultaneously creates money. Therefore, bank broad credit acceleration should be mirrored in a broad money upturn. Does the lack of revival in broad money mean the latest uptick in aggregate credit data has been driven by non-bank credit? Our analysis suggests yes – non-bank credit is responsible for the strong rise in the aggregate credit numbers in January. We deconstructed aggregate credit into broad bank credit and non-bank credit (Diagram I-1). Chart I-13 illustrates that broad bank credit has not accelerated at all, while non-bank credit growth rose in January.
Chart I-
Chart I-13China: Recent Credit Acceleration Is Due To Non-Bank Credit
China: Recent Credit Acceleration Is Due To Non-Bank Credit
China: Recent Credit Acceleration Is Due To Non-Bank Credit
The lack of recovery in broad bank credit growth is corroborated by lingering sluggishness in broad money (both M2 and M3) growth (Chart I-14). Chart I-14Broad Bank Credit Is Consistent With Broad Money (As It Should Be)
Broad Bank Credit Is Consistent With Broad Money (As It Should Be)
Broad Bank Credit Is Consistent With Broad Money (As It Should Be)
Consequently, this refutes the widespread perception in the global investment community that Chinese banks have re-opened the credit spigots. Chart I-15demonstrates the annual growth rate of each component of broad bank credit. While mainland banks’ loan growth to enterprises has accelerated, their lending to non-bank financial institutions has continued to shrink. Chart I-15Broad Bank Credit And Its Components
Broad Bank Credit And Its Components
Broad Bank Credit And Its Components
In sum, broad bank credit and broad money have not revived, and their impulses are rolling over, having failed to break above zero (Chart I-14, bottom panel). Bottom Line: The improvement in aggregate credit growth in January was due to credit provided/bonds purchased by non-banks rather than by banks. This does not tell us whether the credit growth acceleration is sustainable. For a more detailed discussion on the differences between money and credit, please refer to Box I-1 on page 12-13. Investors prefer simple narratives, and have readily embraced the story that China has opened up the credit faucets. Broad bank credit data and broad money supply data do not corroborate this thesis. It may change in the months ahead, but our point is that for the moment there is not yet a simple narrative about China’s credit cycle. Investment Implications Even though China’s aggregate credit impulse ticked up in January, the 2011-‘12 and 2015-‘16 episodes signify that its bottoming can last many months. Critically, EM financial markets have historically lagged turning points in the aggregate credit impulse. These time lags have been anywhere between three to 18 months over the past 10 years. Furthermore, in 2012 there was only a minor rebound in EM share prices – not a cyclical rally – in response to the significant rise in China’s aggregate credit impulse (Chart I-16, top panel). Chart I-16Beware Of The Time Lag
Beware Of The Time Lag
Beware Of The Time Lag
Hence, even if January marked the bottom in the aggregate credit impulse – which is plausible in our opinion – EM risk assets will remain at risk based on historical time lags between the aggregate credit impulse and China-related financial markets.1 BOX 1 Why And When Money Supply Differs From Credit The following elaborates on the key differences between broad money supply and aggregate credit. 1. Why and when do broad money and credit diverge? When commercial banks provide loans to or buy bonds (or any other asset) from non-banks, they simultaneously create new money supply/deposits. Broad money supply is the sum of all deposits in the banking system, which is why we use the terms money and deposits interchangeably. When non-bank financial institutions – in China's case financial trust and investment corporations, financial leasing companies, auto-financing companies and loan companies – as well as enterprises and households make loans or buy bonds, they do not create money. Hence, money supply/deposits is mostly equal to net cumulative broad bank credit creation. The difference between aggregate credit and money supply is due to lending activities of non-bank entities (see Diagram I-1 on page 9). Lending, purchasing of bonds, or any other forms of financing by non-bank entities does not change money supply. Thus, aggregate credit is more relevant than money supply to forecast business cycle fluctuations. Apart from the fact that banks still play a very large role in aggregate financing in China, there are a few other reasons why one should not ignore broad money and rely solely on aggregate credit: Banks can extend credit, but might choose not to classify it as loans on their balance sheet for regulatory reasons. Chinese banks did this in the past by booking loans as non-standard credit assets. In any case, when a bank lends to a non-bank it creates new deposits/money, and it is hard to conceal deposits/liabilities. In these cases, broad money supply gives a better signal about the true extent of credit growth than statistics on loans. If under regulatory pressures banks reclassify their non-standard credit assets as loans, the amount of loans will expand, even though no new lending occurs. Yet, money supply/deposits will not change. In this case, loan numbers will give a false signal and money supply will be a better indicator for new credit origination by banks and, thereby, for economic activity. The true measure of Chinese bank loans and credit data were probably disguised over the past several years because banks and non-bank financial institutions were involved in financial engineering. However, in the past two years, the regulatory clampdown forced Chinese commercial banks to unwind some of these structures and properly reclassify items on their balance sheets. Both the masking of credit assets and the ensuing reclassification could have distorted loan and credit data. This is why we use broad money supply as a litmus test to gauge banks’ broad credit origination. Given TSF includes bank loans but does not include banks’ non-standard credit assets, we believe TSF understates the amount of credit in the economy. As a result, we have not been able to calculate an accurate aggregate level of non-bank credit. Only since mid-2017, when under the regulatory clampdown, banks have stopped classifying loans as non-standard credit assets, can the annual growth rate of TSF serve as a meaningful statistic. Hence, we estimate the annual growth rate of non-bank credit only starting in 2018 (please refer to Chart I-13 on page 9). 2. Does the central bank (PBoC) create money by injecting liquidity into the system? Barring lending to or buying assets from non-banks – which does not typically occur outside of quantitative easing (QE) programs – central banks do not create broad money or deposits. Central banks create banking system reserves, which are not part of the broad money supply in any country. Money supply/deposits, the ultimate purchasing power for economic agents, is created solely by commercial banks “out of thin air,” as we have discussed and illustrated in our series of reports on money, credit and savings. 3. Why do we use impulses (second derivatives of money/credit) rather than growth rates? Our goal is to forecast a change in economic activity/capital spending/imports/enterprise revenues – i.e., a change in flow variables. Money and credit are stock variables. Therefore, a change (the first derivative) in outstanding money and credit produces flow variables. The latter measures new credit and money origination in a given period. These are comparable with flow variables like spending, income and profits. To gauge changes in flow variables, i.e., the growth rate of spending, one needs to calculate a change in new money and credit origination – i.e., change in their net flow. In brief, to do an apples-to-apples comparison, one needs to use the second derivative (a change in change) in money and credit – i.e., changes in their flows – to predict changes in flow variables such as GDP/capital spending/imports/enterprise revenues. Arthur Budaghyan, Senior Vice President Emerging Markets Strategy arthurb@bcaresearch.com Lin Xiang, Research Analyst linx@bcaresearch.com Indonesia: It Is Not All About The Fed Indonesian stocks have outperformed their emerging market peers significantly in the past few months as the Federal Reserve has turned dovish and U.S. rate expectations have declined. Although U.S. bond yields do strongly and inversely correlate with Indonesian stocks’ relative performance versus the EM equity benchmark (Chart II-1, top panel), we believe there are other factors – such as Chinese growth and commodities prices – that are also important to this market (Chart II-1, bottom panel). Chart II-1Indonesian Stocks: The Fed Versus Commodities
Indonesian Stocks: The Fed Versus Commodities
Indonesian Stocks: The Fed Versus Commodities
In the next several months, slowing Chinese growth, lower commodities prices, and a renewed sell-off in EM markets will take a toll on Indonesian financial markets. Indonesian exports are contracting which will intensify as commodities prices fall and China’s purchases of coal and base metals drop (Chart II-2, top panel). Chart II-2Indonesia: Exports Are Shrinking
Indonesia: Exports Are Plunging
Indonesia: Exports Are Plunging
Indonesia’s current account deficit is already large and will continue widening as the export contraction deepens (Chart II-2, bottom panel). Remarkably, the nation’s commercial banks have been encouraged to keep the credit taps open as the central bank – Bank Indonesia (BI) – has been injecting enormous amounts of liquidity (excess reserves) into the banking system (Chart II-3, top panel). Given these liquidity injections, bank credit and domestic demand growth have remained more resilient than would otherwise have been the case. Chart II-3The Central Bank Is Injecting Liquidity
Indonesia's Central Bank Is Injecting Liquidity
Indonesia's Central Bank Is Injecting Liquidity
Yet, by injecting such enormous amounts of excess reserves into the system, the central bank has more than negated its previous liquidity tightening, resulting from the sales of its foreign exchange reserves in order to defend the rupiah (Chart II-3, bottom panel). The implications of such policy are that these excess reserves could encourage speculation against the rupiah, especially amid weakening global growth and falling commodities prices. Provided foreigners own large portions of Indonesian stocks and local-currency government bonds, a depreciation in the rupiah will produce a renewed selloff in the nation’s financial markets. A final point on Indonesian commercial banks: their net interest margins have been narrowing sharply (Chart II-4, top panel). Chart II-4Commercial Banks' Profits Will Weaken
Commercial Banks' Profits Will Weaken
Commercial Banks' Profits Will Weaken
Moreover, as global growth slows, non-performing loans (NPLs) on the balance sheets of Indonesian banks will rise. In turn, provisioning for bad loans will also increase, and bank earnings will decline (Chart II-4, bottom panel). These dynamics will be bearish for Indonesian commercial banks, which account for 44% of the overall MSCI Indonesia index. Bottom Line: Continue avoiding/underweighting Indonesian stocks and fixed-income markets. We continue shorting the IDR versus the U.S. dollar. Ayman Kawtharani, Associate Editor ayman@bcaresearch.com Footnotes 1 Please note that this represents the Emerging Markets Strategy team’s view and is different from BCA’s house view on global risk assets and global growth. The key point of contention is the outlook for China’s growth. Equity Recommendations Fixed-Income, Credit And Currency Recommendations
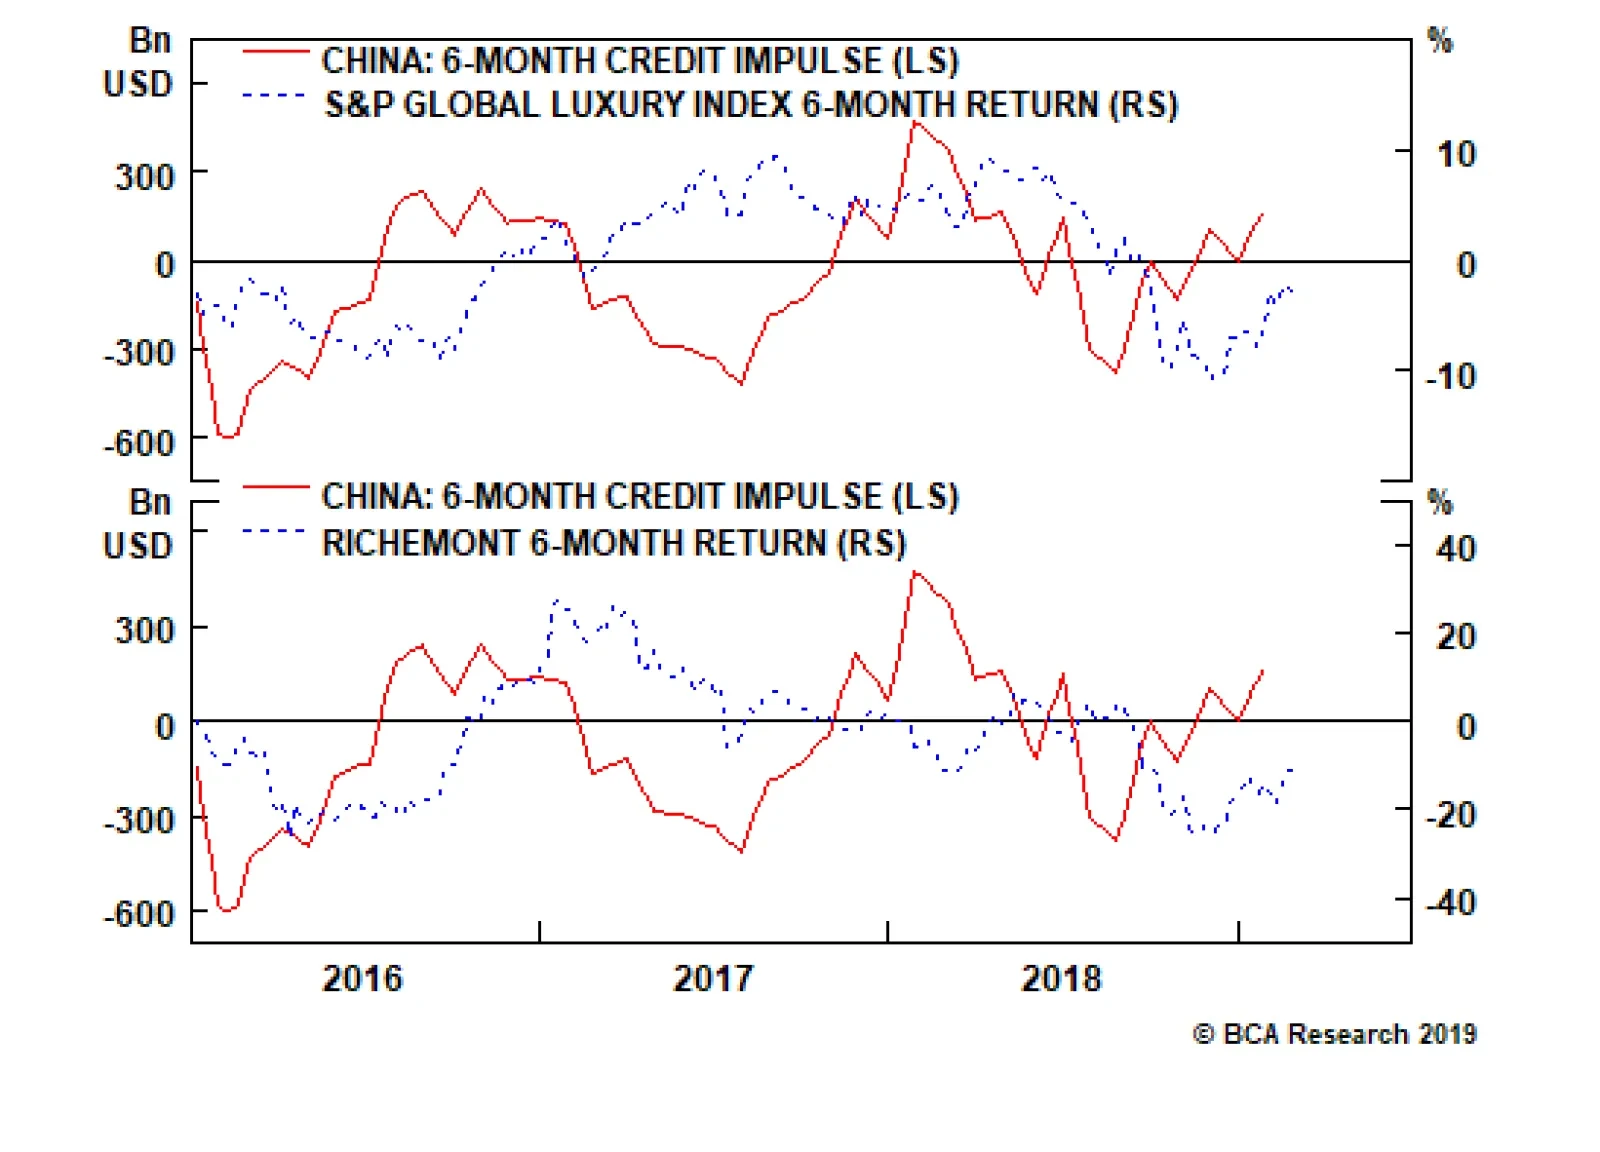
Regarding the European luxury goods sector, we often get following question: is it, just like the basic resources sector, a direct play on China’s growth cycle? The answer is no. Recently, the connection between the fortunes of ‘soft’ luxury goods brands like…
Highlights Please note that analysis on India is published below. Even if the recent upturn in the Chinese credit impulse is sustained, there will likely still be a six- to nine-month lag between the impulse’s trough and the bottom in the mainland’s business cycle. EM corporate earnings cycles typically lag Chinese stimulus efforts by about nine months. Therefore, EM profits will be contracting in the first three quarters of 2019. This will short-circuit the current rebound in EM share prices. EM equity valuations are not cheap enough to shield stocks from profit contraction. Feature China’s credit growth was very strong in January. We contend that even if the upturn in the credit impulse proves to be persistent, there will likely be a six- to nine-month lag between its low point and the bottom in the mainland’s business cycle. Chart I-1 demonstrates that the credit impulse leads both nominal manufacturing output growth and the manufacturing PMI’s import subcomponent by roughly nine months. Chinese imports are the most pertinent variable to gauge China’s economic impact on the rest of the world. Chart I-1China: Credit Impulse Leads Business Cycle By Nine Months
China: Credit Impulse Leads Business Cycle By Nine Months
China: Credit Impulse Leads Business Cycle By Nine Months
In the meantime, will financial markets exposed to Chinese growth look through the valley of the ongoing growth deceleration and continue to rally? Or will they experience a major relapse in the coming months? In our opinion, corporate profits will be the key to broader financial market performance. So long as corporate profits do not shrink, investors will likely look beyond weak macro data, and any weakness in stocks will be minor. However, if corporate profits contract in the next nine months, then share prices will plummet anew. EM Profits Are Heading Into Contraction Chart I-2 illustrates that China’s credit impulse leads both EM and Chinese corporate earnings per share (EPS) by at least nine months and that it currently foreshadows EPS contraction in the first three quarters of 2019. Even if the recent upturn in the credit impulse is sustained, EM and Chinese EPS growth will likely bottom only in August – while they are in negative territory. Chart I-2EM EPS Is Beginning To Contract
EM EPS Is Beginning To Contract
EM EPS Is Beginning To Contract
EM corporate earnings growth has already dropped to zero and will turn negative in 2019. Chart I-3A reveals that EPS in U.S. dollar terms are already contracting in six out of 10 sectors – industrials, consumer staples, consumer discretionary, telecom, utilities and health care. Chart I-3AEM EPS By Sector
EM EPS By Sector
EM EPS By Sector
Chart I-3BEM EPS By Sector
EM EPS By Sector
EM EPS By Sector
EPS growth has not yet turned negative for financials, technology, energy and materials (Chart I-3B). Notably, corporate earnings within these four sectors collectively account for 70% of EM total corporate earnings, as shown in Table I-1.
Chart I-
Over the course of 2019, these sectors’ EPS are also set to shrink: Technology (accounts for 20% of MSCI EM corporate earnings): NAND semiconductor prices have been plunging for some time, and DRAM prices are also beginning to drop (Chart I-4). This reflects broad-based weakness in global trade – global auto sales are shrinking for the first time since the 2008 global financial crisis, global semiconductor sales are relapsing and global mobile phones shipments are falling (Chart I-5). Chart I-4Semiconductor Prices Are Falling
Semiconductor Prices Are Falling
Semiconductor Prices Are Falling
Chart I-5Broad-Based Weakness In Global Trade
Broad-Based Weakness In Global Trade
Broad-Based Weakness In Global Trade
Semiconductors accounted for 77% of Samsung’s operating profits in the first three quarters of 2018, suggesting the potential drop in DRAM prices will be devastating for its profits. Next week we will publish a Special Report on Korea and discuss the outlook for both semiconductors and Korean profits in more detail. In addition, the ongoing contraction in Taiwanese exports of electronics parts confirms downside risks to EM tech earnings (please refer to top panel of Chart I-3B). In brief, the ongoing decline in semiconductor prices will bring about EPS contraction in the EM technology sector. Financials/Banks (financials make up 31% of EM corporate earnings): Banks’ profits often correlate with fluctuations in economic activity, because the latter drive non-performing loan (NPL) cycles (Chart I-6). NPL cycles outside Brazil, Russia and India – where the banking systems have already gone through substantial NPL recognition and provisioning – will deteriorate, and push banks to increase their provisions. The latter will be a major drag on EM banks’ profits. Chart I-6EM Banks EPS And Economic Activity
EM Banks EPS And Economic Activity
EM Banks EPS And Economic Activity
Regarding Chinese banks in particular, if the credit revival in January is sustained, it would strongly suggest that the government is resorting to its old, credit-driven growth playbook. Following 10 years of an enormous credit frenzy and a 20-year capital spending boom, it is currently difficult to find many financially viable projects. Hence, a renewed credit binge will once again be associated with further capital misallocation and more NPLs. Many of these projects will fail to generate sufficient cash flow to service debt. NPLs will thus rise considerably and the need to raise capital will dilute the banks’ existing shareholders. Of course, this will happen with a time lag. Chart I-7 shows that the gap between Chinese banks’ EPS and non-diluted profits has once again widened, and that EPS are beginning to contract. Chart I-7Chinese Banks: Earnings Dilution
Chinese Banks: Earnings Dilution
Chinese Banks: Earnings Dilution
Chinese banks could issue perpetual bonds – discussed in great detail in last week’s report – to recapitalize themselves. Nevertheless, this will be negative for existing shareholders. In a nutshell, despite low multiples, share prices of Chinese banks will drop because more credit expansion amid the lingering credit bubble is negative for existing shareholders. The basis is that it will ultimately lead to their dilution. Chinese banks make up 4.5% of the MSCI’s EM equity market cap and 10% of aggregate EM profits. Hence, their EPS contraction will have a non-trivial impact on overall EM EPS. Resource sectors (energy and materials together make 20% of EM corporate earnings): The ongoing slowdown in China will exert renewed selling pressure in commodities markets. As shown in Chart I-9 on page 8, base metals prices lag the turning points in the Chinese credit impulse by several months and are still at risk of renewed price decline. Hence, profits of firms in the materials sector are at risk. Energy companies’ trailing EPS growth is still positive because the late-2018 carnage in oil prices has not yet filtered through to corporate earnings announcements (Chart I-3B on page 3). More importantly, the recent oil price rebound can be attributed to both Saudi Arabia’s output cuts as well as stronger demand – in the form of a surge in Chinese imports of oil and petroleum products. Chart I-8 illustrates that growth rates of China’s intake of oil and related products approached zero when crude prices were rising but has dramatically accelerated following their plunge. This is consistent with China’s pattern of buying commodities on dips. The point is that the upside in oil prices will be capped by China, which will likely moderate its oil purchases going forward, as crude prices have recently rallied. Chart I-8China And Oil
bca.ems_wr_2019_02_21_s1_c8
bca.ems_wr_2019_02_21_s1_c8
Bottom Line: EM profit cycles lag Chinese’s stimulus by about nine months. EM profits will be contracting in the first three quarters of 2019. This will short-circuit the current rebound in EM share prices. China’s Credit Cycles And Financial Markets What has been the relationship between China’s credit cycle and related financial markets over the past 10 years? The time lag between turning points in China’s credit impulse and relevant financial markets can be anywhere from zero to 18 months. Chart I-9 illustrates historical time lags between the Chinese credit impulse on the one hand and EM share prices, base metals prices and the global manufacturing PMI on the other. The time lag has not been consistent over time. Chart I-9Chinese Credit Impulse And Financial Markets: Understanding Time Lags
Chinese Credit Impulse And Financial Markets: Understanding Time Lags
Chinese Credit Impulse And Financial Markets: Understanding Time Lags
In late 2015-early 2016, the rebound in China’s credit impulse led financial markets by six months. At the recent market peak in January 2018, the credit impulse led financial markets and the global manufacturing PMI by about 18 months. In the meantime, in the 2012-13 mini cycle, EM share prices and commodities markets did not rally much, despite the meaningful upturn in China’s credit impulse. Finally, at the 2010-2011 peak, the credit impulse led EM stocks and base metals prices by 12 months. In short, the credit impulse led those financial markets by a few months to as much as a year and a half. Further, not only do time lags to the stimulus vary, but the impact on both economic activity and financial markets varies as well. This is because both economic activity and financial markets are driven by human psychology and behavior; iterations in stimulus, economic activity and financial markets are chaotic and complex in nature and do not follow well-defined patterns. Given the poor state of sentiment among Chinese consumers, business managers and entrepreneurs, more stimulus and more time may be required to turn the mainland’s business cycle this time around. Besides, unlike in previous episodes, there has not been any stimulus for the property market and no tax reductions on auto sales. Finally, although China and the U.S. may strike a deal on trade, it is unlikely to be a comprehensive agreement that is sustainable in the long run. This would be consistent with our Geopolitical Strategy team’s view that China and the U.S. are in a long-term and broad geopolitical confrontation – not a trade war. The trade war and tariffs are just one dimension of this. Hence, Chinese consumers and businesses, as well as the global business community may well look through this potential deal and not significantly alter their cautious behavior, at least for some time. In other words, the genie of geopolitical confrontation is out of the bottle, and the presidents of the U.S. and China are unlikely to succeed in putting it back. Bottom Line: Turning points in China’s credit impulse generally lead financial markets exposed to Chinese growth by several months. Given that the improvement in the credit impulse is both very recent and modest, odds are that China-related plays including EM risk assets will go through a major selloff before putting in a durable bottom.1 EM Equity Valuations In terms of the ability of EM stocks to withstand profit contraction, would cheap valuations not shield share prices from a considerable drop? We do not think EM equities are cheap; their valuations are neutral. Hence, there is no real valuation cushion in EM stocks to help them endure a period of negative EPS growth. We have written frequently about valuations and will touch on the topic only briefly here. Market cap-based multiples indeed appear very low. However, some segments of the EM universe such as Chinese banks and state-owned companies in Russia, Brazil, China and India have had low multiples for years. In other words, they are a value trap and their multiples are low for a reason. We elaborated above why Chinese banks are chronically “cheap”. For many other companies, low multiples are due to structural issues such as the lack of focus on profitability and shareholder value, or the high cyclicality of profits. Many of these stocks have large market caps, which pull down the EM index’s aggregate multiple. To remove market-cap bias, we have calculated 20% trimmed-mean multiples by ranking 50 MSCI EM industry groups (sub-sectors) and cutting off the top and bottom 10%. Then, we calculate the equal-weighted average of the remaining 80% of the sub-sectors. We did this calculation for the following five ratios: trailing P/E, forward P/E, price-to-cash earnings, price-to-book value and price-to-dividend. Then, we combined them into a composite valuation indicator (Chart I-10, top panel). This indicator shows that EM equity valuations are neutral. Chart I-10EM Equity Valuations In Absolute Terms
bca.ems_wr_2019_02_21_s1_c10
bca.ems_wr_2019_02_21_s1_c10
In addition, we calculated the median and equal-weighted composite valuation indicators (Chart I-10, middle and bottom panels). They also remove market cap bias and tell the same message: EM stocks are trading close to their fair value. EM equities are also close to their historical average relative to developed markets (DM). Chart I-11 illustrates relative EM versus DM valuation indicators based on 20%-trimmed mean, median and equal-weighted metrics. Chart I-11EM Equity Valuations Versus DM
bca.ems_wr_2019_02_21_s1_c11
bca.ems_wr_2019_02_21_s1_c11
In sum, EM valuations are not cheap neither in absolute terms, nor relative to DM. According to both measures, valuations are neutral. Hence, valuations will not prevent share prices from falling as profits begin to contract. This is why we continue to recommend a defensive strategy for absolute-return investors, and we continue to underweight EM versus DM within a global equity portfolio. Arthur Budaghyan, Senior Vice President Emerging Markets Strategy arthurb@bcaresearch.com India: Beware Of Rural Growth Lapse Indian share prices are weak and are underperforming the emerging markets benchmark in U.S. dollar terms (Chart II-1, top panel). Small cap stocks are in a full-fledged bear market (Chart II-1, bottom panel). Chart II-1Indian Stocks Are Weak
Indian Stocks Are Weak
Indian Stocks Are Weak
The latest earnings season turned out to be disappointing. Many companies missed their earnings estimates. Chart II-2 shows that net profit margins of listed non-financial companies have turned down and overall EPS growth is weakening. Chart II-2Indian Corporate Profits Are Sluggish
Indian Corporate Profits Are Sluggish
Indian Corporate Profits Are Sluggish
Disappointing corporate earnings are confirmed by macro data as well. Chart II-3A shows that manufacturing production is decelerating and intermediate goods production is contracting. Further, sales of two-wheelers, three-wheelers, passenger and commercial vehicles, as well as tractors, are either slowing or contracting (Chart II-3B). Chart II-3ACyclical Spending Is Decelerating
Cyclical Spending Is Decelerating
Cyclical Spending Is Decelerating
Chart II-3BCyclical Spending Is Decelerating
Cyclical Spending Is Decelerating
Cyclical Spending Is Decelerating
This weakness emanates from rural areas. The basis is that food prices have been falling since the summer of 2018 – and are deflating for the first time since the early 2000s. This is hurting rural incomes. Several indicators confirm considerable weakness in rural income growth and the latter’s underperformance versus urban income and spending: The top panel of Chart II-4 illustrates that our proxy for spending in rural areas relative to urban areas has deteriorated massively along with the decline in Indian food prices. Chart II-4Rural Spending Is Weaker Than Urban One
Rural Spending Is Weaker Than Urban One
Rural Spending Is Weaker Than Urban One
This measure is calculated as revenue growth of four rural-exposed listed companies minus the revenue growth of four urban-exposed listed companies. In both cases, the companies largely operate in the consumer goods space. Credit growth in rural areas has lagged that of urban areas, explaining the underperformance of rural spending (Chart II-4, bottom panel). Corroborating this, stock prices of these urban-exposed companies have outperformed their rural peers substantially (Chart II-5). Chart II-5Urban-Exposed Stocks Have Outperformed Rural Ones
Urban-Exposed Stocks Have Outperformed Rural Ones
Urban-Exposed Stocks Have Outperformed Rural Ones
Such a slump in rural income is posing a challenge to Modi’s re-election in May. His government – which lost three key state elections in late 2018 – is aware of these ominous trends and is acting boldly to revive income growth in rural areas. The government announced an expansionary budget that appeases rural voters. In particular, the budget aims to strengthen farmers’ support schemes, cut taxes for low- and middle-income earners and introduce a pension scheme for social security coverage of unorganized labor. However, there is a significant risk that the authorities’ fiscal and monetary stimulus are too late to lift growth before May’s elections. According to the past relationship between fiscal spending and India’s business cycle, higher government expenditure growth will only begin to have an effect on the economy in the second half of this year – i.e. after the elections are held (Chart II-6). Hence, the BJP could lose its majority, meaning it would either rule in a minority government or be forced to turn over power to the Congress Party and its allies. Chart II-6Government Expenditures To Lift Growth In H2 2019
Government Expenditures To Lift Growth In H2 2019
Government Expenditures To Lift Growth In H2 2019
Beyond the elections, food prices might be approaching their lows. Well-below average rain will likely result in weak agricultural production and, hence, higher food prices in the second half of 2019 (Chart II-7). Chart II-7Below Trend Monsoon = Food Prices Will Likely Rise
Below Trend Monsoon = Food Prices Will Likely Rise
Below Trend Monsoon = Food Prices Will Likely Rise
Therefore, in the second half of 2019, both fiscal easing and higher food prices will revive rural incomes and spending. In the meantime, monetary easing and credit growth acceleration will support demand in urban areas. Overall, Indian financial markets will likely remain in a risk zone until the elections as economic growth and corporate profits will continue to disappoint. If the opposition Congress Party’s alliance wins the election, Indian stocks and the currency will initially sell off. After this point, Indian assets could offer a buying opportunity because growth will likely revive in the second half of 2019. Bottom Line: For now, we continue to recommend an underweight position in Indian equities relative to the EM equity benchmark. Weakening growth, the very low interest rate differential versus U.S. rates and political uncertainty ahead of the general elections, pose risks of renewed rupee depreciation. A weaker rupee will continue to benefit India’s export-oriented software companies. Therefore, we also reiterate our long Indian software / short EM stocks recommendation. Finally, fixed-income investors should stay with the yield curve steepening trade. The central bank could further cut rates in the near term. However, long-term bond yields will not fall substantially and will likely start drifting higher sooner than later. The widening fiscal deficit, expectations of growth revival in the second half of 2019, and eventually higher food prices and inflation expectations, will all lead to a continuous steepening in the local yield curve. Ayman Kawtharani, Associate Editor ayman@bcaresearch.com Footnotes 1 This is the view of BCA’s Emerging Markets Strategy team and it is different from BCA’s house view on China-related assets and the global business cycle. The primary source of the difference is the outlook for China’s growth. Equity Recommendations Fixed-Income, Credit And Currency Recommendations
Highlights Equities can continue to outperform bonds for a few months longer. The pro-cyclical equity sector stance that has worked well since last October can also continue for a few months longer. Overweight pro-cyclical Sweden versus pro-defensive Denmark. The caveat is that these short-term trends are unlikely to persist and will viciously reverse later in the year. European ‘soft’ luxury goods companies are an excellent structural investment opportunity. Take profits on the 75 percent rally in Litecoin and 50 percent rally in Ethereum. Feature Why should European investors care so much about China? The Chart of the Week provides one emphatic answer. For Europe’s $500 billion basic resources sector, the three most important things in the world are: China, China, and China. Through the past decade, the share price performance of the resource behemoths BHP, Anglo American, Rio Tinto, and Glencore have been joined at the hip to China’s short-term credit impulse (Chart I-2 and Chart I-3). Chart of the WeekFor European Basic Resources, The Three Most Important Things In the World Are: China, China, And China
For European Basic Resources, The Three Most Important Things In the World Are: China, China, And China
For European Basic Resources, The Three Most Important Things In the World Are: China, China, And China
Chart I-2BHP, Anglo American, And Rio Tinto Have Been Rallying For Several Months
BHP, Anglo American, And Rio Tinto Have Been Rallying For Several Months
BHP, Anglo American, And Rio Tinto Have Been Rallying For Several Months
Chart I-3BHP Is Joined At The Hip To China's Short-Term Credit Impulse
BHP Is Joined At The Hip To China's Short-Term Credit Impulse
BHP Is Joined At The Hip To China's Short-Term Credit Impulse
But China has a much deeper importance to Europe. According to Mario Draghi, the recent cycle in Europe is ‘made in China’. On the euro area’s domestic fundamentals, Draghi is upbeat, citing “supportive financing conditions, favourable labour market dynamics and rising wage growth”. Yet the economic data have continued to be weaker than expected. Why? Draghi blames a “slowdown in external demand” and specifically, vulnerabilities in emerging markets. He claims that as soon as there is clarity on the exports and the trade sector, much of the euro area’s weakness will wash out. Federal Reserve Chairman, Jay Powell presented a remarkably similar narrative to justify the recent pause in the Fed’s sequential rate hikes: “The U.S. economy is in a good place… but growth has slowed in some major foreign economies.” If Powell claims that the U.S. domestic economy is in a good place and Draghi points out that the euro area domestic fundamentals are fine, then the explanation for what has happened – and what will happen – can only come from one place: China. Optimistically, Draghi adds: “everything we know says that China’s government is actually taking strong measures to address the slowdown.” The good news is that we can independently corroborate Draghi’s optimism, at least in the near-term (Chart I-4). Chart I-4China's Short-Term Credit Impulse Is Up Sharply, And Commodities Have Rebounded
China's Short-Term Credit Impulse Is Up Sharply, And Commodities Have Rebounded
China's Short-Term Credit Impulse Is Up Sharply, And Commodities Have Rebounded
Why China Matters To Europe Chart I-5 shows the short-term credit impulses in the euro area, U.S., and China through the past twenty years. They are all expressed in dollars to allow an apples for apples comparison between the three major economies. The comparison reveals a fascinating transformation. The dominant short-term impulse – the one with the highest amplitude – charts the shift in global economic power and influence from Europe and the U.S. to China. Chart I-5The Shift In Global Economic Power From Europe And The U.S. To China
The Shift In Global Economic Power From Europe And The U.S. To China
The Shift In Global Economic Power From Europe And The U.S. To China
Before 2008, the short-term impulses in the euro area and the U.S. dominated. But the global financial crisis was a major turning point: the credit stimulus from China dwarfed the responses from the western economies. Then through 2009-12 the impulse oscillations from the three major economies took it in turns to dominate. For example, the 2011-12 global downturn was definitely ‘made in Europe’. However, since 2013 China has taken on the undisputed mantle of dominant impulse. Most recently, last year’s peak to trough decline in China’s short-term impulse amounted to $1 trillion, equivalent to a 1.5 percent drag on global GDP. By comparison, the declines in the euro area and the U.S. amounted to a much more modest $200 billion. Likewise, the recent rebound in the China’s short-term impulse, in dollar terms, has been much larger than the respective rebounds in the euro area and the U.S. Credit Impulses And Speeding Tickets Clients complain that they are confused by the conflicting messages from differently calculated credit impulses. So let’s digress for a moment to present a powerful analogy which should clear the confusion once and for all. Imagine you floored the accelerator pedal of your car (analogous to a huge stimulus). After a hundred metres or so, the stimulus would become very apparent. Your speed over that short sprint would have surged, and possibly have become illegal! But your average speed measured over the previous kilometre would have barely changed. Now imagine a police officer rightfully presents you with a speeding ticket. To protest your innocence, you argue that you couldn’t have floored the accelerator pedal because your average speed over the previous kilometre had barely changed! Clearly, you would never offer such a ludicrous defence for pushing the pedal to the metal. Yet when assessing the impact of an economic stimulus, it is commonplace to make the same mistake. The crucial point is that a stimulus – like flooring the accelerator pedal of your car – will barely move the needle for a longer-term rate of change, but it will become very apparent in a short-term rate of change. For this reason, financial markets never wait for the long-term rates of change to pick up. They always move up or down on the evolution of short-term rates of change. It follows that the credit impulse calculation that is most relevant is the one that provides the best explanatory power for the cycles that we actually observe in the economic and financial market data. As we described in our Special Report, “The Cobweb Theory And Market Cycles”, both the theory and evidence powerfully identify the 6-month credit impulse as the one with the best explanatory power for the oscillations that we actually observe in the economy and markets.1 For the sceptics, the charts in this report should finally dispel any lingering doubts. China’s 6-month impulse gives a spookily perfect explanation for the industrial commodity inflation cycle, and thereby the share price performance of the basic resources sector, as well as the other classically cyclical sectors (Chart I-6 and Chart I-7). Chart I-6China's Short-Term Impulse Perfectly Explains Industrial Commodity Inflation
China's Short-Term Impulse Perfectly Explains Industrial Commodity Inflation
China's Short-Term Impulse Perfectly Explains Industrial Commodity Inflation
Chart I-7Semiconductors Are A Modern Day Cyclical
Semiconductors Are A Modern Day Cyclical
Semiconductors Are A Modern Day Cyclical
The good news is that China’s short-term impulse has indisputably been in a mini-upswing in recent months, and this is the reason that the classical cyclical sectors have simultaneously rebounded or, at the very least, stabilised. The bad news is that the shelf-life of such mini-upswings averages no more than eight months or so. Intuitively, this is because just as you cannot accelerate your car indefinitely, it is likewise impossible to stimulate credit growth indefinitely. The investment conclusion is that the pro-cyclical equity sector stance that has worked well since last October can continue for a few months longer. This sector stance necessarily impacts regional and country allocation. For example, it is still right to be overweight pro-cyclical Sweden versus pro-defensive Denmark (Chart I-8 and Chart I-9). Chart I-8Overweight Pro-Cyclical Sweden Versus Denmark...
Overweight Pro-Cyclical Sweden Versus Denmark...
Overweight Pro-Cyclical Sweden Versus Denmark...
Chart I-9...And Versus Norway
...And Versus Norway
...And Versus Norway
From an asset allocation perspective, it means that equities can continue to outperform bonds for the time being. But the caveat is that these short-term trends are unlikely to persist, and most likely, they will viciously reverse later in the year. Stay tuned for the signal to switch. Stay Structurally Overweight ‘Soft’ Luxuries A common question we get concerns the European luxury goods sector: is it, just like the basic resources sector, a direct play on China’s growth cycle? The answer is no. Recently, the connection between the fortunes of ‘soft’ luxury goods brands like LVMH, Hermes, and Kering and China’s growth cycle has been weak (Chart I-10). Broadly, this is also true for ‘hard’ luxury brands – for example, luxury watches – like Richemont (Chart I-11). Chart I-10European 'Soft' Luxuries Are No Longer A China Play...
European 'Soft' Luxuries Are No Longer A China Play...
European 'Soft' Luxuries Are No Longer A China Play...
Chart I-11...Neither Are European 'Hard' Luxuries
...Neither Are European 'Hard' Luxuries
...Neither Are European 'Hard' Luxuries
As we highlighted in Buying European Clothes: An Investment Megatrend, the much bigger driver for the ‘soft’ luxury brands is the structural increase in female labour participation rates, and the feminisation of consumer spending. We expect this trend to persist for the next decade.2 Hence, we are happy to buy and hold the European clothes and accessories companies with a dominant or significant exposure to women’s clothes and/or accessories; provided they have a top-end brand (or brands) giving pricing power, and mitigating the very strong deflation in clothes prices. In summary, while European basic resources are a good tactical investment opportunity, European ‘soft’ luxury goods companies are an excellent structural investment opportunity. Fractal Trading System* We are delighted to report that the fractal trading system perfectly identified the sharp recent rebound in cryptocurrencies. Our long Litecoin and Ethereum position has hit its 60 percent profit target with Litecoin up 75 percent and Ethereum up 50 percent since trade initiation on December 19. Additionally, long industrials versus utilities has also hit its profit target. With no new trades this week, the fractal trading system now has five open positions. For any investment, excessive trend following and groupthink can reach a natural point of instability, at which point the established trend is highly likely to break down with or without an external catalyst. An early warning sign is the investment’s fractal dimension approaching its natural lower bound. Encouragingly, this trigger has consistently identified countertrend moves of various magnitudes across all asset classes. Chart I-12
Litecoin Is Oversold On A 65-Day Horizon
Litecoin Is Oversold On A 65-Day Horizon
The post-June 9, 2016 fractal trading model rules are: When the fractal dimension approaches the lower limit after an investment has been in an established trend it is a potential trigger for a liquidity-triggered trend reversal. Therefore, open a countertrend position. The profit target is a one-third reversal of the preceding 13-week move. Apply a symmetrical stop-loss. Close the position at the profit target or stop-loss. Otherwise close the position after 13 weeks. Use the position size multiple to control risk. The position size will be smaller for more risky positions. * For more details please see the European Investment Strategy Special Report “Fractals, Liquidity & A Trading Model,” dated December 11, 2014, available at eis.bcaresearch.com Dhaval Joshi, Senior Vice President Chief European Investment Strategist dhaval@bcaresearch.com Footnote 1 Please see the European Investment Strategy Special Report “The Cobweb Theory And Market Cycles” January 11, 2018 available at eis.bcaresearch.com 2 Please see the European Investment Strategy Special Report “Buying European Clothes: An Investment Megatrend” December 6, 2018 available at eis.bcaresearch.com Fractal Trading System Recommendations Asset Allocation Equity Regional and Country Allocation Equity Sector Allocation Bond and Interest Rate Allocation Currency and Other Allocation Closed Fractal Trades Trades Closed Trades Asset Performance Currency & Bond Equity Sector Country Equity Indicators Bond Yields Chart II-1Indicators To Watch - Bond Yields
Indicators To Watch - Bond Yields
Indicators To Watch - Bond Yields
Chart II-2Indicators To Watch - Bond Yields
Indicators To Watch - Bond Yields
Indicators To Watch - Bond Yields
Chart II-3Indicators To Watch - Bond Yields
Indicators To Watch - Bond Yields
Indicators To Watch - Bond Yields
Chart II-4Indicators To Watch - Bond Yields
Indicators To Watch - Bond Yields
Indicators To Watch - Bond Yields
Interest Rate Chart II-5Indicators To Watch - Interest Rate Expectations
Indicators To Watch - Interest Rate Expectations
Indicators To Watch - Interest Rate Expectations
Chart II-6Indicators To Watch - Interest Rate Expectations
Indicators To Watch - Interest Rate Expectations
Indicators To Watch - Interest Rate Expectations
Chart II-7Indicators To Watch - Interest Rate Expectations
Indicators To Watch - Interest Rate Expectations
Indicators To Watch - Interest Rate Expectations
Chart II-8Indicators To Watch - Interest Rate Expectations
Indicators To Watch - Interest Rate Expectations
Indicators To Watch - Interest Rate Expectations
Highlights So What? China’s January credit data suggest that stimulus is here. Why? January credit growth was a blowout number. Trade uncertainty is likely to be prolonged with an extension of talks. Equity bourses in South Korea and Russia are the most likely to benefit from Chinese stimulus. Industrial metals such as copper will also benefit – with a delay. Feature New credit data for China in January improves the chances that Beijing’s stimulus measures will overshoot this year, causing China’s economy to bottom in 2019 and jumpstart global growth. In our annual outlook for this year we argued that while China was stimulating the economy, the magnitude of stimulus would be the decisive factor for the global macro environment in 2019. We argued that the type of stimulus would remain primarily fiscal – tax cuts for households and small and medium-sized enterprises – and hence that it would be modest as fiscal easing would merely offset relatively weak credit growth. This view stemmed from our assessment of the Xi Jinping administration, highlighted in April 2017, as an “elitist” (not populist) administration. Its policy priorities are to discipline the Chinese economy, and in particular to contain systemic financial risk, which President Xi has cited as a national security threat. This view is not wrong, but the latest data clearly show that Xi has decided to pause these painful efforts at limiting leverage and rebalancing China’s economy. Witness January’s decisive uptick in both total social financing (total private credit) and local government bond issuance (Chart 1). Chart 1Higher Risk Of An Overshoot
Higher Risk Of An Overshoot
Higher Risk Of An Overshoot
A massive spike in new credit is the single most important criterion in our “Checklist For A Stimulus Overshoot.” Thus, from a policy perspective, we are now at higher risk of an overshoot (Table 1). Not only credit as a whole but also informal lending saw a surge in January, implying that the government is relenting in its crackdown on the shadow banks. The approval of local government bond issuance for early in the year – and the People’s Bank of China’s announcement of a “Central Bank Bills Swap” program – reinforce this policy shift.1 Table 1Checklist For A Chinese Stimulus Overshoot In 2019
China: Stimulating Amid The Trade Talks
China: Stimulating Amid The Trade Talks
A stimulus overshoot is positive for Chinese demand in the short run but negative for potential GDP in the long run. A “traditional” credit surge of this nature cannot be surgically targeted at SMEs or households. It will go to state-owned enterprises, privileged corporations, property developers, and the like, which have always had the advantage in China’s financial system. SOEs have taken a much larger share of new loans than private companies in recent years,2 and the only silver lining of this trend was the possibility that tighter credit controls would discipline the SOEs. That silver lining is now fading, barring some new and surprising development on the reform front. China needs to create 26 trillion renminbi in new credit over the course of the year to avoid a corporate earnings contraction. These January numbers put China on track to do just that (Chart 2), assuming that President Xi and U.S. President Donald Trump agree to a short-term, framework trade deal this year. Chart 2On Track To Avoid An Earnings Contraction
On Track To Avoid An Earnings Contraction
On Track To Avoid An Earnings Contraction
Of course, a few caveats are in order. First, January’s credit number is only one data point and credit growth is always abnormally strong in the first month of the year. Early in the year, banks seek to expand their assets rapidly in a bid to get as much market share as possible before administrative credit quotas kick in. Because of Chinese New Year, it is best to combine January and February data to get a sense of the rate of credit expansion in the first part of the year. To do that, investors will have to wait for mid-March when the February data is out. This year’s January numbers are very strong relative to previous Januaries (Chart 3) and the context is more accommodative than the 2017 January credit surge, when authorities were beginning to tighten rather than ease macroprudential policy. Still a rapid rate of credit expansion will have to be sustained in the coming months in order to meet the 26 trillion RMB requirement highlighted above.
Chart 3
Second, there is some risk that China’s households and private businesses will not respond as positively today as in the past. The intensification of Communist Party control over the society and economy, President Xi’s cancellation of term limits, and the strategic confrontation with the United States have created a bearish sentiment in the private sector. Our Emerging Markets Strategy would point out that if the propensity to consume, and money velocity,3 do not accelerate, then a surge in new credit may fail to ignite a reacceleration in China (Chart 4). Chart 4Chinese Are Holding On To Their Money
Chinese Are Holding On To Their Money
Chinese Are Holding On To Their Money
Still, what we now know is that Xi Jinping and his top economic adviser, Vice Premier Liu He, are not initiating the “assault phase of reform” that their predecessors initiated in the late 1990s in order to cleanse China’s economy of bad loans and zombie companies. Instead, they are likely reestablishing the “Socialist Put” in order to reverse the current deceleration, demonstrate China’s continued economic might and face down the United States’ threat of tariffs. Bottom Line: China’s stimulus measures are increasingly likely to overshoot, with positive implications for both Chinese and global growth. China is still facing a corporate earnings recession, but the odds of averting it are increasing. Trade Deadline More Likely To Be Extended What of the trade war? First, we would warn clients that China’s annual credit origination is a much bigger factor for the global economy than China’s exports to the United States (Chart 5). The trade war can escalate from here and yet, if China’s stimulus works as it has in the past, the results will be manageable for China’s economy save for Chinese companies expressly exposed to the U.S. economy through exports. In reality, both the U.S. and China are now effectively stimulating their economies and in this sense global trade as a whole will benefit regardless of bilateral tariffs. Chart 5Watch China Credit, Not So Much The Trade War
Watch China Credit, Not So Much The Trade War
Watch China Credit, Not So Much The Trade War
But it is possible that just as global equity markets ignored China’s economic slowdown and only sold off when the tariffs were levied (Chart 6), they may not continue to rally much on China’s credit data. Given the already considerable rally in global risk assets since October, markets may not be satisfied merely with one or two months of solid credit data out of China without a clear resolution to the trade conflict. After all, if a collapse in U.S.-China trade talks portends a new Cold War, then institutional investors may be justified in taking a wait-and-see approach despite China’s credit cycle upswing. Chart 6Will Equities Ignore China Data (Again)?
Will Equities Ignore China Data (Again)?
Will Equities Ignore China Data (Again)?
In the past, we have highlighted that the U.S. and China are not economically prohibited from engaging in a trade war – the export exposure is too small – and China’s new stimulus reinforces this point. However, President Trump is concerned about causing a sell-off in the tech sector and hence the broad equity market which could translate into a bear market and raise the probability of a recession occurring prior to November 2020. Meanwhile, in China, given Beijing’s reported trade concessions, there is apparently a desire to pacify the relationship and discourage U.S. unilateral tariffs and sanctions that could become seriously destabilizing for the Chinese economy and society. The need to have a happy 2021 centenary celebration for the Communist Party may factor into policymakers’ thinking. The latest news flow is mildly positive for the odds of getting a framework deal sometime this year. President Trump visited the Chinese negotiators in Washington, D.C. while President Xi reciprocated with the American negotiators in Beijing. Trump has signaled that an extension of the March 1 deadline is possible, and a two-month extension is being bandied about in the press. China’s National People’s Congress is likely to pass a new Foreign Investment Law that ostensibly guarantees many of the American demands on forced tech transfer, intellectual property theft, and discriminatory treatment of U.S. companies (Table 2). Even the second Trump summit with Kim Jong Un, this time in Vietnam, should be seen as a mild positive for U.S.-China negotiations. Table 2New Foreign Investment Law Would Be A Positive For U.S.-China Negotiations
China: Stimulating Amid The Trade Talks
China: Stimulating Amid The Trade Talks
However, Presidents Trump and Xi have yet to schedule a new summit, which is probably necessary for a final deal. And there are murmurs from the press suggesting that China’s new law and other concessions are not going to satisfy the U.S. negotiators on the critical point of “structural changes” and a verification process. This leaves us inclined to change our trade war probabilities to increase the odds of an extension (Table 3). The improvement in U.S. financial conditions and China’s stimulus, if anything, make it more likely that negotiations will be extended, as both sides feel their economic and financial constraints less acutely. Table 3Updated Trade War Probabilities
China: Stimulating Amid The Trade Talks
China: Stimulating Amid The Trade Talks
Bottom Line: Global and Chinese risk assets should rally on China’s credit uptick, but the lack of resolution of the trade war could continue to inhibit animal spirits – and the odds of a March 1 resolution are declining. Who Are The Equity Winners Of China’s Stimulus? China’s strong January credit number is supportive of global equity markets. That much is obvious. But which equity markets will benefit the most? In what follows we examine the relationship between Chinese credit and MSCI equity returns of various countries. We find that Malaysian, Australian, South Korean, and Indonesian equities are the most highly correlated with Chinese credit growth and are thus most likely to benefit from the recent upturn (Chart 7). On the other hand, France and Italy stand out as countries whose bourses are more insulated.
Chart 7
Out of the markets that are positively correlated, South Korea and Russia stand out as relatively cheap (Chart 8). Thus we expect these equities to do especially well. By contrast, while Indonesia and the Philippines are highly leveraged to China, these markets are currently relatively expensive. BCA’s Emerging Markets Strategy is currently overweight Korean and Russian equities within the EM space, neutral Turkey (although recently upgraded from underweight), and underweight Indonesia and the Philippines.
Chart 8
In addition to credit stimulus, we expect Chinese household consumption to also gain support going forward. This will likely be driven by policy stimulus targeting the consumer specifically and is best exemplified by the recently announced tax cuts (Chart 9), which we expect to trickle down to greater consumer demand and growth in retail sales. Our base case calls for 8%-10% growth in household consumption over the coming 12 months, up from the current 3.5%.
Chart 9
However, consumer sentiment in China is weak. BCA’s Emerging Markets Strategy’s proxy for household marginal propensity to spend ticked up recently, after falling since early last year (see Chart 4 above). A resumption in the decline would highlight that households are increasingly unwilling to spend, which would translate into weaker retail sales despite policy efforts to boost consumption. Such a scenario – in which credit growth accelerates without a substantial uptick in consumer spending – is plausible, given that it occurred between mid-2015 and mid-2016 (Chart 10). In any case, whether Chinese stimulus comes in the form of the traditional credit channel, or instead in the form of fiscal stimulus to household consumption, the same equity markets will generally benefit the most (Chart 11). Chart 10...But Flattish Retail Sales Are Also A Possibility
...But Flattish Retail Sales Are Also A Possibility
...But Flattish Retail Sales Are Also A Possibility
Chart 11
Indeed, global equity markets react the same way regardless of the type of stimulus implemented. For instance, MSCI returns for the Philippines, Sweden, Malaysia, Indonesia, and Turkey are more closely correlated to both Chinese credit growth and retail sales growth compared to Italy, Japan, and France. The same conclusion is reached when we look at the correlations between Chinese credit growth or consumption growth and individual MSCI sectors such as industrials and consumer discretionary (Chart 12).
Chart 12
The relatively stronger correlation between Chinese credit growth and equity returns – as opposed to Chinese retail sales and equity returns – can be put down to the nature of Chinese imports. While industrial goods account for the bulk of China’s purchases of foreign goods, consumer goods excluding autos make up only 15% of China’s imports (Table 4). However, as Chart 12 illustrates, the relationship between China’s retail sales growth and global equities is much tighter in the case of the consumer discretionary sector, whether the latter is compared to global industrials sectors or the overall MSCI index. Table 4Import Composition Of Chinese Imports
China: Stimulating Amid The Trade Talks
China: Stimulating Amid The Trade Talks
Equity market exposure to China is not always in line with the extent of each country’s trade exposure to China (Chart 13).
Chart 13
There are some clear exceptions – most notably Mexico, which has the highest correlation coefficient with Chinese credit and consumption variables since 2010. However, this is likely due to idiosyncratic factors.4 Correlation does not imply causation, and we cannot conclude with certainty that Mexican equities will outperform amid China’s new round of stimulus. Nevertheless, given that Mexico is a very deeply liquid market that benefits amid EM bull markets, this may not be entirely coincidental. The correlations between global equity markets and Chinese credit peak two months after the stimulus measures are first implemented (Chart 14). This is more or less in line with adjusted total social financing’s correlation versus industrial metals. However BCA’s Commodity & Energy Strategy has shown that copper’s correlations versus other measures of Chinese money and credit peak after roughly three quarters (Chart 15).5 This is evident in both the 2012 and 2015-16 stimulus episodes in which the bottom in copper prices lagged the bottom in China’s credit growth. Thus we may witness a rebound in equity markets on the back of China’s credit splurge before we see an improvement in annual returns on copper prices.
Chart 14
Chart 15Copper Rallies Lag China Credit Stimulus
Copper Rallies Lag China Credit Stimulus
Copper Rallies Lag China Credit Stimulus
Bottom Line: South Korean and Russian equities are best positioned to benefit from the positive surprise in China’s credit data. France and Italy are the worst positioned. Copper prices will rebound with a delay. Investment Implications BCA’s Geopolitical Strategy recommends that investors stay long Chinese equities ex-tech relative to the emerging market benchmark. This is a tactical call initiated in August 2018 that is now becoming a cyclical call on the basis of the credit upswing. We also remain long the “China Play Index,” a basket of China-sensitive assets, and long China’s “Big Five” banks relative to other banks. A rebound in China’s credit data and stronger global growth will support copper demand. Prices are still 15% below the mid-2018 peak and are poised to benefit in this environment, especially given that global inventories are already falling. BCA’s Geopolitical Strategy recommends that investors go long copper. Meanwhile, BCA’s China Investment Strategy recommends (for now) staying only tactically overweight Chinese equities relative to the global benchmark, pending higher conviction that the pace of credit growth will be strong enough to overwhelm the negative ramifications of a continued deceleration in actual activity over the coming few months on sentiment and 12-month forward earnings expectations. Over the long run, Geopolitical Strategy would look to underweight Chinese equities, as we are not optimistic about China’s productivity and potential GDP. This is because of the negative structural consequences of continuing the Socialist Put (i.e., bad loans, zombie companies, trade protectionism). We would expect CNY/USD to remain relatively buoyant in the context of both trade negotiations with the U.S. and fiscal-and-credit stimulus. The trade talks can hardly succeed if CNY/USD is falling. Depending on whether and how soon China’s stimulus results in a durable economic bottom, global growth could stabilize and the USD could see a substantial countertrend selloff. Matt Gertken, Vice President Geopolitical Strategy mattg@bcaresearch.com Roukaya Ibrahim, Editor/Strategist roukayai@bcaresearch.com Footnotes 1 Please see Emerging Markets Strategy Special Report titled “China: Prepping A Bazooka?” dated February 14, 2019 available at ems.bcaresearch.com 2 Please see Nicholas Lardy, “The State Strikes Back: The End Of Economic Reform In China?” Peterson Institute For International Economics, January 29, 2019, available at piie.com. 3 Please see Emerging Markets Strategy Weekly Report titled “Dissecting China’s Stimulus,” dated January 17, 2019 available at ems.bcaresearch.com 4 The 2012 election of President Enrique Peña Nieto caused Mexican equities to outperform their EM counterparts. Similarly in 2015-16, U.S. outperformance relative to EM also supported Mexico relative to EM because Mexico’s economy is highly leveraged to its northern neighbor. In both periods Mexico’s outperformance was not caused by – but instead coincided with – Chinese credit stimulus. These idiosyncratic events biased the correlation between Mexico’s equity markets and Chinese credit growth to the upside. 5 Please see Commodity & Energy Strategy Weekly Report titled “Trade Wars, China Credit Policy Will Roil Global Copper Markets,” dated June 21, 2018, available at ces.bcaresearch.com.
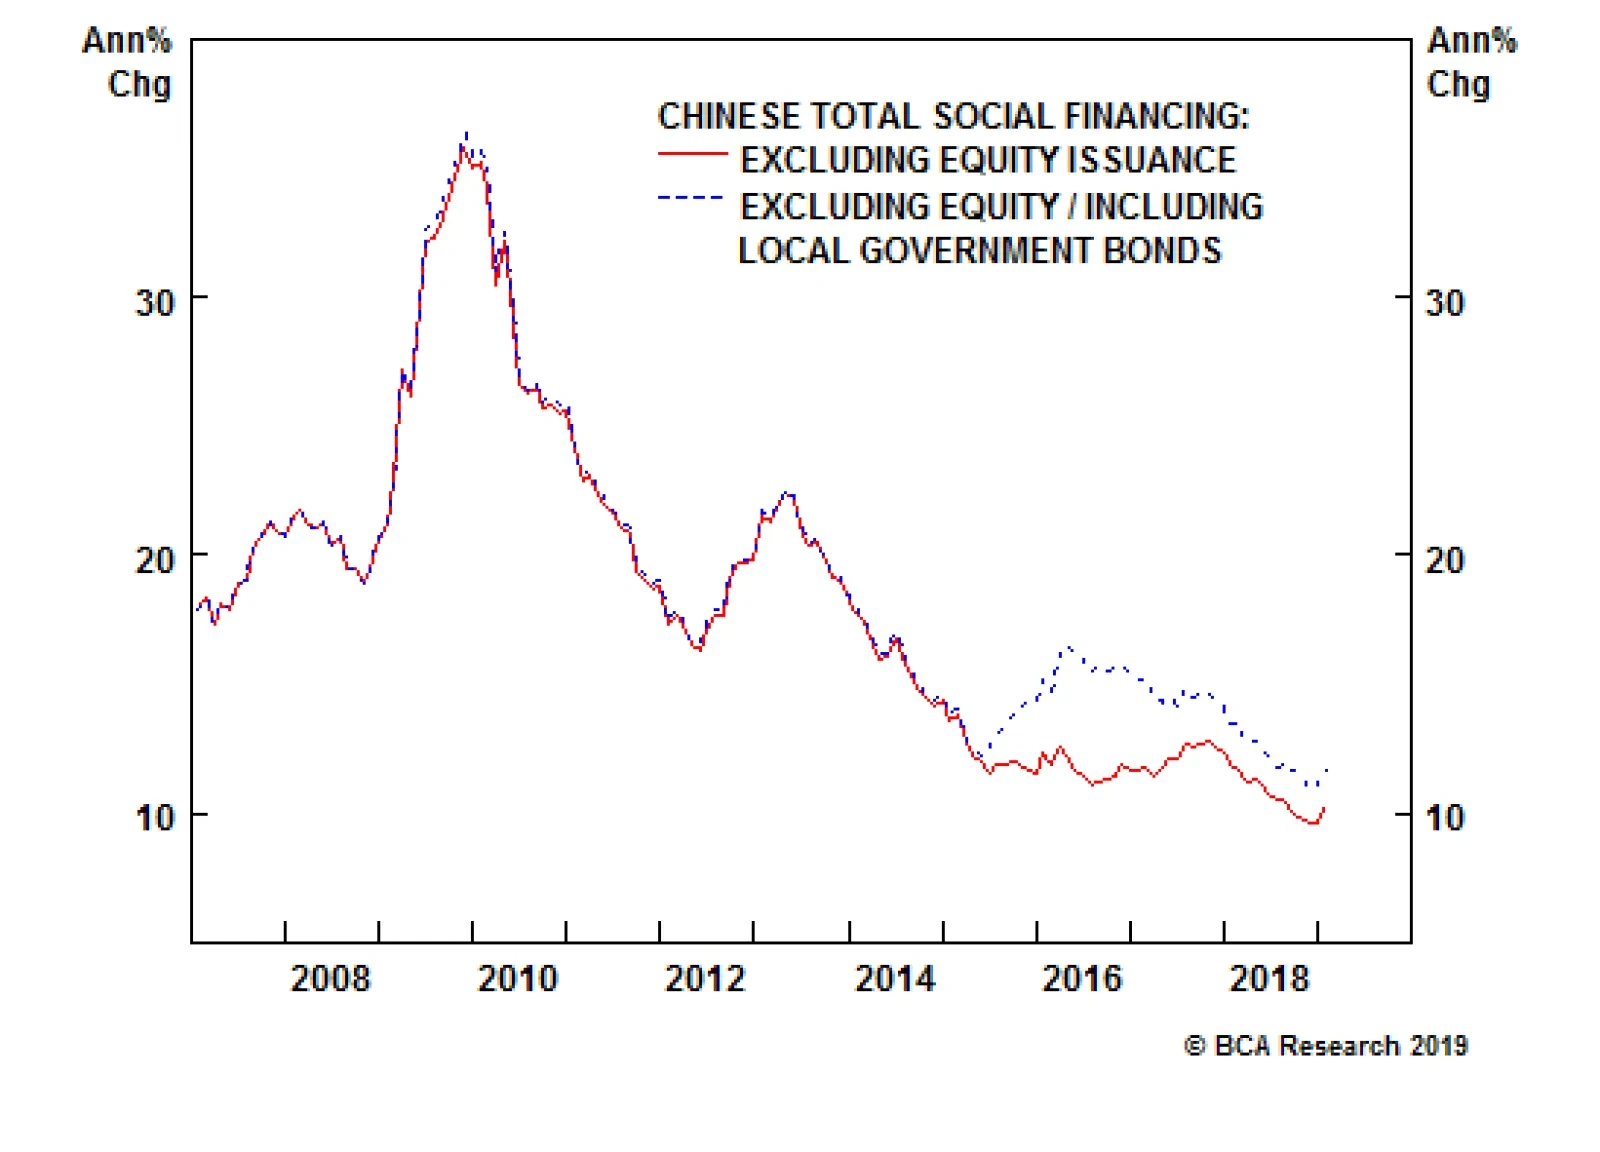
China’s total social financing numbers for January came in at CNY 4.6 trillion, a stunning number even when taking into account the seasonal strength evident every January. In fact, in a recent webcast, our geopolitical strategists argued that any number…
Highlights The CAD and AUD have tactical upside; however, this may well prove to be the last hurrah before some serious declines play out. This time domestic – not global – factors will drive the CAD and AUD lower. Canada and Australia are hitting the end game for their respective debt supercycles as rising U.S. rates will lift the global cost of capital. Canadian and Australian house prices and debt loads are too elevated; a reversal of these excesses is likely to push these two countries toward liquidity traps. These liquidity traps will cause the R-star in Canada and Australia to fall, lagging well behind the U.S. Canada and Australia are uncompetitive, suggesting external demand will not come to their respective rescue, at least not until after the CAD and AUD have fallen significantly. The CAD may fall first, but the AUD has more downside ultimately; not only is Australia even less competitive than Canada, but the Aussie is also more expensive than the Loonie. Feature The Canadian and Australian dollars are in the process of rebounding. This is not surprising. By the end of 2018, both these currencies were deeply oversold, and the recent easing in global financial conditions, helped by the Federal Reserve’s pause, is fueling their rebound (Chart 1). Moreover, pessimism toward China has hit an extreme, yet Sino-U.S. trade relations seem on the cusp of improving and Chinese policymakers are increasingly trying to manage the downside in the Chinese economy. This setup is normally supportive for the Canadian and Australian dollars (Chart 2). Chart 1Financial Conditions Point To A Tactical Rebound In The AUD And The CAD...
Financial Conditions Point To A Tactical Rebound In The AUD And The CAD...
Financial Conditions Point To A Tactical Rebound In The AUD And The CAD...
Chart 2...So Does Chinese Reflation
...So Does Chinese Reflation
...So Does Chinese Reflation
While we have been recommending that our more tactically minded clients play this rally,1 the longer-term outlook for the CAD and AUD remains poor. These countries are getting closer to the end of their respective debt supercycles. Consequently, the CAD and AUD need to trade at much larger discounts to fair value in order to be attractive. Way Too Much Debt Canada and Australia have become victims of their own success. Canada and Australia have seen real estate prices rise for more than two decades. At first, rising prices reflected solid valuations, growing populations and rising prosperity. However, things changed around the Great Financial Crisis. During this traumatic event, the Bank of Canada and the Reserve Bank of Australia both dropped interest rates by 4.25%. Since both countries’ banking sectors escaped the crisis unscathed, and households did not experience similar losses of wealth as those in the U.S., Ireland or Spain, credit growth remained strong. A real estate bubble became the natural consequence of this easy monetary policy. Banks pushed credit to households, and households – impressed by the solid performance of real estate prices, attracted by low interest rates, and enamored with the dream of easy riches – willingly took on mortgages and piled into the property market. A feedback loop ensued, whereby rising collateral values made credit even easier to access, fomenting further house price gains and even-easier credit conditions. Today, we stand at the end of this process. Vancouver and Toronto in Canada, and Sydney and Melbourne in Australia are some of the most expensive real estate markets in world in terms of price-to-income ratios, when one controls for population density (Chart 3). This has created major systemic risks for both countries.
Chart 3
Few would care about the systemic risk created by elevated house prices if debt loads were small. However, in both countries, household indebtedness makes Americans circa 2007 look like a frugal bunch. In Canada, household debt has now reached 176% of disposable income, or 100% of GDP, while in Australia, the same ratios are 189% and 121%, respectively. This is well above the levels that prevailed in the U.S. in 2007 (Chart 4). Mortgage debt alone represents 108% and 140% of disposable income in Canada and Australia, respectively. Moreover, Canadian and Australian households also spend 14.5% and 15.6% of their incomes servicing debt, which also compares unfavorably with the U.S. in 2007. Chart 4ACanadians And Australians Make Americans Look Frugal
Canadians And Australians Make Americans Look Frugal (1)
Canadians And Australians Make Americans Look Frugal (1)
Chart 4BCanadians And Australians Make Americans Look Frugal
Canadians And Australians Make Americans Look Frugal (2)
Canadians And Australians Make Americans Look Frugal (2)
Canadian and Australian households thus seem close to having reached their maximum debt loads. Moreover, measures taken in Canada and Australia to limit foreign money inflows and constrain bank lending are beginning to bite. In both countries, real estate transactions are slowing, with property sales declining by 20% and 8% in Canada and Australia, respectively. House prices too are being hit. House prices in Vancouver and Toronto peaked by 2018, and in Sydney and Melbourne in 2017. Residential construction is likely to be the first victim. Real estate inventories in both these countries have been rising, courtesy of the frenetic pace of housing starts going on for decades. Today, residential investment represents 7% of GDP in Canada and 5% of GDP in Australia (Chart 5). Thus, slowing real estate activity could curtail Canadian and Australian GDP by 2% if we move back to the real estate environment that prevailed in the mid-1990s. This would also imply large hits to employment as construction, real estate and finance have created 336-thousand and 250-thousand jobs in Canada and Australia since 2009, respectively. Chart 5AA Decline In Construction Activity Would Be A Vicious Hit To Canada And Australia (1)
A Decline In Construction Activity Would Be A Vicious Hit To Canada And Australia (1)
A Decline In Construction Activity Would Be A Vicious Hit To Canada And Australia (1)
Chart 5BA Decline In Construction Activity Would Be A Vicious Hit To Canada And Australia (2)
A Decline In Construction Activity Would Be A Vicious Hit To Canada And Australia (2)
A Decline In Construction Activity Would Be A Vicious Hit To Canada And Australia (2)
Consumption too is likely to suffer. Without a growing wealth effect and with declining equity in their houses, Canadian and Australian households are likely to curtail consumption – consumption that has contributed 60% and 30% of Canada’s and Australia’s cumulative GDP growth since 2009. Already, we are seeing slowing Canadian and Australian retail sales – right behind drops in housing activity. The biggest and most dangerous risk is that Canada and Australia teeter on the verge of falling into a liquidity trap, like the U.S. after 2007. As Chart 6 illustrates, propelled by households binging on cheap money in the form of mortgages, Canadian and Australian banks have managed to maintain higher levels of return on equity after the financial crisis. This robust profitability will decline if non-performing loans, which so far remain low, grow in response to weakening house prices and fragile household financial health (Chart 7). Chart 6Canadian And Australian Banks Remain Profitable...
Canadian And Australian Banks Remain Profitable...
Canadian And Australian Banks Remain Profitable...
Chart 7...As Long As NPLs Do Not Rise
...As Long As NPLs Do Not Rise
...As Long As NPLs Do Not Rise
Rising NPLs and declining RoEs tend to limit the willingness of banks to lend. Just as crucially, the poor health of households and falling real estate prices is likely to also limit demand for credit. This combination was behind the sharp decline in the U.S. money multiplier in 2008. No matter how much reserves the Federal Reserve would inject in commercial banks via QE programs, broader money would not respond. A similar fate is likely to ensue in Canada and Australia (Chart 8). The velocity of money is also likely to fall if households are not willing to take on debt anymore and instead focus on rebuilding their financial buffers. Chart 8Canada And Australia Have Avoided A Liquidity Trap... So Far
Canada And Australia Have Avoided A Liquidity Trap... So Far
Canada And Australia Have Avoided A Liquidity Trap... So Far
The consequence of this monetary constipation will be much lower interest rates. When an economy enters a liquidity trap, as was the case in the U.S. after 2007, in Japan since the 1990s, or in Europe after 2010, the neutral real rate of interest, the so-called R-star, falls to zero or even lower. Essentially, no matter how low interest rates fall, they cannot equilibrate the demand and supply for savings. Everyone wants to save, no one wants to borrow, and banks are unwilling to lend. This fate looks increasingly likely for both Canada and Australia over the coming two years. Bottom Line: The Canadian and Australian real estate markets have enjoyed incredible runs for more than two decades. Now, not only are real estate prices in these two nations very expensive, households have been left with prodigious debt loads. As real estate activity slows, residential construction will suffer, but most importantly, these two countries are likely to teeter toward becoming liquidity traps as banks curtail lending and households curtail borrowing. This will result in structurally lagging interest rates. Why Now? Betting on the end of the Canadian and Australian housing bubbles has so far been mugs games. Why is the situation different now? Because the U.S. economy is stronger. Until now, very low global interest rates have kept the Canadian and Australian housing bubbles afloat, but rising U.S. interest rates are now putting upward pressure on mortgage rates in both Canada and Australia (Chart 9). This simply reflects the fact that U.S. rates represent the ultimate opportunity cost of investing outside the international reserve currency, the U.S. dollar. After years of household deleveraging, the U.S. seems to be able to handle higher rates. However, because Canadian and Australian balance sheets are much weaker, their tolerance for higher rates is substantially lower. Chart 9Higher U.S. Rates Threaten Canadian And Australian Households
Higher U.S. Rates Threaten Canadian And Australian Households
Higher U.S. Rates Threaten Canadian And Australian Households
BCA sees further upside for U.S. rates and thus for the global cost of capital. In other words, we do not anticipate the Fed’s pause to last beyond June. The following reasons underpin this view: The U.S. labor market is increasingly inflationary. The employment-to-population ratio for prime-age workers continues to rise, which historically has boosted labor costs (Chart 10). The New York City Fed Underlying Inflation Gauge points toward higher core inflation (Chart 11). Moreover, Ryan Swift argues in BCA’s U.S. Bond Strategy that an unfavorable base effect will dissipate after February, further reinforcing the upside risk to inflation.2 Being the only component of our Fed Monitor moving toward “easy money required” territory, the tightening in U.S. financial conditions last year was the lynchpin behind the Fed’s pause. The other components of the Fed Monitor have not deteriorated significantly, and they still argue in favor of further rate hikes (Chart 12). Thus, if the recent easing in financial conditions can persist, the Fed will hike again this year.
Chart 10
Chart 11Budding U.S. Inflationary Pressures
Budding U.S. Inflationary Pressures
Budding U.S. Inflationary Pressures
Chart 12The Fed Is Pausing Because Of Tightening Financial Conditions, Not The Economy
The Fed Is Pausing Because Of Tightening Financial Conditions, Not The Economy
The Fed Is Pausing Because Of Tightening Financial Conditions, Not The Economy
Finally, U.S. productivity is set to pick up over the coming two years. Since a rising capital stock boosts productivity, the recent strength in capex augurs well (Chart 13). Moreover, the demand deficit created by the deleveraging of U.S. households has weighed on productivity. As U.S. credit growth picks up, so will productivity. This is important as rising productivity lifts the neutral rate, and thus creates more room for the Fed to lift interest rates. Chart 13Upside For U.S. Productivity Equals Upside For U.S. Rates
Upside For U.S. Productivity Equals Upside For U.S. Rates
Upside For U.S. Productivity Equals Upside For U.S. Rates
Ultimately, all these factors point to higher U.S. rates. As such, it suggests that Canadian mortgage rates, and to a lesser extent Australian ones as well, will experience upward pressure – exactly at the time when households in these two countries are most vulnerable to higher rates. Bottom Line: Higher U.S. rates are the main reason why we expect the Canadian and Australian housing markets and economies to buckle now, finally heeding the call of doomsayers. Higher U.S. rates lift the global cost of capital. While U.S. households are in robust shape and therefore better able to handle higher rates, the same cannot be said about Canadian and Australian households. Can the External Sector Come To The Rescue? This is unlikely. After years of commodity booms and strong domestic demand supported by rising household wealth, the Canadian and Australian manufacturing sectors have been greatly diminished. Much capacity has vanished, and it will be difficult to replace the lost output from falling domestic demand by exports of manufactured goods. The Australian and especially the Canadian corporate sectors are also already heavily indebted, and thus, it could take quite some time before capacity is expanded. Complicating the situation, Canada and Australia are not competitive exporters anymore. As the top panel of Chart 14 shows, since 1980, U.S. unit labor costs have risen by 156%, but they have risen by 183% in Canada and by a stunning 282% in Australia. Productivity trends paint a similar, albeit less dramatic picture. Since 1980, U.S. labor productivity has risen 22% versus its trading partners; in Canada it has declined by 20%, and in Australia, by 5%. Consequently, both Canadian and Australia labor will have to cheapen. Historically, the mechanism through which labor costs decline is higher unemployment, which forces a painful adjustment in wages. These adjustments are likely to force both interest rates and currencies lower. Chart 14Canada And Australia Are Uncompetitive
Canada And Australia Are Uncompetitive
Canada And Australia Are Uncompetitive
Could China come to the rescue? Via higher commodity prices, both Canada and Australia have been major beneficiaries of the Chinese economic boom. However, while China today is trying to contain its economic deceleration, Chinese policymakers remain fixated on controlling credit growth. This means that China is unlikely to go on another debt binge similar to what transpired in 2009 or in 2015-‘16. As a result, the recent uptick in commodity prices is unlikely to last long. More fundamentally, China is not only trying to move away from its debt-led growth model: It is also trying to move away from its investment-led growth model. This means that the commodity intensiveness of the Chinese economy is likely to decline. China’s emphasis on controlling air pollution will strengthen this trend. As Chart 15 illustrates, when the share of Capex as a percentage of Chinese GDP declines, so does the labor participation rate of Canada and Australia relative to the U.S. This decline in relative participation rates is associated with falling CAD and AUD values versus the U.S. dollar, a consequence of falling growth potential and interest rates. Chart 15AChanging Chinese Growth Model Points To Falling Canadian And Australian Participation Rates (1)
Changing Chinese Growth Model Points To Falling Canadian And Australian Participation Rates (1)
Changing Chinese Growth Model Points To Falling Canadian And Australian Participation Rates (1)
Chart 15BChanging Chinese Growth Model Points To Falling Canadian And Australian Participation Rates (2)
Changing Chinese Growth Model Points To Falling Canadian And Australian Participation Rates (2)
Changing Chinese Growth Model Points To Falling Canadian And Australian Participation Rates (2)
Bottom Line: Canada’s and Australia’s lack of manufacturing capacity, poor competitiveness, and China moving away from its investment-led growth model suggest that a deflationary environment will ultimately develop in these two nations, at least relative to the U.S. Moreover, the structurally negative outlook on consumption, debt growth and employment suggests that Canadian and Australian neutral rates are likely to fall relative to the U.S. These economic forces point to deeper lows this cycle in the CAD and AUD against the USD. Investment Implications Based on this economic backdrop, both the Canadian and Australian dollar could suffer significant downside in the coming years as their fair value is likely to fall, dragged by interest rates that will lag those in the U.S. However, if an asset is cheap enough, it may nonetheless be an attractive buy. The CAD and AUD do not fall into that camp. Today, the CAD trades in line with our long-term fair-value model, implying that if its fair value falls, the CAD provides zero insulation and will therefore also have to decline. The AUD is in an even worst spot as it currently trades above its fair value (Chart 16). Additionally, the Australian current account deficit is larger than Canada’s. Chart 16The CAD And AUD Are Not Cheap Enough To Compensate For Secular Risks
The CAD And AUD Are Not Cheap Enough To Compensate For Secular Risks
The CAD And AUD Are Not Cheap Enough To Compensate For Secular Risks
In terms of timing, the Loonie could start weakening before the Aussie. The Canadian housing bubble is likely to collapse first as Canadian mortgage rates are more tightly linked to U.S. ones than Australian rates are. Moreover, the Canadian economy seems even more levered to rising real estate prices than that of Australia. However, a collapse in Vancouver and Toronto housing prices will promptly catalyze similar weaknesses in Sydney and Melbourne. Thus, while the CAD may be the first to take the great plunge, the AUD will not be far behind. Ultimately, the AUD will suffer the greatest decline. Obviously, the more onerous pricing of the AUD contributes to this assessment, but so does the greater lack of competitiveness in Australia than in Canada. Australia is likely to endure deeper deflationary pressures as its labor costs need greater adjustments. Furthermore, Australia already suffers from a larger degree of underutilized labor than Canada. Since the currency – not wages – is likely to withstand the bulk of the competiveness adjustment, this implies that the AUD has more work to do than the CAD. The more expensive valuations of Australian assets also handicap the Aussie versus the Loonie. Australian real estate is pricier than Canadian property, and Australian stocks are more expensive (Chart 17). This means that Australians could end up with deeper holes in their balance sheets than Canadians, and that Australia has scope to witness greater outflows of capital than Canada. Chart 17Canadian Financial Assets Are Cheaper Than Australian Ones...
Canadian Financial Assets Are Cheaper Than Australian Ones...
Canadian Financial Assets Are Cheaper Than Australian Ones...
Where Australia shines relative to Canada is in terms of the ability of fiscal authorities to respond to an economic slowdown. Canadian public debt stands at 90% of GDP versus 41% of GDP in Australia. Canada’s cyclically-adjusted primary deficit is already deteriorating, while Australia’s is improving (Chart 18). This means that the Australian governments have deeper pockets and a greater capacity to support domestic demand than Canada’s. This could cushion the deflationary impact in Australia relative to Canada. That being said, the Japanese, Spanish or U.S. experiences argue that once a real estate bubble bursts, fiscal spending can cushion some of the pain, but it cannot eradicate the problem – at least not until banks are recapitalized and the private sector is once again ready to borrow, something that takes years of balance-sheet rebuilding. Chart 18...But Australia Has More Fiscal Space
...But Australia Has More Fiscal Space
...But Australia Has More Fiscal Space
Bottom Line: Both the CAD and AUD are likely to experience substantial downside over the coming years. The CAD and AUD are not cheap enough to compensate for a BoC and RBA that will greatly lag the Fed. While the CAD may weaken first, the AUD will suffer more long-term downside. The Aussie is more expensive, Australia is less competitive than Canada, and it could suffer greater outflows of capital. Continue to underweight Australian and Canadian assets in global portfolios as the AUD and CAD will drag their performance down. Remain short AUD/CAD on a structural basis. Mathieu Savary, Vice President Foreign Exchange Strategy mathieu@bcaresearch.com Footnotes 1 Please see Foreign Exchange Strategy Weekly Report, titled “Global Liquidity Trends Support The Dollar, But…”, dated January 25, 2019, 2018, available at fes.bcaresearch.com 2 Please see U.S. Bond Strategy Weekly Report, “Buy Corporate Credit”, dated January 15, 2019, available at usbs.bcaresearch.com Trades & Forecasts Forecast Summary Core Portfolio Tactical Trades Closed Trades