Personal Products
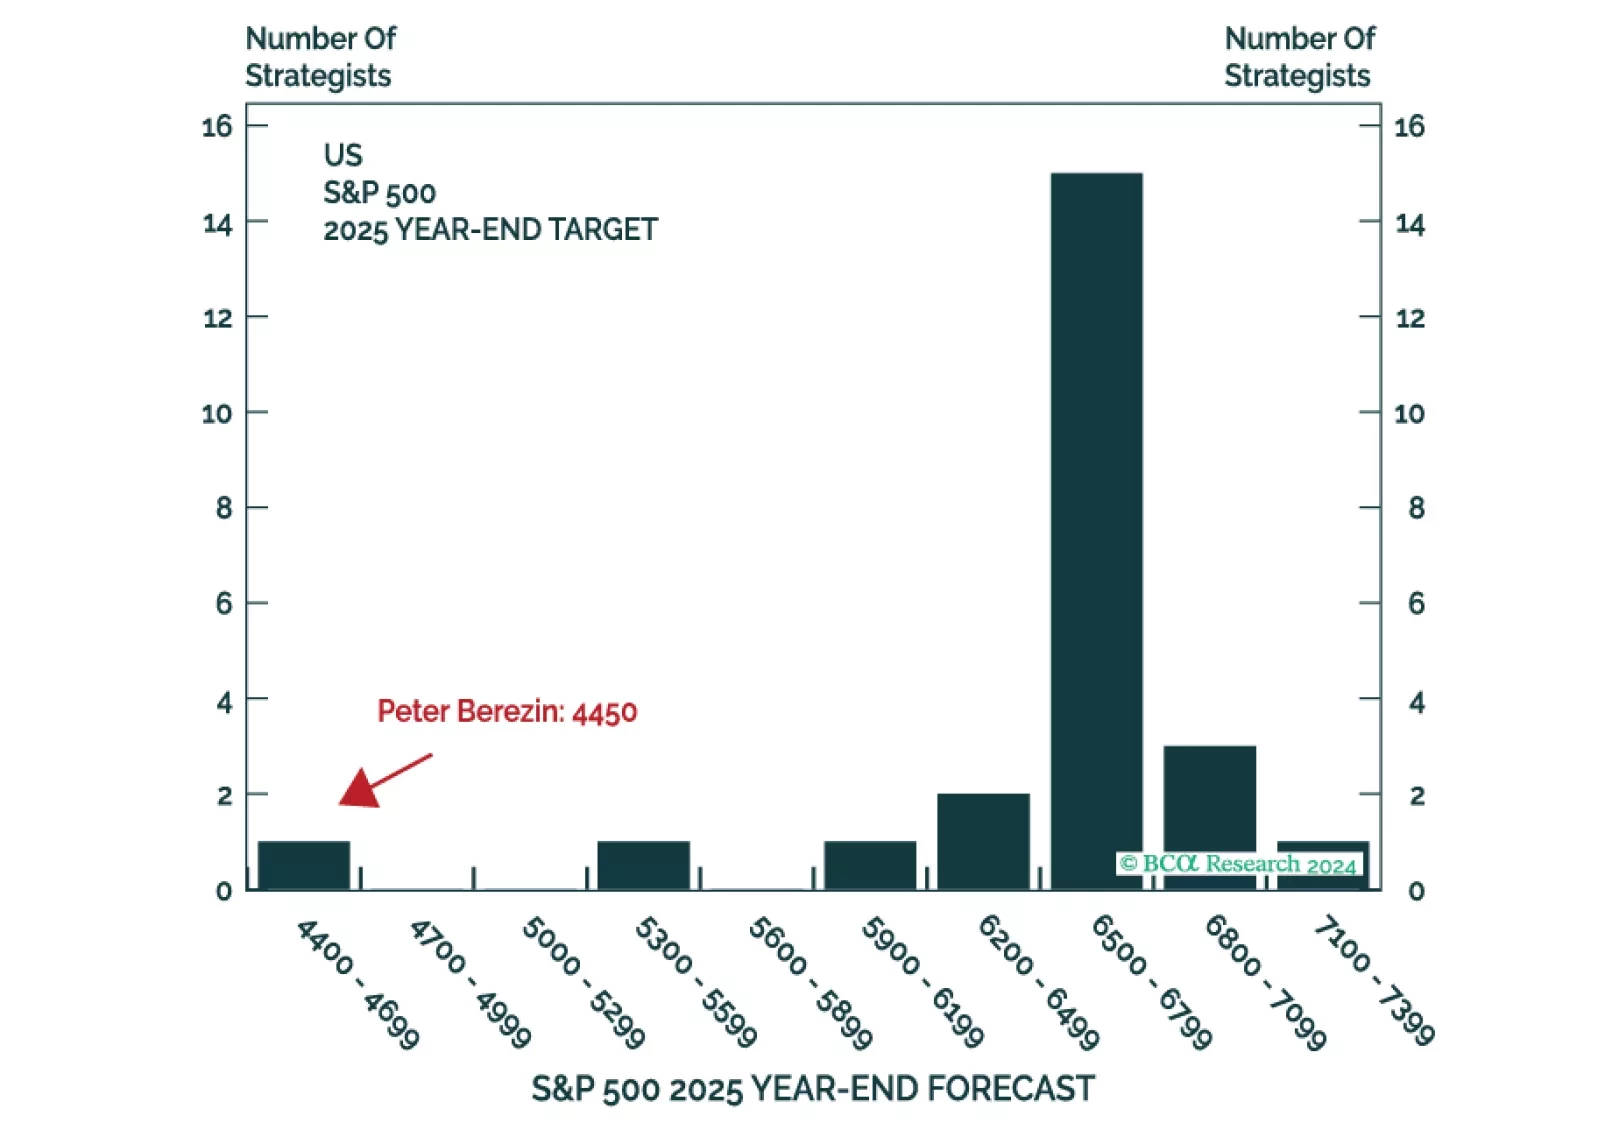
This is the time of the year when strategists are busy sending out their annual outlooks. Here on the Global Investment Strategy team, we decided to go one step further. Rather than pontificating about what could happen in 2025, we decided to harness the power of the multiverse to tell you what did happen (in at least one highly representative timeline).
Next week, please join me for a Webcast on Tuesday, December 17 at 10:30 AM EST (3:30 PM GMT, 4:30 PM CET) to discuss the economy and financial markets.
And with that, I will sign off for the year. I wish you and your loved ones a very happy and healthy 2025. We will be back in the first week of January with our MacroQuant Model Update.

Highlights Demand in the major economies remains well below its pre-pandemic trend. Meaning that relative to potential output, demand is lukewarm, at best. Inflation is hot, not because of strong overall demand, but because of the surging demand for goods. If the spending on goods cools, then inflation will also cool. We expect this ‘good’ resolution of inflation to unfold, because there are only so many goods that any person can buy. Underweight personal goods versus consumer services. Bond yields have the scope to rise by just 50-100 bps before pulling the bottom out of the $300 trillion global real estate market and the $100 trillion global equity market. Long-term investors should continue to own US T-bonds and focus their equity investments in long-duration (growth) stocks, sectors, and stock markets… …because the ultimate low in bond yields is yet to come. Feature Chart of the WeekWill Bond Yields Stay Chilled With Inflation So Hot? 2022 begins with an investment conundrum. Why have long bond yields been so chilled when inflation is running so hot? (Chart I-1) While US and UK inflation have ripped to 6.9 percent and 5.1 percent respectively, the 30-year T-bond yield and 30-year gilt yield remain a relative oasis of calm – standing at 2.1 percent and 1.2 percent respectively. 10-year yields have also stayed relatively calm. Moreover, as long-duration bonds set the valuations of long-duration stocks, a calm bond market has meant a calm stock market. What can explain this apparent conundrum of chilled yields in the face of the hottest inflation in a generation? Long Bond Yields Are Tracking Demand, Not Inflation Chart I-2 answers the conundrum. The long bond yield is taking its cue not from hot inflation, but from economic demand, which is far from overheating. Quite the contrary, US real GDP and consumption are struggling to reach their pre-pandemic trends. Meanwhile, UK real GDP languishes 5 percent below its pre-pandemic trend (Chart I-3), and other major economies tell similar stories. Chart I-2Long Bond Yields Are Tracking Demand Chart I-3Demand Is Lukewarm, At Best Some people mistake the strong economic growth in recent quarters for overheating demand. In fact, this robust growth is just the natural snap-back after the pandemic induced collapse in early-2020. Meaning that the strong growth is unsustainable, just as the bounce that a ball experiences after a big drop is unsustainable. Demand in the major economies remains well below its pre-pandemic trend. To repeat, demand in the major economies remains well below its pre-pandemic trend. As this pre-pandemic trend is a good gauge of potential output, economic demand is lukewarm, at best. And this explains why long bond yields have remained chilled. Inflation Is Tracking The Displacement Of Demand Yet solving the first conundrum simply raises a second conundrum. If overall demand is lukewarm, then why is inflation so hot? (Chart I-4). The answer is that inflation is being fuelled by the displacement of demand into goods from services (Chart I-5). Chart I-4Hot Inflation Is Not Reflecting Lukewarm Overall Demand Chart I-5Hot Inflation Is Reflecting The Hot Demand For Goods If a dollar spent on goods is displaced from a dollar spent on services, then overall demand will be unchanged. However, what happens to the overall price level depends on the relative price elasticities of demand for goods and services. If the price elasticities are the same, then overall prices will also be unchanged, because a higher price for goods will be exactly countered by a lower price for services. But if the price elasticities are very different, then overall prices can rise sharply because the higher price for goods will dominate overall inflation. All of which solves our second conundrum. Spending on services that require close contact with strangers – using public transport, going to the dentist, cinema, or recreational activities that involve crowds – are suffering severe shortfalls compared to pre-pandemic times. Some people say that this is due to supply shortages, yet the trains and buses are running empty and there is no shortage of dentists, cinema seats, or even (English) Premier League tickets. Indeed, the Premier League team that I support (which I will not name) has been sending me begging emails to attend matches! Surging inflation is no longer a reliable reflection of overall demand. If somebody doesn’t use public transport, or go to the cinema or crowded events because he is worried about the health risk, then lowering the price will not lure that person back. In fact, the person might interpret the lower price as a signal of greater risk, and might become more averse. In other words, the price elasticity of demand for certain services has flipped from its usual negative to zero, or even positive. This creates a major problem for central banks, because if the price elasticity of services demand has changed, then surging inflation is no longer a reliable reflection of overall demand, which remains below its potential. Instead, surging inflation is largely reflecting the surging demand for goods. Two Ways That Inflation Can Resolve: One Good, One Bad It follows that if the spending on goods cools, then inflation will also cool. We expect this ‘good’ resolution of inflation to unfold, because there are only so many goods that any person can buy. Durables, by their very definition, last a long time. Even clothes and shoes, though classified as nondurables, are in fact quite durable. Meaning that are only so many cars, iPhone 13s, gadgets, clothes and shoes that any person can own before reaching saturation. We recommend that equity investors play this inevitable normalisation by underweighting personal goods versus consumer services. Still, the resolution of inflation could also take a ‘bad’ form. If inflation persisted, then bond yields could lose their chill as they flipped their focus from lukewarm demand to hot inflation. Given that long-duration bonds set the valuations of long-duration stocks, and given that stock valuations are already stretched versus bonds, this would quickly inflict pain on stock investors (Chart I-6). Chart I-6The US Stock Market = The 30-Year T-Bond Price Multiplied By Profits More significantly, it would also quickly inflict pain on the all-important real estate market. Through the past ten years, world prime residential prices are up by 70 percent while rents are up by just 25 percent1 (Chart I-7). Meaning that the bulk of the increase in global real estate prices is due to skyrocketing valuations. The culprit is the structural collapse in global bond yields (Chart I-8). Chart I-7The Bulk Of The Increase In Global Real Estate Prices Is Due To Valuation Expansion… Chart I-8…And The Culprit For The Richest Ever Valuation Of Global Real Estate Is The Structural Collapse In Global Bond Yields This means that bond yields have the scope to rise by just 50-100 bps before pulling the bottom out of the $300 trillion global real estate market. Given that this dwarfs the $90 trillion global economy, the massive deflationary backlash would annihilate any lingering inflation. Some people counter that in an inflationary shock, stocks and property – as the ultimate real assets – ought to perform well even as bond yields rise. However, when valuations start off stretched as now, the initial intense headwind from deflating valuations would obliterate the tailwind from inflating incomes. The scope for higher bond yields is limited by the fragility of stock market and real estate valuations. With the scope for higher yields limited by the fragility of stock market and real estate valuations, and with the ultimate low in yields yet to come, long-term investors should continue to own US T-bonds. And they should focus their equity investments in long-duration (growth) stocks, sectors, and stock markets. Fractal Trading Update Owing to the holidays, we are waiting until next week to initiate new trades. We will also add a new feature – a ‘watch list’ of investments that are approaching potential turning points, but are not yet at peak fragility. We believe that this enhancement will help to prepare future trades. Stay tuned. Dhaval Joshi Chief Strategist dhaval@bcaresearch.com Footnotes 1 Based on Savills Prime Index: World Cities – Capital Values, and World Cities – Rents and Yields, June 2011 through June 2021. Fractal Trading System Fractal Trades 6-Month Recommendations Structural Recommendations Closed Fractal Trades Indicators To Watch - Bond Yields Chart II-1Indicators To Watch - Bond Yields - ##br##Euro Area Chart II-2Indicators To Watch - Bond Yields - Europe Ex Euro Area Chart II-3Indicators To Watch - Bond Yields - ##br##Asia Chart II-4Indicators To Watch - Bond Yields - Other Developed Indicators To Watch - Interest Rate Expectations Chart II-5Indicators To Watch - Interest Rate Expectations Chart II-6Indicators To Watch - Interest Rate Expectations Chart II-7Indicators To Watch - Interest Rate Expectations Chart II-8Indicators To Watch - Interest Rate Expectations
In a webcast this Friday I will be joined by our Chief US Equity Strategist, Anastasios Avgeriou to debate ‘Sectors To Own, And Sectors To Avoid In The Post-Covid World’. Today’s report preludes five of the points that we will debate. Please join us for the full discussion and conclusions on Friday, June 12, at 8:00 AM EDT (1:00 PM BST, 2:00 PM CEST, 8.00 PM HKT). Highlights Technology is behaving like a Defensive. Defensive versus Cyclical = Growth versus Value. Growth stocks are not a bubble if bond yields stay ultra-low. The post-Covid world will reinforce existing sector mega-trends. Sectors are driving regional and country relative performance. Fractal trade: Long ZAR/CLP. Chart of the WeekSector Defensiveness/Cyclicality = Positive/Negative Sensitivity To The Bond Price 1. Technology Is Behaving Like A Defensive How do we judge an equity sector’s sensitivity to the post-Covid economy, so that we can define it as cyclical or defensive? One approach is to compare the sector’s relative performance with the bond price. According to this approach, the more negatively sensitive to the bond price, the more cyclical is the sector. And the more positively sensitive to the bond price, the more defensive is the sector (Chart I-1). On this basis the most cyclical sectors in the post-Covid economy are, unsurprisingly: energy, banks, and materials. Healthcare is unsurprisingly defensive. Meanwhile, the industrials sector sits closest to neutral between cyclical and defensive, showing the least sensitivity to the bond price. The tech sector’s vulnerability to economic cyclicality appears to have greatly reduced. The big surprise is technology, whose high positive sensitivity to the bond price during the 2020 crisis qualifies it as even more defensive than healthcare. This contrasts sharply with its behaviour during the 2008 crisis. Back then, tech’s relative performance was negatively correlated with the bond price, defining it as classically cyclical. But over the past year, tech’s relative performance has been positively correlated with the bond price, defining it as classically defensive (Chart I-2 and Chart I-3). Chart I-2In 2008, Tech Behaved Like ##br##A Cyclical... Chart I-3...But In 2020, Tech Is Behaving Like A Defensive This is not to say that the big tech companies cannot suffer shocks. They can. For example, from new superior technologies, or from anti-oligopoly legislation. However, the tech sector’s vulnerability to economic cyclicality appears to have greatly reduced over the past decade. 2. Defensive Versus Cyclical = Growth Versus Value If we reclassify the tech sector as defensive in the 2020s economy, then the post mid-March rebound in stocks was first led by defensives. Cyclicals took over leadership of the rally only in May. Moreover, with the reclassification of tech as defensive, the two dominant defensive sectors become tech and healthcare. But tech and healthcare are also the dominant ‘growth’ sectors. The upshot is that growth versus value has now become precisely the same decision as defensive versus cyclical (Chart I-4). Chart I-4Defensive Versus Cyclical = Growth Versus Value 3. Growth Stocks Are Not A Bubble If Bond Yields Stay Ultra-Low Some people fear that growth stocks have become dangerously overvalued. There is even mention of the B-word. Let’s address these fears. Yes, valuations have become richer. For example, the forward earnings yield for healthcare is down to 5 percent; and for big tech it is down to just over 4 percent. This valuation starting point has proved to be an excellent guide to prospective 10-year returns, and now implies an expected annualised return from big tech in the mid-single digits. Yet this modest positive return is well above the extremes of the negative 10-year returns implied and delivered from the dot com bubble (Chart I-5). Chart I-5Big Tech Is Priced To Deliver A Positive Return, Unlike In 2000 Moreover, we must judge the implied returns from growth stocks against those available from competing long-duration assets – specifically, against the benchmark of high-quality government bond yields. If bond yields are ultra-low, then they must depress the implied returns on growth stocks too. Meaning higher absolute valuations (Chart I-6 and Chart I-7). Chart I-6Tech's Forward Earnings Yield Is Above The Bond Yield, Unlike In 2000 Chart I-7Healthcare's Forward Earnings Yield Is Above The Bond Yield, Unlike In 2000 In the real bubble of 2000, big tech was priced to return 12 percent (per annum) less than the 10-year T-bond. Whereas today, the implied return from big tech – though low in absolute terms – is above the ultra-low yield on the 10-year T-bond. If bond yields are ultra-low, then they must depress the implied returns on growth stocks too. The upshot is that high absolute valuations of growth stocks are contingent on bond yields remaining at ultra-low levels. And that the biggest threat to growth stock valuations would be a sustained rise in bond yields. 4. The Post-Covid World Will Reinforce Existing Sector Mega-Trends If a sector maintains a structural uptrend in sales and profits, then a big drop in the share price provides an excellent buying opportunity for long-term investors. This is because the lower share price stretches the elastic between the price and the up-trending profits, resulting in an eventual catch-up. However, if sales and profits are in terminal decline, then the sell-off is not a buying opportunity other than on a tactical basis. This is because the elastic will lose its tension as profits drift down towards the lower price. In fact, despite the sell-off, if the profit downtrend continues, the price may be forced ultimately to catch-down. This leads to a somewhat counterintuitive conclusion. After a big drop in the stock market, long-term investors should not buy everything that has dropped. And they should not buy the stocks and sectors that have dropped the most if their profits are in major downtrends. In this regard, the post-Covid world is likely to reinforce the existing mega-trends. The profits of oil and gas, and of European banks will remain in major structural downtrends (Chart I-8 and Chart I-9). Conversely, the profits of healthcare, and of European personal products will remain in major structural uptrends (Chart I-10 and Chart I-11). Chart I-8Oil And Gas Profits In A Major ##br##Downtrend Chart I-9Bank Profits In A Major ##br##Downtrend Chart I-10Healthcare Profits In A Major Uptrend Chart I-11Personal Products Profits In A Major Uptrend 5. Sectors Are Driving Regional And Country Relative Performance Finally, sector winners and losers determine regional and country equity market winners and losers. Nowadays, a stock market’s relative performance is predominantly a play on its distinguishing overweight and underweight ‘sector fingerprint’. This is because major stock markets are dominated by multinational corporations which are plays on their global sectors, rather than the region or country in which they have a stock market listing. It follows that when tech and healthcare outperform, the tech-heavy and healthcare-heavy US stock market must outperform, while healthcare-lite emerging markets (EM) must underperform. It also follows that the tech-heavy Netherlands and healthcare-heavy Denmark stock markets must outperform. Sector mega-trends will shape the mega-trends in regional and country relative performance. Equally, when energy and banks underperform, the energy-heavy Norway and bank-heavy Spain stock markets must underperform. (Chart I-12 and Chart I-13). These are just a few examples. Every stock market is defined by a sector fingerprint which drives its relative performance. Chart I-12Sector Relative Performance Drives... Chart I-13...Regional And Country Relative Performance If sector mega-trends continue, they will also shape the mega-trends in regional and country relative performance – favouring those stock markets that are heavy in growth stocks and light in old-fashioned cyclicals. Please join the webcast to hear the full debate and conclusions. Fractal Trading System* This week’s recommended trade is to go long the South African rand versus the Chilean peso. Set the profit target and symmetrical stop-loss at 5 percent. In other trades, long Spanish 10-year bonds versus New Zealand 10-year bonds achieved its 3.5 percent profit target at which it was closed. And long Australia versus New Zealand equities is approaching its 12 percent profit target. The rolling 1-year win ratio now stands at 63 percent. Chart I-14ZAR/CLP When the fractal dimension approaches the lower limit after an investment has been in an established trend it is a potential trigger for a liquidity-triggered trend reversal. Therefore, open a countertrend position. The profit target is a one-third reversal of the preceding 13-week move. Apply a symmetrical stop-loss. Close the position at the profit target or stop-loss. Otherwise close the position after 13 weeks. * For more details please see the European Investment Strategy Special Report “Fractals, Liquidity & A Trading Model,” dated December 11, 2014, available at eis.bcaresearch.com. Dhaval Joshi Chief European Investment Strategist dhaval@bcaresearch.com Fractal Trading System Cyclical Recommendations Structural Recommendations Closed Fractal Trades Trades Closed Trades Asset Performance Currency & Bond Equity Sector Country Equity Indicators Bond Yields Chart II-1Indicators To Watch - Bond Yields Chart II-2Indicators To Watch - Bond Yields Chart II-3Indicators To Watch - Bond Yields Chart II-4Indicators To Watch - Bond Yields Interest Rate Chart II-5Indicators To Watch - Interest Rate Expectations Chart II-6Indicators To Watch - Interest Rate Expectations Chart II-7Indicators To Watch - Interest Rate Expectations Chart II-8Indicators To Watch - Interest Rate Expectations

Since the turn of the millennium, the clothing and accessories sector’s profits are up by a thousand percent. Our European investment strategists argue that this megatrend has further to run, as its principle driver is still very much in place: Consumption…
Highlights One of Europe's major success stories is the structural and broad-based increase in female labour participation rates. The trend is set to continue for the next decade. Stay overweight the Personal Products sector as a long-term position. Italy's decade-long stagnation is not a deep-seated structural malaise. It is a protracted cyclical downturn resulting from a banking system that was never repaired after the 2008 financial crisis combined with wholly inappropriate fiscal austerity. We expect Italy's new government to push back against the EU's misguided fiscal rules and correct this decade-long error. Buy exposure to Italian real estate as a new long-term position either directly or through Italy's small real estate equity sector. Feature Some analysts persist on comparing economic performances on the basis of real GDP per head of total population. But the total population includes children and the elderly who cannot contribute to economic output. Therefore, a correct assessment of economic performance should look at real GDP per head of working-age population. Chart I-1AWomen Are Powering The European Economy... Chart I-1B ...Less So In The U.S. Admittedly, as the retirement age rises, the definition of 'working-age' will gradually change, but the general principle still holds: only count in the denominator those who can contribute to economic output. GDP per head of working-age population can grow in several ways. One way is to get more output or better output from each hour worked through improvements in efficiency and/or quality. As this improvement is theoretically limitless, it is the main source of productivity gains in the long run. A second way is for each worker to work more hours. But given the physical and legal constraints on productive working time, there is only limited scope to increase output in this way. How Women Are Powering The European Economy There is one other way to increase GDP per head of working-age population: increase the percentage of the working age population that is in the labour force.1 In other words, structurally increase the labour participation rate. If this participation rate is already high - as it is for men - then there is little scope to increase it much further. But if the participation rate is low - as it is for European women - then there is considerable scope to increase it. This brings us to one of Europe's major, and largely untold, success stories - the structural and broad-based increase in female participation rates (Chart I-1-Chart I-5). Over the past twenty years, the EU28 female participation rate has risen from 57% to 68%, with an especially large contribution from the socially conservative southern countries. In Spain, female participation has surged from 47% to 70%. In Italy, it has shot up from 42% to 56% and has clear scope to rise much further. Chart I-2Italy: Labour Force Participation Rate Chart I-3Spain: Labour Force Participation Rate Chart I-4Germany: Labour Force Participation Rate Chart I-5France: Labour Force Participation Rate What is driving this structural trend? Two things. First, the employment sectors that are growing structurally - healthcare, social care, and education - tend to employ more women than men. Second, European countries have legislated a raft of policies encouraging women to join and remain in the labour force: generous paid maternity leave and subsidised childcare. The trend is for further improvements, with the focus now on improving paternity leave. Sharing parental and family responsibilities between mothers and fathers allows more women to enter and stay in the labour force.2 For the ultimate end-point in the trend, look to the Scandinavian countries which started such policies in the early 1970s. In Sweden, labour force participation for women and men is almost identical: 81% versus 84%. If the EU eventually adopts the Scandinavian model, it would mean another 20 million European women in employment and contributing to economic output (Chart I-6). Chart I-6Another 20 Million European Women ##br##Could Join The Labour Force Dispelling Two Myths: The Euro Area And Italy Having established that economic performances should be compared on the basis of GDP per head of working age population, we can now dispel two common myths. The first myth is that the U.S. generates superior productivity growth than the euro area. It is true that the U.S. has been better at getting more output from each hour worked, so on this measure, the U.S. does win. Against this, the euro area has been much better at getting more of its working-age population - albeit mostly women - into employment. So on this measure, the euro area wins (Chart of the Week). The net result is that, over the past twenty years, the U.S and the euro area have generated exactly the same growth in real GDP per working-age population (Chart I-7). Of course, the euro area's structural improvement in female participation rates cannot continue forever, but it can certainly continue for another decade or so, and this is generally the longest time horizon that most investors care about. Chart I-7The Euro Area And The U.S.: Identical Growth In Real GDP Per Head Of Working-Age Population The second myth concerns the subject du jour: Italy. Many people claim that Italy's economic stagnation is due to deep-seated structural problems which differentiate it from other major economies. The problem with this narrative is that from the mid-1990s until 2008 the growth in Italy's real GDP per head of working age population was little different to that in Germany, France or the U.S. (Chart I-8). Chart I-8Italy Performed In Line With Other Major Economies Until 2008 Italy's economic stagnation only started after the 2008 global financial crisis. After a financial crisis which cripples the banking system, there are two golden rules: unleash fiscal stimulus; and repair the banking system as quickly as possible. The U.S. and U.K. followed the golden rules perfectly and immediately; Ireland followed a couple of years later; Spain waited until 2013. But in each case, the economies rebounded very strongly as the fiscal stimulus kicked in and the banks recuperated. Italy neither unleashed fiscal stimulus, nor repaired its banks - so its economy has stagnated for a decade. Moreover, if output stagnates for a decade, it follows arithmetically that productivity growth will also look poor. In a back-to-front argument, critics have pounced on this as evidence of excessive 'red tape' and 'structural problems'. But this is a misdiagnosis of the malaise. To reiterate, Italy's real GDP per working-age population was growing very respectably before 2008. Italy's misfortune is that its indebtedness has an unusual profile: more public debt than private debt. France and Spain (and other major euro area economies) have the usual profile: less public debt than private debt. So the EU's fiscal rules - which can see only public debt and are blind to private debt - have severely and unfairly constrained Italy's ability to respond to financial crises. While every other major economy followed the golden rules to recover from the 2008 crisis, Italy could neither unleash fiscal stimulus to kick start the economy nor recapitalise its dysfunctional banking system. We expect Italy's new government to push back against the EU's misguided fiscal rules and correct this decade-long error. Two Structural Investment Conclusions This week's two investment conclusions are both long term, and require a buy and hold mentality. The first conclusion reiterates a structural position: overweight the Personal Products sector. This is based on our expectation that, in Europe, female participation rates will continue their structural uptrend; while in the U.S. we expect female participation rates to continue outperforming male participation rates. Therefore the sales and profits of the Personal Products sector, in which female spending dominates, will benefit from a multi-year tailwind, at least relative to other sectors. And the extent of this tailwind is not fully discounted in valuations. The second conclusion is a new long-term recommendation: buy exposure to Italian real estate. This is based on our assessment that Italy's decade-long stagnation is not a deep-seated structural malaise. Instead, it is a protracted cyclical downturn resulting from a banking system that was never repaired after the 2008 financial crisis combined with wholly inappropriate fiscal austerity. Removing these shackles will allow a long-term recovery, just as it did for Spain in 2013. If we are right, the best multi-year buy and hold play is Italian real estate which has been in a decade-long bear market (Chart I-9). For those that cannot directly invest in property, Italy has a small real estate equity sector which faithfully tracks the long term profile of real estate prices (Chart I-10), and whose main component is Beni Stabili. The caveat is that the stock has a market cap of just €2 billion; the appeal is that it offers a juicy dividend yield of 4.5%. Chart I-9Italian Real Estate Has Suffered ##br##A Decade-Long Bear Market Chart I-10Italian Real Estate Equities##br## Track Real Estate Prices Dhaval Joshi, Senior Vice President Chief European Investment Strategist dhaval@bcaresearch.com 1 And in employment. 2 Please see the European Investment Strategy Special Report "Female Participation: Another Mega-Trend" published on April 6, 2017 and available at eis.bcaresearch.com Fractal Trading Model* This week, we note that the 130-day fractal dimension for platinum versus nickel is close to its lower bound, a level which has consistently predicted a tradeable countertrend move over the following 130 days. Hence, this week's trade is long platinum/short nickel on a 130 horizon before expiry. The profit target is 14% with a symmetric stop-loss. Our two other open trades, long SEK/GBP and long PLN/USD, are both in profit. For any investment, excessive trend following and groupthink can reach a natural point of instability, at which point the established trend is highly likely to break down with or without an external catalyst. An early warning sign is the investment's fractal dimension approaching its natural lower bound. Encouragingly, this trigger has consistently identified countertrend moves of various magnitudes across all asset classes. Chart I-11 The post-June 9, 2016 fractal trading model rules are: When the fractal dimension approaches the lower limit after an investment has been in an established trend it is a potential trigger for a liquidity-triggered trend reversal. Therefore, open a countertrend position. The profit target is a one-third reversal of the preceding 13-week move. Apply a symmetrical stop-loss. Close the position at the profit target or stop-loss. Otherwise close the position after 13 weeks. Use the position size multiple to control risk. The position size will be smaller for more risky positions. * For more details please see the European Investment Strategy Special Report "Fractals, Liquidity & A Trading Model," dated December 11, 2014, available at eis.bcaresearch.com Fractal Trading Model Recommendations Equities Bond & Interest Rates Currency & Other Positions Closed Fractal Trades Trades Closed Trades Asset Performance Currency & Bond Equity Sector Country Equity Indicators Bond Yields Chart II-1Indicators To Watch - Bond Yields Chart II-2Indicators To Watch - Bond Yields Chart II-3Indicators To Watch - Bond Yields Chart II-4Indicators To Watch - Bond Yields Interest Rate Chart II-5Indicators To Watch##br## - Interest Rate Expectations Chart II-6Indicators To Watch##br## - Interest Rate Expectations Chart II-7Indicators To Watch##br## - Interest Rate Expectations Chart II-8Indicators To Watch##br## - Interest Rate Expectations
Feature Japan's economic experience in the post bubble era is often described as a fate to avoid at all costs. We would like to turn this common notion on its head. Rather than something to avoid, Japan's post bubble experience is a fate that other major economies should actively try to emulate, at least in parts. This report focusses on three specific lessons for European investors. Japan's so-called 'lost decades' describe the weak growth in its nominal GDP since the mid-1990s. But this emphasis on aggregate nominal income is grossly misleading. Standards of living do not depend on nominal GDP. What matters is real GDP per head combined with the absence of extreme income inequality. Real income must grow and this growth must benefit the majority, rather than a small minority. Since the late 1990s, the growth in Japan's real GDP per head has outperformed every other major economy (Chart Of The Week). And unlike other major economies, income inequality in Japan has not increased, remaining amongst the lowest in the developed world (Chart I-2). This is not surprising. Credit booms inflate bubbles in financial assets, which exacerbate income and wealth inequalities. Chart Of The WeekJapan Has Outperformed Everybody Chart I-2Income Inequality In Japan Has Not Increased Admittedly, the government has been running persistent deficits, but this is to counterbalance private sector de-levering. Total indebtedness as a share of GDP has not been rising. In the post credit boom era, Japan's real growth has come entirely from productivity improvements. Mankind's persistent ability to learn, experiment, and innovate produces more and/or better output from a fixed set of inputs. Unlike the unsustainable growth that is fuelled by credit booms and asset bubbles, real growth that comes from productivity improvements is sustainable. Genuine Price Stability: Something To Celebrate, Not Fear Japanese consumer prices are at the same level today as they were in 1992, meaning that Japan has experienced genuine price stability for two and a half decades (Chart I-3). But this is neither new, nor alarming - Britain enjoyed genuine price stability for two and a half centuries! At the height of the British Empire in 1914, consumer prices were little different to where they stood at the end of the English Civil War in 1651 (Chart I-4). Chart I-3Japan Has Experienced Genuine Price ##br## Stability For Two And A Half Decades... Chart I-4...But Britain Experienced Genuine Price Stability For Two And A Half Centuries! Nevertheless, central banks continue with the deception that price stability means an inflation rate of 2%. This is clearly nonsense. Think about it - if prices rise by 2% a year, then your money will lose a quarter of its purchasing power every decade. And after a typical working life, your money will have lost two-thirds of its value.1 How exactly does that qualify as price stability?2 Still, we frequently hear a strong counterargument - in a highly indebted economy, inflation and growth in nominal GDP do matter. As debt is a nominal amount, it is nominal incomes that determine the ability to service and repay the high level of debt. So given a free choice, policymakers would prefer to have inflation at 2% rather than at zero; and nominal GDP growth at 3.5% rather than at 1.5%. Unfortunately, policymakers do not have this free choice. Contrary to what central bankers promise, inflation and nominal GDP growth cannot be dialled up or down at will to hit a point target. As we explained a while back in The Case Against Helicopters, inflation is a non-linear phenomenon which is extremely difficult, if not impossible, to point target.3 Look at the standard identity of monetary economics: MV = PT M is the broad money supply, V is its velocity of circulation, P is the price level and T is the volume of transactions. PT is effectively nominal GDP. The big problem is that both the broad money supply M and its velocity V - whose product determines nominal GDP - are highly non-linear. Chart I-5The Money Multiplier Is Non-Linear M is non-linear because the commercial banking system money multiplier - the ratio of loans to bank reserves - is non-linear. At a tipping point of inflation, the onus suddenly flips from lending as little as possible to lending as much as possible (Chart I-5). Admittedly, the central bank (in cahoots with the government) could by-pass the commercial banking system to control the money supply M directly. But it can do nothing to change the extreme non-linearity of the other driver of nominal GDP, the velocity of money V. Again, at a tipping point, the onus suddenly flips to spending money - both newly created and pre-existing balances - as fast as possible. At this point, nominal GDP growth and inflation suddenly and uncontrollably phase-shift from ice to fire with little in between. What is the Japanese lesson for Europeans? Simply that just like the BoJ, the ECB will keep moving the 2% inflation goalpost further and further into the future, as it realises the impossibility of achieving and sustaining the 2% point target. So even with inflation in the 1-2% channel, the ECB will create a loophole to exit NIRP and ZIRP very soon after it exits QE. This will structurally support the euro. Do Not Own Banks For The Long Term (Or Now) Japanese financial sector profits stand at less than half their peak level in 1990. For euro area financial sector profits which peaked in 2007, the interesting thing is that they are tracking the Japanese experience with a 17-year lag. If euro area financial profits continue to follow in Japan's footsteps, expect no sustained growth through the next 17 years (Chart I-6). Chart I-6Euro Area Financial Profits May Experience No Sustained Growth In a post credit boom era, banks lose the lifeblood of their business: credit creation. This loss becomes a multi-decade headwind to financial sector profit growth and share price performance. Bank profits are dependent on two other drivers. One is operational leverage - the amount of equity held against the balance sheet. More stringent European regulation will make this a headwind too. Banks will have to hold more equity capital against assets, diluting their profitability. The other driver is the net interest margin - the difference between rates received on loans and rates paid on deposits, effectively a function of the yield curve slope. However, this is a cyclical driver, and as explained last week in Market Turbulence: What Lies Ahead? this driver is unlikely to be positive in the coming months.4 What is the Japanese lesson for Europeans? Simply that euro area financials is not a sector to buy and hold for the long term. Rather, it is a sector to play during periodic strong countertrend rallies, albeit now is not the time for such a cyclical play. A Surge In Female Participation Chart I-7Sales Of Personal Products Have Boomed Over the past twenty years, Japanese sales of skin cosmetics and beauty products have almost tripled (Chart I-7). This has helped the personal products sector to outperform very strongly. The personal products sector is dominated by female spending. So it is significant that in 1995, the Japanese government introduced a raft of policies to encourage women to join the labour force: paid maternity leave, subsidised childcare, and paid parental leave for both parents. Today in Japan, both mothers and fathers can take more than a year of paid parental leave at an average rate of 60% of earnings. The policies had their desired effect. The proportion of Japanese women in the labour force has surged from 57% to 67%, while the male labour participation rate has held at 85%. Therefore, all of the growth in the Japanese labour force through the past twenty years has come from women. Europe tells a similar tale. Through the past couple of decades, parental leave policies have become steadily more generous. Unsurprisingly, the proportion of European women in the labour force has also surged from 57% to 67%, while the male labour participation rate has held at 78%. So just as in Japan, all of the growth in European labour force participation through the past twenty years has come from women (Chart I-8). But for the ultimate end-point in the European trend, look to the Scandinavian countries which have had generous parental leave policies since the 1970s. As a result, labour force participation for Swedish women is almost identical to that for men: 80% versus 83%. If the EU eventually reaches the Scandinavian end-point, it would mean another 20 million women in the EU labour force. What is the Japanese lesson for Europeans? While Japanese financial profits have halved since 1990, Japanese personal products profits have quintupled. Once again, the useful thing is that euro area personal product profits are uncannily tracking the Japanese experience with a 17-year lag (Chart I-9). If euro area personal product profits continue to follow in Japan's footsteps, expect them to almost triple over the next 17 years. Stay overweight the European personal products sector. Chart I-8A Surge In Female Participation Chart I-9Personal Products Profits Set To Grow Very Strongly Dhaval Joshi, Senior Vice President Chief European Investment Strategist dhaval@bcaresearch.com 1 Assuming you work for 50 years. 2 Admittedly, measured inflation probably overstates true inflation. However, estimates put this measurement error at no more than 0.3-0.5 percentage points. 3 Please see the European Investment Strategy Weekly Report 'The Case Against Helicopters' published on May 5 2016 and available at eis.bcaresearch.com 4 Please see the European Investment Strategy Weekly Report 'Market Turbulence: What Lies Ahead?' published on March 29 2018 and available at eis.bcaresearch.com Fractal Trading Model* This week’s trade recommendation is to go long the Australian dollar versus the Norwegian krone. The profit target is 2% with a symmetrical stop-loss. For any investment, excessive trend following and groupthink can reach a natural point of instability, at which point the established trend is highly likely to break down with or without an external catalyst. An early warning sign is the investment’s fractal dimension approaching its natural lower bound. Encouragingly, this trigger has consistently identified countertrend moves of various magnitudes across all asset classes. Chart I-10 * For more details please see the European Investment Strategy Special Report “Fractals, Liquidity & A Trading Model,” dated December 11, 2014, available at eis.bcaresearch.com The post-June 9, 2016 fractal trading model rules are: When the fractal dimension approaches the lower limit after an investment has been in an established trend it is a potential trigger for a liquidity-triggered trend reversal. Therefore, open a countertrend position. The profit target is a one-third reversal of the preceding 13-week move. Apply a symmetrical stop-loss. Close the position at the profit target or stop-loss. Otherwise close the position after 13 weeks. Use the position size multiple to control risk. The position size will be smaller for more risky positions Recommendations Equities Bond & Interest Rates Currency & Other Positions Closed Fractal Trades Trades Closed Trades Asset Performance Currency & Bond Equity Sector Country Equity Indicators Bond Yields Chart II-1Indicators To Watch - Bond Yields Chart II-2Indicators To Watch - Bond Yields Chart II-3Indicators To Watch - Bond Yields Chart II-4Indicators To Watch - Bond Yields Interest Rate Chart II-5Indicators To Watch - Interest Rate Expectations Chart II-6Indicators To Watch - Interest Rate Expectations Chart II-7Indicators To Watch - Interest Rate Expectations Chart II-8Indicators To Watch - Interest Rate Expectations
Highlights ECB policy is set to become less dovish relative to other central banks. Stay long the euro; stay underweight German bunds within a global bond portfolio; and overweight euro area Financials within a global Financials portfolio. Female labour participation is surging. The state of the euro area labour market is not nearly as bad as many pessimists would have you believe. Play the mega-trend of rising female labour participation with a structural overweight in the Personal Products sector. Allowing for euro break-up risk, European equities are fairly valued - rather than cheap - versus U.S. equities. Prefer to gain exposure via a 50:50 combination of Germany (DAX) and Sweden (OMX). Feature "Domestic sources of risk to euro area growth have diminished while global, geo-global sources of risk have increased." - Mario Draghi The Cleanest Dirty Shirt Since the end of 2014, an unspectacular 1.9% growth rate1 has been enough to make the euro area the world's top-performing major economy - bettering the U.S., U.K. and Japan (Chart I-2). Chart of the WeekThe Percentage Of The French Population In Employment Is At An All-Time High Chart I-2The Euro Area Is The Top-Performing Economy The euro area economy has achieved this outperformance with exceptionally low volatility. For eight consecutive quarters, growth2 has remained within a very tight 1.2-2.2% band, less than half of the equivalent volatility in the U.S., U.K. and Japan. And growth is now "solid and broad", meaning that it includes all countries. The ECB's dispersion index of value-added growth in different countries stands at a historical minimum. We expect the euro area to remain the cleanest dirty shirt. As Draghi points out, the ECB is less worried about domestic risks and more worried about global risks. Specifically: "Markets are in the course of reassessment of U.S. fiscal policy" - Trumponomics will not be nearly as stimulative as first thought. "How the U.K. economy does post-Brexit has a channel of economic consequences for the euro area." "Possible negative surprises in some emerging market economies" - notably China. If any of the global risks do flare up, the ECB will sit pat, but other central banks will have to become more dovish relative to current expectations. If the risks do not flare up, the ECB will start to reduce its own extreme dovishness - at least with words, if not actions. Either way, ECB policy is set to become less dovish relative to other central banks. And the investment implications are: stay long the euro; stay underweight German bunds within a global bond portfolio; and overweight euro area Financials within a global Financials portfolio. Female Labour Participation Is Surging Chart I-3Rising Participation Boosts Employment As Emanuel Macron prepares to become the twenty fifth President of the French Republic, he can take heart from a statistic which may surprise you: The percentage of the French population in employment has never been this high. (Chart of the Week). How can this be when the French unemployment rate is still hovering around 10%? The answer is: as millions of formerly inactive French citizens have entered the labour market, it has lifted the percentage of the population with jobs to an all-time high (Chart I-3). But the flip side of rising participation is that it has kept the unemployment rate elevated - because some citizens who were formerly 'uncounted inactive' are now 'counted unemployed'. Remember that to count as unemployed, a person has to be in the labour market available for work. Some argue that French citizens have simply flooded into the labour market to claim generous and long-lasting unemployment benefits. This argument might hold during downturns, but it cannot explain the 25-year uptrend which also includes economic booms. Unpalatable as it might be to the pessimists, we are left with a more optimistic explanation. France has raised activity levels in the working age population with policies that encourage much greater female participation in the labour market. The important lesson is that when labour participation is rising or falling, we must interpret the headline unemployment rate with extreme care.3 If a country's unemployment rate is high because labour participation has increased - as in France - the labour market is not quite as bad as the high unemployment rate might suggest.4 Conversely, if a country's unemployment rate is low because labour participation has decreased - as in the U.S. (Chart I-4) - the labour market is not quite as good as the low unemployment rate might suggest. Counted unemployment has just been replaced with uncounted inactivity. We propose that the percentage of the working age population in employment is the truer measure of labour utilisation. With surging female participation boosting employment in France and most other European countries (Chart I-5), the state of the euro area labour market is not nearly as bad as many pessimists would have you believe. Chart I-4Participation Down In The U.S.,##br## But Up In Europe... Chart I-5...Led By ##br##Women Play the mega-trend of rising female labour participation with a structural overweight in the Personal Products sector. Political Risk Is Correctly Priced Many people saw the Brexit and Trump victories as the leading edge of a wave of economic nationalism. However, subsequent election results in the Netherlands, Austria, Finland, Bulgaria and now France have seen economic nationalists consistently underperforming their expectations. In hindsight, the Brexit and Trump victories were idiosyncratic. Both the Remain and Clinton campaigns were lacking in personality or a strong emotional message, and this proved to be their undoing. Nowadays, many voters care about personalities more than policies; emotional appeal matters more than rational appeal. Behavioural psychologist and Nobel Laureate Daniel Kahneman calls the emotional way of thinking "System 1", and the colder rational way of thinking "System 2". Crucially, in a tight contest, both the Brexit and Trump campaigns resonated with the emotional System 1 with passionate pleas such as "Take Back Control" and "Make America Great Again". By contrast, the Remain and Clinton campaigns tried to appeal mainly to the rational System 2. But as Kahneman explains, when rational System 2 competes with emotional System 1, emotional System 1 almost always wins. Chart I-6Euro Break-Up Probability = 5% A Year In more recent elections, candidates and parties opposing the nationalists - including Emanuel Macron - have used a good balance of System 1 and System 2 arguments, thereby helping to prevent shock outcomes. This is also likely to be case in the two round French legislative elections on June 11 and 18 which we do not expect to impact financial markets significantly. Does this mean that political risk is over in Europe? No. Until the euro area turns into a permanent and irreversible political union, there has to be a probability of euro break-up. To value euro area assets, investors must ask: what is this break-up probability? The sovereign bond market says it is 5% a year (Chart I-6). This shows up in a discount on German bund yields, because after a euro break-up a new deutschmark would rise; and a symmetrical premium on Italian BTP yields, because a new lira would fall. For the aggregate euro area bond, the risk largely cancels out because intra-euro currency redenomination would be zero sum. But European equities must trade at a discount for this tail-event. At the peak of the euro debt crisis in 2011, the Eurostoxx600 underperformed the S&P500 by 25% in one year. In an outright break-up, the underperformance would almost certainly be worse, let's conservatively say 30-40%. So assuming the tail-event probability is 5% a year, European equities must compensate with a valuation discount which allows a 1.5-2.0%5 excess annual return over U.S. equities. Today, the valuation discount on European equities relative to U.S. equities implies an excess annual return of 1.8%.6 This makes European equities cheap versus U.S. equities only if the annual probability of euro break-up is less than 5%. Our assessment is that a 5% annual risk is about right. Therefore, European equities are fairly valued - rather than cheap - versus U.S. equities. But to avoid the undesirable sector skews in the Eurostoxx600, a much better way to gain long-term exposure to European equities is via a 50:50 combination of Germany (DAX) and Sweden (OMX) (Chart I-7). Chart I-7Prefer A DAX/OMX Combo To The Eurostoxx50 Or Eurstoxx600 Dhaval Joshi, Senior Vice President European Investment Strategy dhaval@bcaresearch.com 1 At an annualized rate. 2 At an annualized rate. 3 Geek's note: the unemployment rate can be expressed as: 100*(participation rate - employment to population rate) / (participation rate). Hence, all else being equal, a rising participation rate will raise the unemployment rate and a falling participation rate will depress the unemployment rate. 4 This lesson applies equally to any studies of labour market slack such as this one: https://www.ecb.europa.eu/pub/pdf/other/ebbox201703_03.en.pdf that do not take into account the dynamics of participation rates. 5 5% multiplied by 30-40% equals 1.5-2.0% 6 Through the next ten years. Please see the European Investment Strategy Weekly Report titled "Markets Suspended In Disbelief" dated April 13, 2017 available at eis.bcaresearch.com Fractal Trading Model The rally in the CAC40 after the French election is technically extended. The recommended technical trade is to short the CAC40 versus the Eurostoxx600. For any investment, excessive trend following and groupthink can reach a natural point of instability, at which point the established trend is highly likely to break down with or without an external catalyst. An early warning sign is the investment's fractal dimension approaching its natural lower bound. Encouragingly, this trigger has consistently identified countertrend moves of various magnitudes across all asset classes. Chart I-8 The post-June 9, 2016 fractal trading model rules are: When the fractal dimension approaches the lower limit after an investment has been in an established trend it is a potential trigger for a liquidity-triggered trend reversal. Therefore, open a countertrend position. The profit target is a one-third reversal of the preceding 13-week move. Apply a symmetrical stop-loss. Close the position at the profit target or stop-loss. Otherwise close the position after 13 weeks. Use the position size multiple to control risk. The position size will be smaller for more risky positions. * For more details please see the European Investment Strategy Special Report "Fractals, Liquidity & A Trading Model," dated December 11, 2014, available at eis.bcaresearch.com Fractal Trading Model Recommendations Equities Bond & Interest Rates Currency & Other Positions Closed Fractal Trades Trades Closed Trades Asset Performance Currency & Bond Equity Sector Country Equity Indicators Bond Yields Chart II-1Indicators To Watch - Bond Yields Chart II-2Indicators To Watch - Bond Yields Chart II-3Indicators To Watch - Bond Yields Chart II-4Indicators To Watch - Bond Yields Interest Rate Chart II-5Indicators To Watch##br## - Interest Rate Expectations Chart II-6Indicators To Watch ##br##- Interest Rate Expectations Chart II-7Indicators To Watch##br## - Interest Rate Expectations Chart II-8Indicators To Watch##br## - Interest Rate Expectations