Policy

Executive Summary A Floor In Biden’s Approval?
Biden’s Floor, Republican Cracks
Biden’s Floor, Republican Cracks
Biden’s approval rating is forming a bottom. Democrats will pivot away from Covid-19 to boost the economy and consumer sentiment. While Democrats face a dismal midterm election, Republican infighting could conceivably cost the GOP control of the Senate. Policy uncertainty will rise as the election approaches. Republican infighting is unlikely to affect the outcome in the House of Representatives, although Republicans could lose three-to-nine seats that they might otherwise hold if the party establishment fails to coordinate effectively with former President Trump as we expect. Our tactical trades hinge on Biden’s near-term external risks: the risk of an energy shock that weighs on Treasury yields and pushes up the dollar. Defensives like health care should benefit. Our cyclical recommendations continue to favor cyclical equities such as small cap energy stocks. Bottom Line: Investors should be tactically prepared for geopolitical risks to push up the dollar and push down Treasury yields in the short run, contrary to the cyclical BCA House View. Feature Has Biden’s Approval Hit The Floor? Probably. President Biden’s net approval rating is still under water at -9%, only slightly better than President Trump’s at this stage in the approach to the 2018 midterm elections. Biden’s handling of the economy receives a lower approval rating, which is dangerous for his party because the economy is likely to be the most important issue in the midterm election, given that the Covid-19 pandemic is waning. If Biden follows the path of his predecessors then his approval rating will trend upward as the midterm approaches. That will not prevent a Republican victory in the House but it could affect the Senate and the size of the Republican majority (Chart of the Week). The latest jobs report saw 467, 000 new jobs created. The labor participation rate grew from 81.9% to 82%, while women’s participation rose from 56.5% to 56.8%. The unemployment rate ticked up from 3.9% to 4%, with the broader U6 measure rising from 7.2% to 7.9%, but the reason was that more workers joined the workforce, which is a good thing for the economy (Chart 1). The Omicron variant of the Covid-19 virus is having little impact so the labor market is continuing to heal, a positive for the Biden administration, which is otherwise struggling. Chart 1A Solid Jobs Report
A Solid Jobs Report
A Solid Jobs Report
American sentiment about the economy will hinge on inflation. If inflation abates along with the virus then the Democratic Party will be able to pare some losses in the midterms. At the moment the polarization of economic sentiment – divergence based on partisan affiliation – is declining, but for reasons that will give the administration a headache. Democratic sentiment is falling while Republican sentiment is improving (Chart 2). If inflation stays high, Republican sentiment will tick back down and the public will be increasingly united in a negative view of the president’s economic management. If inflation peaks and rolls over, Democratic sentiment will recover as the election approaches and Republican sentiment will at least not get much worse. Chart 2Economic Sentiment Polarization In Decline
Economic Sentiment Polarization In Decline
Economic Sentiment Polarization In Decline
For this reason Biden and the Democrats are rapidly pivoting away from Covid-19 and social restrictions and trying to create the “return to normalcy” that failed last year. While they were in the opposition they had an interest in hyping the virus but now they are the incumbents and it is important to show that the pandemic is in the rear-view mirror. With 64% of Americans now vaccinated, and 40% having received booster shots, government social restrictions are likely to become less stringent (Chart 3). The latest data from the service sector will motivate this policy pivot away from the virus. The manufacturing sector improved again last month but the non-manufacturing sector was less upbeat in January. Services activity declined by a whopping 12% in January. It is still above its November 2020 level, when Biden got elected, but only by around 2.2%. The non-manufacturing employment index declined by 4.3% and only stands 0.8% above its November 2020 level. The ratio of new orders to inventories declined by 0.6% in January (Chart 4). Chart 3Democrats To Pivot Away From Covid-19
Democrats To Pivot Away From Covid-19
Democrats To Pivot Away From Covid-19
These statistics suggest that the non-manufacturing sector slowed down sharply in January, probably due to omicron and post-Christmas belt tightening. But employers did not let go of a lot of workers, as seen by the discrepancies between business activity and employment. The mostly positive jobs report reinforces this point. The weakness is seen as temporary and employers expect higher demand in coming months. Now that consumer durable spending is running out of steam (at least, excluding cars), consumers are likely to switch to consuming services, as long as services are open for them to consume. There is little reason to think restrictions will stay tight, given the political points cited above. Even in Europe the Covid “hawks” are loosening controls. Chart 4Democrats Want To Boost Service Sector
Democrats Want To Boost Service Sector
Democrats Want To Boost Service Sector
All that being said, the Biden administration has limited ability to control inflation that emanates from foreign supply shocks (e.g. Asia, Russia, Iran). Also voter perceptions of inflation will lag, even if inflation starts to abate. Crime and immigration will also weigh on the administration this fall. And the political clockwork favoring the opposition in midterm elections is remorseless. Bottom Line: Biden and the Democrats are likely to shift policy focus away from emphasis on the pandemic, which weighs on the service sector and employment, and instead pursue other policy options in preparation for the midterm election. The outlook is not positive but if Biden’s approval rating bottoms then Democrats’ chances of performing better in the midterm elections will rise and policy uncertainty will also rise. Will GOP Infighting Affect The Midterms? Maybe In The Senate Former President Trump clashed with former Vice President Mike Pence and others in the Republican Party over whether Pence had the right “to change the Presidential Election results” in 2020 by refusing to validate electoral college votes from states in which electoral fraud was alleged. Pence called the idea “un-American” and reiterated his position that the vice president has no “unilateral authority” to discard a state’s electoral votes while certifying the electoral count.1 Trump lashed out because moderate Republicans are flirting with Democrats over how to pass a bipartisan revision to the Electoral Count Act of 1887, which left a number of ambiguities in the US electoral process, including about the vice president’s role in election certification. It is conceivable that the law will be revised in time for the 2024 election but odds are against a quick solution: the original law took 10 years to pass. Throughout the 2022-24 election cycle, Trump will continue to clash with his party, which raises the single greatest risk to Republicans: that they will be too divided to capitalize fully on the Democrats’ weaknesses. We do not expect Trump to coordinate effectively with Republicans. His interest in revolutionizing the political establishment and winning a second term in 2024 diverges from the interest of the traditional Republicans, who want to preserve the political establishment with themselves on top, and want a fresh face to contend for eight years in the White House in 2024. However, Trump controls a plurality of the party’s grassroots voters (about 54%2 according to opinion polls) so that the Republican Party cannot afford to spurn him. If Trump were willing to cooperate with party leaders, then he would have cooperated when it mattered most: ahead of the Georgia special elections on January 5, 2020. If he had recognized the constitutional supremacy of the electoral college vote, he might have saved Republican control of the Senate. He did not, so the burden of proof falls on those who say that Trump can coordinate effectively with the Republican Party at critical junctures. Most likely the party will continue to play both sides, keeping Trump in the party but seeking a post-Trump future. Trump will continue to pursue the Republican nomination in 2024 and the party will have to acquiesce to him as long as he retains the support of a majority of the party’s grassroots. Trump’s conflict with the party will flare up in the primary elections this spring because Trump will endorse his own favorite candidates regardless of whether the Republican establishment agrees and views them as the most likely to win. Any success of Trump-backed populists in the primaries may become a liability for Republicans in the general election if the seat is competitive and the Democrats put up a moderate candidate. This point is primarily relevant in the Senate: Five Senate Republicans are stepping down, leaving an open competition in Alabama, Missouri, North Carolina, Ohio, and Pennsylvania (Table 1). The last three of these (NC, OH, PA) are competitive seats, especially if the Republican candidate is weak and Biden’s approval revives by the time of the vote. Trump has only made an endorsement in North Carolina, where his candidate is far from assured to win. Given that control of the Senate could hang on a single seat, it is at least possible that Trump’s split with the GOP could affect the Senate balance of power in 2023-24. Table 1Senate Incumbents Not Seeking Re-Election, 2022
Biden’s Floor, Republican Cracks
Biden’s Floor, Republican Cracks
Trump will also have an impact on the House of Representatives but he is less likely to affect the outcome of the midterm there, given that Republicans are likely to win 40 seats when they only need five to take control. There are a lot more Democrats retiring from the House than Republicans in this cycle, a positive indication for Republicans (Chart 5). In total there are 48 competitive seats (13 Republican-leaning, 22 Democrat-leaning, and 13 toss-up).3 Of these 48 competitive seats, 12 seats are “open” (no incumbent), divided evenly among Republicans and Democrats. In most of these competitive seats, but especially in Democrat-leaning seats and toss-up seats, a Trump-backed Republican will have a harder time winning than a traditional Republican. All ten Republicans who voted to impeach President Trump after the January 6 rebellion are vulnerable to Trump challengers (Table 2). Three are already retiring. Given that Wyoming Representative Liz Cheney won her seat by a 44% margin, and yet is polling poorly relative to her Trump-backed challenger, it is fair to say that all seven of the remaining Republican impeachers are vulnerable to a Trumpist challenge. Of these, the general election could be competitive in five seats, i.e. those held by John Katko (R, NY-24), David Valadao (R, CA-21), Peter Meijer (R, MI-3), Fred Upton (R, MI-6), and Jaime Herrera Beutler (R, WA-3). However, given that the national tide does not favor the Democrats, five seats is the maximum that Democrats could poach from this group of lawmakers due to Republican infighting (three is a more likely number). Chart 5House Members Not Seeking Re-Election, 2022
Biden’s Floor, Republican Cracks
Biden’s Floor, Republican Cracks
Table 2House Republicans Who Voted To Impeach President Trump
Biden’s Floor, Republican Cracks
Biden’s Floor, Republican Cracks
More broadly there are 21 moderate Republicans in the House whose seats could be vulnerable to intra-party struggle (Table 3): So far President Trump has only endorsed candidates in seats which Republicans are highly likely to win anyway: namely Beth Van Duyne (R, TX-24), Mario Diaz-Balart (R, FL-25), and Carlos Gimenez (R, FL-26). But as the primary heats up, Trump’s endorsements could cause more tension with the Republican Party machinery. The following six moderate Republicans’ seats could be at risk: Maria Elvira Salazar (R, FL-27), Rodney Davis (R, IL-13), Jeff Van Drew (R, NJ-2), Andrew Garbarino (R, NY-2), Mike Turner (R, OH-10), and Brian Fitzpatrick (R, PA-1). Of these, Fitzpatrick and Garbarino do not face any challengers yet, and only Davis faces a Trump-backed challenger. So six is the maximum Democrats could steal while one-to-three vulnerable seats is more likely. Table 3Republican Moderates Vulnerable To Populist Challengers
Biden’s Floor, Republican Cracks
Biden’s Floor, Republican Cracks
Summing up, the Republican Party could fail to retain three-to-nine Republican seats that they might otherwise win in this cycle. Previously we put the number at five-to-nine seats. These numbers do not include any Democratic-leaning seats that Republicans could fail to poach if they choose a populist candidate who is not competitive in a “purple” state or district. In conclusion, Republican infighting will not prevent Republicans from retaking the House of Representatives this fall. Cyclical factors in favor of Republicans will overwhelm their internal differences. But infighting could leave them with a smaller majority than consensus expects. In 2024 Republican internal divisions will become much more important than in 2022. A competitive Republican primary election for president will reduce Republican odds in the general election. If President Trump fails to win the nomination, he could defect and form his party. If he wins the nomination, Liz Cheney or another traditional Republican could defect and run as a third party, acting as a spoiler. Given the tight margins of victory in presidential elections, even a splinter group could steal enough votes to determine the outcome. The midterms will shed light on the depth of GOP divisions but in general these divisions reinforce our view that while Democrats will perform poorly in the midterms, they are still favored to retain the White House in 2024. Bottom Line: While the odds are stacked against Democrats in the midterms, Republican infighting could affect several Senate seats and will subtract anywhere from three-to-nine seats from expected seat gains in the House. While control of the House will not be affected, it is conceivable that control of the Senate could hang in the balance. Policy uncertainty will rise if Republican infighting makes Senate races more competitive later this year. Housekeeping To conclude we offer a few remarks on our outstanding investment recommendations: Cyclically Long Energy Small Caps: US energy production is rising in keeping with global oil and commodity prices. West Texas Intermediate crude sells for $89 per barrel on the spot market, inventories are drawing, OPEC 2.0 is intact, and there are plenty of supply risks on the horizon. American natural gas exports are picking up but not enough to meet demand if conflict in Ukraine causes a European shortage, while US oil exports are falling (Chart 6). Chart 6US Energy Production Picking Up
US Energy Production Picking Up
US Energy Production Picking Up
Evidence from initial unemployment claims in O&G-dependent states like North Dakota and Wyoming suggests that shale producers need more time to ramp up production (Chart 7), as highlighted by our Commodity Strategist Bob Ryan. Small cap energy stocks have not benefited much from the sharp spike in energy prices this year. We see this as an opportunity, given that US small caps are insulated from geopolitical troubles and will become key players if shortages occur (Chart 8). The risk comes if the supply response overwhelms the supply disruptions, as occurred in 2014 – but oil companies were in a much better position to surge production at that time. The 2015 nuclear deal with Iran also appeared more durable at that time than it will this year if it is rejoined, and there is no guarantee it will be rejoined. Cyclically Long Infrastructure Stocks: Infrastructure stocks peaked along with the equity market and in the wake of the Biden administration’s $550 billion Infrastructure Investment and Jobs Act, which is now being implemented. Indicators of infrastructure construction peaked in late 2020 and early 2021 and are slipping of late. But as long as the economy does not relapse into recession they should stabilize, especially as the virus wanes and global demand recovers (Chart 9). Cyclically Long Cyber-Security Stocks: Global threats, proxied by the Canadian dollar’s exchange rate with the Russian ruble, suggest that cyber security stocks will rebound after getting caught up in the current tech selloff (Chart 10). Tech stocks are also likely to bounce if inflation expectations peak as the Federal Reserve kicks into action. Chart 7It Takes Time To Boost Shale Output
It Takes Time To Boost Shale Output
It Takes Time To Boost Shale Output
Chart 8US Small Caps Yet To Benefit From Oil Price
US Small Caps Yet To Benefit From Oil Price
US Small Caps Yet To Benefit From Oil Price
Chart 9Buy The Dip In Infrastructure Stocks
Buy The Dip In Infrastructure Stocks
Buy The Dip In Infrastructure Stocks
Chart 10Cyber Stocks A 'Buy' In Tech Selloff
Cyber Stocks A 'Buy' In Tech Selloff
Cyber Stocks A 'Buy' In Tech Selloff
Investment Takeaways Chart 11A Floor In Biden’s Approval?
Biden’s Floor, Republican Cracks
Biden’s Floor, Republican Cracks
US financial markets do not care about the midterm elections in the near term but that will change as policy uncertainty will rise over the course of the year. A bottom in Biden’s approval rating (Chart 11) and Republican primary election infighting both suggest that the Democratic Party’s odds in the midterms will improve going forward, raising policy uncertainty, especially over the Senate. Midterm uncertainty typically works in favor of the US dollar, Treasuries, defensive equity sectors, and growth stocks. As such it poses a risk to current market trends. The recent selloff in Big Tech confirms what we have argued since we launched the US Political Strategy: the tech sector faces a slow boil from inflation and rising interest, which are more immediate threats than government regulation. Having said that, we favor growth versus value on a tactical basis as we expect the dollar to rise and Treasury yields to fall on the back of geopolitical risks in the near term (Chart 12). Chart 12A Tactical Bounce For Tech Stocks?
A Tactical Bounce For Tech Stocks?
A Tactical Bounce For Tech Stocks?
Matt Gertken Senior Vice President Chief US Political Strategist mattg@bcaresearch.com Jesse Anak Kuri Associate Editor jesse.kuri@bcaresearch.com Footnotes 1 See Vice President Michael R. Pence’s letter, dated January 6, 2021, available at “Read Pence’s full letter saying he can’t claim ‘unilateral authority’ to reject electoral votes,” PBS, pbs.org. See also Mychael Schnell, “Trump says he wanted Pence to overturn election, eyes effort to reform law,” January 31, 2022, and Brett Samuels, “Pence breaks with Trump: ‘I had no right to overturn the election,’” February 4, 2022, thehill.com. 2 Please see “Over half of Americans believe the country's economy is headed in the wrong direction,” Ipsos, December 29, 2021, Ipsos.com 3 See Cook Political Report, “2022 House Race Ratings,” February 8, 2022, cookpolitical.com. Strategic View Open Tactical Positions (0-6 Months) Open Cyclical Recommendations (6-18 Months) Table A2Political Risk Matrix
Biden’s Floor, Republican Cracks
Biden’s Floor, Republican Cracks
Table A3US Political Capital Index
Biden’s Floor, Republican Cracks
Biden’s Floor, Republican Cracks
Chart A1Presidential Election Model
Biden’s Floor, Republican Cracks
Biden’s Floor, Republican Cracks
Chart A2Senate Election Model
Biden’s Floor, Republican Cracks
Biden’s Floor, Republican Cracks
Table A4APolitical Capital: White House And Congress
Biden’s Floor, Republican Cracks
Biden’s Floor, Republican Cracks
Table A4BPolitical Capital: Household And Business Sentiment
Biden’s Floor, Republican Cracks
Biden’s Floor, Republican Cracks
Table A4CPolitical Capital: The Economy And Markets
Biden’s Floor, Republican Cracks
Biden’s Floor, Republican Cracks
Executive Summary The End Of The Negative Bond Yield Era
Europe Joins The Global Bond Bear Market
Europe Joins The Global Bond Bear Market
Recent price action in developed market government bond markets confirms a backdrop that has been in place for the past several years - movements in US Treasuries define the trend in global yields, but Europe sets the effective floor. Higher core European bond yields are also pushing up non-European yields, in the context of the current global monetary policy tightening cycle. The hawkish market pricing for the ECB this year has gone a bit too far, as the start of European rate hikes this year is more likely in Q4 than in the summer – and only after ECB asset purchases begin to formally wind down. In the UK, the Bank of England appears to be trying to front load policy tightening, both rate hikes and balance sheet runoff, in response to overshooting UK inflation. A shorter, sharper policy tightening cycle means that the UK Gilt curve will continue to bear-flatten. Bottom Line: Within the “Big 3” developed market central banks, the Fed and Bank of England are more likely to deliver discounted rate hikes than the ECB over the next 6-12 months. Remain underweight US Treasuries and UK Gilts versus German Bunds in global bond portfolios. Feature Chart 1A Global Repricing Of Interest Rate Expectations
A Global Repricing Of Interest Rate Expectations
A Global Repricing Of Interest Rate Expectations
Persistent elevated inflation readings are forcing policymakers to move up the timetable of expected cyclical interest rate increases, but without signaling any change to longer-term interest rate expectations. The result has been an upward move in bond yields led by a repricing of shorter-term yields, leading to bearish yield curve flattening pressure across the developed markets (Chart 1). As the global bond bear market has intensified and broadened across countries and fixed income sectors, the amount of bonds worldwide with negative yields has been slashed by $9 trillion since December (Chart 2). Some notable examples: the 10-year German Bund yield is now up to +0.26%, the 30-year US real TIPS yield is now at +0.04% and even the 5-year Japanese government bond yield climbed to +0.02% for the first time since 2016. Last week, bond markets had to digest both a 25bp Bank of England (BoE) rate hike - that was almost a 50bp move - and a huge upside surprise in the January US employment report. However, it was the more hawkish-than-expected messaging from the European Central Bank (ECB) that really rattled fixed income markets. At the February monetary policy meeting, ECB President Christine Lagarde opened the door to potential ECB rate hikes this year, a notable change from the previous forward guidance that rates would stay unchanged in 2022. This not only triggered a major decline in European government bond prices, but also notable jumps in bond volatility for both longer-term and, especially, shorter-term yields. Implied volatilities for swaptions on 2-year European swap rates now sit at the highest levels since the depths of the European Debt Crisis in 2011 (Chart 3). Chart 2The End Of The Negative Bond Yield Era
The End Of The Negative Bond Yield Era
The End Of The Negative Bond Yield Era
Chart 3The Front-Ends Of Yield Curves Awaken
The Front-Ends Of Yield Curves Awaken
The Front-Ends Of Yield Curves Awaken
Overnight index swap (OIS) curves are now discounting multiple rate hikes from the Fed (+127bps), BoE (+125bps) and ECB (+46bps) this year. Tighter monetary policy is the inevitable consequence of the current combination of steady above-trend growth, tight labor markets and very high inflation in those countries. This mix will continue to put upward pressure on global bond yields through a blend of steady inflation expectations and higher real yields as pandemic era monetary stimulus is removed – a process that is already underway in the US and Europe (Chart 4). Our Central Bank Monitors – designed to measure the cyclical pressure to change monetary policy – are all indicating the need for tightening in the US, UK and euro area. However, the risk is that tightening perceived to be too aggressive or too rapid will be received poorly by financial markets that have grown accustomed to easy money policies during the pandemic. Given the current starting point of high equity valuations and relatively tight corporate credit spreads in the US, financial conditions are no impediment to additional Fed rate hikes in 2022 (Chart 5). The same cannot be said in the UK, where the steady appreciation of the trade-weighted pound is tightening financial conditions, on the margin. In the euro area, financial conditions remain relatively stimulative, as the euro is undervalued on a trade-weighted basis. Chart 4A Recipe For Even Higher Bond Yields
A Recipe For Even Higher Bond Yields
A Recipe For Even Higher Bond Yields
Given high realized inflation, financial stability concerns are playing a secondary role in the policy deliberations of central banks facing an inflation-fighting credibility crisis. In the absence of a big fall in inflation, it will take much larger selloffs in equity and corporate credit markets than what has occurred so far in 2022 before policymakers would step back from interest rate increases over the next year. Chart 5Financial Conditions Are No Impediment To Rate Hikes
Financial Conditions Are No Impediment To Rate Hikes
Financial Conditions Are No Impediment To Rate Hikes
The ECB Will Lag The Fed On Rate Hikes Chart 6Faster Growth & Slower Inflation Expected In 2022
Faster Growth & Slower Inflation Expected In 2022
Faster Growth & Slower Inflation Expected In 2022
One of our highest conviction bond market views to begin 2022 called for US Treasuries to underperform German Bunds. Our view was based on the likelihood that the Fed would lift the fed funds rate multiple times this year and the ECB was likely to hold off on rate hikes until the first half of 2023 at the earliest. Last week’s shift in the ECB’s tone does not change that relative call. The Fed is still under far greater pressure to hike rates than the ECB, even if there is now a greater chance that the ECB could begin to tighten by the end of 2022. From an economic growth perspective, both central banks have good reasons to consider withdrawing monetary accommodation. The economic expectations in both the US and euro area have started to recover, according to the ZEW survey of financial market professionals, with a bigger bounce seen in the latter since the trough of last October (Chart 6). The fading Omicron wave is likely playing a large role in lifting economic expectations, as the variant has proven to be less lethal than previous waves of the virus. The ZEW survey also asks respondents about their views on future inflation and interest rate changes. The ZEW Inflation Expectations index has fallen back to pre-pandemic lows in both the US and euro area, indicating that a majority expect lower inflation in the US and Europe over the next year. Both the Fed and ECB also expect inflation to fall from current elevated levels this year. However, there is still a much stronger case for tightening in the US given the tight labor market that is pushing up wages. Last week’s January US payrolls data was a shocker, with employment rising +476,000 on the month when some forecasters were calling for an outright contraction in jobs due to the impact of the Omicron variant. Wage growth accelerated smartly, with average hourly earnings up 0.7% on the month and 5.7% on a year-over-year basis (Chart 7). This continues the trend of wage acceleration seen in other data series like the Employment Cost Index, confirming that the US labor market is tight enough to elicit a strong policy response from the Fed. In the euro area, the recent economic data has been a bit more mixed. The Markit manufacturing PMI rose to a five-month high of 59.0 in January, beating expectations. However, the services PMI fell to a nine-month low of 51.2 as renewed COVID lockdowns weighed on consumer confidence and spending (Chart 8). With Omicron numbers now slowing, some recovery in consumer spending is likely over the next few months as euro area governments reduce restrictions. However, the manufacturing recovery will struggle to gain significant upside momentum without stronger demand for European exports – an outcome that is not currently heralded by an upturn in reliable indicators like the global leading economic indicator or the China credit impulse (Chart 9). Chart 7Persistent US Labor Market Strength
Persistent US Labor Market Strength
Persistent US Labor Market Strength
Chart 8A Mixed Picture On European Growth
A Mixed Picture On European Growth
A Mixed Picture On European Growth
Even within the euro area inflation data, there are mixed trends that make it less clear that a major tightening cycle is necessary. Headline euro area HICP inflation hit a 37-year high of 5.1% in January, which was heavily influenced by a 28.6% rise in the energy component of the index (Chart 10). Goods price inflation reached 6.8%, its highest level since 1991, fueled by global supply chain disruptions and greater consumer demand for goods versus services during the pandemic. For the latter, services inflation reached a much more subdued 2.4% in January, in line with core HICP inflation of 2.3%. We expect goods price inflation to slow substantially, on a global basis and not just in Europe, as supply chain disruptions ease over the course of 2022 and consumers shift spending back towards services from durable goods as economies reopen post-Omicron. Chart 9A Gloomy Picture For European Exports
A Gloomy Picture For European Exports
A Gloomy Picture For European Exports
Chart 10European Inflation Surge Focused On Energy & Goods
European Inflation Surge Focused On Energy & Goods
European Inflation Surge Focused On Energy & Goods
Surging oil and natural gas prices will keep the energy component elevated over the next few months, particularly if geopolitical tensions over Ukraine result in Russia withholding natural gas supplies to Europe. Yet it is not clear how much of this will pass through to core inflation, which actually decelerated in January from the 2.6% pace seen in December 2021 despite surging energy prices. What does a typical ECB liftoff look like? Should the ECB focus more on the headline or core inflation numbers when deciding if rate hikes are necessary later this year? The answer may lie more in the breadth across countries, rather than depth across sectors, of euro area inflation pressures. In the relatively short history of the ECB, dating back to the inception of the euro in 1998, there have been only three monetary tightening episodes that involved interest rate increases: 1999-00, 2006-08 and 2011. In Chart 11, we show the percentage share of individual euro area countries that have accelerating growth momentum (measured as a leading economic indicator above the level of a year earlier), and with headline/core inflation above the ECB’s 2% target. In all three of those past ECB tightening episodes, essentially all euro area countries had to see strong growth or inflation at or above the ECB target before the ECB would hike rates. Chart 11The Growth & Inflation Conditions For An ECB Rate Hike Are In Place
The Growth & Inflation Conditions For An ECB Rate Hike Are In Place
The Growth & Inflation Conditions For An ECB Rate Hike Are In Place
Chart 12Watch European Wages To Determine The ECB's Next Move(s)
Watch European Wages To Determine The ECB's Next Move(s)
Watch European Wages To Determine The ECB's Next Move(s)
A similar story can be told looking at the state of the euro area labor market. The 1999-00 and 2006-08 tightening cycles occurred when nearly all euro area countries had an unemployment rate below the OECD’s estimate of the full employment NAIRU (Chart 12). Only in 2011, which was widely regarded as a major policy error, did the ECB hike rates without widespread labor market strength across the euro area. Right now, the breadth of the growth and inflation data across the euro area would indicate that the ECB will soon begin to tighten policy, if history is any guide. The one missing piece of the puzzle is faster wage growth. Euro area wage growth is severely lagging compared to other developed economies. For the last known data point in Q3/2021, wages were only growing at a 1.5% year-over-year rate. Wage growth has very likely accelerated since then, with the overall euro area unemployment rate now down to an all-time low of 7.0%, well below the OECD NAIRU estimate of 7.7%. The ECB will need to see confirmation of that faster wage growth in the data, however, before embarking on a path of rate hikes. Since last week’s ECB meeting, numerous ECB officials – including President Lagarde - have stated that asset purchases must stop before rate hikes can begin. While the ECB’s pandemic emergency bond buying program is set to end next month, the existing Asset Purchase Program is set to continue with no expiry date. If the ECB officials are to be taken at their word, it is very difficult to imagine a scenario where asset purchases would be fully wound down (i.e. net purchases of zero, with buying only to replace maturing bonds held by the ECB) before the July liftoff date now priced into the Euro OIS curve. Such a rapid removal of the ECB bid would be very disruptive to the riskier parts of European fixed income markets, like Italian and Greek sovereign debt, that have benefited from heavy ECB buying under the pandemic bond buying program. European bond strategy implications While an ECB rate hike in 2022 is now a more probable scenario, it is not yet a done deal. The European growth picture remains mixed, and inflation readings outside of supply-constrained energy and durable goods – including wages - are far less threatening than headline inflation. At the moment, underlying inflation pressures are far more intense in the US. Durable goods inflation in the US reached 16.8% on a year-over-year basis last month, but climbed to “only” 3.8% in Europe (Chart 13). The Cleveland Fed’s trimmed mean CPI index accelerated to 4.8% in January, compared to 3.0% for the euro area trimmed mean CPI inflation gauge constructed by our colleagues at BCA Research European Investment Strategy. Chart 13Stay Positioned For A Wider UST-Bund Spread
Stay Positioned For A Wider UST-Bund Spread
Stay Positioned For A Wider UST-Bund Spread
The Fed has a lot more work ahead of it in terms of tightening monetary policy to rein in inflation pressures (and inflation expectations) than the ECB. This will lead to a faster pace of rate hikes in the US than in Europe and renewed widening of the US Treasury-German Bund yield spread. Financial conditions in Europe will also play a role in limiting when, and how much, the ECB can eventually tighten monetary policy. Yields and spreads on the riskier parts of the European fixed income markets like Italian government bonds have already widened substantially in response to the more hawkish guidance from the ECB (Chart 14). The euro has also stabilized after the steady depreciation seen since the May 2021 peak. Markets are obviously pricing in an end to ECB asset purchases – the precursor to rate hikes – which would force the private sector to absorb a greater share of Italian bond issuance than has been the case over the past few years. It will likely take higher yields to entice those buyers compared to the price-insensitive ECB that has been buying Italian debt as a monetary policy tool. The speed of the adjustment in Italian bond yields has no doubt alerted the ECB Governing Council to the financial stability risks of moving too fast on tightening monetary conditions. We must acknowledge that most the recent trends in the Treasury-Bund spread (narrower) and Italian bond yields/spreads (higher) go against our current strategic recommendations to overweight European fixed income. Markets have moved to price in a far more aggressive move from the ECB than we had envisioned for 2022. However, as highlighted above, it is not clear that the ECB needs to dial back monetary accommodation as rapidly as markets now expect. Thus, we are sticking with our strategic recommendations to overweight euro area government bonds, both in the core and periphery, in global bond portfolios. At the same time, we continue to recommend a below-benchmark duration stance within dedicated European portfolios, even with the 10-year German Bund yield having already reached our end-2022 yield target of 0.25% (Chart 15). European bond yields will remain under upward pressure until euro area inflation finally peaks and the ECB will be under less pressure to tighten. Chart 14ECB Facing An "Italy-vs-Inflation" Tradeoff
ECB Facing An "Italy-vs-Inflation" Tradeoff
ECB Facing An "Italy-vs-Inflation" Tradeoff
Chart 15Too Much, Too Soon Priced Into Bund Yields
Too Much, Too Soon Priced Into Bund Yields
Too Much, Too Soon Priced Into Bund Yields
Bottom Line: Markets are overestimating how quickly the ECB can begin to tighten European monetary policy. An initial rate hike can occur in Q4 of this year, at the earliest, which is later than the current mid-summer liftoff date discounted in interest rate forwards. Ride out the current European rates volatility and stay overweight European government debt versus the US. UK Update: The BoE Wants To Tighten Fast At last week's policy meeting, the BoE Monetary Policy Committee (MPC) voted 5-4 to raise Bank Rate by 25bps to 0.5%. That close vote is less dovish than it appears, though, as the four “dissenting” MPC members wanted to raise rates by 50bps instead! This was a hawkish surprise that resulted in bearish flattening of the UK Gilt yield curve. Chart 16UK Gilts: Volatile, But Underperforming
UK Gilts: Volatile, But Underperforming
UK Gilts: Volatile, But Underperforming
We have maintained a below-benchmark strategic recommendation on Gilts since August of last year. The relative performance of Gilts versus the Bloomberg Global Treasury benchmark index has seen tremendous volatility since then, particular after the BoE delayed the expected initial rate hike last November (Chart 16) Gilts began to underperform again after the BoE hiked in December and have continued to be one of the worst performing G10 bond markets, validating our bearish call. After last week’s BoE hike, we still see value in betting on additional Gilt underperformance, as markets may still be underestimating how high the BoE will have to raise rates in the current tightening cycle. In the new set of economic projections from the BoE’s Monetary Policy Report published last week, the central bank raised its expectation for the April peak in UK inflation to 7.25% (Chart 17). This compares to the latest inflation rate of 5.4%. Higher energy and goods prices account for three-quarters of that expected inflation increase, according to the BoE. UK inflation is projected to fall rapidly from that April peak, in response to an expected deceleration of energy and goods prices and slower UK economic growth. However, the Monetary Policy Report also highlighted that domestic UK cost pressures are intensifying in response to a very tight UK labor market. The BoE’s Agents’ survey of UK businesses reported that UK firms continue to have difficulty filling job openings, while also having success in passing on rising labor costs into selling prices. Thus, the UK labor market is now the critical variable to watch to determine how many more rate hikes the BoE will need to deliver in the current cycle. On that note, the BoE expects UK wage growth to accelerate to just under 5% over the next year, which is well above the central bank’s estimate of “underlying” pre-pandemic wage growth around 3.5%. Inflation expectations in the UK remain elevated. The YouGov/Citigroup survey shows that UK consumers expect inflation to be 4.8% on year from now and 3.8% 5-10 years ahead (Chart 18, top panel). Market-based inflation expectations have been more volatile of late but CPI swaps are pricing in inflation of 5.0% in two years and 4.2% in ten years.1 Thus, by any measure – realized inflation, expected inflation or wage growth – UK inflation is too high, which justifies tighter monetary policy. The UK OIS curve now discounts a peak in Bank Rate of 1.85% in April 2023, but this is immediately followed by rate cuts that take Bank Rate to 1.5% by the end of 2024. That path over the next year is a bit more hawkish than the results from the BoE’s new Market Participants Survey of bond investors, which showed an expected peak in Bank Rate of 1.5% sometime in the latter half of 2023. In both cases, Bank Rate is expected to settle below the BoE’s 2% inflation target, or below current inflation expectations. Suggesting an implied belief that the BoE will not be able to raise real interest rates into positive territory. In terms of forward guidance, several BoE officials have noted that they expect that only a few more hikes will be needed to help bring UK inflation back down to the 2% target. Yet the OIS curve is pricing in a “policy error” scenario where the BoE pushes up rates too rapidly and is then forced to cut rates soon afterward. We see both the BoE guidance and the OIS pricing as far too cautious on the eventual peak in Bank Rate, which leads us to maintain our underweight recommendation on UK Gilt exposure, both in terms of duration and country allocation in global bond portfolios. Chart 17BoE Sees A Short, Sharp Shock From Inflation & Rates
BoE Sees A Short, Sharp Shock From Inflation & Rates
BoE Sees A Short, Sharp Shock From Inflation & Rates
We have also been recommending a Gilt curve steepening trade in our Tactical Overlay portfolio on page 20 since last October. This trade went long a 10-year Gilt bullet versus a barbell combination of a 7-year and 30-year Gilt. Chart 18Stay Underweight UK Gilts
Stay Underweight UK Gilts
Stay Underweight UK Gilts
Our view at the time of trade inception was that a Gilt steepener would benefit from a scenario where the market would be forced to reassess how high rates would go in the next BoE tightening cycle. However, the BoE now appears to be “front loading” the tightening cycle by moving rates sooner and more aggressively, as evidenced by the near 50bp rate hike last week, while also moving to an accelerated runoff of bonds accumulated during quantitative easing operations. The Gilt yield curve has flattened considerably in response to increasing BoE hawkishness, with the yield spread between the 10-year and 2-yield Gilt now down to a mere +17bps. While we still see the potential for the longer-end of the Gilt curve to rise in response to an eventual repricing of terminal rate expectations that appear too low, the BoE’s acceleration of its hiking timetable will make it difficult for the curve to bearishly steepen in the near term. Thus, we are closing out our tactical Gilt curve steepener at a small gain of +23bps. Robert Robis, CFA Chief Fixed Income Strategist rrobis@bcaresearch.com Footnotes 1 UK CPI swaps, and inflation breakevens on index-linked Gilts, reference the UK Retail Price Index (RPI) which typically runs higher than the UK Consumer Price Index (CPI). This imparts an upward bias to UK inflation expectations when compared to CPI swaps and breakevens in other countries. Currently, RPI inflation is running at 7.5% compared to CPI inflation of 5.4%. GFIS Model Bond Portfolio Recommended Positioning Active Duration Contribution: GFIS Recommended Portfolio Vs. Custom Performance Benchmark
Europe Joins The Global Bond Bear Market
Europe Joins The Global Bond Bear Market
The GFIS Recommended Portfolio Vs. The Custom Benchmark Index Cyclical Recommendations (6-18 Months)
Europe Joins The Global Bond Bear Market
Europe Joins The Global Bond Bear Market
Tactical Overlay Trades
Executive Summary Chinese Onshore Stock Prices And Earnings Are Set To Deteriorate
Chinese Onshore Stock Prices And Earnings Are Set To Deteriorate
Chinese Onshore Stock Prices And Earnings Are Set To Deteriorate
Macro fundamentals indicate that for the time being there is no basis to overweight Chinese onshore stocks (in both absolute terms and relative to global stocks) given the outlook for profit growth contraction in 1H22. We are reluctant to shift our stance on Chinese domestic stocks to overweight in the next 6 to 12 months due to the following non-trivial risks: a subdued recovery in China’s economic activity, a deceleration in fiscal impulse in 2H22, a re-focus on reducing carbon emissions, as well as higher US bond yields and tighter global liquidity conditions. Despite a sharp drop in January, valuations in Chinese onshore stocks are still neutral in absolute terms, and only slightly cheaper than global stocks. As such, Chinese onshore stocks offer little valuation buffer in the wake of any negative surprises. Bottom Line: We maintain our underweight stance on Chinese onshore stocks (in both absolute terms and relative to global equities) due to non-trivial risks in the coming year. Feature China’s stock markets was very weak in the first month of 2022. The domestic equity market tumbled by 8% in January, while the offshore market dropped by 3%. We discussed our view on Chinese investable stocks in last week’s report and recommended that investors go long on investable value stocks versus growth stocks. This week’s report focuses on the onshore market. While we expect the economy to stabilize by mid-year on the back of increased policy support, we are reluctant to move to a cyclical overweight in the next 6 to 12 months, in both absolute terms and relative to their global peers. Near-term challenges in economic fundamentals will continue to weigh on Chinese domestic stocks. Over a cyclical time frame, the main risks to a bullish view on Chinese stocks are fourfold: a potentially subdued economic recovery; a sharp deceleration in fiscal impulse in the second half of the year; a re-acceleration in de-carbonization efforts; as well as higher bonds yields in the US and tighter global financial conditions. Chinese onshore stocks are not as deeply discounted as their offshore peers and, therefore, are less able to counter any negative surprises. Macroeconomics Matter Chart 1Weak Economic Fundamentals Undermine Stock Performance
Weak Economic Fundamentals Undermine Stock Performance
Weak Economic Fundamentals Undermine Stock Performance
China’s economic fundamentals still drive corporate earnings and the country’s domestic stock performance, despite an escalation in monetary policy easing (Chart 1). Current macro fundamentals do not provide a legitimate support for investors to overweight Chinese stocks. The domestic stock market’s rocky start to 2022 underscores extremely fragile sentiment and heightened anxiety among investors. Credit growth bottomed in October last year but has not shown any signs of a strong rebound. Corporate demand for credit remains in the doldrums while turmoil in the housing market has disincentivized households from taking mortgages (Chart 2). The real economy, which in previous business cycles lagged credit growth by about six to nine months, has not responded to policy easing measures. Housing market indicators in January deteriorated further (Chart 3). Moreover, the nation’s counter-COVID measures have disrupted a recovery in the service sector and private consumption. Chart 2Demand For Loans Remains Weak
Demand For Loans Remains Weak
Demand For Loans Remains Weak
Chart 3Housing Sales Weakened Further In January
Housing Sales Weakened Further In January
Housing Sales Weakened Further In January
Chart 4Chinese Onshore Stock EPS Is Set To Deteriorate
Chinese Onshore Stock EPS Is Set To Deteriorate
Chinese Onshore Stock EPS Is Set To Deteriorate
The financial market is forward looking and macro policies have become more market friendly. However, Chart 4 suggests that China's onshore corporate profits are set to deteriorate in the coming six months or so, and investors will likely react negatively to any further weakness in China’s measures of economic activity. Bottom Line: At the moment, China’s domestic economic fundamentals do not support an overweight stance in Chinese stocks. Mindful Of Cyclical Risks Chinese authorities have prioritized stimulating growth through countercyclical measures in 2022. However, we are reluctant to move to a cyclical overweight stance because we see four significant risks to turning bullish towards Chinese stocks (in both absolute and relative terms) in the next 6 to 12 months. These scenarios not only threaten the performance of Chinese stocks relative to global equities but could also prevent Chinese stocks’ absolute performance from trending higher. A subdued recovery in China’s economic activity. When policymakers wait too long to decisively stimulate the economy, business and consumer sentiment as well as the economy can remain downbeat for a prolonged period. For example, in the 2014/15 business cycle, monetary policy started to ease in early 2015, but policymakers hesitated to back down from supply-side reforms. As a result, the economy did not bottom until Q1 2016. Business activity and the financial markets reached their lows only after the authorities opened the “flood irrigation” to the economy by massively stimulating the housing sector (Chart 5). Arguably China’s economy is in a better shape now than in 2014/15 and the ongoing economic slowdown is not the result of a four-year downtrend in industrial activity as was the case prior to 2015’s economic slump (Chart 6). The drop in the A-share market in January was nothing compared with the turmoil in the financial markets seven years ago. Chart 5Economic Activity Picked Up In Q1 2016 Following A Massive Stimulus
Economic Activity Picked Up In Q1 2016 Following A Massive Stimulus
Economic Activity Picked Up In Q1 2016 Following A Massive Stimulus
Chart 6China's Economy In General Is In A Better Shape Now Than In 2014/15...
China's Economy In General Is In A Better Shape Now Than In 2014/15...
China's Economy In General Is In A Better Shape Now Than In 2014/15...
On the other hand, the housing market, which is estimated to account for about 29% of China’s economy, is currently decelerating at the same pace as in 2014/15. Growth in home sales and new projects dropped to their 2015 lows, while real estate inventories are comparable to the 2015 highs (Chart 7). Furthermore, property developers and consumers are even more indebted than during the 2014/15 cycle (Chart 8). Chart 7...But Downward Momentum In Property Market Comparable To 2015
...But Downward Momentum In Property Market Comparable To 2015
...But Downward Momentum In Property Market Comparable To 2015
Chart 8Chinese Real Estate Developers And Households Are More Leveraged Now Than In 2015
Chinese Real Estate Developers And Households Are More Leveraged Now Than In 2015
Chinese Real Estate Developers And Households Are More Leveraged Now Than In 2015
Chart 9Policymakers Will Have To Allow Significant Re-leveraging To Revive The Housing Market
Policymakers Will Have To Allow Significant Re-leveraging To Revive The Housing Market
Policymakers Will Have To Allow Significant Re-leveraging To Revive The Housing Market
As noted in a previous report, unless regulators are willing to initiate more aggressive policy boosts as in 2015/16, the ongoing easing measures will not be sufficient to revive sentiment in the property market. Thus, the property market downtrend will likely extend through 2022 (Chart 9). The IMF recently revised its 2022 growth projection for China from 5.6% to 4.8%. It attributed the sharp downgrade to China’s protracted financial stress in the housing sector and pandemic-induced disruptions related to a zero-tolerance COVID-19 policy. A sub-5% economic expansion in 2022, although still an improvement from the 4.5% average annual rate in 2H21, is subdued and below China’s potential growth. Such a weak economic recovery will weigh on investor sentiment towards Chinese stocks in the coming year. A deceleration in fiscal impulse in 2H22. The impulse in fiscal stimulus - without any intervention - will fall sharply in the second half of the year. The Ministry Of Finance has approved a quota of RMB1.46 trillion in local government special purpose bonds (SPBs), which accounts for more than one-third of the yearly SPB quota, to be issued in Q1 this year. Chart 10Large Amount Of Local Government Debts Due In 2H22
Chinese Onshore Stocks: How Much Upside?
Chinese Onshore Stocks: How Much Upside?
However, the frontloading of SPBs also means that the fiscal impulse will slow significantly in 2H22. Our geopolitical strategists have noted that a total of RMB2.7 trillion worth of local government bonds (LGB) will reach maturity this year, with RMB2.2 trillion coming due after June 2022 (Chart 10). The number of maturing LGBs in 2H22 will be only slightly smaller than those in all of 2021; in 2021 42% of LGBs issued were re-financing bonds to pay off existing local government debts, undermining real fiscal support for the economy. Furthermore, authorities have not loosened their grip on implicit local government debts (Chart 11). These so-called shadow banking debts through local government financing vehicles (LGFVs) are an important source of funding for investments in infrastructure projects. If the central government does not reverse its efforts to curb hidden debts while explicit fiscal stimulus also wanes, then we will likely see a sharp deceleration in fiscal support in 2H22. Lastly, we think Chinese policymakers are still serious about preventing “flood irrigation” type of stimulus, and will not opt for it unless the economic slowdown is much sharper. In Q1 2019 stock prices jumped sharply, boosted by an above-expectation pace of local government SPB issuance and credit expansion. However, following the public spat between Premier Li Keqiang and the PBoC over whether the January 2019 credit spike represented “flood irrigation-style” stimulus, policymakers quickly scaled back credit expansion in Q2 and onshore stock prices ended the year 5% lower than in Q1 (Chart 12). Chart 11Authorities Have Kept Tight Grip On Shadow Banking Activity
Authorities Have Kept Tight Grip On Shadow Banking Activity
Authorities Have Kept Tight Grip On Shadow Banking Activity
Chart 12Policymakers Scaled Back Stimulus And Took The Wind Out Of Onshore Stocks In 2019
Policymakers Scaled Back Stimulus And Took The Wind Out Of Onshore Stocks In 2019
Policymakers Scaled Back Stimulus And Took The Wind Out Of Onshore Stocks In 2019
Carbon emission reduction targets are still viable. In the current 14th Five-Year Plan (2021-2025), the cumulative targets reduction in energy consumption intensity is 13.5%.1 Last year’s energy crisis slowed the de-carbonization process and energy consumption intensity fell by 2.7% in 2021, missing the official annual target of 3%. To meet the de-carbonization target by 2025, energy consumption intensity will have to be lowered by at least 2.7% per year in the next four years. If energy- and carbon-intensive infrastructure activity picks up sharply in 1H22, then policymakers will have to renew their vigilance to constrain carbon-intensive activities later this year. The de-carbonization target has become a key parameter for assessing the performance of local governments, and meeting de-carbonization targets is particularly important given the rotation of local officials will be completed in late 2022. Furthermore, the initiative to reduce energy intensity reflects China’s commitment to move to a green economy. Given the important political events in both China and the US in the fall of 2022, meeting the annual de-carbonization target will be an important projection of China’s international image and will likely play a role in US-China negotiations. Chart 13Prior To The Pandemic, Chinese Stocks Had Little Correlation With US Treasury Yields
Prior To The Pandemic, Chinese Stocks Had Little Correlation With US Treasury Yields
Prior To The Pandemic, Chinese Stocks Had Little Correlation With US Treasury Yields
Higher bond yields in the US and tighter global liquidity conditions. Historically, Chinese onshore stocks have exhibited a loose cyclical correlation with US government bond yields (Chart 13). Nonetheless, if US bond yields rise more than global investors expect and to a level that is economically restrictive, then capital expenditures and household consumption in the US will weaken. This, in turn, will weigh down global trade and Chinese exports of manufactured goods. Against the backdrop of escalating US bond yields, Chinese onshore stocks may passively outperform their US counterparts because China’s A-share market is heavily weighted in value stocks. However, A-share prices in absolute terms will not be immune to heightened volatility in the global financial markets. The risk-off sentiment across global bourses will discourage portfolio flows into emerging economies including China. On a monthly basis, foreign portfolio net inflows account for less than 1% of the onshore equity market trading volume, but in recent years foreign portfolio inflows have increasingly influenced China’s onshore market sentiment and prices (Chart 14). China’s domestic household savings will not provide much support to stock prices this year. Chinese households have increasingly invested in the domestic equity market in the past few years, given that the authorities have been vigilant in containing price inflation in the property market.2 While we think Chinese consumers will continue rotating investment from property to financial market, household savings growth has fallen sharply since mid-2021, which means there have been less available funds to invest in the stock market (Chart 15). Chart 15Chinese Households' Quickly Diminishing Dry Powder
Chinese Households' Quickly Diminishing Dry Powder
Chinese Households' Quickly Diminishing Dry Powder
Chart 14Foreign Investors Have Become More Influential In The Chinese Onshore Market
Foreign Investors Have Become More Influential In The Chinese Onshore Market
Foreign Investors Have Become More Influential In The Chinese Onshore Market
Bottom Line: For the time being, the significant risks described above make us reluctant to turn bullish on Chinese stocks in both absolute and relative terms. Investment Conclusions There are few upsides related to Chinese onshore stocks in the next 6 to 12 months. However, there are two risks to our underweight stance on Chinese onshore stocks: First, we cannot rule out the possibility that Chinese policymakers will go “all in” for economic stability and allow a significant credit overshoot. In this scenario, a strong pickup in credit growth will produce a rebound in profit growth and support share prices in absolute terms and relative to global equities. Secondly, recent gyrations in global financial markets, coupled with China’s sluggish domestic economy, have triggered shakeouts in the onshore equity markets. The pullback in stock prices has helped to shed some excesses in Chinese stock valuations. Chart 16In Very Optimistic Scenario Chinese Stocks Would Have Some Upside Potential Vs. Global
In Very Optimistic Scenario Chinese Stocks Would Have Some Upside Potential Vs. Global
In Very Optimistic Scenario Chinese Stocks Would Have Some Upside Potential Vs. Global
If the stimulus in the next 6 to 12 months returns Chinese corporate profit growth to their 2021 peaks, then Chinese stock prices (in absolute terms) will also approach or go back to their early-2021 highs. Chart 16 highlights that reverting to these levels would imply a return of about 10-15% for domestic stocks in both absolute and relative price terms. We think China’s potential to command a higher multiple than global stocks is capped, barring a major structural improvement in earnings growth. However, Chart 16 (bottom panel) shows that Chinese onshore stocks at their height early last year were still cheaper than their global counterparts. Therefore, in a scenario where Beijing does “whatever it takes” to stimulate its economy, we will have no strong reasons to argue against a return of domestic forward multiples and a strong earnings growth back to levels seen in early-2021. Jing Sima China Strategist jings@bcaresearch.com Footnotes 1 Energy consumption intensity refers to energy consumption per unit of GDP. 2 There was a sharp jump in demand in 2020 for investment products from households; mutual funds in China raised money at a record pace, bringing in over 2 trillion yuan ($308 billion), which is more than the total amount in the previous four years. Strategic Themes Cyclical Recommendations Tactical Recommendations
Executive Summary The European Central Bank (ECB) has engaged in a decisive pivot toward higher policy rates. Markets are pricing in a first interest-rate hike in July and three more increases thereafter in 2022. This is too much for one year. Limited domestic inflationary pressures, weakness in long-term inflation expectations, economic slack, and vulnerability in the periphery will limit the ECB to one hike in December. Nonetheless, the ECB will increase interest rates more than the market anticipates beyond 2022. The UK is setting up for a dangerous latter half of 2022. Too Much Now, Not Enough Later
Too Much Now, Not Enough Later
Too Much Now, Not Enough Later
Bottom Line: Bet on a steepening of the euro short-term rate (€STR) curve. Current pricing for 2022 is too aggressive; however, it is too timid beyond the yearend. European financials will be the prime beneficiary of this tilt. Feature On Thursday, February 3, ECB President Christine Lagarde announced a decidedly hawkish pivot at the ECB press conference. The Frankfurt-based institution, worried by higher-than-anticipated inflation, no longer excludes rate hikes for 2022. In a context in which the BoE is resolutely hiking rates and the Fed is ready to initiate a sustained tightening campaign, investors are pricing in a 10bp ECB rate hike as early as July 2022. They also foresee three additional increases by the end of the year. We agree that the ECB will start lifting the deposit rate this year; however, we expect the tightening to begin in December. Nonetheless, we expect the ECB to lift policy rates more aggressively than the €STR prices in subsequent years. European Inflation Is Different Chart 1Surprise!
Surprise!
Surprise!
The knee-jerk reaction of investors to price in a sudden, sustained campaign of ECB rate hikes this year similar to that of the Fed is natural in light of elevated Eurozone inflation and inflation surprises (Chart 1). However, we continue to view European inflation as distinct from US inflation. European inflation remains dominated by dynamics in the energy market. While headline inflation increased from 5% to 5.1% in January, the core Consumer Price Index (CPI) declined modestly to 2.3% from 2.6%. Crucially, the variance of headline CPI is still almost fully explained by the variance of its energy component (Chart 2, top panel). However, it is concerning that there is also evident pass-through from energy prices to core CPI taking place today (Chart 2, bottom panel). Naturally, natural gas prices play a particularly important role in this energy-driven inflation spike (Chart 3). Chart 2Energy Still Drives Inflation
Energy Still Drives Inflation
Energy Still Drives Inflation
Chart 3Natural Gas Remains Key
Natural Gas Remains Key
Natural Gas Remains Key
Imported inflation is another key driver of European inflation. Chart 4 highlights that there is a robust relationship between the level of headline Harmonized Index of Consumer Prices (HICP) across EU nations and their import prices. This confirms that a large proportion of the European inflationary outburst has taken root outside of the continent’s borders. Chart 4Imported Inflation?
The ECB Is Not the Fed—Not Yet
The ECB Is Not the Fed—Not Yet
Despite this energy-driven, imported inflation, domestic pressures are still much more muted than those in the US. VAT increases played an important role in pushing core CPI higher. Without this contribution, CPI excluding food and energy would be 50 bps lower (Chart 5). Meanwhile, rent inflation remains a modest 1.1%, which is significantly lower than that in the US (Chart 6, top panel), whereas used car CPI is not nearly as extreme as across the Atlantic (Chart 6, bottom panel). Chart 5Elevated Contribution From Taxes
Elevated Contribution From Taxes
Elevated Contribution From Taxes
Chart 6Comparatively Muted Domestic Inflation Drivers
Comparatively Muted Domestic Inflation Drivers
Comparatively Muted Domestic Inflation Drivers
Wage dynamics too are not yet as concerning in the Eurozone as they are in the US. Negotiated wages remain near a record low of 1.4%, and unit labor costs at 0.9% are still inconsistent with strong underlying inflationary pressures (Chart 7, top and second panel). The labor market is tightening and the Euro Area unemployment rate fell to a new low at 7%. However, the total hours worked have not yet reached their pre-pandemic levels (Chart 7, third panel), which suggests that it could take a few more months before the dislocation caused by the pandemic has been fully absorbed and wages become a risk. That being said, it is only a matter of time, as job vacancies are skyrocketing (Chart 7, bottom panel). Chart 8Plentiful Slack
Plentiful Slack
Plentiful Slack
Chart 7The Labor Market Will Heat Up... Later
The Labor Market Will Heat Up... Later
The Labor Market Will Heat Up... Later
The European output gap also limits a repetition of the wage-price spiral taking hold in the US. The OECD’s Weekly Tracker of GDP, a proxy for the overall Eurozone comprised of Germany, France, Italy, and Spain, reveals that, as of mid-January, aggregate output was still 4.9% below its pre-pandemic trend (Chart 8, top panel). Looking at the actual GDP of European countries individually, only France stands above its pre-pandemic trend, whereas Germany, Italy, and Spain still linger well below the average economic path that prevailed from 2012 to 2019 (Chart 8, bottom panels). Chart 9The Inflationary Role Of Bottlenecks
The Inflationary Role Of Bottlenecks
The Inflationary Role Of Bottlenecks
Bottlenecks have also played an important role in relation to higher inflation. Goods inflation is much more elevated than services inflation (Chart 9, top panel), and industrial companies rank the ability to procure equipment and materials as their most important production constraint (Chart 9, second panel). However, production bottlenecks are dissipating. A recent Ifo survey highlights that the proportion of retailers with procurement issues declined from 82% in December 2021 to 57% in January 2022. Moreover, the supplier deliveries indexes of the PMIs are improving across the world. In fact, our simple Supply Disruption Index has begun to rollover, which points toward an imminent end to the wave of inflation surprises (Chart 9, bottom panel). European inflation expectations bear the imprint of those more modest domestic inflationary pressures, which explains the comparatively more limited wage-price spiral on the continent. The inflation expectations of Eurozone households are rising, but they are still within the norm of the past 20 years. In the US, they are breaking out. Moreover, our Index of Common Inflation Expectations, designed to mimic the New York Fed’s measure, remains well contained and is tentatively rolling over (Chart 10). Collectively, these forces explain the radically different inflation profiles of the Euro Area and the US. On the western shore of the Atlantic, the two-year annualized rate of change of the core CPI has completely shattered its highs of the past 20 years, indicating that more than simple base-effects are contributing to inflation (Chart 11, top panel). Meanwhile, the two-year annualized rate of change of the European core CPI is higher than the past deflationary eight years, but it is still low compared to the rates that prevailed prior to the European sovereign debt crisis (Chart 11, bottom panel). Chart 10Inflation Expectations: Unlike The US
Inflation Expectations: Unlike The US
Inflation Expectations: Unlike The US
Chart 11Realized Inflation: Unlike The US
Realized Inflation: Unlike The US
Realized Inflation: Unlike The US
Chart 12The Coming CPI Peak?
The Coming CPI Peak?
The Coming CPI Peak?
Going forward, there remains a high likelihood that Eurozone inflation will soon peak. The impact of the German VAT increases will soon dissipate from the data, energy inflation will diminish as the annual rate of change of oil and natural gas prices peaks, and the growth in monetary aggregates has normalized sharply. Most importantly, in the absence of significant domestic inflationary pressures, the sharp decline in the ZEW Inflation Expectations components point toward a deceleration in headline HICP (Chart 12). Nonetheless, we cannot be too sanguine. The European output gap is likely to close this year and wages pressures will emerge before the end of 2022. As a result, inflation will not fall below 2% anytime soon. Moreover, as we wrote last week, any long-lasting crisis in Ukraine will prevent energy inflation from declining, and thus, there remains significant upside risk to our inflation view in the coming months. Bottom Line: European inflation remains dominated by energy prices and imported price pressures. For now, domestic inflation dynamics are still mild, which explains why Europe’s inflation profile is much shallower than that of the US. Moreover, the near-term picture suggests that the imported inflation will peak, giving a respite to the HICP. Nonetheless, toward the yearend, domestic inflationary forces will pick up as wages gain traction. ECB Pricing: Too Much And Too Little ECB President Christine Lagarde delivered a message that was loud and clear: The ECB is abandoning its ultra-dovish stance. Despite this policy pivot, investors are pricing in too many hikes this year, whereas we only expect one rate increase toward yearend. True, if energy prices spike anew, risks to this forecast will be skewed to the upside. Nonetheless, we are inclined to fade the number of rate hikes priced in for 2022 and bet for more hikes in 2023 and 2024 (Chart 13). Chart 13Too Much Now, Not Enough Later
Too Much Now, Not Enough Later
Too Much Now, Not Enough Later
Why does our base case only include one rate hike in December? First, we are considering the entirety of the inflation picture. As we argued above, inflationary dynamics in Europe are much tamer than those in the US, especially in terms of domestic inflation, which the ECB can influence. Moreover, the ECB is still reeling from its infamous 2011 policy mistake, which accentuated underlying deflationary pressures and caused the ECB to undershoot its mandate for eight years in a row (Chart 14). Inflation expectations also offer some leeway to the ECB. Predictions by professional forecasters continue to track below two percent for the medium term. Importantly, market-based inflation expectations remain consistent with a temporary inflation shock, and do not meet yet the ECB’s criteria of being above the 2% target durably. 10-year CPI swaps hover around 2%, driven by the jump in 2-year CPI swaps to 2.7%. Long-dated expectations approximated by the 5-year/5-year forward CPI swap remain below 2% and the inflation curve is its most inverted on record (Chart 15). Chart 15Inflation Swaps Don't Fit The ECB's Criteria
Inflation Swaps Don't Fit The ECB's Criteria
Inflation Swaps Don't Fit The ECB's Criteria
Chart 14The Legacy Of The 2011 Mistake
The Legacy Of The 2011 Mistake
The Legacy Of The 2011 Mistake
In the end, President Lagarde did mention in the press conference that inflation is finally moving toward its target after years of undershoot. In the context described above, it is likely that the ECB will continue to tolerate some higher inflation in the near term if it represses the deflationary mentality that had engulfed the Eurozone last decade and caused a progressive Japanification of the region. This is a small price to pay to exit at last the lower bound of interest rates on a durable basis. Second comes the sequencing of policy. President Lagarde reiterated the importance of the order of events. First, the ECB will have to bring asset purchases to a net zero before lifting rates. It has yet to curtail purchases. The March meeting will be of paramount importance, since it will feature the tapering schedule of the central bank. We continue to see a progressive pace of declining assets purchases that will likely end in September 2022. Moreover, the ECB will want to see how the European economy and markets will absorb the TLTRO cliff this June, when EUR1.3 trillion of facility expire. Chart 16The Italian Constraint
The Italian Constraint
The Italian Constraint
Third, the ECB remains hamstrung by financial dynamics in the periphery. On Thursday, as Bund yields rose 10 basis points, BTP yields rose 21 basis points, bringing the Italian-German spread to 150bps, its highest level since September 2020 (Chart 16). Simply put, the periphery remains fragile because Italy and Spain sport some of the most negative output gaps in the region. Waiting for a stronger position out of those countries would let the ECB increase rates further down the road, allowing for a cleaner exit from negative policy rates in Europe. While these factors continue to favor a cautious posture by the ECB in 2022 and, therefore, support our base view of only one 10bps hike in December to be flagged when net purchases end in September, they will evolve and allow for many more hikes in 2023 and 2024. We expect the following developments to unfold: The output gaps across the region will close this year, which will put the economy in a position of strength and generate stronger domestic inflationary pressures down the road. Salaries will begin to accelerate meaningfully by the summer. This force will accentuate domestic inflationary pressures in late 2022 and 2023, and will contribute to higher household inflation expectations. The periphery will grow increasingly stronger as the Next Generation EU (NGEU) disbursements accelerate in 2022 and 2023. These disbursements are primarily geared toward infrastructure/capex spending (Chart 17) and will therefore sport elevated fiscal multipliers. The resulting strength will provide more resilience to the periphery and limit the tightening of financial conditions caused by higher interest rates. Chart 17The NGEU Will Matter… A Lot
The ECB Is Not the Fed—Not Yet
The ECB Is Not the Fed—Not Yet
Chart 18Terminal Rates Are Too Low
Terminal Rates Are Too Low
Terminal Rates Are Too Low
In the longer term, we also believe that markets still understate the ability of the ECB to lift rates. The market-derived terminal rate proxy for Europe is in the vicinity of the levels recorded in the wake of the European sovereign debt crisis last decade (Chart 18). Fiscal policy is more generous, however, and thus domestic demand is stronger. As a corollary, the accelerator model implies that capex will be more robust than it was last decade. Finally, the European Union is not as politically divided as it once was, which creates a stronger block. Together, these developments suggest that the r-star or the neutral rate of interest in the Euro Area is higher than last decade. Bottom Line: The €STR curve is pricing in the potential path of the ECB this year too aggressively. The ECB is likely to start raising rates in December, not in July. Domestic inflation and inflation expectations remain too modest, while the periphery remains fragile. Moreover, the ECB will stick to the previously decided sequence that calls for an end to net asset purchases ahead of hikes. Beyond 2022, we expect the ECB to increase rates more than what is priced into the €STR curve. Investment Implications The first implication of our view is that the European yield curve is likely to steepen further in the coming year. This is true in absolute terms but also relative to the US. We remain long European steepeners relative to US ones. Second, we continue to favor European financials. European banks are a direct equity play on higher yields and on a steeper yield curve (Chart 19). Moreover, European financials have upside relative to their US competitors. They are cheap, and they will benefit from the relative steepening in the European yield curve (Chart 20). Additionally, European monetary conditions will remain easier this year than US ones, whereas European growth will continue to catch up to the US. Chart 20Roll Over XLF
Roll Over XLF
Roll Over XLF
Chart 19Banks Will Shine More
Banks Will Shine More
Banks Will Shine More
Chart 21A Bit More Stress
A Bit More Stress
A Bit More Stress
Third, the equity market correction might have a little more to run. In the near term, equities had become very oversold. This week’s bounce makes sense after the S&P 500’s RSI plunged below 30. However, hedge funds are not shorting the market as violently as they did in 2018, yet all the major global central banks (apart from the BoJ) are abandoning their pandemic-driven policy. As a result of the prospect of a global decline in liquidity, a retest of the 2018-lows in net exposure is likely as we approach the March Fed meeting, especially as credit spreads are still too low to cause a meaningful change in tone by the Fed (Chart 21). Thus, European stocks could experience another wave of selling in the coming weeks, especially when the risks surrounding Ukraine have yet to clear. Keep some protections in place. Finally, the euro has surged this week. With looming Ukrainian risk, the potential for a repricing downward of the near-term European policy rates and the risk of a last sell-off in equities, the euro could give up some of its recent gains and remain in a churning pattern, in place since December 2021. The uncertainty is therefore elevated for near-term traders. However, considering last week’s ECB pivot and the likelihood of an upward revision of the €STR curve for 2024 rates, long-term investors should use a pull back in the euro in the coming weeks to gain exposure to long EUR/USD. What About The BoE? Last week, the Bank of England increased rates by 25bps to 0.5%, which was a widely expected move. The BoE is naturally ahead of the ECB because inflation swaps stand at 4.3% and are even higher than those in the US. The BoE is forced to be more aggressive because inflation expectations are becoming unmoored, which raises the risk of a wage-price spiral north of the Channel. This is a legacy of years of higher inflation and of the labor-supply problems created by Brexit. Additionally, the UK is exiting Omicron lockdowns faster than the Euro Area, which accentuates its near-term economic strength. The UK is not, however, out of the woods. A perfect storm is brewing for the remainder of the year. Interest rates are set to rise sharply, energy price caps will disappear in two months, and the budget is anticipating a significant tightening in the coming quarters after taxes rise in April. This will hurt economic activity in the latter half of the year and will cause tensions in the domestic market. The tax hikes are not guaranteed and a reversal is still possible. PM Boris Johnson is currently embroiled in the so-called “Partygate” scandal and Rishi Sunak, Chancellor of the Exchequer, is seen as the most likely candidate within the Conservative Party to replace Johnson if he were to be pushed out of power by the 1922 Committee. As a colleague observed, it remains to be seen whether Sunak’s political ambitions will scuttle his fiscal rectitude. Nonetheless, the threats to UK small-cap stocks are increasing, warranting a cautious stance if the tax increases are not revoked in the coming weeks. Mathieu Savary, Chief European Strategist Mathieu@bcaresearch.com Tactical Recommendations Cyclical Recommendations Structural Recommendations Closed Trades
BCA Research is proud to announce a new feature to help clients get the most out of our research: an Executive Summary cover page on each of the BCA Research Reports. We created these summaries to help you quickly capture the main points of each report through an at-a-glance read of key insights, chart of the day, investment recommendations and a bottom line. For a deeper analysis, you may refer to the full BCA Research Report. Executive Summary China’s Property Bust To Dwarf Japan’s
China Geopolitical Outlook 2022
China Geopolitical Outlook 2022
China’s confluence of internal and external risks will continue to weigh on markets in 2022. Internally China’s property sector turmoil is one important indication of a challenging economic transition. The Xi administration will clinch another term but sociopolitical risks are underrated. Externally China faces economic and strategic pressure from the US and its allies. The US is distracted with other issues in 2022 but US-China confrontation will revive beyond that. China will strengthen relations with Russia and Iran, though it will not encourage belligerence. It needs their help to execute its Eurasian strategy to bypass US naval dominance and improve its supply security over the long run. China will ease monetary and fiscal policies in 2022 but it has no interest in a massive stimulus. Policy easing will be frontloaded in the first half of the year. Featured Trade: Strategically stay short the renminbi versus an equal-weighted basket of the dollar and the euro. Stay short TWD-USD as well. Recommendation INCEPTION Date Return SHORT TWD / USD 2020-06-11 0.5% SHORT CNY / EQUAL-WEIGHTED BASKET OF EURO AND USD 2021-06-21 -3.9% Bottom Line: Beijing is easing policy to secure the post-pandemic recovery, which is positive for global growth and cyclical financial assets. But structural headwinds will still weigh on Chinese assets in 2022. China’s Historic Confluence Of Risks Global investors continue to clash over China’s outlook. Ray Dalio, founder of Bridgewater Associates, recently praised China’s “Common Prosperity” plan and argued that the US and “a lot of other countries” need to launch similar campaigns of wealth redistribution. He warned about the US’s 2024 elections and dismissed accusations of human rights abuses by saying that China’s government is a “strict parent.”1 By contrast George Soros, founder of the Open Society Foundations, recently warned against investing in China’s autocratic government and troubled property market. He predicted that General Secretary Xi Jinping would fail to secure another ten years in power in the Communist Party’s upcoming political reshuffle.2 Geopolitics can bring perspective to the debate: China is experiencing a historic confluence of internal (political) and external (geopolitical) risk, unlike anything since its reform era began in 1979. At home it is struggling with the Covid-19 pandemic and a difficult economic transition that began with the Great Recession of 2008-09. Abroad it faces rising supply insecurity and an increase in strategic pressure from the United States and its allies. The implication is that the 2020s will be an even rockier decade than the 2010s. In the face of these risks the Chinese Communist Party is using the power of the state to increase support for the economy and then repress any other sources of instability. Strict “zero Covid” policies will be maintained for political reasons as much as public health reasons. Arbitrary punitive measures will put pressure on the business elite and foreigners. The geopolitical outlook is negative over the long run but it will not worsen dramatically in 2022 given America’s preoccupation with Russia, Iran, and midterm elections. Bottom Line: Global investor sentiment toward China will remain pessimistic for most of the year – but it will turn more optimistic toward foreign markets, especially emerging markets, that sell into China. China’s Internal Risks Chart 1China's Demographic Cliff
China's Demographic Cliff
China's Demographic Cliff
By the end of 2021, China accounted for 17.7% of global economic output and 12.1% of global imports. However, the secular slowdown in economic growth threatens to generate opposition to the single-party regime, forcing the Communist Party to seek a new base of political legitimacy. Most countries saw a drop in fertility rates in the third quarter of the twentieth century but China’s “one child policy” created a demographic cliff (Chart 1). At first this generated savings needed for national development. But now it leaves China with excess capacity and insufficient household demand. Across the region, falling fertility rates have led to falling potential growth and falling rates of inflation. Excess savings increased production relative to consumption and drove down the rate of interest. The shift toward debt monetization in the US and Japan, in the post-pandemic context, is now threatening this trend with a spike in inflation. China is also monetizing debt after a decade of deflationary fears. But it remains to be seen whether inflation is sustainable when fertility remains below the replacement rate over the long run, as is projected for China as well as its neighbors (Chart 2). China’s domestic situation is fundamentally deflationary as a result of chronic over-investment over the past 40 years. China’s gross fixed capital formation stands at 43% of GDP, well above the historic trend of other major countries for the past 30 years (Chart 3). Chart 2Will Inflation Decouple From Falling Fertility?
Will Inflation Decouple From Falling Fertility?
Will Inflation Decouple From Falling Fertility?
Chart 3Over-Investment Is Deflationary, Not Inflationary
China Geopolitical Outlook 2022
China Geopolitical Outlook 2022
Like other countries, China financed this buildup of fixed capital by means of debt, especially state-owned corporate debt. While building a vast infrastructure network and property sector, it also built a vast speculative bubble as investors lacked investment options outside of real estate. The growth in property prices has tracked the growth in private non-financial sector debt. The downside is that if property prices fall, debt holders will begin a long and painful process of deleveraging, just like Japan in the 1990s and 2000s. Japan only managed to reverse the drop in corporate investment in the 2010s via debt monetization (Chart 4). Chart 4Japan’s Property Bust Coincided With Debt Deleveraging
China Geopolitical Outlook 2022
China Geopolitical Outlook 2022
Chart 5China's Debt Growth Halts
China's Debt Growth Halts
China's Debt Growth Halts
Looking at the different measures of Chinese debt, it is likely that deleveraging has begun. Total debt, public and private, peaked and rolled over in 2020 at 290% of GDP. Corporate debt has peaked twice, in 2015 and again in 2020 at around 160% of GDP. Even households are taking on less debt, having gone on a binge over the past decade (Chart 5). In short China is following the Japanese and East Asian growth model: the stark drop in fertility and rise in savings created a huge manufacturing workshop and a highly valued property sector, albeit at the cost of enormous private and considerable public debt. If the private sector’s psychology continues to shift in favor of deleveraging, then the government will be forced to take on greater expenses and fund them through public borrowing to sustain aggregate demand, maximum employment, and social stability. The central bank will be forced to keep rates low to prevent interest rates from rising and stunting growth. China’s policymakers are stuck between a rock and a hard place. New regulations aimed at controlling the property bubble (the “three red lines”) precipitated distress across the sector, emblematized by the failure of the world’s most indebted property developer, Evergrande. Other property developers are looking to raise cash and stay solvent. Property prices peaked in 2015-16 and are now dropping, with third-tier cities on the verge of deflation (Chart 6). Chart 6China's Property Crisis Weighs On Construction
China's Property Crisis Weighs On Construction
China's Property Crisis Weighs On Construction
As the property bubble tops out, Chinese policymakers are looking for new sources of productivity and growth. Chart 7Productivity In Decline
China Geopolitical Outlook 2022
China Geopolitical Outlook 2022
Productivity growth is subsiding after the export and property boom earlier in the decade, in keeping with that of other Asian economies. And sporadic initiatives to improve governance, market pricing, science, and technology have not succeeded in lifting total factor productivity (Chart 7). The initial goal of the Xi administration’s reforms, to rebalance the economy away from manufacturing toward services, has stumbled and will continue to face headwinds from the financial and real estate sectors that powered much of the recent growth in services (Chart 8). Chart 8China’s Structural Transition Falters
China Geopolitical Outlook 2022
China Geopolitical Outlook 2022
Indeed the Communist Party is rediscovering the value of export-manufacturing in the wake of the pandemic, which led to a surge in durable goods orders as global consumers cut back on services and businesses initiated a new cycle of capital expenditures (Chart 9). The party encouraged the workforce to shift out of manufacturing over the past decade but is now rethinking that strategy in the face of the politically disruptive consequences of deindustrialization in the US and UK – such that the state can be expected to recommit to supporting manufacturing going forward (Chart 10). Policymakers are emphasizing economic self-sufficiency and “dual circulation” (import substitution) as solutions to the latent socioeconomic and political threat posed by disillusioned former manufacturing workers. Chart 9China Turns Back To Exports
China Turns Back To Exports
China Turns Back To Exports
Chart 10De-Industrialization Will Be Halted
De-Industrialization Will Be Halted
De-Industrialization Will Be Halted
Even beyond ex-manufacturing workers, the country’s economic transition risks generating social instability. The middle class, defined as those who consume from $10 to $50 per day in purchasing power parity terms, now stands at 55% of total population, comparable to where it stood when populist and anti-populist political transformations occurred in Turkey, Thailand, and Brazil (Chart 11). China’s middle class may not be willing or able to intervene into the political process, but the government is still concerned about the long-term potential for discontent. Otherwise it would not have launched anti-corruption, anti-pollution, and anti-industrial measures in recent years. These measures vary in effectiveness but they all share the intention to boost the government’s legitimacy through social improvements and thus fall in line with the new mantra of “common prosperity.” For decades the ruling party claimed that the “principle contradiction” in society arose from a failure to meet the people’s “material needs,” but beginning in 2021 it emphasized that the principle contradiction is the people’s need for a “better life.” Real wages continue to grow but the pace of growth has downshifted from previous decades. The bigger problem is the stark rise in inequality, here proxied by skyrocketing housing prices. Hong Kong’s inequality erupted into social unrest in recent years even though it has a much higher level of GDP per capita than mainland China (Chart 12). In major cities on the mainland, housing prices have outpaced disposable income over the past two decades. Youth unemployment also concerns the authorities. Chart 11Social Instability A Genuine Risk
China Geopolitical Outlook 2022
China Geopolitical Outlook 2022
Bottom Line: The Chinese regime faces historic social and political challenges as a result of a difficult structural economic transition. The ongoing emphasis on “common prosperity” reveals the regime’s fear of social instability. The underlying tendency is deflationary, though Beijing’s use of debt monetization introduces a long-term inflationary risk that should be monitored. Chart 12Causes Of Hong Kong Unrest Also Present In China
Causes Of Hong Kong Unrest Also Present In China
Causes Of Hong Kong Unrest Also Present In China
China’s External Risks Geopolitically speaking, China’s greatest challenge throughout history has been maintaining domestic stability. Because China is hemmed in by islands that superior foreign powers have often used as naval bases, it is isolated as if it is a landlocked state. A stark north-south division within its internal geography and society creates inherent political tension, while buffer regions are difficult to control. Hence foreign powers can meddle with internal affairs, undermine unity and territorial integrity, and exploit China’s large labor force and market. However, in the twenty-first century China has the potential to project power outward – as long as it can maintain internal stability. Power projection is increasingly necessary because China’s economy increasingly depends on imports of energy, leaving it vulnerable to western maritime powers (Chart 13). Beijing’s conversion of economic into military might has also created frictions with neighbors and aroused the antagonism of the United States, which increasingly seeks to maintain the strategic anchor in the western Pacific that it won in World War II. Chart 13Import Dependency A Strategic Security Threat
Import Dependency A Strategic Security Threat
Import Dependency A Strategic Security Threat
As China’s influence expands into East Asia and the rest of Asia, conflicts with the US and its allies are increasingly likely, especially over critical sea lines of communication, including the Taiwan Strait. China’s reinforcement of its manufacturing prowess will also provoke the United States, while the US’s erratic attempts to retain its strategic position in Asia Pacific will threaten to contain China. Yet the US cannot concentrate exclusively on countering China – it is distracted by internal politics and confrontations with Russia and Iran, especially in 2022. China will strengthen relations with Russia and Iran. As an energy importer, China would prefer that neither Russia nor Iran take belligerent actions that cause a global energy shock. But both Moscow and Tehran are essential to China’s Eurasian strategy of bypassing American naval dominance to reduce its supply insecurity. And yet, in 2022 specifically, the US and China are both concerned about maintaining positive domestic political dynamics due to the midterm elections and twentieth national party congress. This includes a desire to reduce inflation. Hence both would prefer diplomacy over trade war, with regard to each other, and over real war, with regard to Ukraine and Iran. So there is a temporary overlap in interests that will discourage immediate confrontation. China might offer limited cooperation on Iranian or North Korean nuclear and missile talks. But the same domestic political dynamics prevent a significant improvement in US-China relations, as neither side will grant trade concessions in 2022, and the underlying strategic tensions will revive over the medium and long run. Bottom Line: China faces historic external risks stemming from import dependency and conflict with the United States. In the short run, the US conflicts with Russia and Iran might lead to energy shocks that harm China’s economy. Japan never recovered its rapid growth rates after the 1973 Arab oil embargo. In the long run, while Washington has little interest in fighting a war with China, its strategic competition will focus on galvanizing allies to penalize China’s economy and to substitute away from China, in favor of India and ASEAN. China’s Macro Policy In 2022: Going “All In” For Stability In last year’s China Geopolitical Outlook, we maintained our underweight position on Chinese equities and warned that Beijing’s policy tightening posed a significant risk to global cyclical assets – and yet we concluded that policymakers would avoid overtightening policy to the extent of spoiling the global recovery. This view prevailed over the course of 2021. Policymakers tightened monetary and fiscal policy in the first half of the year, then started loosening up in the summer. Chinese equities crashed but global equities powered through the year. In December 2020, at the Central Economic Work Conference, policymakers stated that China would “maintain necessary policy support for economic recovery and avoid sharp turns in policy” in 2021. In the event they did the minimal necessary, though they did avoid sharp turns. For 2022, the key word is “stability.” At the Central Economic Work Conference last month, the final communique mentioned “stability” or “stabilize” 25 times (Table 1). Hence the main objective of Chinese policymakers this year is to prioritize both economic and social stability ahead of the twentieth national party congress. Authorities will avoid last year’s tight policies. Table 1Key Chinese Policy Guidance 2021-22
China Geopolitical Outlook 2022
China Geopolitical Outlook 2022
China’s quarterly GDP growth slipped to just 4% in Q4 2021, from rapid recovery growth of 18.3% in Q1 2021. Considering the low base effect of 2020, the average growth of 2020 and 2021 ranged from 5-5.5% (Chart 14). This growth rate is in line with the pre-pandemic trajectory of 2015-2019. In Jan 2022, the IMF cut China’s 2022 growth forecast to 4.8%, while the World Bank lowered its forecasts to 5.1%. Considering the two-year average growth and government’s goal of “all in for stability,” we see an implicit GDP target of 5-5.5%. Chart 14Breakdown Of China’s GDP Growth
China Geopolitical Outlook 2022
China Geopolitical Outlook 2022
Does this target matter? Although China stopped announcing explicit GDP growth targets, understanding the implicit target helps investors predict the turning point in macro policy. Due to robust global demand, net exports are now making a sizable contribution to GDP growth. However, due to the high base effect of 2021, there is limited room for exports to grow in 2022. Hence economic growth has to rely on final consumption expenditure and gross capital formation. Yet as a result of policy tightening, gross capital formation’s contribution to GDP has decreased significantly, from positive in H1 2021 to a rare negative contribution to GDP in the second half. At the same time, the contribution from final consumption expenditure also slipped over the course of 2021, due to worsening Covid conditions, one of the three pressures stated by the government. What does that mean? It means that loosening up macro policies is the pre-condition for stabilizing growth and the economy. Just like the officials said (see Table 1), the Chinese economy is “facing triple pressure from demand contraction, supply shocks, and weakening expectations,” so that “all sides need to take the initiative and launch policies conducive to economic stability.” Bottom Line: It is reasonable to expect accommodative fiscal and monetary policies in 2022, at least until the party congress ends. In fact, authorities have already started to make these adjustments since Q4 2021. China Avoids Monetary Overtightening Credit growth can be seen as an indicator for gross capital formation. In the second half of 2021, China’s total social financing (total private credit) growth plunged below 12% (Chart 15), the threshold we identified for determining whether authorities overtightened policy. Correspondingly, gross capital formation’s contribution to GDP dropped into the negative zone (see Chart 14 above). However, money growth did not dip below the threshold, and authorities are now trying to boost credit growth. Starting from December 2021, the market has seen marginally positive news out of the People’s Bank of China: December 15, 2021: The PBOC conducted its second reserve requirement ratio (RRR) cut in 2021. The 50 bps cut was expected to release $188 billion in liquidity to support the real economy. December 20, 2021: The PBOC conducted its first interest rate cut since April 2020 by cutting 1-Year LPR by 5 bps on December 20 (Chart 16). Chart 15China's Money And Credit Growth Hits Pain Threshold
China's Money And Credit Growth Hits Pain Threshold
China's Money And Credit Growth Hits Pain Threshold
Chart 16China Monetary Policy Easing
China Monetary Policy Easing
China Monetary Policy Easing
January 17, 2022: The PBOC cut the interest rate on medium-term lending facility (MLF) loans and 7-day reverse repurchase (repos) rate both by 10 bps. January 20, 2022: The PBOC further lowered the 1-year LPR by 10 basis points and cut the 5-year LPR by 5 basis points, the first cut since April 2020. Chart 17China Policy Easing Will Boost Import Volumes
China Policy Easing Will Boost Import Volumes
China Policy Easing Will Boost Import Volumes
The timing and size of the last two rate cuts came as a surprise to the market, signaling more comprehensive easing than was expected (confirming our expectations).3 The market saw a clear turning point: Chinese authorities are now fully aware of the need to loosen up monetary policy to counter intensifying downward pressure on the economy. Incidentally, the fine-tuning of the different lending facilities suggests the government aims to lower borrowing costs and stimulate the market without over-heating the property sector again. PBOC officials claim there is still some space for further cuts, though narrower now, when asked about if there is any room to further cut the RRR and interest rates in Q1. They added that the PBOC should “stay ahead of the market curve” and “not procrastinate.”4 Recent movements have validated this point. Going forward, M2 growth should stay above 8%. Total social financing growth should move up above our “too tight” threshold, although weak sentiment among private borrowers could force authorities to ease further to ensure that credit growth picks up. If the government is still committed to fighting housing speculation, as before, then we could see a smaller adjustment to the 5-Year LPR in the future. Otherwise the government is taking its foot off the brake for stability reasons, at least temporarily. Bottom Line: China will keep easing monetary policy in 2022, at least in the first half. This will result in an improvement in Chinese import volumes and ultimately emerging market corporate earnings, albeit with a six-to-12-month lag (Chart 17). China Avoids Fiscal Overtightening China will also avoid over-tightening fiscal policy in 2022. In December the government stressed the need to “maintain the intensity of fiscal spending, accelerate the pace, and moderately advance infrastructure investment.” In 2021, local government bond issuance did not pick up until the second half of the year. Considering the time lag of construction projects, it was too late for local government investment to stimulate the economy. By Q3 2021, local government bond issuance had just completed roughly 70% of the annual quota. By comparison, in 2018-2020, local governments all completed more than 95% of the annual quota by the end of September each year (Chart 18A). Chart 18AChina: No Pause In Local Bond Issuance In H1 2022
China Geopolitical Outlook 2022
China Geopolitical Outlook 2022
Chart 18BChina: No Pause In Local Bond Issuance In H1 2022
China Geopolitical Outlook 2022
China Geopolitical Outlook 2022
There are several reasons behind the slow pace last year. The central government refused to pre-approve and pre-authorize the quota for bond issuance at the beginning of the year in 2021, in order to restore discipline after the massive 2020 stimulus measures. The quota was not released until after the Two Sessions in March, which means local government bond issuance did not pick up until April 2021, causing a 3-month vacuum in local government fiscal support (see Chart 18B). In contrast, for 2019 and 2020, the central government pre-authorized the bond issuance quota ahead of time to try to provide fiscal support evenly throughout the year. Starting from 2020, the central government strengthened supervision and evaluation of local government investment projects, again to instill discipline. Previously local governments could easily issue general-purpose bonds and the funds were theirs to spend. But now local governments are required to increase the transparency of their investment projects and mainly finance these projects via special-purpose bonds, i.e. targeted money for authorized projects (Table 2). In 2021 local governments were less willing to issue bonds. At the April 2021 Politburo meeting, the central government vowed to “establish a disposal mechanism that will hold local government officials accountable for fiscal and financial risks.” This triggered risk-aversion. Beijing wanted to prevent a growth “splurge” in the wake of its emergency stimulus, like what happened in 2008-11. The fiscal turning point came in the second half of the year. The central government called for accelerating local government bond issuance several times from July to October. The pace significantly picked up in the second half of 2021 and Q4 accounted for a significant portion of annual issuance (Chart 18). As a result, fixed asset investment and fiscal impulse should pick up in Q1 2022. Thus, unlike last year, authorities are trying to avoid a sharp drop in the fiscal impulse. The Ministry of Finance has already frontloaded 1.46 trillion yuan ($229 billion) from the 2022 special purpose bonds quota. This amount is part of the 2022 annual local government bond issuance quota, with the rest to be released at the Two Sessions in March. Pulling these funds forward indicates the rising pressure to stabilize economic growth in Q1 this year. That being said, investors should differentiate easing up fiscal policy and “flood-like” stimulus in the past. The government still claims it will “contain increases in implicit local government debts.” In fact, pilot programs to clean up implicit debts have already started in Shanghai and Guangdong. This means, China will not reverse past efforts on curbing hidden debts. Hence fiscal support will be more tightly controlled in future, like water taps in the hands of the central government. The risk of fiscal tightening is backloaded in 2022. The tremendous amount of local government bonds issued in Q4 2021 will start to kick in early 2022. These will combine with the frontloaded special purposed bonds. Fiscal impulse should tick up in Q1. However, fiscal impulse might decelerate in the second half. A total of $2.7 trillion yuan worth of local government bonds will reach maturity this year, with $2.2 trillion yuan reaching maturity after June 2022 (Table 3). This means that in the second half, local governments will need to issue more re-financing bonds to prevent insolvency risk, thus undermining fiscal support for the economy. And this last point underscores the threat of economic and financial instability that China faces over the long run. Table 2Breakdown Of China Local Government Bond Issuance
China Geopolitical Outlook 2022
China Geopolitical Outlook 2022
Bottom Line: Stability is the top priority in 2022. China will continue to easy up monetary and fiscal policy in H1, to combat the economic downward pressure ahead of the twentieth national party congress (Chart 19). Policy tightening risk is backloaded. Structural reforms will likely subside for now until the Xi administration re-consolidates power for the next ten years. Table 3China: Local Government Debt Maturity Schedule
China Geopolitical Outlook 2022
China Geopolitical Outlook 2022
Chart 19Policy Support Expected For 20th Party Congress
Policy Support Expected For 20th Party Congress
Policy Support Expected For 20th Party Congress
Note: An error in an earlier version of this report has been corrected. Chinese fixed asset investment in Chart 19 is growing at 0.1%, not 57.6% as originally shown. The chart has been adjusted. Matt Gertken Chief Geopolitical Strategist mattg@bcaresearch.com Yushu Ma Research Associate yushu.ma@bcaresearch.com Footnotes 1 See Bei Hu and Bloomberg, “Ray Dalio thinks the U.S. needs more of China’s common prosperity drive to create a ‘fairer system,’” Fortune, January 10, 2022, fortune.com. 2 See George Soros, “China’s Challenges,” Project Syndicate, January 31, 2022, project-syndicate.org. 3 The 5-year LPR had remained unchanged after the December 2021 cut. At that time, only the 1-Year LPR was cut by 5bps. Furthermore, the different magnitudes of the January 20 LPR cut also have some implications. The 1-Year LPR mostly affects new and outstanding loans, short-term liquidity loans of firms, and consumer loans of households. In comparison, the 5-Year LPR has a larger impact, affecting the borrowing costs of total social financing, including mortgage loans, medium- to long-term investment loans, etc. The MLF rate was cut by 10 basis points on January 17; in theory the LPR should also be cut by the same size. However, the 5-Year LPR adjustments was very cautious and was only cut by 5 bps, smaller than the MLF cut and the 1-Year LPR cut. The 5-year LPR serves as the benchmark lending rate for mortgage loans. 4 To combat the negative shock caused by the initial outburst of COVID-19, altogether China lowered the MLF and 1-year LPR by 30 bps and 5-year LPR by 15 bps in H1 2020. This also suggests that there is still room for future interest rate cuts or RRR cuts in the coming months. Strategic Themes Open Tactical Positions (0-6 Months) Open Cyclical Recommendations (6-18 Months)
BCA Research is proud to announce a new feature to help clients get the most out of our research: an Executive Summary cover page on each of the BCA Research Reports. We created these summaries to help you quickly capture the main points of each report through an at-a-glance read of key insights, chart of the day, investment recommendations and a bottom line. For a deeper analysis, you may refer to the full BCA Research Report. Executive Summary The golden rule for investing in the stock market simply states: “Stay bullish on stocks unless you have good reason to think that a recession is imminent.” The catch, of course, is that it is difficult to know whether a recession is lurking around the corner. Still, we can learn a lot from past recessions. As we document in this week’s report, every major downturn was caused by the buildup of imbalances within the economy, which were then laid bare by some sort of catalyst, usually monetary tightening. Today, the US is neither suffering from an overhang of capital spending, as it did in the lead-up to the 2001 recession, nor an overhang of housing, as it did in the lead-up to the Great Recession. US inflation has risen, but unlike in the early 1980s, long-term inflation expectations remain well anchored. This gives the Fed scope to tighten monetary policy in a gradual manner. Outside the US, vulnerabilities are more pronounced, especially in China where the property market is weakening, and debt levels stand at exceptionally high levels. Fortunately, the Chinese government has enough tools to keep the economy afloat, at least for the time being. Equity Bear Markets And Recessions Go Hand In Hand
Equity Bear Markets And Recessions Go Hand In Hand
Equity Bear Markets And Recessions Go Hand In Hand
Bottom Line: Equity bear markets rarely occur outside of recessions. With global growth set to remain above trend at least for the next 12 months, investors should continue to overweight equities. However, they should underweight the tech sector since tech stocks remain disproportionately vulnerable to rising rates, increased regulation, and a retrenchment in pandemic-induced spending on electronics and online services. Macro Matters Investors tend to underestimate the importance of macroeconomics for stock market outcomes. That is a pity. Charts 1, 2, and 3 show that the business cycle drives the evolution of corporate earnings; corporate earnings, in turn, drive the stock market; and as a result, the business cycle determines the path for stock prices. Chart 1The Business Cycle Drives Earnings…
The Business Cycle Drives Earnings...
The Business Cycle Drives Earnings...
Chart 2…Earnings In Turn Drive Stock Prices…
...Earnings In Turn Drive Stock Prices...
...Earnings In Turn Drive Stock Prices...
An appreciation of macro forces leads to our golden rule for investing in the stock market. It simply states: Stay bullish on stocks unless you have good reason to think that a recession is imminent. Chart 3…Hence, The Business Cycle Is The Main Driver Of Equity Returns
...Hence, The Business Cycle Is The Main Driver Of Equity Returns
...Hence, The Business Cycle Is The Main Driver Of Equity Returns
Historically, stocks have peaked about six months before the onset of a recession. Thus, it usually does not pay to turn bearish on stocks if you expect the economy to grow for at least another 12 months. In fact, aside from the brief but violent 1987 stock market crash, during the past 50 years, the S&P 500 has never fallen by more than 20% outside of a recessionary environment (Chart 4). Peering Around The Corner The catch, of course, is that it is difficult to know whether a recession is lurking around the corner. Leo Tolstoy began his novel Anna Karenina with the words “Happy families are all alike; every unhappy family is unhappy in its own way.” By the same token, every economic boom seems the same, whereas every recession has its own unique features. This makes forecasting recessions difficult. Difficult, but not impossible. Even though recessions differ substantially in their magnitude and causes, they all share the following three characteristics: 1) The buildup of imbalances that make the economy vulnerable to a downturn; 2) A catalyst that exposes these imbalances; and 3) Amplifiers or dampeners that either exacerbate or mitigate the slump. Let us review six past recessions to better understand what these three characteristics reveal about the current state of the global economy. Chart 4Equity Bear Markets And Recessions Go Hand In Hand
Equity Bear Markets And Recessions Go Hand In Hand
Equity Bear Markets And Recessions Go Hand In Hand
The 1980 And 1982 Recessions The double-dip recessions of 1980 and 1982 were the last in which inflation played a starring role. Throughout the 1970s, the Fed consistently overstated the degree of slack in the economy (Chart 5). This led to a prolonged period in which interest rates stayed below their equilibrium level. The resulting upward pressure on inflation from an overheated economy was compounded by a series of oil shocks, the last of which occurred in 1979 following the Iranian revolution. Chart 6The Volcker Era: It Took Massive Monetary Tightening To Bring Down Inflation
The Volcker Era: It Took Massive Monetary Tightening To Bring Down Inflation
The Volcker Era: It Took Massive Monetary Tightening To Bring Down Inflation
Chart 5The Fed Continuously Overstated The Magnitude Of Economic Slack In The 1970s
The Fed Continuously Overstated The Magnitude Of Economic Slack In The 1970s
The Fed Continuously Overstated The Magnitude Of Economic Slack In The 1970s
In an effort to break the back of inflation, newly appointed Fed chair Paul Volcker raised rates, first to 17% in April 1980, and then following a brief interlude in which the effective fed funds rate dropped back to 9%, to a peak of 19% in July 1981 (Chart 6). The 1990-91 Recession Overheating also contributed to the early 1990s recession. After reaching a high of 10.8% in 1982, the unemployment rate fell to 5% in 1989, about one percentage point below its equilibrium level at that time. Core inflation began to accelerate, reaching 5.5% by August 1990. The Fed initially responded to the overheating economy by hiking interest rates. The fed funds rate rose from 6.6% in March 1988 to a high of 9.8% by May 1989. By the summer of 1990, the economy had already slowed significantly. Commercial real estate, still reeling from the effects of the Savings and Loan crisis, weakened sharply. Defense outlays continued to contract following the collapse of the Soviet Union. The final straw was Saddam Hussein’s invasion of Kuwait, which caused oil prices to surge and consumer confidence to plunge (Chart 7). The 2001 Recession An overhang of IT equipment sowed the seeds of the 2001 recession. Spending on telecommunications equipment rose almost three-fold over the course of the 1990s, which helped lift overall nonresidential capital spending from 11.2% of GDP in 1992 to 14.7% in 2000 (Chart 8). Chart 7Overheating In The Leadup To The 1990-91 Recession
Overheating In The Leadup To The 1990-91 Recession
Overheating In The Leadup To The 1990-91 Recession
The recession itself was fairly mild. After subsequent revisions to the data, growth turned negative for just one quarter, in Q3 of 2001. However, due to the lopsided influence of the tech sector in aggregate profits – and even more so, in market capitalization – the dotcom bust had a major impact on equity prices (Chart 9). Chart 9The Dotcom Bust Dragged Down Tech Earnings
The Dotcom Bust Dragged Down Tech Earnings
The Dotcom Bust Dragged Down Tech Earnings
Chart 8A Glut Of I.T. Equipment Sowed The Seeds Of The 2001 Recession
A Glut Of I.T. Equipment Sowed The Seeds Of The 2001 Recession
A Glut Of I.T. Equipment Sowed The Seeds Of The 2001 Recession
Having raised rates to 6.5% in May 2000, the Fed responded to the downturn by easing monetary policy. Falling rates were effective in reviving the economy – indeed, perhaps too effective. The resulting housing boom paved the way for the Great Recession. The Great Recession (2007-2009) The housing sector was the source of imbalances in the lead-up to the Great Recession. In the US, and in other countries such as Spain and Ireland, house prices soared as lenders doled out credit on increasingly lenient terms. Chart 10A Long House Party
A Long House Party
A Long House Party
Rising house prices stoked a consumption boom and incentivized developers to build more homes. In the US, the personal savings rate fell to historic lows. Residential investment reached a high of 6.7% of GDP, up from an average of 4.3% of GDP in the 1990s (Chart 10). While the housing bubble would have burst at some point anyway, tighter monetary policy helped expedite the downturn. Starting in June 2004, the Fed raised rates 17 times, pushing the fed funds rate to 5.25% by June 2006. The ECB also hiked rates; it raised the refi rate from 2% in December 2005 to 4.25% in July 2008, continuing to tighten policy even after the Fed had begun to cut rates. Once global growth started to weaken, a number of accelerants kicked in. As is the case in every recession, rising unemployment led to less spending, which in turn led to even higher unemployment. To make matters worse, a vicious circle engulfed the housing market. Falling home prices eroded the collateral underlying mortgage loans, producing more defaults, tighter lending standards, and even lower home prices. The Fed responded to the crisis by cutting rates and introducing an alphabet soup of programs to support the financial system. However, the zero lower-bound constraint limited the degree to which the Fed could cut rates, forcing it to resort to unorthodox measures such as quantitative easing. While these measures arguably helped, they fell short of what was needed to resuscitate the economy. Fiscal policy could have picked up the slack, but political considerations limited the scale and scope of the 2009 Recovery Act. The result was a needlessly long and drawn-out recovery. The Euro Crisis (2012) Chart 11The State Is Here To Mop Up The Mess
The State Is Here To Mop Up The Mess
The State Is Here To Mop Up The Mess
A reoccurring theme in economic history is that financial crises often force governments to assume private-sector liabilities in order to avoid a full-scale economic collapse. Unlike Greece, where government debt stood at very high levels even before the GFC, debt levels in Spain and Ireland were quite modest before the crisis. However, all that changed when Spain and Ireland were forced to bail out their banks (Chart 11). Unlike the US, UK, and Japan, euro area member governments did not have access to central banks that could serve as buyers of last resort for their debts. This limitation created a feedback loop where rising bond yields made it more onerous for governments to service their debts, which led to a higher perceived likelihood of default and even higher yields (Chart 12). Chart 12Multiple Equilibria In The Debt Market Are Possible Without A Lender Of Last Resort
The Golden Rule For Investing In The Stock Market
The Golden Rule For Investing In The Stock Market
The ECB could have short-circuited this vicious cycle. Unfortunately, under the hapless leadership of Jean-Claude Trichet, instead of providing assistance, the central bank raised rates twice in 2011. This helped spread the crisis to Italy and other parts of core Europe. It ultimately took Mario Draghi’s “whatever it takes pledge” to restore some semblance of normality to European sovereign debt markets. Lessons For Today The current environment bears some resemblance to the one preceding the recessions of the early 1980s. As was the case back then, inflation today has surged well above the Federal Reserve’s target, forcing the Fed to turn more hawkish. Oil prices have also risen, despite slowing global growth. Even Russia has returned to its status as the world’s leading geopolitical boogeyman. Yet, digging below the surface, there is a big difference between today and the early ‘80s. For one thing, long-term inflation expectations remain well anchored. While expected inflation 5-to-10 years out has risen to 3.1% in the latest University of Michigan survey, this just takes the reading back to where it was not long after the Great Recession. It is still nowhere near the double-digit levels reached in the early ‘80s (Chart 13). Market-based inflation expectations are even more subdued. In fact, the widely watched 5-year/5-year forward TIPS breakeven inflation rate is currently well below the Fed’s comfort zone (Chart 14). Chart 13Long-Term Inflation Expectations Are Inching Up But Are Still Low
Long-Term Inflation Expectations Are Inching Up But Are Still Low
Long-Term Inflation Expectations Are Inching Up But Are Still Low
Chart 14Market-Based Long-Term Inflation Expectations Are Below The Fed's Comfort Zone
Market-Based Long-Term Inflation Expectations Are Below The Fed's Comfort Zone
Market-Based Long-Term Inflation Expectations Are Below The Fed's Comfort Zone
Higher oil prices are unlikely to have the sting that they once did. The energy intensity of the global economy has fallen steadily over time, especially in advanced economies (Chart 15). Today, the US generates three-times as much output for every joule of energy consumed than it did in 1970. Household spending on energy has declined from a peak of 8.3% of disposable income in 1980 to 3.8% in December 2021. The US also produces over 11 million barrels of oil per day, more than Saudi Arabia (Chart 16). Chart 15The Global Economy Has Become Less Energy Intensive Over Time
The Global Economy Has Become Less Energy Intensive Over Time
The Global Economy Has Become Less Energy Intensive Over Time
Chart 16When It Comes To Energy Production, The USA Is Now #1
When It Comes To Energy Production, The USA Is Now #1
When It Comes To Energy Production, The USA Is Now #1
Unlike in the late 1990s, advanced economies do not face a significant capex overhang. Quite the contrary. Capital spending has been fairly weak across much of the OECD. In the US, the average age of the nonresidential capital stock has risen to the highest level since the 1960s (Chart 17). Looking out, far from cratering, capital spending is set to rise, as foreshadowed by the jump in core capital goods orders (Chart 18). Chart 17The Aging Capital Stock
The Aging Capital Stock
The Aging Capital Stock
Chart 18The Outlook For US Capex Is Bright
The Outlook For US Capex Is Bright
The Outlook For US Capex Is Bright
Chart 19Need More Houses
Need More Houses
Need More Houses
In contrast to the glut of housing that helped precipitate the Global Financial Crisis, housing remains in short supply in many developed economies. In the US, the homeowner vacancy rate has fallen to a record low. There are currently half as many new homes available for sale as there were in early 2020 (Chart 19). Even in Canada, where homebuilding has held up well, government officials have been hitting the panic button over a brewing home shortage. The Biggest Risk Is Debt The biggest macroeconomic risk the global economy faces stems from high debt levels. While household debt has fallen by 20% of GDP in the US, it has risen in a number of other economies. Corporate debt has generally increased everywhere, in many cases to finance share buybacks and M&A activity (Chart 20). Public debt has also soared to the highest levels since during World War II. Chart 20Mo' Debt
Mo' Debt
Mo' Debt
Among emerging markets, China’s debt burden is especially pronounced. Total private and public debt reached 285% of GDP in 2021, nearly double what it was in early 2008. The property market is also slowing, which will weigh on growth. Like many countries, China finds itself in a paradoxical situation: Any effort to pare back debt is likely to crush nominal GDP by so much that the debt-to-GDP ratio rises rather than falls. Ironically, the only solution is to adopt reflationary policies that allow the economy to run hot. In the near term, this could prove to be a favorable outcome for investors since it will mean that monetary policy stays highly accommodative. Over the long haul, however, it may lead to a stagflationary environment, which would be detrimental to equities and other risk assets. In summary, investors should remain overweight stocks for now. However, they should underweight the tech sector since tech stocks remain disproportionately vulnerable to rising rates, increased regulation, and a retrenchment in pandemic-induced spending on electronics and online services. Peter Berezin Chief Global Strategist peterb@bcaresearch.com Global Investment Strategy View Matrix
The Golden Rule For Investing In The Stock Market
The Golden Rule For Investing In The Stock Market
Special Trade Recommendations Current MacroQuant Model Scores
The Golden Rule For Investing In The Stock Market
The Golden Rule For Investing In The Stock Market
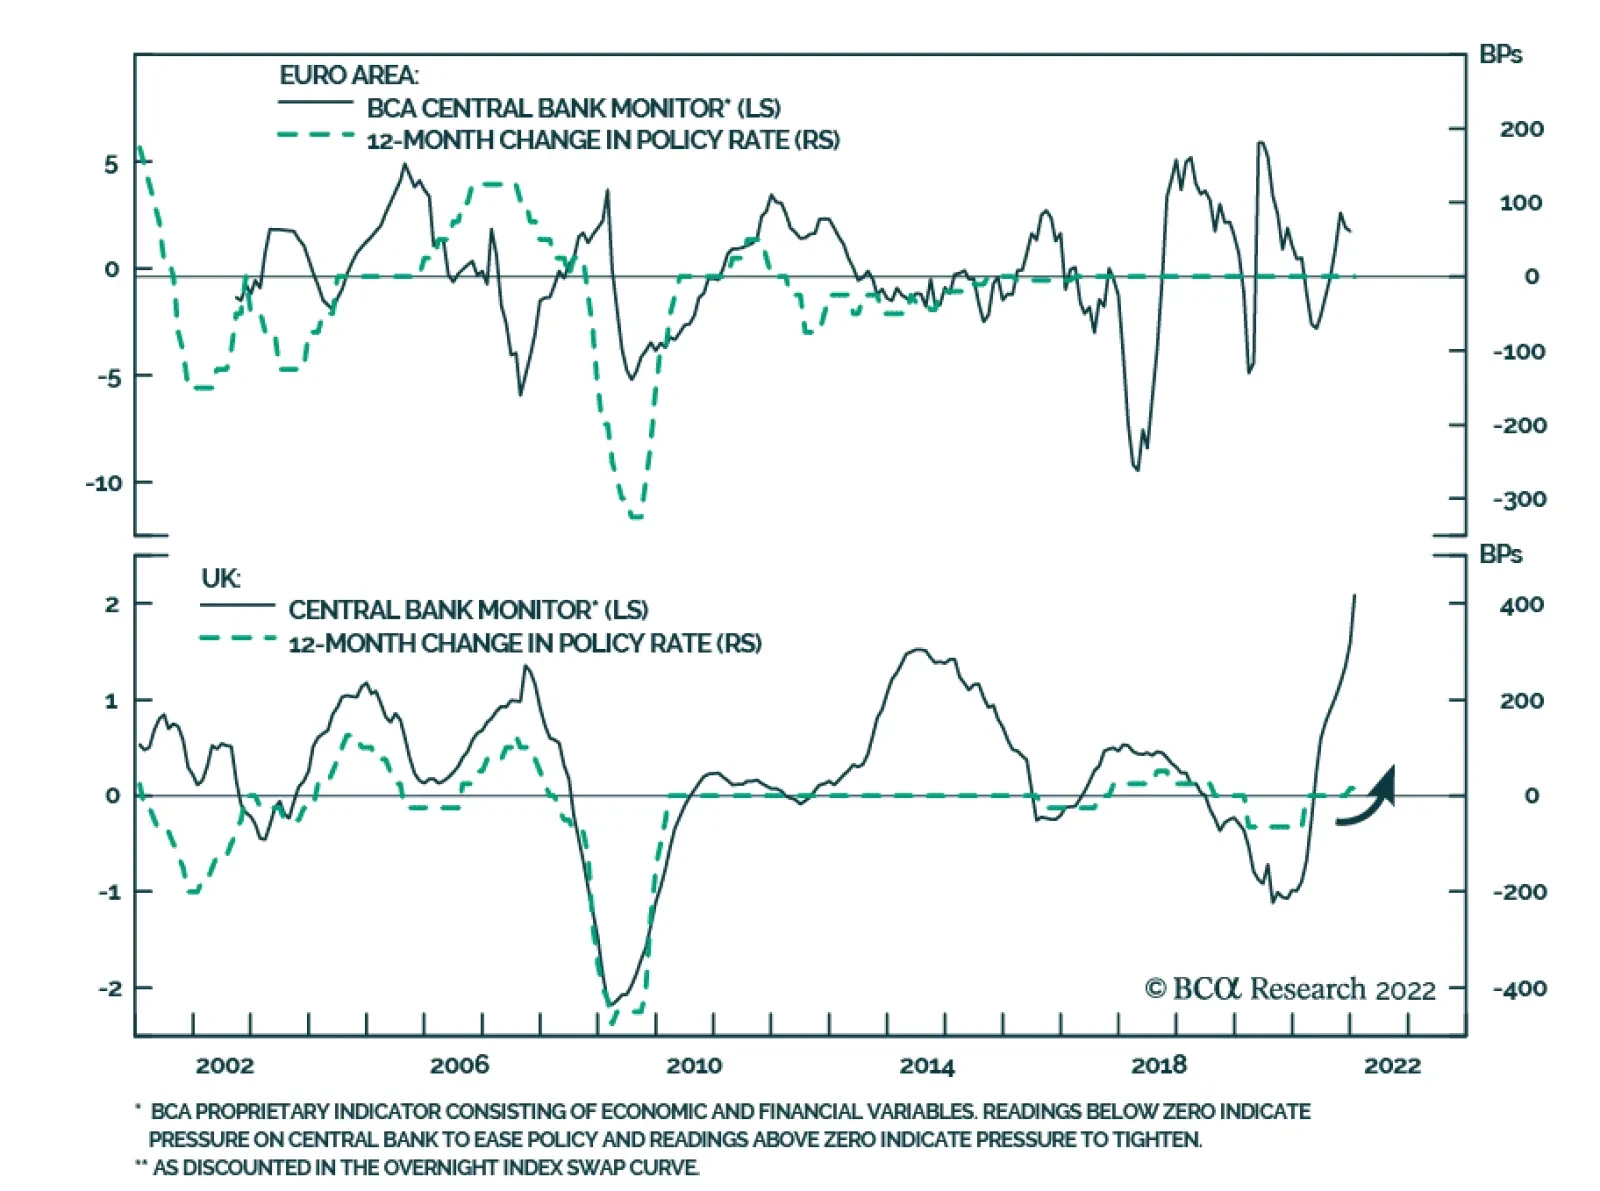
As expected, the Bank of England raised the Bank Rate by 25 bps to 0.5% on Thursday. Notably, of the nine voting MPC members, four voted to increase the Bank Rate by 50 bps to 0.75%. Meanwhile, the ECB kept policy unchanged. Instead, it announced that net…
BCA Research is proud to announce a new feature to help clients get the most out of our research: an Executive Summary cover page on each of the BCA Research Reports. We created these summaries to help you quickly capture the main points of each report through an at-a-glance read of key insights, chart of the day, investment recommendations and a bottom line. For a deeper analysis, you may refer to the full BCA Research Report. In lieu of next week’s report, I will be presenting the quarterly Counterpoint webcast series ‘Where Is The Groupthink Wrong?' I do hope you can join. Executive Summary Spending on goods is in freefall while spending on services is struggling to regain its pre-pandemic trend. If spending on goods crashes to below its previous trend, then there will be a substantial shortfall in demand. The good news is that the freefall in goods spending is leading inflation. With spending on goods now crashing back to earth, inflation will also crash back to earth later this year. Underweight the goods-dominated consumer discretionary sector, and underweight semiconductors versus the broader technology sector. Sell Treasury Inflation Protected Securities (TIPS) and other overbought inflation hedges such as commodities that have not yet corrected. Overbought base metals are particularly vulnerable. Fractal trading watchlist: We focus on nickel versus silver, add tobacco versus cannabis, and update bitcoin, biotech, CAD/SEK, and EUR/CZK. As Spending On Goods Crashes Back To Earth, So Will Inflation
As Spending On Goods Crashes Back To Earth, So Will Inflation
As Spending On Goods Crashes Back To Earth, So Will Inflation
Bottom Line: As spending on goods crashes back to earth, so will inflation, consumer discretionary stocks, semiconductors, and overbought commodities. Feature The pandemic has unleashed a great experiment in our spending behaviour. After a binge on consumer goods, will there be a massive hangover? We are about to find out. The pandemic binge on consumer goods, peaking in the US at a 26 percent overspend, is unprecedented in modern economic history. Hence, we cannot be certain what happens next, but there are three possibilities: We sustain the binge on goods, at least partly. Spending on goods falls back to its pre-pandemic trend. There is a hangover, in which spending on goods crashes to below its previous trend. The answer to this question will have a huge bearing on growth and inflation in 2022-23. After The Binge Comes The Hangover… The pandemic’s constraints on socialising, movement, and in-person contact caused a slump in spending on many services: recreation, hospitality, travel, in-person shopping, and in-person healthcare. Nevertheless, with incomes propped up by massive stimulus, we displaced our spending to items that could be enjoyed within the pandemic’s confines; namely, goods – on which, we binged (Chart I-1). Chart I-1Spending On Goods Is In Freefall
Spending On Goods Is In Freefall
Spending On Goods Is In Freefall
Gradually, we learned to live with SARS-CoV-2, and spending on services bounced back. At the same time, we made some permanent changes to our lifestyles – for example, hybrid office/home working and more online shopping. Additionally, a significant minority of people changed their behaviour, shunning activities that require close contact with strangers – going to the cinema or to amusement parks, using public transport, or going to the dentist or in-person doctors’ appointments. The result is that spending on services is levelling off well short of its pre-pandemic trend (Charts I-2-Chart I-5). Chart I-2Spending On Recreation Services Is Far Below Its Pre-Pandemic Trend
Spending On Recreation Services Is Far Below Its Pre-Pandemic Trend
Spending On Recreation Services Is Far Below Its Pre-Pandemic Trend
Chart I-3Spending On Public Transport Is Far Below Its Pre-Pandemic Trend
Spending On Public Transport Is Far Below Its Pre-Pandemic Trend
Spending On Public Transport Is Far Below Its Pre-Pandemic Trend
Chart I-4Spending On Dental Services Is Far Below Its Pre-Pandemic Trend
Spending On Dental Services Is Far Below Its Pre-Pandemic Trend
Spending On Dental Services Is Far Below Its Pre-Pandemic Trend
Chart I-5Spending On Physician Services Is Far Below Its Pre-Pandemic Trend
Spending On Physician Services Is Far Below Its Pre-Pandemic Trend
Spending On Physician Services Is Far Below Its Pre-Pandemic Trend
Arithmetically therefore, to keep overall demand on trend, spending on goods must stay above its pre-pandemic trend. Yet spending on goods is crashing back to earth. The simple reason is that durables, by their very definition, are durable. Even nondurables such as clothes and shoes are in fact quite durable. Meaning that are only so many cars, iPhone 13s, gadgets, clothes and shoes that any person can binge on before reaching saturation. Indeed, to the extent that our bingeing has brought forward future purchases, the big risk is a period of underspending on goods. Countering The Counterarguments Let’s address some counterarguments to the hangover thesis. One counterargument is that some goods are a substitute for services: for example, eating-in (food at home) substitutes for eating-out; and recreational goods substitute for recreational services. So, if there is a shortfall in services spending, there will be an automatic substitution into goods spending. The problem is that the substitutes are not mirror-image substitutes. Spending on eating-in tends to be much less than on eating-out. And once you have bought your recreational goods, you don’t keep buying them! A second counterargument is that provided the savings rate does not rise, there will be no shortfall in spending. Yet this is a tautology. The savings rate is simply the residual of income less spending. So, to the extent that there is a structural shortfall in services spending combined with a hangover in goods spending, the savings rate must rise – as it has in the past two months. A third counterargument is that the war chest of savings accumulated during the pandemic will unleash a tsunami of spending. Well, it hasn’t. And, it won’t. Previous episodes of excess savings in 2004, 2008, and 2012 had no impact on the trend in spending (Chart I-6). Chart I-6Previous Episodes Of Excess Savings Had No Impact On Spending
Previous Episodes Of Excess Savings Had No Impact On Spending
Previous Episodes Of Excess Savings Had No Impact On Spending
The explanation comes from a theory known as Mental Accounting Bias. This points out that we segment our money into different ‘mental accounts’. And that the main factor that establishes whether we spend our money is which mental account it resides in. The moment we move money from our ‘income’ account into our ‘wealth’ account, our propensity to spend it collapses. Specifically, we will spend most of the money in our ‘income’ mental account, but we will spend little of the money in our ‘wealth’ mental account. Hence, the moment we move money from our income account into our wealth account, our propensity to spend it collapses. Still, this brings us to a fourth counterargument, which claims that even though the ‘wealth effect’ is small, it isn’t zero. Therefore, the recent boom in household wealth will bolster growth. Yet as we explained in The Wealth Impulse Has Peaked, the impact of your wealth on your spending growth does not come from your wealth change. It comes from your wealth impulse, which is fading fast (Chart I-7). Chart I-7The 'Wealth Impulse' Has Peaked
The 'Wealth Impulse' Has Peaked
The 'Wealth Impulse' Has Peaked
Analogous to the more widely-used credit impulse, the wealth impulse compares your capital gain in any year with your capital gain in the preceding year. It is this change in your capital gain – and not the capital gain per se – that establishes the growth in your ‘wealth effect’ spending. Unfortunately, the wealth impulse has peaked, meaning its impact on spending growth will not be a tailwind. It will be a headwind. As Spending On Goods Crashes Back To Earth, So Will Inflation, Consumer Discretionary Stocks, And Overbought Commodities In the fourth quarter of 2021, US consumer spending dipped to below its pre-pandemic trend and the savings rate increased. Begging the question, how did the US economy manage to grow at a stellar 6.7 percent (annualised) rate? The simple answer is that inventory restocking contributed almost 5 percent to the 6.7 percent growth rate. In fact, removing inventory restocking, US final demand came to a virtual standstill in the second half of 2021, growing at just a 1 percent (annualised) rate. Growth that is dependent on inventory restocking is a concern because inventory restocking averages to zero in the long run, and after a massive positive contribution there tends to come a symmetrical negative contribution. If, as we expect, spending on services fails to catch up to its pre-pandemic trend while spending on goods falls back to its pre-pandemic trend, then there will be a demand shortfall. And if there is a hangover, in which spending on goods crashes to below its previous trend, then the demand shortfall could be substantial. As inflation crashes back to earth, so will overbought commodities. The good news is that the freefall in durable goods spending is leading inflation. In this regard, you might be surprised to learn that the US core (6-month) inflation rate has already been declining for five consecutive months. With spending on goods now crashing back to earth, inflation will also crash back to earth later this year (Chart I-8). Chart I-8As Spending On Goods Crashes Back To Earth, So Will Inflation
As Spending On Goods Crashes Back To Earth, So Will Inflation
As Spending On Goods Crashes Back To Earth, So Will Inflation
Sell Treasury Inflation Protected Securities (TIPS) and other overbought inflation hedges such as commodities that have not yet corrected. Given that the level (rather than the inflation) of commodity prices is irrationally tracking the inflation rate, the likely explanation is that investors have piled into commodities as a hedge against inflation. Hence, as inflation crashes back to earth, so will overbought commodities (Chart I-9). Overbought base metals are particularly vulnerable. Chart I-9Overbought Commodities Are Particularly Vulnerable
Overbought Commodities Are Particularly Vulnerable
Overbought Commodities Are Particularly Vulnerable
Fractal Trading Watchlist This week we focus on nickel versus silver, add tobacco versus cannabis, and update bitcoin, biotech, CAD/SEK, and EUR/CZK. To reiterate, overbought base metals are vulnerable, and the 70 percent outperformance of nickel versus silver through the past year has reached the point of fractal fragility that signalled previous major turning-points in 2014, 2016, 2018, and 2020 (Chart I-10). Accordingly, this week’s recommended trade is to go short nickel versus silver, setting the profit target and symmetrical stop-loss at 20 percent. Chart I-10Short Nickel Versus Silver
Short Nickel Versus Silver
Short Nickel Versus Silver
A Potential Switching Point From Tobacco Into Cannabis
A Potential Switching Point From Tobacco Into Cannabis
A Potential Switching Point From Tobacco Into Cannabis
Bitcoin's 65-Day Fractal Support Is Holding For Now
Bitcoin's 65-Day Fractal Support Is Holding For Now
Bitcoin's 65-Day Fractal Support Is Holding For Now
Biotech Approaching A Major Buy
Biotech Approaching A Major Buy
Biotech Approaching A Major Buy
CAD/SEK Approaching A Sell
CAD/SEK Approaching A Sell
CAD/SEK Approaching A Sell
EUR/CZK At A Bottom
EUR/CZK At A Bottom
EUR/CZK At A Bottom
Dhaval Joshi Chief Strategist dhaval@bcaresearch.com Fractal Trading System
After The Pandemic Binge Comes The Pandemic Hangover...
After The Pandemic Binge Comes The Pandemic Hangover...
After The Pandemic Binge Comes The Pandemic Hangover...
After The Pandemic Binge Comes The Pandemic Hangover...
6-Month Recommendations Structural Recommendations Closed Fractal Trades Indicators To Watch - Bond Yields Chart II-1Indicators To Watch - Bond Yields ##br##- Euro Area
Indicators To Watch - Bond Yields - Euro Area
Indicators To Watch - Bond Yields - Euro Area
Chart II-2Indicators To Watch - Bond Yields ##br##- Europe Ex Euro Area
Indicators To Watch - Bond Yields - Europe Ex Euro Area
Indicators To Watch - Bond Yields - Europe Ex Euro Area
Chart II-3Indicators To Watch - Bond Yields ##br##- Asia
Indicators To Watch - Bond Yields - Asia
Indicators To Watch - Bond Yields - Asia
Chart II-4Indicators To Watch - Bond Yields ##br##- Other Developed
Indicators To Watch - Bond Yields - Other Developed
Indicators To Watch - Bond Yields - Other Developed
Indicators To Watch - Interest Rate Expectations Chart II-5Indicators To Watch - Interest Rate Expectations
Indicators To Watch - Interest Rate Expectations
Indicators To Watch - Interest Rate Expectations
Chart II-6Indicators To Watch - Interest Rate Expectations
Indicators To Watch - Interest Rate Expectations
Indicators To Watch - Interest Rate Expectations
Chart II-7Indicators To Watch - Interest Rate Expectations
Indicators To Watch - Interest Rate Expectations
Indicators To Watch - Interest Rate Expectations
Chart II-8Indicators To Watch - Interest Rate Expectations
Indicators To Watch - Interest Rate Expectations
Indicators To Watch - Interest Rate Expectations
BCA Research is proud to announce a new feature to help clients get the most out of our research: an Executive Summary cover page on each of the BCA Research Reports. We created these summaries to help you quickly capture the main points of each report through an at-a-glance read of key insights, chart of the day, investment recommendations and a bottom line. For a deeper analysis, you may refer to the full BCA Research Report. Executive Summary Cyclical UST Curve Flattening, But With Unusually Low Rate Expectations
Deciphering The Messages From The US Treasury Curve
Deciphering The Messages From The US Treasury Curve
The US Treasury curve is unusually flat given high US inflation and with the Fed not having begun to raise interest rates. The dichotomy between deeply negative real interest rates and a flattening yield curve is not only evident in the US, but in other major developed countries like Germany and the UK. A low term premium on longer-term US Treasury yields is one factor keeping the curve so flat, but the term premium will likely rise as the Fed begins to hike rates. An overly flat US Treasury curve more likely reflects a belief that the neutral real fed funds rate (r-star) is actually negative. This is consistent with markets pricing in a very low peak in the funds rate for the upcoming tightening cycle, despite the current high inflation and tight labor market. Bottom Line: The Fed will hike by less than the market expects in 2022 and longer-term Treasury yields remain too low versus even a moderate 2-2.5% peak in the fed funds rate. Stay in US curve steepeners, as the Treasury curve is already too flat and will not flatten as much as discounted in forward rates this year. Feature Last week’s FOMC meeting essentially confirmed that the Fed will begin lifting rates in March and deliver multiple rate hikes this year. This was considered a hawkish surprise as the Fed signaled imminently tighter monetary policy even with the elevated financial market volatility seen so far in 2022. Fed Chair Jerome Powell noted that the US economy was in a stronger position compared to the 2016-18 tightening cycle, justifying a faster pace of hikes – and an accelerated pace of QE tapering – this time around. Markets have responded to the increasingly hawkish guidance of the Fed by pushing up rate expectations for 2022, continuing a path dating back to last September’s FOMC meeting when the Fed first signaled that QE tapering was imminent (Chart 1). There are now 163bps of Fed rate hikes by year-end discounted in the US overnight index swap (OIS) curve. Some Wall Street investment banks are calling for the Fed to hike as much as 6 or 7 times in 2022. We see this as much too aggressive. Chart 1Fed Hawkishness Pushing Up Rate Expectations For 2022/23 - But Not Beyond That
Fed Hawkishness Pushing Up Rate Expectations For 2022/23 - But Not Beyond That
Fed Hawkishness Pushing Up Rate Expectations For 2022/23 - But Not Beyond That
Our base case scenario calls for the Fed to lift rates “only” 3-4 times this year. The persistently high inflation that is troubling the Fed is likely to peak in the first half of 2022, taking some heat off the FOMC to move as aggressively as discounted in markets this year. Although inflation will remain high enough, and the labor market tight enough, to keep the Fed on a tightening path into 2023. The US Treasury Curve Looks Too Flat What is unique about the upcoming Fed tightening cycle is that it is starting with such a flat US Treasury curve. The spread between the 2-year and 10-year yield now sits at 61bps, the lowest level since October 2020. This dynamic is not unique to the US, as yield curves are quite flat in other major countries where policy rates are near 0% and inflation remains relatively high, like the UK and Germany (Chart 2). In the US, the modest slope of the Treasury curve is notably unusual given a growth and inflation backdrop that would be more consistent with much higher bond yields: The US unemployment rate fell to 3.9% in December, well within the range of full employment estimates from FOMC members (Chart 3, top panel) Chart 2Bond Bearish Yield Curve Flattening In The US & UK
Bond Bearish Yield Curve Flattening In The US & UK
Bond Bearish Yield Curve Flattening In The US & UK
US labor costs are accelerating; the wages and salaries component of the Employment Cost Index for Private Industry Workers rose to a 38-year high of 5.0% on a year-over-year basis in Q4/2021 (middle panel) Chart 3Challenges To The Fed's Inflation Fighting Credibility
Challenges To The Fed's Inflation Fighting Credibility
Challenges To The Fed's Inflation Fighting Credibility
Higher inflation is becoming more embedded in medium term consumer inflation expectations measures like the University of Michigan 5-10 year ahead series that climbed to 3.1% last month (bottom panel). Importantly, market-based measures of inflation expectations have pulled back, even with little sign of inflation pressures easing. The 5-year TIPS breakeven, 5-years forward has fallen 35bps from the October 2021 peak of 2.41%. The bulk of that decline occurred in January of this year, alongside a rising trend in real TIPS yields as markets began pricing in a faster pace of Fed rate hikes. TIPS breakevens can often be something of a “vote of confidence” by the markets in the appropriateness of the Fed’s policy stance; rising when policy appears overly stimulative and vice versa. Thus, the decline in the TIPS 5-year/5-year forward breakeven, which climbed steadily higher since the Fed introduced massive monetary easing in March 2020 in response to the pandemic, can be interpreted as a sign that markets agree with the Fed’s recent hawkish turn. However, while the move in TIPS breakevens is sensible, the flatness of the Treasury curve appears unusual. In Chart 4, where we look at the previous times since 1975 that the 2-year/10-year US Treasury spread flattened to 70bps (just above the current level). In past cycles, the Treasury curve would be flattening into such a level after the Fed had already hiked rates a few times, which is obviously not the case today. Also, US unemployment was typically approaching, or falling through, the full employment NAIRU when the 2/10 Treasury curve fell to 70bps, suggesting diminished spare economic capacity and rising inflation pressures – similar to the current backdrop. Chart 4The UST Curve Is Unusually Flat Right Now
The UST Curve Is Unusually Flat Right Now
The UST Curve Is Unusually Flat Right Now
Chart 5UST Curve Too Flat Relative To Inflation Pressures
UST Curve Too Flat Relative To Inflation Pressures
UST Curve Too Flat Relative To Inflation Pressures
In those past cycles, the funds rate was rising at a faster pace than that of core inflation, suggesting that the Fed was pushing up real interest rates. The backdrop looks very different today, with US realized inflation soaring and the real funds rate now deeply negative. In the top panel of Chart 5, we show a “cycle-on-cycle” chart of the 2/10 Treasury curve versus an average of the previous five instances where the curve flattened to 70bps. The green line is the median outcome of all the cycles, while the shaded region represents the range of all the outcomes. In the other panels of the chart, we show US economic variables (the Conference Board leading economic index and the ISM Manufacturing index) and US inflation variables (the wages and salaries component of the Employment Cost Index and the US Congressional Budget Office estimate of the US output gap). The panels are all lined up so that the vertical line in the middle of the chart represents the date that the 2/10 curve falls to 70bps. The conclusion from Chart 5 is that the US economic variables shown are currently at the high end of the range of past curve flattening episodes, but the inflation variables are well above the high end of the historical range. In other words, the current modest slope of the 2/10 Treasury curve is in line with US growth momentum but is too flat relative to US inflation trends. So Why Isn’t The US Treasury Curve Steeper? There are a few possible reasons why the US curve is as flat as it is before the Fed has even begun tightening amid above-trend US growth and very high US inflation: Fears of a deeper financial market selloff The Fed believes strongly in the role of financial conditions in transmitting its monetary policy into the US economy. That often means that, during tightening cycles, the Fed hikes rates “until something breaks” in the financial markets, like a major equity market downturn or a big widening in corporate credit spreads. Such moves act as a brake on US growth through negative wealth effects for investors and by raising the cost of capital for businesses – reducing the need for additional Fed tightening. If bond investors thought that a major market selloff was likely before the Fed could successfully lift rates back to neutral (or even restrictive) levels during a tightening cycle, then they would discount a lower peak level of the funds rate. This would also lower the expected peak level of longer-term Treasury yields, resulting in a flatter Treasury yield curve. Given the current elevated valuations on so many asset classes – like equities, corporate credit and housing – it is likely that the relatively flat Treasury curve incorporates some believe that the Fed will have difficulty delivering a lot of rate hikes in this cycle. However, it should be noted that the US financial conditions remain quite accommodative, even after the recent equity market turbulence (Chart 6), and represent no impediment to US growth that reduces how much tightening the Fed will need to do. Longer-term bond term premia are too low A relatively flat yield curve could reflect a lack of a term premium on longer-maturity bonds. That is certainly the case when looking at the slope of the 2/10 government yield curve in the US, as well as in the UK and Germany (Chart 7).1 Chart 6US Financial Conditions Are No Impediment To US Growth
US Financial Conditions Are No Impediment To US Growth
US Financial Conditions Are No Impediment To US Growth
Chart 7Flatter Yield Curves? Or Just Lower Bond Term Premia?
Flatter Yield Curves? Or Just Lower Bond Term Premia?
Flatter Yield Curves? Or Just Lower Bond Term Premia?
The term premium is the defined as the extra yield that investors require to commit to own a longer-maturity bond instead of the compounded yield from a series of shorter-maturity bonds. The latter can also be expressed as the “expected path of short-term interest rates”, which is often proxied by an average expected path of the monetary policy rate over the life of the longer-maturity bond. So the term premium on a 10-year US Treasury yield is the difference between the actual 10-year Treasury yield and the expected (or average) path of the fed funds rate over the next ten years. The term premium can also be thought of as a risk premium to holding longer-term bonds. On that basis, the term premium should correlate to measures of bond risk, like bond price volatility or inflation volatility. That is definitely true in the US, where the 10-year Treasury term premium shows a strong correlation to the MOVE index of Treasury market option-implied volatility or a longer-term standard deviation of headline CPI inflation (Chart 8). Estimated term premia can also rise during periods of slowing economic growth momentum, but that is typically due to a rapid decline in the expected path of interest rates rather than a rise in bond risk premia (in this case, this is probably more accurately described as a rise in bond uncertainty). Currently, a low term premium on US Treasury yields is justified by the relatively low level of bond volatility and solid US growth momentum. However, the term premium looks far too low compared to the more volatile US inflation seen since the start of the COVID-19 pandemic. With the Fed set to respond to that higher inflation with rate hikes, rising real interest rate expectations could also give a lift to the Treasury term premium. Our favorite proxy for the market expectation of the peak/terminal real short-term interest rate for the major developed market economies is the 5-year/5-year forward OIS rate minus the 5-year/5-year forward CPI swap rate. That “real” 5-year/5-year forward rate measure is typically well correlated to our estimates of the 10-year term premium in the US, Germany and the UK (Chart 9). This correlation likely reflects the level of certainty bond investors have over the likely future path of real interest rates. When there is more uncertainty about how high rates will eventually go to in a tightening cycle, a higher term premium is required. The opposite is true during periods of very low and stable interest rates. Chart 8Drivers Of US Term Premia Pointing Upward
Drivers Of US Term Premia Pointing Upward
Drivers Of US Term Premia Pointing Upward
Chart 9Bond Term Premia Positively Correlated To Real Rate Expectations
Bond Term Premia Positively Correlated To Real Rate Expectations
Bond Term Premia Positively Correlated To Real Rate Expectations
Chart 10Global Yield Curves Are Too Flat Versus Real Policy Rates
Global Yield Curves Are Too Flat Versus Real Policy Rates
Global Yield Curves Are Too Flat Versus Real Policy Rates
Currently, the estimated 10-year US term premium is increasing alongside a rising market-implied path for the real fed funds rate. We anticipate these trends will continue as the Fed lift rates over the next couple of years, boosting longer-term Treasury yields and potentially putting some steepening pressure on the US Treasury curve (or at least limiting the degree of flattening as the Fed tightens). Markets believe that the neutral real rate (r*) is negative Historically, yield curve slopes for government bonds were well correlated to the level of real interest rates, measured as the central bank policy rate minus headline inflation. That relationship has broken down in the US, with the Treasury curve flattening in the face of soaring US inflation and an unchanged fed funds rate (Chart 10). Similar dynamics can also be seen in the German and UK yield curves. The most plausible reason for such a dramatic shift in the relationship between curve slopes and real policy rates is that bond investors now believe that the neutral real interest rate, a.k.a. “r-star”, is negative … and perhaps deeply so. The New York Fed has produced estimates of the US r-star dating back to the 1960s. The gap between the real fed funds rate and that r-star estimate has typically been fairly well correlated to the slope of the Treasury curve (Chart 11). When the real fed funds rate is below r-star, indicating that the policy is accommodative, the Treasury curve is usually steepening, and vice versa. Under this framework, the recent flattening trend of the Treasury curve would indicate that policy is actually getting tighter, despite the falling, and deeply negative, real fed funds rate of -5.4% (deflated by core inflation). Chart 11UST Curve Slope Is Positively Correlated To The 'Real Policy Gap'
UST Curve Slope Is Positively Correlated To The 'Real Policy Gap'
UST Curve Slope Is Positively Correlated To The 'Real Policy Gap'
The last known estimate of r-star from the New York Fed was 0%, but no update has been provided for almost two years. Blame the pandemic for that. The sharp lockdown-fueled collapse in US GDP growth in 2020, and the rapid recovery in growth as the economy reopened, made it impossible to estimate the the “neutral” level of real interest rates given such massive swings in demand that were not related to monetary policy. One way to try and “back out” the implicit pricing of r-star currently embedded in US Treasury yields is to estimate a model linking the gap between the real fed funds rate and r-star to the slope of the Treasury curve. We did just that, with the results presented in Chart 12. This model estimates the “Real Policy Gap”, or r-star minus the real fed funds rate, as a function of the 2/10 Treasury curve slope. In other words, the model shows the Real Policy Gap that is consistent with the current slope of the curve. Chart 12Current UST Yield Curve Makes Slope Sense ... If The Fed Followed The Taylor Rule With 7% Inflation
Current UST Yield Curve Makes Slope Sense ... If The Fed Followed The Taylor Rule With 7% Inflation
Current UST Yield Curve Makes Slope Sense ... If The Fed Followed The Taylor Rule With 7% Inflation
The model estimates that the current 2/10 curve slope is consistent with a Real Policy Gap of 96bps. With US core CPI inflation currently at 5%, and assuming r-star is still 0% as per the last New York Fed estimate, the fed funds rate would have to rise to 4% to justify the current slope of the 2/10 curve. While that may sound like an implausibly large increase in the funds rate, similar results are produced using straightforward Taylor Rules.2 We can also use our Real Policy Gap model to infer the level of inflation that is consistent with a Gap of 96bps, for various combinations of the funds rate and r-star. Those are shown in Table 1. Assuming the funds rate rises in line with current market expectations to 1.7% and r-star remains close to 0%, the current slope of the 2/10 Treasury curve suggests a fall in US inflation to just around 3% - still above the Fed’s inflation target - from the current 5%. Table 1The UST Curve Slope Has Already Discounted A Big Drop In US Inflation
Deciphering The Messages From The US Treasury Curve
Deciphering The Messages From The US Treasury Curve
We see this as the most plausible reason for the relatively flat level of the 2/10 US Treasury curve. Markets expect somewhat lower US inflation and a moderate rise in the funds rate over the next couple of years, making the real funds rate less negative but not pushing it above a negative r-star expectation. This would suggest upside risk for US Treasury yields, and potential bearish steepening pressure, as markets come to realize that the neutral real fed funds rate is actually positive, not negative. Fight The Forwards, Stay In US Treasury Curve Steepeners While it may sound counter-intuitive with the Fed set to begin a rate hiking cycle, we continue to see better value in tactically positioning in US Treasury curve steepening trades. Specifically, we are keeping our recommended trade in our Tactical Overlay on page 19, where we are long a 2-year Treasury bullet versus a duration-neutral barbell of cash (a 3-month US Treasury bill) and a 10-year Treasury bond. The trade is currently underwater, but we see good reasons to expect the performance to rebound over the next few months. The front end of the curve now discounts more hikes than we expect will unfold in 2022, which should limit further increases in the 2-year Treasury yield. At the same time, the 10-year yield looks too low relative to the expected cyclical peak for the fed funds rate (Chart 13). One way we can assess this is by comparing 5-year/5-year forward Treasury rates to survey estimates of the longer run, or terminal, fed funds rate. The median FOMC forecast (or “dot”) for the terminal funds rate is 2.5%, the median terminal rate forecast from the New York Fed’s Survey of Primary Dealers is 2.25% and the median terminal rate forecast from the New York Fed’s Survey of Market Participants is 2%. This sets a range of estimates of the longer-run terminal rate of 2-2.5%, in line with the current expectations of the BCA Research bond services. The current 5-year/5-year forward Treasury rate is 2.0%, at the low end of that range. We see those forwards rising to the upper part of that 2-2.5% range by the end of 2022, which will push the 10-year Treasury yield toward our year-end target of 2.25%. Chart 13The 5-Year/5-Year UST Forward Rate Is Too Low
The 5-Year/5-Year UST Forward Rate Is Too Low
The 5-Year/5-Year UST Forward Rate Is Too Low
Chart 14Stay In UST Curve Steepeners, Even With Fed Liftoff Imminent
Stay In UST Curve Steepeners, Even With Fed Liftoff Imminent
Stay In UST Curve Steepeners, Even With Fed Liftoff Imminent
Some of our colleagues within the BCA family see the longer-term neutral funds rate as considerably higher than survey estimates, perhaps as high as 3-4%. We are sympathetic to that view, but it will take signs of US economic resiliency in the face of rate hikes before bond investors – and more importantly, the Fed – arrive at that conclusion. This would make steepening trades more attractive on a strategic, or medium-term, basis as the market realizes that the Fed is further behind the policy curve (i.e. the funds rate even further below a higher terminal rate) than previously envisioned. For now, we do not see the US Treasury curve flattening at the pace discounted in the Treasury forward curve over the next 3-6 months (Chart 14, top panel). However, this will be more of a carry trade by betting against the forwards over time. A bearish steepening of the Treasury curve with a swift upward move in the 10-year Treasury yield is less likely with bond investor/trader positioning already quite short (bottom two panels). Robert Robis, CFA Chief Fixed Income Strategist rrobis@bcaresearch.com Footnotes 1 The term premium estimates shown here are derived from our own in-house framework. For those familiar with the various term premium estimates on the 10-year US Treasury yield produced by the Fed, our estimates are currently in line with those produced by the ACM model and the Kim & Wright model. 2 A fun US Taylor Rule calculator, which can be used to generate Taylor Rules under a variety of assumptions, is available on the Atlanta Fed’s website here. GFIS Model Bond Portfolio Recommended Positioning Active Duration Contribution: GFIS Recommended Portfolio Vs. Custom Performance Benchmark
Deciphering The Messages From The US Treasury Curve
Deciphering The Messages From The US Treasury Curve
The GFIS Recommended Portfolio Vs. The Custom Benchmark Index Global Fixed Income - Strategic Recommendations* Duration Regional Allocation Spread Product Tactical Overlay Trades
Highlights The combination of a temporarily negative domestic demand effect and a lingering domestic labor and global supply chain effect from the Omicron variant has increased the urgency for the Fed to raise interest rates. The central bank’s credibility has been significantly challenged over the past year by the extent of the rise in consumer prices, and it will move forward with a rate hike at its March meeting. We expect that the Fed funds rate will rise to 1% by the end of this year. The Fed’s asset purchase reductions will not have a direct impact on economic activity, but they could have an indirect effect by prompting a faster rise in US Treasury yields towards their fair value levels. The US 10-year yield could potentially rise to 2.3-2.4% at some point in the first half of the year, rather than by the end of 2022 as we previously expected. Part of the generalized rise in risk premia this month relates to the potential Russian invasion of Ukraine, but the sell-off in equity prices also appears to reflect an overall level of investor discomfort with rising interest rates. Rising long-maturity bond yields are being driven by the short end of the curve, which we see as a sign that the generalized selloff in the US equity market is uncalled for. Investors should buy the US stock market at current levels on a 6-12 month time horizon. It is too early to position aggressively towards China-sensitive commodities and global ex-US stocks, despite the recent pickup in our market-based growth indicator for China. We are more comfortable with a bullish view toward industrial metals in the latter half of 2022, and recommend that investors buy metals on any dips in prices. A Russian invasion of Ukraine has become a likely event, suggesting that investors need to decide now whether to reduce risky asset exposure. The invasion has not yet occurred as we go to press, but could happen at any moment. All told, we doubt that a minor invasion will have a lasting, full-year impact on financial markets, but investors should gird for a risk-off reaction over shorter-term time horizons. Omicron, The Supply-Side, And The Fed January was a poor month for the global equity market, which sold off 10% from its high at the beginning of the year. Chart I-1 highlights that in the US, the S&P 500 has now fallen below its 200-day moving average, in contrast to global ex-US stocks which have fared somewhat better in US$ terms. Equities have declined this month because of a combination of imminent Fed tightening and a geopolitical crisis, both of which we will discuss in detail below. On the pandemic front, the number of confirmed cases of COVID-19 has surged globally (Chart I-2), which is likely an underestimation of the total number of infections given capacity limits on testing in many countries. Panel 2 highlights that services PMIs fell sharply in January in several economies because of the Omicron wave, reflecting both renewed pandemic control measures in some countries as well as precautionary changes in behavior amongst consumers in countries where widespread “non-pharmaceutical interventions” (“NPIs”) were not reintroduced. Manufacturing PMIs, on the other hand, held up quite well, even in Europe where natural gas prices remain high. Chart I-1A Significant Correction In US Stock Prices
A Significant Correction In US Stock Prices
A Significant Correction In US Stock Prices
Chart I-2Omicron Is Impacting Services, Not Manufacturing
Omicron Is Impacting Services, Not Manufacturing
Omicron Is Impacting Services, Not Manufacturing
Some positive signs have emerged from the hospitalization data in advanced economies, as they appear to be pointing to a cresting wave of patients with COVID-19 both in hospitals overall and specifically in intensive care units (Chart I-3). The evolution of the pandemic remains highly uncertain, and the development of new variants continues to remain a risk. But incoming data on hospitalizations, the rapid increase in the number of vaccine booster doses administered in many advanced economies, and the sheer speed at which the disease has recently been spreading all point to a possible imminent peak in the impact of the Omicron variant on the demand side of the economy – at least in the developed world. However, Chart I-4 highlights that there is no sign yet of a waning impact of the pandemic on the supply side of the economy. The chart shows that rising European natural gas prices are having less of an impact on our supply-side pressure indicator, but that the indicator remains flat excluding this effect. We noted in last month’s report that the Omicron variant posed a significant risk of more frequent or longer lockdowns in China, because of the country’s zero-tolerance COVID policy and the inability of the Sinovac vaccine to provide any protection against contracting Omicron. Panel 2 of Chart I-4 highlights that shipping costs between China/East Asia and the west coast of the US have started to tick higher again, suggesting that the impact of ongoing lockdowns as well as mandatory quarantines and testing in key areas such as Shenzhen, Tianjin, Ningbo, and Xi’an may already be having an effect. Chart I-3Hospitalizations From Omicron Appear To Be Peaking
Hospitalizations From Omicron Appear To Be Peaking
Hospitalizations From Omicron Appear To Be Peaking
Chart I-4Pandemic-Related Supply-Side Pressures Remain Severe
Pandemic-Related Supply-Side Pressures Remain Severe
Pandemic-Related Supply-Side Pressures Remain Severe
From the Fed’s perspective, a combination of a temporarily negative domestic demand effect and a lingering domestic labor and global supply chain effect from the Omicron variant has increased the urgency to raise interest rates. The Fed’s credibility has been significantly challenged over the past year by the extent of the rise in consumer prices, which is being partially driven by demand (even if supply-chain factors are also materially boosting global goods prices). Chart I-5The Odds Of Extreme US Inflation Are Falling, But Inflation Will Still Be High This Year
The Odds Of Extreme US Inflation Are Falling, But Inflation Will Still Be High This Year
The Odds Of Extreme US Inflation Are Falling, But Inflation Will Still Be High This Year
Chart I-5 shows that our inflation momentum model is signaling falling odds of 4% or higher core PCE inflation, but the model’s probability remains above the 50% mark. Thus, while it is possible that US inflation will soon peak in year-over-year terms, the Fed will move forward with a rate hike at its March meeting. For now, we believe that the Fed will move at a pace of four quarter-point rate hikes per year (regardless of how they are sequenced), suggesting that the effective Fed funds rate will rise to 1% by the end of this year. Quantitative Tightening And Financial Markets Investors continue to wrestle with the Fed’s recent hawkish shift and the implications that it may have for economic activity and financial markets. Investors are not just concerned about the pace and magnitude of Fed rate hikes, but also the potential impact of quantitative tightening as the Fed moves to slow the pace of its asset purchases over the coming few months. Chart I-6The Correlation Between The Fed's Balance Sheet And The Equity Market Is Mostly A Spurious one
The Correlation Between The Fed's Balance Sheet And The Equity Market Is Mostly A Spurious one
The Correlation Between The Fed's Balance Sheet And The Equity Market Is Mostly A Spurious one
In our view, investors should be more concerned with the former rather than the latter. Chart I-6 highlights the reason that investors were so focused on the magnitude of the Fed’s balance sheet during the first half of the last economic expansion. Panel 1 of the chart shows that the level of the S&P 500 correlated almost perfectly with the Fed’s total holdings of securities from 2008 to 2015. However, panel 2 highlights that this relationship broke down from 2016 to early 2020, only to correlate positively again as the Fed’s holdings of securities surged higher during the pandemic. To us, the experience of the past decade highlights that the correlation between the Fed’s balance sheet and the equity market is mostly a spurious one. The two are indirectly related; periods when the Fed’s security holdings increase reflect periods of monetary easing, which is typically positive for risky asset prices. But we do not agree that the impact of asset purchases on long-maturity bond yields can be effectively separated from the direct impact of changes in short-term interest rates, which are typically falling as the Fed’s balance sheet rises. In addition, asset purchases signal important information by the Fed about the future path of short-term interest rates when it changes the pace of its purchases. And finally, the 2016-2019 period strongly underscores that there is no direct link between Fed asset purchases and the stock market. It is possible that periods of rising Fed asset purchases are associated with a low government bond term premium or more dovish investor sentiment about the future path of interest rates than is projected by the Fed. If so, that could imply that the Fed’s asset purchase reductions will have some impact on financial markets over the coming months. Chart I-7 suggests that the term premium on 10-year Treasurys is no longer low, but these series are based on surveys of primary dealers and fixed-income market participants, and thus may not reflect the aggregate views of investors. Chart I-8 highlights that 10-year government bond yields are 40 basis points below the fair value implied by the Fed’s interest rate projections, and panel 2 highlights a similar conclusion based on a regression of the 10-year yield on the 2-year yield and 5-year/5-year forward CPI swap rates. Thus, it is possible that the Fed’s rapid reduction in the pace of its asset purchases will cause bond yields to converge quickly with these estimates of fair value, implying that the US 10-year yield could potentially rise to 2.3-2.4% at some point in the first half of the year rather than by the end of 2022, as we previously expected. Chart I-7Surveys Suggest The Term Premium Is No Longer Deeply Negative...
Surveys Suggest The Term Premium Is No Longer Deeply Negative...
Surveys Suggest The Term Premium Is No Longer Deeply Negative...
Chart I-8...But 10-Year Treasury Yields Are Lower Than They Should Be
...But 10-Year Treasury Yields Are Lower Than They Should Be
...But 10-Year Treasury Yields Are Lower Than They Should Be
The Stock Market, Interest Rates, And Value Versus Growth Chart I-9The US Equity Market Selloff Has Been Driven By Tech Stocks
The US Equity Market Selloff Has Been Driven By Tech Stocks
The US Equity Market Selloff Has Been Driven By Tech Stocks
The fact that the global equity selloff had been concentrated in the US prior to the escalation in tensions over Ukraine reveals the root cause of the decline. Chart I-9 highlights that the Nasdaq has fallen more than the S&P 500, as have US growth stocks compared with value stocks. As such, the recent selloff in the stock market reflects some of the major themes that we presented in our 2022 annual outlook. We highlighted in our outlook, as well as several previous reports, that the relative performance of global growth versus value since the pandemic has been driven primarily by changes in valuation that could reverse if bond yields rose. Chart I-10 highlights that this is exactly what has occurred over the past month, which also explains the underperformance of US equities given how heavily-weighted the US market is toward broadly-defined technology stocks. However, the underperformance of US growth stocks has occurred within the context of a nontrivial decline in the overall US market, which was somewhat beyond our expectation. We anticipated a period of elevated financial market volatility in advance of the Fed’s first rate hike, and we warned investors that 2022 was likely to be a year of meaningfully lower total returns (mid-to-high single digits) compared with the past two years. The fact that equity multiples for growth stocks are falling in response to higher long-maturity bond yields is not surprising to us. But investors have punished both growth and value stocks as bond yields have risen, behavior that we do not think is justified given the large difference in valuation between the two. Chart I-11 highlights that our (standardized) proxy for the equity risk premium (ERP) is above its 2003-2021 average for value stocks, whereas it is quite low for growth stocks. Had the ERP for value stocks fallen to its historical average this month value stocks would have risen between 1-4% in January despite rising real 10-year government bond yields. And the historically average levels shown in Chart I-11 might themselves be too high, given that other ERP estimates like the ones we showed in our annual outlook highlight that the 2003-2021 period was one in which the US ERP was historically elevated. Chart I-10Value Is Outperforming Growth As Bond Yields Rise, As We Predicted In Our Annual Outlook
Value Is Outperforming Growth As Bond Yields Rise, As We Predicted In Our Annual Outlook
Value Is Outperforming Growth As Bond Yields Rise, As We Predicted In Our Annual Outlook
Chart I-11The ERP For Value Stocks Does Not Need To Rise
The ERP For Value Stocks Does Not Need To Rise
The ERP For Value Stocks Does Not Need To Rise
Chart I-12The Market Is Not Yet Pricing An End To Secular Stagnation, Which Is Good For Stocks
The Market Is Not Yet Pricing An End To Secular Stagnation, Which Is Good For Stocks
The Market Is Not Yet Pricing An End To Secular Stagnation, Which Is Good For Stocks
As noted, part of a generalized rise in the ERP this month relates to the potential Russian invasion of Ukraine, an event that we now see as likely (discussed below). But the sell-off in equity prices also appears to reflect an overall level of investor discomfort with rising interest rates, particularly given the (mistaken) perception amongst investors that Fed hawkishness is entirely driven by elevated inflation. We acknowledge that the Fed’s hawkish shift has been a rapid one, and that this has led US government bond yields to rise quickly. Both the level and change in interest rates matter for economic activity and financial market sentiment, but our view is that the former is more important. Changes in interest rates are mainly significant because they create uncertainty about where rates will ultimately settle, and whether that level would be sustainable for economic activity and the valuation of financial assets. In this respect, Chart I-12 should be encouraging for investors. The chart shows that the 10-year Treasury yield recently reached a new pandemic high, but that this rise was driven by yields on shorter-maturity bonds. 5-year/5-year forward Treasury yields remain 50 basis points below the Fed’s long-term Fed funds rate projection (2.5%), suggesting that the rapid move in US Treasury yields simply reflects a revised pace of rate hikes – not ultimately a higher level. This underscores that the generalized selloff in the US equity market is uncalled for, and that investors should buy the US stock market at current levels. Chart I-13Recession Fears May Rise Early Next Year
Recession Fears May Rise Early Next Year
Recession Fears May Rise Early Next Year
Chart I-13 highlights that an accelerated pace of rate hikes will likely cause the yield curve to be flatter at the end of the year than would have otherwise been the case, which may eventually be interpreted by investors as a sign that a recession is drawing nearer (potentially implicating both value and growth stocks). We discussed this risk in last month’s report, but for now we maintain the view that this is more likely to occur in 2023 rather than this year. The chart highlights that the S&P 500 did not sell off in response to growth/recession concerns in 2018 before the 2/10 yield curve had flattened to 20-30 basis points, which isn’t likely to occur until 1H 2023 according to fair value calculations derived from the FOMC’s rate projections. The Dollar, Chinese Policy, Commodities, And Global Ex-US Stocks Chart I-14Until This Week, The Dollar Had Been Trending Lower Despite Ostensibly Bullish Dollar Factors
Until This Week, The Dollar Had Been Trending Lower Despite Ostensibly Bullish Dollar Factors
Until This Week, The Dollar Had Been Trending Lower Despite Ostensibly Bullish Dollar Factors
Despite the recent surge in US interest rate expectations, and up until last week, the US dollar had behaved in a somewhat strange fashion since late November– even as the Omicron variant spread rapidly around the globe. Chart I-14 highlights that the dollar had traded counter to both relative interest rate differentials and the intensity of the pandemic, both of which appear to have strongly explained the dollar’s trend in the first three quarters of 2021. As we go to press, the US dollar is rallying again, although at least some of the rise is being driven by the prospect of imminent war in Ukraine. We argued in our annual outlook that the dollar was likely to fall this year, and that it was both technically stretched and expensive according to our PPP models. Chart I-15 highlights that the prior weakness in the dollar may also be explained by slowing net foreign purchases of US equities, as the impact of global equity investors flocking to the tech-heavy US market during the pandemic begins to wane. However, we suspect that two additional factors may have been impacting the broad dollar trend before this week’s surge in geopolitical risk. The first is a possible reversal in the correlation between the number of COVID-19 cases and the dollar (from positive to negative). For most of the pandemic, investors have treated new waves of the pandemic as an indication that global growth will slow, which certainly occurred in the services sector this month. But the sheer speed at which the Omicron variant is spreading, in combination with the fact that it causes less severe disease than previous variants, has likely prompted some investors to expect that Omicron has shortened the amount of time to COVID-19 endemicity. An endemic disease, while still a public health issue, would imply less transmission and much less COVID-19-related hospitalization and death. Correspondingly, it would also likely be associated with a significant increase in services spending alongside stronger international travel, which would be positive for global growth (and thus negative for the dollar). Second, it is apparent that China-related assets have caught a bid, as illustrated by our market-based China growth indicator and its accompanying diffusion index (Chart I-16). While the indicators shown in Chart I-16 remain below the boom/bust line, they are rising quickly, and in a manner that suggests investors are reacting to new information. Chart I-15Portfolio Flows Have Likely Put Pressure On The Dollar Over The Past Few Months
Portfolio Flows Have Likely Put Pressure On The Dollar Over The Past Few Months
Portfolio Flows Have Likely Put Pressure On The Dollar Over The Past Few Months
Chart I-16Since November, Optimism Towards China Has Also Likely Weakened The Dollar
Since November, Optimism Towards China Has Also Likely Weakened The Dollar
Since November, Optimism Towards China Has Also Likely Weakened The Dollar
Chart I-17China Bulls Are Probably A Bit Too Early
China Bulls Are Probably A Bit Too Early
China Bulls Are Probably A Bit Too Early
We doubt that investors would be upgrading their outlook for Chinese economic growth based on expectations of COVID-19 endemicity, given the country’s zero-tolerance COVID policy and the inability of the Sinovac vaccine to prevent transmission of Omicron. Therefore, we conclude that investors have become more optimistic about the pace of easing from Chinese policymakers, potentially sparked by a recent pickup in the pace of special purpose local government bond issuance (Chart I-17). We agree with investors that Chinese monetary policy is becoming easier at the margin. For example, the PBoC recently reduced its one-year loan prime rate (LPR) by 10 bps and five-year rate by 5 bps, following last week’s 10bps cut in the 7-day reverse repo and the 1-year Medium-term Lending Facility (MLF) rate. This is on top of December’s 50 bps drop in the reserve requirement ratio (RRR). But we do not think that China’s credit data is yet heralding a meaningfully stronger growth impulse. Panel 2 of Chart I-17 presents the 12-month flow of China’s ex-equity total social financing as a share of nominal GDP, both including and excluding local government bond issuance. The chart highlights that the significant pickup in local government bond issuance has led to only a slight uptick in China’s overall credit impulse. Excluding local government bonds, China’s credit impulse continues to decline, reflecting an impaired monetary policy transmission mechanism and slowing bank loan growth. The implication is that it is too early to position aggressively towards China-sensitive commodities and global ex-US stocks, despite the recent pickup in our market-based growth indicator for China. At least some of the pickup in our market-based indicator reflects passive outperformance of some China-sensitive assets; Chart I-18 highlights that global ex-stocks and industrial metals prices have risen relative to US stock prices over the past month, but mostly because US stocks sold off in reaction to Fed hawkishness. Chart I-19 highlights that industrial metals prices continue to advance in a fashion that is not explained by the pace of China’s credit growth (as has generally been the case over the past decade), suggesting that metals are being somewhat supported by investment demand that is likely being driven by inflation hedging. We noted in our November Special Report that industrial commodities performed well during the stagflationary period of the 1970s,1 and over the past 40 years during months in which stock and bond returns are both negative. This makes metals an ideal portfolio hedge in the current environment, and we suspect that this factor – in addition to global inventory drawdowns last year – have kept prices elevated. Chart I-18Some Of The Rise In Our Market-Based China Growth Indicator Reflects Passive Outperformance
Some Of The Rise In Our Market-Based China Growth Indicator Reflects Passive Outperformance
Some Of The Rise In Our Market-Based China Growth Indicator Reflects Passive Outperformance
Chart I-19Metals Prices Are Higher Than What Chinese Economic Growth Would Imply
Metals Prices Are Higher Than What Chinese Economic Growth Would Imply
Metals Prices Are Higher Than What Chinese Economic Growth Would Imply
However, this also implies that metals prices could sell off at some point over the coming few months if US inflation fears begin to peak and Chinese monetary policy has not yet turned decisively reflationary. We are more comfortable with a bullish view toward industrial metals in the latter half of 2022, and recommend that investors buy metals on any dips in prices. Similarly, while we believe that investors should maintain global ex-US stocks on upgrade watch, we would prefer to see more evidence of a likely acceleration in Chinese economic activity before upgrading. In addition, we would also recommend that investors wait for the Ukrainian situation to play out, given the recent selloff in European stocks in response to the deepening crisis. A Likely War In Ukraine Last week, US President Joe Biden publicly predicted that Russia would likely invade parts of Ukraine, and implied that the sanction response from Western countries might be muted if the invasion were “minor”. Biden’s remarks have since been described as a gaffe, but in our view they were likely accurate. When combined with reports that the White House is warning domestic chipmakers of potential export restrictions to Russia in the event of an invasion, Biden’s remarks suggest that the US government does not believe that a diplomatic solution is likely and that Russia will probably send troops into Ukrainian territory. A full-scale invasion of Ukraine is very unlikely, as it would unite the Western world in delivering crippling economic sanctions towards Russia. The question for investors is whether the economic consequences of a minor incursion have significant enough implications to change one’s 12-month asset allocation stance. The extent of the rise in energy prices following a minor Russian incursion into Ukraine would be the key determinant of the impact that Russian military action would have on financial markets. Russia could withhold natural gas or oil exports to punish Europe if the Nord Stream II pipeline were cancelled. Oil prices would likely rise, even if retaliatory action was limited to the natural gas market, because oil consumption would rise as a substitute. This would further exacerbate the European energy crisis, although as we noted above, the PMI data continues to point to COVID as a more serious near-term threat to European economic activity than energy prices. Our geopolitical strategy team recently upgraded the odds of Russia invading Ukraine from 50% to 75%, suggesting that investors need to decide now whether to reduce risky asset exposure. The invasion has not yet occurred as we go to press, but could happen at any moment. All told, we doubt that a minor invasion will have a lasting, full-year impact on financial markets, but it is likely to have a near-term impact on the performance of some assets. While some of the risk of this event has already been priced in, on a 0-3 month time horizon, the US dollar would likely rally even further in response to an invasion and we suspect that the recent outperformance of global ex-US stocks would reverse (with the US outperforming). Our sense is that global equities may underperform government bonds for a short period following a minor incursion, but that a more aggressive Russian invasion would likely be needed to cause a persistent rise in the US dollar, US equity outperformance, and stocks to underperform bonds on a 12-month time horizon. Investment Conclusions Chart I-20We Expect Further Outperformance Of Value, Within The Context Of A Rising Stock-To-Bond Ratio
We Expect Further Outperformance Of Value, Within The Context Of A Rising Stock-To-Bond Ratio
We Expect Further Outperformance Of Value, Within The Context Of A Rising Stock-To-Bond Ratio
Relative to the investment positions that we presented in our annual outlook report, we see no compelling reason to alter any of our recommendations on a 6-12 month time horizon. Over the nearer-term, a minor Russian incursion of Ukraine is now likely, and may further roil financial markets for a period of time. But the bar for the Ukrainian situation to durably impact returns on a 12-month time horizon is high, and implies a degree of conflict that we do not currently expect. US equities have sold off because of a rise in the discount rate and in the equity risk premium. We do not believe the latter is justified for the market as a whole. Our view that US equities have overreacted to the Fed’s hawkish shift and that long-maturity US bond yields have roughly another 50 basis points of upside this year strongly point to an overweight stance towards stocks versus bonds and a short-duration stance as still justified. We continue to expect that growth stocks will underperform value stocks over the coming year, but in the context of a rising rather than falling overall market (Chart I-20). It is too early to position aggressively toward China-sensitive commodities and global ex-US stocks, but investors should maintain these assets on upgrade watch. The US dollar may continue to reverse some of its recent decline over the coming 3 months in response to military conflict in Ukraine or if investors dial back their expectations for Chinese economic growth, but we expect a lower dollar in a year’s time. Jonathan LaBerge, CFA Vice President The Bank Credit Analyst January 28, 2022 Next Report: February 24, 2022 II. The US Productivity Surge: Less Than Meets The Eye The current surge in US measured productivity looks very unlike what occurred in the mid-to-late 1990s. A detailed breakdown of labor productivity growth points to atypical labor market compositional effects – namely a significant decline in services employment – as being responsible for the apparent rise in productivity. In addition, technological disinflation, a major ingredient of the late 1990s “disinflationary boom”, is absent today. A cross-country comparison of the growth in output per worker during the pandemic can be mostly explained by differences in the fiscal response to the crisis. US output per worker surged compared to other countries, but the US fiscal response also generated a significant amount of excess income to support economic activity – unlike in the euro area, UK, and Japan. Micro-level arguments and some academic studies argue against the idea that work from home arrangements will ultimately be productivity-enhancing. Remote work makes it more difficult for firms to train the next generation of senior employees, which will raise the staffing risks for many businesses. While the long-term outlook for technologically-driven productivity growth is positive, projected commercialization timelines for several well-known technologies under development do not point to an imminent, inflation-offsetting boom in potential output. If inflation remains significantly above target after the pandemic is over, the Fed’s long-term interest rate projections may rise. US stocks would suffer potentially large losses in a scenario where 10-year US Treasury yields rise towards the potential growth rate of the economy. Investors should consider reducing their equity exposure if 5-year, 5-year forward US Treasury yields break above 2.5%. We do not expect that to occur this year, which for now justifies an overweight stance towards risky assets. Chart II-1A Pandemic-Driven Productivity Surge?
A Pandemic-Driven Productivity Surge?
A Pandemic-Driven Productivity Surge?
The behavior of US labor productivity during the COVID-19 pandemic has raised several questions among investors. As defined by output per hour worked, US productivity accelerated significantly over the first six quarters of the COVID-19 pandemic, but then fell sharply in Q3 2021 (Chart II-1). While some market participants have questioned the cause of the recent decline, investors have generally been more interested in the question of whether the US is in the middle of a long-lasting productivity surge that will help alleviate inflationary pressure – akin to what occurred in the second half of the 1990s. In this report, we review the recent surge in US labor productivity in contrast to what occurred in the late-1990s, and then compare it with what has occurred globally. While we are not pessimistic about the pace of technological advancement and its potential to drive long-run productivity, we conclude that the US is not likely experiencing a sustained productivity boom driven by technological adoption during the pandemic. This underscores why investors should not expect a significant increase in potential output owing to the pandemic or its effects. It also highlights that, if elevated inflation in response to strongly positive output gaps were to occur over the coming few years, it would likely be met by significantly tighter fiscal or monetary policy. Today Versus The 1990s: Total Factor Productivity Versus Capital Intensity Chart II-2The Technologically-Driven US Productivity Surge In The 1990s Was A Major Macro Event
The Technologically-Driven US Productivity Surge In The 1990s Was A Major Macro Event
The Technologically-Driven US Productivity Surge In The 1990s Was A Major Macro Event
A technologically-driven surge in productivity growth in the second half of the 1990s was a highly significant macroeconomic event. Chart II-2 highlights that US labor productivity surged to over 3% from 1995 to 2000, alongside a significant deceleration in core PCE inflation and a sizeable acceleration in potential GDP growth. Given the acceleration in measured productivity during the pandemic, and the accompanying rapid adoption (or broader use) of technology, it is easy to see why some investors have questioned whether a 1990s-style productivity boom is underway. However, a detailed breakdown of the 2020 rise in labor productivity growth highlights substantial differences between the current environment and that of the late 1990s, which points instead to compositional effects as the main driver. Improvements in labor productivity can come from smarter workers, an increase in the amount of capital employed per worker, or from technological innovations and better working practices. The US Bureau of Labor Statistics provides a breakdown of the annual change in labor productivity that attempts to capture these three components: The contribution from shifts in labor composition: This measures the productivity impact of changes in the age, education, and gender structure of the labor force. The contribution from capital intensity: This measures the productivity impact of shifts in the amount of capital equipment available per worker. Total factor (or “multifactor”) productivity: This measures the changes in output per hour that cannot be accounted for by the above two factors. Thus, it includes the effects of technological changes, returns to scale, shifts in the allocation of resources, and other changes in operating procedures. Examining the 2020 rise in labor productivity growth along these three factors underscores key differences between the current environment and that of the late 1990s. The first point for investors to note is that the acceleration in labor productivity in 2020 occurred alongside a contraction in total factor productivity (TFP) growth, in contrast to the 1990s when TFP drove labor productivity (Chart II-3). The fact that TFP growth fell in 2020 means that the increase in labor productivity must have occurred either because of labor composition or capital intensity effects. In 2020, labor composition contributed somewhat to accelerating labor productivity, but that most of the increase was caused by a sharp increase in capital intensity. Some of the increase in overall capital intensity occurred because of an increase in the intensity of information processing equipment and intellectual property products (supporting the idea of an increase in pandemic-driven capital deployment), but this was outstripped by the contribution of “other” capital services (Chart II-4). Chart II-3Total Factor Productivity Collapsed In 2020, Unlike In The 1990s
Total Factor Productivity Collapsed In 2020, Unlike In The 1990s
Total Factor Productivity Collapsed In 2020, Unlike In The 1990s
Chart II-4The Surge In US Capital Intensity Reflects A Rapid Compositional Shift In The Labor Market
February 2022
February 2022
The concept of capital intensity refers to the amount of capital available per worker, but in practice it is measured as the ratio of the amount of capital used relative to the amount of labor hours used to produce output. Thus, a surge in capital intensity that is not accounted for by an increase in the amount of tech-related capital available to workers points to a rapid compositional shift in the economy from relatively low capital-intensive industries to relatively high-intensive industries. Under less extreme economic circumstances we would be more inclined to search for other potential causes of a rapid increase in measured capital intensity, but a shift in employment from less to more capital-intensive industries is exactly what has occurred during the pandemic. Services jobs tend to be much more labor-intensive than goods-producing jobs; Chart II-5 highlights that the former fell far more than the latter during the pandemic, in sharp contrast to what normally occurs during a recession (Chart II-6). This phenomenon is also reflected in a highly unusual decline in services spending compared with very strong goods spending relative to their pre-pandemic trend. Chart II-5Employment In Low Capital Intensity Services-Producing Industries Fell Far More Than Goods-Producing
Employment In Low Capital Intensity Services-Producing Industries Fell Far More Than Goods-Producing
Employment In Low Capital Intensity Services-Producing Industries Fell Far More Than Goods-Producing
Chart II-6The Sharp Decline In Services Jobs During The Pandemic Was Unprecedented
The Sharp Decline In Services Jobs During The Pandemic Was Unprecedented
The Sharp Decline In Services Jobs During The Pandemic Was Unprecedented
The takeaway for investors is that the nature of the pandemic and its unique impact on the economy has created the appearance of an acceleration in productivity, when in reality true productivity has fallen and the standard measure of productivity is being flattered by enormous changes in the composition of the labor market. Today Versus The 1990s: IT Investment, And Technological Disinflation The trends in IT investment and prices highlight another major difference between the current environment and that of the late 1990s. Charts II-7 and II-8 highlight recent trends in comparison to those of the 1990s, with the following notable points: Chart II-7There Are Major Differences Between IT Investment And Prices Today Versus The 1990s
There Are Major Differences Between IT Investment And Prices Today Versus The 1990s
There Are Major Differences Between IT Investment And Prices Today Versus The 1990s
Chart II-8A One-Off Move
A One-Off Move
A One-Off Move
The recent pace of real investment in total IT does not point to the pandemic as a sustained source of productivity growth. Real investment in IT has already slowed significantly, in contrast to the 1990s when it accelerated on a sustained basis for years. IT investment as a % of GDP and of total plant and equipment spending has already stopped rising (or is now falling), exhibiting clear signs of a one-off shift and thus undermining the view that IT investment has significantly raised potential output. In pronounced contrast to the mid-1990s when IT equipment prices were collapsing, computing equipment inflation has recently risen into positive territory – to the highest levels recorded since the data became available in 1959. Higher prices for IT equipment clearly reflect, at least in part, pandemic-driven pressure on global supply chains and the production of semiconductors. So we do not expect sustained increases in the price of computing equipment. But the key point for investors is that a major ingredient of the late 1990s “disinflationary boom” is missing today. The US Versus The World We have presented Chart II-9 in previous reports to highlight that there is certainly no evidence of a global productivity surge, using output per worker as a proxy for the standard measure of labor productivity (output per hour worked). Some investors have countered that the US is a more dynamic economy, and that a sustained productivity boom would be more apparent in the US prior to its emergence in other countries. Or simply that the US alone is experiencing a productivity boom that will help reduce very elevated US inflation, with strong implications for Fed policy. Chart II-9During The Pandemic, Cross-Country Changes In Real Output Per Worker…
February 2022
February 2022
Chart II-10…Are Mostly Explained By Different Fiscal Responses
February 2022
February 2022
Chart II-11High US Real Output Per Worker Also Reflects A Lagging Jobs Recovery Relative To Pre-Pandemic Levels
High US Real Output Per Worker Also Reflects A Lagging Jobs Recovery Relative To Pre-Pandemic Levels
High US Real Output Per Worker Also Reflects A Lagging Jobs Recovery Relative To Pre-Pandemic Levels
Charts II-10 and II-11 present a different cross-country comparison that reinforces the view that the US is not likely experiencing a long-lasting productivity surge that will help reduce inflation. Chart II-10 highlights that in the face of a significant decline in employment, US output was supported by a substantial amount of “excess income” – the cumulative amount of household disposable income earned over the course of the pandemic in excess of what would have been predicted based on the pre-pandemic trend. Other major DM economies (such as the UK and euro area) either saw negative excess income or a modestly positive amount (Japan), underscoring that the fiscal response to the pandemic in most advanced economies was aimed at stabilizing income rather than raising it. In combination with Chart II-11 – which highlights that the US labor market recovery has significantly lagged behind the European and Canadian economies in terms of returning to the pre-pandemic employment trend – this would appear to explain why the US has experienced stronger real output per worker than other countries. Chart II-12Given A Similar Fiscal Response, Would The US Have Canada's Job Recovery If It Had Less COVID Cases?
Given A Similar Fiscal Response, Would The US Have Canada's Job Recovery If It Had Less COVID Cases?
Given A Similar Fiscal Response, Would The US Have Canada's Job Recovery If It Had Less COVID Cases?
Canada stands out as the outlier compared with the US, in the sense that it’s growth in real output per worker has been much lower but Canadian fiscal policy created a similar amount of excess income. However, it may be the case that the Canadian experience highlights that the US labor market recovery is the outlier, which could imply that the surge in US labor productivity may in fact have inflationary rather than disinflationary consequences at the margin. We discussed the factors that we believe are driving the slow recovery in the US working-age population in our 2022 annual outlook report, and how they are strongly linked to the pandemic. However, Canada has also clearly been affected by COVID-19, and yet it has experienced a more significant recovery in jobs. Chart II-12 highlights that there has been one major difference between the US and Canada during the pandemic: a substantial gap in the burden of disease from COVID-19. This raises the question of whether Canada has outperformed the US in terms of its labor market recovery, despite a similarly impactful fiscal response, because of a smaller labor shortage stemming from long-term COVID symptoms. Over the past two years, there have been many reports about people who have recovered from COVID but who continue to experience some symptoms of the disease. The medical community has labeled this condition as post-acute sequelae of SARS-CoV-2 infection (PASC), colloquially referred to as “long COVID.” Chart II-13Long-COVID Might Help Explain The US’ Lagged Return To Pre-Pandemic Employment
February 2022
February 2022
The medical community’s understanding of long COVID is currently poor, and doctors do not know why some people get the condition or what treatment options are likely to be the most effective. Given this, it is possible that some reports of long COVID are, in fact, related to other conditions. But a recent research report from Brookings estimated that the US labor market may be missing 1.6 million workers because of long COVID’s effects (Chart II-13), which alone would account for 1 percentage point (or roughly 1/4th) of the growth in US real output per worker since the pandemic began. This circumstance would be inflationary rather than disinflationary on the margin, as it would imply that accelerating first and second quartile US wage growth may be sticky even as the pandemic recedes. Is Working From Home Positive For Productivity? We have noted above that the macro data argues against the idea of a sustained rise in US productivity stemming from the pandemic. A more micro-level perspective, one that examines the working-from-home (WFH) experience, also appears to support our case. It is true that surveys of employees highlight that their experience of WFH has been significantly better on average than workers expected and report their being more productive while working from home during the pandemic. Chart II-14 emphasizes that, based on the running surveys from Barrero, Bloom, and Davis (“BBD”), 60% of workers have conveyed better WFH outcomes relative to expectations, versus just 14% reporting worse outcomes. In addition, Chart II-15 clearly highlights that workers prefer at least some form of hybrid WFH arrangement, with just 22% of survey respondents reporting the desire to work from home either rarely or never. Chart II-14Remote Workers Have Reported Better Work-From-Home Outcomes Than What Was Expected
February 2022
February 2022
Chart II-15Remote Workers Clearly Prefer A Hybrid Work Model
February 2022
February 2022
However, worker preferences do not necessarily correlate with productivity gains, at least not to the same degree. Chart II-16 from the BBD surveys highlights that the share of workers reporting more efficiency while working from home is not as large as those reporting better outcomes relative to expectations, suggesting that employees are considering whether WFH arrangements are benefiting them personally when responding to their desired post-pandemic level of remote work. Chart II-17 also shows that employees working from home only spend a third of the time ordinarily allocated to commuting to working on their primary job; the rest is spent on childcare, leisure, home improvement, or working on a second job (which may or may not be a sustainable source of income). Chart II-16Less Than Half Of Workers Report Being More Efficient While Working Remotely
February 2022
February 2022
Chart II-17Only 1/3rd Of Time Saved Commuting Is Spent On Primary Employment
February 2022
February 2022
There is also some evidence from academic studies that indicates productivity fell during the pandemic for some remote workers. Michael Gibbs, Friederike Mengel, and Christoph Siemroth (2021) surveyed 10,000 professionals at a large Asian IT services company, and found that productivity declined because of a slight decline in average output and a rise in hours worked.2 Admittedly, elements of the study did point to some factors potentially impacting this decline in productivity that were more prominent in the earlier phase of the pandemic, specifically the issue of childcare (which would not likely be a drag on remote worker productivity in a post-pandemic environment). But it also noted that employees with a longer company tenure fared better, which in our view is an often overlooked element of remote work that points to less future productivity gains from WFH arrangements than may be recognized by investors. The outperformance of senior staff in a WFH environment is not particularly surprising: once employees have accrued significant experience, they spend less of their working time learning and more (or all) of their working time “doing.” It makes sense that employees who predominantly “platform” their existing experience may fare the same or better in a WFH arrangement, but it is highly questionable whether it is sustainable, because it makes it much more difficult for businesses to train the next generation of senior employees. The Gibbs, Mengel, and Siemroth study noted that higher communication and coordination costs featured prominently in their findings of reduced remote worker productivity. Importantly, they found that employees communicated with fewer individuals and business units, both inside and outside the firm, and received less coaching and one-to-one meetings with supervisors. While some firms may be able to mitigate these risks to the advancement and development of more junior staff while maintaining a hybrid on-site / WFH model, we suspect that many firms will fail to do so fully. Future Productivity: Pessimism Unwarranted, But No Inflation Salvation The fact that the US is not likely in the middle of a pandemic-driven productivity boom does not mean that the outlook for productivity is poor. In fact, we would point to two factors that lead us to believe that productivity growth will be better in the future than it has been over the past decade: The pronounced consumer deleveraging phase that existed for several years following the global financial crisis is over, and There are several identifiable technologies currently under development that are likely to have legitimate commercial applications and productivity-enhancing benefits in the future On the first point, we have contended in previous reports that the weak productivity growth observed during the first half of the last economic expansion was because of demand rather than supply-side factors. This notion is jarring for many investors, who are accustomed to think of productivity trends as being exclusively driven by supply-side phenomena. This is typically correct, in that the cyclical impact of fluctuating aggregate demand on measured productivity – particularly during and immediately after recessions – is usually temporary in nature. However, the 2008/2009 recession was highly atypical, in the sense that it was a household “balance sheet” recession rather than a normal “income” recession. This led to a prolonged period of US household deleveraging, below-average corporate sales growth, and poor growth in output per hour worked. In effect, the post-2008 deleveraging phase created a long-lasting, multi-year cyclical effect on measured productivity growth. In early-2009, pessimistic investors held to an understandable reason for why they doubted the sustainability of the economic recovery: there could be no meaningful labor market recovery if businesses expected several years of weak demand because of the likelihood of consumer deleveraging. In this respect, the post-2008 period served as an important natural experiment for macroeconomists and investors: we have learned that the response of firms to a durable but shallow economic recovery is, on the one hand, to hire additional workers, but, on the other hand, also to control wage and salary costs aggressively. Chart II-18Slow Productivity Growth Last Cycle Was A Demand Story, Not A Supply Story
February 2022
February 2022
Chart II-18 encapsulates the point that weak productivity during the last economic cycle was closely tied to US household deleveraging. The chart highlights that the decline in total factor productivity due to goods-producing industries – heavily concentrated in manufacturing – was much larger than for private services from 2007 to 2019. Since there was no technological slowdown that disproportionally impacted the manufacturing industry during the period, this clearly points to demand-side rather than supply-side factors as the main driver of the post-GFC productivity slowdown. On the second point about future productivity growth, Table II-1 outlines five well-known technologies that are in various stages of development and are likely to lead to significant applications at some point in the future: artificial intelligence, automated driving (a specific application of AI), quantum computing, augmented/virtual reality and human-machine interface, and CRISPR/gene editing. The table outlines the nature of potential future applications, as well as projections from McKinsey Global Institute about the most likely commercialization timeline. Table II-1Technological Advancement Is Ongoing. It Won’t Likely Help Fight Inflation Over The Next Few Years
February 2022
February 2022
A detailed analysis of each of these technologies is beyond the scope of this report, but Table II-1 underscores two key points for investors. The first is that further, technologically-driven productivity growth is not just possible, it is likely. It is clear what advancements will probably drive these productivity gains, and Table II-1 highlights only the most well-known technologies to which experts in the field would point to. The second point is that most major changes from these technologies are projected to occur beyond 2025, and, in many cases, beyond this decade. In the case of quantum computing, while it could potentially lead to an explosion of algorithmic power that would almost certainly have major commercial implications, it is even possible that this technology will initially subtract from total factor productivity growth before contributing positively. This is because of its potential to render much of the existing global internet security and privacy infrastructure useless, as highlighted by a NIST Cybersecurity White Paper last April: “Continued progress in the development of quantum computing foreshadows a particularly disruptive cryptographic transition. All widely used public-key cryptographic algorithms are theoretically vulnerable to attacks based on Shor’s algorithm, but the algorithm depends upon operations that can only be achieved by a large-scale quantum computer. Practical quantum computing, when available to cyber adversaries, will break the security of nearly all modern public-key cryptographic systems.”3 Some experts believe that the preparation required to avoid this outcome may dwarf that of the millennium bug (“Y2K”) problem of the late-1990s,4 which cost roughly 1% of GDP to fix – and thus was clearly not productivity-enhancing. The bottom line for investors is that while the long-term outlook for technologically-driven productivity growth is bright, it is unlikely to save the US and/or global economies from elevated inflation over the next several years if output gaps in advanced economies rise to strongly positive levels in the wake of the pandemic. Investment Conclusions Our analysis above has highlighted that the current surge in measured productivity looks very unlike what occurred in the mid-to-late 1990s, and that very atypical labor market compositional effects are likely responsible for the apparent rise in labor productivity. We have also highlighted that a cross-country comparison of the growth in output per worker during the pandemic can be mostly explained by differences in the fiscal response to the pandemic, and that there are micro-level arguments against the idea that work from home arrangements are productivity-enhancing. Finally, while the long-term outlook for technologically-driven productivity growth is positive, projected commercialization timelines for several well-known technologies under development do not point to an imminent, inflation-offsetting boom in potential output. While we believe that the COVID-19 pandemic will recede in importance this year, it is not yet over. As such, investors do not yet know how strong the output gap in the US and other advanced economies will be on average over the coming two to three years, or what the pace of consumer price inflation will look like in the face of strong aggregate demand but substantially lower (or no) pressure from the supply-side of the economy (as we expect). Chart II-19There Is A Lot Of Downside For Stocks If Bond Yields Rise To Potential Growth Rates
There Is A Lot Of Downside For Stocks If Bond Yields Rise To Potential Growth Rates
There Is A Lot Of Downside For Stocks If Bond Yields Rise To Potential Growth Rates
In a scenario in which aggregate demand remains strong next year and inflation remains above-target, even in the face of Fed tightening and a normalization in services/goods spending, we would expect to see significantly tighter fiscal or monetary policy. This is a scenario in which the secular stagnation narrative, which underpins the Fed’s low long-term interest rate projection, would likely be aggressively challenged by investors. Chart II-19 highlights that US equities would potentially suffer a 24% contraction in the forward P/E in a scenario in which the equity risk premium is in line with its historical average and 10-year US Treasury yields rise to the potential growth rate of the economy. We do not yet believe that a significant rise in long-term interest rate expectations will occur this year, meaning that investors should still be overweight stocks versus government bonds over the coming 6-12 months. But as we noted in last month’s report, we may recommend that investors reduce their equity exposure if 5-year, 5-year forward Treasury yields break above 2.5% (the FOMC’s long-run Fed funds rate projection), which we noted in Section 1 of our report is 50 basis points above current levels. Jonathan LaBerge, CFA Vice President The Bank Credit Analyst III. Indicators And Reference Charts BCA’s equity indicators highlight that the “easy” money from expectations of an eventual end to the pandemic have already been made. Our valuation, and sentiment indicators remain very extended, highlighting that investors should expect positive but relatively modest returns from stocks over the coming 6-12 months. Our technical indicator has declined from extremely overbought levels in response to January’s US equity sell-off, but it has not yet reached oversold territory. Still, we believe that the equity market’s reaction to rising bond yields is overdone, especially for value stocks. Forward equity earnings are pricing in a substantial further rise in earnings per share. Net earnings revisions and net positive earnings surprises have rolled over, but from extremely elevated levels and there is no meaningful sign yet of a decline in the level of forward earnings. Bottom-up analyst earning expectations remain too high, but stocks are still likely to be supported by robust revenue growth over the coming year. Within a global equity portfolio, we continue to recommend that investors position for the underperformance of financial assets that are negatively correlated with long-maturity government bond yields (such as growth stocks). The 10-Year Treasury Yield has broken convincingly above its 200-day moving average following the Fed’s hawkish shift, but remains below the fair value implied by our bond valuation index and the FOMC-implied fair value in a March 2022 rate hike scenario. We continue to expect that long-maturity bond yields will move higher over the coming year. Commodity prices remain elevated, and our composite technical indicator highlights that they remain overbought. An eventual slowdown in US goods spending, coupled with eventual supply-chain normalization, could weigh on commodity prices at some point over the coming 6-12 months. We are more comfortable with a bullish view towards industrial metals in the latter half of 2022. US and global LEIs have rolled over from very elevated levels. Our global LEI diffusion index has declined very significantly, but this likely reflects the outsized impact of a few emerging market countries (whose vaccination progress is still lagging). Still-strong leading and coincident indicators underscore that the global demand for goods is robust, and that output gaps are negative in many advanced economies because of very weak services spending. The latter will recover significantly at some point over the coming year, as the severity of the pandemic wanes. EQUITIES: Chart III-1US Equity Indicators
US Equity Indicators
US Equity Indicators
Chart III-2Willingness To Pay For Risk
Willingness To Pay For Risk
Willingness To Pay For Risk
Chart III-3US Equity Sentiment Indicators
US Equity Sentiment Indicators
US Equity Sentiment Indicators
Chart III-4US Stock Market Breadth
US Stock Market Breadth
US Stock Market Breadth
Chart III-5US Stock Market Valuation
US Stock Market Valuation
US Stock Market Valuation
Chart III-6US Earnings
US Earnings
US Earnings
Chart III-7Global Stock Market And Earnings: Relative Performance
Global Stock Market And Earnings: Relative Performance
Global Stock Market And Earnings: Relative Performance
Chart III-8Global Stock Market And Earnings: Relative Performance
Global Stock Market And Earnings: Relative Performance
Global Stock Market And Earnings: Relative Performance
FIXED INCOME: Chart III-9US Treasurys And Valuations
US Treasurys And Valuations
US Treasurys And Valuations
Chart III-10Yield Curve Slopes
Yield Curve Slopes
Yield Curve Slopes
Chart III-11Selected US Bond Yields
Selected US Bond Yields
Selected US Bond Yields
Chart III-1210-Year Treasury Yield Components
10-Year Treasury Yield Components
10-Year Treasury Yield Components
Chart III-13US Corporate Bonds And Health Monitor
US Corporate Bonds And Health Monitor
US Corporate Bonds And Health Monitor
Chart III-14Global Bonds: Developed Markets
Global Bonds: Developed Markets
Global Bonds: Developed Markets
Chart III-15Global Bonds: Emerging Markets
Global Bonds: Emerging Markets
Global Bonds: Emerging Markets
CURRENCIES: Chart III-16US Dollar And PPP
US Dollar And PPP
US Dollar And PPP
Chart III-17US Dollar And Indicator
US Dollar And Indicator
US Dollar And Indicator
Chart III-18US Dollar Fundamentals
US Dollar Fundamentals
US Dollar Fundamentals
Chart III-19Japanese Yen Technicals
Japanese Yen Technicals
Japanese Yen Technicals
Chart III-20Euro Technicals
Euro Technicals
Euro Technicals
Chart III-21Euro/Yen Technicals
Euro/Yen Technicals
Euro/Yen Technicals
Chart III-22Euro/Pound Technicals
Euro/Pound Technicals
Euro/Pound Technicals
COMMODITIES: Chart III-23Broad Commodity Indicators
Broad Commodity Indicators
Broad Commodity Indicators
Chart III-24Commodity Prices
Commodity Prices
Commodity Prices
Chart III-25Commodity Prices
Commodity Prices
Commodity Prices
Chart III-26Commodity Sentiment
Commodity Sentiment
Commodity Sentiment
Chart III-27Speculative Positioning
Speculative Positioning
Speculative Positioning
ECONOMY: Chart III-28US And Global Macro Backdrop
US And Global Macro Backdrop
US And Global Macro Backdrop
Chart III-29US Macro Snapshot
US Macro Snapshot
US Macro Snapshot
Chart III-30US Growth Outlook
US Growth Outlook
US Growth Outlook
Chart III-31US Cyclical Spending
US Cyclical Spending
US Cyclical Spending
Chart III-32US Labor Market
US Labor Market
US Labor Market
Chart III-33US Consumption
US Consumption
US Consumption
Content Chart III-34US Housing
US Housing
US Housing
Chart III-35US Debt And Deleveraging
US Debt And Deleveraging
US Debt And Deleveraging
Chart III-36US Financial Conditions
US Financial Conditions
US Financial Conditions
Chart III-37Global Economic Snapshot: Europe
Global Economic Snapshot: Europe
Global Economic Snapshot: Europe
Chart III-38Global Economic Snapshot: China
Global Economic Snapshot: China
Global Economic Snapshot: China
Jonathan LaBerge, CFA Vice President The Bank Credit Analyst Footnotes 1 Please see The Bank Credit Analyst "Gauging The Risk Of Stagflation," dated October 29, 2021, available at bca.bcaresearch.com 2 Michael Gibbs, Friederike Mengel, and Christoph Siemroth. “Work from Home & Productivity: Evidence from Personnel & Analytics Data.” Working Paper No. 2021-56. July 13, 2021. Pp. 1-30. 3 William Barker, William Polk, and Murugiah Souppaya. “Getting Ready for Post-Quantum Cryptography: Exploring Challenges Associated with Adopting and Using Post-Quantum Cryptographic Algorithms.” National Institute of Standards and Technology, US Department of Commerce. April 28, 2021. Pp. 1-7. 4 Jonathan Ruane, Andrew McAfee, and William Oliver. “Quantum Computing for Business Leaders.” Harvard Business Review, January-February 2022.