Policy

Highlights The selloff in equities since the start of the year marks a long overdue correction rather than the start of a bear market. Stocks often suffer a period of indigestion when bond yields rise suddenly, but usually bounce back as long as yields do not move into economically restrictive territory. BCA’s bond strategists expect the 10-year yield to rise to 2%-to-2.25% by the end of the year, which is well below the level that could trigger a recession. While valuations in the US remain stretched, they are much more favorable abroad. Investors should overweight non-US markets, value stocks, and small caps in 2022. Go long homebuilders versus the S&P 500. US homebuilders are trading at only 6.5-times forward earnings and will benefit from tight housing supply conditions and a moderation in input costs. FAQ On Recent Market Action The selloff in stocks since the start of the year has garnered a lot of attention. In this week’s report, we address some of the key questions clients are asking. Q: What do you see as the main reasons for the equity selloff? A: At the start of the year, the S&P 500 had gone 61 straight weeks without experiencing a 6% drawdown, the third longest stretch over the past two decades. Stocks were ripe for a pullback. The backup in bond yields provided a catalyst for the sellers to come out. Not surprisingly, growth stocks fell hardest, as they are most vulnerable to changes in the long-term discount rate. At last count, the S&P 500 Growth index was down 13.7% YTD, compared to 4.1% for the Value index. Our research has found that stocks often suffer a period of indigestion when bond yields rise suddenly, but usually bounce back as long as yields do not move into economically restrictive territory (Table 1). BCA’s bond strategists expect the 10-year yield to rise to 2%-to-2.25% by the end of the year, which is well below the level that could trigger a recession. Table 1As Long As Bond Yields Don’t Rise Into Restrictive Territory, Stocks Should Recover
A Correction Not A Bear Market
A Correction Not A Bear Market
Historically, equity bear markets have coincided with recessions (Chart 1). Corrections can occur outside of recessionary periods, but for stocks to go down and stay down, corporate earnings need to fall. That almost never happens unless there is a major economic downturn (Chart 2). In fact, the only time in the last 50 years the US stock market fell by more than 20% outside of a recessionary environment was in October 1987. Chart 1Recessions And Bear Markets Tend To Go Hand In Hand
Recessions And Bear Markets Tend To Go Hand In Hand
Recessions And Bear Markets Tend To Go Hand In Hand
Chart 2Business Cycles Drive Earnings
Business Cycles Drive Earnings
Business Cycles Drive Earnings
Chart 3The Bull-Bear Ratio Is Below Its Pandemic Lows
The Bull-Bear Ratio Is Below Its Pandemic Lows
The Bull-Bear Ratio Is Below Its Pandemic Lows
It is impossible to know when this correction will end. However, considering that the bull-bear spread in this week’s AAII survey fell below the trough reached both in March 2020 and December 2018, our guess is that it will be sooner rather than later (Chart 3). With global growth likely to remain solid, equity prices should rise. Q: What gives you confidence that growth will hold up? A: Households are sitting on a lot of excess savings – $2.3 trillion in the US and a similar amount abroad. That is a lot of dry powder. Banks are also actively looking to expand credit, as the recent easing in lending standards demonstrates (Chart 4). Leading indicators of capital spending are at buoyant levels (Chart 5). Chart 4US Banks Are Easing Lending Standards
US Banks Are Easing Lending Standards
US Banks Are Easing Lending Standards
Chart 5The Outlook For US Capex Is Bright
The Outlook For US Capex Is Bright
The Outlook For US Capex Is Bright
It is striking how well the global economy has handled the Omicron wave. While service PMIs have come down, manufacturing PMIs have remained firm. In fact, the euro area manufacturing PMI reached 59 in January versus expectations of 57.5. It was the strongest manufacturing print for the region since August. The manufacturing PMI also ticked up slightly in Japan. The China Caixin/Markit PMI and the official PMI published by the National Bureau of Statistics also ticked higher. After dipping below zero last August, the Citi global economic surprise index has swung back into positive territory (Chart 6). Chart 6The Omicron Wave Did Not Drag Down The Global Economy
The Omicron Wave Did Not Drag Down The Global Economy
The Omicron Wave Did Not Drag Down The Global Economy
Markets are also not pricing in much of a growth slowdown (Chart 7). Growth-sensitive industrial stocks have outperformed the overall index by 1.1% in the US so far this year. EM equities have outperformed the global benchmark by 5.9%. The Bloomberg Commodity Spot index has risen 7.2%. Credit spreads have barely increased. Chart 7Markets Are Not Discounting Much Of A Growth Slowdown
Markets Are Not Discounting Much Of A Growth Slowdown
Markets Are Not Discounting Much Of A Growth Slowdown
Q: What is your early read on the earnings season? A: Nothing spectacular, but certainly not bad enough to justify the steep drop in equity prices. According to Refinitiv, of the 145 S&P 500 companies that have reported Q4 earnings, 79% have beat analyst expectations while 19% reported earnings below expectations. Usually, 66% of companies report earnings above analyst estimates, while 20% miss expectations. In aggregate, the reported earnings are coming in 3.2% above estimates, slightly lower than the historic average of 4.1%. Guidance has been lackluster. However, outside of a few tech names like Netflix, earnings disappointments have generally been driven by higher-than-expected expenses, rather than weaker sales. Overall EPS estimates for 2022 have climbed 0.4% in the US and by 1.1% in foreign markets since the start of the year (Chart 8). Q: To the extent that the Fed is trying to engineer tighter financial conditions, doesn’t this imply that stocks must continue falling? A: That would be true if the Fed really did want to tighten financial conditions, either via lower stock prices, a stronger dollar, higher bond yields, or wider credit spreads. However, we do not think that this is what the Fed wants. Despite all the chatter about inflation, the 5-year/5-year forward TIPS breakeven inflation rate has fallen to 2.05%, which is 25 basis points below the bottom end of the Fed’s comfort zone (Chart 9).1 Chart 8Earnings Expectations Have Not Been Revised Lower
Earnings Expectations Have Not Been Revised Lower
Earnings Expectations Have Not Been Revised Lower
Chart 9Market-Based Long-Term Inflation Expectations Are Below The Fed's Comfort Zone
Market-Based Long-Term Inflation Expectations Are Below The Fed's Comfort Zone
Market-Based Long-Term Inflation Expectations Are Below The Fed's Comfort Zone
Chart 10The Terminal Fed Funds Rate Seen At 2%-2.5%
The Terminal Fed Funds Rate Seen At 2%-2.5%
The Terminal Fed Funds Rate Seen At 2%-2.5%
Chart 11The Market Thinks The Fed Will Not Be Able To Lift Rates Above 2%
The Market Thinks The Fed Will Not Be Able To Lift Rates Above 2%
The Market Thinks The Fed Will Not Be Able To Lift Rates Above 2%
Remember that the Fed’s estimate of the neutral rate, R*, is very low. The Fed thinks it will only be able to raise rates to 2.5% during this tightening cycle, which would barely bring real rates into positive territory (Chart 10). The market does not think the Fed will be able to raise rates to even 2% (Chart 11). The last thing the Fed wants to do is inadvertently invert the yield curve. In the past, an inverted yield curve has reliably predicted a recession (Chart 12). Chart 12A Yield Curve Inversion Usually Signals The End Of A Business Cycle (And Can Even Predict A Pandemic)
A Yield Curve Inversion Usually Signals The End Of A Business Cycle (And Can Even Predict A Pandemic)
A Yield Curve Inversion Usually Signals The End Of A Business Cycle (And Can Even Predict A Pandemic)
The Fed is about to start raising rates and shrinking its balance sheet not because it wants to slow growth, but because it wants to maintain its credibility. While the Fed will never admit it, it is very much attuned to the direction in which the political winds are blowing. The rise in inflation, and the Fed’s failure to predict it, has been embarrassing for the FOMC. Doing nothing is no longer an option. However, doing “something” does not necessarily imply having to raise rates more than the market is already discounting. Contrary to the consensus view that the Fed has turned hawkish, we think that the main takeaway from this week’s FOMC meeting is that Jay Powell, aka Nimble Jay, wants more flexibility in how the Fed conducts monetary policy. This makes perfect sense, as layer upon layer of forward guidance merely served to confuse market participants while unnecessarily tying the Fed’s hands. Q: How confident are you that inflation will fall without a meaningful tightening in financial conditions? A: If we are talking about a horizon of 2-to-3 years, not very confident. As we discussed two weeks ago in a report entitled The New Neutral, the interest rate consistent with stable inflation and full employment is substantially higher than either the Fed believes or the market is pricing in. This means that the Fed is likely to keep rates too low for too long. However, if we are talking about a 12-month horizon, there is a high probability that inflation will fall dramatically, even if monetary policy stays very accommodative. Today’s inflation is largely driven by rising durable goods prices. Durables are the one category of the CPI basket where prices usually fall over time, so this is not a sustainable source of inflation (Chart 13). As demand shifts back from goods to services and supply bottlenecks abate, durable goods inflation will wane. Chart 14 shows that the price indices for a number of prominent categories of goods – including new and used vehicles, furniture and furnishings, building supplies, and IT equipment – are well above their trendlines. Not only is inflation in these categories likely to fall, but it is apt to turn negative, as the absolute level of prices reverts back to trend. This will put significant downward pressure on inflation. Chart 13Durable Goods Prices Are The Main Driver Of Inflation
Durable Goods Prices Are The Main Driver Of Inflation
Durable Goods Prices Are The Main Driver Of Inflation
Chart 14Some Of These Prices Will Fall Outright
Some Of These Prices Will Fall Outright
Some Of These Prices Will Fall Outright
Chart 15Wage Growth Has Picked Up, Especially At The Bottom Of The Income Distribution
Wage Growth Has Picked Up, Especially At The Bottom Of The Income Distribution
Wage Growth Has Picked Up, Especially At The Bottom Of The Income Distribution
Granted, service inflation will accelerate this year as the labor market continues to tighten. However, rising service inflation is unlikely to offset falling goods inflation. While wage growth has accelerated, wage pressures have been concentrated at the bottom end of the wage distribution (Chart 15). According to the Census Household Pulse Survey, a record 8.75 million workers – many of them in relatively low-paid service jobs – were not working in the second week of January due to pandemic-related reasons (Chart 16). As the Omicron wave fades, most of these workers will re-enter the labor force. This should help boost labor participation among low-wage workers, which has recovered much less than for higher paid workers (Chart 17). Chart 16The Pandemic Is Still Affecting Labor Supply
The Pandemic Is Still Affecting Labor Supply
The Pandemic Is Still Affecting Labor Supply
Chart 17Employment In Low-Wage Industries Has Not Fully Recovered
Employment In Low-Wage Industries Has Not Fully Recovered
Employment In Low-Wage Industries Has Not Fully Recovered
Q: Tensions between Ukraine and Russia have risen to a fever pitch. Could this destabilize global markets? Chart 18Valuations Matter For Long-Term Returns
Valuations Matter For Long-Term Returns
Valuations Matter For Long-Term Returns
A: In a note published earlier today, Matt Gertken, BCA’s Chief Geopolitical Strategist, increased his odds that Russia will invade Ukraine from 50% to 75%. However, of that 75% war risk, he gives only 10% odds to Russia invading and conquering all of Ukraine. A much more likely scenario is one where Russia invades Donbas and perhaps a few other regions in Eastern or Southern Ukraine where there are large Russian-speaking populations and/or valuable coastal territory. While such a limited incursion would still invite sanctions from the West, Matt does not think that Russia will retaliate by cutting off oil and natural gas exports to Europe. Not only would such a retaliation deprive Russia of its main source of export earnings, but it could lead to a hostile response from countries such as Germany which so far have pushed for a more measured approach than the US has championed. Q: Valuations are still very stretched. Even if the conflict in Ukraine does not spiral out of control and the goldilocks macroeconomic scenario of above-trend global growth and falling inflation comes to pass, hasn’t much of the good news already been discounted? A: US stocks are quite pricey. Both the Shiller PE ratio and households’ allocations to equities point to near-zero total returns for stocks over a 10-year horizon (Chart 18). That said, valuations are not a useful timing tool. The business cycle, rather than valuations, tends to dictate the path of stocks over medium-term horizons of 6-to-12 months (Chart 19). Chart 19AThe Business Cycle Drives The Stock Market Over Medium-Term Horizons (I)
The Business Cycle Drives The Stock Market Over Medium-Term Horizons (I)
The Business Cycle Drives The Stock Market Over Medium-Term Horizons (I)
Chart 19BThe Business Cycle Drives The Stock Market Over Medium-Term Horizons (II)
The Business Cycle Drives The Stock Market Over Medium-Term Horizons (II)
The Business Cycle Drives The Stock Market Over Medium-Term Horizons (II)
Moreover, stocks are not expensive everywhere. While US equities trade at 20.8-times forward earnings, non-US stocks trade at a more respectable 14.1-times. The valuation gap is even more extreme based on other measures such as normalized earnings, price-to-book, and price-to-sales (Chart 20). Chart 20AUS Stocks Are Trading At A Significant Premium To Their Non-US Peers (I)
US Stocks Are Trading At A Significant Premium To Their Non-US Peers (I)
US Stocks Are Trading At A Significant Premium To Their Non-US Peers (I)
Chart 20BUS Stocks Are Trading At A Significant Premium To Their Non-US Peers (II)
US Stocks Are Trading At A Significant Premium To Their Non-US Peers (II)
US Stocks Are Trading At A Significant Premium To Their Non-US Peers (II)
In terms of equity styles, both small caps and value stocks trade at a substantial discount to large caps and growth stocks (Chart 21). We recommend that investors overweight these cheaper areas of the market in 2022. Trade Recommendation: Go Long US Homebuilders Versus The S&P 500 US homebuilder stocks have fallen by 19.4% since December 10th. Beyond the general market malaise, worries about rising mortgage rates and soaring input costs have weighed on the sector. Yet, current valuations more than adequately discount these risks. The sector trades at 6.5-times forward earnings, a steep discount to the S&P 500. Whereas demand for new homes is near record high levels according to the National Association of Home Builders (NAHB) survey, the homeowner vacancy rate is at a multi-decade low. The supply of recently completed new homes is half of what it was on the eve of the pandemic (Chart 22). With demand continuing to outstrip supply, home prices will maintain their upward trend. As building material prices stabilize and worries about an overly aggressive Fed recede, homebuilder stocks will rally. Chart 21Value Stocks And Small Caps Are Cheap
Value Stocks And Small Caps Are Cheap
Value Stocks And Small Caps Are Cheap
Chart 22US Homebuilders Looking Attractive
US Homebuilders Looking Attractive
US Homebuilders Looking Attractive
Peter Berezin Chief Global Strategist peterb@bcaresearch.com Footnotes 1 The Federal Reserve targets an average inflation rate of 2% for the personal consumption expenditures (PCE) index. The TIPS breakeven is based on the CPI index. Due to compositional differences between the two indices, CPI inflation has historically averaged 30-to-50 basis points higher than PCE inflation. This is why the Fed effectively targets a CPI inflation rate of about 2.3%-to-2.5%. Global Investment Strategy View Matrix
A Correction Not A Bear Market
A Correction Not A Bear Market
Special Trade Recommendations Current MacroQuant Model Scores
A Correction Not A Bear Market
A Correction Not A Bear Market
HighlightsUpgrade odds of Russia invading Ukraine from 50% to 75%. The US and allies are transferring arms to Ukraine while seeking alternate energy supply for Europe.Of the 75% war risk, we give 10% odds to Russia conquering all of Ukraine, as discussed in our “Five Black Swans For 2022.” Russia’s limited war aims worked in 2014 and President Putin tends to take calculated military risks. Full-scale invasion would force the West to unify.The remaining 25% goes to diplomatic resolution. It appears that the US is not offering Russia sufficient security guarantees. Ukrainian leaders do not have a domestic mandate to surrender and have not done so for eight years. Russia cannot accept the status quo now that it has made armed demands for big change.Our third key view for 2022 – that oil producing states have geopolitical leverage – is vividly on display.Tactically stay defensive. But cyclically stay invested. Book 10% gain on long DM Europe / short EM Europe. Book a 8.6% gain on long CAD-RUB.FeatureUkraine’s economy is small but investors rightly worry that an expansion of the still simmering 2014 war there will cause Europe’s energy supply to tighten, pushing up prices and dragging on European demand. Russia would cut off natural gas to Ukraine, which would cut off 6.6% of Europe’s natural gas imports, 18% of Germany’s, 77% of Hungary’s, and 38% of Italy’s (Chart 1). Chart 1Ukraine Hinges On Germany
All Bets Are Off ... Well, Some (A GeoRisk Update)
All Bets Are Off ... Well, Some (A GeoRisk Update)
If Europe retaliates against Russia with crippling sanctions, Russia and Belarus could conceivably cut off another 20% of Europe’s imports and 60% of Germany’s imports. The Czech Republic, Finland, and Hungary get almost 100% of their natural gas from Ukraine and Russia, while Finland, Poland, and Hungary get more than half of their oil from Russia. In other words, Europe will try to avoid war and try to limit sanctions so that Russia does not further reduce supply.Yet Russia, if waging war, will prefer to receive revenues from Europe, as long as Europe is still buying. Thus Russia will keep its military aims limited so that Germany and other countries have a basis for watering down sanctions to keep the energy flowing and avoid a recession. The US has already committed to sweeping sanctions against Russia and is much more likely to follow through (though President Biden also wants to avoid an energy shock ahead of midterm elections).Energy consumption amounts to only 2% of European GDP, though it could rise to 5% in the event of a shock, as our European Investment Strategist Mathieu Savary has shown. This number would not be far from the 7% reached in 2008, which coincided with financial crisis and recession. All of Europe will suffer from high prices, not only those that import via Ukraine, and Europe’s supply squeeze would push up global prices as well. So the risk of a recession in Europe will rise if the energy squeeze worsens, even if a recession is ultimately avoided.Whatever Russia ends up doing with its military, it may start off with shock and awe. Europe might see its first major war since World War II. Global investors will react very negatively, at least until they can be assured that the conflict will remain contained in Ukraine. According to our market-based quantitative indicators of Russian geopolitical risk, there is still complacency – the ruble has not fallen as far as one would expect based on key macro variables (Chart 2). Chart 2Russia Geopolitical Risk: Two Quantitative Indicators
Russia Geopolitical Risk: Two Quantitative Indicators
Russia Geopolitical Risk: Two Quantitative Indicators
Chart 3Russian Market Reaction Amid Ukraine Crisis
Russian Market Reaction Amid Ukraine Crisis
Russian Market Reaction Amid Ukraine Crisis
Investors will sell European – especially eastern European – equities and currencies even more rapidly if a war breaks out (Chart 3). It is too soon to buy the dip. What is needed is a Russian decision and then clarity on the scope of the western reaction. Even then, developed Europe and non-European emerging markets will be more attractive.Looking at global equities: How did the market respond to previous Russian invasions?Few conclusions can be drawn from Russia’s invasion of Georgia in 2008, given Georgia’s lack of systemic importance and the simultaneous global financial crisis (Chart 4). Stocks underperformed bonds and cyclicals underperformed defensives, but value caught a bid relative to growth.Russia’s initial invasion of Ukraine in 2014 occurred in a different macroeconomic context but saw stocks flat relative to bonds, cyclicals fall relative to defensives (except energy stocks), and small caps roll over relative to large caps (Chart 5). Value stocks, however, outperformed growth stocks. Chart 4Market Reaction To Russian Invasion Of Georgia
Market Reaction To Russian Invasion Of Georgia
Market Reaction To Russian Invasion Of Georgia
Chart 5Market Reaction To Russian Invasion Of Crimea
Market Reaction To Russian Invasion Of Crimea
Market Reaction To Russian Invasion Of Crimea
Chart 6Ukraine Crisis And Energy: 2022 Versus 2014
Ukraine Crisis And Energy: 2022 Versus 2014
Ukraine Crisis And Energy: 2022 Versus 2014
However, in today’s context, these cyclical trends are looking stretched, so a temporary pullback from these trends should be expected. Value stocks, especially energy stocks, have skyrocketed relative to growth and defensives and are likely to pull back in a global risk-off move (Chart 6). Tactically we recommend American over European assets, defensives over cyclicals, large caps over small caps, and safe-haven assets like gold and the Japanese yen.Washington Offers “No Change” To MoscowWhy is a diplomatic solution less likely than before?The US offered no concessions to Russia in its formal written response to Russia’s demands on January 26. “No change, and there will be no change” in longstanding policies, according to Secretary of State Antony Blinken.1 The relevant policies are not about NATO membership – Ukraine is never going to join NATO – but rather about the US and NATO making Ukraine a de facto member by providing arms and defense cooperation. Russia obviously sees a US-armed Ukraine as a threat to its national security.One of the few realistic demands of Russia’s – that the US and NATO stop providing arms – has been flung back in Russia’s face. Blinken pointed out in his press conference that the US has given more defense aid to Ukraine in the past year than in any previous year. He said the US will continue to provide arms while pursuing diplomacy, including five MI-17 helicopters on the way. He also noted that the US has authorized allies to transfer American-origin arms to Ukraine.2The importance of the defense cooperation is not the quality of the arms being transferred (so far) but the long-term potential for the US to turn Ukraine into Russia’s Taiwan, i.e. a foreign-backed military enemy on its doorstep. The costs of inaction today could be checkmate from Russia’s long-term strategic point of view. Russia has warned for 14 years that it saw Ukraine as a red line and yet the US and NATO have increased defense cooperation. It is a moot point whether the US provides arms because it does not empathize with Russia’s security interests or because it believes Russia will attack Ukraine regardless.A diplomatic solution could still come from the US, if more information comes to light, or from Ukraine itself, under French and German pressure. Ukraine could make promises to respect Russia’s national security interests and implement the Minsk Protocols it was forced into after Russia seized Crimea in 2014.3If Ukraine surrenders, Russia can claim victory and reduce the threat of war, at least temporarily. But it would not eliminate the long-term risk of war since Ukraine’s government may not be willing or able to implement any such agreement. Ukraine views the Minsk agreement as a Russian imposition and it has rejected key parts of it (such as federalization and granting rights and privileges to Russian separatists in Donbass) for eight years already.4The joint statement from Russia, Ukraine, France, and Germany on January 26 reaffirms the ceasefire in the Donbass.5 It is unlikely that Russia can walk away with this ceasefire alone, having made fundamental demands regarding Russia’s long-term security and the European order. It is more likely that any Ukrainian violation of the ceasefire will now offer a pretext for Russia to respond with military force.Russia’s military advantage is immediate whereas diplomatic attempts by Ukraine to buy time could help it stage a more formidable defense against Russia in future, given ongoing US and NATO defense cooperation. This is why the continuation of arms transfers is the signal. Russia is incentivized to take action sooner rather than later now that the western willingness and urgency to provide arms has increased.Putin has succeeded with his “small war” and “hybrid war” strategy thus far. Russian forex and gold reserves at $630 billion (38% of GDP), gradual diversification away from the dollar (16% of forex reserves), low short-term external debt (5% of GDP), an alternative bank communication system, a special economic relationship with China, a Eurasian Economic Union that can help circumvent sanctions, all provide Russia with some buffer against US sanctions.GeoRisk Indicators: Europe Chart 7European GeoRisk Indicator Amid Ukraine Crisis
European GeoRisk Indicator Amid Ukraine Crisis
European GeoRisk Indicator Amid Ukraine Crisis
In our Q3 2021 outlook, we argued that European political risk had bottomed due to Russia. Our geopolitical risk indicators show that financial markets tend to price European political risks in line with the USD-EUR exchange rate. The dollar rallied in 2021 and has since fallen back but a war and energy squeeze in Europe should help the dollar stay resilient, as should Federal Reserve rate hikes (Chart 7).If Russia attacks, the Ukrainians will fall back and then mount an insurgency. This will make the war more difficult than its planners initially believe. It will also raise the risk that war will spill over. Neighbors that provide economic aid – not to mention military aid – will eventually make themselves vulnerable to Russian attack, either to destroy commerce or cut insurgency supply lines.NATO will fortify its borders with troops but then tensions will grow on those borders, reducing security and raising uncertainty in the Baltics, Poland, Slovakia, and the Czech Republic. Ukraine could become a war zone like Libya or Syria except that this time the US and Russia would truly be fighting a proxy war against each other.Other European Risks Pale In ComparisonWe will monitor the French election in case the Ukraine conflict causes dynamics to shift against President Emmanuel Macron. Most likely Macron’s diplomatic flourishes, combined with France’s insulation from Russia and Ukraine, will benefit him at the ballot box.In the UK, Prime Minister Boris Johnson faces a leadership challenge. He will probably survive but the Conservative Party faces a serious challenge over the coming years. Labour’s comeback will build ahead of the next election, given that the pandemic has dealt a powerful blow against the Tories, who have been in power since 2010 and are therefore becoming stale. Labour has gotten over the Jeremy Corbyn problem.What matters is whether the UK rejoins the EU, whether Scotland leaves the UK, and whether the next government has a strong majority with which to lead. So far there have not been major changes on these issues:The Tories still have a 75-seat majority through 2024.Support for Scottish independence is stuck at 45% where it has been since 2014.Polling is still evenly divided on Brexit. Labour taking power is a prerequisite to any reunion with the EU, Labour does not want to campaign on re-opening the Brexit issue. While Labour will want to run against inflation, and win back the middle class, rather than for the EU.Thus political risk will be flat, not returning to Brexit highs anytime soon, which is marginally good news for pound sterling over a cyclical horizon (Chart 8). Chart 8UK GeoRisk Indicator And Boris Johnson's Troubles
UK GeoRisk Indicator And Boris Johnson's Troubles
UK GeoRisk Indicator And Boris Johnson's Troubles
India Enters Populist Phase Of Election Cycle2022 will mark the beginning of India’s election season in full earnest, even though general elections are not due until 2024. This is because within the five-year election cycle spanning from 2019-2024, this year will see elections in some of India’s largest states (Chart 9).More importantly 2022 will see elections take place in most of India’s northern region (Chart 10), which is a key constituency for the ruling Bhartiya Janata Party (BJP). Chart 9India: Major State Elections This Year
All Bets Are Off ... Well, Some (A GeoRisk Update)
All Bets Are Off ... Well, Some (A GeoRisk Update)
Chart 10North India In Focus With State Elections
All Bets Are Off ... Well, Some (A GeoRisk Update)
All Bets Are Off ... Well, Some (A GeoRisk Update)
Of all the state elections due this year, the most critical will be those in Uttar Pradesh, where voting will begin on February 10, 2022. Final results will be declared a month later on March 10, 2022.Uttar Pradesh Will Disappoint BJPAt the last state elections held in Uttar Pradesh in 2017, BJP stormed into power with one of the strongest mandates ever seen in this sprawling and heterogenous state. The BJP boosted its seat share to an extraordinary 77%, leaving competitors far behind (Chart 11). Chart 11Bhartiya Janata Party (BJP) Stormed Into Power In Uttar Pradesh (UP) In 2017
All Bets Are Off ... Well, Some (A GeoRisk Update)
All Bets Are Off ... Well, Some (A GeoRisk Update)
Cut to 2022, the BJP appears likely to cross the 50% majority threshold but will cede seat share to a regional party called the Samajwadi Party (SP).What will drive this reduction in seats? The reduction will be driven by a degree of anti-incumbency sentiment and some adverse socio-political arithmetic. In a state where voting is still driven to a large extent by identity politics, it is worth recalling that the BJP was able to win the 2017 elections by pulling votes from three distinct communities:BJP’s core constituency of upper caste Hindus.A subset of Other Backward Classes (OBCs).A subset of a community belonging historically to one of the lowest social levels in India called Dalits.This winning formula of 2017 may not work in 2022 as the BJP faces resentment from parts of each of these three communities as well as from farmers (who were against farm law reforms that the BJP tried to pass).There is a chance that these groups may flock to the regional Samajwadi Party in 2022. The latter is in a position of strength as it is expected to retain support from its core constituency of Muslims and upper-caste OBCs too.Yet the risk is to the downside for the ruling party. Modi and the BJP have suffered a hit to their popular support from the global pandemic and recession, like other world leaders.Reading The Tea Leaves For 2024The pro-Modi wave that began in 2014, and gained steam in Uttar Pradesh in 2017, became a tsunami by 2019, causing the BJP to win a decisive 56% of seats in the national assembly. So, if the BJP loses seats in Uttar Pradesh this year, what will be the implications for the general elections of 2024?In a base case scenario, the Modi-led BJP appears set to emerge as the single largest party in the 2024 elections (albeit with a lower seat share than the 62 of 80 seats that the BJP managed in 2019). As the BJP administration ages, it is expected to lose a degree of seat share in its core constituency of north India. But these losses should be partially offset by gains in regions like east India where the BJP continues to make inroads. Also, national parties tend to attract higher vote share at general elections as compared to state elections, and this is true for the BJP. Most likely the pandemic will have fallen away by 2024 and the economy will be expanding.However, a lot can change in two years, and a major disappointment at Uttar Pradesh would sound alarm bells. By 2024, the BJP will have been in power for ten years. So it is not a foregone conclusion that the BJP will win a single-party majority for a third time, even if it does remain the biggest party.Regional parties like the Samajwadi Party (from Uttar Pradesh), Trinamool Congress (from West Bengal), Shiv Sena (from Maharashtra) and Aam Aadmi Party (from New Delhi) are small but rising and may incrementally eat into the BJP’s national seat share.Policy Implications For 2022 Chart 12India’s Fiscal Report Card May Worsen With Populism
All Bets Are Off ... Well, Some (A GeoRisk Update)
All Bets Are Off ... Well, Some (A GeoRisk Update)
India’s central government will unveil its budget for FY23 on Feb 1, 2022 in the Indian parliament. We expect the government to announce a fiscal deficit of 6.6% of GDP which will be marginally lower than the FY22 target of 6.8% of GDP. However, with key elections around the corner, we allocate a high probability to the government announcing a big-bang pro-farmer or pro-poor scheme from this pulpit. This high focus on populism and inadequate focus on capital expenditure could lead markets to question India’s fiscal well-being at a time when its debt levels are high (Chart 12).Distinct from policy risks in the short run, geopolitical risks confronting India are elevated too. India’s relationship with China continues to fester. Sino-Indian frictions could easily take a turn for the worst in 2022 as India enters the business end of its five-year election cycle on one hand and China’s all-important 20th National Congress of the Chinese Communist Party (NCCCP) is due in the fall of 2022. China could take advantage of US distraction in Ukraine to flex its muscles in Asia. A geopolitical showdown with China would likely only cause a temporary drop in Indian equities, but taken with other factors, now is not the time to buy.Bottom Line: We remain positive on India on a strategic horizon. However, in view of India approaching the business-end of its five-year election cycle, when policy risks tend to become elevated, we reiterate our tactical sell on India.GeoRisk Indicators: Rest Of WorldNeutral China: China’s performance relative to emerging markets may be starting to bottom but we do not recommend buying it. Domestic political risk is still rising according to our indicator and we expect it to keep rising (Chart 13). Negative political surprises will occur in the lead up to the twentieth national party congress and the March 2023 implementation of the “Common Prosperity” plan. Any Russian conflict will distract the US and enable General Secretary Xi Jinping to cement his second ten-year term in office – and China’s reversion to autocracy – with minimal foreign opposition. The US’s conflict with China is one reason Russia believes it has a window of opportunity. Chart 13CHINA GEORISK INDICATOR
CHINA GEORISK INDICATOR
CHINA GEORISK INDICATOR
Short Taiwan: Taiwan’s geopolitical risk has paused far short of previous peaks as the country’s currency and stock market benefit from the ongoing semiconductor shortage. But a peak may be starting to form in relative equity performance (Chart 14). We doubt that China will see any Russian attack on Ukraine in 2022 as an opportunity to invade Taiwan, although economic sanctions and cyber-attacks are an option that we fully anticipate. Invading Taiwan is far more difficult militarily than invading Ukraine and China is less ready than Russia for such an operation. However, China might be able to exploit a Russian attack as soon as 2024. Chart 14TAIWAN TERRITORY GEORISK INDICATOR
TAIWAN TERRITORY GEORISK INDICATOR
TAIWAN TERRITORY GEORISK INDICATOR
Long South Korea: South Korea’s presidential election is approaching on March 9 and this event combined with North Korea’s new cycle of missile provocations will keep political risk elevated (Chart 15). The conservative People Power party has pulled ahead in opinion polling and the incumbent Democratic Party has been weakened by the pandemic. But the race is still fairly tight and a viable third party candidate could make a comeback. China’s policy easing should eventually benefit South Korea. Chart 15SOUTH KOREA GEORISK INDICATOR
SOUTH KOREA GEORISK INDICATOR
SOUTH KOREA GEORISK INDICATOR
Long Australia: Australia’s federal election must be held by May 21 and anti-incumbency feeling has taken hold, with the Liberal-National coalition collapsing in opinion polls relative to the Australian Labor Party. Australia still faces shockwaves from the pandemic and China’s secular slowdown, reversion to autocracy, and conflict with the US, especially if the US gets distracted in Europe. Political risk is high and rising (Chart 16). However, Australia benefits from rising commodity prices and we favor developed markets outside the United States. Chart 16AUSTRALIA GEORISK INDICATOR
AUSTRALIA GEORISK INDICATOR
AUSTRALIA GEORISK INDICATOR
Long Canada: Canada’s recapitalized its political system with last year’s general election and political risk is subsiding (Chart 17). Canada benefits from rising oil and commodity prices and close proximity to the hyper-stimulated US economy. Chart 17CANADA GEORISK INDICATOR
CANADA GEORISK INDICATOR
CANADA GEORISK INDICATOR
Neutral Turkey: Turkey is one of our perennial candidates for a “black swan” event as the country’s political stability continues to suffer under strongman rule, unorthodox monetary and fiscal policy, military adventures in North Africa and Syria, and now a Russian bid to dominate the Black Sea. Elections looming in 2023 will provoke turmoil as the Erdogan administration is extremely vulnerable and yet has many ways to try to cling to power (Chart 18). Chart 18TURKEY GEORISK INDICATOR
TURKEY GEORISK INDICATOR
TURKEY GEORISK INDICATOR
Neutral Brazil: Brazilian political risk is subsiding as the market expects former President Lula da Silva to return to power in this October’s presidential election and replace current populist President Jair Bolsonaro. Relative equity performance always appears as if it has bottomed only to inch lower in the next selloff. China’s policy easing is a boon for Brazil but China is not providing massive stimulus, the election will be tumultuous, and even a Lula victory will need to see a market riot to ensure that structural reforms are pursued (Chart 19). Chart 19BRAZIL GEORISK INDICATOR
BRAZIL GEORISK INDICATOR
BRAZIL GEORISK INDICATOR
Long South Africa: South Africa still faces elevated political risk despite the conclusion of the 2021 municipal elections. However, the ruling African National Congress, which is pursuing an anti-corruption drive, is likely to stay in power, lending policy continuity. Equities have bottomed and are rebounding relative to emerging markets (Chart 20). The danger is that structural reforms will slip ahead of the spring 2024 election. Chart 20SOUTH AFRICA GEORISK INDICATOR
SOUTH AFRICA GEORISK INDICATOR
SOUTH AFRICA GEORISK INDICATOR
Investment TakeawaysTactically stay long gold, defensives over cyclicals, large caps over small caps, Japanese industrials versus German, GBP-CZK, and JPY-KRW.Book a 10% gain on long DM Europe / short EM Europe. Book a 8.6% gain on long CAD-RUB. Matt Gertken Vice PresidentGeopolitical Strategymattg@bcaresearch.com Ritika Mankar, CFAEditor/Strategistritika.mankar@bcaresearch.comFootnotes1 For Blinken’s press conference on the US formal response to Russia, see US Department of State, "Secretary Antony J. Blinken at a Press Availability," January 26, 2022, state.gov.2 For Ukraine’s criticism that Germany should offer pillows in addition to helmets, see Humeyra Pamuk and Dmitry Antonov, "U.S. responds to Russia security demands as Ukraine tensions mount," Reuters, January 26, 2022, reuters.com. For the US’s $2.5 billion in defense aid to Ukraine since 2014, see Elias Yousif, "U.S. Military Assistance to Ukraine," January 26, 2022, stimson.org. For purpose and significance, see Samuel Charap and Scott Boston, "U.S. Military Aid to Ukraine: A Silver Bullet?" Rand Blog, rand.org.3 Michael Kofman, "Putin’s Wager in Russia’s Standoff with the West," War on the Rocks, January 24, 2022, warontherocks.com.4 In 2021 the US apparently moved to embrace the Minsk Protocols for the first time, but since then it has not joined the talks. See National Security Adviser Jack Sullivan, "White House Daily Briefing," December 7, 2021, c-span.org. 5 Élysée, "Declaration of the advisors to the N4 Heads of States and Governments," January 26, 2022, elysee.fr. See also "Russia, Ukraine agree to uphold cease-fire in Normandy talks," DW, January 26, 2022, dw.com.Geopolitical CalendarStrategic ThemesOpen Tactical Positions (0-6 Months)Open Cyclical Recommendations (6-18 Months)
Highlights Corporate Bond Returns & Fed Tightening: Corporate bond performance varied considerably during the past four Fed tightening cycles. Our analysis of these periods suggests that valuations and the slope of the yield curve are the two most important factors to monitor. Investment Grade Strategy: Given tight valuations, our analysis of past Fed tightening cycles suggests that it will make sense to downgrade our allocation to investment grade corporates from neutral (3 out of 5) to underweight (2 out of 5) once we are confident that the yield curve has shifted into a flatter regime. High-Yield Strategy: De-risking will also be warranted in the high-yield space as the yield curve flattens, but relative valuations dictate that investors should retain a preference for high-yield over investment grade corporates. Feature It is now apparent that the Federal Reserve intends to kick off the next rate hike cycle at the March FOMC meeting. This move has been strongly hinted at in recent Fed speeches and it will be telegraphed more officially when Jay Powell addresses the media tomorrow. In preparation for upcoming rate increases, last week’s report looked at Treasury returns during prior periods of Fed tightening.1 This week, we extend that analysis to the corporate bond market. Specifically, we consider the excess returns that were earned by both investment grade and high-yield corporates during the four most recent rate hike cycles.2 We conclude that a defensive posture toward credit risk will be warranted as Fed tightening gets underway. While we aren’t quite ready to downgrade our recommended allocation to corporate bonds today, we expect to do so within the next couple of months. Corporate Bond Returns During Rate Hike Cycles Table 1 presents excess returns for both the Bloomberg Barclays Investment Grade Corporate Bond Index and the Bloomberg Barclays High-Yield Corporate Bond Index in each of the past four Fed tightening cycles. As was the case last week, we define each tightening cycle as spanning from the first rate hike until the last rate hike. We also exclude periods such as 1997 when the Fed only lifted rates once before reversing course. Table 1Corporate Bond Returns During Fed Rate Hike Cycles
Positioning For Rate Hikes In The Corporate Bond Market
Positioning For Rate Hikes In The Corporate Bond Market
Our first preliminary conclusion is that (unlike with Treasury returns) there is not much commonality between the different cycles. For example, corporate excess returns were quite strong during the 2015-18 cycle and very weak during the 1999-2000 cycle. In other words, it’s even more important to examine each cycle individually to get a sense of how we should position in the corporate bond market today. The 2015-2018 Cycle The most recent Fed tightening cycle started with a 25 basis point rate hike in December 2015. The Fed then went on hold for 12 months before delivering a string of 8 hikes between December 2016 and December 2018. All in all, the tightening cycle lasted 36 months and the Fed raised the target rate by 225 bps. Investment grade corporate bond returns were quite strong during this period (Chart 1A), and there is one major reason why. The start of the tightening cycle happened to coincide with the peak of a default cycle. As a result, corporate spreads were elevated when hiking began and they tightened rapidly throughout 2016 and 2017 (Chart 1A, panel 3). Spread tightening in 2016 and 2017 was helped along by an accommodative policy environment, as evidenced by the fact that the yield curve remained steep (3/10 slope > 50 bps) during those years (Chart 1A, panel 4). It’s notable that returns turned negative in 2018, only after the average index spread moved below 100 bps and the Treasury slope moved below 50 bps. In other words, corporate bond returns were strong early in the cycle but turned negative once value evaporated and the monetary backdrop became less accommodative. High-Yield returns show a similar pattern to investment grade (Chart 1B). Spreads started out very wide in early-2016 and tightened rapidly until monetary conditions turned more restrictive in 2018. Our Default-Adjusted Spread is an additional valuation tool for high-yield bonds (Chart 1B, panel 4). This is calculated as the average index spread less the actual default losses that were experienced during the subsequent 12 months. Our research has shown that high-yield bonds usually outperform Treasuries during 12 month periods in which the Default-Adjusted Spread is above 100 bps (see the Appendix of this report for more details). In this case, the Default-Adjusted Spread was an extremely high 258 bps at the beginning of the tightening cycle and it didn’t dip below 100 bps until after rate hikes ended. Chart 1A2015-2018 Cycle: Investment Grade
2015-2018 Cycle: Investment Grade
2015-2018 Cycle: Investment Grade
Chart 1B2015-2018 Cycle: High-Yield
2015-2018 Cycle: High-Yield
2015-2018 Cycle: High-Yield
The 2004-2006 Cycle During this cycle, which spanned from June 2004 to June 2006, the Fed lifted rates by 400 bps (sixteen 25 basis point rate hikes). The fed funds rate rose from 1% to 5.25% during the two-year span. Excess investment grade corporate bond returns were close to zero during this cycle (Chart 2A). Unlike in 2015, corporate spreads started out at tight levels (below 100 bps), though the accommodative monetary environment – as evidenced by the steep yield curve – allowed them to tighten somewhat during the first year of Fed hiking. However, spreads then reverted closer to 100 bps in 2005 as the yield curve flattened to below 50 bps (Chart 2A, panel 4) and the policy backdrop turned more restrictive. Junk bonds performed extremely well during the 2004-06 cycle (Chart 2B), and once again this is due to very attractive starting valuations. The average High-Yield Index spread was 384 bps on the day of the first hike in 2004, compensation that turned out to be astoundingly high when you consider that monthly default events were in the low single digits throughout the entire period (Chart 2B, bottom panel). As was the case in the 2015-18 cycle, our Default-Adjusted Spread measure never dipped below 100 bps. In fact, it troughed at 145 bps in early 2005 (Chart 2B, panel 4). Chart 2A2004-2006 Cycle: Investment Grade
2004-2006 Cycle: Investment Grade
2004-2006 Cycle: Investment Grade
Chart 2B2004-2006 Cycle: High-Yield
2004-2006 Cycle: High-Yield
2004-2006 Cycle: High-Yield
The 1999-2000 Cycle In this cycle, the Fed lifted rates by 175 bps between June 1999 and May 2000, driving the fed funds rate from 4.75% to 6.5%. Excess investment grade corporate bond returns were poor during this period (Chart 3A), the combination of relatively low starting spreads and a very flat yield curve that even inverted in early 2000 (Chart 3A, panels 3 & 4). High-yield excess returns were even worse than for investment grade (Chart 3B). While, at the onset of Fed tightening, junk spreads were quite elevated in absolute terms (Chart 3B, panel 3), they turned out to be too low compared to the magnitude of default losses that occurred throughout 1999 and 2000 (Chart 3B, bottom panel). Our Default-Adjusted Spread measure started the cycle below 100 bps and then dipped into negative territory in early 2000 (Chart 3B, panel 4). Chart 3A1999-2000 Cycle: Investment Grade
1999-2000 Cycle: Investment Grade
1999-2000 Cycle: Investment Grade
Chart 3B1999-2000 Cycle: High-Yield
1999-2000 Cycle: High-Yield
1999-2000 Cycle: High-Yield
The 1994-1995 Cycle The Fed surprised markets by lifting rates extremely quickly during this cycle. The Fed moved rates from 3% to 6% in the span of only 12 months between February 1994 and February 1995. This cycle coincided with modestly positive excess returns for investment grade corporates (Chart 4A). The average index spread began the cycle at the extraordinarily tight level of 67 bps (Chart 4A, panel 3). However, unappealing valuations were counteracted by the accommodative monetary environment, as evidenced by a yield curve slope that didn’t dip below 50 bps until the Fed was almost done hiking (Chart 4A, panel 4). Junk returns were also modestly positive during this period (Chart 4B). Spreads started the cycle at attractive levels (Chart 4B, panel 3) and the default rate was on the downswing (Chart 4B, bottom panel). Junk spreads, however, were mostly rangebound during the period of Fed tightening. Chart 4A1994-1995 Cycle: Investment Grade
1994-1995 Cycle: Investment Grade
1994-1995 Cycle: Investment Grade
Chart 4B1994-1995 Cycle: High-Yield
1994-1995 Cycle: High-Yield
1994-1995 Cycle: High-Yield
Investment Implications Investment Grade Our analysis of past cycles reveals that valuation and the slope of the yield curve are the two most important factors to consider when assessing the potential for investment grade corporate bond excess returns during a Fed tightening cycle. The 2015-18 period of strong investment grade returns coincided with elevated spreads and a yield curve slope that stayed above 50 bps for the first two years of tightening. In contrast, the 1999-2000 period of negative corporate returns was driven by expensive starting valuations and a very flat curve. Today, investment grade corporate bond valuations are about as expensive as they’ve ever been. The average index option-adjusted spread (OAS) is currently 100 bps, the index OAS has been tighter than this level 40% of the time since 1995 (Chart 5). This does not appear terrible at first blush, but we must also consider that the risk characteristics of the index have changed during the past few decades. Specifically, the index’s average credit rating is lower, and its average duration is higher. If we adjust the index to maintain a constant credit rating through time, we see that the spread falls from its 40th percentile to its 28th percentile (Chart 5, panel 2). If we then adjust for the changing duration of the index by looking at the 12-month breakeven spread instead of the OAS, we see the spread fall to its 7th percentile since 1995 (Chart 5, bottom panel).3 As for the yield curve, the 3-year/10-year Treasury slope is currently very close to 50 bps – the threshold that roughly represents the transition from an accommodative monetary environment to a more neutral one (Chart 6). Given expensive starting valuations, our inclination is to reduce our investment grade corporate bond exposure once we are confident that the 3/10 slope will remain below 50 bps for the remainder of the cycle. We think we are close to reaching that point, but we aren’t quite there yet. Our estimates based on a range of plausible scenarios for Fed tightening suggest that the 3/10 slope will permanently move below 50 bps in the coming months, by July at the very latest. When that occurs, we will reduce our recommended corporate bond exposure from neutral (3 out of 5) to underweight (2 out of 5). Chart 6Watch The Treasury Slope
Watch The Treasury Slope
Watch The Treasury Slope
Chart 5IG Valuation
IG Valuation
IG Valuation
High-Yield The valuation picture for high-yield is somewhat more pleasant than for investment grade. The OAS differential between the high-yield and investment grade indexes is fairly tight, at its 15th percentile since 1995 (Chart 7). However, this differential rises to the 36th percentile when we adjust for the duration differences of the indexes by using the 12-month breakeven spread. Chart 7HY Valuation
HY Valuation
HY Valuation
Applying our Default-Adjusted Spread methodology to today’s junk market, we estimate that the Default-Adjusted Spread will come in above the crucial 100 bps threshold as long as the default rate is 3.5% or lower during the next 12 months (Chart 7, bottom panel). This seems quite likely given the current strong state of corporate balance sheets.4 All that said, the evidence from past cycles suggests that a more defensive posture toward high-yield corporates will also be warranted once we are confident that the 3/10 slope has permanently moved below 50 bps. However, relative valuation dictates that we should still retain a preference for high-yield over investment grade even as we get more defensive overall. Our next move will likely be to downgrade high-yield from overweight (4 out of 5) to neutral (3 out of 5). Some Thoughts On Credit Investment Strategy The above analysis of corporate bond performance shows that it is generally weaker once the yield curve has flattened into a range of 0 – 50 bps. However, that move alone doesn’t guarantee negative excess corporate bond returns. In fact, it is quite plausible that the slope could remain within a 0 – 50 bps range for a long time even as the Fed tightens, and that corporate bonds could still deliver small positive excess returns versus Treasuries. However, we must acknowledge that the risks of Fed overtightening, curve inversion and economic recession increase as the yield curve flattens. We must also acknowledge that current valuations suggest that future excess returns will be small, even if they are positive. For example, if we assume that the average investment grade OAS can’t tighten very much from current levels, then the best we can expect is 100 bps per year of excess return. Meanwhile, 100 bps of spread widening – much less than you would expect in a default cycle – would lead to losses of roughly 850 bps. In other words, it will be profitable to exit investment grade corporate bond positions today as long as the next bout of 100 bps of spread widening occurs within the next 8.5 years (Table 2). The risk/reward trade-off clearly favors a more defensive credit allocation. Table 2The Risk/Reward Trade-off In Corporate Bonds
Positioning For Rate Hikes In The Corporate Bond Market
Positioning For Rate Hikes In The Corporate Bond Market
Interestingly, Table 2 shows that the risk/reward math is more favorable for junk bonds. Depending on our default loss assumptions, the 8.5 years we calculated for investment grade falls to a range of 1.8 to 3 years for high-yield. Bottom Line: Tight valuations and low expected returns suggest that investors should be more cautious on credit risk this cycle. In our view, it is advisable to reduce credit risk allocation earlier than usual this cycle in order to ensure that you aren’t invested during the next big selloff. Appendix
Image
Ryan Swift US Bond Strategist rswift@bcaresearch.com Footnotes 1 Please see US Bond Strategy Weekly Report, “Positioning For Rate Hikes In The Treasury Market”, dated January 18, 2022. 2 We define excess returns as the excess returns earned by the corporate bond index relative to a duration-matched position in US Treasuries. 3 The 12-month breakeven spread can be thought of as the spread widening required for the index to break even with duration-matched Treasuries on a 12-month investment horizon. It can be approximated as OAS divided by duration. 4 Please see US Bond Strategy Weekly Report, “The Fed’s Inflation Problem”, dated November 23, 2021. Recommended Portfolio Specification Other Recommendations Treasury Index Returns Spread Product Returns
Dear client, In lieu of our weekly bulletin next week, I will be hosting a webcast on Friday, January 28 at 11:00 am EST, to discuss recent dollar trends. I hope you all tune in. Kind regards, Chester Ntonifor Highlights While not often discussed, it is well known that the dollar is expensive. It is true that valuations tend to matter less until they trigger a tipping point. Such inflections usually coincide with huge external imbalances, especially generated by an overvalued exchange rate. The US dollar could be stepping into such a paradigm - the DXY is 1.5 standard deviations above fair value, at the same time as the goods trade deficit is hitting record lows, and real interest rates are deeply negative. More importantly, there has been limited precedence to such a dollar configuration. Historically, it has required much higher real interest rates, or an improving balance of payments backdrop, to justify such lofty valuations. Our trading model shows that selling a currency when it is expensive and buying it when it is cheap generates excess returns over time. Within our valuation ranking, the cheapest currencies are JPY, SEK and NOK. On a terms-of-trade basis, the AUD stands out as a winner. Feature Chart 1High Dollar Valuation And Ultra-Low Real Rates Is Unprecedented
High Dollar Valuation And Ultra-Low Real Rates Is Unprecedented
High Dollar Valuation And Ultra-Low Real Rates Is Unprecedented
Valuations usually get little respect when it comes to medium-term currency movements. This has been especially the case over the last few years, where the macroeconomic environment has been by far the biggest driver of the US dollar. The bull market in the dollar from 2011 to 2020 coincided with higher real interest rates in the US, relative to the rest of the developed world. In fact, since 2008, no developed market central bank has been able to hike rates by more than 200bps, except for the US Federal Reserve. Our report last week focused on why aggressive interest rate increases by the Federal Reserve could be bullish for the US dollar in the short term, but eventually set the stage for depreciation. In this report, we argue that valuations will also become a more important factor for currency strategy over the next 1-2 years (Chart 1). The Dollar And The External Balance The framework to understand currencies and the external balance is straightforward - a rising trade deficit (imports > exports) requires a lower exchange rate to boost competitiveness in the manufacturing sector, or less spending to reduce the trade deficit. Reduced domestic spending is unlikely in most developed economies, given ample pent-up demand and loose fiscal policy. Therefore, the natural adjustment mechanism for countries running wide trade deficits will have to be the exchange rate. Within a broad spectrum of developed and emerging market currencies, the US dollar stands out as overvalued on a real effective exchange rate basis (Chart 2A and 2B). It is true that valuations tend to matter less until they trigger a tipping point. Such inflections usually occur with a shift in animal spirits, coinciding with huge external imbalances.
Chart 2
Chart 2
In the US, these imbalances are already starting to trigger a shift. The US trade deficit is deteriorating, with the goods deficit hitting a record low of -$98bn in November. Over the last few years, it has become increasingly difficult to fund this widening trade deficit via foreign purchases of US Treasuries (Chart 3). Meanwhile, as we highlighted last week, substantial equity inflows over the last few years have started to roll over. In a nutshell, the basic balance in the US (the sum of the current account and foreign direct investment) is deteriorating at an accelerated pace (Chart 4). The US current account deficit for Q3 came in at -$214.8 billion, the widest in over a decade. This has reversed a lot of the improvement in the basic balance since the Global Financial Crisis. The dollar tends to decline on a multi-year basis when the basic balance peaks and starts deteriorating. Chart 4Deteriorating Balance Of Payments Dynamics US Balance Of Payments
Deteriorating Balance Of Payments Dynamics US Balance Of Payments
Deteriorating Balance Of Payments Dynamics US Balance Of Payments
Chart 3It Is Becoming Increasingly Difficult To Fund The Widening Deficit
It Is Becoming Increasingly Difficult To Fund The Widening Deficit
It Is Becoming Increasingly Difficult To Fund The Widening Deficit
Fiscal policy is likely to become tighter in the next couple of years, easing the domestic spending constraint for the exchange rate. That said, fiscal policy will remain loose compared to pre-pandemic levels and relative to underlying employment conditions. This has historically led to a deterioration in the external balance and pulled the real effective exchange rate of the dollar down (Chart 5). Chart 5The Dollar And The Budget Deficit
The Dollar And The Budget Deficit
The Dollar And The Budget Deficit
Real Interest Rates And The Dollar It is remarkable that at a time when real rates are the most negative in the US, the dollar is as overvalued as it has been in decades on a simple PPP model. This is a perfect mirror image of the dollar configuration at the start of the bull market in 2010, where the dollar was cheap and real rates were more supportive (Chart 1). According to economic theory, a currency should adjust to equalize returns across countries. This is a no-arbitrage condition. In the early 80s, an overvalued dollar was supported by very positive real rates. The subsequent dollar declines thereafter also coincided with falling real interest rates. In fact, over the last decade, it has been an anomaly that the dollar is so strong despite relative real interest rates being so negative (Chart 6). Our view remains that the terminal interest rate for the US should be higher than what is currently discounted in the 10-year Treasury yield. According to the overnight index swap curve, the Fed will not hike interest rates past 1.75%. This is much lower than past cycles and will keep real interest rates low. This does not justify an expensive greenback. Our shorter-term interest rate model also shows the DXY as slightly expensive, even though short-term interest rates have moved in favor of the dollar over the past year (Chart 7). Chart 6The Level Of Relative Real Yields Also Matters
The Level Of Relative Real Yields Also Matters
The Level Of Relative Real Yields Also Matters
Chart 7Our Timing Model Suggests ##br##A Pullback
Our Timing Model Suggests A Pullback
Our Timing Model Suggests A Pullback
Other Considerations While real effective exchange rates and purchasing power parity models are among our favorite valuation gauges, they are not foolproof. Countries with structurally higher inflation (and so a higher real effective exchange rate), could also have higher productivity. According to the Balassa-Samuelson Hypothesis, competitiveness in the tradeable goods sector will boost wages across all sectors of the economy, leading to higher prices. This argument particularly resonates with proponents that suggest the US is a fast-growing economy, and so will tend to run a current account deficit, like Australia during the commodity boom of the early 2000s. Meanwhile, the US earns more on its overseas assets than it spends on its liabilities, suggesting that the funding gap will eventually close. Unfortunately, the overvaluation of the dollar has not been due to higher relative productivity in the US, especially when compared to other economies. Across a broad spectrum of developed and emerging market economies, the dollar is expensive according to our productivity models. The Chinese RMB (which is much overvalued on a PPP basis) is closer to fair value when productivity is taken into consideration (Chart 8).
Chart 8
Meanwhile, the sizeable US deficit is not completely offset by its positive investment balance (Chart 9). This is occurring at a time when many faster growing countries (such as China for example) are generating current account surpluses (Chart 10A and 10B). In a nutshell, whether one looks at relative price levels, relative productivity trends, or relative real returns on government assets, the dollar is expensive. Chart 9The Positive Income Balance Has Not Helped The Us Investment Position
The Positive Income Balance Has Not Helped The Us Investment Position
The Positive Income Balance Has Not Helped The Us Investment Position
Chart 10
Chart 10
Conclusion Last summer, we introduced a trading model for FX valuation enthusiasts. We used both our in-house purchasing power parity models (PPP) and our intermediate-term timing models as valuation tools. Since the 2000s, both valuation models have outperformed a buy-and-hold currency strategy with much lower volatility (Chart 11). Currency valuation tends to matter over the longer term, while the macro environment tends to dominate short-term currency trading. Given that the dollar has been overvalued for the last three to five years, the above analysis suggests we might be entering this “longer-term” tipping point where valuations will start to matter more going forward. Within our valuation ranking, the cheapest currencies are JPY, SEK and NOK. On a terms-of-trade and productivity basis, the AUD stands out as a winner. This is being reflected in a record-high basic balance surplus (Chart 12). In our trade tables, we went long AUD at 70 cents, and will upgrade this to a high conviction bet on signs that currency volatility is ebbing. Chart 11A Trading Rule Solely Based On Valuation
A Trading Rule Solely Based On Valuation
A Trading Rule Solely Based On Valuation
Chart 12AUD And Balance Of Payments
AUD And Balance Of Payments
AUD And Balance Of Payments
Chester Ntonifor Foreign Exchange Strategist chestern@bcaresearch.com Trades & Forecasts Strategic View Tactical Holdings (0-6 months) Forecast Summary
Highlights Our top five “black swan” risks for 2022: Social unrest in China; Russian invasion of all of Ukraine; unilateral Israeli strikes on Iran; a cyber attack that goes kinetic; and a failure of OPEC 2.0. Too early to buy the dip on Russian assets: President Biden says Putin will probably “move in” and re-invade Ukraine, Russian embassy staff have been evacuating Ukraine, the US and UK have been providing more arms to Ukraine, and the US is warning of a semiconductor embargo against Russia. Talks resume in Geneva on Friday. Tactically investors should take some risk off the table, especially if linked to Russia and Europe. Stay short the Russian ruble and EM Europe; stay short the Chinese renminbi and Taiwanese dollar; stay long cyber security stocks; and be prepared for oil volatility. Convert tactical long equity trades to relative trades: long large caps versus small caps, long defensives versus cyclicals, and long Japanese industrials versus German industrials. Feature Chart 1Recession Probability And Yield Curve
Recession Probability And Yield Curve
Recession Probability And Yield Curve
The 2/10-year yield curve is flattening and now stands at 79 bps, while the implied probability of a recession over the next 12 months troughed at 5.9% in April 2021, and as of December 2021 stood at 7.7% (Chart 1). Apparently stagflation and recession are too high of a probability to constitute a “black swan” risk for this year. Black swans are not only high impact but also low probability. In this year’s annual “Five Black Swan” report, the last of our 2022 outlook series, we concentrate on impactful but unlikely events. These black swans emerge directly from the existing themes and trends in our research – they are not plucked at random. The key regions are highlighted in Map 1.
Chart
Black Swan #1: Major Social Unrest Erupts In China China’s financial problems are front and center risks for investors this year. They qualify as a “Gray Rhino” rather than “Black Swan” risk.1 It is entirely probable that China’s financial and property sector distress will negatively impact Chinese and global financial markets in 2022. What investors are not expecting is an eruption of social unrest in China that fouls up the twentieth national party congress this fall and calls into question the Communist Party’s official narrative that it is handling the pandemic and the underlying economic transition smoothly. Social unrest is a major risk around the world in the face of the new bout of inflation. Most of the democracies have already changed governments since the pandemic began, recapitalizing their political systems, but major emerging markets – Russia, India, Turkey, Brazil – have not done so. They have seen steep losses of popular support for both political leaders and ruling parties. There is little opinion polling from China and people who are surveyed cannot speak openly. It is possible that the government’s support has risen given its minimization of deaths from the pandemic. But it is also possible that it has not. Beijing’s policies over the past few years have had a negative impact on the country’s business elite and foreign relations. There are disgruntled factions within China, though the current administration has a tight grip over the main organs of power. Since President Xi is trying to clinch his personal rule this fall, sending China down a path of autocracy that proved disastrous under Chairman Mao Zedong, it is possible he will face surprise resistance. China’s economic growth is decelerating, clocking in at a 4.0% quarter-on-quarter growth rate at the end of last year. While authorities are easing policy to secure the recovery, there is a danger of insufficient support. Private sentiment will remain gloomy, as reflected by weak money velocity and a low propensity to spend among both businesses and households (Chart 2). The government will continue to be repressive in the lead up to the political reshuffle. At least for the first half of the year the economy will remain troubled. Structurally China is ripe for social unrest. It suffers from high income inequality and low social mobility, comparable to the US and Brazil, which are both struggling with political upheaval (Chart 3). Chart 2China's Private Sector Still Depressed
China's Private Sector Still Depressed
China's Private Sector Still Depressed
Chart 3
In addition China is keeping a stranglehold over Covid-19. This “Zero Covid” policy minimizes deaths but suppresses economic activity. Strict policy has also left the population with a very low level of natural immunity and the new Omicron variant is even more contagious than other variants. Hence the regime is highly likely to double down to prevent an explosive outbreak. The service side of the economy will continue to suffer if strict lockdowns are maintained, exacerbating household and business financial difficulties (Chart 4). Yet in other countries around the world, government decisions to return to lockdowns have sparked unrest. Chart 4Zero Covid Policy: Not Sustainable Beyond 2022
Zero Covid Policy: Not Sustainable Beyond 2022
Zero Covid Policy: Not Sustainable Beyond 2022
China’s “Misery Index” (unemployment plus inflation) is rising sharply. While misery is ostensibly lower than that of other emerging markets, China’s unemployment data is widely known to be unreliable. If we take a worst-case scenario, looking at youth unemployment and fuel prices, misery is a lot higher (Chart 5). The youth, who are having the hardest time finding jobs, are also the most likely to protest if conditions become intolerable (Chart 6). Of course, if social unrest is limited to students, it will lack support among the wider populace. But it is inflation, not youth activism, that is the reason for China’s authorities to be concerned, as inflation is a generalized problem that affects workers as well as students. Chart 5China's Misery Index Is Higher Than It Looks
China's Misery Index Is Higher Than It Looks
China's Misery Index Is Higher Than It Looks
Chart 6China's Troubled Youth
China's Troubled Youth
China's Troubled Youth
Why would protesters stick their necks out knowing that the Communist Party will react ferociously to any sign of instability during President Xi Jinping’s political reshuffle? True, mainland Chinese do not have the propensity to political activism that flared up in protests in Hong Kong in recent years. Also the police state will move rapidly to repress any unrest. Yet the entire focus of Xi Jinping’s administration, since 2012, has been the restoration of political legitimacy and prevention of popular discontent. Xi has cracked down on corruption, pollution, housing prices, education prices, and has announced his “Common Prosperity” agenda to placate the low and middle classes.2 The regime has also cracked down on the media, social media, civil society, and ideological dissent to prevent political opposition from taking root. If the government were not concerned about social instability, it would not have been adopting these policies. Disease, often accompanied by famines or riots, has played a role in the downfall of six out of ten dynasties, so Beijing will not be taking risks for granted (Table 1). Table 1Disease And Downfall Of Chinese Dynasties
Five Black Swans For 2022
Five Black Swans For 2022
Social instability would have a major impact as it would affect China’s stability and global investor sentiment toward China. Western democracies would penalize China for violations of human rights, leaving China even more isolated. Bottom Line: Investors should stay short the renminbi and neutral Chinese equities. Foreign investors should steer clear of Chinese bonds in the event of US sanctions. After the party congress this fall there will be an opportunity to reassess whether Xi Jinping will “let a hundred flowers bloom,” thus improving the internal and external political and investment environment, but this is not at all clear today. Black Swan #2: Russia Invades All (Not Just Part) Of Ukraine US-Russia relations are on the verge of total collapse and Russian equities have sold off, in line with our bearish recommendations in reports over the past two years. Russia’s threat of re-invading Ukraine is credible. Western nations are still wishy-washy about the counter-threat of economic sanctions, judging by German Chancellor Olaf Scholz’s latest comments, and none are claiming they will go to war to defend Ukraine.3 Russia is looking to remove the threat of Ukraine integrating militarily and economically with the West. The US and UK are providing Ukraine with defense weaponry even as Russia specifically demands that they cease to do so. President Putin may choose short-term economic pain for long-term security gain. The consensus view is that if Russia does invade, it will undertake a limited invasion. But what if Russia invades all of Ukraine? To be clear, a full invasion is unlikely because it would be far more difficult and costly for Russia. It would go against Putin’s strategy of calculated risk and limited conflict. Table 2 compares Russia and Ukraine in size and strength, alongside a comparison of the US and Iraq in 2002. This is not a bad comparison given that Ukraine’s and Iraq’s land area and active military personnel are comparable. Table 2Russia-Ukraine Balance Of Power 2022 Compared To US-Iraq 2002
Five Black Swans For 2022
Five Black Swans For 2022
Russia would be biting off a much bigger challenge than the US did. Ukraine’s prime age population is 2.5 times larger than Iraq’s in 2002, and its military expenditure is three times bigger. The US GDP and military spending were 150 and 250 times bigger than Iraq’s, while Russia’s GDP and military spending are about ten times bigger than Ukraine’s today. Iraq was not vital to American national security, whereas Ukraine is vital to Russia; Russia has more at stake and is willing to take greater risks. But Ukraine is in better shape to resist Russian occupation than Iraq was to resist American. The point is that the US invasion went smoothly at first, then got bogged down in insurgency, and ultimately backfired both in political and geopolitical terms. Russia would be undertaking a massive expense of blood and treasure that seems out of proportion with its goal, which is to neutralize Ukraine’s potential to become a western defense ally and host of “military infrastructure.” However, there are drawbacks to partial invasion. The remainder of the Ukrainian state would be unified and mobilized, capable of integrating with the western world, and willing to support a permanent insurgency against Russian troops in eastern Ukraine. Russia has forces in Belarus, Crimea, and the Black Sea, as well as on Ukraine’s eastern border, giving rise to fears that Russia could attempt a three-pronged invasion of the whole country. In short, it is conceivable that Russian leaders could make the Soviet mistake of overreaching in the military aims, or that a war in eastern Ukraine could inadvertently expand into the west. If Russia tries to conquer all of Ukraine, the global impact will be massive. A war of this size on the European continent for the first time since World War II would shake governments and populations to their bones. The borders with Poland, Romania, the Baltic states, Slovakia, Hungary, Finland and the Black Sea area would become militarized (Map 2).
Chart
NATO actions to secure its members and fortify their borders would exacerbate tensions with Russia and fan fears of a wider war. Trade flows would become subject to commerce destruction, affecting even neutral nations, including in the Black Sea. Energy supplies would tighten further, sending Russia and probably Europe into recession. The disruption to business and travel across eastern Europe would be deep and lasting, not only due to sanctions but also due to a deep risk-aversion that would affect foreign investors in the former Soviet Union and former Warsaw Pact. Germany would be forced to quit sitting on the fence, as it would be pressured by the US and the rest of Europe to stand shoulder to shoulder in the face of such aggression. Finland and Sweden would be much more likely to join NATO, exacerbating Russia’s security fears. Russia would suffer a drastic loss of trade, resulting in recession, and its currency collapse would feed inflation (Chart 7). Chart 7Inflation Poses Long-Term Threat To Putin Regime
Inflation Poses Long-Term Threat To Putin Regime
Inflation Poses Long-Term Threat To Putin Regime
Ultimately the consequences would be negative for the Putin regime and Russia as a result of recession and international isolation. But in the short run the Russian people would rally around the flag and support a war designed to prevent NATO from stationing missiles on their doorstep. And their isolation would not be total, as they would strengthen ties with China and conduct trade via proxy states in the former Soviet Union. Bottom Line: A full-scale invasion of all of Ukraine is highly unlikely because it would be so costly for Russia in military, economic, and political terms. But the probability is not zero, especially because a partial re-invasion could lead to a larger war. While global investors would react in a moderate risk-off matter to a limited war in eastern Ukraine, a full-scale war would trigger a massive global flight to safety as it would call into question the entire post-WWII peace regime in Europe. Black Swan #3: Israel Attacks Iran The “bull market in Iran tensions” continues as there is not yet a replacement for the 2015 nuclear deal that the US abrogated. Our 2022 forecast that the UAE would get caught in the crossfire was confirmed on January 17 when Iran-backed Houthi rebels expanded their range of operations and struck Abu Dhabi (Map 3). The secret war is escalating and US-led diplomacy is faltering.
Chart
Iran is not going to give up its nuclear program. North Korea achieved nuclear arms and greater military security and is now developing first and second strike capabilities. Meanwhile Ukraine, which faces another Russian invasion, exemplifies what happens to regimes that give up nuclear arms (as do Libya and Iraq). Iran appears to be choosing the North Korean route. While we cannot rule out a minor agreement between President Biden and Iranian President Ebrahim Raisi, we can rule out a substantial deal that halts Iran’s nuclear and missile progress. Here’s why: Any day now Iran could reach nuclear “breakout capacity,” with enough highly enriched uranium to construct a nuclear device (Table 3).4 Table 3Iran’s Violations Of 2015 Nuclear Deal Since US Exit
Five Black Swans For 2022
Five Black Swans For 2022
Within Iran’s government, the foreign policy doves have been humiliated and kicked out of office while the hawks are fully in control. No meaningful agreement can be reached before 2024 because of the risk that the US will change ruling parties again and renege on any promises. Iran is highly incentivized to make rapid progress on its nuclear program now. The US will not be able to lead the P5+1 coalition to force Iran to halt its program because of its ongoing struggles with Russia and China. China is striking long-term cooperation deals with Iran. Israel has a well-established record of taking unilateral action, specifically against regional nuclear programs, known as the “Begin Doctrine.”5 Israel’s threats are credible on this front, although Iran is a much greater operational challenge than Iraq or Syria. Iran’s timeline from nuclear breakout to deliverable nuclear weapon is 12-24 months.6 Iran’s missile program is advanced. Missile programs cannot be monitored as easily as nuclear activity, so foreign powers base the threshold on nuclear capability rather than missile capability. Iran had a strong incentive to move slowly on its nuclear and missile programs in earlier years, to prevent US and Israeli military interference. But as it approaches breakout capacity it has an incentive to accelerate its tempo to a mad dash to achieve nuclear weaponization before the US or Israel can stop it. Now that time may have come. The Biden administration is afraid of higher oil prices and Israeli domestic politics are more divided and risk-averse than before. And yet Iran’s window might close in 2025, as the US could turn aggressive again depending on the outcome of the 2024 election. Hence Iran has an incentive to make its dash now. The US and Israel will restate their red lines against Iranian nuclear weaponization and brandish their military options this year. But the Biden administration will be risk-averse since it does not want to instigate an oil shock in an election year. Israel is more likely than the US to react quickly and forcefully since it is in greatest danger if Iran surprises the world with rapid weaponization. Here are the known constraints on unilateral Israeli military action: Limited Israeli military capability: Israel would have to commit a large number of aircraft, leaving its home front exposed, and even with US “bunker buster” bombs it may not penetrate the underground Fordow nuclear facility.7 Limited Israeli domestic support: The Israeli public is divided on whether to attack Iran. The post-Netanyahu government recently came around to endorsing the US’s attempt to renegotiate the nuclear deal. Limited US support: Washington opposes Israeli unilateralism that could entangle the US into a war. Israel cannot afford to alienate the US, which is its primary security guarantor. Iranian instability: The Iranian regime is under economic distress due to “maximum pressure” sanctions. It is vulnerable to social unrest, not least because of its large youth population. These constraints have been vitiated in various ways, which is why we raise this Israeli unilateralism as a black swan risk: Where there’s a will, there’s a way: If Israel believes its existence will be threatened, it will be willing to take much greater operational risks. It has already shown some ability to set back Iran's centrifuge program beyond the expected.8 Israeli opinion will harden if Iran breaks out: If Iran reaches nuclear breakout or tests a nuclear device, Israeli opinion will harden in favor of military strikes. Prime Minister Naftali Bennett has an incentive to take hawkish actions before he hands the reins of government over to a partner in his ruling coalition as part of a power-sharing agreement. The ruling coalition is so weak that a collapse cannot be ruled out. US opposition could weaken: Biden will have to explore military options if talks fail and Iran reaches nuclear breakout capacity. Once the midterms are over, Israel may have even more freedom to act, while a gridlocked Biden may be looking to shift his focus to foreign policy. Iranian stability: Iran’s social instability has not resulted in massive unrest or regime fracture despite years of western sanctions and a global recession/pandemic. Yet now energy prices are rising and Iran has less reason to believe sanction regimes will be watertight. From Israeli’s point of view, even regime change in Iran would not remove the nuclear threat once nuclear weapons are obtained. Finally, while Israel cannot guarantee that military strikes would successfully cripple Iran’s nuclear program and prevent weaponization, Israel cannot afford not to try. It would be a worse outcome to stand idly by while Iran gets a nuclear weapon than to attack and fail to set that program back. Hence the likeliest outcome over the long run is that Iran pursues a nuclear weapon and Israel attacks to try to stop it, even if that attack is likely to fail (Diagram 1). Diagram 1Game Theory: Will Israel Attack Iran?
Five Black Swans For 2022
Five Black Swans For 2022
Bottom Line: A unilateral Israeli strike is unlikely but would have a massive impact, as 21% of global oil and 26% of natural gas flows through the Strait of Hormuz, and conflict could disrupt regional energy production and/or block passage through the strait itself. Black Swan #4: Cyber Attacks Spill Into Real World Investors are very aware of cyber security risks – it holds a respectable though not commanding position in the ranks of likely crisis events (Table 4). Our concern is that a cyber attack could spill over into the real world, impairing critical infrastructure, supply chains, and/or prompting military retaliation. Table 4Cyber Events Underrated In Consensus View Of Global Risks
Five Black Swans For 2022
Five Black Swans For 2022
Russian attacks on US critical infrastructure by means of ransomware gangs disrupted a US fuel pipeline, meat-packing plant, and other critical infrastructure in 2021. Since then the two countries have engaged in negotiations over cyber security. The Russian Federal Security Bureau has cracked down on one of the most prominent gangs, REvil, in a sign that the US and Russia are still negotiating despite the showdown over Ukraine.9 Yet a re-invasion of Ukraine would shatter any hope of cooperation in the cyber realm or elsewhere. Russia is already using cyberattacks against Ukraine and these activities could expand to Ukraine’s partners if the military conflict expands. Should the US and EU impose sweeping sanctions that damage Russia’s economy, Russia could retaliate, not only by tightening energy supply but also by cyber attacks. Any NATO partners or allies would be vulnerable, though some states will be more reactive than others. Interference in the French election, for example, would be incendiary. The key question is: if Russia strikes NATO states with damaging cyber attacks, at what point would it trigger Article V, the mutual defense clause? There are no established codes of conduct or red lines in cyber space, so the world will have to learn each nation’s limits via confrontation and retaliation. Similar cyber risks could emerge from other conflicts. China is probably not ready to invade Taiwan but it has an interest in imposing economic costs on the island ahead of this fall’s midterm elections. Taiwan’s critical role in the semiconductor supply chain means that disruptions to production would have a global impact. Israel and the US have already used cyber capabilities to attack Iran and set back its nuclear program. These capabilities will be necessary as Iran approaches breakout capacity. Yet Iran could retaliate in a way that disrupts oil supplies. North Korea began a new cycle of provocations last September, accelerated missile tests over the past four months, and is dissatisfied with the unfinished diplomatic business of the Trump administration. In the wake of the last global crisis, 2010, it staged multiple military attacks against South Korea. South Korea may be vulnerable due to its presidential elections in May. The semiconductor or electronics supply chain could be interrupted here as well as in Taiwan. Bottom Line: There is no code of conduct in cyber space. As geopolitical tensions rise, and nations test the limits of their cyber capabilities, there is potential for critical infrastructure to be impaired. This could exacerbate supply chain kinks or provoke kinetic responses from victim nations. Black Swan #5: OPEC 2.0 Falls Apart The basis of the OPEC 2.0 cartel is Russian cooperation with Saudi Arabia to control oil supply and manage the forward price curve. Backwardation, when short-term prices are higher than long-term, is ideal for these countries since they fear that long-term prices will fall. In a world where Moscow and Riyadh both face competition from US shale producers as well as the green energy revolution, cooperation makes sense. Yet the two sides do not trust each other. Cooperation broke down both in 2014 and 2020, sending oil prices plunging. Falling global demand ignited a scramble for market share. Interestingly, Russian military invasions have signaled peak oil price in 1979, 2008, and 2014. Russia, like other petro-states, has greater room for maneuver when oil revenues are pouring in. But high prices also incentivize production, disincentivize cartel discipline, and trigger reductions in global demand (Chart 8). Chart 8Russian Invasions And Oil Price Crashes
Russian Invasions And Oil Price Crashes
Russian Invasions And Oil Price Crashes
Broadly speaking, Saudi oil production rose modestly during times of Russian military adventures, while overall OPEC production was flat or down, and Russian/Soviet production went up (Chart 9). Chart 9Saudi And OPEC Oil Production During Russian Military Adventures
Saudi And OPEC Oil Production During Russian Military Adventures
Saudi And OPEC Oil Production During Russian Military Adventures
Since 2020, we have held that OPEC 2.0 would continue operating but that the biggest risk would come in the form of a renewed US-Iran nuclear deal that freed up Iranian oil exports. In 2014, the Saudis increased production in the face of the US shale threat as well as the Iranian threat. This scenario is still possible in 2022 but it has become a low-probability outcome. Even aside from the Iran dynamic, there is some probability that Russo-Saudi cooperation breaks down as global growth decelerates and new oil supply comes online. Bottom Line: The world’s inflation expectations are elevated and closely linked to oil prices. Yet oil prices hinge on an uneasy political agreement between Russia and Saudi Arabia that has fallen apart twice before. If Russia invades Ukraine, or if US withdraws sanctions on Iran, for example, then Saudi Arabia could make a bid to expand its market share and trigger price declines in the process. Two Bonus Black Swans: Turkey And Venezuela Turkey lashes out: Our Turkish Political Capital Index shows deterioration for President Recep Erdogan’s political capital across a range of variables (Table 5). With geopolitical pressures increasing, and domestic politics heating up ahead of the 2023 elections, Erdogan’s behavior will become even more erratic. His foreign policy could become aggressive, keeping the lira under pressure and/or weighing on European assets. Table 5Turkey: Erdogan’s Political Capital Wearing Thin
Five Black Swans For 2022
Five Black Swans For 2022
Venezuela’s Maduro falls from power: Venezuelan regime changes often follow from military coups. These coups do not only happen when oil prices collapse – sometimes the army officers wait to be sure prices have recovered. Coup-throwers want strong oil revenues to support their new rule. An unexpected change of regimes would affect the oil market due to this country’s giant reserves. Bottom Line: Turkey’s political instability could result in foreign aggression, while Venezuela’s regime could collapse despite the oil price recovery. Investment Takeaways We are booking profits on our tactical long trades on large caps and defensive sectors. We will convert these to relative trades: long large caps over small caps, and long defensives over cyclicals. We also recommend converting our tactical long Japan trade into long Japanese industrials / short German industrials equities. If US-Russia diplomacy averts a war we will reconsider. Matt Gertken Vice President Geopolitical Strategy mattg@bcaresearch.com Footnotes 1 “Gray Rhino” is a term coined by author Michele Wucker to describe large and probable risks that people neglect or avoid. For more, see thegrayrhino.com. 2 Xi Jinping recently characterized the “common prosperity” agenda as follows: “China has made it clear that we strive for more visible and substantive progress in the well-rounded development of individuals and the common prosperity of the entire population. We are working hard on all fronts to deliver this goal. The common prosperity we desire is not egalitarianism. To use an analogy, we will first make the pie bigger, and then divide it properly through reasonable institutional arrangements. As a rising tide lifts all boats, everyone will get a fair share from development, and development gains will benefit all our people in a more substantial and equitable way.” See World Economic Forum, “President Xi Jinping’s message to The Davos Agenda in full,” January 17, 2022, weforum.org. 3 Chancellor Scholz, when asked whether Germany would avoid using the Nord Stream II pipeline if Russia re-invaded Ukraine, said, "it is clear that there will be a high cost and that all this will have to be discussed if there is a military intervention against Ukraine.” He was speaking with NATO Secretary-General Jens Stoltenberg. See Hans Von Der Burchard, “Scholz: Germany will discuss Nord Stream 2 penalties if Russia attacks Ukraine,” Politico, January 18, 2022, politico.eu. 4 For the Begin Doctrine, see Meir Y. Soloveichik, “The Miracle of Osirak,” Commentary, April 2021, commentary.org. 5 The estimate of 12-24 months to mount a nuclear warhead on a missile has been cited by various credible sources, including David Albright and Sarah Burkhard, “Highlights of Iran’s Perilous Pursuit of Nuclear Weapons,” Institute for Science and International Security, August 24, 2021, isis-online.org, and Eric Brewer and Nicholas L. Miller, “A Redline for Iran?” Foreign Affairs, December 23, 2021, foreignaffairs.com. 6 See Edieal J. Pinker, Joseph Szmerekovsky, and Vera Tilson, “Technical Note – Managing a Secret Project,” Operations Research, February 5, 2013, pubsonline.informs.org, as well as “What Can Game Theory Tell Us About Iran’s Nuclear Intentions?” Yale Insights, March 17, 2015, insights.som.yale.edu. 7 See Josef Joffe, “Increasingly Isolated, Israel Must Rely On Nuclear Deterrence,” Strategika 35 (September 2016), Hoover Institution, hoover.org. 8 The sabotage of the Iran Centrifuge Assembly Center at the Natanz nuclear facility in July 2020 “set back Iran’s centrifuge program significantly and continues to do so,” according to David Albright, Sarah Burkhard, and John Hannah, “Iran’s Natanz Tunnel Complex: Deeper, Larger Than Expected,” Institute for Science and International Security, January 13, 2022, isis-online.org. For a recent positive case regarding Israel’s capabilities, see Mitchell Bard, “Military Options Against Iran,” Jewish Virtual Library, American-Israeli Cooperative Enterprise, January 2022, jewishvirtuallibrary.org. 9 For the FSB and REvil, see Chris Galford, “Russian FSB arrests members of REvil ransomware gang following attacks on U.S. infrastructure,” Homeland Preparedness News, January 18, 2022, homelandprepnews.com. For the Colonial Pipeline and JBS attacks, and other ransomware attacks, see Jonathan W. Welburn and Quentin E. Hodgson, “How the United States Can Deter Ransomware Attacks,” RAND Blog, August 9, 2021, rand.org. Strategic Themes Open Tactical Positions (0-6 Months) Open Cyclical Recommendations (6-18 Months)
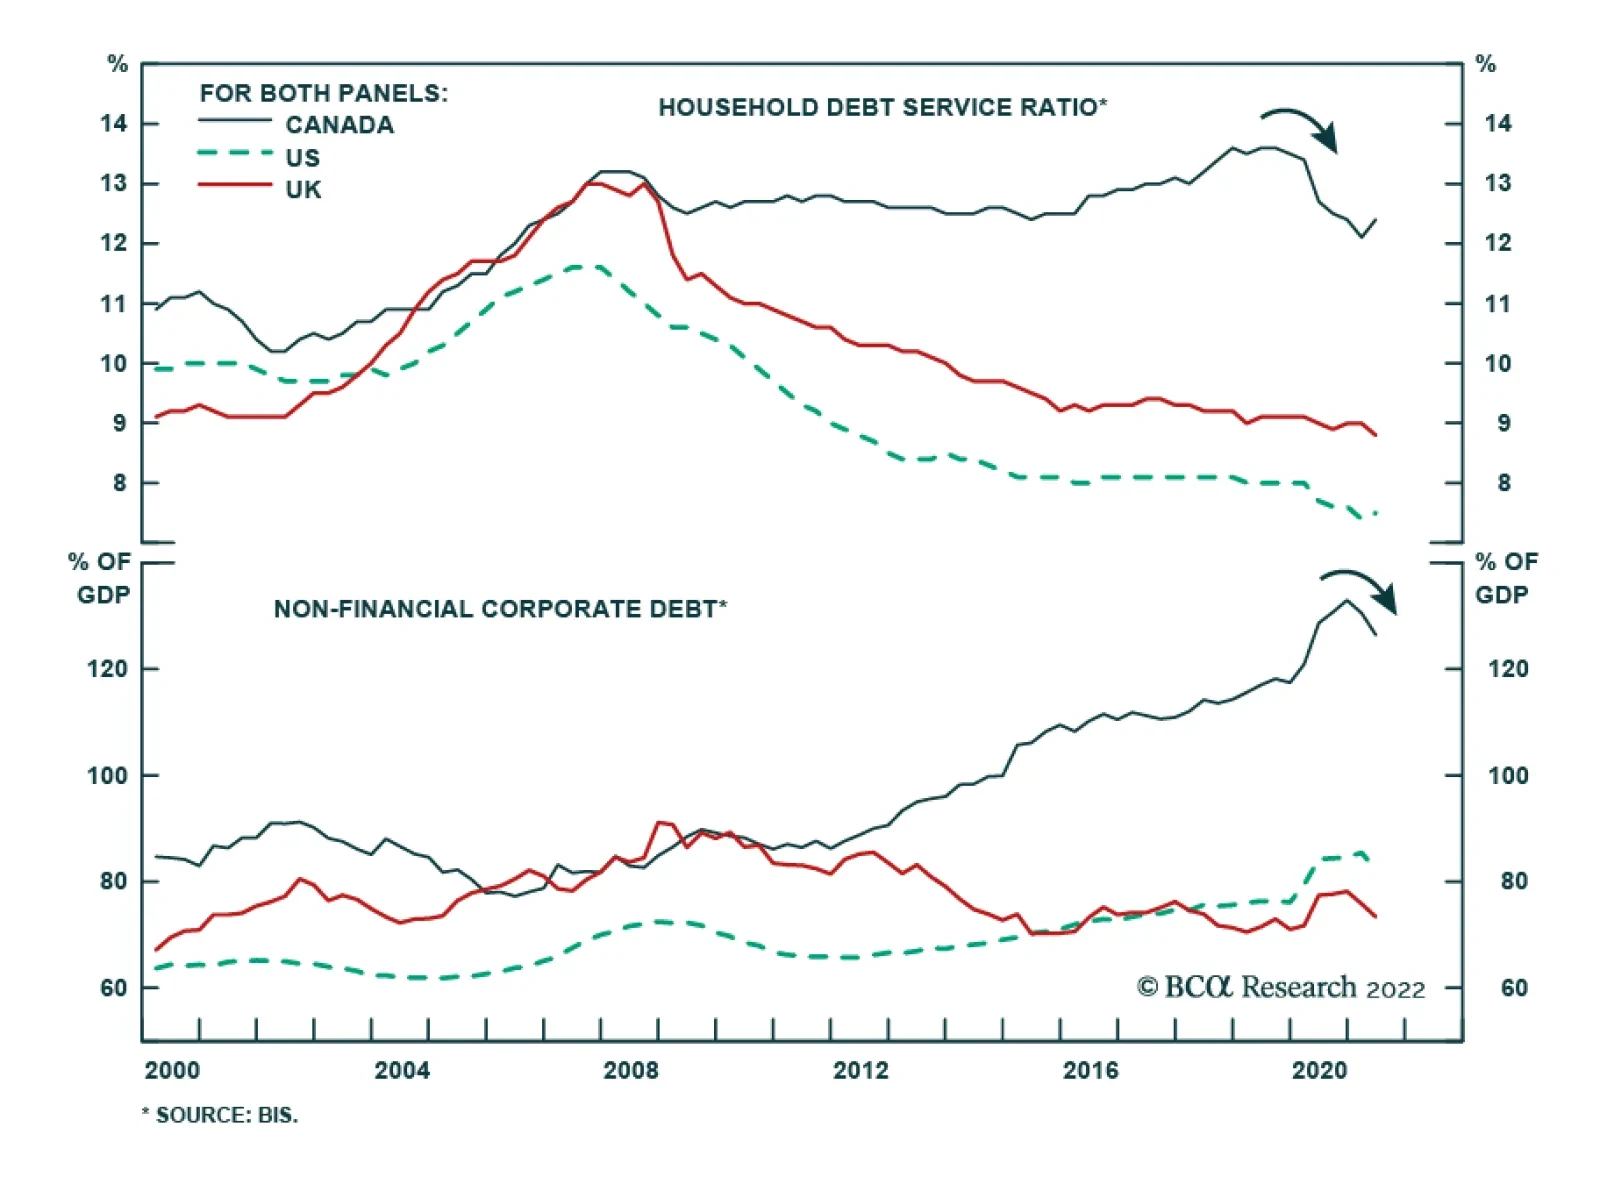
Market participants have aggressively increased their rate hike expectations for Canada over the coming year. Recent data supports this shift. Canada’s headline inflation rate rose to a fresh 30-year high of 4.8% in December. More importantly, all three core…
Highlights US Vs. Europe: Growth and inflation momentum remains stronger in the US versus Europe. The latter is taking the bigger economic hit from more severe Omicron economic restrictions and a greater exposure to slowing Chinese demand. European inflation has accelerated, but remains slower and less broad-based than elevated US inflation. The backdrop remains more negative for US fixed income compared to Europe. UST-Bund Spread: With markets already priced for multiple Fed rate hikes in 2022, it is now harder to earn significant returns shorting US Treasuries outright compared to 2021. We prefer positioning for higher US bond yields through less-volatile US Treasury-German Bund spread widening positions, with the ECB unlikely to deliver even the single discounted 2022 rate hike. We recommend the position both as a structural allocation in bond portfolios (underweight the US versus Germany) and as a tactical trade (selling US Treasury futures versus Bund futures). Feature Chart of the WeekUS Bond Yields & Bond Volatility Are Both Rising
US Bond Yields & Bond Volatility Are Both Rising
US Bond Yields & Bond Volatility Are Both Rising
Global fixed income markets are off to a volatile start in 2022, on the back of significant repricing of US interest rate expectations. The 10-year US Treasury yield now sits at 1.85%, up +34bps so far in January and is up +72bps from the August 4/2021 intraday low of 1.13%. The 2-year US yield, which is even more sensitive to changes in Fed expectations, is 1.04%, up +31bps so far this month and up +87bps since early August 2021. Yields are rising in other countries as well, with the 10-year benchmark government bond yield up year-to-date in the UK (+24bps), Canada (+45bps) and even Germany (+18bps) where the Bund yield is threatening to return to positive territory. US Treasuries are selling off as markets have heeded the hawkish shift in the Fed’s interest rate guidance. The US overnight index swap (OIS) curve now discounting 89bps of Fed rate hikes in 2022. Bond volatility further out the Treasury curve has increased as yields have moved higher, with the realized volatility of the Bloomberg 7-10 US Treasury index now at an 19-month high (Chart of the Week). We continue to recommend a defensive strategic posture towards direct US Treasuries with below-benchmark exposure on both duration and country allocations in global bond portfolios. However, we prefer a more efficient way to position for the same theme of rising US yields – betting on a wider 10-year US Treasury-German Bund spread. US Growth & Inflation Fundamentals Support A More Hawkish Fed The rise in global bond yields seen in recent weeks has inflicted damage on risk assets, but not in a consistent fashion. Equity markets have taken the brunt of the hit, with the S&P 500 down around -3% so far in January with the tech-heavy NASDAQ down -6%. Yet the MSCI emerging market equity index is up around +1%, European equities are flat and global high-yield corporate bond spreads are essentially unchanged so far this month. While higher bond yields are reflecting expectations of more global monetary tightening over the next year, medium-term interest rate expectations remain subdued. Our proxy for the market pricing of terminal interest rate expectations – 5-year OIS rates, 5-years forward – remains at or below pre-pandemic levels in the US, the UK, Canada and the euro area (Chart 2). Risk assets are performing relatively well in the face of higher bond yields because markets still do not believe that a major increase in interest rates will be needed in the current global tightening cycle. We see this – the likelihood that interest rates will have to rise much more than markets expect - as the biggest vulnerability for global bond markets over the next couple of years. The US remains the “poster child” for this view. In the US, core CPI inflation accelerated to an 31-year high of 5.5% in December. The pickup in US inflation continues to be broad-based, with the Cleveland Fed median CPI and trimmed mean CPI inflation measures reaching 3.8% and 4.8%, respectively (Chart 3). This massive run-up in US inflation has filtered through to medium-term household inflation expectations; the preliminary University of Michigan consumer survey for January showed that inflation 5-10 years out is expected to be 3.1% - the highest level in 13 years. Chart 2Rising Yields Are Not A Threat To Risk Assets ... Yet
Rising Yields Are Not A Threat To Risk Assets ... Yet
Rising Yields Are Not A Threat To Risk Assets ... Yet
Chart 3The Fed Cannot Ignore Elevated Inflation Expectations
The Fed Cannot Ignore Elevated Inflation Expectations
The Fed Cannot Ignore Elevated Inflation Expectations
Chart 4US Demand Steadily Normalizing From The Pandemic Shock
US Demand Steadily Normalizing From The Pandemic Shock
US Demand Steadily Normalizing From The Pandemic Shock
While much of the run-up in US inflation over the past year has been fueled by supply chain disruption and high energy prices, there is still a robust demand component to the high inflation. Consumer spending on goods remains elevated versus its pre-pandemic trend, while services spending is steadily returning back to the pre-pandemic pace (Chart 4). The overall US unemployment rate is now down to 3.9%, the lowest level since February 2020, with broad-based strength in the US labor market across most industries (bottom panel). The rise in consumer inflation expectations has to be most worrisome to Fed officials. Yes, market-based inflation expectations have already seen a significant run-up since the mid-2020 lows, and have even drifted down a bit of late on the back of the more hawkish rhetoric from the Fed. However, survey-based measures of inflation expectations tend to be less volatile than market-based measures, and typically follow trends in realized inflation, which is not slowing down in the US. In other words, rising household inflation expectations are a more reliable indication that an inflationary mindset is becoming entrenched in consumer behavior. US inflation dynamics are transitioning away from supply-driven goods inflation toward more lasting domestically driven forces like tight labor markets, faster wage growth and rising housing costs (Chart 5). Measures of supply chain disruption like global shipping costs are showing signs of peaking (top panel), while commodity price momentum has clearly rolled over – both should eventually feed into slower goods inflation this year. At the same time, tight labor markets will continue to boost US employment costs, which historically have been strongly correlated to US services inflation (middle panel). Chart 5US Inflation Pressures Remain Intense
US Inflation Pressures Remain Intense
US Inflation Pressures Remain Intense
Meanwhile, shelter costs, which represents 32% of the US CPI index, were up 4.2% on a year-over-year basis in December and are likely to continue accelerating given a dearth of housing supply versus demand that is pushing up both house prices and rents (bottom panel). Tying it all together, there are good reasons why the Fed has ramped up the hawkish rhetoric over the past couple of months. However, with the US OIS curve now discounting between 3-4 rate hikes in 2022, it will be harder to generate a second consecutive year of negative returns in the US Treasury market this year. Dating back to the early 1970s, there have only been five calendar years where the Bloomberg US Treasury index delivered an outright negative total return: 1994, 1999, 2009, 2013 and 2021 (Chart 6). None of the four cases prior to last year saw negative returns in the following year, as Treasury yields fell in 1995, 2000, 2010, 2014. Yet even the episodes that saw consecutive years of US yield increases – 1974-75, 1977-81, 1987-88, 2005-06 and 2015-16 – did not see outright negative returns from the Bloomberg US Treasury index. Chart 6Negative Return Years For US Treasuries Are Rare
Negative Return Years For US Treasuries Are Rare
Negative Return Years For US Treasuries Are Rare
Given the starting point of deeply negative real US bond yields, and interest rate expectations that remain too low beyond 2022, we still see value in staying below-benchmark on US duration exposure on a medium-term basis. However, we see a more efficient way to play for higher Treasury yields this year by positioning US Treasury underweights/shorts versus overweights/longs in government bonds in a region where discounted rate hikes will not happen – Europe. The ECB Is In No Hurry To Hike Rates The same supply driven factors that have pushed up US inflation over the past year have also lifted inflation in the euro area. Headline HICP inflation reached an 30-year high of 5.0% in December, while core HICP inflation hit an all-time high of 2.6%. The European Central Bank (ECB), however, is unlikely to deliver any rate hikes in 2022 even with the high inflation, for several reasons (Chart 7): Growth momentum entering 2022 was soft, thanks to Omicron related economic restrictions at the end of 2021 and also weak demand for European exports from China. It will take time for both of those factors to reverse, thus reducing any growth related pressure to tighten monetary policy. Inflation expectations are not exceeding the ECB 2% inflation target, with the 5-year/5-year forward EUR CPI swap now at 1.9% even with headline inflation of 5.0%. The surge in European energy prices will eventually subside in the first half of 2022, which will reduce inflationary pressure on the ECB to tighten. The ECB is ending its pandemic emergency bond buying program (PEPP) in March, and is only partially replacing that buying activity by upsizing its existing pre-pandemic asset purchase program (APP). The ECB will not want to compound the effect of this “tapering” of bond buying by also hiking interest rates, which would surely tighten financial conditions further through higher Italian government bond yields, rising corporate bond yields and a firmer euro. There is little evidence to date showing any pass-through of higher energy-fueled inflation into more domestically-driven inflation. Euro area wage growth was only 1.3% as of the latest available data in Q3/2021 (which is still well after realized inflation had started to accelerate), highlighting the lack of visible “second round” effects on euro area inflation from high energy prices that would prompt the ECB to consider rate hikes (Chart 8). Chart 7An ECB Rate Hike In 2022 Is Unlikely
An ECB Rate Hike In 2022 Is Unlikely
An ECB Rate Hike In 2022 Is Unlikely
Chart 8Limited 'Second Round' Effects From Energy-Driven European Inflation
Limited 'Second Round' Effects From Energy-Driven European Inflation
Limited 'Second Round' Effects From Energy-Driven European Inflation
The EUR OIS curve is discounting 7bps of rate hikes by year-end. Even that modest amount will not be delivered, which will limit how much further European government bond yields will rise this year. A Better Mousetrap: Playing UST Bearishness Through UST-Bund Spread Widening Trades Combining our view of an increasingly hawkish Fed and a still-dovish ECB produces our highest conviction investment recommendation for 2022: positioning for a wider 10-year US Treasury/Germany Bund spread. This can be done by underweighting the US versus core Europe in global bond portfolios, or shorting US Treasury futures versus German Bund futures as we are already recommending in our Tactical Trade Overlay (see page 15). A Treasury-Bund spread widening view is a more efficient way to play for a more hawkish Fed and higher US Treasury yields, for several reasons: There are many examples over past 30 years where the Treasury-Bund spread widened in consecutive years (Chart 9). This is in contrast to the fewer occurrences of consecutive years of rising Treasury yields shown earlier in this report. Thus, there are better odds that last year’s Treasury-Bund spread widening can be repeated in 2022. Chart 9Consecutive Years Of A Rising UST-Bund Spread Happen Often
Consecutive Years Of A Rising UST-Bund Spread Happen Often
Consecutive Years Of A Rising UST-Bund Spread Happen Often
The realized volatility of Treasury-Bund spread trades is almost always lower than that of an outright short position in US Treasuries, but the direction of returns of the two trades is similar (Chart 10). This shows that there is directionality in the Treasury-Bund spread (i.e. it is driven far more by the movements of US yields), but that is a welcome feature given our more bearish view on US Treasuries. The Treasury-Bund spread remains well below fair value on our fundamental valuation model, with fair value increasing due to widening US-European inflation differentials (Chart 11). Tighter relative monetary policies this year (more tapering and rate hikes from the Fed compared to the ECB) also favor a wider fair value spread on our model. Chart 10UST-Bund Wideners Have Lower Volatility Than Outright UST Shorts
UST-Bund Wideners Have Lower Volatility Than Outright UST Shorts
UST-Bund Wideners Have Lower Volatility Than Outright UST Shorts
Chart 11The UST-Bund Spread Looks Very Cheap On Our Model
The UST-Bund Spread Looks Very Cheap On Our Model
The UST-Bund Spread Looks Very Cheap On Our Model
The gap between our 24-month discounters, which measure the change in policy interest rates over the next two years discounted in OIS curves, for the US and euro area is a reliable leading indicator of the 10-year Treasury-Bund spread (Chart 12, bottom panel). The “discounter spread” is currently calling for the Treasury-Bund spread to widen by more than the current path discounted in US Treasury and German Bund forward rates. Chart 12Position For More UST-Bund Spread Widening In 2022
Position For More UST-Bund Spread Widening In 2022
Position For More UST-Bund Spread Widening In 2022
Chart 13UST-Bund Spread Is Not Technically Stretched
UST-Bund Spread Is Not Technically Stretched
UST-Bund Spread Is Not Technically Stretched
The Treasury-Bund spread is not stretched from a technical perspective (Chart 13). The spread is sitting right at its 200-day moving average and the 26-week change in the spread (a measure of price momentum) is rising but remains well below previous peak levels that have capped past spread increases. Summing it all up, the case is strong for including US-Germany spread widening positions as core holdings in investor portfolios in 2022. The current spread is 185bps and we have a year-end target of 225bps. Bottom Line: With markets already priced for multiple Fed rate hikes in 2022, it is now harder to earn significant returns shorting US Treasuries outright compared to 2021. We prefer positioning for higher US bond yields through less-volatile US Treasury-German Bund spread widening positions, with the ECB unlikely to deliver even the single discounted 2022 rate hike. We recommend the position both as a structural allocation in bond portfolios (underweight the US versus Germany) and as a tactical trade (selling US Treasury futures versus Bund futures). Robert Robis, CFA Chief Fixed Income Strategist rrobis@bcaresearch.com Recommendations Duration Regional Allocation Spread Product Tactical Trades GFIS Model Bond Portfolio Recommended Positioning Active Duration Contribution: GFIS Recommended Portfolio Vs. Custom Performance Benchmark
Image
The GFIS Recommended Portfolio Vs. The Custom Benchmark Index
Highlights Duration: A look at past rate hike cycles shows that Treasury returns are generally low, though not always negative. For the current cycle, we continue to recommend a below-benchmark portfolio duration stance as we don’t think the full extent of Fed rate hikes is adequately priced in the yield curve. Interest Rate Policy: The Fed will deliver its first rate hike in March and will lift rates 2 or 3 more times this year. We see the fed funds rate moving above 2% this cycle, higher than what is currently priced in the market. Fed Balance Sheet: The Fed will start the passive runoff of its securities holdings in the first half of this year, after one or two rate hikes have been delivered. Balance sheet reduction will proceed more quickly than it did last cycle, but the Fed will refrain from outright sales. Feature Chart 1Market Expectations Are Too Low
Market Expectations Are Too Low
Market Expectations Are Too Low
Rate hikes are just around the corner. In fact, there is a growing consensus among FOMC participants that it will be appropriate to deliver the first rate hike in March, as soon as net asset purchases reach zero. Just last week, San Francisco Fed President Mary Daly called a March rate hike “quite reasonable” and Fed Vice-Chair Lael Brainard testified that the Fed will be “in a position” to lift rates as soon as purchases end. Brainard also mentioned that the Fed has discussed shrinking its balance sheet.1 We expect the Fed to follow through with a 25 basis point rate hike in March, and with 2 or 3 more hikes over the course of 2022. We also see the Fed shrinking its balance sheet this year, via the passive runoff of maturing securities. With all that in mind, this week’s report draws on the experience of past rate hike cycles to give us a sense of what Treasury returns to expect as the Fed lifts rates. We also discuss how the Fed’s balance sheet will evolve over the next few years. Treasury Returns During Rate Hike Cycles Table 1 provides a useful summary of Treasury returns during the prior four rate hike cycles. The table shows excess Treasury returns versus cash for the Bloomberg Barclays Treasury Index as well as its Intermediate Maturity and Long Maturity sub-indexes. Table 1Treasury Returns During Fed Rate Hike Cycles
Positioning For Rate Hikes In The Treasury Market
Positioning For Rate Hikes In The Treasury Market
The first conclusion we draw is that Treasury returns are generally poor during Fed tightening cycles. Intermediate maturity Treasuries underperformed cash in all four cycles. Long maturity Treasuries provided only modestly positive returns in two of the four cycles and deeply negative returns in one of them. One important caveat is that our analysis only considers cycles where the Fed lifted rates multiple times in a row. For example, we exclude the 1997-98 period when one rate hike in 1997 was quickly reversed in 1998. We also define the most recent tightening cycle as spanning from 2015 to 2018 even though the Fed kept the policy rate steady from December 2015 to December 2016. Obviously, if the Fed is forced to abandon its tightening cycle after one or two hikes, then Treasury returns will be much stronger than our historical analysis suggests. Next, let’s dig a bit deeper by looking at each rate hike cycle individually. The 2015-2018 Cycle Chart 22015-2018 Cycle
2015-2018 Cycle
2015-2018 Cycle
The most recent Fed tightening cycle started with a 25 basis point rate hike in December 2015. The Fed then went on hold for 12 months before delivering a string of 8 hikes between December 2016 and December 2018. All in all, the tightening cycle lasted 36 months and the Fed raised the target fed funds rate by 225 bps, from a range of 0% - 0.25% to a range of 2.25% - 2.5% (Chart 2). If we look at the 36-month discounter on the day before the first hike (Chart 2, panel 3), it shows that the market was priced for 159 bps of tightening over the next three years. The fact that the Fed delivered more tightening (225 bps) explains why excess Treasury returns were negative for short and intermediate maturities. The 5-year/5-year forward Treasury yield is another useful metric because it is a good approximation of the market’s expected terminal fed funds rate, i.e. the fed funds rate at the end of the tightening cycle. The 5-year/5-year forward Treasury yield stood at 2.92% in December 2015, slightly above where the fed funds rate peaked in 2018 (Chart 2, bottom panel). This explains why long-maturity excess Treasury returns were slightly positive during the cycle. The 2004-2006 Cycle Chart 32004-2006 Cycle
2004-2006 Cycle
2004-2006 Cycle
During this cycle, which spanned from June 2004 to June 2006, the Fed lifted rates by 400 bps (sixteen 25 basis point rate hikes). The fed funds rate rose from 1% to 5.25% during the two-year span (Chart 3). The 24-month fed funds discounter stood at 369 bps the day before the first hike (Chart 3, panel 3), indicating that the market discounted 31 bps less tightening than was ultimately delivered. Once again, this explains why excess Treasury returns were negative for short and intermediate maturities. The 5-year/5-year forward Treasury yield was 5.72% just prior to the first hike in June 2004 (Chart 3, bottom panel). But, as was the case in the 2015-2018 cycle, the fed funds rate never reached this level. It peaked at 5.25% in 2006 and long-maturity excess Treasury yields were somewhat positive as a result. The 1999-2000 Cycle Chart 41999-2000 Cycle
1999-2000 Cycle
1999-2000 Cycle
In this cycle, the Fed lifted rates by 175 bps between June 1999 and May 2000, driving the fed funds rate from 4.75% to 6.5% (Chart 4). The 12-month fed funds discounter stood at 108 bps on the day before the first hike (Chart 4, panel 3). Once again, this was slightly less than the 175 bps of tightening that transpired. Excess returns for short and intermediate maturity Treasuries were negative as a result. The 5-year/5-year forward Treasury yield was 5.99% on the day before the first hike (Chart 4, bottom panel). This time, the market’s assessment proved to be too low compared to the funds rate’s 6.5% peak. This divergence explains why long-maturity Treasury excess returns were worse during this period than they were in the 2015-18 and 2004-06 cycles. The 1994-1995 Cycle Chart 51994-1995 Cycle
1994-1995 Cycle
1994-1995 Cycle
The Fed surprised markets by lifting rates extremely quickly during this cycle. The Fed moved rates from 3% to 6% in the span of only 12 months between February 1994 and February 1995 (Chart 5). The 12-month discounter was only 130 bps at the beginning of the tightening cycle, well short of the 300 bps rate increase that was delivered (Chart 5, panel 3). This large divergence explains why excess Treasury returns were so poor during this period. Interestingly, the 5-year/5-year forward Treasury yield stood at 6.69% just prior to the first hike (Chart 5, bottom panel), not that far from the ultimate peak in the fed funds rate. In other words, while market expectations for the near-term path of interest rates were too low, expectations for the ultimate peak in interest rates were fairly accurate. However, terminal rate expectations became unmoored when the Fed started to tighten, and the 5-year/5-year forward Treasury yield rose all the way to 8.5%, far above the fed funds rate’s ultimate peak. This dramatic shift in terminal rate expectations explains the deeply negative long-maturity Treasury returns observed during the period. Of course, those losses were quickly reversed in H1 1995 once it became clear that the Fed would not lift rates further. The 5-year/5-year forward Treasury yield plummeted back to 6.5%. Investment Implications Let’s apply the above analysis to today’s situation. At present, the 12-month fed funds discounter stands at 93 bps. The 24-month discounter is 151 bps and the 36-month discounter is 159 bps (Chart 1). In other words, the market is discounting that the Fed will deliver between 3 and 4 rate hikes this year, but only 2 more in 2023 before the funds rate stabilizes at roughly 1.5%. Our expectation is that the fed funds rate will rise to at least 2% during the next three years, and we therefore continue to recommend running below-benchmark portfolio duration. For its part, the 5-year/5-year forward Treasury yield is currently 2.03%. This is at the low-end of survey estimates for the long-run neutral fed funds rate (Chart 1, bottom panel). We expect the 5-year/5-year forward Treasury yield to rise closer to the middle of the range of survey estimates (~2.25%) as it becomes clear that the fed funds rate will rise to at least 2%. It’s also possible that, like in the 1994-95 episode, terminal rate expectations will rise dramatically as the Fed lifts rates more quickly than anticipated. This, however, is not our base case outlook given that expectations for a low terminal fed funds rate are very well entrenched. Bottom Line: A look at past rate hike cycles shows that Treasury returns are generally low, though not always negative. For the current cycle, we continue to recommend a below-benchmark portfolio duration stance as we don’t think the full extent of Fed rate hikes is adequately priced in the yield curve. The Balance Sheet Outlook Chart 6Hike First, Then QT
Hike First, Then QT
Hike First, Then QT
We expect the Fed to start shrinking its securities holdings this year. The process will probably begin in the first half of the year after one or two rate hikes have been delivered. To arrive at this conclusion, we first look at how the Fed proceeded during the last tightening cycle. Back then, the Fed waited until the funds rate was around 1% before it started to shrink its balance sheet in September 2017 (Chart 6). Notably, the Fed didn’t immediately move toward the full passive runoff of its portfolio. Rather, it started slowly by permitting only $6 billion of Treasuries and $4 billion of MBS to mature in October 2017. These amounts were gradually increased in the subsequent months. The Fed will move more quickly toward balance sheet reduction this cycle and the pace of said reduction will be faster. Here are the relevant passages from the minutes of the December FOMC meeting: Almost all participants agreed that it would likely be appropriate to initiate balance sheet runoff at some point after the first increase in the target range for the federal funds rate. However, participants judged that the appropriate timing of balance sheet runoff would likely be closer to that of policy rate liftoff than in the Committee’s previous experience. […] Many participants judged that the appropriate pace of balance sheet runoff would likely be faster than it was during the previous normalization episode. Many participants also judged that monthly caps on the runoff of securities could help ensure that the pace of runoff would be measured and predictable…2 From these quotes, we surmise that balance sheet runoff will start earlier than last time – after one or two rate hikes instead of four. Also, while the runoff will proceed more quickly than last time, there is still support for maintaining monthly caps on the pace. The Fed will probably not move immediately to the complete passive runoff of its portfolio, and outright bond sales do not appear to be part of the discussion. One concern that investors might have about the Fed’s balance sheet runoff is the extra supply of Treasuries that will hit the market. As an upper-bound, if we assume complete passive runoff starting in April 2022, the Fed’s Treasury holdings will shrink from $5.7 trillion today to $3.5 trillion by the end of 2024, adding an average of $715 billion extra Treasury supply to the market each year (Chart 7). If we exclude T-bills and TIPS to focus only on coupon-paying nominal Treasury securities, then we calculate that Fed holdings will fall from $4.9 trillion to $3 trillion, adding an extra $639 billion of supply to the market on average for the next three years. However, it’s important to note that Fed policy alone doesn’t dictate the supply of Treasury securities. The Treasury department’s issuance plans also need to be considered. When the Fed allows a maturing bond to passively roll off its portfolio it doesn’t dump that bond directly into the market. Rather, the Treasury Department issues new debt to replace the maturing bond. The Treasury could decide, for example, to increase T-bill issuance instead of coupon issuance. In fact, this sort of decision becomes more likely if Treasury officials are concerned about dumping too much coupon supply on the market. Currently, the Treasury Department targets a range of 15% - 20% for the amount of outstanding T-bills as a proportion of the overall funding mix, a target that it is hitting (Chart 8). However, the minutes from the most recent Quarterly Refunding meeting stressed that the Treasury feels the need to maintain “flexibility” when it comes to this target range and noted that “there is likely more leeway at the top of the recommended range than at the bottom.”3 Chart 7The Pace Of ##br##Runoff
The Pace Of Runoff
The Pace Of Runoff
Chart 8T-bill Issuance Could Rise As The Fed's Portfolio Shrinks
T-bill Issuance Could Rise As The Fed's Portfolio Shrinks
T-bill Issuance Could Rise As The Fed's Portfolio Shrinks
Finally, it is important to consider the extent to which the Fed will be able to shrink its balance sheet. The Fed’s goal will be to achieve a reserve supply that allows it to maintain the funds rate within its target band without putting undue pressure on either its Overnight Reverse Repo Facility (ON RRP) or its new Standing Repo Facility (SRF). Chart 9The Fed's Balance Sheet Was Too Small In September 2019
The Fed's Balance Sheet Was Too Small In September 2019
The Fed's Balance Sheet Was Too Small In September 2019
The ON RRP acts as a floor on interest rates and its usage therefore increases when the Fed’s balance sheet is too large. The third panel of Chart 9 shows that this is currently the case. Conversely, the SRF acts as a ceiling on interest rates and its usage will ramp up if the Fed’s balance sheet becomes too small. This last occurred in September 2019 when the Fed briefly lost control of interest rates and was forced to increase repo holdings and reserve supply (Chart 9). Going forward, the Fed will continue to run down its balance sheet until ON RRP usage drops close to zero. However, it will want to stop reducing its holdings before SRF usage picks up. It is highly uncertain when this will occur, but we suspect that the Fed won’t be able to get the balance sheet back to September 2019 levels before seeing SRF usage increase. Bottom Line: The Fed will start the passive runoff of its securities holdings in the first half of this year, after one or two rate hikes have been delivered. Balance sheet reduction will proceed more quickly than it did last cycle, but the Fed will refrain from outright sales. While the size of the Fed’s balance sheet will shrink during the next few years, it will remain larger than it was in September 2019. Ryan Swift US Bond Strategist rswift@bcaresearch.com Footnotes 1 Please see https://www.reuters.com/business/exclusive-feds-daly-march-liftoff-is-quite-reasonable-2022-01-13/ and https://www.nbcnews.com/business/economy/interest-rate-hike-come-soon-march-feds-brainard-signals-rcna12112 2 https://www.federalreserve.gov/monetarypolicy/files/fomcminutes20211215.pdf 3 https://home.treasury.gov/news/press-releases/jy0464 Recommended Portfolio Specification Other Recommendations Treasury Index Returns Spread Product Returns
Dear Client, Next week there will be no regular strategy report. Instead, we will hold our quarterly webcast which will discuss the outlook for the European economy and assets in 2022. I look forward to this interaction. Best regards, Mathieu Savary Highlights European and global yields have considerable upside over the coming year, even if inflation peaks in 2022. The post-World War II experience is instructive: massive war-time fiscal and monetary stimulus allowed for an upward re-estimation of the neutral rate as trend nominal growth improved. A similar development is likely to result in an improvement in nominal growth and the neutral rate compared to the post-GFC decade. China and a financial accident outside the US constitute the greatest risks this year to higher yields. European stocks and value stocks will benefit from this rise in yields. Cyclicals in general and industrials in particular are the European sectors most levered to higher yields. Overweight these assets. Defensives will underperform meaningfully if yields rise further. Long Sweden and the Netherlands / Short Switzerland is an appealing trade to bet on higher yields, especially if inflation peaks in 2022. Feature Last week, US Treasury yields finally reached levels that prevailed before the pandemic started. In Europe, German 10-year yields flirted with the symbolic 0% level, rising to their highest reading since May 2019. With the Fed preparing to increase interest rates in March, and global inflation remaining perky, do yields already reflect all the bearish bond news or will they continue to climb higher on a cyclical basis? Moreover, what would be the implications for equity prices of higher yields? BCA expects yields to rise further, for which German Bunds will not be an exception. This process will continue to generate volatility in stock prices, but ultimately, higher equities will prevail. Increasing yields will help European stocks and are strongly associated with an outperformance of cyclical equities. What’s Moving Yields Up? Not all yield increases are created equal. A breakdown of yields helps us understand what investors are pricing in for the future. In the US, the upside in 10-year yields mostly reflects the increase in 5-year yields. This maturity has moved back to levels that prevailed prior to the pandemic, while the 5-year/5-year forward yield remains below its spring 2021 peak (Chart 1, top panel). Moreover, these shifts mirror higher real interest rates, which are rising across maturities, while inflation expectations have been declining in recent weeks or have been flat since mid-2021 on a 5-year/5-year forward basis (Chart 1, middle and bottom panels). This breakdown confirms investors are driving yields higher because they expect more Fed tightening. However, this upgraded view of the Fed’s policy path is limited to the next few years, and long-term policy expectations approximated by the forward rates are not rising as much. In other words, markets do not expect that the Fed will be able to push up interest rates on a long-term basis. In Germany, the breakdown of the most recent shift in yield paints a different picture (Chart 2). As in the US, real yields, not inflation expectations, drove the latest bond selloff. This points toward pricing in an eventual policy tightening in Europe. However, unlike what is happening in the US, 5-year/5-year forward rates are the main force driving yields higher; investors are therefore expecting the ECB to have to follow the Fed later on. Chart 1Near-Term Tightening Is Driving Treasurys
Near-Term Tightening Is Driving Treasurys
Near-Term Tightening Is Driving Treasurys
Chart 2longer-Term Tightening Is Driving Bunds
longer-Term Tightening Is Driving Bunds
longer-Term Tightening Is Driving Bunds
Can the Yield Upside Continue? While BCA’s target for the 10-year Treasury yield in 2022 stands at 2.25% and the Bund yield at 0.25%, the coming two to three years should witness significantly higher yields. The period after World War II offers an interesting historical equivalent. During the War, government spending as a share of GDP exploded, lifting US gross federal debt from 52% of GDP at the dawn of the conflict to 114% at the end of 1945. However, the Fed kept a lid on interest rates during this period to help finance the war effort. T-Bill rates were pegged at 3/8th of a percent and the Fed also capped T-Bond yields at 2.5%. Chart 3The Post WWII Experience
The Post WWII Experience
The Post WWII Experience
As a consequence of this policy effort, the Fed balance sheet increased significantly and continued to do so after the war (Chart 3). The stimulative fiscal and monetary policy, as well as the capacity constraints associated with shifting production from military goods to consumer and capital goods, contributed to an inflation spike to 20% in March 1947. Moreover, the Korean War boosted government spending between 1950 and 1953, resulting in another inflation spike to 9.5% in 1951. The Fed’s cap on yields ended after the March 1951 Treasury-Fed Accord. It was followed by the beginning of a multi-decade uptrend in bond yields, which culminated in 1981 with T-Bond yields above 15% following the inflationary surge of the 1970s. Nonetheless, the yield increase from 2.5% in 1951 to 4% at the end of the 1950s happened after the inflation peak of the Korean War. This original inflection reflected economic vigor and a normalization of the neutral rate after the trauma of the Great Depression. The current situation is not dissimilar. The neutral rate and the market-based estimates of the terminal rate of interest are still very low in the US and in Europe (Chart 4). However, the vast amount of monetary and fiscal stimulus injected in the economy has jolted a recovery. It has also caused a massive wealth transfer to households and the private sector in general that is likely to increase consumption permanently. As a result, growth in the coming decade will be stronger than it was in the past decade, in both the US and Europe. This process will allow the neutral rate to rise over time, which in turn will lift the terminal rate of interest and yields. In this context, even if inflation were to cool in 2022 because some of the supply constraints that marked 2021 dissipate, yields may continue to rise and do so for the remainder of the decade. This is also true in Europe where the household savings rate still towers near 19% of disposable income and may fall by 6% to reach its pre-pandemic levels, as the US experience presages (Chart 5). Chart 4Terminal Rates Proxies Are Too Low
Terminal Rates Proxies Are Too Low
Terminal Rates Proxies Are Too Low
Chart 5European Savings Rate Has Downside
European Savings Rate Has Downside
European Savings Rate Has Downside
A simple modeling exercise confirms that yields will have greater upside over the coming year. Conceptually, yields are anchored by policy rates and the terminal rate, which is somewhere above the neutral rate of interest. One of the key determinants of the nominal neutral rate is the trend growth rate of nominal GDP. While the market cannot know precisely where that growth rate stands, recent experience influences the perception of market participants. Thus, a long-term moving average of nominal GDP growth constitutes a rough proxy of this measure and will relate to investors’ assessment of the neutral rate and the terminal interest rates. Chart 6Bond Yields Are Too Low, Especially If Trend Nominal Growth Picks Up
Bond Yields Are Too Low, Especially If Trend Nominal Growth Picks Up
Bond Yields Are Too Low, Especially If Trend Nominal Growth Picks Up
Using this approach reveals two important bearish forces for bonds. Even after accounting for the slow growth rate of both the US and Eurozone economies over the past ten years, as well as extraordinarily low policy rates, T-Notes and Bunds yields are too low (Chart 6). More importantly, if nominal GDP growth is higher this decade than next, this alone will push up the equilibrium level of yields in Advanced Economies. The upside in yields is not without risks. China is still going through a deflationary shock whereby growth is slowing. As China eases policy, Chinese yields will continue to fall, bucking the global trend (Chart 7). In recent years, Chinese yields have rarely diverged from global yields. If Chinese growth plummets from here, the divergence will not be resolved via higher Chinese yields. However, Chinese authorities do not want growth to collapse. Reports from the State Council suggest an acceleration of the implementation of major spending projects under the 14th Five-year plan and that the credit impulse is trying to bottom. Nonetheless, China remains a risk to monitor closely. The second major risk stems from the intertwined nature of the global financial system. The US economy is able to withstand higher Treasury yields, but is the rest of the world? As Chart 8 highlights, US private debt-servicing costs are low today, as a result of minimal interest rates and the decline in debt loads after the GFC. The same is not true for the G-10 outside the US, let alone EM economies. These differences suggest that the US will be much more resilient to rising yields than the rest of the world. A major financial accident outside the US would prompt a wave of risk aversion that would decrease yields around the world. Chart 7An Unusual Divergence
An Unusual Divergence
An Unusual Divergence
Chart 8Will The Rest Of The World Withstand Higher US Yields?
Will The Rest Of The World Withstand Higher US Yields?
Will The Rest Of The World Withstand Higher US Yields?
Bottom Line: Global yields have much greater upside for the years ahead, even if inflation slows in 2022. While BCA targets 2.25% and 0.25% for, respectively, Treasurys and Bund yields this year, the multi-year upside is much greater as neutral rates are re-adjusted upward. The change will not move in a straight line, but the trend will not be friendly for bondholders. In the near-term, the main culprits preventing higher yields are a further slowdown in China as well as a financial accident outside the US. Investment Implications The most obvious investment implication is that investors should use any pullback in yields to sell duration. As a corollary, investors should maintain an overweight stance on equities relative to bonds. The equity risk premium, especially in Europe, remains elevated, and European dividend yields stand near record highs compared to Bund yields (Chart 9). Moreover, when yields rise because of a higher neutral rate, this also means that the expected long-term growth rate of earnings is firming, which negates some of the adverse impacts on valuations of higher discount rates. Nonetheless, if inflation does not stabilize, the increase in yields could become much more painful for stocks, as the negative correlation between stock prices and bond yields would reassert itself—a possibility we described five weeks ago. A rising neutral rate and terminal rate are also associated with an outperformance of European stocks compared to the US and an outperformance of value stocks over growth stocks in Europe (Chart 10). These relationships reflect the greater procyclicality of European equities and value stocks. Chart 9A Valuation Cushion For Stocks
A Valuation Cushion For Stocks
A Valuation Cushion For Stocks
Chart 10Higher Terminal Rates Favor Europe And Value
Higher Terminal Rates Favor Europe And Value
Higher Terminal Rates Favor Europe And Value
Finally, we looked at the performance of European sectors based on the trend in yields. Table 1 highlights that industrials are the great winner when yields rise, which is a testament to their pro-cyclicality. They beat the market on 3-month, 6-month and 12-month horizons by 1.6%, 2.9% and 5.8%, respectively. The regularity of their benchmark-beating performance is extremely high. When yields rise, financials also see a marked improvement of their relative returns compared to their historical average returns. Surprisingly, so do European tech firms, which reflect the more hardware focus of European tech compared to the US. Table 1Rising Yields & Sector Relative Performance
Implications Of Rising Yields
Implications Of Rising Yields
Table 2 repeats the same exercise, but, this time, we control for the slope of the yield curve, focusing on periods when the yield curve is positively sloped. Again, industrials are the star sector, but other cyclicals such as materials and consumer discretionary also stand out. European tech remains dominated by its cyclical properties, while the outperformance of financials becomes more marked. Table 2Rising Yields & Sector Relative Performance With Postive Yield Curve Slope As A Control Variable
Implications Of Rising Yields
Implications Of Rising Yields
Table 3 looks at the behavior of sectors when yields rise and when the Euro Area PMI Manufacturing improves, which is a scenario we expect for most of 2022 once the winter passes. Industrials win more clearly than materials or consumer discretionary. The European tech sector continues to generate a very strong outperformance, while the excess return of financials firms up as well. This scenario also shows a particularly steep underperformance for all the defensive sectors. Table 3Rising Yields & Sector Relative Performance With Improving Manufacturing PMI As A Control Variable
Implications Of Rising Yields
Implications Of Rising Yields
Table 4 completes the picture, focusing on rising yields when core CPI decelerates, another development we foresee in 2022. Once again, industrials stand out as a result of the extent and regularity of their outperformance. However, under this controlling variable, the performance of materials and consumer discretionary stocks deteriorates significantly. Financials also see a large downgrade to their relative performance. Tech performs best under these circumstances. Here, staples suffer the worst fate, closely followed by utilities and healthcare. Table 4Rising Yields & Sector Relative Performance With Falling Core CPI As A Control Variable
Implications Of Rising Yields
Implications Of Rising Yields
Based on these observations, the highest likelihood scenario is that European cyclicals will outperform defensive equities significantly this year after a period of consolidation since last spring. A more targeted approach would be to overweight industrials and tech at the expense of staples and utilities. Geographically, investors should buy a basket of Swedish (overweight industrials) and Dutch stocks (overweight tech), while selling Swiss stocks (overweight healthcare). Mathieu Savary, Chief European Strategist Mathieu@bcaresearch.com Tactical Recommendations Cyclical Recommendations Structural Recommendations Closed Trades Currency Performance Fixed Income Performance Equity Performance
Highlights It’s true that rising rates often precipitate bear markets, but it takes a while, … : We subscribe to the view that expansions are more likely to be murdered by the Fed than die of old age. It’s hard to envision a plausible scenario in which the Fed could hike rates enough in 2022 to kill this one, though, and even the first half of 2023 would be a reach. … because the Fed only seeks to slow the economy when it’s firing on all cylinders: Earnings are typically growing at a rapid clip and risk aversion is a distant memory when the Fed begins the process of draining the punch bowl. The fed funds rate tipping point can only be definitively identified after the fact, but our estimate has an impressive track record: No one knows for sure where the line of demarcation between easy and tight monetary policy lies, but equities have shined when the fed funds rate is below our equilibrium estimate. We do not share the view that Tech stocks are especially vulnerable to higher interest rates: Although it lacks empirical support outside of a small subset of observations, the Tech vulnerability view has spread more widely than the Omicron variant. Feature Last week’s report discussing the equity impact of impending rate hikes elicited a lot of reaction. A discussion with one investor usually has relevance for other investors, so we are sharing a composite of the questions we received, along with our responses. It gives us the chance to elaborate on some points that we did not previously address in full, but our conclusion remains unchanged. History argues that equities have little to fear from an incremental rate hike campaign, and we expect that they will generate sizable positive excess returns above Treasuries and cash over the next twelve months. The Fed, With Rate Hikes, In The Board Room Why shouldn’t investors be concerned about rate hikes when you yourself have said that the Fed precipitates recessions? As the last expansion stretched on for a record length of time, we regularly repeated the line that expansions don’t die of old age, they die because the Fed murders them. It fits well with our tipping point view of rate hikes and we wholly subscribe to it. It is important to bear in mind, however, that the Fed’s tools act much more slowly than the lethal array of objects in the game of Clue. As we highlighted last week, monetary policy acts with long and variable lags and the Fed accordingly tightens it in increments allowing for real-time feedback that might help it tailor its actions to evolving economic conditions. Ex-the pandemic, tight monetary policy has been a necessary, albeit not sufficient, recession condition for the 60 years covered by our equilibrium fed funds rate estimate. Although not every instance when the fed funds rate exceeded its equilibrium level preceded a recession, no recession occurred when the funds rate was below equilibrium (Chart 1). Owing to monetary policy’s lagged effects, however, the recessions didn’t begin until well after the Fed began to tighten policy. On average, each recession arrived 26 months after Phase I kicked off and 12 months after the policy cycle entered Phase II (Table 1). Peak growth occurs in the early stages of rate hikes, while the Fed is merely easing up on the gas; deceleration only ensues in the latter stages, when the Fed pushes down on the brake pedal. Chart 1Rate Hikes Are A Necessary, But Not Sufficient, Recession Condition ...
Rate Hikes Are A Necessary, But Not Sufficient, Recession Condition ...
Rate Hikes Are A Necessary, But Not Sufficient, Recession Condition ...
Table 1... And It Takes A While For The Economy To Feel Their Full Effect
Q&A About Rate Hikes And Stocks
Q&A About Rate Hikes And Stocks
Index P/E Multiples Don’t Collapse Overnight It’s often said that the Fed hikes rates until something breaks. If equities are ultimately going to break in the process, why wouldn’t a prudent investor read the first rate hike, or even the run-up to it, as a sign to begin reducing exposure? We showed last week that signal measures of economic activity – hiring, lending, spending and GDP – grow well above their through-the-cycle pace while the Fed is tightening policy. Corporate earnings do, too, and S&P 500 earnings expectations have risen most rapidly when the Fed is hiking rates, with Phase I growth nearly doubling aggregate growth (Chart 2, middle panel). Earnings gains are vulnerable to dilution from multiple de-rating, but Phase I multiples have been roughly flat in the aggregate (Chart 2, bottom panel). Perhaps investors recognize that equities don’t break until well after the Fed starts hiking rates, or double-digit earnings growth makes them lose sight of the likelihood that they eventually will. Chart 2Our Definitions Of The Phases Must Be Close To The Mark
Our Definitions Of The Phases Must Be Close To The Mark
Our Definitions Of The Phases Must Be Close To The Mark
Based on the empirical record, investors judged by their relative performance should not reduce equity exposure until the rate hiking campaign is well advanced. Phase I has produced the best returns of any phase in the 42 years that earnings expectations have been compiled and missing out on them could be harmful to a professional investor’s career (Chart 2, top panel). Today’s Starting Point Is Unusually Demanding Have equities ever been this expensive at the start of a tightening cycle? History suggests that equities can rally in a “normal” Phase I even after some initial turbulence, but how much scope do they have to rise from current valuation levels? There is unfortunately scarcely any empirical data to address this question. The nine Phase I episodes account for just eight years of the 42-year earnings expectations era and several of them are very short (Table 2). The one instance when forward multiples were at or above today’s levels, from June through October of 1999, they were able to hold their ground, falling less than a half of a multiple point, or 1.5%. Earnings expectations grew by 6.3% over that period, allowing the S&P 500 to advance at the rate of about 1% per month, in line with its overall Phase I performance since 1979. Table 2Multiples Have Held Their Ground In Phase I
Q&A About Rate Hikes And Stocks
Q&A About Rate Hikes And Stocks
Empirically, however, robust growth in earnings expectations is the basis for overweighting stocks in Phase I, not multiple expansion. We do not expect re-rating as the Fed pushes the funds rate toward its equilibrium level, and we are alert to the certainty that stocks will de-rate sometime in the future if forward multiples are still subject to mean reversion. History shows it won’t necessarily happen in Phase I, though, and TINA may stave it off while there is a dearth of non-equity options offering positive prospective real returns. Disclaimer (BCA Is Human, Too) How can you be certain that your estimate of the equilibrium rate is accurate? We are not certain at all about the level of the equilibrium rate, and nothing we’ve ever written or said should be construed as implying that we are. As we’ve said many times before, the equilibrium rate is a concept. It cannot be directly observed and our attempts to estimate it are no more than our best effort to gain a sense of where the tipping point for financial markets and the economy might be. Our current 3.25% estimate likely sounds quite high, but we take the estimates at any given point in time with a grain of salt. We are not so full of ourselves that we believe we can pin down an amorphous concept to two decimal places in real time, and we have found that thinking of the point estimate as falling within a plausible range is the best way to proceed. Right now, the US Investment Strategy team views the equilibrium rate as somewhere around 2.5% or higher. That’s all the precision we need to assert with high conviction that monetary policy is accommodative and will remain so for all of 2022 and much, if not all, of 2023. For all the inherent uncertainty of attempts to quantify the equilibrium rate, however, the sharp disparity in equity performance across easy and tight monetary policy settings suggests that we’re on the right track. We’re further encouraged by the clear distinctions in earnings and multiples growth across phases (Figure 1), which suggest that monetary policy settings exert a persistent influence on fundamentals and investor appetites. Given that equities have flourished when policy is easy, overweighting stocks in multi-asset portfolios should contribute to outperformance over the next twelve months. Monetary policy settings are not the be-all and the end-all, but we have found that they offer a very useful default guide to asset allocation.
Chart
Fooled By Randomness? The results have been robust over a lengthy period, but how do you know they’re not random? Why does the relationship you’ve cited work? We are convinced that the observed strong-growth/tighter-policy, tepid-growth/easier-policy relationship has a durable structural foundation. The through line is the fact that monetary policy is a blunt instrument that works with indeterminate lags. Its limitations influence the way the Fed deploys it and impose a predictable pattern on its economic and market impacts. The Fed is not quite the meddler that its Libertarian-minded critics make it out to be, hovering over the economy in a continuous effort to fine-tune it. Instead, it acts on a limited basis to ensure that the harms embedded in cyclical extremes do not prevent the economy from reaching its long-run potential. It deploys accommodative measures during recessions to keep hysteresis from turning a cyclical soft patch into a structural albatross and restrictive measures during high-revving expansions to keep the inflation genie from getting out of the bottle. The Fed does not want to root out green shoots before they can take hold, so it does not begin Phase I, or assiduously pursue it, until it is certain that the economy can withstand higher rates, especially while (lagging) inflation readings are tame (Chart 3). It therefore launches tightening cycles with a predictable bias to err on the side of being too easy. Chart 3Inflation Is A Lagging Indicator, ...
Inflation Is A Lagging Indicator, ...
Inflation Is A Lagging Indicator, ...
That bias allows the economy to gather momentum in Phase I, in line with cyclical peaks in activity and earnings growth, and outsized equity and credit returns. Left unchecked, the momentum could produce higher inflation, and the Fed is typically compelled to dial up intervention to counter it. Wielding a blunt instrument that works with a lag, however, the Fed is at risk of going too far, and Phase II hikes often induce a recession. Investors sniff out the looming downturn and de-rate equities. By the time the Fed reverses field and initiates a new easing campaign (Phase III), earnings growth has stalled out and measured inflation is peaking (Table 3). Equities mark time and credit spreads widen until, with a slowdown plainly evident and measured inflation sliding, the Fed shifts to full-on accommodation (Phase IV). It maintains market-friendly settings until the economy begins to look too strong, upon which it intervenes to hold it back, kicking off a new policy cycle. Table 3... Managed With Policy That Works With A Lag
Q&A About Rate Hikes And Stocks
Q&A About Rate Hikes And Stocks
As we showed last week, the direct relationship between activity and rates is immediately apparent in the real economy. Robust activity translates to robust earnings growth, but it is possible that equity multiples will behave differently in the approaching fed funds rate cycle than they have in the past. Although we expect that TINA will protect equities from meaningful de-rating pressure this year, investors should not lose sight of the fact that the earnings estimate era began with the S&P 500’s forward P/E multiple at 7. That rock-bottom starting point paved the way for an annualized 2.6% valuation increase over the last 42 years, but it cannot continue indefinitely, if at all. We are confident that multiples will continue to fare better when the Fed is cutting rates than when it is hiking them, but the cutting tailwinds will likely weaken going forward, while the hiking headwinds will stiffen. Don’t Believe The Hype Tech stocks are especially vulnerable to higher interest rates and the fate of US indexes is intimately bound up with them. Aren’t you dismissing the threat from higher rates a little too easily? The Tech sector’s outsized presence in the S&P 500 has surely contributed to market anxieties over looming rate hikes. We are firmly of the view, however, that popular concerns over Tech stocks’ interest rate vulnerability are way overdone. The idea that their back-loaded earnings profile makes them acutely vulnerable to a higher discount rate in the manner of long duration bonds ignores the fact that their future cash flows are not fixed. Unlike bonds, their owners' claims on earnings ebb and flow as rates rise and fall in line with economic conditions. Chart 4Relative Tech Multiples Have Mostly Moved With Rates, Not Against Them
Relative Tech Multiples Have Mostly Moved With Rates, Not Against Them
Relative Tech Multiples Have Mostly Moved With Rates, Not Against Them
Chart 5
We recently devoted a Special Report to pushing back against the idea that Tech stocks are hostage to interest rates. In it, we argued that a stock’s price can be viewed as the product of its earnings per share and its P/E ratio. The biggest Tech companies’ earnings have a low interest rate sensitivity because they have little debt and do not sell big-ticket items that their customers have to finance, so the purported inverse relationship between Tech stocks’ relative performance and interest rates must be a function of relative P/E multiple changes. Relative Tech multiples and interest rates consistently moved together in the ten years through 2018, however, and were only sporadically negatively correlated over the last three years (Chart 4). Duration is essential for describing the sensitivity of risk-free bond returns to changes in interest rates, but it is an uncomfortable fit with equities. Treasuries exhibit a nearly perfect inverse correlation with changes in interest rates (Chart 5, top panel), but the cash flow uncertainty introduced by even the modest credit risk associated with investment grade corporate bonds reduces the correlation considerably (Chart 5, second panel). Interest rates’ impact on equities is even more attenuated. The S&P 500 is only weakly – and positively – correlated with rates (Chart 5, third panel), just like its Tech sector constituents (Chart 5, bottom panel). Doug Peta, CFA Chief US Investment Strategist dougp@bcaresearch.com