Policy

Highlights The most important question is whether the Fed will hike interest rates by more than what is currently discounted in markets, or less. More hikes will trigger a set of cascading reactions. US bond yields will initially jump, boosting the dollar. But this process could also undermine growth stocks, and the US equity market leadership. Equity portfolio flows have been more important in financing the US trade deficit, than Treasury purchases, since 2020. Hence, a reversal in these flows will undermine a key pillar of support for the dollar. On the flip side, less rate hikes will severely unwind higher interest rate expectations in the US vis-a-vis other developed markets, especially in the euro area and Japan. This means we could be witnessing a shift in the dollar, where upside is capped, and downside is substantial. Feature Chart 1The Dollar In 2021
The Dollar In 2021
The Dollar In 2021
The two most important drivers of the dollar over the last few months have been the spread between US interest rates and other developed markets, as well as the relative performance of US equities (Chart 1). Rising interest rate expectations in the US have led to substantial speculative flows into the US dollar. The outperformance of the US equity market has also coincided with notable portfolio inflows into US equities in 2021. This cocktail of macro drivers has pinned the US dollar in a quandary. If rates rise substantially in the US, and that undermines the US equity market leadership, the dollar could suffer. If US rates rise by less than what the market expects, record high speculative positioning in the dollar will surely reverse. The Dollar And The Equity Market The traditional relationship between the dollar and the equity market was negative for most of the first half of the pandemic. Monetary easing by the Federal Reserve stimulated global financial conditions setting the stage for an epic bull market. The correlation between the S&P 500 and the DXY index was a near perfect inverse correlation for much of 2020 (Chart 2). Chart 3US Equity Portfolio Inflows Have Been Substantial Since 2020
US Equity Portfolio Inflows Have Been Substantial Since 2020
US Equity Portfolio Inflows Have Been Substantial Since 2020
Chart 2The Dollar In ##br##2020
The Dollar In 2020
The Dollar In 2020
The big change in 2021 is that this correlation has shifted, as the Fed has pivoted on monetary policy. This means that investors have been betting on higher stock prices in the US, as well as higher interest rates. In short, portfolio flows into US equities have surged (Chart 3). For the long-duration US equity market, higher interest rates could push it to a tipping point, where it starts to underperform other developed market bourses. This will reverse these equity portfolio flows, hurting the dollar in the process. Profits, Interest Rates And The Dollar The key driver of equity markets is profits in the short run, with valuation starting to matter over the longer run. This in turn becomes the key driver of cross-border equity flows. These flows help dictate currency movements. For much of the previous decade, US profits did much better than overseas earnings. For this reason, the US equity market outperformed, pulling the dollar up, as foreign equity purchases accelerated (Chart 4). The post-pandemic era has seen inflation rising across the world, changing the paradigm for US profits. High inflation, and consequently, higher bond yields, have been synonymous with an underperformance of US profits (Chart 5). Banks profit from higher rates, as they benefit from rising net interest margins. Materials, energy, and industrial stocks, benefit from higher inflation via rising commodity prices that boost their pricing power. In a nutshell, rising inflation tends to be better for value stocks and cyclicals, sectors that are underrepresented in the US. This means portfolio flows into US equities, one of the key drivers of the capital account surplus, could be on the cusp of a substantial reversal. Chart 4The Dollar And Relative Profits
The Dollar And Relative Profits
The Dollar And Relative Profits
Chart 5Bond Yields And Relative Profits
Relative Profits And Bond Yields
Relative Profits And Bond Yields
Second, valuation in the US has become extended as interest rates have fallen. More importantly, US valuations have been more sensitive to changes in interest rates, compared to other developed markets (Chart 6). This is because the US stock market has become increasingly overweight long duration sectors, like technology and healthcare. Higher rates will undermine the valuation premium these sectors command. This will cause the US equity market to derate relative to other cyclical bourses. Chart 6Relative Multiples And Bond Yields
Relative Multiples And Bond Yields
Relative Multiples And Bond Yields
The key point is that the US equity market has been the darling of the last decade, and leadership is at risk from higher rates, via a reset in both relative valuation and relative profits. So, while the US market could perform well in 2022, higher rates could undermine its relative performance to overseas bourses. This will curtail equity portfolio inflows, as capital tends to gravitate to markets with higher expected returns. The Dollar And Relative Interest Rates Over the long term, bond flows are the overarching driver of the currency market. Most market participants expect the Fed to be among the most hawkish in 2022. This is clear in the pricing of the Eurodollar versus Euribor December 2022 contract, or just the relative path of two-year US bond yields versus other markets. This in turn has helped drive speculative positioning in the US dollar towards record highs (Chart 7). Correspondingly, US Treasury inflows have accelerated in recent months, even though real interest rates have not risen that much (Chart 8). In level terms, the trade deficit (that hit a record low of -US$80bn in November) is being helped financed by renewed foreign interest in US Treasurys. Chart 8Interest Rates And Treasury Flows
Interest Rates And Treasury Flows
Interest Rates And Treasury Flows
Chart 7Record Dollar Speculative Positions
Record Dollar Speculative Positions
Record Dollar Speculative Positions
We see two major contradictions in the pricing of US interest rates, relative to other developed markets. First, rising inflation is a global phenomenon and not specific to the US. If inflation proves sticky, other central banks will turn a tad more hawkish to defend their policy mandates. If inflation subsides, the Fed might not be as aggressive in tightening policy as the market expects. This will unwind speculative long positions in the dollar. It will also slow portfolio inflows into US Treasuries. Second, the reality is that outside the ECB and the BoJ, most other developed market central banks have already tightened monetary policy ahead of the Fed. The ability of any central bank to tighten policy will depend on the health of the labor market, and the potential for a wage inflation spiral. One data point that has caught our attention is the participation rate across G10 economies - it is notable that the US has one of the lowest participation rates (Chart 9A). Given that many countries have seen their participation rate recover to pre-pandemic levels, it suggests upside in the US rate. This will be especially the case if fiscal stimulus, which could wane, has been a key reason why the US participation rate has stayed low. In a nutshell, the low participation rate in the US could be a reason the Fed lags market expectations for aggressive rate increases this year. On the flip side, a higher participation rate in places like Canada, Norway, and Australia, could allow their central banks to normalize policy faster than the market expects. There has been a loose correlation between relative changes in the participation rate, and relative changes in inflation across G10 economies (Chart 9B). Chart 9BThe US Relative Participation Rate And Relative Inflation
The US Relative Participation Rate And Relative Inflation
The US Relative Participation Rate And Relative Inflation
Chart 9AUS Labor Force Participation Is Low, But Improving
US Labor Force Participation Is Low, But Improving
US Labor Force Participation Is Low, But Improving
Finally, relative monetary policy tends to be driven by relative growth. US growth remains robust but has been rolling over relative to other developed markets (Chart 10). This is occurring at a time when China is easing monetary policy, which tends to buffet non-US growth. Higher non-US growth could also tip the bond and currency market narrative that the Fed will tighten much faster than other G10 central banks. Chart 10Non-US Growth Is Improving, Relative To US Growth
Non-US GROWTH Is Improving, Relative To US Growth
Non-US GROWTH Is Improving, Relative To US Growth
Conclusion The above analysis suggests we could be entering a paradigm shift in the dollar, where any response by the Fed could eventually trigger the same outcome. Higher rates than the market expects will initially boost the US dollar. But this process will also undermine the US equity market leadership, reversing substantial portfolio inflows in recent years. On the flip side, fewer rate hikes will severely unwind higher rate expectations in the US vis-a-vis other developed markets. Our concluding thoughts from our 2022 outlook, which are consistent with our views herein, were as follows: The DXY could touch 98 in the near term but will break below 90 over the next 12-18 months. An attractiveness ranking reveals the most appealing currencies are JPY, SEK, and NOK, while the least attractive are USD and NZD. Policy convergence will be a key theme at the onset of 2022. Stay long EUR/GBP and AUD/NZD as a play on this theme. Look to buy a currency basket of oil producers versus consumers. We went long the AUD at 70 cents. Terms of trade are likely to remain a tailwind for the Australian dollar. The AUD will benefit specifically in a green revolution. Chester Ntonifor Foreign Exchange Strategist chestern@bcaresearch.com Trades & Forecasts Strategic View Tactical Holdings (0-6 months) Forecast Summary
Highlights The neutral rate of interest in the US is 3%-to-4% in nominal terms or 1%-to-2% in real terms, which is substantially higher than the Fed believes and the market is discounting. The end of the household deleveraging cycle, rising wealth, stronger capital spending and homebuilding, and a structurally looser fiscal stance have all increased aggregate demand. In addition, deglobalization and population aging are depleting global savings, raising the neutral rate in the process. A higher neutral rate implies that monetary policy is currently more stimulative than widely perceived. This is good news for stocks, as it reduces the near-term odds of a recession. The longer-term risk is that monetary policy will stay too loose for too long, causing the US economy to overheat. This could prompt the Fed to raise rates well above neutral, an outcome that would certainly spell the end of the secular equity bull market. Investors should overweight stocks in 2022 but look to turn more defensive in late 2023. We are taking partial profits on our long December-2022 Brent futures trade, which is up 17.3% since inception. We are also closing our short meme stocks trade. AMC and GME are down 53% and 47%, respectively, since we initiated it. The Neutral Rate Matters At first glance, the neutral rate of interest – the interest rate consistent with full employment and stable inflation – seems like a concept only an egghead economist would care about. After all, unlike actual interest rates, the neutral rate cannot be observed in real time. The best one can do is deduce it after the fact, something that does not seem very relevant for investment decisions. While this perspective is understandable, it is misguided. The yield on a long-term bond is largely a function of what investors expect short-term rates to be over the life of the bond. Today, investors expect the Fed to raise rates to only 1.75% during this tightening cycle, a far cry from previous peaks in interest rates (Chart 1). Chart 2Investor Worries That The Fed Will Tighten Too Much Has Led To A Flattening Of The Yield Curve
Investor Worries That The Fed Will Tighten Too Much Has Led To A Flattening Of The Yield Curve
Investor Worries That The Fed Will Tighten Too Much Has Led To A Flattening Of The Yield Curve
Chart 1Expected Rate Hikes Are A Far Cry From Previous Peaks In Interest Rates
Expected Rate Hikes Are A Far Cry From Previous Peaks In Interest Rates
Expected Rate Hikes Are A Far Cry From Previous Peaks In Interest Rates
Far from worrying that the Fed will keep rates too low for too long in the face of high inflation, investors are worried that the Fed will tighten too much. This is the main reason why the yield curve has flattened over the past three months and the 20-year/30-year portion of the yield curve has inverted (Chart 2). Secular Stagnation Remains The Consensus View Why are so many investors convinced that the Fed will be unable to raise rates all that much over the next few years? The answer is that most investors have bought into the secular stagnation thesis, which posits that the neutral rate of interest has fallen dramatically over time. The secular stagnation thesis comes in two versions: The first or “strong form” describes an economy that needs a deeply negative – and hence unattainable – nominal interest rate to reach full employment. Japan comes to mind as an example. The country has had near-zero interest rates since the mid-1990s; and yet it continues to suffer from deflation. The second or "weak form" describes the case where a country needs a low, but still positive, interest rate to reach full employment. Such an interest rate is attainable by the central bank, and hence creates a goldilocks outlook for investors where profits return to normal, but asset prices continue to get propped up by an ultra-low discount rate. The “weak form” version of the secular stagnation thesis arguably describes the United States. Post-GFC Deleveraging Pushed Down The Neutral Rate
Chart 3
One can think of the neutral rate as the interest rate that equates aggregate demand with aggregate supply at full employment. If something causes the aggregate demand curve to shift inwards, a lower real interest rate would be required to bring demand back up (Chart 3). Like many other countries, the US experienced a prolonged deleveraging cycle following the Global Financial Crisis. The ratio of household debt-to-GDP has declined by 23 percentage points since 2008. The need for households to repair their balance sheets weighed on spending, thus necessitating a lower interest rate. Admittedly, corporate debt has risen over the past decade, with the result that overall private debt has remained broadly stable as a share of GDP (Chart 4). However, the drag on aggregate demand from declining household debt was not offset by the boost to demand from rising corporate debt. Whereas falling household debt curbed consumer spending, rising corporate debt did little to boost investment spending. This is because most of the additional corporate debt went into financial engineering – including share buybacks and M&A activity – rather than capex. In fact, the average age of the private-sector capital stock has increased from 21 years in 2010 to 23.4 years at present (Chart 5). Chart 4Household Debt Has Fallen From Its Highs, While Corporate Debt Has Risen Since The GFC
Household Debt Has Fallen From Its Highs, While Corporate Debt Has Risen Since The GFC
Household Debt Has Fallen From Its Highs, While Corporate Debt Has Risen Since The GFC
Chart 5The Average Age Of Capital Stock Has Been Increasing
The Average Age Of Capital Stock Has Been Increasing
The Average Age Of Capital Stock Has Been Increasing
Buoyant Consumer And Business Spending Will Prop Up The Neutral Rate Today, the US economy finds itself in a far different spot than 12 years ago. Households are borrowing again. Consumer credit rose by $40 billion in November, the largest monthly increase on record, and double the consensus estimate (Chart 6). Banks are easing lending standards across all consumer loan categories (Chart 7). Chart 6Big Jump In Consumer Credit
Big Jump In Consumer Credit
Big Jump In Consumer Credit
Chart 7Banks Are Easing Lending Standards For All Consumer Loans
Banks Are Easing Lending Standards For All Consumer Loans
Banks Are Easing Lending Standards For All Consumer Loans
Chart 8Net Worth Has Soared Over The Past Two Years
Net Worth Has Soared Over The Past Two Years
Net Worth Has Soared Over The Past Two Years
Meanwhile, years of easy money have pushed up asset prices, a dynamic that was only supercharged by the pandemic. We estimate that household wealth rose by 145% of GDP between the end of 2019 and the end of 2021 – the largest two-year increase on record (Chart 8). A back-of-the-envelope calculation suggests that this increase in wealth could boost aggregate demand by 5%.1 Reacting to the prospect of stronger final demand, businesses are ramping up capex (Chart 9). After moving sideways for two decades, capital goods orders have soared. Surveys of capex intentions remain at elevated levels. Against the backdrop of empty shelves and warehouses, inventory investment should also remain robust. Residential investment will increase (Chart 10). The homeowner vacancy rate has dropped to a record low, as have inventories of new and existing homes for sale. Homebuilder sentiment rose to a 10-month high in December. Building permits are 11% above pre-pandemic levels. Amazingly, homebuilders are trading at only 7-times forward earnings. We recommend owning the sector. Chart 9Investment Spending Will Stay Strong
Investment Spending Will Stay Strong
Investment Spending Will Stay Strong
Chart 10US Housing Will Remain Well Supported
US Housing Will Remain Well Supported
US Housing Will Remain Well Supported
Fiscal Policy: Tighter But Not Tight Chart 11Chinese Credit Impulse Seems To Be Bottoming
Chinese Credit Impulse Seems To Be Bottoming
Chinese Credit Impulse Seems To Be Bottoming
As in most other countries, the US budget deficit will decline over the next few years, as pandemic-related measures roll off and tax receipts increase on the back of a strengthening economy. Nevertheless, we expect the structural budget deficit to remain 1%-to-2% of GDP larger in the post-pandemic period, following the passage of the infrastructure bill last November and what is likely to be a slimmed down social spending package focusing on green energy, universal pre-kindergarten, and health insurance subsidies. The shift towards structurally more accommodative fiscal policies will play out in most other major economies. In the euro area, spending under the Next Generation EU recovery fund will accelerate later this year, with southern Europe being the primary beneficiary. In Japan, the government has approved a US$315 billion supplementary budget. Matt Gertken, BCA’s Chief Geopolitical Strategist, expects Prime Minister Kishida to pursue a quasi-populist agenda ahead of the upper house election on July 25th. China is also set to loosen policy. The Ministry of Finance has indicated that it intends to “proactively” support growth in 2022. For its part, the PBoC cut the reserve requirement ratio by 50 basis points on December 6th. The 6-month credit impulse has already turned up (Chart 11). More Than The Sum Of Their Parts Chart 12The Labor Share Typically Rises When Unemployment Falls
The Labor Share Typically Rises When Unemployment Falls
The Labor Share Typically Rises When Unemployment Falls
As discussed above, the end of the deleveraging cycle, rising household wealth, stronger capital spending and homebuilding, and a structurally looser fiscal stance have all increased aggregate demand in the US. While each of these factors have independently raised the neutral rate of interest, taken together, the impact has been even greater. For example, stronger consumption has undoubtedly incentivized greater investment by firms eager to expand capacity. Strong GDP growth, in turn, has pushed up asset prices, leading to even more spending. Furthermore, a tighter labor market has propped up wage growth, especially among low-wage workers. Historically, labor’s share of overall national income has increased when unemployment has fallen (Chart 12). To the extent that workers spend more of their income than capital owners, a higher labor share raises aggregate demand, thus putting upward pressure on the neutral rate. The Retreat From Globalization Will Push Up The Neutral Rate… Chart 13The Ratio Of Global Trade-To-Output Has Been Flat For Over A Decade
The Ratio Of Global Trade-To-Output Has Been Flat For Over A Decade
The Ratio Of Global Trade-To-Output Has Been Flat For Over A Decade
Globalization lowered the neutral rate of interest both because it shifted the balance of power from workers to businesses; and also because it allowed countries such as the US, which run chronic current account deficits, to import foreign capital rather than relying exclusively on domestic savings. The era of hyperglobalization has ended, however. The ratio of global trade-to-manufacturing output has been flat for over a decade (Chart 13). Looking out, the ratio could decline as geopolitical tensions between China and the rest of the world continue to simmer, and more companies shift production back home in order to gain greater control over the supply chains of essential goods. … As Will Population Aging Chart 14Most Of The Deceleration In US Potential Real GDP Growth Has Already Taken Place
Most Of The Deceleration In US Potential Real GDP Growth Has Already Taken Place
Most Of The Deceleration In US Potential Real GDP Growth Has Already Taken Place
Aging populations can affect the neutral rate either by dragging down investment demand or by reducing savings. The former would lead to a lower neutral rate, while the latter would lead to a higher rate. As Chart 14 shows, most of the decline in US potential GDP growth has already occurred. According to the Congressional Budget Office, real potential GDP growth fell from over 3% in the early 1980s to about 1.9% today, mainly due to slower labor force growth. The CBO expects potential growth to edge down to 1.7% over the next few decades. In contrast, the depletion of national savings from an aging population is just beginning. Baby boomers are leaving the labor force en masse. They hold over half of US household wealth, considerably more than younger generations (Chart 15). As baby boomers transition from net savers to net dissavers, national savings will fall, leading to a higher neutral rate. The pandemic has accelerated this trend insomuch as it has caused about 1.2 million workers to retire earlier than they would have otherwise (Chart 16).
Chart 15
Chart 16Number Of Retired People Jumped During The Pandemic
Number Of Retired People Jumped During The Pandemic
Number Of Retired People Jumped During The Pandemic
To What Extent Are Higher Rates Self-Limiting? Some commentators contend that any effort by central banks to bring policy rates towards neutral would reduce aggregate demand by so much that it would undermine the rationale for why the neutral rate had increased in the first place. In particular, they argue that higher rates would drag down asset prices, thus curbing the magnitude of the wealth effect. While there is some truth to this argument, its proponents overstate their case. History suggests that stocks tend to brush off rising bond yields, provided that yields do not rise to prohibitively high levels (Table 1). Table 1As Long As Bond Yields Don’t Rise Into Restrictive Territory, Stocks Will Recover
The New Neutral
The New Neutral
Chart 17The Equity Risk Premium Remains High
The Equity Risk Premium Remains High
The Equity Risk Premium Remains High
The last five weeks are a case in point. Both 10-year and 30-year Treasury yields have risen nearly 40 bps since December 3rd. Yet, the S&P 500 has gained 2.7% since then. Keep in mind that the forward earnings yield for US stocks still exceeds the real bond yield by 552 bps, which is quite high by historic standards. The gap between earnings yields and real bond yields is even greater abroad (Chart 17). Thus, stocks have scope to absorb an increase in bond yields without a significant PE multiple contraction. Investment Implications Our analysis suggests that the neutral rate of interest in the US is substantially higher than widely believed. How much higher is difficult to gauge, but our guess is that in real terms, it is between 1% and 2%. This is substantially higher than survey measures of the neutral rate, which peg it at close to 0% in real terms (Chart 18). It is also significantly higher than 10-year and 30-year TIPS yields, which stand at -0.73% and -0.17%, respectively (Chart 19). The neutral rate has also increased in other economies, although not as much as in the US. Chart 18Both The Fed And Investors Have Lowered Their Estimate Of The Neutral Rate
Both The Fed And Investors Have Lowered Their Estimate Of The Neutral Rate
Both The Fed And Investors Have Lowered Their Estimate Of The Neutral Rate
Chart 19Long-Term Real Rates Remain Depressed
Long-Term Real Rates Remain Depressed
Long-Term Real Rates Remain Depressed
If the neutral rate turns out to be higher than the consensus view, then monetary policy is currently more stimulative than widely perceived. That is good news for stocks, as it would reduce the near-term odds of a recession. Hence, we remain positive on stocks over a 12-month horizon, with a preference for non-US equities. In terms of sector preferences, we maintain our bias for banks over tech. The longer-term risk is that monetary policy will stay too easy, causing the economy to overheat. This could prompt the Fed to raise rates well above neutral, an outcome that would certainly spell the end of the secular equity bull market. Such a day of reckoning could be reached by late 2023. Two Trade Updates We are taking partial profits on our long December-2022 Brent futures trade by cutting our position by 50%. The trade is up 17.3% since inception. Bob Ryan, BCA’s Chief Commodity Strategist, still sees upside for oil prices, so we are keeping the other half of our position for the time being. We are also closing our short meme stocks trade. AMC and GME are down 53% and 47%, respectively, since we initiated it. While the outlook for both companies remains challenging, there is an outside chance that they will find a way to leverage their meme status to create profitable businesses. This makes us inclined to move to the sidelines. Peter Berezin Chief Global Strategist peterb@bcaresearch.com Footnotes 1 In line with published estimates, we assume that households spend 5 cents of every one dollar increase in housing wealth, 2 cents of every dollar increase in equity wealth, 10 cents out of bank deposits, and 2 cents out of other assets. Of the 145% of GDP in increased household net worth between the end of 2019 and the end of 2021, 19% stemmed from higher housing wealth, 52% from higher equity wealth, 12% from higher bank deposits, and 17% from other categories. View Matrix
Image
Special Trade Recommendations Current MacroQuant Model Scores
Image
Highlights This week we highlight key charts for US Political Strategy themes and views in the New Year. For H1 2022, we maintain a pro-cyclical, risk-on approach. We favor industrials, energy, infrastructure, and cyclicals. Foreign supply kinks will persist due to Omicron. The US Congress will pass one more spending bill as Democrats try to save their skin ahead of the midterm election. Yet other trends are not so inflationary: Fed rate hikes, an 8% of GDP fiscal drag, and a looming return to congressional gridlock. Midterm elections usually see defensive and growth stocks outperform cyclical and value stocks. This is a risk to our view and may require adjustments later this year. Feature This week we offer our updated US Political Strategy chart pack for the new year. Inflation and stagflation are the top concerns. But the Federal Reserve is kicking into gear, with the market now expecting three-to-four interest rate hikes in 2022 alone. We doubt that will come to pass but it is possible and there is no question that a 12-month core PCE print of 4.7% is forcing the Fed to move. Since the mega-stimulus of March 2020, markets have seen a 91% rally in the S&P 500 and a 114% rally in the tech sector. Ultra-low interest rates and stay-at-home policies created a paradise for tech stocks. But the 10-year Treasury yield surged from 1.45% in December, when Omicron emerged and the Fed turned hawkish, to 1.76% today. An inflation-induced pullback and rotation out of tech stocks was to be expected and has been our most consistent sectoral view. Long-term inflation expectations have not taken off, however. Many investors see secular stagnation over the long run – and even in the short run the resilient dollar should work against inflation. Not only will the Fed wind down asset purchases by $30bn a month starting January 2022 and start hiking rates in March, but also the budget deficit is contracting, making for an 8% of GDP fiscal drag in 2022. In addition the market no longer has any confidence that Congress will pass President Biden’s “Build Back Better” plan. We still think a reconciliation bill will pass, albeit in watered down form. But ultimately the looming midterm election will paralyze Congress, as we argued in our 2022 outlook report, “Gridlock Begins Before The Midterms.” Gridlock will ensure that whatever passes only modestly expands the long-term deficit and then that fiscal taps will be turned off in 2023. In the context of Fed hikes, this should reduce fears of inflation later in 2022, though we still see inflation as a persistent long-term problem. If history is any guide, stocks and bond yields will be flattish for most of the year due to election uncertainty. The difference between this year and other midterm years is that the US consumer is in better financial shape and yet foreign supply kinks will persist due to Omicron. The takeaway is to prefer industrials, energy, small caps, and cyclicals, even though we may not maintain these recommendations for the whole year. We are hedging by staying long health care stocks. Omicron: Less Relevant At Home, More Relevant Abroad American economic growth is declining but will likely settle at or above trend (Chart 1A). Money growth, a proxy for stimulus, is also coming off its peaks while credit growth is rising moderately. The long deleveraging of the American consumer since 2008 appears to have come to an end. But it is too soon to say how aggressively Americans will lever back up and whether a new private sector “debt super cycle” will begin (Chart 1B). Chart 1AEconomic Growth Peaked, Will Slow To Trend
Economic Growth Peaked, Will Slow To Trend
Economic Growth Peaked, Will Slow To Trend
Chart 1BEconomic Growth Peaked, Will Slow To Trend
Economic Growth Peaked, Will Slow To Trend
Economic Growth Peaked, Will Slow To Trend
The Omicron variant of COVID-19 will have a modest negative impact early in the year. Hospitalizations are picking up in the wake of a surge in new cases following Christmas gatherings. Only 61% of Americans are fully vaccinated and only 23% have received the booster shot that is most effective against Omicron (Chart 2A & Chart 2B). Yet new deaths from the disease remain subdued and only about a fifth of those hospitalized go to the intensive care unit today.
Chart 2
Chart 2BCOVID-19 Continues But Relevance Wanes
COVID-19 Continues But Relevance Wanes
COVID-19 Continues But Relevance Wanes
Pharmaceuticals, both vaccines and anti-viral medications, are saving the day and Americans are becoming resigned to the likelihood of getting the virus at some point. Social mobility has dropped off since summer 2021 but will boom in the springtime and consumer confidence is already picking back up (Chart 3A & Chart 3B). The Biden administration is not likely to impose unpopular social restrictions during an election year unless a variant is deadlier, more contagious, and resistant to vaccines, which is not the case with Omicron. Chart 3AOmicron Not A Major Setback For Recovery
Omicron Not A Major Setback For Recovery
Omicron Not A Major Setback For Recovery
The resilience of the US will come with persistent inflation in goods given that Omicron will still cause supply disruptions abroad. Not all countries have as effective vaccines when it comes to Omicron – if they maintain tighter social restrictions, prices of imported goods will continue to rise. The Fed cannot resolve foreign bottlenecks. While manufacturing surveys show bottlenecks easing from last year’s highs, foreign supply constraints will remain a problem throughout the year. Chart 3BOmicron Not A Major Setback For Recovery
Omicron Not A Major Setback For Recovery
Omicron Not A Major Setback For Recovery
Buy The Rumor, Sell The News Of “Build Back Better” The Biden administration and Democratic Party are still likely to pass one last blast of fiscal spending – the “Build Back Better” budget reconciliation act, a social welfare bill. The output gap is virtually closed and the economy does not need new demand stimulus. However, the Democratic Party needs a legislative win ahead of the midterm election. Thin majorities in both chambers of Congress enable a single senator to derail the bill. But the bill’s provisions are popular among political independents and especially the Democratic Party’s base, which is lacking in enthusiasm about the election as things stand (Charts 4A & 4B). Moderate Democrats in the Senate are still negotiating: their goal is to chop the plan down to size and pass only the most popular provisions, rather than to sink the president and their own party.
Chart 4
Chart 4
This means the bill’s top-line spending will be further reduced. The final size should fall from the earlier range of $2.5-$4.7 trillion to $2.3 trillion or less. Add a few tax hikes, like the minimum corporate tax, and the deficit impact will be around $600 billion (Table 1). Table 1"You’ve Gotta Pass It To See What’s In It"
Chart Pack: Gridlock Now
Chart Pack: Gridlock Now
Ultimately we cannot have high conviction on the BBB plan because we cannot predict what a single senator will do. That is a matter of intelligence, not macro analysis.
Chart 5
Chart 5
But subjectively we still give 65% odds that the Democratic Party will circle the wagons and pass the bill. The party views itself as surrounded by populism on both its right and left flanks – a failure to compromise will whet the appetites of both the Sanderistas (left-wing populists) and the Trumpists (right-wing populists) (Chart 5A). The Republicans still have a better position in the states, and the states have constitutional control of elections, so establishment Democrats are more terrified than usual of flopping in the midterm elections (Chart 5B). Otherwise the midterms – which are already likely to be bad for the Democrats – will deal a devastating blow. Republicans are recovering in party affiliation and tentatively surpassing Democrats among independent voters (Chart 6A). Biden and the Democrats lashed out at former President Trump and the Republican Party on the anniversary of the January 6, 2020 rebellion, but this tactic will not lift their popularity in polls. Their current polling is not much better than that of Republicans in 2018, when the latter suffered a bruising defeat in the midterms (Chart 6B). Chart 6ADemocrats Need A Win Before The Midterm
Democrats Need A Win Before The Midterm
Democrats Need A Win Before The Midterm
Chart 6
Biden’s legislation would reduce the fiscal drag marginally in fiscal year 2023 but overall the budget deficit will shrink and then lie flat over 2022-24 regardless of what Congress does (Chart 7). New spending would be marginally inflationary over the long run since the budget deficit is expected to expand again beyond fiscal year 2024.
Chart 7
Republicans will not be able to slash the budget until they control both Congress and the White House, but in that case they are likely to prove big spenders as in the past. Populism will persist on all sides: the political establishment will keep trying to use fiscal profligacy to peel voters away from populists, who are even more fiscally profligate. Only an inflation-induced recession will restore some fiscal discipline – and that is a way off. Ultimately the significance of the BBB bill is to verify whether establishment politicians – fiscal authorities – are capable of moderating their spending plans according to the threat of inflation, as Modern Monetary Theory maintains. Otherwise the implication is that polarization and populism will produce fiscal overshoots regardless of near-term inflation, even with the narrowest of possible majorities in Congress. The latter, a BBB fiscal overshoot, is what we expect. If it happens it will probably be received negatively by the equity market, fearing faster Fed rate hikes, and it would add credibility to long-term concerns about inflation, because it would reveal that fiscal authorities are not good at adjusting in real time. The former, a BBB failure and a halt to fiscal spending, would suggest that fiscal extravagance remains a crisis-era phenomenon and will be reined in by Congress after a crisis passes, which is probably positive for equities. It would at least suggest that fiscal authorities will adjust when the facts change. Of course, how investors respond to any legislative outcome will depend on a range of factors. But the takeaway is this: Inflation fears may or may not peak in the short run but they will persist over the long run. The Fed: Focus On The Framework In the wake of the Great Recession the Federal Reserve as an institution – both the Federal Open Market Committee and the Board of Governors – shifted in a more accommodative or dovish direction (Chart 8). The shift culminated in the review of monetary policy strategy in August 2020, which produced average inflation targeting.
Chart 8
In practice the dovish policy shift is apparent in a real Fed funds rate at -4%, the lowest level since the inflationary 1970s under Fed Chair Arthur Burns. But what is more remarkable is the simultaneous surge in the budget deficit, unlike anything since World War II, and unlike anything in peacetime (Chart 9). Chart 9Inflation And Stagflation Risks
Inflation And Stagflation Risks
Inflation And Stagflation Risks
The massive increase in federal debt, from 34% of GDP in 2000 to 75% before COVID-19 and 106% today, acts as a constraint on any future Fed hawkishness (Chart 10). A Fed chair who drives interest rates too high amid high debt levels will cause a recession and force the debt-to-GDP ratio up even higher. Yet the result of low rates is to stimulate indebtedness. While the private debt super cycle has subsided, a public debt super cycle is thriving. Chart 10A Major Check On Fed Hawkishness
A Major Check On Fed Hawkishness
A Major Check On Fed Hawkishness
This brings us to today’s predicament. The Fed’s criteria for raising interest rates have mostly been met: 12-month core PCE inflation is running at 4.7% while the inflation breakeven rate in the Treasury market suggests that inflation is well anchored and likely to persist above the 2% inflation target for some time (Chart 11A). The economy is virtually at “maximum employment” (Table 2) – the Fed has set aside concerns about low labor force participation to focus on the collapsing unemployment rate, which is now within the range at which it will feed inflation (Chart 11B). Chart 11AThe Fed's Criteria For Liftoff
The Fed's Criteria For Liftoff
The Fed's Criteria For Liftoff
Table 2The Fed’s Criteria For Liftoff
Chart Pack: Gridlock Now
Chart Pack: Gridlock Now
Chart 11BThe Fed's Criteria For Liftoff
The Fed's Criteria For Liftoff
The Fed's Criteria For Liftoff
The takeaway is that the Fed is suddenly restoring the credibility of its 2% inflation target, with headline PCE rapidly coming up on the trajectory established in the wake of the Great Recession (Chart 12), as our US bond strategist Ryan Swift has demonstrated. Chart 12Lo And Behold: Debt Monetization Generates Inflation
Lo And Behold: Debt Monetization Generates Inflation
Lo And Behold: Debt Monetization Generates Inflation
The explosion of fiscal spending played a critical role in generating this new trajectory. The combination of monetary and fiscal accommodation has worked wonders. Assuming the BBB passes, Chairman Powell will face even greater pressure to prevent this correction of the inflation trajectory from overshooting and turning into a wage-price spiral. The unexpected risk would be if the BBB bill fails, the Fed hikes aggressively, global growth sputters, the dollar surges, and Republicans retake Congress — then Powell may yet see disinflationary challenges in his term in office. Our sense is that the BBB will pass, reinforcing Powell’s less dovish pivot, and yet the Fed’s framework will not permit too hawkish of a stance, resulting in persistent inflation risks over the long run. Three Strategic Themes In our annual strategic outlook, we highlighted three structural or strategic themes that are not beholden to the 12-month forecasting period: 1. Rise Of Millennials And Generation Z: The sharp drop in labor force participation will gradually mend in the wake of the crisis but the aging of the population ensures that the general trend will decline over time as the dependency ratio rises (Chart 13A). Chart 13AStrategic Theme #1: Rise Of Millennials/Gen Z
Strategic Theme #1: Rise Of Millennials/Gen Z
Strategic Theme #1: Rise Of Millennials/Gen Z
Chart 13
Politically the millennials and younger generations are gaining clout over time, although their partisan identity will also evolve as they mature and gain a greater stake in the economy and become asset owners (Chart 13B). 2. Peak Polarization: US political polarization stands at historic highs and will likely remain so over the 2022-24 political cycle (Chart 14A). Polarization coincides with the transformation of society amid falling bond yields and technological revolution (Chart 14B). Chart 14AStrategic Theme #2: Peak Polarization
Strategic Theme #2: Peak Polarization
Strategic Theme #2: Peak Polarization
Chart 14BStrategic Theme #2: Peak Polarization
Strategic Theme #2: Peak Polarization
Strategic Theme #2: Peak Polarization
The pandemic era has been especially polarized due to the 2020 election and controversies over vaccination (Chart 15).
Chart 15
Domestic terrorism of whatever stripe is possible (Chart 16). But any historic incidents will generate a majority opposed to political violence. Chart 16Risk Of Domestic Terrorism
Risk Of Domestic Terrorism
Risk Of Domestic Terrorism
True, former President Trump is still likely to run on the Republican ticket, which will ensure that polarization remains elevated (Diagram 1). However, US elections hinge on structural factors, not individuals. Diagram 1GOP 2024 Is Up To Trump
Chart Pack: Gridlock Now
Chart Pack: Gridlock Now
So far structural factors point to policy continuity: not only are Democrats still slated to retain the White House, but President Biden has coopted many of Trump’s key policies, including infrastructure, protectionism, and big budget deficits (Chart 17). If Democrats falter, Trump’s policies will be reaffirmed. The implication is that a new national policy consensus is taking shape beneath the surface.
Chart 17
3. Limited “Big Government”: Americans have been turning away from “small government” and toward “big government” since the 1990s. Voters no longer worry so much about budget discipline and instead look for the “visible hand” of government to support the economy (Charts 18A & 18B).
Chart 18
Chart 18
Both domestic populism and geopolitical challenges encourage this shift. Industrial policy and domestic manufacturing are making a comeback (Table 3). Table 3Strategic Theme #3: Limited “Big Government”
Chart Pack: Gridlock Now
Chart Pack: Gridlock Now
With extremely robust fiscal policy, the US has avoided the policy mistake of the period after the Global Financial Crisis, when premature fiscal tightening undermined the economic recovery (Chart 19). Policy uncertainty will increase as gridlock returns to Congress and fiscal policy will be frozen. But investors need not fear a slide back into deflation. The Republican Party’s populist base may prevent more Democratic social spending but they will not be able to repeal what is done. Chart 19Even With Looming Gridlock, The US Is Far From Tightening Fiscal Policy Too Soon This Time
Even With Looming Gridlock, The US Is Far From Tightening Fiscal Policy Too Soon This Time
Even With Looming Gridlock, The US Is Far From Tightening Fiscal Policy Too Soon This Time
Three Key Views For 2022 The key views for the 12-month period are connected with the above but of a more short-term or cyclical duration: 1. From Single-Party Rule To Gridlock: Republicans are highly likely to win back control of the House of Representatives and likely the Senate (Charts 20A & 20B). President Biden’s approval rating suggests that Democrats could lose 40 seats in the House (Chart 21) and three in the Senate (Chart 22), whereas they only need to lose five and one to lose control. Our quantitative Senate election model shows an even split but the model’s trend favors Republicans, as does the political cycle and partisan enthusiasm (Chart 23).
Chart 20
Chart 20
Chart 21
Chart 22
Chart 23
2. From Legislative To Executive Power: Biden may still pass one more spending bill but otherwise the legislature will be frozen. Democrats will not succeed in ramming legislation through by abolishing the Senate filibuster. Biden will turn to executive decree, where he is already on track to make a historic increase in regulation, which will increase concerns among small business (Chart 24A & Chart 24B). Anti-trust laws are unlikely to be overhauled and Democrats will struggle to bring back the tough anti-trust posture of the 1900s-1950s without new legislation, meaning that Big Tech faces a bigger threat from inflation than regulation (Table 4). The green transition will continue but primarily in the form of any subsidies passed in the reconciliation bill, rather than new taxes or any carbon pricing scheme (Chart 25A & Chart 25B). Chart 24AKey View #2: From Legislative To Executive Power
Key View #2: From Legislative To Executive Power
Key View #2: From Legislative To Executive Power
Chart 24
Table 4Key View #2: From Legislative To Executive Power
Chart Pack: Gridlock Now
Chart Pack: Gridlock Now
Chart 25
Chart 25BGreen Energy: Subsidies But No Carbon Tax
Green Energy: Subsidies But No Carbon Tax
Green Energy: Subsidies But No Carbon Tax
3. From Domestic To Foreign Policy Risks: Biden faces a slew of foreign policy and external risks that could damage the Democrats in the midterms. The surge in illegal immigration on the southern border is truly historic and will have significant policy ramifications over the long run (Chart 26A & Chart 26B). The surge in inflation will force Biden to contend with foreign policy challenges with one hand tied behind his back, since energy supply disruptions could derail his party ahead of the midterm election (Chart 27). While Biden could ease some inflationary pressure via reduced trade tariffs, protectionist impulses will prevail during an election year (Chart 28). Chart 26AKey View #3: External Risks For Biden
Key View #3: External Risks For Biden
Key View #3: External Risks For Biden
Chart 26BKey View #3: External Risks For Biden
Key View #3: External Risks For Biden
Key View #3: External Risks For Biden
Chart 27Foreign Policy Could Hit Prices At Pump
Foreign Policy Could Hit Prices At Pump
Foreign Policy Could Hit Prices At Pump
Chart 28Tariff Relief In 2022? Don't Bet On It
Tariff Relief In 2022? Don't Bet On It
Tariff Relief In 2022? Don't Bet On It
Investment Takeaways The stock market tends to be flat, with risks skewed to the downside, during midterm election years due to policy uncertainty. The same is true for bond yields (Chart 29). Chart 29Stocks And Bond Yields Trend Lower Before Midterms ...
Stocks And Bond Yields Trend Lower Before Midterms ...
Stocks And Bond Yields Trend Lower Before Midterms ...
When united or single-party governments approach midterms, stocks tend to perform worse than for divided governments in midterm years, while bond yields tend to be a bit higher (Chart 30). This trend is supercharged in 2022 due to the inflationary effects of the pandemic. Chart 30... But United Govts See Higher Bond Yields And Weaker Stocks ...
... But United Govts See Higher Bond Yields And Weaker Stocks ...
... But United Govts See Higher Bond Yields And Weaker Stocks ...
Assuming Republicans regain at least the House, the US will transition from united to divided government (gridlock). In previous such transitions, stocks tend to perform in line with the average for a midterm election year, but bond yields skew higher – reinforcing the previous point (Chart 31). Chart 31... Shift From United To Divided Govt Implies Higher Bond Yields Than Otherwise
... Shift From United To Divided Govt Implies Higher Bond Yields Than Otherwise
... Shift From United To Divided Govt Implies Higher Bond Yields Than Otherwise
We will update our US Sector Political Risk Matrix to bring it better into line with our views, particularly in light of Table 5 below regarding sector relative performance during midterm election years. Normally defensives and growth stocks outperform in midterm years, Table 5ConDisc, Tech, Health Do Best During Midterms …But Waning Pandemic Makes An Exception
Chart Pack: Gridlock Now
Chart Pack: Gridlock Now
while cyclicals and value stocks underperform, but 2022 looks to be different due to inflation. Still over the course of the year we would expect the historic trend to reassert itself. Investors should favor cyclicals even though they probably cannot outperform defensives for much longer (Chart 32A). We recommend health care stocks as a hedge given that the dollar should still be resilient this year, Fed hikes should moderate inflation expectations, and midterm policy uncertainty will eventually weigh on risk appetite (Chart 32B). Chart 32AFavor Cyclicals, Though They May Not Outperform Defensives Much Longer
Favor Cyclicals, Though They May Not Outperform Defensives Much Longer
Favor Cyclicals, Though They May Not Outperform Defensives Much Longer
Chart 32BLong Health Care As Hedge
Long Health Care As Hedge
Long Health Care As Hedge
Value stocks are forming a bottom relative to growth stocks, although this trend is less clear in the US, especially among US large caps, than it is abroad (Chart 33). We favor value over growth on a cyclical basis but midterm election uncertainties will pull the other way, making for a choppy bottom. Chart 33Favor Value And Small Caps, Though Bottom Formation Remains Choppy
Favor Value And Small Caps, Though Bottom Formation Remains Choppy
Favor Value And Small Caps, Though Bottom Formation Remains Choppy
The same process is visible on a sector basis, where energy and materials continue to outperform tech (Chart 34A). We recommend staying long energy on a cyclical basis, though its outperformance against tech could abate later in 2022. Infrastructure stocks – such as building and construction materials – also continue to outperform. Since Biden’s honeymoon period ended, the outperformance is largely relative to tech rather than the S&P as a whole. We still favor infrastructure stocks as the fiscal policy theme will continue even beyond the current legislation, which will barely start to be implemented in 2022 (Chart 34B). Chart 34AFavor Energy, Materials, And Infrastructure Versus Tech
Favor Energy, Materials, And Infrastructure Versus Tech
Favor Energy, Materials, And Infrastructure Versus Tech
Chart 34BFavor Energy, Materials, And Infrastructure Versus Tech
Favor Energy, Materials, And Infrastructure Versus Tech
Favor Energy, Materials, And Infrastructure Versus Tech
Matt Gertken Vice President Geopolitical Strategy mattg@bcaresearch.com Strategic View Open Tactical Positions (0-6 Months) Open Cyclical Recommendations (6-18 Months)
Image
Image
Image
Image
Image
Image
Image
Highlights 2022 Key Views & Allocations: Translating our 2022 global fixed income Key Views into recommended positioning within our model bond portfolio results in the following conclusions to begin the year. Target a moderate level of overall portfolio risk, maintain below-benchmark overall duration exposure, make developed market government bond country allocations based on relative expected central bank hawkishness (underweight the US, UK and Canada; overweight Germany, France, Italy, Australia, Japan), and be selective on allocations to global spread product (overweight high-yield with a bias toward Europe over the US, neutral global investment grade, underweight emerging market hard currency debt). Specific Allocation Changes: Much of the current positioning in our model bond portfolio already reflects our 2022 investment themes. The only significant changes we make to begin the year are reducing emerging market USD-denominated corporate bond exposure to underweight, and shifting some high-yield corporate bond exposure from the US to Europe. Feature In our last report of 2021, we published our 2022 Key Views, outlining the themes and investment implications of the 2022 BCA Outlook for global fixed income markets. In this report, our first of the new year, we translate those views into more specific recommendations and allocations within the BCA Research Global Fixed Income Strategy model bond portfolio. The main takeaways are that another year of expected above-trend global growth, even after the risks to start the year from the Omicron variant, will further absorb spare capacity across the developed economies. Realized inflation will slow from the elevated readings of 2021, but will remain high enough to force central banks – led by the US Federal Reserve – to incrementally remove highly accommodative monetary policies put in place during the pandemic. The backdrop for global bond markets will turn far less friendly as a result, with higher bond yields (led by US Treasuries), flatter yield curves and much weaker returns on spread products that have benefited from easy monetary policies like investment grade corporate debt and emerging market (EM) hard currency debt. Against this challenging backdrop for overall fixed income returns, bond investors will need to focus more on relative exposures between countries, sectors and credit ratings to generate outperformance versus benchmarks. Our recommended portfolio allocations to begin 2022 reflect that shift (Table 1). Table 1GFIS Model Bond Portfolio Recommended Positioning For The Next Six Months
Our Model Bond Portfolio Strategy To Begin 2022: Choosing Our Battles Wisely
Our Model Bond Portfolio Strategy To Begin 2022: Choosing Our Battles Wisely
A Review Of The Model Bond Portfolio Performance In 2021 Chart 12021 Performance: A Positive, Yet Volatile, Year
2021 Performance: A Positive, Yet Volatile, Year
2021 Performance: A Positive, Yet Volatile, Year
Before we begin our discussion of the model bond portfolio for 2022, we will take a final look back at the performance of the portfolio in 2021. Last year, the model bond portfolio delivered a small negative total return (hedged into US dollars) of -0.51%, but this still outperformed its custom benchmark index by +36bps (Chart 1).1 It was a very challenging year for global fixed income markets, in aggregate, with significant swings in bond yields (i.e. US Treasuries were up in Q1, down in Q2/Q3, up then down in Q4) and credit spreads (US high-yield spreads fell in H1/2021 and were rangebound in H2/2021, while EM hard currency spreads were stable in H1/2021 before steadily widening during the rest of the year). Over the full year, the government bond portion of the portfolio outperformed the custom benchmark index by +27bps while the spread product segment outperformed by +9bps (Table 2). The bulk of that government bond outperformance occurred during the first quarter of the year when global bond yields surged higher as COVID-19 vaccines began to be distributed and economic optimism improved in response – trends that benefited the below-benchmark duration tilt within the portfolio. The credit market outperformance was more evenly spread out during the final nine months of the year. Table 2GFIS Model Bond Portfolio Full Year 2021 Overall Return Attribution
Our Model Bond Portfolio Strategy To Begin 2022: Choosing Our Battles Wisely
Our Model Bond Portfolio Strategy To Begin 2022: Choosing Our Battles Wisely
In terms of specific country exposures on government debt (Chart 2), our underweight stance on US Treasuries (both in allocation and duration exposure) generated virtually all of the full-year outperformance of the government bond portion of the portfolio (+38bps versus the benchmark). The biggest underperformer was the UK (-9bps), concentrated at the very end of the year as Gilt yields declined on the back of the Omicron surge, to the detriment of our underweight stance. All other country allocations provided little excess return, in aggregate, over the full year in 2021 – although there was significant variance of those returns during the year.
Chart 2
Within spread product (Chart 3), the biggest gains were seen in US high-yield (+19bps) where we remained overweight throughout 2021. The largest drag on performance came from UK investment grade corporates (-9bps), although this all came in Q1/2021 where we maintained an overweight stance at the time and spreads widened. Other spread product sectors delivered little in the way of excess return, although that should not be a surprise as we maintained a neutral stance on US and euro area investment grade corporates – which have a combined 18% weighting within the model bond portfolio custom benchmark index – throughout 2021.
Chart 3
In the end, our recommended portfolio tilts during 2021 were generally on the right side of the market, with our overweights outperforming in an overall down year for bond returns (Chart 4). The numbers would have been even better without the drag on performance in the fourth quarter (-17bps for the entire portfolio). That came entirely from our two biggest government bond underweights – US Treasuries and UK Gilts – which saw significant bond yield declines in response to the emergence of the Omicron variant. (the detailed breakdown of the Q4/2021 performance can be found in the Appendix on pages 19-23).
Chart 4
Importantly, the surge in bond yields seen in the first week of 2022 has already resulted in a full recovery of that Q4/2021 underperformance, providing a good start to the new year for our model portfolio. Top-Down Bond Market Implications Of Our Key Views We now present the specific fixed income investment recommendations that derive from those themes, described along the following lines: overall portfolio risk, overall duration exposure, country allocations within government bonds, yield curve allocations within countries, and corporate credit allocations by country and credit rating. Overall Portfolio Duration Exposure: BELOW BENCHMARK As we concluded in our 2022 Key Views report, longer-maturity government bond yields are now too low given the mix of very high inflation and very low unemployment seen in many countries. While we expect inflation to come down this year from the very rapid pace of 2021, it will not be by enough to force central banks off the path towards rate hikes that already began at the end of last year in places like the UK and New Zealand. The Fed is now signaling that multiple US rate hikes are likely in 2022, while even some European Central Bank (ECB) officials are expressing concern over very high European inflation. Longer maturity bond yields remain too low, in our view, because investors are discounting very low terminal rates – the peak level of policy rates to be reached in the next monetary tightening cycle. (Chart 5). An upward adjustment of global interest rate expectations is likely this year as central banks like the Fed and the Bank of England (BoE) deliver on expected rate hikes, with more tightening necessary beyond 2022. This will be the primary driver of the rise in global bond yields that we expect this year - an outcome that has already begun in the first week of 2022. Chart 5Global Government Bond Yields Vulnerable To Hawkish Repricing
Global Government Bond Yields Vulnerable To Hawkish Repricing
Global Government Bond Yields Vulnerable To Hawkish Repricing
Chart 6Staying Below-Benchmark On Overall Duration Exposure
Staying Below-Benchmark On Overall Duration Exposure
Staying Below-Benchmark On Overall Duration Exposure
We ended 2021 with a model bond portfolio duration that was -0.65 years below that of the custom performance benchmark (Chart 6). We feel comfortable maintaining that position, in that size, to begin the new year. Government Bond Country Allocation: OVERWEIGHT THE EURO AREA (CORE & PERIPHERY), JAPAN & AUSTRALIA; UNDERWEIGHT THE US, UK & CANADA Our country allocation decisions within our model bond portfolio entering 2022 are based on a simple framework. We are overweighting countries where central banks are less likely to raise rates this year, and vice versa. We expect the largest increase in developed market bond yields in 2022 to occur in the US, as markets are still not priced for the cumulative tightening that the Fed will likely deliver over the next couple of years. Markets are also underpricing how much the Bank of England and Bank of Canada will need to raise rates over the full tightening cycle, even with multiple hikes discounted for 2022. We see the necessary upward repricing of post-2022 rate expectations in all three of those countries – the US, UK and Canada – justifying underweight allocations in our model portfolio. Chart 7Our Recommended DM Government Bond Allocations To Start 2022
Our Recommended DM Government Bond Allocations To Start 2022
Our Recommended DM Government Bond Allocations To Start 2022
The opposite is true in core Europe and Australia. Overnight index swap (OIS) curves are discounting multiple rate hikes this year from the Reserve Bank of Australia (RBA) and even an ECB rate hike later in 2022. As we discussed in our Key Views report, there is still not enough evidence pointing to rapid wage growth in Australia or Europe that would force the RBA and ECB to turn more hawkish than their current forward guidance which calls for no rate hikes in 2022. While both central banks may talk about the possibility that monetary policy will need to be tightened, we expect the actual rate hikes to occur in 2023 and not 2022. Thus, both markets justify overweight allocations in our model bond portfolio. We are also maintaining an overweight to Japanese government bonds, as Japanese inflation remains far too low – even in an environment of high energy prices and global supply chain disruption – for the Bank of Japan to contemplate any tightening of monetary policy. The country allocations within the model portfolio as of the end of 2021 all fit with the above analysis, thus we see no major changes that need to be made to begin 2022 (Chart 7).2 The only significant move made was to slightly bump up the size of the overweights in Italy and Spain, to be funded by the reduction in EM corporate bond exposure (as we discuss below). We continue to see a positive case for owning Peripheral European government bonds for the relatively high yields within Europe, with the ECB maintaining an overall dovish policy stance in 2022 even as it scales back the size of its bond buying activity starting in March. Inflation-Linked Bond Allocations: MAINTAIN A NEUTRAL OVERALL ALLOCATION TO GLOBAL LINKERS Chart 8Our Recommended Inflation-Linked Bond Allocations To Start 2022
Our Recommended Inflation-Linked Bond Allocations To Start 2022
Our Recommended Inflation-Linked Bond Allocations To Start 2022
Inflation-linked bonds have been a necessary part of bond investors' portfolios since the lows in global inflation breakeven spreads were seen in mid-2020. Now, with inflation expectations at or above central bank inflation targets in most developed market countries, and with realized inflation likely to subside from current levels this year, the backdrop no longer justifies structural overweights to linkers across all countries. We are sticking with our end-2021 overall neutral allocation to global inflation-linked bonds, focusing more on country allocations based on our inflation breakeven valuation indicators, as discussed in our 2022 Key Views report (Chart 8). This means maintaining a neutral stance on US TIPS and linkers (vs. nominal government bonds) in Canada, Australia and Japan. We are also staying with underweight positions in linkers (vs. nominals) in the UK, Germany, France and Italy where breakevens appear too high based on our indicators. Spread Product Allocation: MAINTAIN A SMALL OVERWEIGHT TO GLOBAL SPREAD PRODUCT FOCUSED ON EUROPEAN & US HIGH-YIELD CORPORATES, WHILE UNDERWEIGHTING EM CREDIT Chart 9Negative Real Yields: Global Bonds' Biggest Vulnerability
Negative Real Yields: Global Bonds' Biggest Vulnerability
Negative Real Yields: Global Bonds' Biggest Vulnerability
Our expectation of above-trend global growth in 2022, with still relatively high inflation (compared to pre-pandemic levels), should be positive for spread products like corporate bonds that benefit from strong nominal economic (and revenue) growth. However, the less accommodative global monetary policy backdrop we also expect is a potential negative for credit market performance - specially as rate hikes put upward pressure on deeply negative real interest rates, most notably in the US (Chart 9). Thus, we are entering 2022 with a cautious, but still positive, overall position on spread product in our model bond portfolio. We are focusing more on credit valuation, however - both in absolute terms and between countries and sectors – to try and generate outperformance for the credit portion of the portfolio. We are maintaining a neutral stance on investment grade corporates in the US, euro area and UK given the tight spread valuations in those markets. We prefer to focus our corporate credit exposure on overweights to high-yield bonds in the US and Europe, but with a marginal preference for European junk bonds over US equivalents as we discussed in our 2022 Key Views report (Chart 10). Within EM USD-denominated credit, we remain cautious entering 2022 given the poor fundamental backdrop for EM credit: slowing momentum of Chinese economic growth and global commodity prices, a firmer US dollar, and a less-accommodative global monetary policy backdrop (Chart 11). Thus, an underweight stance on EM credit is appropriate within the portfolio to start the year. Chart 10Increase Euro High-Yield Exposure Vs US High-Yield
Increase Euro High-Yield Exposure Vs US High-Yield
Increase Euro High-Yield Exposure Vs US High-Yield
Chart 11Reduce EM USD-Denominated Corporate Debt Exposure To Underweight
Reduce EM USD-Denominated Corporate Debt Exposure To Underweight
Reduce EM USD-Denominated Corporate Debt Exposure To Underweight
Chart 12
Finally, we are entering 2022 with the same relative tilt within US mortgage-backed securities (MBS) that we maintained during the latter half of 2021, with an overweight stance on agency commercial MBS and an underweight on agency residential MBS. Based on our outlook for 2022, we are immediately making two marginal changes to the spread product allocations to the model bond portfolio: Reducing the size of our US high-yield overweight and using the proceeds to increase the size of the European high-yield overweight Reducing our EM USD-denominated corporate bond allocation to underweight from neutral, and placing the proceeds into Italian and Spanish government bonds (hedged into USD) to limit the reduction in the portfolio yield from the EM downgrade. The above moves will lower our overall credit overweight versus government bonds from 5% to 4%, all coming from the EM to Italy/Spain switch (Chart 12). Overall Portfolio Risk: MODERATE The changes made to our spread product allocations had no material impact on the estimated tracking error of the model portfolio – the relative volatility versus that of the benchmark. The tracking error is 78bps, still below our self-imposed limit of 100bps but above the lows seen in early 2021 (Chart 13). That higher tracking error is likely related to our underweight stance on US Treasuries, given the rise in bond volatility evident in measures like the MOVE index (bottom panel). Nonetheless, a moderate level of portfolio risk is reasonable given the combination of solid global economic growth, but with tighter global monetary policy, that we expect in 2022. Chart 13Keeping Overall Portfolio Risk At Moderate Levels
Keeping Overall Portfolio Risk At Moderate Levels
Keeping Overall Portfolio Risk At Moderate Levels
Chart 14Positive Portfolio Carry Via Selective Spread Product Overweights
Positive Portfolio Carry Via Selective Spread Product Overweights
Positive Portfolio Carry Via Selective Spread Product Overweights
The overweights to US high-yield, European high-yield and Italian government bonds all contribute to the model bond portfolio having a yield that begins 2022 modestly higher (+14bps) than that of the benchmark index (Chart 14). Portfolio Scenario Analysis For The Next Six Months After making all the changes to our model portfolio allocations, which can be seen in the tables on pages 24-25, we now turn to our regular quarterly scenario analysis to determine the return expectations for the portfolio during the first half of 2022. On the credit side of the portfolio, we use risk-factor-based regression models to forecast future yield changes for global spread product sectors as a function of four major factors - the VIX, oil prices, the US dollar and the fed funds rate (Table 2A). For the government bond side of the portfolio, we avoid using regression models and instead use a yield-beta driven framework, taking forecasts for changes in US Treasury yields and translating those in changes in non-US bond yields by applying a historical yield beta (Table 2B).
Chart
Chart
For our scenario analysis over the next six months, we use a base case scenario plus two alternate “tail risk” scenarios, based on the following descriptions and inputs: Base Case Omicron related economic weakness is visible in some major economies (euro area, Canada), but the US stays resiliently strong and the US labor market continues to tighten. China is a growth laggard, but this will lead to policymakers providing more macro stimulus (credit, monetary, fiscal) starting in Q2/2022. Inflation pressures from supply chain disruption remain stubbornly strong and realized global inflation rates stay elevated for longer. Developed market central banks continue dialing back pandemic-era monetary policy accommodation, led by Fed tapering and a June 2022 liftoff of the funds rate. There is a mild initial bear steepening of the US Treasury curve with additional widening of US inflation breakevens in Q1/2022, leading to bear flattening in Q2 in the run-up to liftoff – the net effect is a parallel shift higher in the entire yield curve. The VIX index stays near current levels at 20, both the US dollar and oil prices are broadly unchanged and the fed funds rate is increased to 0.25%. Hawkish Fed The Omicron wave is short-lived with limited impact on global growth, which remains well above trend. Global inflation only declines moderately from current elevated levels, both from persistent supply squeezes and faster wage growth. China loosens monetary/credit policies and announces new fiscal stimulus in late Q1/2022 – a positive surprise for global growth expectations. Developed economy central banks turn even more hawkish. Fed liftoff is in March, with another hike in June. The US Treasury curve bear-flattens as US inflation breakevens reach their cyclical peak. The VIX index climbs to 25, the US dollar depreciates by -3% (pulled in opposing directions by strong global growth but relatively higher US interest rates), oil prices climb +10% and the fed funds rate is increased to 0.5%. Pessimistic Scenario The Omicron wave persists in many major countries (including the US) and leads to extended lockdowns and weaker consumer spending. Global growth momentum slows sharply. China does not signal adequate stimulus to offset its slowdown, while a weakened Biden administration passes much smaller US fiscal stimulus. Supply chain disruptions persist and are made worse by Omicron, keeping inflation elevated even as growth slows (stagflation). Developed economy central banks, stuck between slowing growth and elevated inflation, are unable to ease in response to economic weakness. The Fed goes for a slower taper that still ends in June, but liftoff is delayed until at least September. The US Treasury curve bull steepens modestly as the front end prices out 2022 hikes. US inflation breakevens remain sticky due to persistent realized inflation. The VIX index climbs to 30, the US dollar appreciates by +5% on a safe haven bid, oil prices fall -10% and the fed funds rate remains at 0%. The excess return scenarios for the model bond portfolio, using the above inputs in our simple quantitative return forecast framework, are shown in Table 3A. The US Treasury yield assumptions are shown in Table 3B. For the more visually inclined, we present charts showing the model inputs and Treasury yield projections in Chart 15 and Chart 16, respectively.
Chart
Chart
Chart 15Risk Factor Assumptions For The Scenario Analysis
Risk Factor Assumptions For The Scenario Analysis
Risk Factor Assumptions For The Scenario Analysis
Chart 16US Treasury Yield Assumptions For The Scenario Analysis
US Treasury Yield Assumptions For The Scenario Analysis
US Treasury Yield Assumptions For The Scenario Analysis
The model bond portfolio is expected to deliver an excess return over its performance benchmark during the next six months of +54bps in the Base Case and +31bps in the Hawkish Fed scenario, but is projected to underperform by -9bps in the Pessimistic scenario. Importantly, there is virtually no expected excess return from the credit side of model bond portfolio in the Hawkish Fed scenario, even with strong global growth. A faster-than-expected pace of Fed rate hikes in the first half of 2022 would be a clear signal to downgrade exposure to the riskier parts of the fixed income universe like US high-yield. Although in that Hawkish Fed scenario, greater-than-expected China stimulus and a weaker US dollar would also represent signals to begin adding back emerging market credit exposure. Robert Robis, CFA Chief Fixed Income Strategist rrobis@bcaresearch.com Footnotes 1 Our model bond portfolio custom benchmark index is the Bloomberg Barclays Global Aggregate Index, but with allocations to global high-yield corporate debt and USD-denominated emerging market debt replacing very high quality spread product (i.e. AA-rated). We believe this to be more indicative of the typical internal benchmark used by global multi-sector fixed income managers. 2 We also made very slight adjustments within the US, Japan, Germany and France allocations to refine our allocations across the various maturity buckets while keeping the overall portfolio duration unchanged entering 2022. Appendix
Image
Image
Image
Image
Image
Recommendations Duration Regional Allocation Spread Product Tactical Trades GFIS Model Bond Portfolio Recommended Positioning Active Duration Contribution: GFIS Recommended Portfolio Vs. Custom Performance Benchmark
Image
The GFIS Recommended Portfolio Vs. The Custom Benchmark Index
Highlights Chart 1Stick With Steepeners
Stick With Steepeners
Stick With Steepeners
The new year promises to be one of Fed tightening. The minutes from the December FOMC meeting reinforced the notion that rate hikes will begin as early as March and the market is now priced for 85 bps of rate increases (between 3 and 4 hikes) by the end of 2022. The long-end of the curve has responded to the hawkishness with the 10-year Treasury yield moving above its previous post-pandemic high of 1.74%. Just as interesting, however, is that the 5-year/5-year forward Treasury yield has only just climbed back to the lower-end of the range of neutral fed funds rate estimates (Chart 1). This has implications for our preferred yield curve positioning. With the 5-year/5-year forward yield still below our target, it makes sense to position for a bear-steepening of the Treasury curve. A shift from steepeners to flatteners will be warranted once the 5-year/5-year is more consistent with survey estimates of the neutral rate. For now, we recommend keeping portfolio duration low and owning 2/10 Treasury curve steepeners (long 2-year, short cash/10 barbell). Feature Table 1Recommended Portfolio Specification
Prepare For Liftoff
Prepare For Liftoff
Table 2Fixed Income Sector Performance
Prepare For Liftoff
Prepare For Liftoff
Investment Grade: Neutral Chart 2Investment Grade Market Overview
Investment Grade Market Overview
Investment Grade Market Overview
Investment grade corporate bonds outperformed the duration-equivalent Treasury index by 60 basis points in December and by 162 bps in 2021. The index option-adjusted spread tightened 7 bps on the month and our quality-adjusted 12-month breakeven spread ticked down to its 6th percentile since 1995 (Chart 2). This indicates that corporate bonds remain expensive, despite the Fed’s pivot toward tightening. The slope of the yield curve is a critical indicator for our corporate bond call. We are very comfortable holding corporate bonds when the 3-year/10-year Treasury slope is above 50 bps, but our work suggests that returns to credit risk take a significant step down once the slope flattens into a range of 0 bps to 50 bps.1 The 3-year/10-year Treasury slope recently bounced off the 50 bps level and it currently sits at 59 bps. However, our fair value estimates for the 3/10 slope suggest that it won’t stay above 50 bps for long (bottom panel). The three scenarios we consider all suggest that the 3/10 slope will break below 50 bps within the next six months.2 We will turn more defensive on corporate bonds once that occurs.
Chart
Chart
High-Yield: Overweight Chart 3High-Yield Market Overview
High-Yield Market Overview
High-Yield Market Overview
High-Yield outperformed the duration-equivalent Treasury index by 216 bps in December and by 669 bps in 2021. The index option-adjusted spread tightened 54 bps on the month, ending the year at 283 bps. The 12-month spread-implied default rate – the default rate that is priced into the junk index assuming a 40% recovery rate on defaulted debt and an excess spread of 100 bps – also fell back to 3.3% (Chart 3). The odds are good that defaults will come in below 3.3% in 2021, which should coincide with the outperformance of high-yield bonds versus duration-matched Treasuries. For context, the high-yield default rate came in at 1.8% for the 12 months ending in November and we showed in a recent report that corporate balance sheets are in excellent shape.3 Specifically, we noted that the ratio of total debt to net worth for the nonfinancial corporate sector has fallen to 41%, the lowest ratio since 2010 (bottom panel). We recommend that investors favor high-yield over investment grade corporate bonds. While, as noted on page 3, we will turn more defensive on credit risk (including high-yield) once the 3/10 Treasury slope moves sustainably below 50 bps, we will likely retain a preference for high-yield over investment grade based on relative valuations. MBS: Underweight Chart 4MBS Market Overview
MBS Market Overview
MBS Market Overview
Mortgage-Backed Securities outperformed the duration-equivalent Treasury index by 21 basis points in December but lagged by 69 bps in 2021. The zero-volatility spread for conventional 30-year agency MBS tightened 6 bps on the month, evenly split between 3 bps of option-adjusted spread (OAS) tightening and a 3 bps drop in the compensation for prepayment risk (option cost) (Chart 4). We wrote in a recent report that MBS’ poor performance in 2021 was attributable to an option cost that was too low relative to the pace of mortgage refinancings, noting that the MBA Refinance Index was slow to fall in 2021, despite the back-up in yields.4 The robust pace of home price appreciation has been an important factor boosting refis, as homeowners have been increasingly incentivized to tap the equity in their homes. With no indication that cash-out refi activity is about to slow, we expect refinancings to remain stubbornly high in 2022. This will put upward pressure on MBS spreads. We recommend an up-in-coupon bias within an overall underweight allocation to MBS. Higher coupon MBS exhibit more attractive option-adjusted spreads and higher convexity than lower coupon MBS. This makes high-coupon MBS (4%, 4.5%) more likely to outperform low-coupon MBS (2%, 2.5%, 3%) in an environment where bond yields are flat or rising (bottom panel). Government-Related: Overweight Chart 5Government-Related Market Overview
Government-Related Market Overview
Government-Related Market Overview
The Government-Related index outperformed the duration-equivalent Treasury index by 34 basis points in December and by 68 bps in 2021. Sovereign debt outperformed duration-equivalent Treasuries by 216 bps in December but lagged by 10 bps in 2021. Foreign Agencies outperformed the Treasury benchmark by 6 bps on the month and by 41 bps in 2021. Local Authority bonds underperformed by 37 bps in December but beat duration-matched Treasuries by 368 bps in 2021. Domestic Agency bonds underperformed by 1 bp in December and were flat versus Treasuries on the year. Supranationals outperformed Treasuries by 2 bps in December and by 20 bps in 2021. The investment grade Emerging Market Sovereign bond index outperformed the duration-equivalent US corporate bond index by 109 bps in December. The Emerging Market Corporate & Quasi-Sovereign index outperformed duration-matched US corporates by 16 bps (Chart 5). Both EM indexes continue to offer significant yield advantages versus US corporate bonds with the same credit rating and duration. We continue to recommend overweighting USD-denominated EM sovereigns and corporates versus investment grade US corporates with the same credit rating and duration.5 Within EM sovereigns, attractive countries include: Philippines, Russia, Mexico, Indonesia, Saudi Arabia, UAE and Qatar. Municipal Bonds: Maximum Overweight Chart 6Municipal Market Overview
Municipal Market Overview
Municipal Market Overview
Municipal bonds outperformed the duration-equivalent Treasury index by 43 basis points in December and by 416 bps in 2021 (before adjusting for the tax advantage). The economic and policy back-drop remains favorable for municipal bond performance. Trailing 4-quarter net state & local government savings are incredibly high (Chart 6) and 2021’s federal spending splurge will support state & local government coffers for some time. A recent report showed that the average duration of municipal bond indexes has fallen significantly during the past few decades, a trend that has implications for how we should perceive municipal bond valuations.6 Specifically, the trend makes municipal bonds more attractive relative to both Treasury securities and investment grade corporates. Long-maturity bonds are especially compelling. We calculate that 12-17 year maturity Revenue munis offer a breakeven tax rate of 19% relative to credit rating and duration matched US corporate bonds. 12-17 year General Obligation Munis offer a breakeven tax rate of 25% versus corporates (panel 2). High-yield muni spreads are reasonably attractive compared to high-yield corporates (panel 4), but we recommend only a neutral allocation to high-yield munis versus high-yield corporates. The deep negative convexity of high-yield munis makes them susceptible to extension risk if bond yields rise. Treasury Curve: Buy 2-Year Bullet Versus Cash/10 Barbell Chart 7Treasury Yield Curve Overview
Treasury Yield Curve Overview
Treasury Yield Curve Overview
The Treasury curve bear-flattened in December but reversed some of that flattening in the first week of January. All in all, the 2-year/10-year Treasury slope has flattened 2 bps since the end of November, bringing it to 89 bps. As noted on the front page of this report, the 5-year/5-year forward Treasury yield is rising but it is still only at the low-end of survey estimates of the long-run neutral fed funds rate. This argues for continuing to hold curve steepeners in the near term. It will make sense to shift into flatteners once the 5-year/5-year forward yield rises to the middle of the range of survey estimates. We also observe that the 2/5/10 butterfly spread is extremely high, both in absolute terms and relative to our model’s fair value (Chart 7). This signals that a 2/10 curve steepening position (long 5-year bullet, short 2/10 barbell) is incredibly cheap. Indeed, the 2/10 slope has already flattened to below the levels that were witnessed on the last two Fed liftoff dates in 2015 and 2004 (panel 4) and the Fed has still not raised rates off the zero bound. A trade long the 5-year bullet and short a duration-matched 2/10 barbell looks attractive in this environment. However, we note that the 2/5 Treasury slope has also flattened to below levels seen on the prior two Fed liftoff dates (bottom panel). In other words, the 2/5 slope also has room to steepen. For that reason, we prefer to focus our long positions on the 2-year Treasury note rather than the 5-year. We recommend buying the 2-year bullet versus a duration-matched cash/10 barbell. We also advise investors to own a position long the 20-year bond versus a duration-matched 10/30 barbell. This latter position offers a very attractive duration-neutral yield advantage of 20 bps. TIPS: Neutral Chart 8TIPS Market Overview
TIPS Market Overview
TIPS Market Overview
TIPS outperformed the duration-equivalent nominal Treasury index by 85 basis points in December and by 830 bps in 2021. The 10-year TIPS breakeven inflation rate rose 8 bps on the month while the 2-year TIPS breakeven inflation rate fell by 2 bps. The 10-year and 2-year rates currently sit at 2.52% and 3.17%, respectively. The Fed’s preferred 5-year/5-year forward TIPS breakeven inflation rate rose 5 bps on the month. It currently sits at 2.19%, somewhat below the Fed’s 2.3% - 2.5% target range. Our valuation indicator shows that 10-year TIPS are slightly expensive compared to 10-year nominal Treasuries (Chart 8), and we retain a neutral allocation to TIPS versus nominals at the long-end of the curve. We acknowledge the risk that a prolonged period of high inflation could lead to a break-out in long-dated TIPS breakevens, but this now looks less likely given the Fed’s increasing hawkishness. We see better trading opportunities at the front-end of the TIPS curve where the 2-year TIPS breakeven inflation rate remains well above the Fed’s target range (panel 4). Short-maturity breakevens are more sensitive to swings in CPI than those at the long end. Therefore, the 2-year TIPS breakeven inflation rate has considerable downside during the next 6-12 months, assuming inflation moderates as we expect. We recommend an underweight allocation to TIPS versus nominals at the front-end of the curve. Given our view that CPI inflation will be lower in 6-12 months, we recommend shorting 2-year TIPS outright, positioning in 2/10 TIPS breakeven inflation curve steepeners (bottom panel) and 2/10 TIPS (real) yield curve flatteners. All three trades will profit from falling short-maturity inflation expectations. ABS: Overweight Chart 9ABS Market Overview
ABS Market Overview
ABS Market Overview
Asset-Backed Securities outperformed the duration-equivalent Treasury index by 5 basis points in December and by 31 bps in 2021. Aaa-rated ABS outperformed by 4 bps in December and by 17 bps in 2021. Non-Aaa ABS outperformed Treasuries by 9 bps in December and by 103 bps in 2021. During the past two years, substantial federal government support for household incomes has caused US households to build up an extremely large buffer of excess savings. During this period, many households have used their windfalls to pay down consumer debt and credit card debt levels have fallen to well below pre-COVID levels (Chart 9). Though consumer credit growth is starting to rebound, debt levels are still low. This indicates that the collateral quality backing consumer ABS remains exceptionally strong. Investors should remain overweight consumer ABS and should take advantage of the high quality of household balance sheets by moving down the quality spectrum, favoring non-Aaa rated securities over Aaa-rated ones. Non-Agency CMBS: Neutral Chart 10CMBS Market Overview
CMBS Market Overview
CMBS Market Overview
Non-Agency Commercial Mortgage-Backed Securities outperformed the duration-equivalent Treasury index by 24 basis points in December and by 180 bps in 2021. Aaa Non-Agency CMBS outperformed Treasuries by 17 bps in December and by 80 bps in 2021. Non-Aaa Non-Agency CMBS outperformed Treasuries by 42 bps in December and by 513 bps in 2021 (Chart 10). Though returns have been strong and spreads remain relatively high, particularly for lower-rated CMBS, we continue to recommend only a neutral allocation to the sector because of the structurally challenging environment for commercial real estate. Agency CMBS: Overweight Agency CMBS outperformed the duration-equivalent Treasury index by 12 basis points in December and by 70 bps in 2021. The average index option-adjusted spread tightened 1 bp on the month. It currently sits at 36 bps (bottom panel). Though Agency CMBS spreads have recovered to well below their pre-COVID levels, they still look attractive compared to other similarly risky spread products. Stay overweight. Appendix A: Butterfly Strategy Valuations The following tables present the current read-outs from our butterfly spread models. We use these models to identify opportunities to take duration-neutral positions across the Treasury curve. The following two Special Reports explain the models in more detail: US Bond Strategy Special Report, “Bullets, Barbells And Butterflies”, dated July 25, 2017, available at usbs.bcaresearch.com US Bond Strategy Special Report, “More Bullets, Barbells And Butterflies”, dated May 15, 2018, available at usbs.bcaresearch.com Table 4 shows the raw residuals from each model. A positive value indicates that the bullet is cheap relative to the duration-matched barbell. A negative value indicates that the barbell is cheap relative to the bullet. Table 4Butterfly Strategy Valuation: Raw Residuals In Basis Points (As Of December 31st, 2021)
Prepare For Liftoff
Prepare For Liftoff
Table 5 scales the raw residuals in Table 4 by their historical means and standard deviations. This facilitates comparison between the different butterfly spreads. Table 5Butterfly Strategy Valuation: Standardized Residuals (As Of December 31st, 2021)
Prepare For Liftoff
Prepare For Liftoff
Table 6 flips the models on their heads. It shows the change in the slope between the two barbell maturities that must be realized during the next six months to make returns between the bullet and barbell equal. For example, a reading of -58 bps in the 5 over 2/10 cell means that we would expect the 5-year to outperform the 2/10 if the 2/10 slope flattens by less than 58 bps during the next six months. Otherwise, we would expect the 2/10 barbell to outperform the 5-year bullet. Table 6Discounted Slope Change During Next 6 Months (BPs)
Prepare For Liftoff
Prepare For Liftoff
Appendix B: Excess Return Bond Map The Excess Return Bond Map is used to assess the relative risk/reward trade-off between different sectors of the US bond market. It is a purely computational exercise and does not impose any macroeconomic view. The Map’s vertical axis shows 12-month expected excess returns. These are proxied by each sector’s option-adjusted spread. Sectors plotting further toward the top of the Map have higher expected returns and vice-versa. Our novel risk measure called the “Risk Of Losing 100 bps” is shown on the Map’s horizontal axis. To calculate it, we first compute the spread widening required on a 12-month horizon for each sector to lose 100 bps or more relative to a duration-matched position in Treasury securities. Then, we divide that amount of spread widening by each sector’s historical spread volatility. The end result is the number of standard deviations of 12-month spread widening required for each sector to lose 100 bps or more versus a position in Treasuries. Lower risk sectors plot further to the right of the Map, and higher risk sectors plot further to the left.
Chart 11
Ryan Swift US Bond Strategist rswift@bcaresearch.com Footnotes 1 Please see US Bond Strategy Weekly Report, “Expected Returns In Corporate Bonds”, dated September 21, 2021. 2 We consider three scenarios for the fed funds rate. (1) March liftoff, 100 bps per year hike pace, 2.08% terminal rate. (2) March liftoff, 75 bps per year hike pace, 2.08% terminal rate. (3) March liftoff, 75 bps per year hike pace, 2.33% terminal rate. 3 Please see US Bond Strategy Weekly Report, “The Fed’s Inflation Problem”, dated November 23, 2021. 4 Please see US Bond Strategy Weekly Report, “The Omicron Impact”, dated November 30, 2021. 5 Please see US Bond Strategy Special Report, “2022 Key Views: US Fixed Income”, dated December 14, 2021. 6 Please see US Bond Strategy Weekly Report, “The Best & Worst Spots On The Yield Curve”, dated October 26, 2021.
Highlights The prospect of Fed rate hikes seems to be weighing on 2022 equity return expectations, … : Financial media outlets have been sounding the alarm about the impact of rate hikes on equity returns. … but we think concerned investors are getting ahead of themselves, because monetary policy works with a lag, … : It takes time for changes in the fed funds rate to work their way through the economy. Even if the FOMC initiates a rate hike campaign in March, its effects may not begin to be felt until September or next March. … and the fed funds rate is miles away from becoming restrictive: In inflation-adjusted terms, the entire interest rate structure is incredibly supportive of economic activity. Assuming 4% inflation, the real fed funds rate will still be well below the bottom of its 2013-19 range even if all of the rate hikes investors are currently discounting occur in 2022. We continue to believe that it is too soon to turn defensive in multi-asset portfolios: The bull markets in equities and credit will eventually end, but not while the FOMC is only beginning to unwind maximum monetary accommodation. Feature The release of the minutes from the FOMC’s December meeting momentarily roiled financial markets last week. The minutes had a distinctly hawkish tone, pointing to a mid-March liftoff date and raising the specter of a shrinking Fed balance sheet. The ensuing sell-off dovetailed with rising anxiety in the financial media about the potentially adverse equity market impacts of impending rate hikes. The opening two paragraphs of “The Big Uneasy” article that filled the front page of The New York Times’ Business section on New Year’s Day captured the prevailing tone:1 For two years, the stock market has been largely able to ignore the lived reality of Americans during the pandemic … because of underlying policies that kept it buoyant. Investors can now say goodbye to all that. The body of the article was much more measured, pointing out that a series of rate hikes would eventually slow the economy and could diminish investors’ near-term appetite for equities, before wrapping up with a wildly sensationalist quote. “The nightmare scenario is: The Fed tightens and it doesn’t help,” said Aaron Brown, a former risk manager of AQR Capital Management who now manages his own money and teaches math at [NYU]. Mr. Brown said that if the Fed could not orchestrate a “soft landing” for the economy, things could start to get ugly – fast. And then, he said, the Fed may have to take “very aggressive action like a rate hike to 15 percent, or wage and price controls, like we tried in the ‘70s.” By an equal measure, the Fed’s moves, even if they are moderate, could also cause a sell-off in stocks, corporate bonds and other riskier assets, if investors panic when they realize that the free money that drove their risk-taking to ever greater extremes over the past several years is definitely going away. Dennis Gartman, the longtime writer of a daily newsletter for traders and institutional investors, echoed the theme in an interview with Bloomberg Radio last Monday. The Bloomberg story summarizing the interview was headlined “Gartman Sees Stocks Falling 15% in 2022 on Aggressive Fed Hikes” and hewed to the higher-rates/lower-stocks mantra. “Gartman said … that stocks could trade 10% to 15% lower this year. While [he] has long been calling for a bear market, he said the catalyst for the decline could be the central bank raising interest rates amid a continued rise in inflation. … ‘The advent of a bear market will come when the Fed begins to tighten monetary policy, and that will be later this year. No question.’” We admired The Gartman Letter and subscribe to the Times, but fed funds rate concerns have gotten overdone. In our view, anxiety about the effect of rate hikes on equity returns in 2022 is misplaced on two counts. First, it ignores that monetary policy only impacts the economy with a lag. Second, it fails to distinguish between the level of the fed funds rate and its direction. The economy and the S&P 500 have historically thrived in the early stages of rate-hiking campaigns, meeting their Waterloo only after the level of the fed funds rate becomes restrictive. The Fed Funds Rate Cycle We formulate investment strategy based on our analysis of the cycles that exert the strongest pull on financial markets: the business cycle, the credit cycle and the monetary policy cycle. As applied to US markets, we have found that the monetary policy cycle has the most reliably meaningful impact. As shown in Figure 1, we decompose the cycle into four phases based on whether the FOMC is hiking (the left half of the curve) or cutting (the right half) rates and the position of the fed funds rate relative to our estimate of its equilibrium level (the dashed horizontal line). We deem policy to be accommodative when the funds rate is below equilibrium and restrictive when it is above equilibrium.
Chart
We like to describe equilibrium as the fed funds rate that neither encourages nor discourages economic activity. The equilibrium rate is a concept and cannot be directly observed; though our estimate represents our best efforts, we recognize that no one can always pinpoint it in real time. We nonetheless take heart from the sharp divide in S&P 500 returns across periods that we have designated as easy or tight. As we show for the first time in this report, growth in key economic indicators aligns consistently with the progression of the funds rate cycle, supporting the investment conclusion that the approaching rate-hiking phase will be favorable for risk assets. Monetary Policy Works With A Lag The idea that monetary policy affects the economy with long and variable lags, first advanced by Milton Friedman in the late fifties, is universally accepted. To test the proposition within our policy cycle framework, we mapped growth in nonfarm payrolls, aggregate bank lending, consumption and GDP across rate cycle phases over the last 60 years. All series grew at their fastest rate in Phase I, when the Fed is tightening policy but has not yet made it tight. They continued to grow faster than their through-the-cycle pace, even when adjusted for inflation, in Phase II, when the Fed continues to hike the funds rate beyond its equilibrium level. Growth in Phases III and IV, when the Fed is easing policy to stimulate the economy, is markedly slower across all metrics than it is when the Fed is tightening. Chart 1 shows each indicator’s phase-by-phase performance in its own panel, with growth in early tightening Phase I (the solid black line) and late tightening Phase II (the dashed green line) easily surpassing early easing Phase III (the solid gray line) and late easing Phase IV (the dashed red line). Chart 1It Takes A While To Turn A Battleship, Especially When The Rudder Moves With Long And Variable Lags
It Takes A While To Turn A Battleship, Especially When The Rudder Moves With Long And Variable Lags
It Takes A While To Turn A Battleship, Especially When The Rudder Moves With Long And Variable Lags
Table 1 fleshes out the results, reporting each metric’s compound annual growth rate (CAGR) across the phases and compiling the CAGRs when the Fed is hiking rates and when it's cutting them. It also presents the nominal growth rates for lending, consumption and GDP, which are not shown in the chart. We view the results as forcefully supporting the long-and-variable view, especially as the FOMC deliberately moves at an incremental pace so as not to act like Friedman’s fool in the shower.2 Given that Phase II growth is comfortably above trend for every metric, it appears that Phase I would have to move at hyperspeed to hobble the economy at any point over the next year-plus. Table 1Phase I Is The Economy's Growth Sweet Spot
The Difference Between Tightening And Tight
The Difference Between Tightening And Tight
The Starting Point Matters, Too The economy should also be insulated from the adverse effects of reduced accommodation by virtue of its current level of support. The real fed funds rate is way below its financial crisis lows (Chart 2, top panel), along with the real 10-year Treasury yield (Chart 2, bottom panel). Both rates have steadily declined over the last 40 years' complete peak-to-peak cycles, in line with the US economy’s declining potential growth. Falling inflation has further contributed to a decline in the nominal equilibrium rate, as per the actual fed funds rate and our in-house estimate (Chart 3). Chart 2Real Rates Have A Long, Long Way To Go To Become Restrictive
Real Rates Have A Long, Long Way To Go To Become Restrictive
Real Rates Have A Long, Long Way To Go To Become Restrictive
Chart 3Interest Rates May Have More Headroom Than Markets Think
Interest Rates May Have More Headroom Than Markets Think
Interest Rates May Have More Headroom Than Markets Think
Our estimate bottomed well before the onset of the pandemic, however, and we would argue that the economy currently has far less need for monetary policy support than it did in the aftermath of the crisis. While the financial system reeled, Congress provided stingy fiscal support before taking it back like Lucy pulling the football away from Charlie Brown. In contrast, the US now has a surfeit of fiscal support and even WeWork founder Adam Neumann has ready access to capital. The upshot is that the rates tipping point is miles away and we doubt the Fed can cover that much ground in the space of one year. For Equities, Level Trumps Direction The level, not the direction, of the fed funds rate has driven US equity performance over the 60-year period covered by our equilibrium estimate. The S&P 500 has eked out a 0.4% nominal annualized return across the aggregate 19 years that policy has been tight, by our reckoning, while advancing 10.6% annually over the accumulated 41 years when it has been easy (Table 2). Easy policy’s ten-percentage-point advantage over tight policy leaves cutting rates’ four-point edge over hiking rates in the dust. Table 2Easy Policy Settings Yield An Extra 10 Percentage Points Of Nominal Returns, ...
The Difference Between Tightening And Tight
The Difference Between Tightening And Tight
Table 3... And An Extra 11.5 After Adjusting For Inflation
The Difference Between Tightening And Tight
The Difference Between Tightening And Tight
The easy/tight disparity widens to eleven-and-a-half percentage points when nominal returns are adjusted for inflation. In Phases I and IV, when the fed funds rate is below our estimate of equilibrium, the S&P 500 has generated robust 7.1% real annualized returns while shedding 4.4% in Phases II and III, when the funds rate exceeds our equilibrium estimate (Table 3). Stocks do better on a real basis when the Fed is cutting rates, just as they do on a nominal basis, but the spread is narrower. The level of rates is the key dividing line, not their direction. Investment Implications The empirical record overwhelmingly supports the idea that early-stage rate hikes will not stifle growth or prevent equities from generating ample positive excess returns over Treasuries and cash. Against a backdrop of high and soaring inflation that the economy has only faced twice in the last 50 years (Chart 4), however, it is worth considering whether this time could be different. Whereas most recent rate hike campaigns have patiently aimed to prevent potential inflation pressures from taking root in a robust economy, this one might require the Fed to move urgently to get the genie back in the bottle. Chart 4Be Careful What You Wish For, Central Bankers
Be Careful What You Wish For, Central Bankers
Be Careful What You Wish For, Central Bankers
The potential for urgent rather than incremental action could turn the prevailing positive correlation between stock prices and interest rates negative, as our Chief Emerging Markets Strategist Arthur Budaghyan has warned. If inflation worries choke off animal spirits, multiple de-rating could more than offset typical Phase I earnings gains, sending stocks lower. Although we do not expect multiple contraction in 2022 given the dearth of asset classes with positive expected real returns, we see it as one of the major threats to our risk-friendly positioning. We will be watching out for it, along with adverse pandemic surprises and the possibility that consumption could disappoint, though we will stick with our constructive positioning in the meantime. Doug Peta, CFA Chief US Investment Strategist dougp@bcaresearch.com Footnotes 1 "Fed’s Moves in 2022 Could End the Stock Market’s Pandemic Run", The New York Times (nytimes.com). Accessed January 3, 2022. 2 Friedman likened central banks to a person who excessively turns the hot or the cold tap in the shower when the water temperature does not change immediately, only to shock him/herself once the lag between action and effect closes.
Highlights In this week’s report we update our Chart Pack, updating familiar charts that underscore our strategic themes and cyclical/tactical views. Social unrest in Kazakhstan points to two of our strategic themes: great power struggle and populism/nationalism. A sneak preview of our Black Swan risks for the year: Iran crisis, Russian aggression, and a massive cyber attack. Recent market moves reinforce the BCA House View that investors will rotate out of US growth stocks and into global cyclicals and value plays. We are sticking with our current tactical and cyclical views and trades. Feature Since releasing our key views for 2022, bond yields have surged, tech shares have sold off, and social unrest has erupted in Central Asia. These developments have both structural and cyclical drivers and are broadly supportive of our investment strategy. First, a brief word about Kazakhstan. The surge in unrest this week is a new and urgent example of one of our strategic themes: populism and nationalism. Long-accumulating Kazakh nationalism is blowing up and forcing the autocratic regime to complete an unfinished political leadership transition that began three years ago. Russia is now forced to intervene militarily to maintain stability in this important satellite state. If instability is prolonged, Russia will be weakened in its high-stakes standoff against the United States and the West over Ukraine. China’s interest in Kazakhstan is also threatened by the change in political orientation there. We will provide a full report on this topic soon but for now the investment implication is to stay short Russian equities. In the rest of this report we offer our newly revised chart book for investors to consider as they gird for a year that promises to be anything but dull. The purpose of the chart book is to update a succinct series of charts that underpin our key themes and views. Many of these charts will be familiar to regular readers but here they are updated with some notable points highlighted in the text. A Waning Pandemic And Global Growth Falling To Trend The Omicron variant of COVID-19 is causing a surge of new cases and hospitalizations around the world, which will weigh on economic activity in the first quarter. However, this variant does not appear to be a game changer. While it is highly contagious, not as many people who go to the hospital end up in the intensive care unit (Chart 1).
Chart 1
China is in a difficult predicament that will continue to constrict the global supply side of the economy. Chinese authorities maintain a “zero COVID” policy that emphasizes draconian social restrictions to suppress COVID cases and deaths to minimal levels (Chart 2A).
Chart 2
Chart 2
But Chinese-made vaccines are not as effective as western alternatives, particularly against Omicron, as discussed in our flagship Bank Credit Analyst. Hence China cannot open its economy without risking a disastrous wave of infections. When China shuts down activity, as at the Yantian port last spring, the rest of the world suffers higher costs for goods (Chart 2B). Chart 3Global Growth Will Fall Back To Trend
Global Growth Will Fall Back To Trend
Global Growth Will Fall Back To Trend
Global economic growth is decelerating from the peaks of the extreme rebound (Chart 3). The historic fiscal stimulus of 2020 (Chart 4A) is giving way to negative fiscal thrust, or a decline in budget deficits, that will take away from growth (Chart 4B).
Chart 4
Chart 4
Chart 5Inflation Will Moderate But Remain A Long-Term Risk
Inflation Will Moderate But Remain A Long-Term Risk
Inflation Will Moderate But Remain A Long-Term Risk
Yet a recession is not the likeliest scenario since growth is expected to stabilize given the resumption of activity across the world due to an improved ability to live with the virus. The Federal Reserve is considering hiking interest rates faster than the market had expected given that the unemployment rate is collapsing and core inflation is surging. The persistence of the pandemic’s supply disruptions adds to concerns. At the same time, a wage-price spiral is not yet taking shape, as our bond strategist Ryan Swift shows. Productivity is growing faster than real wages and long-term inflation expectations remain within reasonable ranges, at least for now (Chart 5). Three Strategic Themes In our annual outlook (“2022 Key Views: The Gathering Storm”) we revised our long-term mega themes: 1. Great Power Struggle The US’s relative decline as a share of global geopolitical power, despite a brief respite last year, is indicated in Charts 6-8.
Chart 6
Chart 7
Chart 7
Chart 8America's Global Role Persists (If Lessened)
America's Global Role Persists (If Lessened)
America's Global Role Persists (If Lessened)
2. Hypo-Globalization An ongoing globalization process, yet one that falls short of potential, is shown in Charts 9-10. A tentative improvement in our multi-century globalization chart is misleading – it is due to lack of data reporting by several countries, which artificially suppresses the denominator. Chart 9Hypo-Globalization And Hegemonic Instability
Hypo-Globalization And Hegemonic Instability
Hypo-Globalization And Hegemonic Instability
Chart 10AFrom 'Hyper-Globalization' To Hypo-Globalization
From 'Hyper-Globalization' To Hypo-Globalization
From 'Hyper-Globalization' To Hypo-Globalization
While trade sharply rebounded from the pandemic, the global policy setting is now averse to ever-deeper dependency on international trade. Chart 10BFrom 'Hyper-Globalization' To Hypo-Globalization
From 'Hyper-Globalization' To Hypo-Globalization
From 'Hyper-Globalization' To Hypo-Globalization
3. Populism and Nationalism The post-pandemic cycle will see these structural trends reaffirmed. Charts 11-12 shows a rising Misery Index, or sum of unemployment and inflation, a source of political turmoil that will both reflect and feed these trends. Chart 11Misery Indexes Signal More Unrest, Populism, And Nationalism
Misery Indexes Signal More Unrest, Populism, And Nationalism
Misery Indexes Signal More Unrest, Populism, And Nationalism
Chart 12EM Populism/Nationalism Threatens Negative Surprises In 2022
EM Populism/Nationalism Threatens Negative Surprises In 2022
EM Populism/Nationalism Threatens Negative Surprises In 2022
Chart 12 highlights major markets that have local or nationwide elections in 2022-23, where policy fluctuations are already occurring with various investment implications. We are tactically bullish on South Korea and Brazil, strategically but not tactically bullish on India, and bearish on Turkey. Russia’s domestic sociopolitical problems are not all that different from Kazakhstan’s and its response may be outwardly aggressive, so we are bearish. Three Key Views For 2022 Our annual outlook also outlined three key views for this year: 1. China’s Reversion To Autocracy The government will ease policy to secure the economic recovery so that President Xi Jinping can clinch his personal rule for at a critical Communist Party personnel reshuffle this fall (Chart 13). Chart 13China Will Easy Policy Ahead Of Political Reversion To Autocracy
China Will Easy Policy Ahead Of Political Reversion To Autocracy
China Will Easy Policy Ahead Of Political Reversion To Autocracy
A stabilization of Chinese demand in 2022 will be positive for commodities, cyclical equity sectors, and emerging markets.
Chart 14
Chart 14
Policy easing will not lead to a sustainable rally in Chinese equities, as internal and external political risks remain high (Charts 14A & 14B). A “fourth Taiwan Strait Crisis” is likely in the short run while a military conflict is not unlikely over the long run. 2. America’s Policy Insularity The Biden administration is focused on domestic legislation and the midterm elections, due November 8, 2022. Biden’s approval rating has deteriorated further, putting the Democrats in line for a loss of around 40 seats in the House and four seats in the Senate, judging by historic patterns (Chart 15). But our sense is that the Senate is still in play – Democrats probably will not lose four Senate seats – but they are likely to lose control of both chambers as things stand.
Chart 15
However, the Democrats still have a subjective 65% chance of passing a partisan budget reconciliation bill, which would be a badly needed victory. The “Build Back Better” plan would include a minimum corporate tax and various social programs. Another round of fiscal reflation would reinforce the Federal Reserve’s less dovish pivot. Chart 16US Still At Peak Polarization
US Still At Peak Polarization
US Still At Peak Polarization
Polarization will remain at historic peaks leading up to the election, as the Democrats will need “wedge issues” to drive enthusiasm among their popular base in the face of Republican enthusiasm. For decades polarization has correlated with falling Treasury yields and US tech sector equity outperformance (Chart 16). Midterm election years tend to see flat equity performance and falling yields, albeit with yields higher when a single party controls government, as is the case this year. 3. Petro-State Leverage Globally, commodity markets continue to tighten on the supply side. Our Commodity & Energy Strategist Bob Ryan outlines the situation admirably: The supply side is tightening in oil markets, where OPEC 2.0 producers have been unable to restore output under their agreement to return 400,000 barrels per day each month since August 2021. It is true in base metals, where the energy crisis in Europe and Asia are constricting supplies, particularly in copper. And it is true in agricultural commodities, where high natural gas prices are driving fertilizer prices higher, which will push food prices up this year. Demand for these commodities will increase as Omicron becomes the dominant COVID-19 strain, keeping consumption above production, particularly in oil. These are long-term trends. Oil and natural gas markets will probably remain tight throughout the decade, as will base metal markets. This is going to put enormous stress on the global energy transition to renewable energy over the next 10 years. The ascendance of left-of-center political parties in critical base-metal exporting states, and rising ESG initiatives, will increase costs for energy and metals producers; and global climate activism in boardrooms and courtrooms will push costs higher as well. Higher prices will be necessary to recover these cost increases. In this context, energy producers gain geopolitical leverage. Their treasuries become flush with cash and they see an opportunity to pursue foreign policy objectives. Conflicts involving oil producers are more likely when oil prices are swinging up (Chart 17).
Chart 17
This trend is on display in Russia’s dispute with the West, where Europe is struggling with a surge in natural gas prices due to Russian supply constraints that weaken its resolve in the showdown over Ukraine (Chart 18, top panel). Chart 18Energy Prices: Biden's And Europe's Problem
Energy Prices: Biden's And Europe's Problem
Energy Prices: Biden's And Europe's Problem
Yet even in the energy-independent US, the Biden administration is wary of pursuing policies against Russia or Iran that would ignite a bigger spike in prices at the pump during an election year (Chart 18, bottom panel). Biden will have to attend to foreign policy this year but will be defensive. Petro-states are not immune to domestic problems, including social unrest. Many of them are poor, unequal, misgoverned, and suffering from inflation. Iran is a prime example. Yet Iran has not collapsed under sanctions so far, the world is recovering, and Tehran has the advantage in its negotiations with the US because it can stage attacks across the Middle East, including the Persian Gulf and Strait of Hormuz. Military incidents could drive oil prices into politically punitive territory. Three Black Swans For 2022 This brings us to three “Black Swans” or low-probability, high-impact events for 2022. We will publish our regular annual report on this year’s black swans soon. For now we offer a sneak preview: 1. Iran Crisis In Middle East The fear of being abandoned by the US has kept Israel from acting unilaterally so far (Chart 19A).
Chart 19
Chart 19
But an attack is not impossible if Iran reaches “breakout” levels of highly enriched uranium – and the global impact of an attack could be catastrophic (Chart 19B). The news media have been conspicuously quiet about Iran. Taken together, this scenario is pretty much the definition of a black swan. 2. Russian Aggression Abroad There is a 50% chance that Russia will stage a limited re-invasion of Ukraine to secure its control of territory in the east or along the Black Sea coast. Chart 20Black Swan #2: Russian Aggression Abroad
Black Swan #2: Russian Aggression Abroad
Black Swan #2: Russian Aggression Abroad
Within this risk, there is a small chance (less than 5%) that Russia would invade all of Ukraine. We do not expect this and neither do other analysts. The total conquest of Ukraine is unlikely when Russia’s domestic conditions are weak and it faces so much unrest in other parts of its sphere of influence (including Belarus and Kazakhstan). As we go to press, Russia is staging a military intervention in Kazakhstan, which could expand. Kazakhstan could create a way for Russia to avoid its self-induced pressure to take military action against Ukraine. But most likely Russia and Kazakhstan will quell the unrest, enabling Russia to sustain the threat of a partial re-invasion of Ukraine. Putin’s low approval rating often triggers new foreign adventures and financial markets are pricing higher risks (Chart 20). 3. Massive Cyber Attack Amid the pandemic and inflation surge, investors have forgotten about the huge risks facing businesses and individuals from their extreme dependency on remote work and digital services. A cyber war is also raging behind the scenes. So far it has not spilled into the physical realm. Yet Russia-based ransomware attacks in 2021 showed that vital US infrastructure is vulnerable. Cyber stocks have topped out amid the recent tech selloff (Chart 21A). But the global average cost of data breaches is skyrocketing. Governments are devoting more resources to network security and cyber-security (Chart 21B), which should be positive for earnings. Chart 21ABlack Swan #3: Massive Cyber Attack
Black Swan #3: Massive Cyber Attack
Black Swan #3: Massive Cyber Attack
Chart 21BBlack Swan #3: Massive Cyber Attack
Black Swan #3: Massive Cyber Attack
Black Swan #3: Massive Cyber Attack
Investment Takeaways The revised Geopolitical Risk Index does not show as pronounced of an uptrend as the version published last year but it is still higher than in the late 1990s (Chart 22). Our reading of all available evidence points to rising geopolitical risk – at least until the current challenge to US global supremacy leads to a new equilibrium.
Chart 22
Global policy uncertainty is also rising on a secular basis and maintaining its correlation with the trade-weighted dollar, which has rebounded despite the global growth recovery and rise in inflation (Chart 23). We remain neutral on the dollar. Chart 23A Secular Rise In Global Uncertainty
A Secular Rise In Global Uncertainty
A Secular Rise In Global Uncertainty
Gold has fallen from its peaks during the onset of the pandemic and real rates suggest it will fall further. But we hold it as a hedge against geopolitical risk as well as inflation (Chart 24). Chart 24Stay Long Gold As Hedge Against Geopolitical Crisis As Well As Inflation
Stay Long Gold As Hedge Against Geopolitical Crisis As Well As Inflation
Stay Long Gold As Hedge Against Geopolitical Crisis As Well As Inflation
The evidence is inconclusive about whether global investors will rotate away from US assets this year. The US share of global equity capitalization is stretched. Long-dated Treasuries will eventually reflect higher inflation expectations (Chart 25). Chart 25No Substitute For The USA Yet
No Substitute For The USA Yet
No Substitute For The USA Yet
Chart 26Waiting For Rotation
Waiting For Rotation
Waiting For Rotation
US equity outperformance continues unabated and emerging market equities are still underperforming their developed peers (Chart 26). Cyclically investors should take the opposite side of these trends but not tactically. The renminbi is tentatively peaking against both the dollar and euro. As expected, China’s policymakers are shifting toward preserving economic stability (Chart 27). Stabilization may require a weaker renminbi, though producer price inflation is also a factor for the People’s Bank to consider. Chart 27Strategically Short Renminbi And Taiwanese Dollar
Strategically Short Renminbi And Taiwanese Dollar
Strategically Short Renminbi And Taiwanese Dollar
Taiwanese stocks continue to outperform Korean stocks (to our chagrin) but they have not broken above previous peaks relative to global equities. Nor has the Taiwanese dollar broken above previous peaks versus the greenback (Chart 28). So far Taiwan has avoided the fate of semiconductor stocks, which have sold off. This situation presents a buying opportunity for semi stocks but we remain short Taiwan as a bourse because it is central to US-China strategic conflict. Chart 28Strategically Short Taiwan
Strategically Short Taiwan
Strategically Short Taiwan
Chart 29Strategically Short Russia And EM Europe
Strategically Short Russia And EM Europe
Strategically Short Russia And EM Europe
Chart 30Safe Havens Look Attractive
Safe Havens Look Attractive
Safe Havens Look Attractive
Russia and eastern European assets continue to underperform developed market peers as geopolitical risks mount across the former Soviet Union (Chart 29). Russia’s negotiations with the US, NATO, and the EU in January will help us to gauge whether tensions will break out to new highs. Assuming Russia succeeds in quashing Kazakh unrest, it will be necessary for the US to offer concessions to Russia to prevent the Ukraine showdown from worsening Europe’s energy crisis. Safe havens caught a bid in early 2021 and have not yet broken down. Our geopolitical views support building up safe-haven positions (Chart 30). Presumably one should favor global cyclical equities as the pandemic wanes and global growth stabilizes. But cyclicals are struggling to outperform defensives (Chart 31A). Chart 31AFavor Cyclicals On China's Stabilization
Favor Cyclicals On China's Stabilization
Favor Cyclicals On China's Stabilization
Chart 31BFavor Cyclicals On China's Stabilization
Favor Cyclicals On China's Stabilization
Favor Cyclicals On China's Stabilization
China’s policy easing is positive in this regard, although the new wave of fiscal-and-credit support is only just beginning and financial markets will remain skeptical until the dovish policy pivot is borne out in hard data (Chart 31B). Global value stocks have ticked up again versus growth stocks, suggesting that the choppy process of bottom formation continues (Charts 32A & 32B). Chart 32AValue’s Choppy Bottom Versus Growth Stocks
Value's Choppy Bottom Versus Growth Stocks
Value's Choppy Bottom Versus Growth Stocks
Chart 32BValue’s Choppy Bottom Versus Growth Stocks
Value's Choppy Bottom Versus Growth Stocks
Value's Choppy Bottom Versus Growth Stocks
Matt Gertken Vice President Geopolitical Strategy mattg@bcaresearch.com Strategic Themes Open Tactical Positions (0-6 Months) Open Cyclical Recommendations (6-18 Months)
Highlights Global equities are poised to deliver mid-to-high single-digit returns this year, with the outlook turning bleaker in 2023 and beyond. Non-US markets are likely to outperform. We examine the four pillars that have historically underpinned stock market performance. Pillar 1: Technically, the outlook for equities is modestly bullish, as investor sentiment is nowhere near as optimistic as it usually gets near market tops. Pillar 2: The outlook for economic growth and corporate earnings is modestly bullish as well. While global growth is slowing, it will remain solidly above trend in 2022. Pillar 3: Monetary and financial conditions are neutral. The Fed and a number of other central banks are set to raise rates and begin unwinding asset purchases this year. However, monetary policy will remain highly accommodative well into 2023. Pillar 4: Valuations are bearish in the US and neutral elsewhere. Investors should avoid tech stocks in 2022, focusing instead on banks and deep cyclicals, which are more attractively priced. The Bedrock For Equities In assessing the outlook for the stock market, our research has focused on four pillars: 1) Sentiment and other technical factors, which are most pertinent for stocks over short-term horizons of about three months; 2) cyclical fluctuations in economic growth and corporate earnings, which tend to dictate the path for stocks over medium-term horizons of about 12 months; 3) monetary and financial conditions, which are also most relevant over medium-term horizons; and finally 4) valuations, which tend to drive stocks over the long run. In this report, we examine all four pillars, concluding that global equities are likely to deliver mid-to-high single-digit returns this year, with the outlook turning bleaker in 2023 and beyond. Pillar 1: Sentiment And Other Technical Factors (Modestly Bullish) Chart 1US Equities: Breadth Is A Concern
US Equities: Breadth Is A Concern
US Equities: Breadth Is A Concern
Scaling The Wall Of Worry Stocks started the year on a high note, before tumbling on Wednesday following the release of the Fed minutes. Market breadth going into the year was quite poor. Even as the S&P 500 hit a record high on Tuesday, only 57% of NYSE stocks and 38% of NASDAQ stocks were trading above their 200-day moving averages compared to over 90% at the start of 2021 (Chart 1). The US stock market had become increasingly supported by a handful of mega-cap tech stocks, a potentially dangerous situation in an environment where bond yields are rising and stay-at-home restrictions are apt to ease (more on this later). That said, market tops often occur when sentiment reaches euphoric levels. That was not the case going into 2022 and it is certainly not the case after this week's sell-off. The number of bears exceeded the number of bulls in the AAII survey this week and in six of the past seven weeks (Chart 2). The share of financial advisors registering a bullish bias declined by 25 percentage points over the course of 2021 in the Investors Intelligence poll. Option pricing is far from complacent. The VIX stands at 19.6, above its post-GFC median of 16.7. According to the Minneapolis Fed’s market-based probabilities model, the market was discounting a slightly negative 12-month return for the S&P 500 as of end-2021, with a 3.6 percentage-point larger chance of a 20% decline in the index than a 20% increase (Chart 3). Chart 3Option Pricing Is Not Pointing To Elevated Complacency
Option Pricing Is Not Pointing To Elevated Complacency
Option Pricing Is Not Pointing To Elevated Complacency
Chart 2Sentiment Is Not Exceptionally Bullish, Despite The S&P 500 Trading Close To All-Time Highs
Sentiment Is Not Exceptionally Bullish, Despite The S&P 500 Trading Close To All-Time Highs
Sentiment Is Not Exceptionally Bullish, Despite The S&P 500 Trading Close To All-Time Highs
Equities do best when sentiment is bearish but improving (Chart 4). With bulls in short supply, stocks can continue to climb the proverbial wall of worry. Whither The January Effect? Historically, stocks have fared better between October and April than between May and September (Chart 5). One caveat is that the January effect, which often saw stocks rally at the start of the year, has disappeared. In fact, the S&P 500 has fallen in January by an average annualized rate of 5.2% since 2000 (Table 1). Other less well-known calendar effects – such as the tendency for stocks to underperform on Mondays but outperform on the first trading day of each month – have persisted, however.
Chart 4
Chart 5
Table 1Calendar Effects
The Four Pillars Of The Stock Market
The Four Pillars Of The Stock Market
Bottom Line: January trading may be choppy, but stocks should rise over the next few months as more bears join the bullish camp. Last year’s losers are likely to outperform last year’s winners. Pillar 2: Economic Growth And Corporate Earnings (Modestly Bullish) Economic Growth And Earnings: Joined At The Hip The business cycle is the most important driver of stocks over medium-term horizons of about 12 months. The reason is evident in Chart 6: Corporate earnings tend to track key business cycle indicators such as the ISM manufacturing index, industrial production, business sales, and global trade. Chart 6The Business Cycle Is The Most Important Driver Of Stocks Over Medium-Term Horizons
The Business Cycle Is The Most Important Driver Of Stocks Over Medium-Term Horizons
The Business Cycle Is The Most Important Driver Of Stocks Over Medium-Term Horizons
Chart 7PMIs Signaling Above-Trend Growth
PMIs Signaling Above-Trend Growth
PMIs Signaling Above-Trend Growth
Global growth peaked in 2021 but should stay solidly above trend in 2022. Both the service and manufacturing PMIs remain in expansionary territory (Chart 7). The forward-looking new orders component of the ISM exceeded 60 for the second straight month in December. The Bloomberg consensus is for real GDP to rise by 3.9% in the G7 in 2022, well above the OECD’s estimate of trend G7 growth of 1.4% (Chart 8). Global earnings are expected to increase by 7.1%, rising 7.5% in the US and 6.7% abroad (Chart 9). Our sense is that both economic growth and earnings will surprise to the upside in 2022. Chart 9Analysts Expect Single-Digit Earnings Growth
Analysts Expect Single-Digit Earnings Growth
Analysts Expect Single-Digit Earnings Growth
Chart 8
Plenty Of Pent-Up Demand For Both Consumer And Capital Goods US households are sitting on $2.3 trillion in excess savings (Chart 10). Around half of these savings will be spent over the next few years, helping to drive demand. Households in the other major advanced economies have also buttressed their balance sheets. Chart 10Plenty Of Pent-Up Demand
Plenty Of Pent-Up Demand
Plenty Of Pent-Up Demand
After two decades of subdued corporate investment, capital goods orders have soared. This bodes well for capex in 2022. Inventories remain at rock-bottom levels, which implies that output will need to exceed spending for the foreseeable future (Chart 11). On the residential housing side, both the US homeowner vacancy rate and the inventory of homes for sale are near multi-decade lows. Building permits are 11% above pre-pandemic levels (Chart 12). Chart 11Business Investment Should Be Strong In 2022
Business Investment Should Be Strong In 2022
Business Investment Should Be Strong In 2022
Chart 12Residential Construction Will Remain Well Supported
Residential Construction Will Remain Well Supported
Residential Construction Will Remain Well Supported
Chart 13China's Credit Impulse Has Bottomed
China's Credit Impulse Has Bottomed
China's Credit Impulse Has Bottomed
Chinese Growth To Rebound, Europe To Benefit From Lower Natural Gas Prices Chinese credit growth decelerated last year. However, the 6-month credit impulse has bottomed, and the 12-month impulse is sure to follow (Chart 13). Chinese coal prices have collapsed following the government’s decision to instruct 170 mines to expand capacity (Chart 14). China generates 63% of its electricity from coal. Lower energy prices and increased stimulus should support Chinese industrial activity in 2022. Like China, Europe will benefit from lower energy costs. Natural gas prices have fallen by nearly 50% from their peak on December 21st. A shrinking energy bill will support the euro (Chart 15). Chart 14Coal Prices Are Renormalizing In China
Coal Prices Are Renormalizing In China
Coal Prices Are Renormalizing In China
Chart 15A Shrinking Energy Bill Will Support The Euro
A Shrinking Energy Bill Will Support The Euro
A Shrinking Energy Bill Will Support The Euro
Chart 16
Omicron Or Omicold? While the Omicron wave has led to an unprecedented spike in new cases across many countries, the economic fallout will be limited. The new variant is more contagious but significantly less lethal than previous ones. In South Africa, it blew through the population without triggering a major increase in mortality (Chart 16). Preliminary data suggest that exposure to Omicron confers at least partial immunity against Delta. The general tendency is for viral strains to become less lethal over time. After all, a virus that kills its host also kills itself. Given that Omicron is crowding out more dangerous strains such as Delta, any future variant is likely to emanate from Omicron; and odds are this new variant will be even milder than Omicron. Meanwhile, new antiviral drugs are starting to hit the market. Pfizer claims that its new drug, Paxlovid, cuts the risk of hospitalization by almost 90% if taken within five days from the onset of symptoms. Bottom Line: While global growth has peaked and the pandemic remains a risk, growth should stay well above trend in the major economies in 2022, fueling further gains in corporate earnings and equity prices. Pillar 3: Monetary And Financial Factors (Neutral) Chart 17The Overall Stance Of Monetary Policy Will Not Return To Pre-Pandemic Levels For At Least Another 12 Months
The Overall Stance Of Monetary Policy Will Not Return To Pre-Pandemic Levels For At Least Another 12 Months
The Overall Stance Of Monetary Policy Will Not Return To Pre-Pandemic Levels For At Least Another 12 Months
Tighter But Not Tight Monetary and financial factors help govern the direction of equity prices both because they influence economic growth and also because they affect the earnings multiple at which stocks trade. There is little doubt that a number of central banks, including the Federal Reserve, are looking to dial back monetary stimulus. However, there is a big difference between tighter monetary policy and tight policy. Even if the FOMC were to raise rates three times in 2022, as the market is currently discounting, the fed funds rate would still be half of what it was on the eve of the pandemic (Chart 17). Likewise, even if the Fed were to allow maturing assets to run off in the middle of this year, as the minutes of the December FOMC meeting suggest is likely, the size of the Fed’s balance sheet will probably not return to pre-pandemic levels until the second half of this decade. A Higher Neutral Rate We have argued in the past that the neutral rate of interest in the US is higher than widely believed. This implies that the overall stance of monetary policy remains exceptionally stimulative. Historically, stocks have shrugged off rising bond yields, as long as yields did not increase to prohibitively high levels (Table 2). Table 2As Long As Bond Yields Don’t Rise Into Restrictive Territory, Stocks Will Recover
The Four Pillars Of The Stock Market
The Four Pillars Of The Stock Market
If the neutral rate ends up being higher than the Fed supposes, the danger is that monetary policy will stay too loose for too long. The question is one of timing. The good news is that inflation should recede in the US in 2022, as supply-chain bottlenecks ease and spending shifts back from goods to services. The bad news is that the respite from inflation will not last. As discussed in Section II of our recently-published 2022 Strategy Outlook, inflation will resume its upward trajectory in mid-2023 on the back of a tightening labor market and a budding price-wage spiral. This second inflationary wave could force the Fed to turn much more aggressive, spelling the end of the equity bull market. Bottom Line: While the Fed is gearing up to raise rates and trim the size of its balance sheet, monetary policy in the US and in other major economies will remain highly accommodative in 2022. US policy could turn more restrictive in 2023 as a second wave of inflation forces a more aggressive response from the Fed. Pillar 4: Valuations (Bearish In The US; Neutral Elsewhere) US Stocks Are Looking Pricey… While valuations are a poor timing tool in the short run, they are an excellent forecaster of stock prices in the long run. Chart 18 shows that the Shiller PE ratio has reliably predicted the 10-year return on equities. Today, the Shiller PE is consistent with total real returns of close to zero over the next decade.
Chart 18
Investors’ allocation to stocks has also predicted the direction of equity prices (Chart 19). According to the Federal Reserve, US households held a record high 41% of their financial assets in equities as of the third quarter of 2021. If history is any guide, this would also correspond to near-zero long-term returns on stocks. Chart 19Valuations Matter For Long-Term Returns (II)
Valuations Matter For Long-Term Returns (II)
Valuations Matter For Long-Term Returns (II)
… But There Is More Value Abroad Valuations outside the US are more reasonable. Whereas US stocks trade at a Shiller PE ratio of 37, non-US stocks trade at 20-times their 10-year average earnings. Other valuation measures such as price-to-book, price-to-sales, and dividend yield tell a similar story (Chart 20). Chart 20AUS Stocks Are Trading At A Significant Premium To Their Non-US Peers (I)
US Stocks Are Trading At A Significant Premium To Their Non-US Peers (I)
US Stocks Are Trading At A Significant Premium To Their Non-US Peers (I)
Chart 20BUS Stocks Are Trading At A Significant Premium To Their Non-US Peers (II)
US Stocks Are Trading At A Significant Premium To Their Non-US Peers (II)
US Stocks Are Trading At A Significant Premium To Their Non-US Peers (II)
Cyclicals And Banks Overrepresented Abroad Our preferred sector skew for 2022 favors non-US equities. Increased capital spending in developed economies and incremental Chinese stimulus should boost industrial stocks and other deep cyclicals, which are overrepresented outside the US (Table 3). Banks are also heavily weighted in overseas markets; they should also do well in response to faster-than-expected growth and rising bond yields (Chart 21). Table 3Deep Cyclicals And Financials Are Overrepresented Outside The US
The Four Pillars Of The Stock Market
The Four Pillars Of The Stock Market
Chart 21Rising Bond Yields Will Help Bank Shares
Rising Bond Yields Will Help Bank Shares
Rising Bond Yields Will Help Bank Shares
Bottom Line: Valuations are more appealing outside the US, and with deep cyclicals and banks set to outperform tech over the coming months, overseas markets are the place to be in 2022. Peter Berezin Chief Global Strategist peterb@bcaresearch.com Global Investment Strategy View Matrix
Image
Special Trade Recommendations
Image
Current MacroQuant Model Scores
Image
Highlights US economic data remains robust, but economic surprises are rolling over relative to other G10 countries. Meanwhile, the Fed is turning a tad more hawkish, which is positive for the greenback in the short term but could hurt growth over a cyclical horizon. A hawkish Fed and dovish PBoC could set the stage for an economic recovery outside the US. We are not fighting the Fed (dollar bullish in the near term), and most of our trades are at the crosses. These include long EUR/GBP, long AUD/NZD and long CHF/NZD. We also have a speculative long on AUD/USD. We were stopped out of our short USD/JPY trade at break even and will look to reinstate at more attractive levels. Feature
Chart 1
The dollar was the best performing G10 currency last year (Chart 1), which begs the question if this outperformance will be sustained in 2022. In this week’s report, we go over a few key data releases in the last month and implications for currency markets. Most recently, PMI releases across the developed world have remained robust but are peaking (Chart 2). The key question is whether the slowdown proves genuine, and if so, whether the US can maintain economic leadership versus the rest of the G10. Chart 2AGlobal PMIs Are Softening, Especially In The US
Global PMIs Are Softening, Especially In The US
Global PMIs Are Softening, Especially In The US
Chart 2BGlobal PMIs Are Softening, Especially In The US
Global PMIs Are Softening, Especially In The US
Global PMIs Are Softening, Especially In The US
The next key question is what central banks do about inflation. It is becoming clearer that rising prices are not a US-centric phenomenon but a global problem (Chart 3). Our bias is that central banks cannot meaningfully diverge on the inflation front. This will create trading opportunities. Chart 3AInflation Is A Global Problem
Inflation Is A Global Problem
Inflation Is A Global Problem
Chart 3BInflation Is A Global Problem
Inflation Is A Global Problem
Inflation Is A Global Problem
Over the next few pages, we look at the latest data releases and implications for currency strategy. US Dollar: Strong Now, Weaker Later? The dollar DXY index fell 0.4% in December and is up 0.5% year to date. A growth rotation from the US to other economies continues, even though US economic data over the last month remains rather robust. The latest release of the ISM manufacturing index remained strong at 58.7 for December, but this has rolled over from 61.1 in the previous month. More importantly, the prices paid index fell from 82.4 to 68.2. This suggests inflationary pressures are coming in, which could assuage tightening pressure on the Federal Reserve. In other data, the trade deficit continues to widen, hitting a record -$97.8bn in November. Durable goods orders for November rose 2.5%, the biggest increase in six months. The consumer confidence index from the Conference Board has also rebounded, rising to 115.8 in December. Home prices are also rising, with an increase of almost 20% year on year in October. This suggests monetary conditions in the US remain very easy, relative to underlying demand. A tighter Fed is what the US needs, but the perfect calibration of monetary policy could prove difficult to achieve. The Fed minutes this week highlighted a preference for a faster pace of policy normalization, in the face of a tightening labor market and persistent inflationary pressures. This put the US dollar in a quandary, relative to other developed market currencies. If the US tightens monetary policy, while China eases, it strengthens the dollar in the near term, but tightens US financial conditions that have been the bedrock of US demand. This will suggest peak US demand in the coming months, and a bottoming in demand for countries that are more sensitive to Chinese monetary conditions. Chart 4AUS Dollar
US Dollar
US Dollar
Chart 4BUS Dollar
US Dollar
US Dollar
The Euro: All Bets On China? The euro was up 0.4% in December. Year-to-date, the euro is down 0.5%. Inflation continues to rise in the eurozone, which begs the question of how long the ECB can remain on a dovish path and maintain credibility on its inflation mandate. PPI came out at 23.7% year-on-year, the highest in several decades. Core consumer price index (CPI) in the eurozone is at 4.9%, a whisker below US levels. Economic data remain resilient in the euro area, despite surging Covid-19 cases. The ZEW expectations survey rose to 26.8 in December from 25.9. The trade balance remains in a healthy surplus (though rolling over). In a nutshell, economic surprises in the eurozone have been outpacing those in the US over the last month. The ECB continues to maintain a dovish stance, keeping rates on hold and reiterating that inflation should subside in the coming quarters. According to their forecasts, inflation is headed below 2% by the end of 2022. This could prove wrong in a world where inflation is sticky globally and driven by supply-side factors. In the near term, we expect a policy convergence between the ECB and the BoE. As such, we are long EUR/GBP on this basis. Over the longer term, we expect the ECB to lag the Fed, and thus we will fade any persistent strength in the euro. Chart 5AEuro
Euro
Euro
Chart 5BEuro
Euro
Euro
The Japanese Yen: The Most Hated Currency The Japanese yen was down 2% in December. It is also down 0.6% year-to-date. Overall, the yen was the worst performing G10 currency in 2021. Good news out of Japan continues to be underappreciated, while bad news is well discounted. Industrial production rose 5.4% in November, from a contraction the previous month, and the Jinbun Bank manufacturing PMI edged higher in December to 54.3. Retail sales are inflecting higher, and the national CPI has bottomed, easing pressure on the Bank of Japan to remain ultra-accommodative. The bull case for the yen remains intact. First, as we have witnessed recently, it will perform well in a market reset, given it is the most shorted G10 currency. Second, and related, the yen tends to do well with rising volatility, which we should expect in the coming months. Third, Covid-19 infections in Japan remain low, meaning should global cases rollover, Japan could be quicker in jumpstarting an economic recovery. Finally, an equity market rotation from expensive markets like the US towards cheaper and cyclical markets like Japan, will benefit the yen via the portfolio channel. From a valuation standpoint, the yen is the cheapest G10 currency according to our PPP models. We were long the yen and stopped out at break even (114.40). We will look to re-enter this trade at more attractive levels. Chart 6AJapanese Yen
Japanese Yen
Japanese Yen
Chart 6BJapanese Yen
Japanese Yen
Japanese Yen
British Pound: Near-Term Volatility The pound was up 1.9% in December. Year-to-date, cable is flat. UK data continues to moderate from high levels, similar to the picture in the US. Covid-19 infections continue to surge, but the December manufacturing PMI remains resilient at 57.9. Retail sales and house prices are also robust, and the latest CPI print for November, at 5.1%, justifies the interest rate hike by the Bank of England last month. The near-term path for the pound will be dictated by portfolio flows, and the ability of the BoE to deliver aggressive rate hikes already priced in the market. With the UK running a basic balance deficit, a dry up in foreign capital could hurt the pound. This will also be the case if the BoE does not deliver as many hikes as is discounted by markets. A rollover in energy costs (electricity prices are collapsing), and potentially, inflation could be catalyst. The post-Brexit environment also remains quite volatile. This short-term hiccup underpins our long EUR/GBP call. Longer term, incoming data continues to strengthen the case for the BoE to tighten policy. At 4.2%, the unemployment rate is at NAIRU. Wages are also inflecting higher. As such, the pound should outperform over the longer-term, as the BoE continues to normalize policy. Chart 7ABritish Pound
British Pound
British Pound
Chart 7BBritish Pound
British Pound
British Pound
Australian Dollar: Top Pick For 2022 The Australian dollar was up 2.2% in December. Year-to-date, the Aussie is down 1.4%. Covid-19 continues to ravage Australia, prompting the government to adopt measures such as threatening to deport superstar athletes who refuse to be vaccinated. Combined with the zero-Covid policy in China (Australia’s biggest export partner), the economic outlook remains grim in the near term. In our view, such pessimism opens a window to be cautiously long AUD. First, speculators are very short the currency. Second, low interest rates are reintroducing froth in the property market that the authorities have fought hard to keep a lid on. Home prices in Sydney and Melbourne are rising close to 20% year-on-year. Most inflation gauges are also above the midpoint of the RBA’s target. Our playbook is as follows: China eases policy, allowing Australian exports to remain strong. This will allow the RBA to roll back its dovish rhetoric, relative to other central banks. This will also trigger a terms of trade recovery and interest rate support for the AUD. We are cautiously long AUD at 70 cents, and recommend investors stick with this position. Chart 8AAustralian Dollar
Australian Dollar
Australian Dollar
Chart 8BAustralia Dollar
Australia Dollar
Australia Dollar
New Zealand Dollar: Up Versus USD, But Lower On The Crosses The New Zealand dollar was up 0.25% in December, while down 1.1% year to date. The Covid-19 situation is much better in New Zealand, compared to its antipodean neighbor, but recent economic developments still have a stagflationary undertone. Headline CPI and house prices are rising at the fastest pace in decades, but wage growth remains very muted. With the RBNZ that now has house price considerations in its mandate, the risk is that further rate hikes hamper the recovery. Data wise, the trade balance continues to print a deficit as domestic demand in China remains tepid. New Zealand currently has the highest G10 10-year government bond yield, suggesting marginally tighter financial conditions. Meanwhile, portfolio flows into New Zealand have turned negative in recent quarters, especially driven by defensive equity outflows. Overall, the kiwi will benefit from a recovery in China but less so than the AUD, which is much shorted and has a better terms of trade picture. As such we are long AUD/NZD. Chart 9ANew Zealand Dollar
New Zealand Dollar
New Zealand Dollar
Chart 9BNew Zealand Dollar
New Zealand Dollar
New Zealand Dollar
Canadian Dollar: Next Up After AUD? The CAD was up 1.4% in December. Year to date, the loonie is down 0.7%. The key driver of the CAD in 2022 remains the outlook for monetary policy, and the path of energy prices. We are optimistic on both fronts. On monetary policy, CPI inflation remains above the central bank’s target, house prices are rising briskly, and the trade balance continues to improve meaningfully. This provides fertile ground for tighter monetary settings. Employment in Canada is already above pre-pandemic levels and has now settled towards trend growth of around 2%. This suggests a print of 30,000 - 40,000 jobs (27,500 in December), is in line with trend. The unemployment rate continues to drop, hitting 6.0%. Oil prices also remain well bid, as outages in Libya offset planned production increases by OPEC. Should Omicron also fall to the wayside, travel resumption will bring back a meaningful source of demand. Net purchases of Canadian securities continue to inflect higher, as the commodity sector benefits from a terms-of-trade boom. We are buyers of CAD over a 12–18-month horizon. Chart 10ACanadian Dollar
Canadian Dollar
Canadian Dollar
Chart 10BCanadian Dollar
Canadian Dollar
Canadian Dollar
Swiss Franc: Line Of Defense The Swiss franc was up 0.8% in December and has fallen by 0.9% year to date. The Swiss economy continues to fare well amidst surging Covid-19 infections. Meanwhile, as a defensive currency, the franc has benefitted from the rise in volatility, especially compared to other currencies like the New Zealand dollar over the course of 2021 (we are long CHF/NZD). Economic wise, the unemployment rate has dropped to 2.5%, inflation is rising briskly, and house prices remain very resilient. This is lessening the need for the central bank to maintain ultra-accommodative settings. It is also interesting that the Swiss franc is well shorted by speculators engaging in various carry trades. Our baseline is that the Swiss National Bank is likely to lag the rest of the G10 in lifting rates from -0.75%, currently the lowest benchmark interest rate in the world. That said, this is well baked in the consensus suggesting any risk-off event or pricing of less monetary accommodation in other markets will help the franc. One area of opportunity is being long EUR/CHF, where the market has priced a very dovish ECB, even relative to the SNB. We are long this cross (which could suffer in the short term) but should rise longer term. Chart 11ASwiss Franc
Swiss Franc
Swiss Franc
Chart 11BSwiss Franc
Swiss Franc
Swiss Franc
Norwegian Krone: A Beta Play On A Lower Dollar The Norwegian krone was up 2.7% in December and is down 0.9% year to date. Norway was a developed market beacon of how to handle the pandemic until the more contagious Omicron variant started to ravage the economy. The latest data prints suggest core CPI is falling and house price appreciation is rolling over. Headline inflation remains strong, and the latest retail sales release shows 1% growth month on month for November suggesting some resilience amidst the pandemic. The Norges Bank has been the most orthodox in the G10, raising interest rates and promising to continue doing so in the coming quarters. Should Omicron prove transient and oil prices stay resilient, this will be a “carte blanche” for the Norges bank to keep normalizing policy. Norway’s trade balance and terms of trade remain robust. Meanwhile, portfolio investment in some unloved sectors in Norway could provide underlying support for the NOK. We are buyers of the NOK on weakness. Chart 12ANorwegian Krone
Norwegian Krone
Norwegian Krone
Chart 12BNorwegian Krone
Norwegian Krone
Norwegian Krone
Swedish Krona: A Play On China The SEK was up 0.3% in December and is down 1% year to date. The performance of the Swedish economy continues to strengthen the case for the Riksbank to tighten monetary policy. In recent data, the trade balance remains in a surplus as of November, household lending is rising 6.6% year on year (November), retail sales remain robust, and PPI is inflecting higher. Manufacturing confidence also improved in December, along with improvement in labor market conditions. The Riksbank will remain data dependent, but it has already ended QE. It remains one of the most dovish G10 central banks and is slated to keep its policy rate flat at 0% at least until 2024. This could change if inflationary pressures remain persistent. A bounce in Chinese demand could be the catalyst that triggers this change. We have no open positions now in SEK, but will look to go short USD/SEK and EUR/SEK should more evidence of a Swedish recovery materialize. Chart 13ASwedish Krona
Swedish Krona
Swedish Krona
Chart 13BSwedish Krona
Swedish Krona
Swedish Krona
Chester Ntonifor Foreign Exchange Strategist chestern@bcaresearch.com Trades & Forecasts Strategic View Tactical Holdings (0-6 months) Forecast Summary
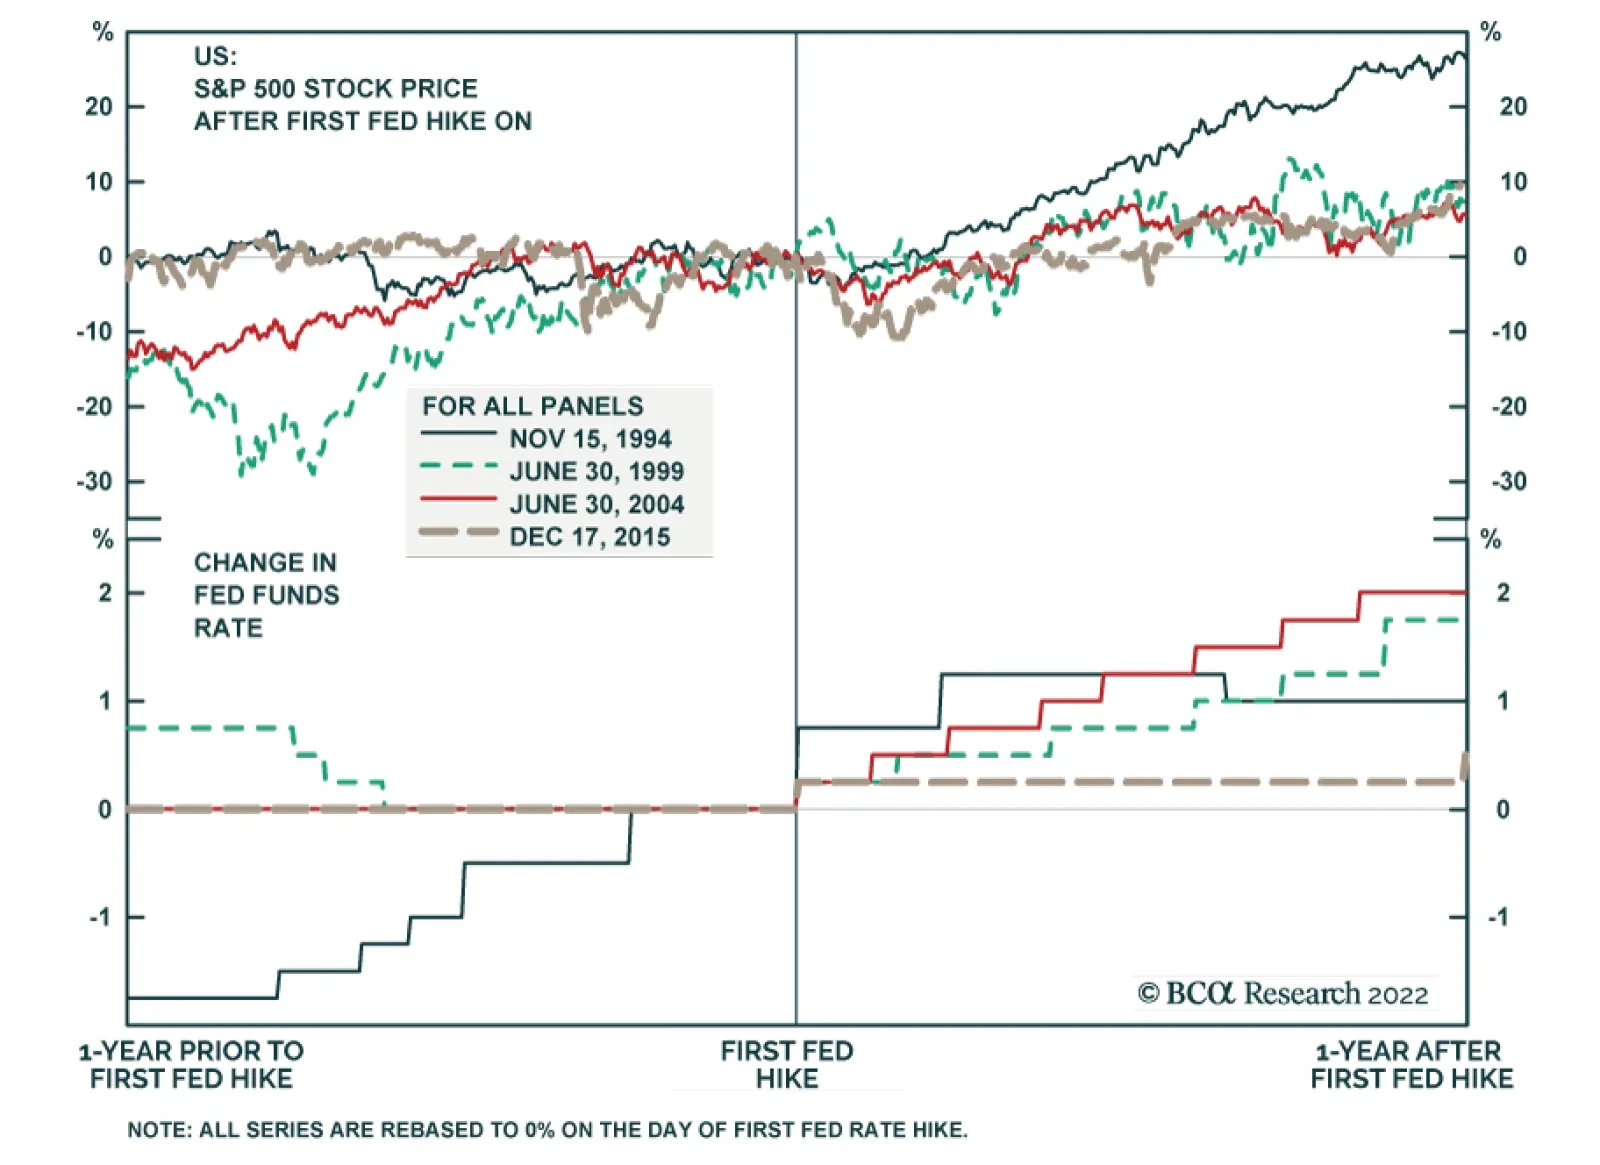
The December FOMC meeting minutes reinforced the Fed’s hawkish pivot and sent a chill down Wall Street on Wednesday. Unsurprisingly, the equity selloff was led by long-duration, interest rate sensitive sectors. The question facing investors going forward is…