Policy

Highlights The helicopter drops are over, … : The economic impact payments and supplemental unemployment insurance benefits may have stopped, but their full impact has yet to be felt. … but fiscal and monetary policy will continue to support demand, … : US households are sitting on more than $2 trillion of excess pandemic savings. If they were to spend just half of their stash over the next two or three years, the economy would gain a steady tailwind. … and the macro backdrop will remain equity-friendly, … : Monetary policy will be less accommodative going forward but it will remain solidly supportive of markets and the economy across all of 2022. … so investors should stick around for one last round: Equities and spread product outperform when monetary policy is easy. As long as COVID-19 doesn’t spring a nasty surprise, the expansion will continue and risk assets will once again generate positive excess returns over Treasuries and cash. Feature BCA editors’ annual sit-down with Mr. and Ms. X provides a welcome opportunity to gather our thoughts for the coming year and review how this year’s calls panned out. Looking back to this time last year,1 our risk-friendly recommendations performed well as the rationale behind them proved to be sound. Financial markets thrived in the wake of monetary and fiscal policy measures intended to err on the side of providing too much accommodation. The policy efforts were massive, and their support for markets and the economy has yet to be fully exhausted; indeed, their lengthy half-life is a key pillar of our sanguine 2022 outlook. Unlike last December, investors cannot look forward to peak accommodation in the year ahead; the peak is behind us and monetary and fiscal stimulus will be throttled back. The Fed is currently deliberating how much to accelerate its taper timetable, with an eye toward gaining the flexibility to hike rates sooner than previously planned. The hawkish turn foreshadowed by Chair Powell two weeks ago in Congressional testimony unsettled markets somewhat, but it is important to note that monetary policy settings are merely on track to become less accommodative – they are nowhere near crossing the line to restrictive and will not approach it anytime soon. Investors can be certain that markets will enjoy ample policy support across all of 2022 and we expect that equities will still be in a bull market when Mr. and Ms. X return to discuss the outlook for 2023. We are on board with the BCA consensus as detailed in the Bank Credit Analyst’s 2022 outlook.2 Early indications suggest that the Omicron variant will not be enough of a threat to provoke a negative growth surprise and we expect that the pandemic will recede in importance as the year unfolds. As it fades, supply chains should become less snarled, easing the near-term pressures that have been pushing prices higher. We expect that markets are overestimating inflation in the near term and that growth will be robust in the US and other developed economies. Despite the dialing back of some accommodation, monetary policy will remain easy, supporting economic activity and market valuations. We foresee another year of solidly positive excess returns for risk assets. The Economy Is Firing On All Cylinders You wouldn’t necessarily know it to talk with investors, much less consumer confidence survey respondents, but aggregate demand is surging and ought to remain robust going forward. Households are in fantastic shape. Although their net worth growth slowed in the third quarter, its 13% annualized seven-quarter (1Q20 through 3Q21) pace is within a whisker of all-time highs (Chart 1). They have accumulated $2.3 trillion of excess savings since the pandemic began and have plenty of capacity to borrow to augment their spending power. Just about anyone who wants a job can have one: the ratio of job openings to unemployed workers is making new highs (Chart 2) and the share of people in the labor force filing initial jobless claims is approaching the all-time lows set before the pandemic (Chart 3). Chart 1The Wealth Effect Will Support Consumption
The Wealth Effect Will Support Consumption
The Wealth Effect Will Support Consumption
Chart 2More Jobs Than People Without Them ...
More Jobs Than People Without Them ...
More Jobs Than People Without Them ...
Businesses are on a solid financial footing, as well. Debt as a share of net worth is near the lower end of its typical range since the high yield bond market got going in the late ‘80s (Chart 4). Borrowing costs are scraping all-time lows (Chart 5) and profit margins are wide (Chart 6). Banks and fixed income asset managers are falling all over themselves to lend to businesses and will continue to do so while default rates remain low. Chart 3... And Almost No Layoffs
... And Almost No Layoffs
... And Almost No Layoffs
Chart 4Corporations Have Less Debt And More Equity, ...
Corporations Have Less Debt And More Equity, ...
Corporations Have Less Debt And More Equity, ...
Chart 5... But Debt Has Never Cost Less ...
... But Debt Has Never Cost Less ...
... But Debt Has Never Cost Less ...
Chart 6... And Profit Margins Are Wide
... And Profit Margins Are Wide
... And Profit Margins Are Wide
Financial conditions will remain highly accommodative despite the Fed’s and other major developed world central banks’ moves to make them less easy at the margin. Below-equilibrium policy rates will continue to encourage financed purchases of homes, autos and other durable goods and entice investment via low hurdle rates. If sovereign bond yields rise modestly in 2022 in line with our high-conviction base case, governments won’t feel any pressure to tighten the fiscal screws. That may nourish modern monetary theory fantasies to the ultimate detriment of public finances, but it should ensure that all three engines of domestic demand – households, businesses and government – will hum in 2022. Omicron has reminded everyone that the pandemic is not over, but the shadow it casts on public health and economic activity is set to shrink. Booster shots of the Pfizer vaccine apparently provide effective protection, and Omicron’s mutations will not allow it to evade Merck’s and Pfizer’s soon-to-be-approved antiviral pills. The availability of pills to treat those who contract COVID could possibly be a game-changer in terms of neutralizing its global threat. Distributing shelf-stable pills is vastly simpler than delivering vaccines that need to be transported at temperatures below -70 degrees Fahrenheit. The Earnings Bar Has Been Set Very Low Our constructive view would not translate into risk friendly investment strategy if asset prices already discounted it or were expecting something even better. Just as the economy is on a better path than consumers seem to perceive and investors believe can persist, S&P 500 earnings per share are poised to grow over the next four quarters by more than the bottom-up analyst consensus expects. As compared to the simple annualized run rate of last quarter’s earnings ($215.76, or $53.89 times 4), the analyst consensus is calling for effectively no growth ($215.87) over the four quarters through 3Q22. That is a surprising prediction based on two sets of empirical evidence. First, earnings typically rise outside of recessions (Chart 7). Second, analysts have consistently forecast that forward four-quarter earnings would top the run rate of the last reported quarter’s earnings for four decades (Chart 8). This year, though, analysts have repeatedly called for quarter-over-quarter declines in earnings (Table 1), only to have reported numbers shred their estimates by jaw-dropping margins, just as they have in all six full quarters since COVID-19 arrived (Chart 9). We interpret the phase shift in the magnitude of earnings beats as evidence that companies have surprised themselves by how much they’ve been able to increase efficiency and/or cut costs during the pandemic. Our interactions with the investment community suggest that it has also been surprised but views the gains as one-off events that are unlikely to continue. Chart 7Earnings Declines Outside Of Recessions Are Rare
Earnings Declines Outside Of Recessions Are Rare
Earnings Declines Outside Of Recessions Are Rare
Chart 8This Has Been An Odd Time To Expect 40-Year Lows In Earnings Growth
This Has Been An Odd Time To Expect 40-Year Lows In Earnings Growth
This Has Been An Odd Time To Expect 40-Year Lows In Earnings Growth
Table 1Grim Expectations
2022 Key Views: Stay For One More Round
2022 Key Views: Stay For One More Round
Expectations of sequentially declining earnings would fit if the economy were flirting with falling below stall speed, as it regularly did during the sluggish post-GFC expansion. But they are completely at odds with the Bloomberg economist consensus that GDP will grow at a 5% real annualized rate this quarter and 3.9% in calendar 2022 (Table 2). Over time, S&P 500 revenue growth should converge with nominal GDP growth, so the current expectations for around 10% and 7% annualized nominal GDP growth in 4Q21 and 2022, respectively, are a decent starting point for estimating S&P 500 revenue growth over those periods. While we expect that S&P 500 profit margins have peaked, we do not foresee a sharp decline in 2022, and operating leverage should ensure that high single-digit revenue growth will translate into healthy earnings gains.
Chart 9
Table 2Above-Trend Growth Ahead
2022 Key Views: Stay For One More Round
2022 Key Views: Stay For One More Round
Bottom Line: The S&P 500 should have no trouble topping consensus estimates that foresee next to no growth in earnings over the next four quarters. There is ample room for corporate earnings to surprise to the upside. Our Major Disagreement With Markets Differences of opinion make markets and our biggest one pertains to the future direction of interest rates. We think the widespread conviction that the Fed will be unwilling or unable to raise the fed funds above 2%, if that, lest it crush financial markets and the real economy is way off base. The majority of investors seem to have taken the decade between the crisis and the pandemic as evidence that rates will remain very low for very long. Many of them must be buying the longer end of the Treasury curve in anticipation that an expedited liftoff date is the first step on the path to the next recession (Chart 10). Chart 10The Bond Market Sees Ice, Not Fire
The Bond Market Sees Ice, Not Fire
The Bond Market Sees Ice, Not Fire
The risk asset selloff that ensued in December 2018 after the FOMC marched the fed funds rate up to 2.5% looms large in the markets’ minds and feeds the widespread view that an ambitious program of rate hikes will pull the rug out from under financial assets and the economy. Many investors have also been conditioned by the post-crisis decade to assume that inflation cannot exceed 2% for a sustained period. The market view is rooted in honest-to-goodness evidence, but we think it is of little relevance now, given the way the massive pandemic fiscal stimulus programs have altered the backdrop. In the space of thirteen months from March 2020 through March 2021, Congress passed bills injecting over $5 trillion of aid – 25% of a year’s GDP – into the economy. The Herculean effort contrasted sharply with the skittish disbursement of less than 5% of GDP on the Bush and Obama administrations’ watch from 2008 through 2010. The aftermath of the crisis demonstrated that even multiple rounds of QE do not by themselves trigger inflation, especially if demoralized households and businesses are disinclined to borrow money to consume or invest, and chastened banks are subjected to regulatory strictures forcing them to maintain sizable new capital buffers and discouraging them from making any but plain-vanilla loans to highly rated borrowers. The Bernanke Fed’s three rounds of QE presumably tamped down interest rates, but the cash that bought the Treasury and agency securities barely tiptoed into the wider world before the primary dealer banks sent it right back to the Fed as excess reserves. With banks hiding their QE money under the mattress, the money supply didn’t expand in any notable way after the crisis. Thanks to Congress’ series of 2020-21 helicopter drops, the money supply has been growing at rates that would make the late Paul Volcker’s head spin (Chart 11). Inflation is fiendishly more complicated than Milton Friedman’s always-and-everywhere dictum suggests, but there’s now a whole lot of money chasing a limited amount of goods, services and assets. We expect that a receding pandemic will allow greater quantities of goods and services to be produced, and that securities underwriters and their clients are hard at work ramping up asset supply, but inflation has far more of a chance to gain traction now than it did in the decade before the pandemic. Chart 11Bringing "Always And Everywhere" Back Into Vogue?
Bringing "Always And Everywhere" Back Into Vogue?
Bringing "Always And Everywhere" Back Into Vogue?
We therefore think the lower-for-longer and lower-for-ever crowd will find itself offsides at some point in the next few years. We do not think it will get its comeuppance in 2022, however, as we see long yields rising only modestly, with the 10-year Treasury yield ending next year at 2-2.25%. Though we expect the fed funds rate will end the upcoming hiking cycle well north of 2%, bringing about the end of the bull markets in equities and credit, and quite possibly inducing the next recession, we do not think markets will abandon their new-normal rates view by the end of next year. This story will be continued, likely with a greater sense of urgency, in our 2023 outlook. Investment Recommendations Consistent with the foregoing, we make the following recommendations for 2022: Overweight equities in multi-asset portfolios. Although they are not cheap, and may experience a turbulent ride in 2022 as inflation concerns wax and wane, COVID-19 infections periodically surge and the Fed tries to adjust its messaging and actions on the fly, stocks should continue to generate sizable positive excess returns over Treasuries and cash. Overweight cyclical sectors and underweight defensive sectors within equity portfolios. If we’re right to be constructive on the global economy, Energy, Industrials, Materials and Financials are better positioned to benefit than Health Care, Staples and Utilities. Overweight small-cap equities versus large-cap equities. The S&P 600 SmallCap Index has greater exposure to our cyclicals-over-defensives call and our US Equity Strategy colleagues highlight that its constituents are cheaper than the S&P 500’s and are projected to have better earnings growth. Adding small-cap exposure to equity portfolios aligns with our constructive view on the economy and markets. Underweight fixed income in multi-asset portfolios. Underweight Treasuries within bond portfolios. Maintain below-benchmark duration within bond portfolios. Though we do not expect the bond market to see things entirely our way next year, we think the long end of the yield curve will shift out somewhat. We therefore have little appetite for duration and Treasuries and expect spread product will outperform Treasuries and high-yield corporate bonds will outperform investment-grade corporates. Consider hybrid alternatives to traditional fixed income securities. When we roll out our multi-asset ETF portfolio next month, it will include a hybrid bucket of income-generating assets to help multi-asset investors seeking income find low-beta destinations with a fighting chance of generating positive real total returns. Doug Peta, CFA Chief US Investment Strategist dougp@bcaresearch.com Footnotes 1 Please see the December 14, 2020 US Investment Strategy Report, "2021 Key Views: It’s The Policy, Stupid." 2 Please see the December 2021 Bank Credit Analyst, "OUTLOOK 2022: Peak Inflation – Or Just Getting Started?"
Highlights A partial reinvasion of Ukraine cannot be ruled out. The constraints on Russia are not prohibitive, especially amid global energy shortages. On this issue, it is better to be alarmist than complacent. We would put the risk of a partial re-invasion of Ukraine as high as 50/50, albeit with an uncertain time frame over 12-36 months. The negative impact of conflict may not stay contained within Russian and eastern European markets. The US and EU are now threatening major retaliatory sanctions if Russia invades. In response Russia could reduce energy exports, exacerbating global shortages and damaging Europe’s overall economy. Investors should stay short Russian assets and overweight developed European equities over emerging European peers. Stay long gold and GBP-CZK. The dollar will be flat-to-up. Feature Chart 1Ruble Faces More Downside From Geopolitics
Ruble Faces More Downside From Geopolitics
Ruble Faces More Downside From Geopolitics
Geopolitical tensions surrounding Russia remain unresolved and investors should continue to reduce holdings of assets exposed to any renewed conflict in Ukraine and the former Soviet Union. The ruble has dropped off its peaks since early November when strategic tensions revived (Chart 1). Presidents Joe Biden and Vladimir Putin held their second bilateral summit on a secure video link on December 7 to discuss the situation in Ukraine, where Russia has amassed 95,000-120,000 troops on the border in a major show of force. Russia also mustered troops in April and only partially drew them down after the Biden-Putin summit in Geneva where the two sides agreed to hold talks to address differences. The two presidents agreed to hold consultations regarding Ukraine. Putin accused NATO of building up Ukraine’s military and demanded “reliable, legally fixed guarantees excluding the expansion of NATO in the eastern direction and the deployment of offensive strike weapons systems in the states adjacent to Russia.”1 President Putin’s red line against Ukraine joining NATO is well known. Recently he said his red line includes the placement of western military infrastructure or missile systems in Ukraine. Biden refused to accept any limits on NATO membership in keeping with past policy. After the summit National Security Adviser Jake Sullivan said, “I will tell you clearly and directly [Biden] made no such commitments or concessions. He stands by the proposition that countries should be able to freely choose who they associate with.” 2 Biden, who had conferred with the UK, France, Germany, and Italy prior to the call, outlined the coordinated economic sanctions that would be leveled against Russia if it resorted to military force, as well as defense aid that would go to Ukraine and other eastern European countries. Thus Putin gave an ultimatum and Biden rebuffed it – and yet the two agreed to keep talking. The Russians have since said that they will present proposals to the Americans in less than a week. Talks are better than nothing. But neither side has given concrete indication of a change in position that would de-escalate strategic tensions – instead they have both raised the stakes. Therefore investors should proceed with the strong presumption that tensions will remain elevated or escalate in the coming months. Clearing Away Misconceptions Before going further we should clear away a few misconceptions about the current situation: Ukraine has unique strategic value to Russia. Like Belarus, but unlike Central Asia, Ukraine serves as critical buffer territory protecting Moscow and the Russian core from any would-be invaders. Russia lacks firm geological borders so it protects itself by means of distance and winter. This grand strategy succeeded against King Charles XII of Sweden, Napoleon, and Hitler. The collapse of the Soviet Union left Russia shorn of much of its buffer territory. Ukraine also offers access to the Black Sea. Russia has long striven to gain access to warm-water ports. The loss of control over Ukraine resulted in a loss of access. Russia’s seizure of Crimea in 2014 only partially rectified the situation. Ukraine’s southern coastline around Crimea is the territory at risk today (Map 1).
Chart
It is Ukraine’s physical existence and unique strategic value – not its democratic leanings or ideological orientation – that ensures perpetual tensions with post-Soviet Russia. Russia has a strategic imperative to reassert control or at least prevent control by foreign powers. Ideological opposition may make things worse but an anti-Russian Ukrainian dictator would also face Russian coercion or aggression, perhaps even more than the current weak democracy. In fact Russia is trying to force Ukraine to revise its constitution and adopt a federal structure so as to grant greater autonomy to separatist regions Donetsk and Luhansk that Russia helped break away in 2014. But Ukraine has not relented to Moscow’s demands of political reform. It is not authoritarianism but a permanent foreclosure of Ukrainian membership in the EU and NATO that Moscow is after. Yet it is highly unlikely that Russia would try to invade and conquer all of Ukraine. Ukraine is the largest country by territory in Europe and has 255,000 active soldiers and 900,000 reserves (contra Russia’s 1 million active and 2 million reserves) who would defend their freedom and sovereignty against an invader.3 Russia would not be able to stage a full-scale invasion with the 175,000 maximum troop buildup that US intelligence is warning about. It would have to mobilize fully, dangerously neglecting other vast dimensions of its national security, and would inevitably get bogged down fighting a vicious insurgency backed by the NATO powers. It would save blood and treasure by paralyzing Ukraine’s politics and preventing it from allying with western militaries, which is what Putin is attempting to do today. Putin uses foreign adventures to strengthen his grip at home but an adventure of this nature would impose such burdens as to threaten his grip at home. A limited re-invasion of Ukraine could yield historic strategic advantages to Russia. Moscow could focus on a partial military incursion that would annex or shore up Donbass, or extend its control from Donbass to the Black Sea, conceivably all the way to the Dnieper river. This pathway would yield Russia maritime access and a buffer space to fortify Crimea. Naval warfare could also yield control of deep-water ports (Yuzhne, Odessa, Mykolaiv, Chornomorsk), control of the mouth of the Dnieper, control of the canal that supplies water to Crimea, and a means of bottling up the Ukrainian navy and preventing foreign maritime assistance. Ukraine would be further weakened and Russia would have a larger beachhead in Ukraine for future pressure tactics. Russia is not bluffing – its military buildup poses a credible threat. If there is anywhere Russia’s threats are credible, it is in taking military action against former Soviet republics like Georgia (2008) and Ukraine (2014) that have pro-western leanings yet lack the collective security of the NATO alliance. At very least, given that Russian forces did deploy in Ukraine in 2014, Russian action in Ukraine cannot be ruled out. The military balance has not changed so significantly in that time and strongly favors Russia (Chart 2). The US has provided around $2.5 billion in military aid to Ukraine since 2014, and has sent lethal weapons including Javelin anti-tank missiles and launchers since 2017-18, including $450 million worth of military aid under the Biden administration (and $300 million just authorized by Congress on December 7). NATO allies have also provided defense aid. This is part of Putin’s complaint but these new arms are not game changers that would prevent Russia from taking military action.
Chart 2
Thus if the West rejects Moscow’s core demands, war is likely. This is true even if Russia would prefer to achieve its aims through political and economic rather than military means. Russia does not deem the West’s threat of sanctions as prohibitive of invasion. The West’s sanctions since 2014 have failed to change Russia’s government, strategy, or posture in Ukraine. Yes, European nations joined the US in imposing sanctions. But Germany also pursued the Nord Stream II pipeline as a means of bypassing Ukraine and working directly with Russia to preserve economic engagement and energy security. Former Chancellor Merkel forced the pipeline through despite the objections of eastern Europeans and the United States. The allies also formed the “Normandy Quartet,” excluding the US, to force Ukraine to accept the Minsk agreements on resolving the conflict. Thus the lesson of 2014-21 is not that NATO allies stood shoulder-to-shoulder in defense of Ukraine’s sovereignty and territorial integrity but rather that Germany and the EU, and the EU and the US, have major differences in interests and risk-tolerance in dealing with Russia. Russia does not face, or may think it does not face, a united front among the western powers. A partial reinvasion of Ukraine would bring the western allies together initially but probably not for long. Russia determines the timing of any new military incursion in Ukraine. Winter is not the ideal time to invade Ukraine, though it is possible. Russia could act in spring 2022, as the US has warned, but it could also act in the summer of 2023, the spring of 2024, or other times. From a strategic point of view, Russia has enjoyed a historic window of opportunity since 2001 when the US got bogged down in Afghanistan and Iraq and then the US and the EU got bogged down in economic and financial crisis. Given that the American political establishment is withdrawing from foreign quagmires, reactivating fiscal policy, bulking up the military-industrial complex, and making a dedicated effort to revitalize its global alliances, Russia may believe that its historic window is closing. Russia’s domestic fundamentals are deteriorating over time. Putin could decide it is necessary to seize strategic ground in Ukraine sooner rather than later. Bottom Line: Ukraine offers unique and irreplaceable buffer space and maritime access to Russia. Russia’s military actions in 2014 led to stalemate, such that Russia remains insecure, Ukraine remains defiant, and the West is still entertaining defense cooperation or even NATO membership with Ukraine. Yet the Crimea conflict also revealed a lack of concert among western powers exemplified by Germany’s Nord Stream II pipeline. Today Russia has the military capability to seize another slice of Ukrainian territory. Western retaliatory actions would be painful but may not be deemed prohibitive. Investors cannot rule out a partial re-invasion of Ukraine. Nord Stream Pipeline Is Not The Sole Factor Is Russia not making a show of military force merely to ensure that Nord Stream II pipeline goes into operation? Will Russia not back down if the pipeline is guaranteed? A common view in Washington and the financial industry is that Russia’s military buildup is just a bluff, i.e. Moscow’s aggressive way of demanding that Germany’s new government and the European Union approve Nord Stream. The pipeline finished construction in September but now awaits formal regulatory certification. Approval was originally expected by May 2022 but has now been delayed. The pipeline would carry 55 billion cubic meters of natural gas into Europe, about half of Russia’s current export capacity outside of Ukraine. Ukraine’s total capacity is around 150 billion cubic meters. The pipeline enables Russia and Germany to bypass Ukraine, whose conflicts with Moscow since 2004 have threatened Germany’s energy security. About 18% of EU’s total energy imports come from Russia, whilst this figure is 16% for Germany. That is about 0.5% and 0.2% of EU and German GDP, respectively. Meanwhile Russian energy exports to Germany and the EU make up 0.8% and 5.6% of GDP, respectively (Chart 3).
Chart 3
The problem with this reasoning is that the US conceded Nord Stream to Russia over the summer. The US initially raised the threat of sanctions because the pipeline strengthened Russo-German ties, diminished Ukraine’s leverage, and deprived the US of a chance to sell liquefied natural gas to Europe. But the Biden administration proved unwilling to take this aggressive approach. Secretary of State Anthony Blinken has a long history of arguing that the US should prioritize strong relations with its European allies rather than punitive measures to try to block Russian gas sales. Biden met with outgoing Chancellor Angela Merkel in July and agreed to let Nord Stream go forward. The only proviso was that Russia not “weaponize natural gas,” i.e. withhold supplies for geopolitical purposes, as it has done in the past.4 Before Russia’s military threats, Germany and the EU were expected to certify the pipeline by no later than May 2022 and an earlier certification looked possible because of Europe’s low natural gas supplies. Yet Russia, fresh off parliamentary elections, did precisely what Germany said it was not supposed to do. The pipeline was completed in September and reports of Russian limitations on natural gas supply surfaced in October. Moscow not only weaponized the gas but also mustered its army on the Ukrainian border again. Putin may have feared that the new German government, which officially took office on December 8, would change policy and refuse to certify the pipeline. He also could have feared that the US Congress would pass a Republican-backed provision that would require Biden to impose sanctions that would halt the pipeline. But these explanations are not satisfactory. First, the German government was not likely to halt Nord Stream. Quite the opposite, Berlin has pushed against all opposition to speed the pipeline into action. It only delayed the regulatory approval when Russia did the one thing that Germany had expressly prohibited, which was weaponize natural gas. Second, the US Congress was never likely to pass mandatory sanctions on Nord Stream operators. The Democrats opposed it, as it would have tied Biden’s hands, whereas presidents always retain discretion over foreign policy and national security. Even moderate Republicans opposed the measure, for the same reason. If either of these were the reason for Putin’s latest buildup, then the buildup will probably dissipate in the coming months. Putin also wants to force Ukraine to implement the Minsk agreements. But the Biden administration adopted the Minsk framework in June for the first time, which was a concession to Russia. So the latest military threats are not solely about coercing Europe to approve the pipeline or Ukraine to implement Minsk. Putin is driving at something else. Putin’s Focus On Ukraine And NATO Putin used military pressure on Ukraine’s border to force the US to accept the pipeline and the Minsk agreements. He is now using the same tactic to raise the stakes and demand that the US and its allies permanently rule out NATO membership and defense cooperation with Ukraine. Biden rejected the first demand during the summit, as mentioned. There is no way that the US or NATO will forswear any and all eastward expansion. Even on Ukraine specifically, Biden cannot give Russia a legal guarantee because it would require a 60-seat majority in the Senate (not likely). Any future president would retain prerogative over the matter anyway and Putin knows this. Moreover Ukraine is never going to join NATO. Russia would attack. And NATO members would not be unanimous (as is required for new members) because the collective defense treaty would require them to defend Ukraine. They would be signing up for a war with Russia. Still Biden is unlikely to disavow Ukrainian NATO membership because to do so would be to deny the self-determination of nations, capitulate to Russian coercion, and demoralize the Ukrainians, whom the US hopes will maintain a plucky resistance against Russian domination. It would also demoralize US allies and partners – namely Taiwan, which also lacks a formal defense treaty and would be forced to sue for peace with China in the face of American abandonment. Biden’s refusal to ban Ukraine from NATO is encapsulated in Diagram 1, an exercise in game theory that exemplifies why the risk of war should not be dismissed. Diagram 1Game Theory Suggests Russia Will Keep Applying Military Pressure
Russia/Ukraine: Don’t Be Complacent
Russia/Ukraine: Don’t Be Complacent
Biden may give private or executive assurances on Ukraine and NATO but Putin will know that these mean nothing since Biden may be out of office as early as January 2025 and then Putin would have to renegotiate. America is not a credible negotiator because partisanship has resulted in extreme foreign policy vacillations – the next president could revoke the deal. Even after Putin is gone Russia would have to negotiate with the US to prevent the US from arming Ukraine. Hence Moscow may decide to reduce Ukraine and improve Russia’s strategic position by force of arms. This is true even if Biden forswears the NATO option, as Diagram 1 illustrates. Putin’s second demand – that the US not provide offensive weapon systems in countries adjacent to Russia – is more material. This is what the new round of talks will focus on. This new Ukraine line of talks is separate, more urgent and important, than the other bilateral dialogues on the arms race, and cyber-war. US-Russia talks on Iran are also urgent, however, and Russia’s cooperation there may be contingent on US concessions regarding Ukraine. The US may be willing to stop its defense cooperation with Ukraine but not with other allies and partners, however. It is also not clear what Putin will accept. These negotiations will have to be watched. Biden cannot make major concessions with a gun to his head. It is unclear how far the US is willing to concede on defense cooperation with countries around Russia. The US may quietly abandon Ukraine but then it would need to reinforce its other defense relationships. If Putin draws down the troops, and Biden calls a stop to defense aid to Ukraine, then a crisis may be averted. What Could Go Wrong? Economic sanctions under consideration in Washington are significant: the US could freeze bank transactions, expand restrictions on trading Russian sovereign and corporate debt, and lobby Belgium to kick Russia off the SWIFT financial messaging system. However, these sanctions may not be effective in preventing Russia from using military force. Russia has weathered US sanctions since 2014, and the smaller and weaker Iranian economy has weathered maximum pressure sanctions since 2019. Energy producers like Russia and Iran have maximum geopolitical leverage when global energy inventories draw down, as is the case today. Even in the face of Russian military aggression, the Biden administration is vacillating on sanctions targeting Russia’s energy sector that would contribute to global shortages and ultimately raise prices at the pump for voters in a midterm election year.5 Germany’s new government also hesitates to declare unambiguously that it will discontinue the Nord Stream II pipeline if Russia invades Ukraine. True, Germany signaled that the pipeline would be halted. Its energy regulator declared that the pipeline’s ownership must be unbundled, which pushes back the certification date to sometime after May 2022 – this was a geopolitical not a legalistic decision. But construction is completed, the pipeline physically exists, which will vitiate Germany’s commitment to sanctions whenever natural gas shortages occur, as is the case this winter (Chart 4). Shortages will continue to occur and Russia controls a large share of supply.
Chart 4
Chart 5
It would take a catastrophe to drive Germany to restart coal and nuclear plants, so natural gas will continue to be in demand. Germany does not have liquefied natural gas import capability yet. If Europe imposes crippling sanctions on Russia, Russia could reduce energy supplies and harm Europe’s economy (Chart 5). The Russian economy and society would suffer which is one reason any military action in Ukraine would be limited in scope. Still, Moscow may believe that Germany would restrain the EU, and the EU would restrain the US, thereby preventing sanctions from being fully, uniformly, and durably implemented. Prior to Russia’s aggression, public opinion polls showed that the German public strongly supported Nord Stream. Even a majority of Green Party members supported it despite the fact that the Greens were the most critical of increasing Germany’s dependency on fossil fuels and an authoritarian petro-state. While public approval of the pipeline has surely suffered in the face of Russian aggression, a majority probably still favors the pipeline. Germany has a national consensus in support of engagement with Russia and avoiding a new cold war, given that the original Cold War cut Germany in half. For that reason invasion may only temporarily unite the western powers – it could ultimately drive a wedge between Germany and other EU members, namely in the former Soviet bloc. It would also divide the more risk-averse EU from the US in terms of how to deal with Russia. And it would weaken the Biden administration at a time when it is extremely vulnerable, exacerbating America’s internal divisions. Russian domestic patriotism would rally, at least initially. Note that Russia could miscalculate on this issue and that is one reason for high level of risk. Perhaps the West would prove far more unified and aggressive in its sanctions enforcement than it was after 2014. A falling ruble and rising inflation could cause Russian social unrest. But Russia could misread the situation. Unless the US and Europe escalate the sanctions threat massively to better deter Russia, their lack of concert is another reason for investors not to be complacent about renewed conflict. Bottom Line: The threat of sanctions may prove insufficient to deter renewed Russian aggression against Ukraine. Germany favors engagement with Russia and Europe’s energy dependency on Russia makes it vulnerable to supply disruptions. Russia has leverage given tight global energy markets, Europe’s low natural gas inventories, and US domestic political considerations ahead of the 2022 midterms. Investment Takeaways The point of this report argues that a partial re-invasion of Ukraine cannot be ruled out. Russia has the capability to reinforce de facto control of Donbas, or expand its footprint in southern Ukraine, though not to invade the whole country. The threat of economic sanctions is not yet so overwhelming as to warrant overconfident predictions of de-escalation. In this case it is better to be alarmist than complacent. Russia would want to maintain an element of surprise so the timing of any belligerence is hard to predict. For de-escalation, investors should watch for Russia to withdraw troops from the Ukrainian border, US-Russia consultations to begin promptly and proceed regularly, and for the US and allies to delay or halt defense cooperation and arms transfers to Ukraine. While global investors would quickly become de-sensitized to conflict that is entirely contained in Ukraine, the trans-Atlantic threat of major sanctions now raises the stakes and suggests that global energy shocks could negatively affect the European or global economy in the event of conflict. Any conflict could also spill outside of Ukraine’s borders, as with Malaysian Airlines flight MH17, which was shot down by Russian-backed Ukrainian separatists in July 2014. The Black Sea has seen a dangerous uptick in naval saber-rattling and that strategic situation would become permanently more dangerous if Russia seized more of coastal Ukraine. Russian military integration with Belarus is also a source of insecurity for EU and NATO members. Global financial markets have only started to price the geopolitical risk emanating from Russia. Our Russian GeoRisk Indicator has ticked up (Chart 6). But Russian equity performance relative to broad emerging markets is only arguably underperforming what is implied by Brent crude oil prices. Chart 6Market Slow To React To Ukraine Crisis - Risk To Downside For Russian Assets
Market Slow To React To Ukraine Crisis - Risk To Downside For Russian Assets
Market Slow To React To Ukraine Crisis - Risk To Downside For Russian Assets
This relatively muted reaction suggests more downside lies ahead if we are right that strategic tensions will be flat-to-up over the coming months. Sell the RUB-USD on any strength. Stay long GBP-CZK. Tactically short Russian equities versus EM-ex-Asia (Chart 7). They are exposed to further correction as a result of escalating geopolitical risk. Chart 7Russia Falling Off Peaks Of Performance Versus EM-Ex-Asia
Russia Falling Off Peaks Of Performance Versus EM-Ex-Asia
Russia Falling Off Peaks Of Performance Versus EM-Ex-Asia
Chart 8Developed Europe A Safer Bet Than Emerging Europe Amid Tensions
Developed Europe A Safer Bet Than Emerging Europe Amid Tensions
Developed Europe A Safer Bet Than Emerging Europe Amid Tensions
Stick to long DM Europe versus EM Europe – our main trade this year to capture rising geopolitical risk between Russia and the West (Chart 8). Matt Gertken Vice President Geopolitical Strategy mattg@bcaresearch.com Footnotes 1 President of Russia, "Meeting with US President Joseph Biden," December 7, 2021, kremlin.ru. 2 White House, "Press Briefing by Press Secretary Jen Psaki and National Security Advisor Jake Sullivan, December 7, 2021," whitehouse.gov. 3 Dan Peleschuk, "Ukraine’s military poses a tougher challenge for Russia than in 2014," Politico, April 14, 2021, politico.eu.; see also Gav Don, "LONG READ: Russia looks poised to invade Ukraine, but what would an invasion actually look like?" Intellinews, November 24, 2021, intellinews.com. 4 US Department of State, "Joint Statement of the United States and Germany on Support for Ukraine, European Energy Security, and our Climate Goals," July 21, 2021, state.gov. 5 Kylie Atwood and Natasha Bertrand, "US likely to hold off for now on energy sanctions for Russia, fearing impact on global prices," CNN, December 9, 2021, cnn.com. Strategic Themes Open Tactical Positions (0-6 Months) Open Cyclical Recommendations (6-18 Months)
Highlights The last two years have taught us to live with Covid-19. This means global growth will remain strong in 2022. That is not reflected in a strong dollar. The RMB will be a key arbiter between a bullish and bearish dollar view. This is because a weak RMB will be deflationary for many commodity currencies, especially if it reflects weak Chinese demand. Inflation in the US will remain stronger than in other countries. The key question is what the Federal Reserve does next year. In our view, they will stay patient which will keep real interest rates in the US very low. Upside in the DXY is nearing exhaustion according to most of our technical indicators. We upgraded our near-term target to 98. Over a longer horizon, we believe the DXY will break below 90, towards 85 in the next 12-18 months. A key theme for 2022 will be central bank convergence. Either inflation proves sticky and dovish central banks turn a tad more hawkish, or inflation subsides and aggressive rate hikes priced in some G10 OIS curves are revised a tad lower. The path for bond yields will naturally be critical. Lower bond yields will initially favor defensive currencies such as the DXY, CHF and JPY. This is appropriate positioning in the near-term. Further out in 2022, as bond yields rise, the Scandinavian currencies will be winners. Portfolio flows into US equities have been a key driver of the dollar rally. This has been because of the outperformance of technology. Should this change, equity flows could switch from friend to foe for the dollar. A green technology revolution is underway and this will benefit the currencies of countries that will supply these raw materials. The AUD could be a star in 2022 and beyond. The rise in cryptocurrencies will continue to face a natural gravitational pull from policy makers. Gold and silver will rise in 2022, but silver will outperform gold. Feature 2022 has spooky echoes of 2020. In December 2019, we were optimistic about the global growth outlook, positive on risk assets, and bearish the US dollar. That view was torpedoed in March 2020, when it became widely apparent that COVID-19 was a truly global epidemic. More specifically, the dollar DXY index (a proxy for safe-haven demand) rose to a high of 103. US Treasury yields fell to a low of 0.5%. Chart 1Covid-19 And The Dollar
Covid-19 And The Dollar
Covid-19 And The Dollar
Today, the DXY index is sitting at 96, exactly the midpoint of the March 2020 highs and the January 2021 lows. Once again, the dollar is discounting that the new Omicron strain will be malignant – worse than the Delta variant, but not as catastrophic as the original outbreak (Chart 1). Going into 2022, we are cautiously optimistic. First, we have two years of data on the virus and are learning to live with it. This suggests the panic of March 2020 will not be repeated. Second, policymakers are likely to stay very accommodative in the face of another exogenous shock. This will especially be the case for the Fed. Our near-term target for the DXY index is 98, given that the macro landscape remains fraught with risks. This is a speculative level based on exhaustion from our technical indicators (the dollar is overbought) and valuation models (the dollar is expensive). Beyond this level, if our scenario analysis plays out as expected, we believe the DXY index will break below 90 in 2022. Omicron And The Global Growth Picture Chart 2Global Growth And The Dollar
Global Growth And The Dollar
Global Growth And The Dollar
Our golden rule for trading the dollar is simple – sell the dollar if global growth will remain robust, and US growth will underperform its G10 counterparts. Historically, this rule has worked like clockwork. Using Bloomberg consensus growth estimates for 2022, US growth is slated to stay strong, but give way to other economies (Chart 2). News on the Omicron variant continues to be fluid. As we go to press, Pfizer suggests a third booster dose of its vaccine results in a 25-fold increase in the antibodies that attack the virus. Additionally, a new vaccine to combat the Omicron variant will be available by March. If this proves accurate, it suggests the world population essentially has protection against this new strain. The good news is that vaccinations are ramping up around the world, especially in emerging markets. Countries like the US and the UK were the first countries to see a majority of their population vaccinated. Now many developed and emerging market countries have a higher share of their population vaccinated compared to the US (Chart 3). Chart 3ARising Vaccinations Outside The US
Rising Vaccinations Outside The US
Rising Vaccinations Outside The US
Chart 3BRising Vaccinations Outside The US
Rising Vaccinations Outside The US
Rising Vaccinations Outside The US
This has resulted in a subtle shift – growth estimates for 2022 are increasingly favoring other countries relative to the US (Chart 4). Let us consider the case of Japan - just in June this year, ahead of the Olympics, only 25% of the population was vaccinated. Today, Japan has vaccinated 77% of its population and new daily infections are near record lows. While Omicron is a viable risk, the starting point for Japan is very encouraging and should open a window for a recovery in pent-up demand and a pickup in animal spirits. Chart 4ARising Growth Momentum Outside The US
Rising Growth Momentum Outside The US
Rising Growth Momentum Outside The US
Chart I-4
This template could very much apply to other countries as well. This view is not embedded in the dollar, which continues to price in an outperformance of US growth (Chart 5). The Risks From A China Slowdown China sits at the epicenter of a bullish and bearish dollar view. If Chinese growth is bottoming, then the historical relationship between the credit impulse and pro-cyclical currencies will hold (Chart 6). This will benefit the EUR, the AUD, the CAD and even the SEK which that track the Chinese credit impulse in real time. As an expression of this view, we went long the AUD at 70 cents. Chart 5Economic Surprises Outside The US
Economic Surprises Outside The Us
Economic Surprises Outside The Us
Chart 6Chinese Credit Demand And Currencies
Chinese Credit Demand And Currencies
Chinese Credit Demand And Currencies
Just as global policy makers are calibrating the risk from the Omicron variant, the Chinese authorities are also acknowledging the risk of an avalanche from a property slowdown. They have already eased monetary policy on this basis. Specific to the dollar, a key arbiter of a bullish or bearish view will be the Chinese RMB. So far, markets have judiciously separated the risk, judging that the Chinese authorities can surgically diffuse the real estate market, without broad-based repercussions in other parts of the economy (such as the export sector). Equities and corporate credit prices have collapsed in specific segments of the Chinese market but the RMB remains strong (Chart 7). Correspondingly, inflows into China remain very robust, a testament to the fact that Chinese growth (while slowing) remains well above that of many other countries (Chart 8). Chart 7The RMB Has Diverged From The Carnage In China
The RMB Has Diverged From The Carnage In China
The RMB Has Diverged From The Carnage In China
Chart 8Strong Portfolio Inflows Into China
Strong Portfolio Inflows Into China
Strong Portfolio Inflows Into China
China contributed 20% to global GDP in 2021 and will likely contribute a bigger share in 2022, according to the IMF (Chart 9). This suggests that foreign direct investment in China will remain strong . This will occur at a time when the authorities could have diffused the risk from a property market slowdown.
Chart I-9
The commodity-side of the equation will also be important to monitor, especially as it correlates strongly with developed-market commodity currencies. It is remarkable that despite the slowdown in Chinese real estate, commodity prices remain resilient (Chart 10). This has been due to adjustment on the supply side, as our colleagues in the Commodity & Energy Strategy team have been writing. Finally, China offers one of the best real rates in major economies. It also runs a current account surplus. This suggests there is natural demand and support for the RMB (Chart 11). A strong RMB limits how low developed-market commodity currencies can fall. Chart 10Commodity Prices Remain Well Bid
Commodity Prices Remain Well Bid
Commodity Prices Remain Well Bid
Chart 11Real Interest Rates Favor The RMB
Real Interest Rates Favour The RMB
Real Interest Rates Favour The RMB
Inflation And The Policy Response Output gaps are closing around the world as fiscal stimulus has helped plug the gap in aggregate demand. This suggests that while inflation has been boosted by idiosyncratic factors (supply bottlenecks) that could soon be resolved, rising aggregate demand will start to pose a serious problem to the inflation mandate of many central banks. Chart 12A Key Driver Of The Dollar Rally
A Key Driver Of The Dollar Rally
A Key Driver Of The Dollar Rally
As we wrote a few weeks ago, there have been consistencies and contradictions with the market response to higher inflation. The market is now pricing in that the Fed will raise interest rates much faster, compared to earlier this year. According to the overnight index swap (OIS) curve, the Fed is now expected to lift rates at least twice by December 2022, compared to earlier this year. Meanwhile, market pricing is even more aggressive when looking at the December 2022 Eurodollar contract, relative to either the Euribor contract (European equivalent) or Tibor (Japanese equivalent) (Chart 12). The reality is that outside the ECB and the BoJ, other central banks have actually been more proactive compared to the Federal Reserve. The Bank Of Canada has ended QE and will likely raise interest rates early next year, the Reserve Bank of New Zealand has ended QE and raised rates twice, and the Reserve Bank of Australia has already been tapering asset purchases. The Bank of England will also be ahead of the Fed in raising interest rates, according to our Global Fixed Income Strategy colleagues. This suggests that the pricing of a policy divergence between the Fed and other G10 central banks could be a miscalculation and a potential source of weakness for the dollar. Chart 13The US Is Generating Genuine Inflation
The US Is Generating Genuine Inflation
The US Is Generating Genuine Inflation
Rising inflation is a global phenomenon and not specific to the US (Chart 13). So either inflation subsides and the Fed turns a tad more accommodative, or inflation proves sticky and other central banks turn a tad more hawkish to defend their policy mandates. We have two key short-term trades penned on this view – long EUR/GBP and long AUD/NZD. While the European Central Bank will lag the Bank of England (and the Fed) in raising interest rates, expectations for the path of policy are too hawkish in the UK, with 4 rate hikes priced in by the end of 2022. Similarly, hawkish expectations for the Reserve Bank of New Zealand are likely to be revised lower, relative to the Reserve Bank of Australia. As for the US, the Fed is likely to hike interest rates next year but real rates will remain very low relative to history (Chart 14A and 14B). Low real rates will curb the appeal of US Treasuries. Chart 14AReal Interest Rates In The US Are Very Negative
Real Interest Rates In The US Are Very Negative
Real Interest Rates In The US Are Very Negative
Chart I-14
The Dollar And The Equity Market Chart 15The US Stock Market And The Dollar
The US Stock Market And The Dollar
The US Stock Market And The Dollar
One of the biggest drivers of a strong dollar this year (aside from rising interest rate expectations), has been equity inflows. The greenback tends to do well when US bourses are outperforming their overseas peers (Chart 15). It is also the case that value tends to underperform growth in an environment where the dollar is rising. We discussed this topic in depth in our special report last summer. Flows tend to gravitate to capital markets with the highest expected returns. So if investors expect the pandemic winners (technology and healthcare) to keep driving the market in an Omicron setting, the US bourses that are overweight these sectors will do well. We will err on the other side of this trade for 2022. Part of that is based on our analysis of the global growth picture in the first section of this report. If growth rotates from the US to other economies, their bourses should do well as profits in these economies recover. Earnings revisions in the US have been sharply revised lower compared to other countries (Chart 16). This has usually led to a lower dollar eventually. In the case of the euro area, there has been a strong and consistent relationship between relative earnings revisions vis-à-vis the US, and the performance of the euro (Chart 17). Chart 16Earnings Revisions Are Moving Against US Companies
Earnings Revisions Are Moving Against US Companies
Earnings Revisions Are Moving Against US Companies
Chart 17Earnings Revisions Are Moving In Favor Of Euro Area Companies
Earnings Revisions Are Moving In Favor Of Euro Area Companies
Earnings Revisions Are Moving In Favor Of Euro Area Companies
In a nutshell, should profits in cyclical sectors recover on the back of rising bond yields, strong commodity prices and a tentative bottoming in the Chinese economy, value sectors that are heavily concentrated in countries with more cyclical currencies such as Australia, Norway, Sweden, and Canada, will benefit. Ditto for their currencies. The Outlook For Petrocurrencies
Chart I-18
When the pandemic first hit in 2020, oil prices (specifically the Western Texas Intermediate blend) went negative. This drop pushed the Canadian dollar towards 68 cents and USD/NOK punched above 12. This time around, the drop in oil prices (20% from the peak for the Brent blend) has been more muted. We think this sanguine market reaction is more appropiate in our view for two key reasons. First, as our colleagues in the Commodity & Energy Stategy team have highlighted, investment in the resource sector, specifically oil and gas, has been anemic in recent years. In Canada, investment in the oil and gas sector has dropped 68% since 2014 at the same time as energy companies are becoming more and more compliant vis-à-vis climate change (Chart 18). Second, if we are right, and Omicron proves to be a red herring, then transportation demand (the biggest source of oil demand) will keep recovering. In terms of currencies, our preference is to be long a petrocurrency basket relative to oil consumers. As the US is the biggest oil producer in the world (Chart 19), being long petrocurriences versus the dollar has diverged from its historical positive relationship with oil prices. Chart 20 shows that a currency basket of oil producers versus consumers has had both a strong positive correlation with oil prices and has outperformed a traditional petrocurrency basket. Chart 19The US Is Now A Major Oil Producer
The US Is Now A Major Oil Producer
The US Is Now A Major Oil Producer
Chart 20Hold A Basket Of Oil Consumers Versus Producers
Hold A Basket Of Oil Consumers Versus Producers
Hold A Basket Of Oil Consumers Versus Producers
Technical And Valuation Indicators The dollar tends to be a momentum-driven currency. Past strength begets further strength. We modelled this when we published our FX Trading Model, which showed that a momentum strategy outperformed over time (Chart 21). The problem with momentum is that it works until it does not. Net speculative long positions in the dollar are approaching levels that have historically signaled exhaustion (Chart 22). There is a dearth of dollar bears in today’s environment. That is positive from a contrarian standpoint. Meanwhile, our capitulation index (a measure of how overbought or oversold the dollar is) is approaching peak levels. Chart 21The Dollar Is A Momentum Currency
The Dollar Is A Momentum Currency
The Dollar Is A Momentum Currency
Chart 22Long Dollar Is A Consensus Trade
Long Dollar Is A Consensus Trade
Long Dollar Is A Consensus Trade
Valuation is another headwind for the dollar. According to all of our in-house models, the dollar is expensive. That is the case according to both our in-house curated PPP model (Chart 23) and a simple one based on headline consumer prices (Chart 24).
Chart I-23
Chart 24The Dollar is Expensive
The Dollar is Expensive
The Dollar is Expensive
In a broader sense, we have built an attractiveness ranking for currencies (Chart 25). This ranks G10 currencies on a swathe of measures, including their basic balances, our internal valuation models, sentiment measures, economic divergences, and external vulnerability. The ranking is in order of preference, with a lower score suggesting the currency is sitting in the top/most attractive quartile of the measures. The Norwegian krone and Swedish krona are especially attractive as 2022 plays.
Chart I-25
More specifically, the Scandinavian currencies have been one of the hardest hit this year. The Norwegian krone will benefit from the reopening of economies, particularly through the rising terms-of-trade. The Swedish krona will benefit from a pickup in the industrial sector, and continued strength in global trade. The least attractive G10 currencies are the New Zealand dollar and the greenback. This is mostly due to valuation. As we have highlighted in previous reports, valuation is a poor timing tool in the short term but over a longer-term horizon, currencies tend to revert towards fair value. Where Next For EUR/USD? Our bias is that the euro has bottomed. The ECB will lag the Fed in raising interest rates, but the spread between German bund yields and US Treasuries does not justify the current level of the euro. More importantly, if European growth recovers next year, this will sustain portfolio flows into the eurozone, which are cratering (Chart 26). Our 2022 target for EUR/USD is 1.25, a level that will unwind 10.6% of the undervaluation versus the dollar. Beyond valuation,s a few key factors support the euro: As a pioneer in green energy and a pro-cyclical currency, the euro will benefit from portfolio flows into renewable energy companies, as well as foreign direct investment. A close proxy for these flows are copper prices, that have positively diverged from the performance of the euro (Chart 27). Chart 26The Euro And Portfolio Flows
The Euro And Portfolio Flows
The Euro And Portfolio Flows
Chart 27EUR/USD And Copper
EUR/USD And Copper
EUR/USD And Copper
Inflation in the euro area is lagging the US, but is undeniably strong. As such, while the ECB will lag the Fed in tightening monetary policy, the divergence in monetary policy will not widen. Earnings revisions are moving in favor of European companies, as we have shown earlier. Historically, this has put a floor under the euro. Safe-Haven Demand: Long JPY Safe-haven currencies will perform well in the near term. We are long the yen, which is the cheapest currency according to our models and also one of the most shorted. CHF will also do well in the near term, though as we have argued, will induce more intervention from the Swiss National Bank.
Chart I-28
We are long both the yen and CHF/NZD as short-term trades, but our preference is for the yen. First, Japan has one of the highest real rates in the developed world. So, outflows from JGBs are going to be curtailed. Second, the DXY and USD/JPY have a strong positive correlation, and this places the yen in a very enviable position as the dollar weakens in 2022 (Chart 28). A Final Word On Gold, Silver, And Precious Metals Chart 29Hold Some Gold
Hold Some Gold
Hold Some Gold
Along with our commodity strategists, we remain bullish precious metals. In our view, inflation could prove stickier than most investors expect. This will depress real rates and support precious metals. Within the precious metals sphere, we particularly like silver and platinum. Almost every major economy now has negative real interest rates. Gold (and silver) have a long-standing relationship with negative interest rates (Chart 29). Central banks are also becoming net purchasers of gold, which is bullish for demand. The true precious metals winner in 2022 could be silver. The Gold/Silver ratio (GSR) tends to track the US dollar quite closely, so a bearish view on the dollar can be expressed by being short the GSR (Chart 30). Second, gold is very expensive compared to silver (Chart 31). In general, when gold tends to make new highs (as it did in 2020), silver tends to follow suit. This means silver prices could double from current levels over the next few years, to reclaim their 2011 highs. Finally, the bullish case for platinum is the same as for silver. It has lagged both gold and palladium prices. Meanwhile, breakthroughs are being made in substituting palladium for platinum in gasoline catalytic converters. Chart 30Hold Some Silver
Hold Some Silver
Hold Some Silver
Chart 31Stay Short The GSR
Stay Short The GSR
Stay Short The GSR
Concluding Thoughts Our currency positions, as we enter 2022, are biased towards a lower dollar, but we also acknowledge that there are key risks to the view. Our recommendations are as follows: The DXY will could touch 98 in the near term, but will break below 90 over the next 12-18 months. An attractiveness ranking reveals the most appealing currencies are JPY, SEK, and NOK, while the least attractive are USD and NZD. Chart 32Hold Some AUD
Hold Some AUD
Hold Some AUD
Policy convergence will be a key theme at the onset of 2022. Stay long EUR/GBP and AUD/NZD as a play on this theme. Look to buy a basket of oil producers versus consumers once volatility subsides. We went long the AUD at 70 cents. Terms of trade are likely to remain a tailwind for the Australian dollar (Chart 32). The AUD will benefit specifically in a green revolution. Chester Ntonifor Foreign Exchange Strategist chestern@bcaresearch.com Trades & Forecasts Strategic View Cyclical Holdings (6-18 months) Tactical Holdings (0-6 months) Limit Orders Forecast Summary
Highlights 1. How will the pandemic resolve? 2. Will services spending recover to its pre-pandemic trend? 3. Will we spend our excess savings? 4. How will central banks react to inflation? 5. Will cryptocurrencies continue to eat gold’s lunch? 6. How fragile is Chinese real estate? 7. Will there be another shock? Fractal analysis: Personal goods versus consumer services. Feature Chart of the WeekWill Services Spending Recover To Its Pre-Pandemic Trend?
Will Services Spending Recover To Its Pre-Pandemic Trend?
Will Services Spending Recover To Its Pre-Pandemic Trend?
“Judge a man by his questions, not by his answers” The quotation above is often misattributed to Voltaire instead of its true author, Pierre-Marc-Gaston de Lévis. Irrespective of the misattribution, we agree with the maxim. Asking the right questions is more important than finding answers to the wrong questions. In this vein, this report takes the form of the seven crucial questions for 2022 (and our answers). 1. How Will The Pandemic Resolve? As new variants of SARS-CoV-2 have arrived like clockwork, the number of new global cases of infection and the virus reproduction rate have formed a near-perfect mathematical ‘sine wave’. This near-perfect sine wave will propagate into 2022 (Chart I-2). Chart I-2The Pandemic's Sine-Wave Will Propagate Into 2022
The Pandemic's Sine-Wave Will Propagate Into 2022
The Pandemic's Sine-Wave Will Propagate Into 2022
But how will this sine wave of infections translate into mortality, morbidity, and stress on our healthcare systems? As we explained in RNA Viruses: Time To Tell The Truth, the answer depends on the specific combination of contagiousness, immuno-evasion, and pathogenicity of each variant. Yet none of this should come as any surprise. Flus and colds also come in waves, which is why we call them flu and cold seasons. And the morbidity of a given flu and cold season depends on the aggressiveness of that season’s flu and cold variant. So, just like the flu and the cold, Covid will become an endemic respiratory disease which comes in waves. The trouble is that our under-resourced health care systems can barely cope with a bad flu season, let alone with an additional novel disease that can be worse than the flu. Hence, until we add enough capacity to our healthcare systems, expect more disruptions to economic activity from periodic non-pharmaceutical interventions such as travel bans, vaccine passports, and face-mask mandates. 2. Will Services Spending Recover To Its Pre-Pandemic Trend? The pandemic has given us a crash course in virology and epidemiology. We now understand antigens, antibodies, and ‘reproduction rates.’ We understand that a virus transmits as an aerosol in enclosed unventilated spaces, and that singing, and yelling eject this viral aerosol. We understand that vaccinations for RNA viruses have limited longevity, do not prevent reinfections, and that certain environments create ‘super-spreader’ events. Armed with this new-found awareness, a significant minority of people have changed their behaviour. Services which require close contact with strangers – going to the dentist or in-person doctors’ appointments, going to the cinema or to amusement parks, or using public transport – are suffering severe shortfalls in demand. Given that this change in behaviour is likely long-lasting, demand for these services is unlikely to regain its pre-pandemic trend in 2022 (Charts I-3 - I-6). Chart I-3Dental Services Are Far Below The Pre-Pandemic Trend
Dental Services Are Far Below The Pre-Pandemic Trend
Dental Services Are Far Below The Pre-Pandemic Trend
Chart I-4Physician Services Are Far Below The Pre-Pandemic Trend
Physician Services Are Far Below The Pre-Pandemic Trend
Physician Services Are Far Below The Pre-Pandemic Trend
Chart I-5Recreation Services Are Far Below The Pre-Pandemic Trend
Recreation Services Are Far Below The Pre-Pandemic Trend
Recreation Services Are Far Below The Pre-Pandemic Trend
Chart I-6Public Transportation Is Far Below The Pre-Pandemic Trend
Public Transportation Is Far Below The Pre-Pandemic Trend
Public Transportation Is Far Below The Pre-Pandemic Trend
Therefore, to keep overall demand on trend, spending on goods will have to stay above its pre-pandemic trend. This will be a tough ask. Durables, by their very definition, last a long time. Even clothes and shoes, though classified as nondurables, are in fact quite durable. Meaning that are only so many cars, iPhone 13s, gadgets, clothes and shoes that any person can own before reaching saturation. If, as we expect, spending on goods falls back to its pre-pandemic trend, but spending on services does not recover to its pre-pandemic trend, then there will be a demand shortfall in 2022 (Chart of the Week). 3. Will We Spend Our Excess Savings? If spending falls short of income – as it did through the pandemic – then, by definition, our savings have gone up. Many people claimed that this war chest of savings would unleash a tsunami of spending. Well, it didn’t. And, it won’t. Previous episodes of excess savings in 2004, 2008, and 2012 had no impact on the trend in spending (Chart I-7).
Image
The explanation comes from a theory known as Mental Accounting Bias. The theory states that we segment our money into different accounts, which are sometimes physical, sometimes only mental, and that our willingness to spend money depends on which mental account it occupies. This contrasts with standard economic theory which assumes that money is perfectly fungible, meaning that a dollar in a current (checking) account is no different to a dollar in a savings or investment account. In practice, money is not fungible, because we attach different emotions to our different mental accounts. A dollar in our current account we will gladly spend, but a dollar in our savings account we will not spend. Hence, the moment we move the dollar from our current account into our savings account, our willingness to spend it collapses. This explains why consumption trends have no connection with windfall income receipts once those income receipts end up in our savings mental or physical account. Pulling all of this together, the war chest of savings accumulated during the pandemic is unlikely to change the overall trend in spending. 4. How Will Central Banks React To Inflation? The real story of the current ‘inflation crisis’ is that while goods and commodity prices have surged exactly as expected in a positive demand shock, services prices have not declined as would be expected in the mirror-image negative demand shock. The result is that aggregate inflation has surged even though aggregate demand has not (Chart I-8 and Chart I-9). Chart I-8Goods Prices Have Reacted To A Positive Demand Shock...
Goods Prices Have Reacted To A Positive Demand Shock...
Goods Prices Have Reacted To A Positive Demand Shock...
Chart I-9...But Service Prices Have Not Reacted To A Negative Demand Shock
...But Service Prices Have Not Reacted To A Negative Demand Shock
...But Service Prices Have Not Reacted To A Negative Demand Shock
Why have services prices remained resilient despite a massive negative demand shock? One answer, as explained in question 2, is that much of the shortfall in services demand is due to behavioural changes, which cannot be alleviated by lower prices. If somebody doesn’t go to the dentist or use public transport because he is worried about catching Covid, then lowering the price will not lure that person back. In fact, the person might interpret the lower price as a signal of greater risk, and might become more averse. In technical terms, the price elasticity of demand for certain services has flipped from its usual negative to positive. This creates a major problem for central banks, because if the price elasticity of services demand has changed, then surging aggregate inflation is no longer a reliable indicator of surging aggregate demand. To repeat, inflation is surging even though aggregate demand is barely on its pre-pandemic trend. Hence in 2022, central banks face a Hobson’s choice. Choke demand that does not need to be choked, or turn a blind eye to inflation and risk losing credibility. 5. Will Cryptocurrencies Continue To Eat Gold’s Lunch? Most of the value of gold comes not from its economic utility as a beautiful, wearable, and electrically conductive metal, but from its investment value as a hedge against the debasement of fiat money. The multi-year investment case for cryptocurrencies is that they are set to displace much of gold’s investment value. Still, to displace gold’s investment value, cryptocurrencies need to match its other qualities: an economic utility, and limited supply. A cryptocurrency’s economic utility comes from its means of exchange for the intermediation services that its blockchain provides. For example, if you issue a bond or smart-contract using the Ethereum blockchain, then you must pay in its cryptocurrency ETH. Which gives ETH an economic utility. Furthermore, the number of blockchains that will succeed as go-to places for intermediation services will be limited, and each cryptocurrency has a limited supply. Thereby, the supply of cryptocurrencies that have a utility is also limited. With an economic utility, a limited supply, and drawdowns that are becoming smaller, cryptocurrencies can continue to displace gold’s dominance of the $12 trillion anti-fiat investment market. Therefore, the cryptocurrency asset-class can continue its strong structural uptrend, albeit punctuated by short sharp corrections (Chart I-10). Chart I-10Cryptocurrencies Will Continue To Displace Gold's Investment Value
Cryptocurrencies Will Continue To Displace Gold's Investment Value
Cryptocurrencies Will Continue To Displace Gold's Investment Value
The corollary is that the structural outlook for gold is poor. 6. How Fragile Is Chinese Real Estate? A decade-long surge in Chinese property prices has lifted Chinese valuations to nosebleed levels. According to global real estate specialist Savills, prime real estate yields in China’s major cities are now barely above 1 percent, and the world’s five most expensive cities are all in China: Hangzhou, Shenzhen, Guangzhou, Beijing, and Shanghai (Chart I-11).
Chart I-11
Without a social safety net and with limited places to park their money, Chinese savers have for years been encouraged to buy homes, in the widespread belief that property is the safest investment, whose price only goes up. With the bulk of people’s wealth in property acting as a perceived economic safety net, even a modest decline in house prices would constitute a major shock to the household sector’s hopes and expectations of what property is. Therefore, in contrast to the US housing debacle in 2008, the Chinese government will ensure that its property market adjustment does not come from a collapse in home prices. Rather, it will come from a collapse in property development and construction activity. This will have negative implications for commodities, emerging Asia, developing countries that produce raw materials, and machinery stocks worldwide. 7. Will There Be Another Shock? Most strategists claim that shocks, such as the pandemic, are unpredictable. We disagree. Yes, the timing and source of an individual shock is unpredictable, but the statistical distribution of shocks is highly predictable. We define a shock as any event that causes the long-duration bond price in a major economy to rally or slump by at least 20 percent.1 Using this definition through the last 60 years, the statistical distribution of the number of shocks in any ten-year period is Poisson (3.33) and the time between shocks is Exponential (3.33). This means that in any ten-year period, the likelihood of suffering a shock is a near-certain 95 percent; in any five-year period, it is an extremely high 80 percent; in a two-year period it is a coin toss at 50 percent; and even in one year it is a significant 30 percent (Chart I-12).
Chart I-12
Therefore, on a multi-year horizon, another shock is a near-certainty even if we do not know its source or precise timing. The question is, will it be net deflationary, or net inflationary? Our high-conviction view is that it will be net deflationary. Meaning that even if it starts as inflationary, it will quickly morph into deflationary. The simple reason is that it is not just Chinese real estate that is fragile. Through the past ten years, world prime residential prices are up by 70 percent while rents are up by just 25 percent2 (Chart I-13). Meaning that the bulk of the increase in global real estate prices is due to skyrocketing valuations. The culprit is the structural collapse in global bond yields – which, in turn, is due to persistently ultra-low policy interest rates combined with trillions of dollars of quantitative easing. Chart I-13Property Price Inflation Has Far Exceeded Rent Inflation
Property Price Inflation Has Far Exceeded Rent Inflation
Property Price Inflation Has Far Exceeded Rent Inflation
This means that bond yields have very limited scope to rise before pulling the bottom out of the $300 trillion global real estate market. Given that this dwarfs the $90 trillion global economy, it would constitute a massive deflationary backlash to the initial inflationary shock. Some people counter that in an inflationary shock, property – as the ultimate real asset – ought to perform well even as bond yields rise. However, when valuations start off in nosebleed territory as now, the initial intense headwind from deflating valuations would obliterate the tailwind from inflating incomes. Investment Conclusions To summarise, 2022 will be a year in which: Covid waves continue to disrupt the economy; a persistent shortfall in spending on services is not fully countered by excess spending on goods; China’s construction boom comes to an end; inflation takes time to cool, pressuring central banks to raise rates despite fragile demand; and the probability of another shock is an underestimated 30 percent. We reach the following investment conclusions: Overweight the China 30-year bond and the US 30-year T-bond. There will be no sustained rise in long-duration bond yields, and the risk to yields is to the downside. Long-duration equity sectors and stock markets that are least sensitive to cyclical demand will continue to rally (Chart I-14). Chart I-14The US Stock Market = The 30-Year T-Bond Multiplied By Profits
The US Stock Market = The 30-Year T-Bond Multiplied By Profits
The US Stock Market = The 30-Year T-Bond Multiplied By Profits
Overweight the US versus non-US. Underweight Emerging Markets. Underweight old-economy cyclical sectors such as banks, materials, and industrials. Commodities will struggle. Underweight commodities that haven’t corrected versus those that have (Chart I-15). Chart I-15Underweight Commodities That Haven't Yet Corrected
Underweight Commodities That Haven't Yet Corrected
Underweight Commodities That Haven't Yet Corrected
Overweight the US dollar versus commodity currencies. Cryptocurrencies will continue their structural uptrend at the expense of gold. Goods Versus Services Is Technically Stretched Finally, this week’s fractal analysis corroborates the massive displacement from services spending into goods spending, highlighted by the spectacular outperformance of personal goods versus consumer services. This outperformance is now at the point of fragility on its 260-day fractal structure that has signalled previous reversals (Chart I-16). Therefore, a good trade would be to short personal goods versus consumer services, setting a profit target and symmetrical stop-loss at 12.5 percent. Chart I-16Underweight Personal Goods Versus Consumer Services
Underweight Personal Goods Versus Consumer Services
Underweight Personal Goods Versus Consumer Services
Dhaval Joshi Chief Strategist dhaval@bcaresearch.com Footnotes 1 As bond yields approach their lower limit, this definition of a shock will need to change as it will become impossible for long-duration bond prices to rally by 20 percent. 2 Based on Savills Prime Index: World Cities – Capital Values, and World Cities – Rents and Yields, June 2011 through June 2021. Fractal Trading System Fractal Trades 6-Month Recommendations Structural Recommendations Closed Fractal Trades Indicators To Watch - Bond Yields Chart II-1Indicators To Watch - Bond Yields - Euro Area
Indicators To Watch - Bond Yields - Euro Area
Indicators To Watch - Bond Yields - Euro Area
Chart II-2Indicators To Watch - Bond Yields - Europe Ex Euro Area
Indicators To Watch - Bond Yields - Europe Ex Euro Area
Indicators To Watch - Bond Yields - Europe Ex Euro Area
Chart II-3Indicators To Watch - Bond Yields - Asia
Indicators To Watch - Bond Yields - Asia
Indicators To Watch - Bond Yields - Asia
Chart II-4Indicators To Watch - Bond Yields - Other Developed
Indicators To Watch - Bond Yields - Other Developed
Indicators To Watch - Bond Yields - Other Developed
Indicators To Watch - Interest Rate Expectations Chart II-5Indicators To Watch - Interest Rate Expectations
Indicators To Watch - Interest Rate Expectations
Indicators To Watch - Interest Rate Expectations
Chart II-6Indicators To Watch - Interest Rate Expectations
Indicators To Watch - Interest Rate Expectations
Indicators To Watch - Interest Rate Expectations
Chart II-7Indicators To Watch - Interest Rate Expectations
Indicators To Watch - Interest Rate Expectations
Indicators To Watch - Interest Rate Expectations
Chart II-8Indicators To Watch - Interest Rate Expectations
Indicators To Watch - Interest Rate Expectations
Indicators To Watch - Interest Rate Expectations
Highlights Indian stocks need more time to digest and consolidate the significant gains from earlier this year. However, the country’s medium and long-term growth outlook remains positive. Indian firms’ profit margins will likely settle at a higher level than usual. That will also put a floor on its equity multiples. With an imminent topline recovery, the main driver of Indian stocks next year will be profits, in contrast with multiple expansions during the last year and a half. India is beginning a cyclical expansion with a cheap rupee. Stay neutral Indian stocks in an EM equity basket for now. Investors should overweight India in an EM domestic bond portfolio. Feature Chart 1Indian Stocks Are Overbought
Indian Stocks Are Overbought
Indian Stocks Are Overbought
We tactically downgraded Indian stocks from overweight to neutral in EM and emerging Asian equity portfolios in early October this year. This call has worked out well so far as India’s absolute and relative share prices seem to have peaked. The primary reason for our tactical “neutral” call on Indian equities was this market’s vertical rise earlier this year, both in absolute and relative terms. Similar spikes – in terms of magnitude and duration back in 2007 and in 2014 – were followed by a period of underperformance (Chart 1). Yet, we recommended downgrading to only a neutral allocation. The reason is that the country’s cyclical outlook remains constructive, and the profit expansion cycle has further to run. That forbade us from turning too bearish on this bourse. A neutral stance on India also makes sense for the next several months as this bourse digests and consolidates its previous gains. In this report, we detail the various nuances of our analysis. Meanwhile, the Indian currency is cheap versus the greenback and will likely be one of the best performing currencies in the EM world over the next year. A positive currency outlook also makes Indian government bonds attractive for foreign investors, as Indian bonds also offer a high yield amid a benign domestic inflation backdrop. Dedicated EM domestic bond portfolios should stay overweight India. Equity Multiple Compression Ahead? Chart 2India's Profit Margin Expansion Has Led To Its Equity Re-Rating
India's Profit Margin Expansion Has Led To Its Equity Re-Rating
India's Profit Margin Expansion Has Led To Its Equity Re-Rating
An upshot to the steep equity rally earlier this year has been India’s stretched valuations. That made many investors question the sustainability of the outperformance. A pertinent question, therefore, is how overvalued have Indian stocks become? And how much multiple compression can investors expect in this bourse? Before we answer this question, it’s useful to understand what drove the cyclical re-rating of Indian markets in the first place. The solid black line in Chart 2 shows the gross profit margins of all Indian listed non-financial firms. They have risen substantially since spring 2020 to reach decade-high levels. Margin expansions of this magnitude are indicative of material efficiency gains; and are usually rewarded with an equity re-rating. This is indeed what happened since spring 2020: stock multiples rose following the expanding margins. The same can be said if we only consider the major non-financial corporations’ EBITDA margins (Chart 2, bottom panel). If one looks at the cyclically adjusted P/E ratio (CAPE) instead, we see a very similar thing: the CAPE ratio has also risen in line with rising profit margins (Chart 3). Chart 3Profit Margins Have A Bearing On Equity Valuations
Profit Margins Have A Bearing On Equity Valuations
Profit Margins Have A Bearing On Equity Valuations
Charts 2 and 3 show that the positive correlations between profit margins and stock multiples held steady over past several cycles. Hence, it will be reasonable to expect that should Indian firms hold on to wide margins, they will not suffer a significant de-rating going forward. Can Margins Stay Wide? Chart 4Indian Firms' Borrowing Costs Will Likely Stay Low
Indian Firms' Borrowing Costs Will Likely Stay Low
Indian Firms' Borrowing Costs Will Likely Stay Low
Before we delve into the question of whether margins can stay wide, we need to understand what caused such a margin expansion in the first place. That cause is cost cutting: wage bills have gone down as businesses slashed employees. Data from Oxford economics show that there had been 9% fewer workers in India as of September 2021 compared to March 2020, just before the pandemic. Interest expense has also gone down – both relative to sales and profits (Chart 4) – as interest rates were cut aggressively. In our view, the latest rollover in profit margins will likely be temporary and limited. It is probably due to hiring back of some employees. Beyond a near-term limited drop in margins, the more relevant question to ask is, can Indian corporations maintain high margins? Our bias is that, to a large extent, they can. The main reason is that firms’ costs are slated to stay under control: Chart 5Indian Companies Do Not Face Any Wage Pressures
Indian Companies Do Not Face Any Wage Pressures Firms' Costs Will Likely Stay Low As Wage Pressures Are Muted...
Indian Companies Do Not Face Any Wage Pressures Firms' Costs Will Likely Stay Low As Wage Pressures Are Muted...
Wage expectations are low. Going forward, as millions of new job seekers and workers temporarily discouraged by the pandemic enter the job market, wages have little chance of much of an increase. The top panel of Chart 5 shows salary expectations from an industrial survey by RBI. Both the assessment for the current quarter and expectations for the next quarter have been a net negative for a while. Rural wages are also similarly timid (Chart 5, bottom panel). Notably, companies’ hiring back of employees is slow. It seems they prefer to substitute labor by capital by investing in new machines and equipment. This will boost productivity and cap wages. Overall, high productivity growth will keep companies’ profit margins wide and excess labor will suppress wages. Higher margins and low inflation are bullish for the stock market. Critically, headline inflation is within the central bank target bands, and our model shows that it will likely remain as such (Chart 6, top panel). Core inflation is also likely to stay flattish (Chart 6, bottom panel). This means the odds are that the central bank will not raise rates anytime soon. Flattish inflation and policy rates mean firms’ borrowing costs, in both nominal and real terms, are slated to stay approximately as low as they are now. Low real borrowing costs are usually a tailwind for stocks (Chart 7).
Chart 6
Chart 7Low Borrowing Costs Are Bullish For Stocks
Low Borrowing Costs Are Bullish For Stocks
Low Borrowing Costs Are Bullish For Stocks
All put together, Indian companies will likely see their costs largely under control. That, in turn, should keep profit margins wider than usual. Wide profit margins should limit multiple compression. Can The Topline Rise Further? Wider margins will boost total profits if and once the topline (revenues) recovers. So, the next question is, how much topline recovery is in the cards? Chart 8Indian Economy Is In A Rapid Expansion Mode
Indian Economy Is In A Rapid Expansion Mode
Indian Economy Is In A Rapid Expansion Mode
There are already signs that sales will likely accelerate in the months to come: PMI indexes for both the manufacturing and services sectors have recovered strongly since the Delta variant-induced lockdowns in spring. They are now hovering around a very high level of close to 60. This indicates that the economy is in a rapid expansion mode (Chart 8). The Industrial Outlook survey (conducted by the RBI) shows that the order books for the September quarter was already at a decade-high level. The expectation for the next few quarters is even more elevated – indicating strong momentum (Chart 9, top panel). In other surveys, such as the PMI and Business Expectation survey (from Dun & Bradstreet), we see similar strong order books (Chart 9, bottom panel). While orders are strong, inventory of finished goods is low. Not surprisingly, businesses are expecting very high-capacity utilization in the next few quarters (Chart 10, top two panels). Chart 9Firms' Order Books Are Quite Robust
Firms' Order Books Are Quite Robust
Firms' Order Books Are Quite Robust
Chart 10Low Inventories Mean Stronger Economic Activity Ahead
Low Inventories Mean Stronger Economic Activity Ahead
Low Inventories Mean Stronger Economic Activity Ahead
They are expecting to hire more people. Companies also believe consumer demand will revive which will enable wider profit margins. In sum, firms are optimistic about accelerating economic activity (Chart 10, bottom two panels). Chart 11A Positive Bank Credit Impulse Is Bullish For Industrial Activity
A Positive Bank Credit Impulse Is Bullish For Industrial Activity
A Positive Bank Credit Impulse Is Bullish For Industrial Activity
This, in turn, is encouraging them to make capital investments. Finally, the commercial banks’ credit impulse has also turned positive. Rising bank credit impulses usually signal stronger industrial production (Chart 11). To summarize, chances are that firms’ top lines are set to rise materially. Coupled with high margins, this will translate into strong profit acceleration in the next several quarters. Put differently, over the past year and a half, Indian firms witnessed rising margins. Going forward, they will likely see rising profits. Higher profits, in turn, will propel Indian share prices cyclically beyond any short-term consolidation. A Sustainable Expansion? In a notable departure from most developed countries, India’s recovery from the pandemic-induced recession has been more capex-led, rather than consumption-led (Chart 12). One reason for that is the Indian government did not supplement the lost household incomes during the lockdowns nearly as much as developed countries did. That, in turn, kept household demand low. And it also contributed to keeping inflation in check – even though India’s supply side was also paralyzed due to strict lockdown measures. On the other hand, firms’ profits soared owing to rigorous cost-cutting. Higher profits in turn have encouraged firms to expand their production capacity. Companies are ramping up capital spending as they expect sales to accelerate in the future (Chart 13). Chart 12A Capex-Led Recovery Will Prolong The Economic Expansion
A Capex-Led Recovery Will Prolong The Economic Expansion
A Capex-Led Recovery Will Prolong The Economic Expansion
Chart 13Strong Profits Are Encouraging Firms To Ramp Up Capital Spending
Strong Profits Are Encouraging Firms To Ramp Up Capital Spending
Strong Profits Are Encouraging Firms To Ramp Up Capital Spending
Notably, the combination of curtailed household demand and robust capital expenditure has set India’s inflation dynamics apart from many other countries in Latin America and EMEA. While India’s inflation remains largely contained, countries in those regions are witnessing accelerating inflation. Also, over a cyclical horizon, a capex-led expansion is very crucial for India as this will determine the duration and magnitude of the cycle. Strong investment expenditures do not only boost firms’ competitiveness and profitability, but they also help keep inflationary pressures at bay. Lower inflation for a longer period means the central bank need not raise rates as soon and/or as much as otherwise would be the case. That in turn allows the economic and profit expansion to continue for longer. An extended period of expansion is also positive for multiples as investors extrapolate profit growth over many years ahead. India’s current dynamics are a case in point. Given the country is facing no imminent interest rate hikes, stock multiples can stay higher for longer. This is because multiple de-rating commences only after meaningful rate hikes have already been accorded (Chart 14). Since that is quite far off, valuations are not facing any immediate and considerable headwinds. Finally, India is beginning the new cycle with a rather inexpensive currency. Chart 15 shows that the rupee is currently cheaper by about 10% than what would be its “fair value” vis-à-vis the US dollar. The fair value has been derived from a regression analysis of the exchange rate on the relative manufacturing producer prices of India and the US. Chart 14It Takes Several Rate Hikes Before It Hurts Stock Multiples
It Takes Several Rate Hikes Before It Hurts Stock Multiples
It Takes Several Rate Hikes Before It Hurts Stock Multiples
Chart 15India's Cyclical Expansion Has A Tailwind From Cheap Currency
India's Cyclical Expansion Has A Tailwind From Cheap Currency
India's Cyclical Expansion Has A Tailwind From Cheap Currency
Investment Conclusions Equities: Given the vertical rise earlier this year, Indian stocks would likely need a few more months to digest previous gains and consolidate. Hence, even though the country’s cyclical outlook remains constructive, we recommend that dedicated EM and Asian equity portfolios stay neutral on this market for now. Absolute return investors should stay on the sidelines and wait for a better entry point. Currency and Bonds: The rupee is cheap and could be one of the best performers within the EM world over a cyclical horizon. Indian government bonds also offer a good value with a rather high yield (6.4% for 10-year securities) amid a benign inflation outlook. A positive rupee outlook also makes Indian bonds more appealing for foreign investors. Investors should stay overweight India in an EM local currency bond portfolio. Rajeeb Pramanik Senior EM Strategist rajeeb.pramanik@bcaresearch.com Footnotes
Highlights Omicron vs. The Fed: The new COVID variant has thrown a growth scare into markets, but the bigger concern is the Fed belated playing catch up to high inflation and low unemployment. Fade the Omicron bond rally, and position for higher US Treasury yields over the next year with the Fed threatening to taper faster, and potentially hike sooner, than markets expect. New Zealand: Underlying growth and inflation fundamentals, soaring house prices, and the central bank’s historical reaction function indicate that the Reserve Bank of New Zealand will lift the cash rate to 2% by the end of 2022. However, markets are already priced for this, leaving little room for New Zealand debt to continue underperforming on a relative basis. We are upgrading New Zealand sovereigns to neutral and initiating a long NZ/short US 10-year spread trade. A Year-End Bout Of Uncertainty Chart of the WeekMarkets Have Been Worried About The Fed Since September
Markets Have Been Worried About The Fed Since September
Markets Have Been Worried About The Fed Since September
Over the past two weeks, we have published Special Reports and thus have not had an opportunity to comment on market moves and news. Needless to say, it has been an eventful period! The emergence of the new Omicron variant, and the hawkish shift in the Fed’s guidance on future policy moves, have injected fresh uncertainty and volatility into global financial markets. Since the existence of Omicron was revealed to the world on Nov 26, 30-year US Treasury yields have fallen by as much as -23bps and the S&P 500 index has been down by as much as -4.4%. Yet the evolving Fed stance, with Fed Chair Jerome Powell hinting last week that the end of tapering and start of rate hikes could begin sooner than expected next year, is having a more lasting influence on risk asset performance. Dating back to the September 23 FOMC meeting, when the Fed first signaled an imminent tapering of bond purchases and pulled forward the timing of liftoff into 2022, the 2-year US Treasury yield has gone up from 0.22% to 0.63%. Importantly, there has been little pullback on the pricing at the front-end of the US Treasury curve due to the Omicron shock. That pre-September-FOMC low in the 2-year Treasury yield also marked the peak in riskier fixed income market performance for 2021, with the Bloomberg Global High-Yield and Emerging Market USD-Denominated Sovereign total return indices down -2.0% and -1.8%, respectively, since Sept 23 (Chart of the Week). Other risk assets also appear to be responding more to news about the Fed than Omicron. Equity markets stopped climbing since the Fed announced the first taper of bond purchases at the November 3 FOMC meeting – three weeks before the world knew of Omicron - which also coincided with troughs in the VIX index and corporate credit spreads, not only in the US but in Europe and emerging markets as well (Chart 2). Of course, it is difficult to disentangle which is having a greater impact, the variant or the Fed, when details on both are evolving at the same time. Omicron Investors are understandably right to be nervous about a new COVID variant that can reportedly evade existing vaccines and even infect those who have had COVID previously. The whole idea of “putting COVID in the rearview mirror’ that has helped fuel booming equity and credit markets was predicated on vaccines being both effective and widely available. However, when investors see COVID case numbers start to pick up in the US and Europe, with vaccination rates twice that of South Africa where Omicron was first detected (Chart 3), this raises concern about a return to pre-vaccine economic restrictions and uncertainty. Chart 2A Typical Risk-Off Response To The Emergence Of Omicron
A Typical Risk-Off Response To The Emergence Of Omicron
A Typical Risk-Off Response To The Emergence Of Omicron
Chart 3Omicron Putting A Dent In Vaccine Optimism
Omicron Putting A Dent In Vaccine Optimism
Omicron Putting A Dent In Vaccine Optimism
The “Omicron effect” on fixed income markets has been most evident in the repricing of interest rate expectations. Since the presence of Omicron was revealed on November 26, there has been a reduction in the cumulative amount of tightening discounted to the end of 2024 in the overnight index swap (OIS) curves of the major developed economies (Table 1). The moves were most evident in the US (32bps of hikes priced out), Canada (37bps) and Australia (37bps). Table 1Pricing Out Some Rate Hikes Because Of Omicron
Blame The Fed, Not Omicron, For More Volatile Markets
Blame The Fed, Not Omicron, For More Volatile Markets
Much is still unknown about the dangers of the Omicron variant. The admittedly very early data out of South Africa, however, indicates that there has not been a major surge in hospitalizations related to Omicron cases. A new COVID strain that proves to be more virulent, but that does not strain health care systems, should help allay investor concerns over a major economic hit from Omicron. This presents an opportunity to put on positions that will profit from a rebound in global bond yields led by higher US Treasury yields. The Fed The Omicron threat to date has not been enough to move the Fed off its plans to rein in the monetary accommodation put in place in 2020 to fight the pandemic. If Omicron is to have any impact on the US economy, it will do so at a time when the economy continues to grow well above trend. The November reading on the ISM Manufacturing survey showed strength in the overall index, with a stabilization of the New Orders/Inventory ratio that leads overall growth, and only a very modest reduction in the still-elevated Prices Paid and Supplier Deliveries indices (Chart 4). The Atlanta Fed’s GDPNow model is suggesting that US real GDP growth could come in at a whopping 9.7% in Q4. As further evidence that the US economy is growing at a pace well above trend, just look to labor market data. New US jobless claims are at the lowest level since 1969. The November US Payrolls report showed that the headline unemployment rate fell 0.4 percentage points on the month to 4.2% - within the range of full employment estimates of the FOMC - even with actual job growth falling short of consensus forecasts (Chart 5, top panel). Chart 4Nothing Bond-Bullish In US Manufacturing
Nothing Bond-Bullish In US Manufacturing
Nothing Bond-Bullish In US Manufacturing
The improving health of the labor market is being felt more broadly, with big declines seen in unemployment rates for minorities and less-educated Americans (second panel). That point is of critical importance to the Powell Fed that has emphasized reducing racial and educational gaps in US unemployment as part of reaching its goal of “maximum employment”. Chart 5Nothing Bond-Bullish In US Labor Markets
Nothing Bond-Bullish In US Labor Markets
Nothing Bond-Bullish In US Labor Markets
Tightening labor markets are also evident in accelerating wage momentum. Excluding the 2020 spike driven by labor force compositional effects related to COVID lockdowns, the year-over-year growth in average hourly earnings reached a 39-year high of 5.9% in November (third panel). The Fed now seems willing to finally confront high US inflation and strong economic growth with some tightening of monetary policy. Chart 6A Near-Term Break From Supply-Fueled Inflation?
A Near-Term Break From Supply-Fueled Inflation?
A Near-Term Break From Supply-Fueled Inflation?
Powell caused some investor agita last week when he indicated that the taper could end before mid-2022, the previous FOMC guidance, which would open the door for rate hikes. We see Powell’s comments as less about signaling an intensifying hawkishness and more about giving the Fed optionality on when to start lifting rates next year in the event the US economy continues to overheat. The Fed strongly believes that tapering must end before rate hikes can begin, so a more accelerated taper allows for an earlier liftoff date, if necessary. To that end, the supply fueled surge in inflation this year, which has lingered for far longer than the Fed anticipated, may be showing some signs of easing. Several indices of global shipping container prices are off the highs, while there is a reduced backlog of container ships off key US ports like Los Angeles. Overall commodity price momentum has peaked, in line with slower, but still strong, global industrial activity (Chart 6). An easing of supply-driven price pressures would be welcome by the FOMC. It would allow time to evaluate both the Omicron threat and evolving US labor market dynamics, instead of being forced to fight a rearguard action against accelerating inflation. However, a shift away from goods/commodity inflation to more domestically driven inflation would not lessen the need for the Fed to begin lifting rates next year – in fact, it could even strengthen the case for the Fed to hike rates faster, and by more, than currently discounted in markets. Importantly, forward looking indicators are still pointing to solid US growth next year (Chart 7): The Conference Board’s leading economic indicator continues to grow at a pace signaling above-trend growth US financial conditions remain highly accommodative even with the recent market turbulence The New York Fed’s yield curve based recession probability model is indicating that the spread between the 10-year US Treasury yield and the 3-month US Treasury bill rate, currently 138bps, is consistent with only a 9% chance of a US recession over the next year (bottom panel) We continue to recommend a below-benchmark duration stance within US fixed income portfolios, with a yield target on the 10-year benchmark US Treasury yield of 2-2.25% to be reached by the end of 2022. We also continue to recommend positioning in Treasury curve steepening trades. This is admittedly a counter-intuitive suggestion given that the Fed is moving towards a rate hiking cycle, but we see too much flattening priced into the Treasury forward curve over the next year (Chart 8). Chart 7A Positive Message From US Leading Growth Indicators
A Positive Message From US Leading Growth Indicators
A Positive Message From US Leading Growth Indicators
Chart 8Our Favorite Bearish US Rates Trades
Our Favorite Bearish US Rates Trades
Our Favorite Bearish US Rates Trades
For global bond investors, our favorite trade that will benefit from higher US bond yields next year is to position for a wider 10-year US Treasury-German Bund spread (bottom panel). We expect the ECB to avoid any rate increases until at least mid-2023, well after the Fed has begun to tighten. Forward curves in the US and Germany currently discount a relatively stable Treasury-Bund spread in 2022, thus there is no negative carry incurred by positioning for a wider spread. Bottom Line: Omicron has thrown a growth scare into markets, but the bigger concern is that the Fed is belated starting to play catch up to high inflation and low unemployment. Fade the Omicron bond rally, and position for higher US Treasury yields over the next year. New Zealand: How Much Further Can The Bond Selloff Go? Chart 9NZ Sovereign Underperformance Has Been Driven By RBNZ Hawkishness
NZ Sovereign Underperformance Has Been Driven By RBNZ Hawkishness
NZ Sovereign Underperformance Has Been Driven By RBNZ Hawkishness
Over the past year, New Zealand bonds have sold off much faster than developed market peers (Chart 9). Markets correctly recognized the Reserve Bank Of New Zealand (RBNZ) as a central bank that would move more aggressively to tamp down on inflation and manage the financial stability and political risks arising from soaring house prices. The RBNZ has already delivered back-to-back hikes at its October and November meetings, after its plans to hike at the August meeting were thrown off by the Delta variant. Markets are now pricing in a further 172bps of tightening over the coming year, having largely faded any downside growth risk from the Omicron variant. Expectations of continued tightening have been buoyed by the response of New Zealand policymakers, who are largely looking past the Omicron variant. Restrictions have already begun to ease, with the country having entered its “Traffic Light” COVID-19 Protection Framework. The new variant is also unlikely to affect the RBNZ’s tightening path, with Chief Economist Yuong Ha stating that, given the lifting of restrictions, the RBNZ would have raised rates even if Omicron had become known before its November 24 meeting. Given the bond-bearish backdrop, New Zealand government bonds have underperformed substantially this year. On a relative hedged and duration-matched basis, New Zealand sovereigns have underperformed by -6.6% year-to-date with -4.0 percentage points of that underperformance coming after July 21 when we formally moved to an underweight stance on New Zealand debt within global government bond portfolios (Chart 9, bottom panel). However, with monetary policy entering a new phase, led by an increasingly hawkish Fed, we believe it is appropriate to re-assess our New Zealand call and judge whether this underperformance can continue into 2022. The growth picture is broadly supportive of the RBNZ’s stated policy path. Real GDP as of Q2 was above its pre-Covid trend and 2.6% over the RBNZ’s own estimate of potential GDP, supported by an easing of travel restrictions and strong consumer spending (Chart 10). On a forward-looking basis, however, the risk is now that the economy is running too hot, jeopardizing future growth. Consumer and business sentiment has been worsening as inflation expectations soar, with consumers fearing a hit to purchasing power and businesses concerned about the impact of rising input costs on profit margins. Household and business inflation fears also have a strong basis in the realized inflation data, which has soared to a 10-year high of 4.9% (Chart 11). More troublingly, underlying inflation measures such as the trimmed mean and core (excluding food and energy) are now at series highs of 4.8% and 4%, respectively, indicating that higher inflation could prove to be sticky. The RBNZ now sees headline inflation peaking at 5.7% in Q1/2022 before settling to 2% by the end of its forecast horizon in 2024. Chart 10The NZ Economy Is Overheating
The NZ Economy Is Overheating
The NZ Economy Is Overheating
Chart 11The RBNZ Will Welcome A Slight Growth Slowdown
The RBNZ Will Welcome A Slight Growth Slowdown
The RBNZ Will Welcome A Slight Growth Slowdown
The RBNZ clearly attributes higher inflation to an economy running above longer-term capacity rather than short-term supply factors. The Bank’s measure of the output gap is now at the most positive level since 2007, and survey measures of capacity utilization remain elevated. In contrast to the Fed, which is still nominally focused on maximum employment, the RBNZ actually believes that employment is above its maximum sustainable level, and sees a rising unemployment rate as necessary to ease capacity constraints. Given that the RBNZ is clearly comfortable with, and will likely welcome, a gradual rise in unemployment, it will take much more than a slight growth shock to deter the RBNZ from its tightening path. Chart 12Higher Rates Necessary To Stabilize The NZ Housing Market
Higher Rates Necessary To Stabilize The NZ Housing Market
Higher Rates Necessary To Stabilize The NZ Housing Market
The newest, and most politically potent, part of the RBNZ’s remit—house prices – has further supported a bias to tighten monetary policy. However, while still dramatically elevated, house price growth looks to have peaked (Chart 12). The central bank’s hawkish shift earlier in the year has made a clear impact, with house price growth peaking shortly after mortgage rates started picking up in April of this year. Overall household mortgage credit has also begun to decelerate, indicating that the passthrough from monetary policy to credit demand and housing via the mortgage rate is working as intended. However, there is likely further to go. The last time house price growth was somewhat stable around 6.6% in the 2012-2019 period, benchmark 5-year mortgage rates averaged 6.1%. Assuming the spread between the 5-year mortgage and policy rates remains around 4%, history indicates that we would need to see the policy rate rise to at least 2% to cool down the housing market. That 2% level is also the RBNZ’s mean estimate of a “neutral” cash rate—a level at which policy would be neither accommodative nor restrictive (Chart 13). Current market pricing is quite consistent with the RBNZ’s own projected path of rates as of the November meeting—both of which are set to exceed the neutral rate by the end of 2022. Historical experience from the pre-crisis period indicates that this is not uncommon, and that a bout of restrictive policy might be needed to cool down an overheating economy.
Chart 13
Indeed, if the RBNZ’s historical reaction to inflation is any guide, it seems likely that policymakers will want to push rates above inflation. The top two panels of Chart 14 show how anomalous deeply negative real policy rates are in New Zealand. Even if we make the case that developed market real rates are in a structural downtrend, as realized real rates have peaked out at successively lower levels with each tightening cycle, the current gap between the cash rate and core inflation seems obviously unsustainable and requires a tightening of policy. Chart 14NZ Real Rates Are Too Low
NZ Real Rates Are Too Low
NZ Real Rates Are Too Low
Chart 15Go Long The 10-Year NZ Government Bond/US Treasury Spread
Go Long The 10-Year NZ Government Bond/US Treasury Spread
Go Long The 10-Year NZ Government Bond/US Treasury Spread
Another way to think about where policy rates are in relation to a “neutral” level is to look at the yield curve (Chart 14, bottom panel). Typically, the yield curve inverts when markets judge that monetary policy is too restrictive and that short rates are too high relative to a long-run average. However, the New Zealand government bond curve has historically remained inverted for extended periods of time, troughing at around -100bps. This again indicates that the RBNZ is comfortable raising rates above neutral and keeping policy restrictive when needed. Putting together the four factors we have looked at—growth, inflation, asset prices, and the RBNZ’s reaction function—it looks likely that the RBNZ will continue along the tightening path it has set out and chances of any dovish surprise seem slim. At the same time, markets are priced to perfection in terms of the pace and amount of tightening discounted. For New Zealand sovereigns to continue underperforming, however, we will need to see markets price in, on the margin, even more tightening from the RBNZ relative to its peers. With the Fed and other central banks having become more focused on responding to US inflation dynamics, bond-bearish upside shocks to market rate expectations will increasingly come from outside New Zealand. At the same time, in the event of a negative global growth shock, perhaps relating to COVID-19, there is relatively more room for hikes to be priced out in New Zealand. Given our view that bond and rates markets have appropriately priced in the extent of the RBNZ’s likely tightening cycle, we are upgrading New Zealand sovereign debt to neutral, taking profits on our current underweight stance. While we do not include New Zealand debt in our model bond portfolio, we are expressing our view via a new tactical cross-country spread trade: long New Zealand 10-Year government bonds vs. US 10-Year Treasuries (Chart 15). Forwards are currently pricing in a flat spread between the two countries, meaning that any future spread tightening will put our trade in the black. Given that there is more space for markets to price in increased hawkishness from the Fed, we believe that spread compression is likely. We are implementing this trade by going long New Zealand cash bonds and shorting 10-year US Treasury futures. Details can be found on Page 18. Bottom Line: Underlying growth and inflation fundamentals, soaring house prices, and the central bank’s historical reaction function indicate that the Reserve Bank of New Zealand will lift the cash rate to 2% by the end of 2022. However, markets are already priced for this, leaving little room for New Zealand debt to continue underperforming on a relative basis. We are upgrading New Zealand sovereigns to neutral and initiating a long NZ/short US 10-year spread trade. Robert Robis, CFA Chief Fixed Income Strategist rrobis@bcaresearch.com Shakti Sharma Senior Analyst ShaktiS@bcaresearch.com GFIS Model Bond Portfolio Recommended Positioning Active Duration Contribution: GFIS Recommended Portfolio Vs. Custom Performance Benchmark
Image
The GFIS Recommended Portfolio Vs. The Custom Benchmark Index Global Fixed Income - Strategic Recommendations* Duration Regional Allocation Spread Product Tactical Overlay Trades
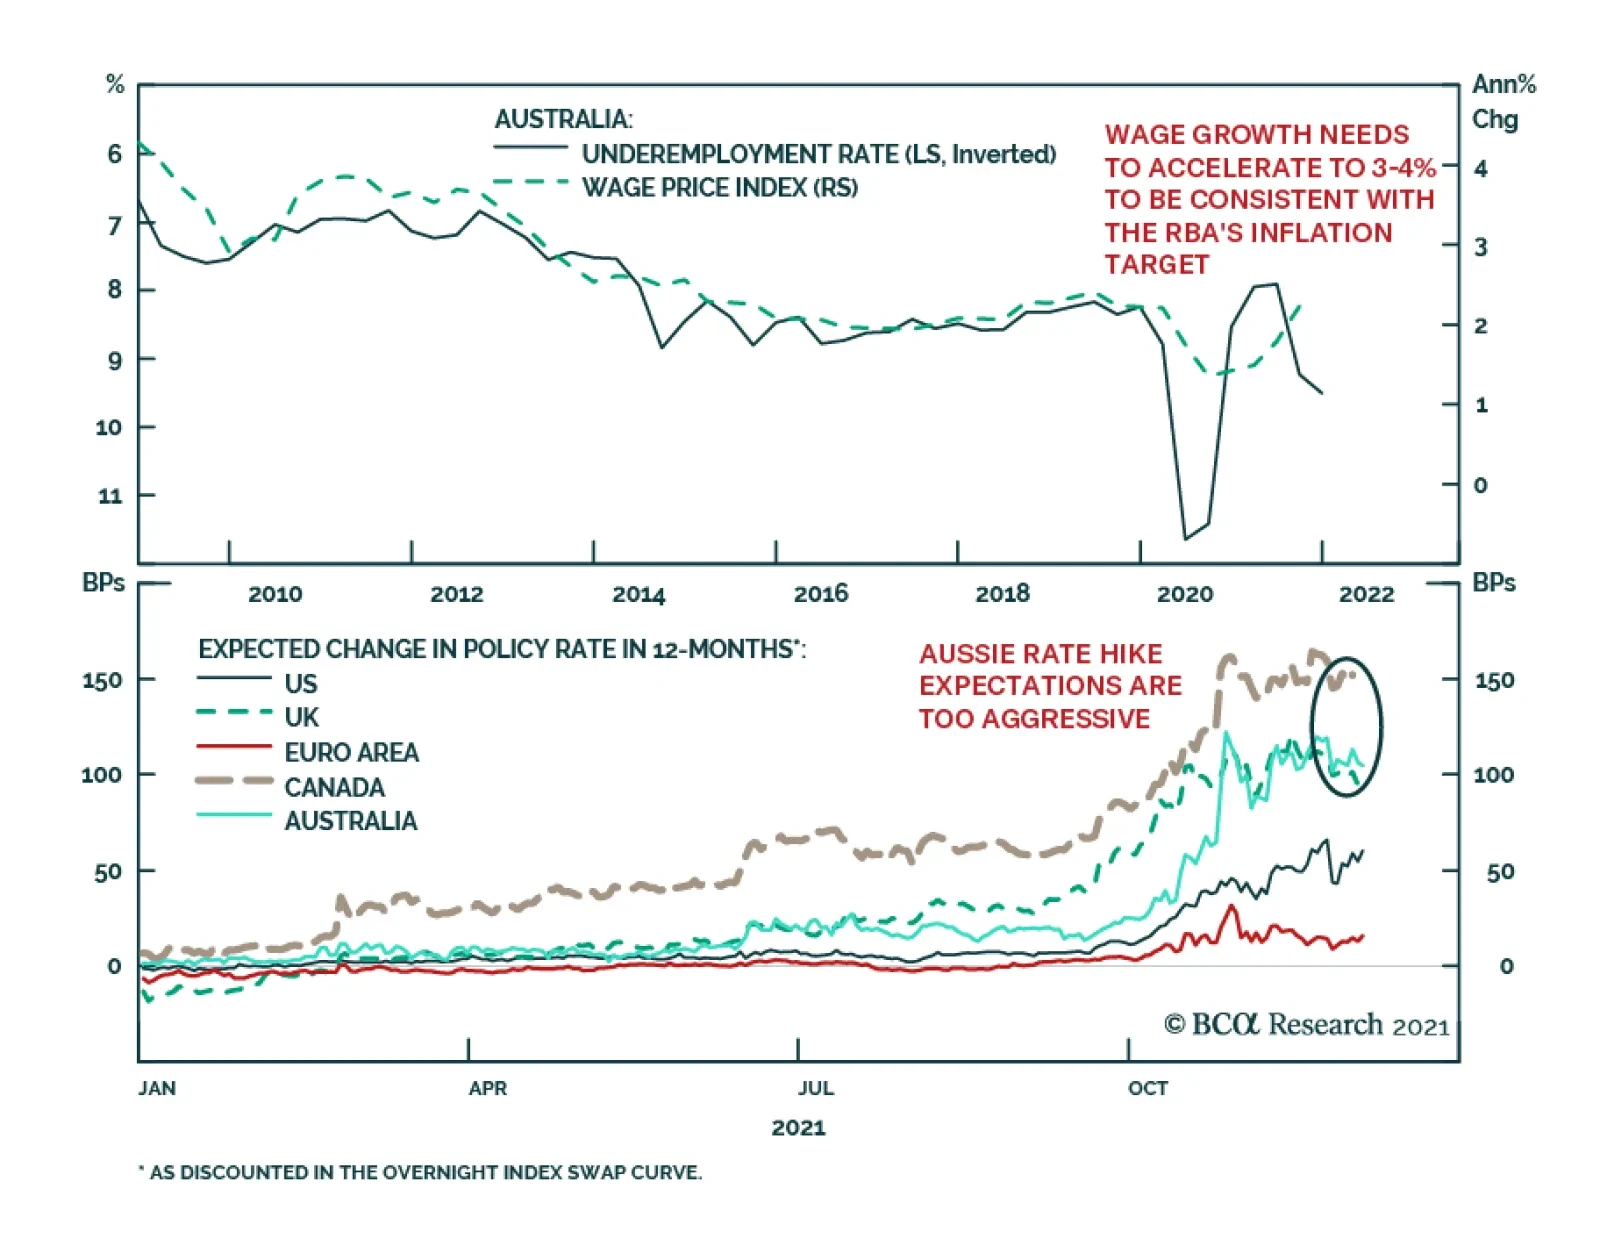
The RBA kept monetary policy unchanged at its Tuesday meeting. Governor Philip Lowe sounded cautiously optimistic in his policy statement. He noted that the Australian economy is on track towards recovery following the Delta-induced setback and that although…
Highlights Chart 1Curve Flattening Is Overdone
Curve Flattening Is Overdone
Curve Flattening Is Overdone
Fed Chair Jay Powell made big news last month. During Senate testimony, Powell not only signaled that the Fed is likely to accelerate the pace of asset purchase tapering when it meets in December, he also suggested that the Fed won’t necessarily wait until “maximum employment” is achieved before lifting rates. Powell’s comments suggest that the first Fed rate hike could come as early as June 2022 and as late as December 2022, and the exact timing will depend on how inflation and inflation expectations move during the next few months. The front-end of the Treasury curve is fairly priced for either scenario. The 2-year Treasury yield is currently 0.60%. If we assume that the Fed eventually lifts rates at a pace of 100 bps per year until reaching a 2.08% terminal rate, we calculate a fair value range for the 2-year yield of 0.39% to 0.74%, depending on whether Fed liftoff occurs in June or December. In contrast, the same assumptions give us a fair value range of 1.69% to 1.79% for the 10-year Treasury yield, well above its current level of 1.40% (Chart 1). The investment implications are clear. Investors should maintain below-benchmark portfolio duration and put on Treasury curve steepeners, overweight the 2-year note and underweight the 10-year. Feature Table 1Recommended Portfolio Specification
Powell’s Pivot
Powell’s Pivot
Table 2Fixed Income Sector Performance
Powell’s Pivot
Powell’s Pivot
Investment Grade: Neutral Chart 2Investment Grade Market Overview
Investment Grade Market Overview
Investment Grade Market Overview
Investment grade corporate bonds underperformed the duration-equivalent Treasury index by 89 basis points in November, dragging year-to-date excess returns down to +102 bps. The index option-adjusted spread widened 12 bps on the month and our quality-adjusted 12-month breakeven spread is now at its 7th percentile since 1995. This indicates that valuations remain stretched even after the recent widening (Chart 2). The back-up in spreads was driven by the combination of the Fed’s shift toward a more hawkish policy stance and concerns about the new omicron COVID variant. This led to a large flattening of the yield curve in addition to wider corporate bond spreads. The slope of the yield curve is a critical indicator for our corporate bond call. We are very comfortable owning corporate bonds when the 3-year/10-year Treasury slope is above 50 bps, but our work suggests that returns to credit risk take a significant step down once the slope flattens into a range of 0 – 50 bps.1 The 3-year/10-year Treasury slope currently sits at 49 bps, just below our 50 bps threshold. However, our range of fair value estimates suggests that the 3/10 slope should be between 63 bps and 86 bps today, and that it should only break below 50 bps between March and September of next year (bottom panel). All in all, we expect the pace of Treasury curve flattening to abate during the next couple of months and this will allow spreads to tighten back to their recent lows. We will turn more cyclically defensive on corporate bonds next year when the break below 50 bps in the 3/10 slope is confirmed by our fair value readings. Table 3ACorporate Sector Relative Valuation And Recommended Allocation*
Powell’s Pivot
Powell’s Pivot
Chart
High-Yield: Overweight Chart 3High-Yield Market Overview
High-Yield Market Overview
High-Yield Market Overview
High-Yield underperformed the duration-equivalent Treasury index by 121 basis points in November, dragging year-to-date excess returns down to +444 bps. The index option-adjusted spread widened 50 bps on the month, leading to a significant rise in the spread-implied default rate. The spread-implied default rate is the 12-month default rate that is priced into the junk index, assuming a 40% recovery rate on defaulted debt and an excess spread of 100 bps. At present, the spread-implied default rate sits at 3.8% (Chart 3). For context, defaults have come in at an annualized rate of 1.6% so far this year and we showed in a recent report that corporate balance sheets are in excellent shape.2 Specifically, the ratio of total debt to net worth for the nonfinancial corporate sector has fallen to 41%, the lowest ratio since 2010 (bottom panel). We conclude that the default rate will be comfortably below 3.8% during the next 12 months, allowing high-yield bonds to outperform duration-matched Treasuries. We recommend that investors favor high-yield over investment grade corporate bonds, and we expect that last month’s spread widening will reverse in relatively short order. However, as noted on page 3, we will turn more defensive on credit risk (including high-yield bonds) next year once we are confident that the 3/10 Treasury curve has sustainably moved into a flatter regime (0 – 50 bps). MBS: Underweight Chart 4MBS Market Overview
MBS Market Overview
MBS Market Overview
Mortgage-Backed Securities underperformed the duration-equivalent Treasury index by 46 basis points in November, dragging year-to-date excess returns down to -90 bps. The zero-volatility spread for conventional 30-year agency MBS widened 13 bps on the month, driven by an 11 bps widening of the option-adjusted spread and a 2 bps increase in the compensation for prepayment risk (option cost) (Chart 4). We wrote in last week’s report that MBS’ recent poor performance is attributable to an option cost that is too low relative to the pace of mortgage refinancings, noting that the MBA Refinance Index has been slow to fall this year despite the back-up in yields.3 The robust pace of home price appreciation has been an important factor boosting refis, as homeowners have been increasingly incentivized to tap the equity in their homes. With no indication that cash-out refi activity is about to slow, we expect refi activity will remain sticky going forward. This will put upward pressure on MBS spreads. We recommend adopting an up-in-coupon bias within an overall underweight allocation to MBS. Higher coupon MBS exhibit more attractive option-adjusted spreads and higher convexity than lower coupon MBS. This makes high-coupon MBS (4%, 4.5%) more likely to outperform low-coupon MBS (2%, 2.5%, 3%) in an environment where bond yields are flat or rising (bottom panel). Government-Related: Neutral Chart 5Government-Related Market Overview
Government-Related Market Overview
Government-Related Market Overview
The Government-Related index underperformed the duration-neutral Treasury index by 35 basis points in November, dragging year-to-date excess returns down to +33 bps. Sovereign debt underperformed duration-equivalent Treasuries by 157 basis points in November, dragging year-to-date excess returns down to -220 bps. Foreign Agencies underperformed the Treasury benchmark by 9 bps on the month, dragging year-to-date excess returns down to +36 bps. Local Authority bonds underperformed by 16 bps in November, dragging year-to-date excess returns down to +406 bps. Supranationals outperformed by 2 bps, bringing year-to-date excess returns up to +18 bps. The investment grade Emerging Market Sovereign bond index outperformed the equivalent-duration US corporate bond index by 42 bps in November. The Emerging Market Corporate & Quasi-Sovereign index underperformed duration-matched US corporates by 16 bps (Chart 5). Both EM indexes continue to offer significant yield advantages versus US corporate bonds with the same credit rating and duration. We continue to recommend overweighting USD-denominated EM sovereigns and corporates versus investment grade US corporates with the same credit rating and duration.4 Within EM sovereigns, attractive countries include: Russia, Mexico, Indonesia, Saudi Arabia, UAE and Qatar. Municipal Bonds: Maximum Overweight Chart 6Municipal Market Overview
Municipal Market Overview
Municipal Market Overview
Municipal bonds outperformed the duration-equivalent Treasury index by 29 basis points in November, bringing year-to-date excess returns up to +371 bps (before adjusting for the tax advantage). The economic and policy back-drop remains favorable for municipal bond performance. Trailing 4-quarter net state & local government savings are incredibly high (Chart 6) and 2021’s federal spending splurge will support state & local government coffers for some time. A recent report showed that the average duration of municipal bond indexes has fallen significantly during the past few decades, a trend that has implications for how we should perceive municipal bond valuation.5 Specifically, the trend makes municipal bonds more attractive relative to both Treasury securities and investment grade corporates. Long-maturity bonds are especially compelling. We calculate that 12-17 year maturity Revenue Munis offer a breakeven tax rate of 14% relative to credit rating and duration matched US corporate bonds. 12-17 year General Obligation Munis offer a breakeven tax rate of 22% versus corporates (panel 2). High-yield muni spreads are reasonably attractive compared to high-yield corporates (panel 4), but we recommend only a neutral allocation to high-yield munis versus high-yield corporates. The deep negative convexity of high-yield munis makes them susceptible to extension risk if bond yields rise. Treasury Curve: Buy 2-Year Bullet Versus Cash/10 Barbell Chart 7Treasury Yield Curve Overview
Treasury Yield Curve Overview
Treasury Yield Curve Overview
The Treasury curve flattened dramatically in November. Increasingly hawkish rhetoric from the Fed pushed front-end yields higher as news about the omicron COVID strain pressured long-dated yields lower. The 2-year/10-year Treasury slope flattened 16 bps on the month, it currently sits at 75 bps. The 5-year/30-year Treasury slope flattened 11 bps on the month, it currently sits at 56 bps. As noted on the front page, long-dated Treasury yields have fallen to well below levels consistent with a reasonable Fed rate hike cycle. This drop in long-maturity yields has pushed the 2/5/10 butterfly spread to extremely high levels, both in absolute terms and relative to our model’s fair value (Chart 7). This signals that 2/10 yield curve steepeners are incredibly cheap. Indeed, we observe that the 2/10 slope has already flattened to below the levels that were witnessed on the last two Fed liftoff dates in 2015 and 2004 (panel 4). A trade long the 5-year bullet and short a duration-matched 2/10 barbell does indeed look attractive in this environment. However, we note that the 2/5 Treasury slope has also flattened to below levels seen on the prior two Fed liftoff dates (bottom panel). In other words, the 2/5 slope also has room to steepen during the next 6-12 months, and we prefer to focus our long positions on the 2-year Treasury note rather than the 5-year. This leads us to recommend a position long the 2-year note and short a duration-matched barbell consisting of cash and the 10-year note. We also advise investors to own a position long the 20-year bond versus a duration-matched barbell consisting of the 10-year note and 30-year bond. This latter position offers a very attractive duration-neutral yield advantage of 24 bps. TIPS: Neutral Chart 8TIPS Market Overview
TIPS Market Overview
TIPS Market Overview
TIPS performed in line with the duration-equivalent nominal Treasury index in November, leaving year-to-date excess returns unchanged at +739 bps. The 10-year TIPS breakeven inflation rate fell 8 bps on the month while the 2-year TIPS breakeven inflation rate rose 17 bps. The 10-year and 2-year rates currently sit at 2.44% and 3.24%, respectively. The Fed’s preferred 5-year/5-year forward TIPS breakeven inflation rate rose 8 bps on the month. It currently sits at 2.16%, below the Fed’s 2.3% - 2.5% target range. Our valuation indicator shows that 10-year TIPS are slightly expensive compared to 10-year nominal Treasuries (Chart 8), and we retain a neutral allocation to TIPS versus nominals at the long-end of the curve. We acknowledge the risk that a prolonged period of high inflation could lead to a break-out in long-dated TIPS breakevens, but this now looks less likely given the Fed’s increasing hawkishness. We see better trading opportunities at the front-end of the TIPS curve, where the 2-year TIPS breakeven inflation rate remains well above the Fed’s target range (panel 4). Short-maturity breakevens are more sensitive to swings in CPI than those at the long-end. Therefore, the 2-year TIPS breakeven inflation rate has considerable downside during the next 6-12 months, assuming inflation moderates as we expect it will. We recommend an underweight allocation to TIPS versus nominals at the front-end of the curve. Given our view that CPI inflation will be lower in 6-12 months, we recommend shorting 2-year TIPS outright, positioning in 2/10 TIPS breakeven inflation curve steepeners (bottom panel) and 2/10 TIPS (real) yield curve flatteners. All three trades will profit from falling short-maturity inflation expectations. ABS: Overweight Chart 9ABS Market Overview
ABS Market Overview
ABS Market Overview
Asset-Backed Securities underperformed the duration-equivalent Treasury index by 9 basis points in November, dragging year-to-date excess returns down to +26 bps. Aaa-rated ABS underperformed by 11 bps on the month, dragging year-to-date excess returns down to +13 bps. Non-Aaa ABS performed in line with Treasuries in November, keeping year-to-date excess returns steady at +93 bps. During the past two years, substantial federal government support for household incomes has caused US households to build up an extremely large buffer of excess savings. During this period, many households have used their windfalls to pay down consumer debt and credit card debt levels have fallen to well below pre-COVID levels (Chart 9). The result is that the collateral quality backing consumer ABS is exceptionally high. Investors should remain overweight consumer ABS and should take advantage of the high quality of household balance sheets by moving down the quality spectrum, favoring non-Aaa rated securities over Aaa-rated ones. Non-Agency CMBS: Neutral Chart 10CMBS Market Overview
CMBS Market Overview
CMBS Market Overview
Non-Agency Commercial Mortgage-Backed Securities underperformed the duration-equivalent Treasury index by 40 basis points in November, dragging year-to-date excess returns down to +155 bps. Aaa Non-Agency CMBS underperformed Treasuries by 30 bps in November, dragging year-to-date excess returns down to +63 bps. Non-Aaa Non-Agency CMBS underperformed Treasuries by 70 bps, dragging year-to-date excess returns down to +469 bps (Chart 10). Though returns have been strong this year and spreads remain attractive, particularly for lower-rated CMBS, we continue to recommend only a neutral allocation to the sector because of the structurally challenging environment for commercial real estate. Agency CMBS: Overweight Agency CMBS underperformed the duration-equivalent Treasury index by 47 basis points in November, dragging year-to-date excess returns down to +58 bps. The average index option-adjusted spread widened 9 bps on the month. It currently sits at 40 bps (bottom panel). Though Agency CMBS spreads have recovered to well below their pre-COVID levels, they still look attractive compared to other similarly risky spread products. Stay overweight. Ryan Swift US Bond Strategist rswift@bcaresearch.com Appendix A: Butterfly Strategy Valuations The following tables present the current read-outs from our butterfly spread models. We use these models to identify opportunities to take duration-neutral positions across the Treasury curve. The following two Special Reports explain the models in more detail: US Bond Strategy Special Report, “Bullets, Barbells And Butterflies”, dated July 25, 2017, available at usbs.bcaresearch.com US Bond Strategy Special Report, “More Bullets, Barbells And Butterflies”, dated May 15, 2018, available at usbs.bcaresearch.com Table 4 shows the raw residuals from each model. A positive value indicates that the bullet is cheap relative to the duration-matched barbell. A negative value indicates that the barbell is cheap relative to the bullet. Table 5 scales the raw residuals in Table 4 by their historical means and standard deviations. This facilitates comparison between the different butterfly spreads. Table 6 flips the models on their heads. It shows the change in the slope between the two barbell maturities that must be realized during the next six months to make returns between the bullet and barbell equal. For example, a reading of -62 bps in the 5 over 2/10 cell means that we would expect the 5-year to outperform the 2/10 if the 2/10 slope flattens by less than 62 bps during the next six months. Otherwise, we would expect the 2/10 barbell to outperform the 5-year bullet. Table 4Butterfly Strategy Valuation: Raw Residuals In Basis Points (As Of November 30th, 2021)
Powell’s Pivot
Powell’s Pivot
Table 5Butterfly Strategy Valuation: Standardized Residuals (As Of November 30th, 2021)
Powell’s Pivot
Powell’s Pivot
Table 6Discounted Slope Change During Next 6 Months (BPs)
Powell’s Pivot
Powell’s Pivot
Appendix B: Excess Return Bond Map The Excess Return Bond Map is used to assess the relative risk/reward trade-off between different sectors of the US bond market. It is a purely computational exercise and does not impose any macroeconomic view. The Map’s vertical axis shows 12-month expected excess returns. These are proxied by each sector’s option-adjusted spread. Sectors plotting further toward the top of the Map have higher expected returns and vice-versa. Our novel risk measure called the “Risk Of Losing 100 bps” is shown on the Map’s horizontal axis. To calculate it, we first compute the spread widening required on a 12-month horizon for each sector to lose 100 bps or more relative to a duration-matched position in Treasury securities. Then, we divide that amount of spread widening by each sector’s historical spread volatility. The end result is the number of standard deviations of 12-month spread widening required for each sector to lose 100 bps or more versus a position in Treasuries. Lower risk sectors plot further to the right of the Map, and higher risk sectors plot further to the left.
Chart 11
Footnotes 1 Please see US Bond Strategy Weekly Report, “Expected Returns In Corporate Bonds”, dated September 21, 2021. 2 Please see US Bond Strategy Weekly Report, “The Fed’s Inflation Problem”, dated November 23, 2021. 3 Please see US Bond Strategy Weekly Report, “The Omicron Impact”, dated November 30, 2021. 4 Please see US Bond Strategy Weekly Report, “Damage Assessment”, dated September 28, 2021. 5 Please see US Bond Strategy Weekly Report, “The Best & Worst Spots On The Yield Curve”, dated October 26, 2021.
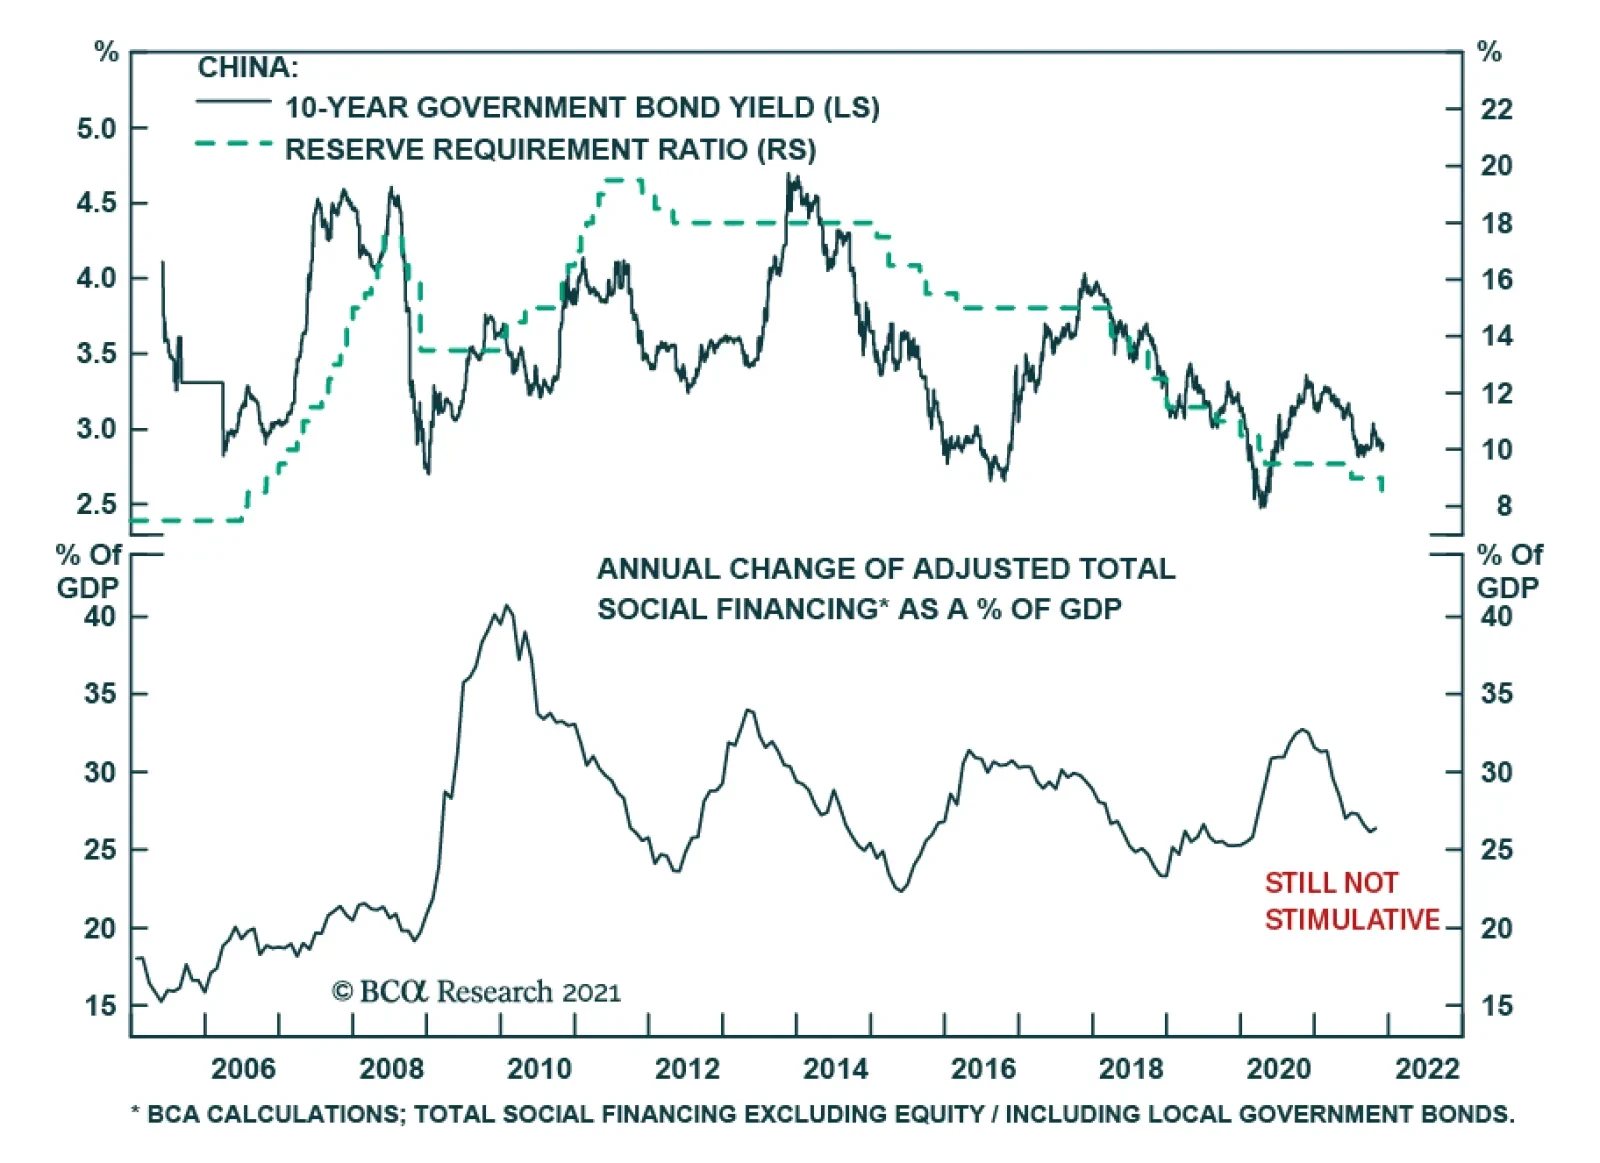
The PBoC’s decision to cut the reserve requirement ratio by 50 bps is unlikely to be a game changer for the Chinese economy. The more important drivers of China’s business cycle and financial markets are credit growth and investment. Both these variables…
Highlights Economy: Chair Powell retired the term “transitory” last week, signaling that the Fed may take a harder line on inflation in the coming year: The Fed coined the transitory term to describe the current inflation backdrop, and publicly throwing in the towel on the idea allows the FOMC to open the door to a more hawkish approach in 2022. Markets: Financial markets continued their post-Thanksgiving gyrations, but the Omicron variant was a more meaningful driver than Fedspeak: Powell’s hints simply brought the Fed’s liftoff date closer to the markets' estimate. Omicron was the main force behind the fall in interest rates, as evidenced by the swoon in oil and pandemic-exposed equities. Strategy: Don’t fight the crowd in the near term, but position for a higher-than-expected terminal rate down the road: We expect rates will remain well behaved in 2022, but we do not share the seeming market conviction that rates will be permanently lower. Feature A US investor who called it a week the day before Thanksgiving may think twice about leaving his/her desk for even a day going forward. Stocks and other risk assets were hammered in the abbreviated Black Friday session on concerns about Omicron, COVID’s latest variant. The S&P 500 recovered much of its losses last Monday, only to be jolted again on Tuesday, as Fed Chair Powell testified before a Senate committee. Stocks duly surged on Wednesday, leaving the S&P off just over 1% from its pre-Thanksgiving close, until news that the Omicron variant had been discovered in California sparked a sharp intra-day reversal. They then came back very strong on Thursday – lather, rinse, repeat. The action was a reminder that volatility often picks up as a perceived inflection point nears. The VIX, which measures implied volatility on S&P 500 index options, spent the week ensconced above the 20 level that has mostly contained it since the financial crisis faded and effective COVID vaccines became widely available (Chart 1). Despite the recent gyrations, our base-case cyclical outlook, as described in last week’s report, remains in place. We expect US growth will come in well above trend for this quarter and all of 2022, monetary policy settings will likely remain easy for another two years, and the accumulated monetary and fiscal stimulus that’s already been injected into the economy will keep the expansion going at least through 2023. Chart 1An Eventful Stretch
An Eventful Stretch
An Eventful Stretch
What The Chair Said Fed Chair Powell testified before the Senate and the House Tuesday and Wednesday last week, respectively. His comments on the pace of tapering, the economy’s progress in meeting the Fed’s inflation criteria for hiking rates, the way inflation might thwart employment gains and the word "transitory" captured the attention of investors and the financial media. On tapering: “At this point, the economy is very strong, and inflationary pressures are high. It is therefore appropriate in my view to consider wrapping up the taper of our asset purchases, which we … announced at our November meeting, perhaps a few months sooner.” On the inflation criteria for hiking rates: “The test that we’ve articulated clearly has been met [.] … Inflation has run well above 2% for long enough now [given recent data releases].” On inflation as a threat to full employment: “What I am taking on board is it is going to take longer to get labor force participation back. … That means to get back to the kind of great labor market we had before the pandemic, we’re going to need a long expansion. To get that we’re going to need price stability, and in a sense, the risk of persistent high inflation is also a major risk to getting back to such a labor market.” On “transitory” inflation: Though some people interpreted it as short-lived, we used “transitory” to “mean that it won’t leave a permanent mark in the form of higher inflation. I think it’s probably a good time to retire that word and try to explain more clearly what we mean.” How Powell’s Comments Might Shift Monetary Policy Table 1The Liftoff Checklist
Wiggle Room
Wiggle Room
The taper timetable will be sped up. It seems clear that the FOMC will vote to accelerate the taper at its meeting ending December 15th. Given how carefully the Fed has telegraphed its asset purchase actions, Powell would not have raised the issue unless it were a done deal. Instead of ending in June upon the purchase of an additional $420 billion of Treasury and agency securities, as per the November FOMC meeting's guidance, this round of QE will end sometime sooner after buying somewhat less. While we do not think that the parameters of the taper matter all that much in themselves, Powell has stated that the FOMC will not begin hiking rates until it has stopped purchasing securities and accelerating the tapering pace will afford it the flexibility to bring the liftoff date forward if it so chooses. Chart 2Hikes May Not Wait For Full Employment
Hikes May Not Wait For Full Employment
Hikes May Not Wait For Full Employment
The economic prerequisites for hiking rates are closer to being met. Our US Bond Strategy service has maintained a checklist of the three criteria the FOMC laid out as preconditions for hiking rates (Table 1). With consumer prices rising by more than the 2% target for several months, our bond colleagues checked the inflation boxes a while ago and noted that the full employment1 criterion would become the swing factor for rate hikes. Per the FOMC’s Summary of Economic Projections, it has been reasonable to assume that full employment would entail an unemployment rate at or below 4% (Chart 2, top panel), with the prime-age participation rate near its pre-pandemic level (Chart 2, middle panel), even if overall participation continues to lag (Chart 2, bottom panel). Powell’s Senate testimony indicated that the criterion has been relaxed, as his comments calling out too-high inflation as a threat to the labor market countered the Fed’s previously firm resolve to let the economy run hot until the economy achieved maximum employment. The bottom line is that Powell’s testimony has given the Fed some flexibility to raise rates sooner than the second half of next year if it sees fit. As Cleveland Fed president Loretta Mester, a 2022 FOMC voter, said after Powell wrapped up his appearances on Capitol Hill, “Making the taper faster is definitely buying insurance and optionality so that if inflation doesn’t move back down significantly next year we’re in a position to be able to hike if we have to. Right now, with the inflation data the way it is and with the job market as strong as it is, I do think we have to be in a position that if we need to raise rates a couple times next year, we’re able to do that.” The Fixed Income Market Reaction Chart 3What A Difference A Week Makes
What A Difference A Week Makes
What A Difference A Week Makes
Ahead of Powell’s testimony, the overnight index swap curve took out almost an entire hike for the next twelve months, falling from 66 basis points ("bps") (two hikes and a 64% chance of a third) on Thanksgiving to 43 bps on Monday (one hike and a 72% chance of a second). The same went for the next twenty-four months, which fell from 140 bps to 117 bps, or five hikes and a 60% chance of a sixth to four hikes and a 68% chance of a fifth by Thanksgiving 2023. Rate hike odds regained some ground on Powell’s remarks, though the ultimate rebound was half-hearted – at press time, the probability of a third hike in the next twelve months stood at just 8% (Chart 3, top panel); only two hikes were priced in for the following twelve months, with an 80% chance of a third hike (Chart 3, middle panel); and the chances of getting the fed funds rate above 1.5% by November 2024 were judged to be slim (Chart 3, bottom panel). How can it be that a hawkish shift in Fed rhetoric would coincide with a decline in fed funds rate expectations? The bulk of the decline resulted from the emergence of the Omicron variant and the toll it might take on economic activity. If Omicron fears prove to be overstated, fed funds rate expectations likely will as well, but as we showed last week, market terminal rate expectations were in line with the FOMC’s guidance – they just foresaw a sooner liftoff date. Powell’s comments and the increased tapering pace suggest that the Fed’s expectations are moving closer to market expectations. The other aspect is the fact that markets were on board with the transitory inflation narrative. Sharply downward sloping inflation expectations curves indicated that fixed income markets agreed that high near-term inflation would not leave a lasting mark on longer-run inflation. Since Thanksgiving, the curves derived from TIPS (Chart 4) and CPI swap prices (Chart 5) have put a new spin on Operation Twist, with the front end shifting in while the back end has stood pat. Omicron aside, if retiring the transitory term means the Fed will be more vigilant about upward inflation pressures, it increases the probability they will turn out to be transitory, as the Fed will give them less of a chance to take root.
Chart 4
Chart 5
Investment Implications In our view, adaptive expectations will keep long-end interest rates on a fairly tight leash over the next year. It seems that investors are unable to shake what they perceive to be the central lesson of the post-crisis era: rates will be permanently lower. That view rests on a conviction that inflation is kaput and the widely shared sense that the Fed can’t hike rates beyond 2% because it would be: a) too disruptive for a fundamentally fragile economy, b) too disruptive for financial markets weaned on ZIRP, and/or c) too disruptive for a prodigally indebted federal government. We don’t think those views will hold up over the next few years – encouraging inflation would seem to be the easiest way to wriggle out from c) – but we do not advise challenging them head-on in the near term. We also push back – rhetorically for now – on the view that long maturity Treasury yields are low, and the yield curve has flattened, because the Fed is on track to make a policy mistake by unnecessarily tightening into a recession. Monetary policy affects the economy with long and variable lags – our rule of thumb is somewhere from six to twelve months – and if the neutral fed funds rate is north of 2% (an admittedly out-of-fashion view), it appears as if it will take at least two years to get there. Under our rule-of-thumb lag, then, the economy will be subject to a tailwind from monetary accommodation at least until the middle or end of 2024. Given the additional consumption support from households' remaining $2.2 trillion of pandemic excess savings, we are confident that a recession is not on the horizon. We are therefore staying the course, overweighting equities and high yield while underweighting Treasuries, and remaining vigilant for threats to our base-case macro backdrop of strong growth and easy monetary policy. Doug Peta, CFA Chief US Investment Strategist dougp@bcaresearch.com Footnotes 1 “Full employment” is a somewhat ambiguous concept that turns on estimates of the natural slack that results from structural frictions in the labor market, like geographic and skills mismatches.