Policy
BCA Research’s Foreign Exchange strategists maintain a bearish outlook for the US dollar. US growth momentum is starting to rotate away from the US to other economies. Meanwhile, central banks are beginning to shift towards policy normalization. Several DM…

Highlights Economy – The inflation question is unresolved, and it will remain that way for the rest of the year: August’s CPI report had something for everyone and ensured the debate will continue. Doves could celebrate the month-over-month decline while hawks could argue that upward inflation pressures are no longer a transitory phenomenon. Markets – Elevated valuations make equities vulnerable, but a little turmoil in China is not likely to trigger a de-rating wave: The demise of large Chinese property developer Evergrande may cause some upheaval in China but it is not likely to ruffle the S&P 500, corporate bonds or other US spread product. Strategy – Policymakers continue to hold the key. As long as the Fed is still easing, and households direct some of their excess savings to consumption, risk assets should outperform: We still think Goldilocks is far more likely that a too-cold or a too-hot outcome. Feature We continue to view the prospects for financial markets and the economy through a Goldilocks-and-the-two-tails lens, with the idea that equities and credit will thrive against a backdrop of supercharged growth and ongoing policy support (Figure 1). The Fed’s unusually pro-cyclical stance will prolong the macro sweet spot for risk assets and ensure positive excess returns provided growth doesn’t flop (the too-cold left tail), or the inflation genie doesn’t get out of the bottle (the too-hot right tail). Though both flanks pose a risk to our base-case Goldilocks scenario, we deem overheating to be the bigger concern. Unless a vaccine-resistant variant reestablishes COVID-19 as a mortal threat to the broad population, we think it is unlikely that growth will tumble below trend this year or next. Figure 1Goldilocks And The Two Tails
Watching Both Flanks
Watching Both Flanks
One does not need to be a sworn devotee of rugged individualism to harbor some misgivings about the magnitude and scope of the direct transfers to American households or the broader fiscal effort to combat the economic effects of the pandemic. Egged on by support amounting to 25% of a year’s output, it remains entirely possible that aggregate demand might overwhelm productive capacity. The emergence of rolling bottlenecks in the spaces that were most crimped by COVID has focused attention on the threat of overheating, but the more lasting risk emanates from spaces that cannot be dismissed as unduly influenced by the pandemic. We have been closely monitoring the path of consumer prices and will continue to do so, but the ultimate outcome remains unclear. Though a Goldilocks macro backdrop remains our base-case expectation, it is far from assured. In this week’s report, we consider three potential disruptions: too much inflation, a change in the Fed’s policy course and a credit shock from China. We do not think that any of the potential disruptions is likely to change the picture in a material way and we therefore reiterate our view that investors with a twelve-month timeframe ought to maintain at least an equal weight exposure to equities and credit in a multi-asset portfolio. Fitting The August CPI Tile Into The Inflation Mosaic The pace of consumer price increases cooled in August, according to the headline and core CPIs. Both measures came in below market expectations, and the leading month-over-month series (Chart 1, dashed line) decelerated more than their year-over-year counterparts (Chart 1, solid line). Although the data were encouraging on their face, the ongoing inflation debate is nowhere near resolved. COVID continues to play havoc with the spaces it impacted most heavily, defying simple interpretations of aggregate CPI data. Base effects have warped year-over-year data once the peak pandemic months of last spring and summer entered the equation. As category-by-category analyses of the April CPI release showed, the lion’s share of the aggregate core CPI increase was powered by new and used cars and a handful of badly disrupted services like air travel, car rental, lodging and in-person entertainment. Chart 1Inflation Seems To Have Peaked
Inflation Seems To Have Peaked
Inflation Seems To Have Peaked
Chart 2A Stunning Reversal On Used-Car Lots
A Stunning Reversal On Used-Car Lots
A Stunning Reversal On Used-Car Lots
The semiconductor-driven production squeeze pushed up new car prices and took used car prices along for the ride as consumers turned to them as a ready substitute. Used car prices then rose even more as rental car companies frantically reversed 2020’s culling of their fleets to meet revived 2021 demand (Chart 2). By July, however, several of those categories had come off the boil and began to make more modest contributions to month-over-month core CPI growth. In August, they turned into headwinds, limiting core CPI’s sequential gain to just 0.1%. While the core index grew at its slowest rate since February, the segments that weren’t as heavily affected by the pandemic – the gray portion of the stacked bars in Chart 3 – experienced their largest price increases of the year. Those core categories less sensitive to transitory pandemic factors have eased a bit on a year-over-year basis (Chart 4, bottom panel) but the leading month-on-month measure suggests they will turn higher going forward. Chart 3Passing The Baton
Watching Both Flanks
Watching Both Flanks
Shelter costs account for 41% of the core CPI basket and though spiking hotel rates (Chart 5, second panel) have made an outsized contribution to their bounce off the bottom (Chart 5, top panel), the much weightier owners’ equivalent rent and primary residence cost measures have begun to hook up (Chart 5, third panel). Series that impact the supply and demand balance for residences, like the prime-age employment-to-population ratio (Chart 5, fourth panel) and the National Multifamily Housing Council’s measures of apartment market activity (Chart 5, fifth panel), suggest that the key rent series will continue moving higher. Chart 4Transitory Factors Are Abating ...
Transitory Factors Are Abating ...
Transitory Factors Are Abating ...
Chart 5... But Rents Are Rising
... But Rents Are Rising
... But Rents Are Rising
The bottom line is that the August CPI report, like much of the economic data in this particularly uncertain time, offered evidence to support opposing interpretations. We will simply have to wait and see how the data evolve over the rest of the year to gain a good read on its future trajectory. We expect that inflation will continue to come down from its summer peak while remaining comfortably above the Fed’s effective 2.3-2.5% core CPI target. Such a move will underscore that its inflation criteria have been met and focus investor attention squarely on the labor market’s progress toward regaining full employment. Much Ado About Nothing The bond market has cottoned on to the fact that the labor market, not consumer price inflation, is the swing factor for monetary policy settings, and the 10-year Treasury note has essentially ignored the core CPI breakout (Chart 6). Equities have evinced little concern, reflecting the causal relationship we noted last week. High inflation by itself is not kryptonite for stocks; the restrictive monetary policy measures the Fed eventually imposes in response to high inflation are. Inflation’s market importance thus turns on the tipping point at which it heralds restrictive monetary policy. Chart 6Treasuries Are On Board With The Transitory View
Treasuries Are On Board With The Transitory View
Treasuries Are On Board With The Transitory View
A Fed that believes elevated inflation readings are transitory is a Fed that will wait to restrain the economy to contain them. A Fed that is determined to let the economy run hot so as to nurture broad-based strength in the labor market is a Fed with a less sensitive inflation reaction function than has prevailed since Paul Volcker’s tenure. The same goes for a Fed that has made no secret of its desire to reset inflation expectations higher. Putting it all together, the Fed appears determined to wait until it sees the whites of inflation’s eyes before it takes action that will undermine economic growth. Our view that the Fed’s inflation reaction function has become less sensitive is independent of the identity of the chair. The revised statement on longer-run goals and monetary policy strategy was issued by the entire FOMC, and investors should not be distracted by the quadrennial reappointment parlor game, which has settled on a contest between chair Powell and board member Brainard. Although Brainard has won progressives’ admiration for her advocacy of tighter bank supervision, policy would not be materially different under her stewardship than it would be under Jay Powell’s. Monetary policy will be accommodative for a long time regardless of who is chairing the FOMC on February 1st and the Biden administration’s nomination decision will not have lasting market implications. Could A Messy Evergrande Unwind Trip Up The US Bull? The financial press last week was filled with stories about the dire condition of Evergrande Property Group (Chart 7), one of China’s largest property developers. As noted in several of last week’s reports, Evergrande is the world’s most indebted developer and its leverage burden is not news to dollar bond investors, who have increasingly required outsized yields to lend to the company.1 All three major credit rating agencies have downgraded it to the equivalent of CC, reflecting their view that default is imminent. Though a technical default may be certain, per reports that Evergrande will fail to make scheduled interest and principal payments due this week, the ultimate ripple effects are unknown. As our Emerging Markets Strategy team has noted, a broad range of outcomes are possible. At the most benign end of the continuum, the event could mark a crescendo of concerns that have been weighing on sentiment and activity, and trigger policy stimulus that produces economic and market inflections. At the other end, Evergrande could intensify the existing credit crunch, sparking a wave of self-reinforcing defaults and bankruptcies, culminating in a systemic event on the order of Lehman Brothers’ bankruptcy. Absent government intervention, the defaults will be messy. Most of the company’s assets are in the form of unfinished properties that will require additional capital and know-how before they can be monetized. Even its portfolios of completed properties may not be easy to sell in a residential market that was already slowing (Chart 8). The pall its troubles have cast over the property market will make things worse by prodding other liquidity-constrained developers to slash prices to move their own inventories. Chart 7Boom And Bust
Boom And Bust
Boom And Bust
Chart 8Not Exactly A Seller's Market
Not Exactly A Seller's Market
Not Exactly A Seller's Market
Our China strategists believe that the government wants to make an example out of Evergrande to impose some discipline on investors and developers. Despite repeated warnings, it has remained on the wrong side of the three red lines policy makers recently established to rein in property market excesses. Some onshore investors may be bailed out, but party officials will have no qualms about leaving offshore investors holding the bag. As China goes, so too do small neighboring economies reliant on its appetite for imports. Resource economies like Brazil, Chile and Australia that export iron ore, copper and other base metals to feed the China construction and infrastructure juggernaut could slow. Suppliers of machinery and specialized manufactured components like Japan and Europe could also feel a bit of a chill. While the US is not immune to disruptions in the rest of the world, it is a comparatively closed economy that is generally less susceptible to external troubles and has minimal financial links with the Middle Kingdom. A review of the 2020 10-Ks for the SIFI banks and Goldman Sachs and Morgan Stanley confirmed that the American banking system has minimal direct exposures to China and Hong Kong. Only Citigroup, which operates a meaningful commercial banking franchise in Hong Kong, has direct cross-border exposures that amount to as much as 1% of assets (Table 1). Table 1SIFI Exposures To China And Hong Kong
Watching Both Flanks
Watching Both Flanks
The bottom line is that we do not view Evergrande as China’s Lehman. Policymakers may want to make an example of it but not to the point that they will stand by in the face of a broad contagion. Even if it did produce a credit event that rippled across Asian EM markets and tempered investors’ enthusiasm for risk assets more generally, US markets would benefit in a relative sense befitting the dollar’s status as a defensive currency, Treasuries’ status as the predominant risk-free asset and the S&P 500’s low-beta nature. The fall of an overextended Chinese property developer is unlikely to push the US out of Goldilocks and into too-cold territory. Investment Implications Inflation will trigger a policy change once it stays high enough for long enough to trigger the Fed’s recalibrated reaction function. Markets will sniff out a policy change ahead of time and could even catalyze a policy change if the bond vigilantes awaken from their long hibernation. When we reiterate our constructive view on markets and the economy over a three-to-twelve-month timeframe, we are reiterating our assessment that markets will not begin to prepare for the policy change within the next twelve months and that growth will appear as if it will remain on an above-trend trajectory for some time beyond. We are confident that the next twelve months will remain “safe” from a policy and a growth perspective. We have much less conviction about the next six to twelve months following next September and are acutely aware that the outlook for the second half of 2022 and the first half of 2023 will exert a meaningful influence next summer. We will adjust our views based on the incoming data, but we do think the first three to six months of our cyclical timeframe will be conducive to risk asset outperformance and therefore reiterate our recommendation to overweight equities and credit while sharply underweighting Treasuries. Doug Peta, CFA Chief US Investment Strategist dougp@bcaresearch.com Footnotes 1 Per Evergrande’s annual reports, its average annual interest rate on outstanding debt on 12/31/20 was 9.49%, up from 8.99% on 12/31/19, 8.13% on 12/31/18 and 8.09% on 12/31/17.
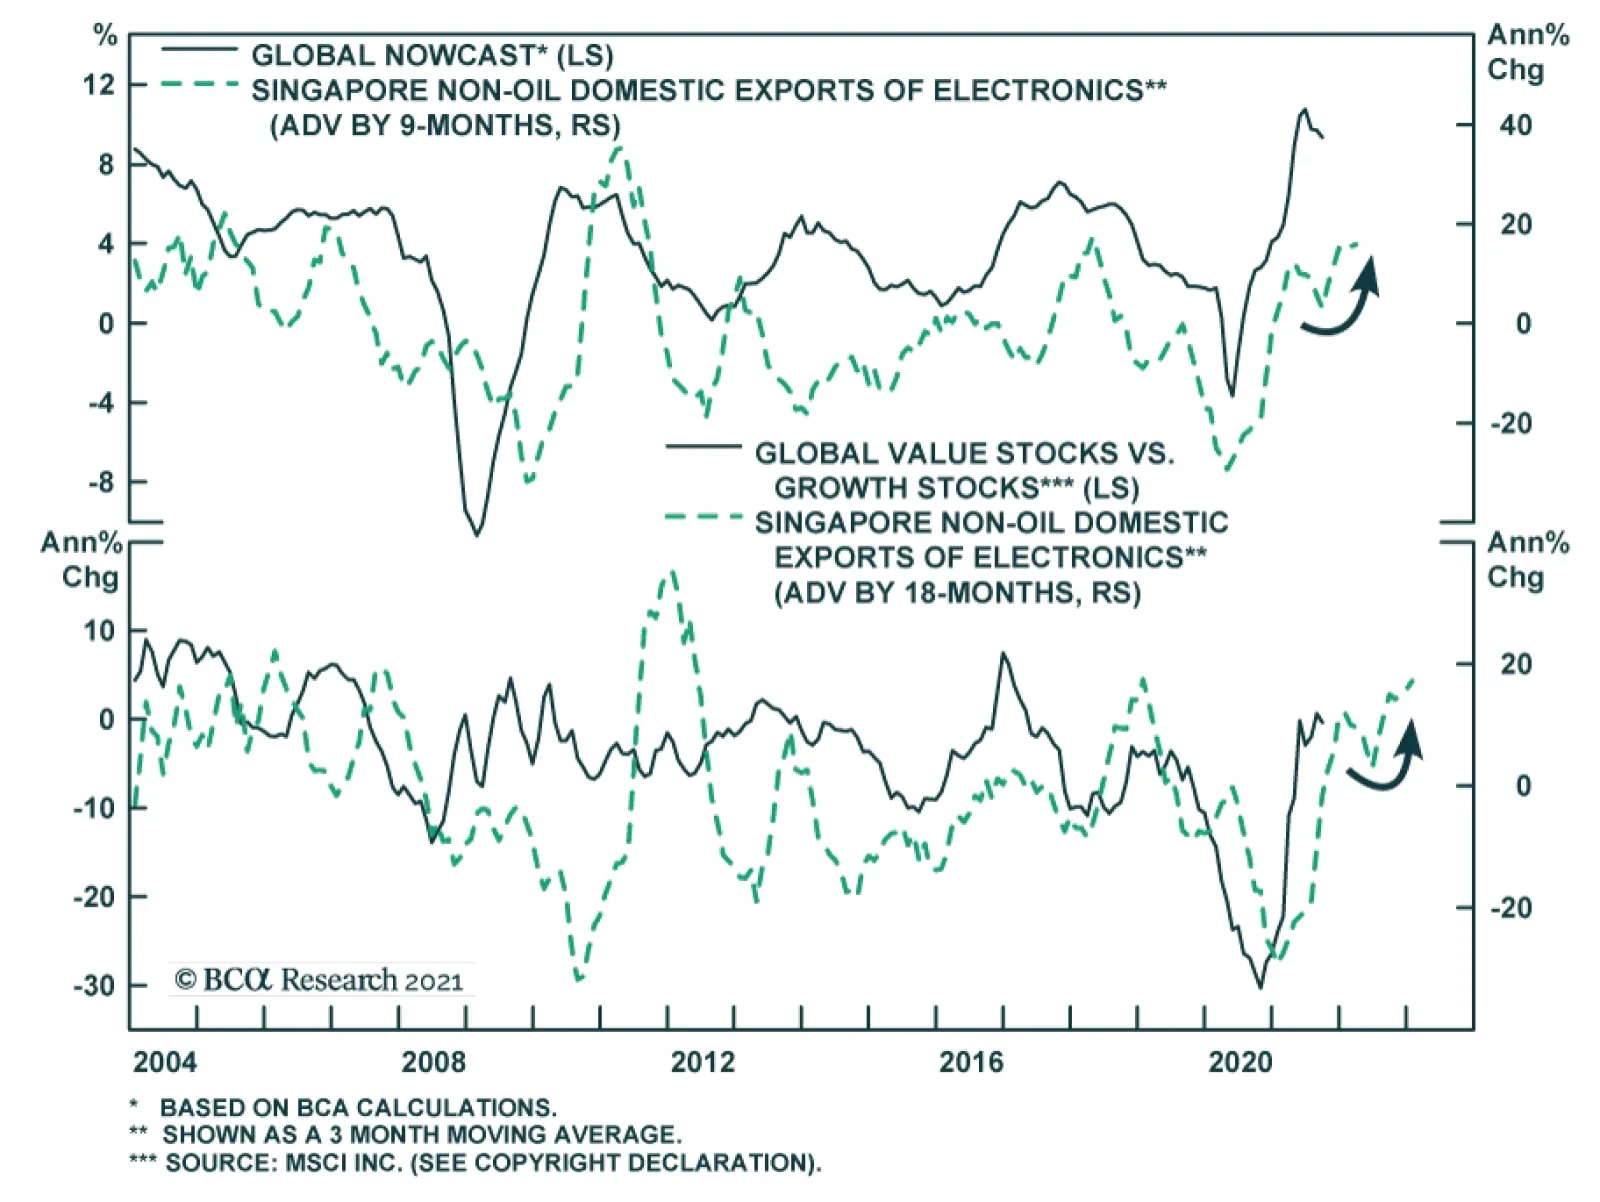
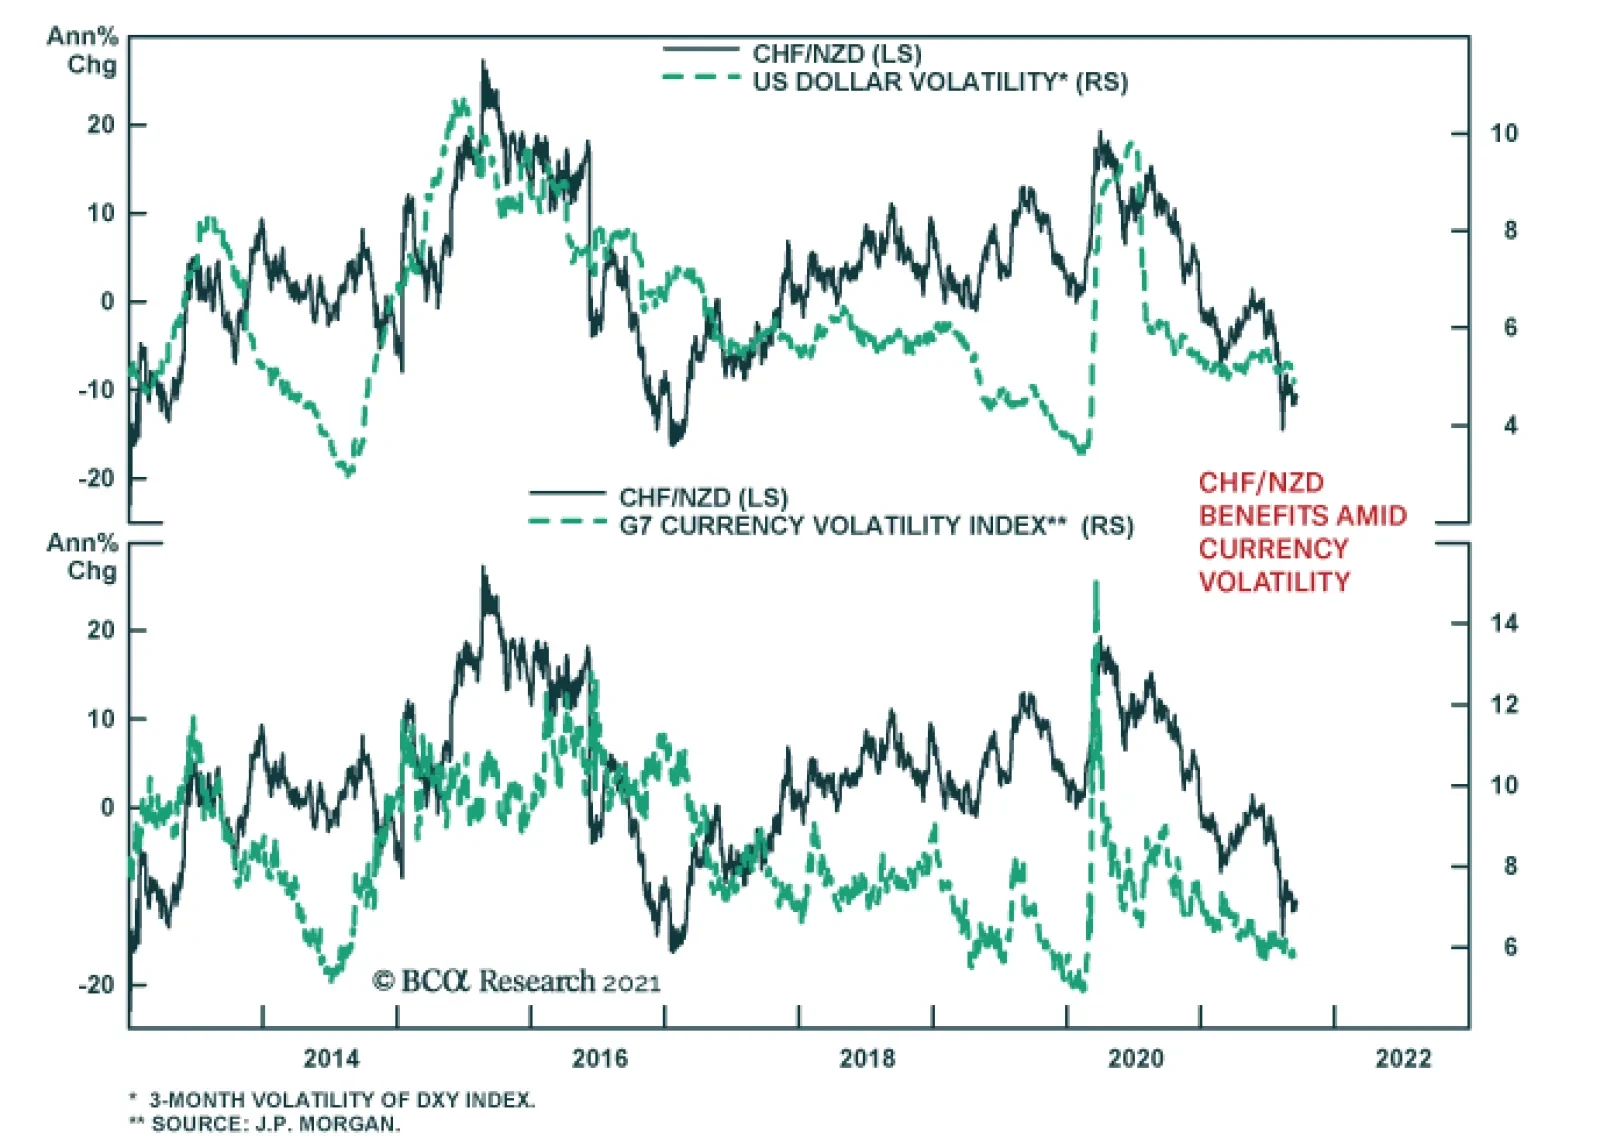
At first glance, Singapore’s exports appear to be sending a warning about the state of global manufacturing. The country’s non-oil domestic exports disappointed in August, falling 3.6% m/m versus an anticipated 2.4% increase. The year-on-year change…
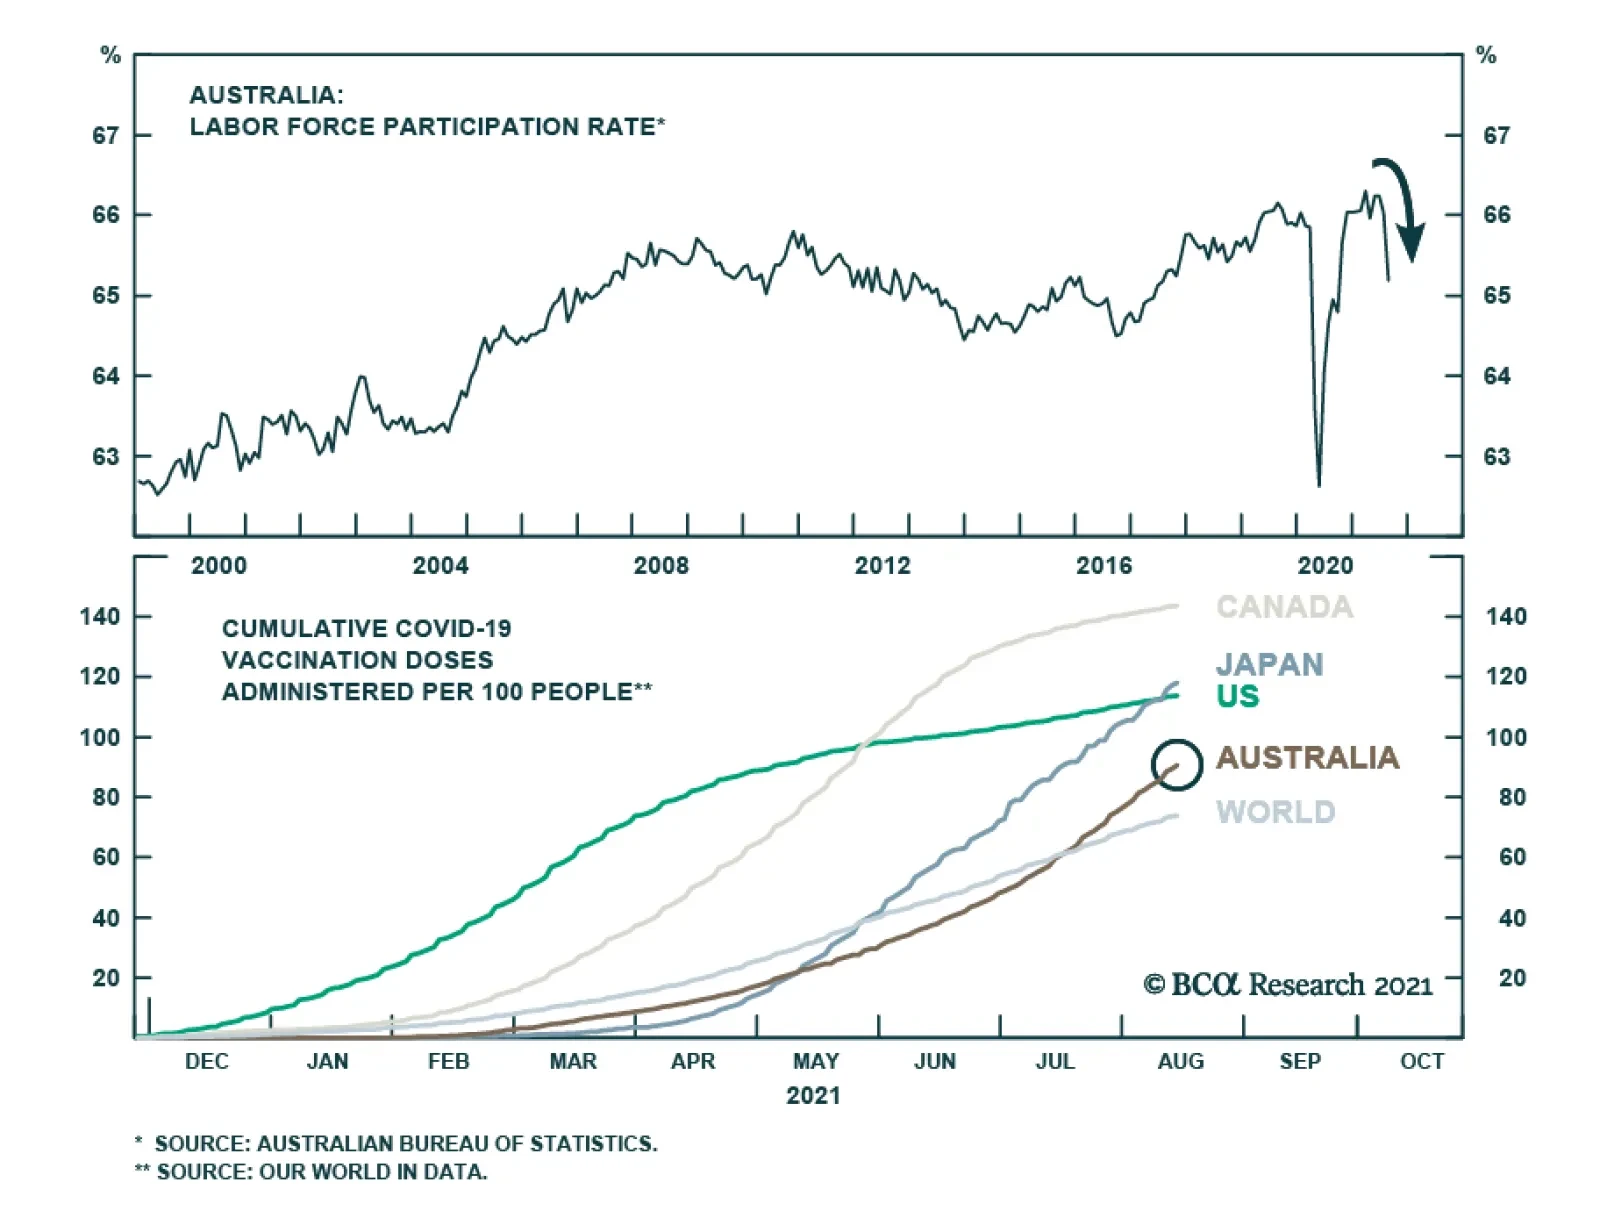
At first blush, Australia’s labor market recovery appears to have accelerated in August. The unemployment rate fell to a 13-year low of 4.5% versus expectations it would rise 0.4 percentage points to 5.0%. However, the lower unemployment rate reflects a…
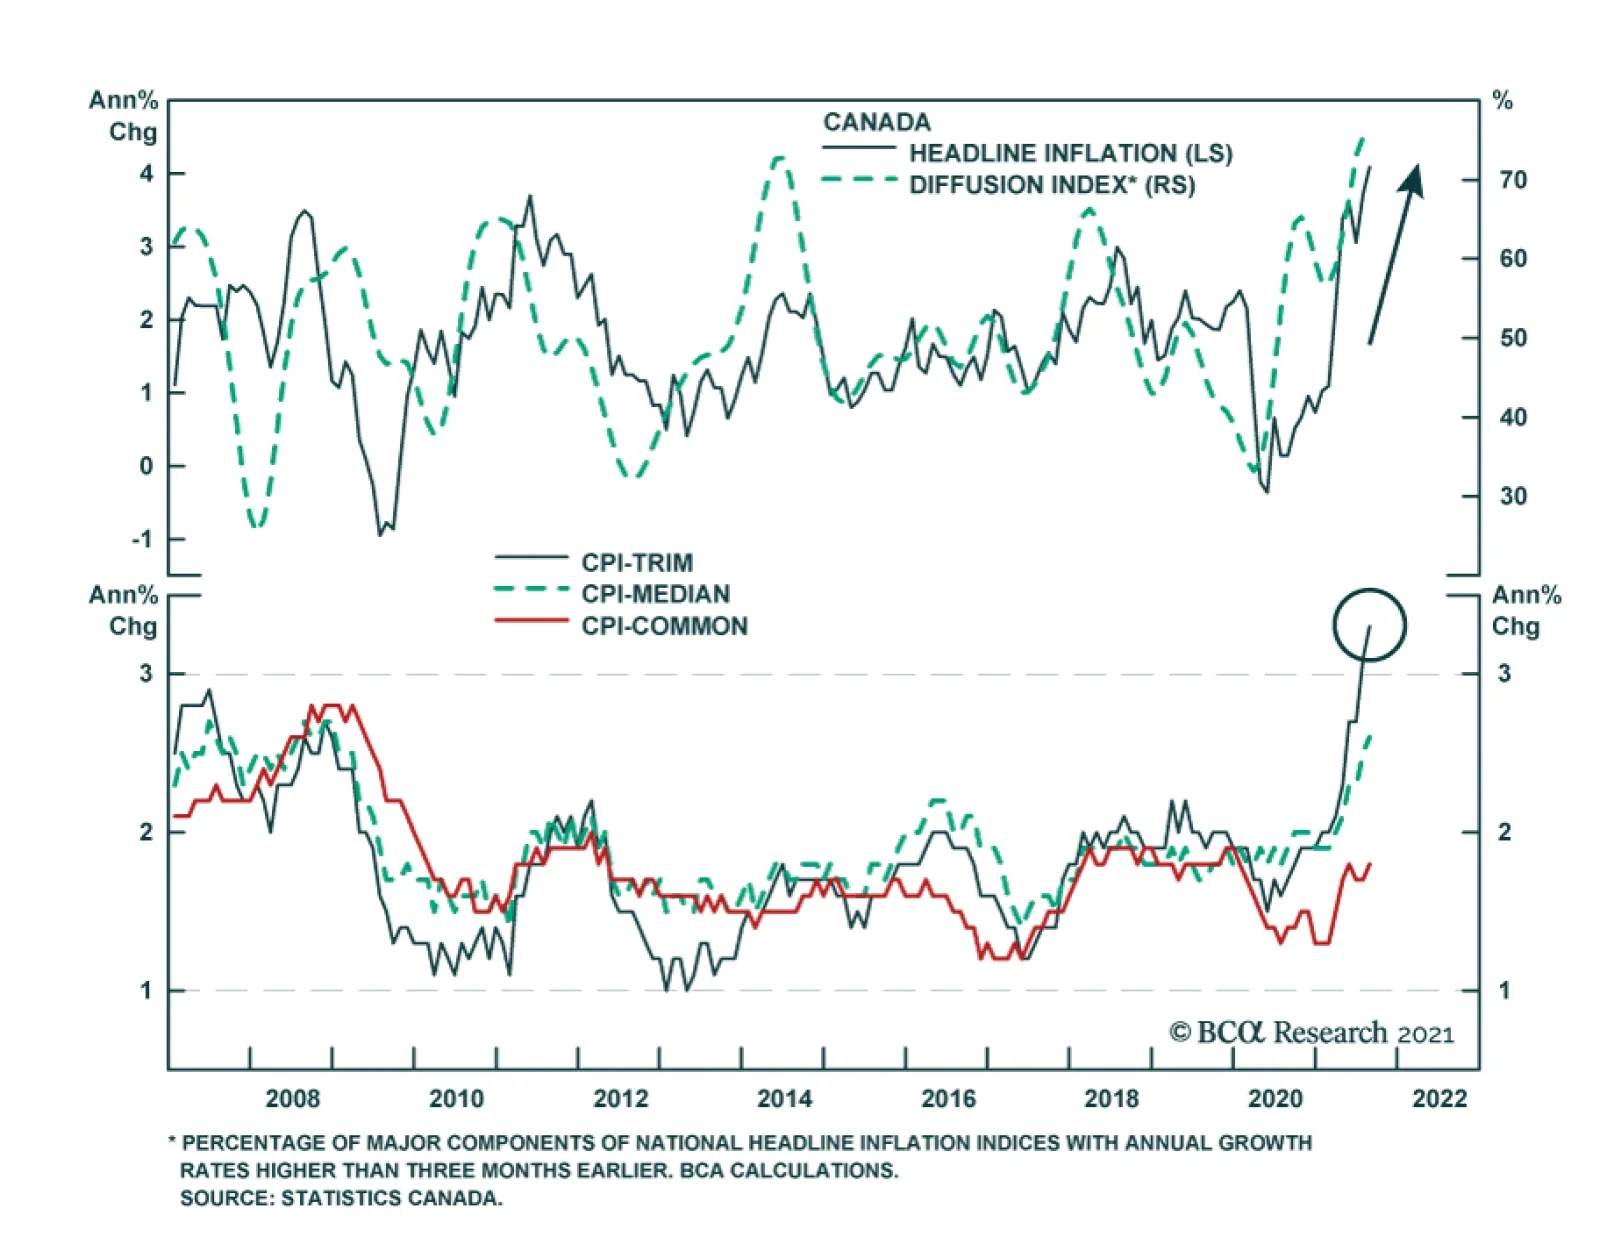
Inflationary pressures are likely to keep the Bank of Canada at least as hawkish - if not more hawkish - than the Fed. Headline CPI accelerated to a 18-year high of 4.1% y/y in August. The diffusion index's extremely elevated reading is in line with…
Highlights The House Ways and Means Committee’s tax proposals are a slight positive surprise for investors. They envision raising $1.5 trillion in new revenue, down from expectations of $2.6 trillion. The House’s tax plans would see the corporate rate at 26.5%, creating a likely range of 25%-26.5%, confirming our view that the proposal would be closer to Biden’s 28% than Trump’s 21%. Combining the Senate spending proposals with the House tax proposals, our updated scenarios for the budget reconciliation bill point to a net deficit impact of $1.2-$1.6 trillion over ten years. We still assign 80% subjective odds of passage to the bipartisan infrastructure bill and, if it passes, 65% odds to the reconciliation bill’s passage. We still expect the debt ceiling showdown to create only temporary volatility as Democrats have the power to raise or suspend the ceiling unilaterally. The major risk to our cyclically bullish view comes from Chinese corporate debt defaults, not a default on the US national debt. We are closing our consumer discretionary trade for a 9% gain to mitigate risks ahead of looming increase in volatility but we expected cyclical plays on Biden’s forthcoming stimulus bills to grind higher this fall. Feature President Biden’s big budget battle is upon us. The House Ways and Means Committee unveiled its tax proposals for the Democrats’ nominal $3.5 trillion reconciliation bill this fall. Spending proposals are soon to follow. The House tax proposals help to define the range of tax hikes that US businesses and investors face next year. An updated timeline of this fall’s budget battle is shown in Diagram 1. The various House committees are supposed to complete their proposals by September 15, just after we go to press. We will update the spending side next week. After that, on September 27, Democratic lawmakers will have a chance to vote on the bipartisan infrastructure bill that the Senate has already passed. Diagram 1Timeline Of Biden’s Big Budget Battles This Fall
The House Ways And Means Tax Plan
The House Ways And Means Tax Plan
Bipartisan infrastructure will pass sometime this fall even if there are delays. Pelosi and other Democratic leaders will be forced to de-link this bipartisan bill from their partisan reconciliation bill that expands social welfare. Republicans cannot be associated with reconciliation so any linkage of the two bills could scupper the bipartisan infrastructure bill. But neither President Biden nor moderate Democrats can afford to let the infrastructure deal fail. Table 1 shows the nine House moderates who delayed the passage of the House budget resolution in August to demand a separate vote on bipartisan infrastructure. Five are true centrists, with narrow margins of victory in districts that Biden narrowly won. This is more than the three votes that Pelosi can spare. Table 1Moderate Democrats In Competitive Districts Need the Infrastructure Deal
The House Ways And Means Tax Plan
The House Ways And Means Tax Plan
Therefore Pelosi will have to separate the two bills. Senator Bernie Sanders and the progressive Democrats cannot afford to let both bills fail – that is merely a progressive bluff. This means we still give an 80% subjective chance that infrastructure will pass. The reconciliation bill has a subjective 65% chance of passing, assuming infrastructure passes. However, it will be greatly modified from current proposals. The $3.5 trillion headline price tag is too high for Senate moderates while the $1-$1.5 trillion price tag outlined by the Moderate-in-Chief, West Virginia Senator Joe Manchin, is too low for progressives. Other points of negotiation and the net deficit impact will be discussed below. Moderate Senate Democrats like Manchin and Arizona Senator Kyrsten Sinema will pass the reconciliation bill because it is the least bad option both for them and their party. They have four main options: Vote to abolish the Senate filibuster, making way for Democrats to push through their controversial voting rights bill. Vote in favor of Biden’s signature reconciliation bill. Vote against both initiatives, thwarting their party and the Biden presidency without necessarily saving their seat in future elections. Vote for both initiatives and face the wrath of their more moderate voter base in their home state. The least bad option is to refrain from abolishing the filibuster but vote in favor of Biden’s reconciliation – they will then save their skin with both their constituents and the Democratic Party. The concessions they extract from party leaders can be sold as victories on the campaign trail back home, along with the bipartisan infrastructure bill. Thus while all kinds of twists and turns can happen this fall, the base case is that the moderate senators fall in line over the reconciliation bill, enabling it to pass by Christmas. Update On The Debt Ceiling September will see a showdown over keeping the government running (avoiding a shutdown) and raising or suspending the national debt ceiling, or the government’s credit card limit. The showdown will cause equity market volatility but it will be temporary – not a compelling reason to sell stocks but rather a possible buying opportunity. This is because a US default on the national debt will be averted. A continuing resolution must be passed by September 30, end of the fiscal year, to avoid a government shutdown. This stop-gap measure is expected to last until December 10, when a new solution on regular budget appropriations will be required. The Democratic tactic is to link the continuing resolution with $24 billion in disaster relief for the Gulf of Mexico and $6.4 billion in emergency funds for Afghan refugees. Republicans would have trouble voting against these worthy causes only to suffer the opprobrium of shutting down the government during a lingering pandemic. Even if this gambit fails, there is little chance the US will default on the national debt. There are four key aspects to this view: 1. Neither party wants to be blamed for causing a default, which would trigger a financial crisis and deprive seniors and veterans of their federal checks, among other politically intolerable consequences. 2. The 46 Republicans who signed a letter pledging not to raise the debt ceiling specifically said they will not actively vote to raise or increase the ceiling. They did not explicitly rule out a suspension or delay of the debt ceiling, nor did they say they would filibuster any attempt to raise it.1 Suspending the debt ceiling is the more politically palatable alternative these days because it does not require specifying a certain new dollar amount of debt to which the limit will be raised. It merely suspends or delays the operation of the debt limit for a period of time. In other words, some Republicans could vote for a suspension in the eleventh hour to avoid a national default. You would need six of them to do so (in addition to four Republicans who did not sign the letter, and all 50 Democrats), if there were a Republican filibustering the debt ceiling suspension. But then again, Republicans will likely refuse to filibuster. Any senator who filibusters a suspension of the debt ceiling would personally be responsible for a national default. A senator who goes rogue would encourage his moderate colleagues to break ranks and join the Democrats to reach the 60-vote threshold. Otherwise Democrats plus four Republican moderates are more than enough to meet the 51-seat simple majority requirement. The bipartisan infrastructure bill cannot even function if the debt ceiling is not raised to authorize new spending. So Republicans will be twice the fools if they vote for infrastructure but refuse to suspend the debt limit (as well as natural disaster and Afghan refugee relief). And really thrice the fools, because they are already unpopular as they are tainted with the accusation of inciting an insurrection on January 6 at the Capitol. 3. Republicans do not control the House or the Senate, so Democrats have the means at their disposal to suspend the debt ceiling unilaterally. 4. If all options fail, Democrats have the ability to revise the budget resolution so as to include a suspension of the debt ceiling in the reconciliation bill. This point is controversial because it is not certain that the Senate parliamentarian, Elizabeth MacDonough, will allow Democrats to revise the budget resolution to include the debt ceiling. Democrats are already making several demands of her on what can be included in reconciliation, and she has already shot them down once earlier this year over the minimum wage. Our view is that MacDonough would allow the budget resolution to be modified to suspend the debt ceiling if the country were immediately at risk of debt default.2 Moreover the President of the Senate, Vice President Kamala Harris, could always overrule the parliamentarian. This is a key point both for the debt ceiling and the contents of the reconciliation bill. Still, there is serious problem of timing mismatch between the debt ceiling and the reconciliation bill. The government’s technical debt default could happen “during the month of October,” according to Treasury Secretary Janet Yellen, whereas the reconciliation bill may not be ready to pass by Thanksgiving or Christmas. It is very hard to speed up a historic multi-trillion reconciliation bill to meet a much narrower statutory requirement of suspending the debt ceiling. Therefore suspending the debt ceiling via reconciliation, even if we are correct that it is legal, would be very difficult in execution – and hence very volatility-inducing for equities. The Democrats’ refusal to suspend the debt ceiling on their own is the weak link in the chain and will break under pressure if the Republicans unite in opposition. But the latter is not a foregone conclusion since the GOP would take the blame for a national default. If Republicans regain the House but not the Senate after the November 2022 midterm elections then our assessment of the debt ceiling risk may change. But for 2021, financial markets should view national default as a passing risk. Comparing The House Tax Plan To Previous Expectations The House Ways and Means Committee released tax proposals for the nominal $3.5 trillion reconciliation bill. These proposals will change significantly in the House, and in conference with the Senate, but the new proposals help to determine the range of policies under negotiation. Table 2 outlines the “tax expenditures” or tax breaks that the Democrats propose. The key features are tax breaks for households (e.g. a large and fully refundable child tax credit, an expanded earned income tax credit and dependent tax credit) and tax breaks for corporations to switch to renewable energy and electric vehicles. Table 3 high lights the “revenue raisers” or new taxes. The top marginal corporate rate would be set at 26.5%. While Senate moderates prefer 25%, which has determined consensus expectations, the implicit range is now between these two numbers. This is a confirmation of our prediction that it would be about 26%-27%. The new rate will thus be closer to the 21% rate established by the Trump administration than the previous 35% status quo, which was the highest in the OECD (Chart 1). Table 2House Ways & Means Tax Expenditure Plan
The House Ways And Means Tax Plan
The House Ways And Means Tax Plan
Table 3House Ways & Means Tax Revenue Plan
The House Ways And Means Tax Plan
The House Ways And Means Tax Plan
Indeed that is the common thread across these tax hikes: the Biden administration, in a nod to the median voter, is only partially reversing President Trump’s Tax Cuts and Jobs Act. Chart 1Corporate Tax Rate Under House Plan
The House Ways And Means Tax Plan
The House Ways And Means Tax Plan
Chart 2Individual Tax Rate Under House Plan
The House Ways And Means Tax Plan
The House Ways And Means Tax Plan
The top marginal individual rate would be 39.6% — no surprise to anyone (Chart 2). The long-term capital gains tax rate would be set at 25%. In addition, a new 3% surtax would be levied on incomes greater than $5 million. These, combined with the Obamacare surtax of 3.8%, would yield a top marginal rate of 31.8%, close to our expected 32% (Chart 3). The international minimum corporate rate would be set at 16.6%, which, when various tax breaks are included, will end up close to the nominal 15% minimum that Biden agreed with a range of other countries this summer (Chart 4). Putting it all together, the House is projecting a hike in taxes worth $1.5 trillion in total revenue, about 58% of the $2.6 trillion previously envisaged (Table 4). Chart 3Capital Gains Tax Rates Under House Plan
The House Ways And Means Tax Plan
The House Ways And Means Tax Plan
Chart 4Minimum Corporate Rate Under House Plan
The House Ways And Means Tax Plan
The House Ways And Means Tax Plan
Table 4Comparison Of House And Senate Tax Plan For Reconciliation Bill
The House Ways And Means Tax Plan
The House Ways And Means Tax Plan
This news constitutes a slight positive surprise for investors relative to expectations earlier this year. Senate tax writers will probably propose more ambitious taxes but Senate moderates will constrain them when it comes to what can gain 51 votes. So the final bill is unlikely to hike taxes more aggressively. However, we still expect the news of rising taxes to be negative in absolute terms – i.e. to create a one-off knock against corporate earnings that investors will have to digest. The historical record shows that there is no correlation between corporate tax rates and economic growth. However, it is not only corporate rates that are rising. The Biden administration is hiking taxes across the board, which could combine to weigh on business sentiment if growth or earnings disappoint.. A look at tax rates over the long run shows that these hikes are not insignificant, though they are moderate (Chart 5). Chart 5The Long View Of US Tax Rates
The House Ways And Means Tax Plan
The House Ways And Means Tax Plan
Going forward, however, investors must consider that the political environment in the US suggests that the median voter has shifted to the left due to generational, ethnic, geopolitical, and ideological shifts affecting the electorate. Tax hikes are more likely to become the norm over the long run than tax cuts, the opposite of the case during the long Reagan era. Hence our expectation is that investors will “buy the rumor, sell the news” of the reconciliation bill. The bill will stimulate economic growth – it increases the budget deficit over the coming ten years relative to expectations. But by the time the Senate passes the bill, this effect may be priced in, whereas any unintended consequences of across-the-board tax hikes will have to be accounted for later. And not only will 2022 see tax hikes but it will also see the Federal Reserve preparing for interest rate hikes. The budget deficit will shrink in 2022 but grow over the coming 10 years under Biden’s legislation. Until the House releases its spending plans, we must combine the House tax plan with the Senate spending plan to update our deficit projections. Table 5 provides descriptions of the various legislative scenarios and Table 6 provides the results in terms of revenue, expenditure, and net deficit impact. Note that these tables include the bipartisan infrastructure bill. Table 5Scenario Descriptions For Budget Deficit Under House Ways And Means Tax Proposals (Sept 2021)
The House Ways And Means Tax Plan
The House Ways And Means Tax Plan
Table 6Scenario Results For Budget Deficit Under House Ways And Means Tax Proposals (Sept 2021)
The House Ways And Means Tax Plan
The House Ways And Means Tax Plan
The deficit impact falls into the same general range we highlighted in the past albeit a bit larger: the Baseline Scenario would amount to a $1.6 trillion net expansion of the deficit over the 10-year budget window, , while the moderate/compromise Scenario 6 would amount to a $1.2 trillion net expansion. Previously we estimated $1-$1.6 trillion, so the difference is a drop in the bucket but the point is that Democrats cannot afford to let tax ambitions sink the entire bill or the economic recovery. The risk to the deficit lies to the upside given that several of the “pay-fors,” or revenue offsets, are chimerical. For example, doubling the size of the Internal Revenue Service may not yield the $140 billion that is projected in higher tax collections, as the Congressional Budget Office pointed out in its scoring of the bipartisan infrastructure bill. The use of “dynamic scoring” to project higher tax revenues from putatively faster economic growth is the favorite gimmick of the US political parties. Investment Takeaways Higher taxes – and a higher labor share of national income via rising wages and social transfers – will weigh on the net profit margins of business. If interest rates rise along with wages and taxes, in a context of hypo-globalization, the result will be a squeeze on margins (Chart 6). The one-off impact of the corporate tax hike on earnings could range from 5%-8%, according to our Global Investment Strategy. President Trump’s Tax Cut and Jobs Act created a 16% gap in the growth of earnings after tax relative to pre-tax earnings growth (Chart 7). A partial reversal of Trump’s hikes could produce half of this effect in the opposite direction. Our US Investment Strategy and US Equity Strategy still expect positive earnings growth in 2022. Chart 6Drivers Of Profit Margins
Drivers Of Profit Margins
Drivers Of Profit Margins
Chart 7Gauging The Tax Hit To Earnings
Gauging The Tax Hit To Earnings
Gauging The Tax Hit To Earnings
The sectors that pay the lowest effective taxes in the US are the ones that stand to suffer most from broadening the corporate tax base, raising rates, and tightening enforcement. This would include Big Tech as well as health care and utilities (although we are bullish on health care in general). Sectors like tech that gain a large share of earnings from abroad also stand to suffer. These low-tax sectors will especially suffer on a relative basis if Biden’s stimulus pushes up growth and inflation expectations and hence interest rates. Companies that pay high effective rates, such as energy, industrials, and materials, could also lose out. But as long as the pandemic continues to wane and the global economy recovers, some of these high-tax firms should still perform well, as will companies with a high share of earnings from abroad. The relative performance of these different baskets suggests that markets are still much more concerned about global recovery than about higher taxes (Chart 8). Cyclical and “value” stocks surged on the advent of the coronavirus vaccines despite the political result in the US indicating that tax hikes were coming. This was a key signal and we would expect something similar, on a smaller scale, as the pandemic recedes. Chart 8Higher Taxes Will Hit The Trump Winners
Higher Taxes Will Hit The Trump Winners
Higher Taxes Will Hit The Trump Winners
American populism is visible in that the Biden administration is coopting Trump’s agenda in various areas despite outward acrimony (e.g. infrastructure, China, trade protectionism). It is only partially reversing Trump’s legacy even in the areas of greatest disagreement, such as taxes. When all is said and done this Christmas, the United States will likely be left with a net tax cut relative to the levels seen under President Obama’s administration. We would not be surprised if across-the-board tax hikes caused or contributed to an equity market correction sometime in the wake of the bill’s passage. But that would not be a reason to grow cyclically bearish. Instead, the fate of China’s economic growth is the big risk to the cyclical view. While we expect equities to grind higher, we are booking a 9% gain on our consumer discretionary trade to mitigate risks ahead of the looming volatility this fall. Fundamentally we remain bullish on this sector due to economic recovery, fiscal stimulus, income redistribution, and the relative costs of the upcoming tax hikes. Matt Gertken Vice President Geopolitical Strategy mattg@bcaresearch.com Appendix Table A1USPS Trade Table
The House Ways And Means Tax Plan
The House Ways And Means Tax Plan
Table A2Political Risk Matrix
The House Ways And Means Tax Plan
The House Ways And Means Tax Plan
Chart A1Presidential Election Model
The House Ways And Means Tax Plan
The House Ways And Means Tax Plan
Chart A2Senate Election Model
The House Ways And Means Tax Plan
The House Ways And Means Tax Plan
Table A3Political Capital Index
The House Ways And Means Tax Plan
The House Ways And Means Tax Plan
Table A4APolitical Capital: White House And Congress
The House Ways And Means Tax Plan
The House Ways And Means Tax Plan
Table A4BPolitical Capital: Household And Business Sentiment
The House Ways And Means Tax Plan
The House Ways And Means Tax Plan
Table A4CPolitical Capital: The Economy And Markets
The House Ways And Means Tax Plan
The House Ways And Means Tax Plan
Footnotes 1 See Senator Shelley Moore Capito, “Debt Ceiling Letter,” United States Senate, August 10, 2021, capito.senate.gov. 2 Senate Majority Leader Chuck Schumer of New York said “We have a number of different ways we’re going to look at getting the debt ceiling done. We must get it done,” in the context of whether Democratic leaders would revise the budget resolution’s reconciliation instructions to lift the debt ceiling. See Jennifer Shutt, “Yellen: Treasury could hit debt ceiling in October without congressional action,” Roll Call, September 8, 2021, rollcall.com. For the parliamentarian’s role, see James Wallner, “Parliamentarian’s Guidance Contradicts Budget Rules,” Legislative Procedure, June 21, 2021, legislativeprocedure.com.
Highlights Fed: The Fed will be forced to clarify its definition of “maximum employment” in 2022, and the path of inflation will ultimately dictate how far the Fed tries to push the labor market. We expect Fed rate hikes to start in December 2022 and that the pace of hikes will proceed more quickly than is currently priced in the yield curve. Duration: Investors should maintain below-benchmark portfolio duration in anticipation of a rate hike cycle starting in December 2022. Yield Curve: Investors should position in Treasury curve flatteners. Specifically, we recommend shorting the 5-year Treasury note versus a duration-matched barbell consisting of the 2-year and 10-year notes. Feature Chart 1Bonds De-Coupled From Inflation In 2021
Bonds De-Coupled From Inflation In 2021
Bonds De-Coupled From Inflation In 2021
One of our themes this year is that US bond investors should pay more attention to the employment data than the inflation data.1 This is because the Fed has successfully convinced markets that it will not lift rates until “maximum employment” is achieved, even if inflation is strong.2 This story has played out during the past few months as bond yields have remained low despite surging prices (Chart 1). Our view is that the muted reaction in bonds is due to the widespread belief that the labor market remains far from “maximum employment” and that rate hikes are therefore a long way off. In this environment, only surprisingly strong employment prints can upset the market’s narrative and send bond yields higher. This playbook for the bond market will continue to function for the next few months. Strong employment data will pull bond yields higher and disappointing employment data will push them down. Inflation prints will be largely irrelevant for the market. But this will change next year. In fact, we see the employment data taking a back seat to the inflation data in the minds of bond investors in 2022. A More Explicit Definition of “Maximum Employment” Must Emerge In 2022 Almost everyone agrees that the US labor market is far from “maximum employment” today, but that will no longer be the case in 2022. The Appendix to this report shows the average monthly nonfarm payroll growth that is required to reach different possible definitions of “maximum employment” by a few specific future dates. For example, we calculate that average monthly nonfarm payroll growth of 414 thousand would cause the unemployment rate to reach 3.8% and the labor force participation rate to reach 63% by the end of 2022. Our sense is that the US economy will be able to add more than 414 thousand jobs per month between now and December 2022. This means that if Fed officials believe that an unemployment rate of 3.8% and a participation rate of 63% meet the definition of “maximum employment”, then they will start to lift interest rates by then. This example sets the scene for what will become next year’s most important monetary policy debate. What constitutes “maximum employment”? Does our example of a 3.8% unemployment rate and a 63% participation rate meet the definition? Or does the Fed have different targets in mind? The Fed will be forced to clarify its position on the topic as the labor market gets closer to reasonable definitions of “maximum employment”. Our sense is that, as of now, there are a range of views on the committee with some FOMC participants taking a more hawkish view of how much slack is left in the labor market and some adopting a more dovish posture. We outline the differences between the hawkish and dovish positions below, but ultimately the path of inflation in 2022 will determine which camp wins out. If inflation remains high next year, then the Fed will be quicker to declare that the labor market is at “maximum employment”, and vice-versa. The Fed’s reliance on the inflation data to settle the argument of what constitutes “maximum employment” will make inflation the most important economic indicator for bond yields in 2022. Labor Market Slack: The Hawkish Case Chart 2The Unemployment Rate Is Falling Fast
The Unemployment Rate Is Falling Fast
The Unemployment Rate Is Falling Fast
The hawkish case for the US labor market reaching “maximum employment” sooner rather than later was outlined nicely last month by our own Bank Credit Analyst.3 First, the Bank Credit Analyst points out that the US labor market was likely beyond “maximum employment” before COVID-19 struck. The implication being that the Fed may move to lift interest rates before the unemployment and participation rates fully recover their pre-pandemic levels. Notice that the unemployment rate (adjusted for the post-COVID surge in people employed but absent from work) was 3.5% in February 2020, well below the Congressional Budget Office’s 4.5% estimate of the natural rate of unemployment (Chart 2).4 Today, the adjusted unemployment rate is 5.5%, not that far above the 3.5%-4.5% range of FOMC participant estimates of the natural rate. If this year’s rate of decline continues, the unemployment rate will hit 4.5% by January 2022 and 3.5% by May 2022. Of course, we know that the Fed takes a broader view of labor market utilization than just the unemployment rate. In particular, we observed sharp declines in labor force participation rates across a wide range of demographic groups when the pandemic struck last year (Chart 3). While the Fed will want to see some improvement in labor force participation, it might be unrealistic to expect the overall labor force participation rate to return to its pre-pandemic level. This is because the aging of the US population imparts a structural downtrend to the participation rate. The dashed line in Chart 4 shows where the participation rate would be if the rate of labor force participation of every individual age cohort remained constant at its February 2020 level. Even in this case, the greater flow of people into the older age groups causes the part rate to fall over time. The message from Chart 4 is that even if the participation rates of every age cohort tracked by the Bureau of Labor Statistics rebound to their February 2020 levels, we would still only expect an overall participation rate of 62.8% by the end of 2022, significantly below the 63.3% seen in February 2020. Chart 3Labor Force Participation By Age Cohort
Labor Force Participation By Age Cohort
Labor Force Participation By Age Cohort
Chart 4The Demographic Downtrend In Participation
The Demographic Downtrend In Participation
The Demographic Downtrend In Participation
On top of the demographic argument, we also notice that the pandemic led to a surge in the number of retired people last year, a number that continues to rise quickly (Chart 5). While we should probably expect some increase in the flow of people coming out of retirement to re-join the labor force as the economy recovers, it’s also logical to assume that there will be at least some hysteresis among the retired population. That is, the longer someone is retired, the less likely they are to re-enter the labor force at all. To the extent that the increase in retired people is sticky, it may be ambitious to expect a full convergence of the 55-year+ part rate back to February 2020 levels (Chart 3, bottom panel). All else equal, this will cause the labor market to reach “maximum employment” more quickly than even our demographic trendline for participation suggests. Chart 5A Surge In Retirees
A Surge In Retirees
A Surge In Retirees
The question of how many FOMC participants agree with the above arguments remains open, but our sense is that there are some who will be eager to declare that “maximum employment” has been achieved before we see a full rebound in the unemployment and participation rates back to pre-COVID levels. For example, Fed Vice-Chair Richard Clarida mentioned the “demographic trend” in labor force participation in his most recent speech.5 Also, Dallas Fed President Robert Kaplan said the following in a recent interview: We’ve had 3 million retirements since February 2020. […] Some of these workers will come back into the workforce, but some of these workers are 55 and older and they’re in reasonably good financial shape and COVID has caused them to re-think whether they really want to re-enter the workforce.6 Labor Market Slack: The Dovish Case There are also good arguments on the side of those who think that an appropriate definition of “maximum employment” involves an unemployment rate closer to 3.5% than 4.5% and a participation rate that does return to pre-COVID levels, and maybe even moves higher. First, a study from the Federal Reserve Bank of Kansas City noted that the bulk of the recent increase in the number of retired people is explained, not by an increase in the number of retirements, but by a reduction in the flow of people from retirement back into the workforce (Chart 6).7 This suggests that pandemic-related health risks are the likely culprit behind the increase in the number of retired people, casting doubt on the idea that the increase in retired people will be sticky. Chart 6Increased Retirees: A Closer Look
2022 Will Be All About Inflation
2022 Will Be All About Inflation
Second, there is a strong case to be made that even the February 2020 labor force participation rate is not high enough to meet the definition of “maximum employment”. If we look at the participation rates for 25-54 year old men and women, we see that both were in strong uptrends prior to the pandemic (Chart 7), and there is every reason to believe that they would have continued to move higher if COVID hadn’t cut the recovery short. Chart 7Part Rates Were Rising Pre-Pandemic
Part Rates Were Rising Pre-Pandemic
Part Rates Were Rising Pre-Pandemic
Consider what some FOMC participants were saying prior to the pandemic: The strong labor market is also encouraging more people in their prime working years – ages 25 to 54 – to rejoin or remain in the labor force, […] So far, we have made up more than half the loss in the Great Recession, which translates to almost 2 million more people in the labor force. But prime age participation could still be higher. - Jerome Powell, November 20198 Whether participation will continue to increase in a tight labor market remains to be seen. But I note that male prime-age participation still remains below levels seen in previous business cycle expansions. - Richard Clarida, November 20199 In a more recent interview, Minneapolis Fed President Neel Kashkari expressed skepticism about the idea that labor force participation is destined to remain in a long-run structural downtrend and said that he’s “not convinced we were actually at maximum employment before the COVID shock hit us.” He also said: Getting [labor force participation] and employment-to-population at least back to where they were before [the pandemic], but not necessarily even declaring victory when we do that. I think that’s a reasonable thing for us to try to achieve.10 Inflation: The Ultimate Argument Settler What the above arguments make clear is that there are good reasons to think that the US labor market will reach some policymakers’ definitions of “maximum employment” perhaps by as early as the middle of next year. However, there are also some policymakers who will adopt a more dovish view of what constitutes “maximum employment”. Ultimately, the path of inflation will determine which camp wins out. This is because the entire concept of “maximum employment” is only meaningful when viewed alongside inflation. If employment is pushed beyond its “maximum”, it definitionally means that labor market tightness is leading to unwanted inflationary pressures. With that in mind, the Fed will increasingly refer to the inflation data next year as it tries to make its definition of “maximum employment” more precise. Crucially, what will matter for the Fed (and for the bond market) is where inflation is next year, not where it is right now. Right now, core inflation is well above the Fed’s price stability target, but it is well known that the recent increase in inflation is concentrated in a few sectors – COVID-impacted services and autos – where prices will decelerate as post-pandemic bottlenecks ease (Chart 8). Just as the Fed ignored surging prices in those sectors this year, it will ignore plunging prices in those sectors next year. What will matter for monetary policy is whether core inflation excluding COVID-impacted services and autos remains contained or rises above levels consistent with the Fed’s target (Chart 8, bottom panel). The Fed will also be inclined to declare that “maximum employment” has been achieved if wage growth is accelerating. Currently, there is some evidence of rising wages but also some major supply bottlenecks in the labor market, as evidenced by the all-time high in job openings (Chart 9). Labor supply constraints should ease next year, but the Fed will be watching closely to see if wage growth moderates in kind or continues to increase. Chart 8Watch CPI (ex. COVID-Impacted Services And Autos) In 2022
Watch CPI (ex. COVID-Impacted Services And Autos) In 2022
Watch CPI (ex. COVID-Impacted Services And Autos) In 2022
Chart 9Watch Wages In 2022
Watch Wages In 2022
Watch Wages In 2022
Finally, the Fed will keep a close eye on inflation expectations next year. In particular, it will monitor the Common Inflation Expectations Index and the 5-year/5-year forward TIPS breakeven inflation rate (Chart 10). If either of these indicators break above levels consistent with the Fed’s 2% inflation target, then policymakers will be more inclined to think that “maximum employment” has been attained. Chart 10Watch Inflation Expectations In 2022
Watch Inflation Expectations In 2022
Watch Inflation Expectations In 2022
Bottom Line: The Fed will be forced to clarify its definition of “maximum employment” in 2022, and the path of inflation will ultimately dictate how far the Fed tries to push the labor market. The key indicators to monitor to decide when the Fed will declare that “maximum employment” has been attained are: core inflation excluding COVID-impacted services and autos, wage growth, inflation expectations and the prime-age (25-54) labor force participation rate (Chart 3, panel 2). Investment Implications For bond markets, the question of when the Fed decides that the labor market has reached “maximum employment” is crucial because it will determine the start of the next rate hike cycle. At present, the overnight index swap curve is priced for Fed liftoff in January 2023 and for a total of 78 bps of rate hikes by the end of 2023 (Chart 11). Chart 11Rate Hike Expectations
Rate Hike Expectations
Rate Hike Expectations
Our expectation is that the Fed will start lifting rates in December 2022 and that rate hikes will proceed more quickly than what is currently priced in the market. The unemployment rate will be close to 3.5% by December 2022 and inflation will be sufficiently above the Fed’s target that policymakers will be inclined to view the labor market as at “maximum employment”. Investors should run below-benchmark duration in US bond portfolios to profit from this outcome. We also recommend that investors position for a flatter yield curve by the end of 2022. Specifically, we recommend shorting the 5-year Treasury note versus a duration-matched barbell consisting of the 2-year and 10-year notes. Table 1A shows fair value estimates for the 2-year, 5-year and 10-year yields as of the end of 2022 assuming the market moves to price-in the following path for the fed funds rate: The first 25 bps rate hike occurs in December 2022 Rate hikes proceed at a pace of 100 bps per year The fed funds rate levels-off at a terminal rate of 2.08%11 Table 1ATreasury Curve Fair Value Estimates: December 2022 Liftoff Scenario
2022 Will Be All About Inflation
2022 Will Be All About Inflation
In that example, the 2-year and 5-year yields both rise by much more than the 10-year yield and both exceed the change that is priced into the forward curve by more than the 10-year yield. Table 1B shows the results from a similar scenario, the only difference is that the liftoff date is pushed back to March 2023. Both the 2-year and 5-year yields also rise by more than the 10-year yield in this scenario, though the delayed liftoff dampens the relative upside in the 2-year yield. Table 1BTreasury Curve Fair Value Estimates: March 2023 Liftoff Scenario
2022 Will Be All About Inflation
2022 Will Be All About Inflation
Bottom Line: Investors should maintain below-benchmark portfolio duration and position in Treasury curve flatteners in anticipation of a rate hike cycle that will start in December 2022. Appendix: How Far From “Maximum Employment” And Fed Liftoff? Chart A1Defining “Maximum Employment”
Defining "Maximum Employment"
Defining "Maximum Employment"
The Federal Reserve has promised that the funds rate will stay pinned at zero until the labor market returns to “maximum employment”. The Fed has not provided explicit guidance on the definition of “maximum employment”, but we deduce that “maximum employment” means that the Fed wants to see the U3 unemployment rate within a range consistent with its estimates of the natural rate of unemployment, currently 3.5% to 4.5%, and that it wants to see a more or less complete recovery of the labor force participation rate back to February 2020 levels (Chart A1). Alternatively, we can infer definitions of “maximum employment” from the New York Fed’s Surveys of Primary Dealers and Market Participants. These surveys ask respondents what they think the unemployment and labor force participation rates will be at the time of Fed liftoff. Currently, the median respondent from the Survey of Market Participants expects an unemployment rate of 3.5% and a participation rate of 63%. The median respondent from the Survey of Primary Dealers expects an unemployment rate of 3.8% and a participation rate of 62.8%. Tables A1-A4 present the average monthly nonfarm payroll growth required to reach different combinations of unemployment rate and participation rate by specific future dates. For example, if we use the definition of “maximum employment” from the Survey of Market Participants, then we need to see average monthly nonfarm payroll growth of +414k in order to hit “maximum employment” by the end of 2022. Table A1Average Monthly Nonfarm Payroll Growth Required For The Unemployment To Reach 4.5% By The Given Date
2022 Will Be All About Inflation
2022 Will Be All About Inflation
Table A2Average Monthly Nonfarm Payroll Growth Required For The Unemployment To Reach 4% By The Given Date
2022 Will Be All About Inflation
2022 Will Be All About Inflation
Table A3Average Monthly Nonfarm Payroll Growth Required For The Unemployment To Reach 3.5% By The Given Date
2022 Will Be All About Inflation
2022 Will Be All About Inflation
Table A4Average Monthly Nonfarm Payroll Growth Required To Reach “Maximum Employment” As Defined By Survey Respondents
2022 Will Be All About Inflation
2022 Will Be All About Inflation
Chart A2 presents recent monthly nonfarm payroll growth along with target levels based on the Survey of Market Participants’ definition of “maximum employment”. This chart is to help us track progress toward specific liftoff dates. For example, if monthly nonfarm payroll growth continues to print at the same level as last month, then we could anticipate a Fed rate hike by June 2022. Chart A2Tracking Toward Fed Liftoff
Tracking Toward Fed Liftoff
Tracking Toward Fed Liftoff
We will continue to track these charts and tables in the coming months, and will publish updates after the release of each monthly employment report. Ryan Swift US Bond Strategist rswift@bcaresearch.com Footnotes 1 Please see US Bond Strategy Weekly Report, “Watch Employment, Not Inflation”, dated June 15, 2021. 2 Specifically, the Fed’s forward guidance states that it will not lift interest rates until (i) inflation is above 2%, (ii) inflation is expected to remain above 2% for some time and (iii) the labor market has reached “maximum employment”. 3 Please see Bank Credit Analyst Special Report, “The Return To Maximum Employment: It May Be Faster Than You Think”, dated August 26, 2021. 4 For details on the adjustment we make to the unemployment rate please see US Bond Strategy Weekly Report, “Overreaction”, dated July 13, 2021. 5 https://www.federalreserve.gov/newsevents/speech/clarida20210804a.htm 6 https://www.bloomberg.com/news/articles/2021-08-09/dallas-fed-president-rob-kaplan-on-the-economy-and-monetary-policy-right-now?sref=Ij5V3tFi 7 https://www.kansascityfed.org/research/economic-bulletin/what-has-driven-the-recent-increase-in-retirements/ 8 https://www.federalreserve.gov/newsevents/speech/powell20191125a.htm 9 https://www.federalreserve.gov/newsevents/speech/clarida20191114a.htm 10 https://www.bloomberg.com/news/articles/2021-08-16/neel-kashkari-on-the-fed-s-quest-to-get-to-full-employment?srnd=oddlots-podcast&sref=Ij5V3tFi 11 We assume a target range of 2% to 2.25% for the terminal fed funds rate. We also assume that the effective fed funds rate trades 8 bps above the lower-end of its target band, as is presently the case. Recommended Portfolio Specification Other Recommendations Treasury Index Returns Spread Product Returns
The House Ways and Means Committee delivered a positive surprise to President Biden’s tax plan. In a package released on Monday, the Committee increased the top corporate tax rate to 26.5% from 21% and raised the capital gains tax to 25% from 20%. Both…
Highlights Germany’s election on September 26 is more of an opportunity than a risk for global investors. Coalition formation will prolong uncertainty but the key takeaway is that early or aggressive fiscal tightening is off the table for Germany … and hence the EU. Germany’s left wing is surprising to the upside as predicted, but it is the Social Democrats rather than the Greens who have momentum in the polls. This is a market-positive development. A coalition of only left-wing parties is entirely possible, but there is a 65% chance that the Christian Democrats (or Free Democrats) will take part in the next coalition to get a majority government. This would constrain business unfriendly outcomes. The German economy is likely to slow for the remainder of 2021, but the outlook for 2022 remains bright as the current headwinds facing the country will dissipate, especially if the risk of an aggressive fiscal drag is low. The underperformance of German equities relative to their Eurozone counterparts is long in the tooth. A combination of valuation, earnings momentum and technical factors suggests that German stocks will beat their peers next year. German equities will also outperform Bunds, which offer particularly unattractive prospective returns. Feature Germany’s federal election will be held on September 26. Our forecast that the left wing will surprise to the upside remains on track, albeit with the Social Democrats rather than the Greens surging to the forefront of opinion polls (Chart 1). However, the precise composition of the next government is very much in the air. Chart 1German Election: Social Democrats Take The Lead
German Election: Social Democrats Take The Lead
German Election: Social Democrats Take The Lead
Our quantitative German election model – which we introduce in this special report – predicts that the ruling Christian Democratic Union will outperform their current 21% standing in opinion polls, winning as much as 33% of the popular vote. Subjectively, this seems like an overestimation, but it goes to show that outgoing Chancellor Angela Merkel’s popularity, a historically strong voting base, and the economic recovery will help the party pare its losses this year. This finding, combined with the strong momentum for the Social Democrats, suggests that the election outcome will not be decisive. Germany will end up with either a grand coalition that includes Merkel’s Christian Democrats or a left-wing coalition that lacks a majority in parliament.1 Investors should note that none of the election outcomes are hugely disruptive to domestic or foreign policy. The status quo is unexciting but not market-negative, while a surprise left-wing victory would mean more reflation in the short run but a roll back of some pro-business policies in the long run. More broadly Germany has established a national consensus that rests on European integration, looser fiscal policy, renewable energy, and qualified engagement with autocratic powers like Russia and China. The chief takeaway is that fiscal policy will not be tightened too soon – and could be loosened substantially. Germany’s Fiscal Question Outgoing Chancellor Angela Merkel is stepping down after ruling Germany since 2005. The Christian Democratic Union, and its Bavarian sister party the Christian Social Union, together form the “Union” that is hard to beat in German elections, having occupied the chancellor’s office for 57 out of 72 years. However, both the Christian Democrats and the Social Democrats, their main rivals, have been shedding popular vote share since 1990, as other parties like the Greens, Free Democrats, the Left, and Alternative for Germany have gained traction (Table 1). Table 1Germany: Traditional Parties Lose Vote Share Over Time
German Election: Winds Of Change
German Election: Winds Of Change
The Great Recession and European sovereign debt crisis ushered in a new geopolitical and macroeconomic context that Merkel reluctantly helped Germany and the EU navigate. Germany’s clashes with the European periphery ultimately resulted in deeper EU integration, in accordance with Germany’s grand strategy and Merkel’s own strategy. But just as the euro crisis receded, a series of shocks elsewhere threatened to upend Germany’s position as one of the biggest economic winners of the post-Cold War world. The sluggish aftermath of the financial crisis, the Russian invasion of Crimea, the Syrian refugee crisis, the Brexit referendum, and President Trump’s election in the US sparked a retreat from globalization, a direct threat to an export-oriented manufacturing economy like Germany. In the 2017 election the Union lost 13.4 percentage points compared to the 2013 election. Minor parties have gradually gained ground since then. However, through a coalition with the Social Democrats, Merkel and her party managed to retain control of the government. This grand coalition eased the country’s fiscal belt in response to the trade war and global slowdown in 2019, signaling Germany’s own shift away from fiscal austerity. Then COVID-19 struck, prompting a much larger fiscal expansion to tide over the economy amid social lockdowns. Germany was not the largest EU member in terms of fiscal stimulus but nor was it the smallest (Chart 2). It joined with France to negotiate a mutual debt plan to rescue the broader EU economy and deepen integration. Chart 2Germany’s Fiscal Stimulus Ranks In The Middle Of Major Countries
German Election: Winds Of Change
German Election: Winds Of Change
Germany’s pro-EU perspective has been reinforced by Brexit and is not on the ballot in 2021. Immigration and terrorism have temporarily subsided as voter concerns. The focus of the 2021 election is how to get through the pandemic and rebuild the German economy for the future. For investors the chief question is whether conservatives will have enough sway in the next government to try to semi-normalize policy and consolidate budgets in the coming years, or whether a left-wing coalition will take charge, expanding on Germany’s proactive fiscal turn. The latter has consequences for broader EU fiscal normalization as well since Germany is traditionally the prime enforcer of deficit limits. The latest opinion polls point to more proactive fiscal policy. The country’s left-leaning ideological bloc has taken the lead (Chart 3A) and the Social Democratic leader Olaf Scholz has sprung into first place among the chancellor candidates (Chart 3B). Chart 3AGermany: Voting Intentions Favor Left-Leaning Parties
Germany: Voting Intentions Favor Left-Leaning Parties
Germany: Voting Intentions Favor Left-Leaning Parties
Chart 3BSocial Democrats Likely To Take Chancellery
German Election: Winds Of Change
German Election: Winds Of Change
Scholz has served as finance minister and is the face of the country’s recent fiscal stimulus efforts. Public opinion is clearly rewarding him for this stance as well as his party, which was previously in the doldrums.2 The Social Democrats and Greens are calling for more fiscal expansion as well as wage hikes and tax hikes (wealth redistribution) in pursuit of social equality and a greener economy (Table 2). If the Christian Democrats retain a significant role in the future coalition, these initiatives will be blunted – not to say halted entirely. But if the left parties put together a ruling coalition without the Christian Democrats, then they will be able to launch more ambitious tax-and-spend policies. Opinion polls show that voters still slightly favor coalitions that include the Christian Democrats, although momentum has shifted sharply in favor of a left-wing coalition (Chart 4). Table 2German Party Platforms
German Election: Winds Of Change
German Election: Winds Of Change
Chart 4Voters Evenly Split On Whether Next Coalition Should Include CDU
German Election: Winds Of Change
German Election: Winds Of Change
This shift is what we forecast in previous reports but now the question is whether the left-wing parties can actually win enough seats to put together a majority coalition. That is a tall order. Our quantitative election model suggests that the Christian Democrats, having suffered a long overdue downgrade in expectations, will not utterly collapse when the final vote is tallied. While we do not expect them to retain the chancellorship, momentum will have to shift even further in the opposition’s favor over the next two weeks to produce a majority coalition that excludes the Union. Our Quantitative German Election Model Our model is based off the work of Norpoth and Geschwend, who created a simple linear model to predict the vote share that incumbent governing parties or coalitions will obtain in impending elections.3 Their model utilizes three explanatory variables and has a sample size of 18 previous elections, covering elections from 1953 to 2017. Our model updates their original work to make estimates for the 2021 election. Unlike our US Political Strategy Presidential Model, which makes use of both political and economic explanatory variables in real time, our German election model makes predictions based solely on historical political variables, all of which display a high degree of correlation with popular vote share. We will look at economic factors that may affect the election later in this report. The Three Explanatory Variables 1. Chancellor Approval Rating: This variable captures the short-term support rate of the incumbent chancellor. A positive relationship exists between chancellor approval and vote share: higher approval equates to higher vote share for the incumbent party. Merkel’s approval stands at 64% today which is a boon for the otherwise beleaguered Christian Democrats (Chart 5). Chart 5Merkel's Coattails A Boon But Not Enough To Save Her Party
Merkel's Coattails A Boon But Not Enough To Save Her Party
Merkel's Coattails A Boon But Not Enough To Save Her Party
2. Long-term partisanship: This variable shows the long-term support rate of voters for specific parties or coalitions in past elections. It is measured as the average vote share of the incumbent party over the past three elections. A positive relationship with vote share exists here too: higher historical partisanship equates to a higher share of votes in forthcoming elections, and vice versa. This variable clearly gives a boost to the Christian Democrats – although it could overrate them based on past performance, as occurred in 2017 when they underperformed the model’s prediction.4 3. “Time For Change”: This is a categorical variable measured by how many terms the parties or coalition have held office leading into an election. This variable has a negative relationship with vote share outcomes. The longer an incumbent party or coalition holds office, the less vote share they will receive. Effectively, our model punishes parties that hold office for long periods of time. In this case that would be the long-ruling Christian Democrats. Model Estimation And Results Our model is estimated by the following simple equation: Popular Vote Share = constant + ßChancellor Approval Rating + ßLong-Term Partisanship + ßTime For Change Estimating the above model for the 2021 election predicts that the Union will win 32.7% of the vote share (Table 3). If this prediction came true, it would suggest that the ruling party performed almost exactly the same as in 2017. In other words, the party’s strong voter base combined with Merkel’s long coattails are expected to shore up the party. This flies in opinion polling, however, so we think the model is overestimating the Christian Democrats. Table 3Our German Election Quant Model Says CDU Will Not Collapse
German Election: Winds Of Change
German Election: Winds Of Change
Note that even if the Union performs this well, it still will not win enough seats to govern on its own. Potential Union-led coalitions are shown in Table 3, excluding the Social Democrats (see below). For a majority government, a coalition with the Free Democrats and the Greens would need to be formed. This coalition would equate to 53% of the vote share. Otherwise, to obtain a majority, the Union would have to team up with the Social Democrats, which is today’s status quo. We can use the same methodology to predict the vote share for the Social Democrats. We use the support rate of Social Democratic chancellor-candidate Olaf Scholz and calculate the long-term partisanship variable using past Social Democratic vote shares. In this case our model predicts that the Social Democrats will win 22.1% of the vote. If this result were to come true, it would not be enough for the party to govern own its own. Potential Social Democratic-led coalitions are shown in Table 4. The best coalition would be with the Greens and either the Left or the Free Democrats. But in this case the Social Democrats cannot form a government with a vote share above 50%, unless it pairs up with the Christian Democrats. Table 4Our German Election Quant Model Says SPD Has Not Yet Won It All
German Election: Winds Of Change
German Election: Winds Of Change
In other words, either the left-wing parties must build on their current momentum and outperform their historical record in the final election tally, or they will need to form a coalition with the Christian Democrats. This kind of left-wing surge is precisely what we have predicted. But the model helps put into perspective how difficult it will be for the left-leaning parties to get a majority. Scholz is single-handedly trying to overcome the long downtrend of the Social Democrats. His party is rising at the expense of the Greens, and the Left, which puts a lid on the total left-wing coalition size. If these three parties all beat the model and slightly surpass their top vote share in recent memory (SPD at 26%, Greens at 11%, and the Left at 12%), they still only have 49% of the vote. While our model is reliant on historical political data, it is a robust predictor for past election results (Chart 6). The average vote share error between the predicted and realized outcomes over from 1953 to 2013 is 1.7 percentage points. The problem with relying on the model is that the Christian Democrats have broken down from their long-term trend in opinion polls. And while Merkel’s approval is strong, she is no longer on the ballot and her hand-picked successor, Armin Laschet, is floundering in the polls (see Chart 3B above). Chart 6Our German Election Quant Model Has Solid Track Record, But Merkel’s High Approval Rating Caused Overestimate In 2017 And May Do So In 2021
German Election: Winds Of Change
German Election: Winds Of Change
In short, the model is probably overrating the Union but it is also calling attention to the extreme difficulty of the left-wing parties forming a majority coalition. Scholz may have to form a coalition with the Free Democrats or pursue another grand coalition. And if the Social Democrats fail to get the largest vote share, German President Frank-Walter Steinmeier may ask Armin Laschet to try to form a government first. Still, Scholz is the most likely chancellor when all is said and done. Election Model Takeaway Our German election model predicts that the Union will receive 32.9% of the popular vote, while the Social Democrats will receive 22.1%. At the same time, the left-leaning parties, specifically the Social Democrats, clearly have the momentum. Therefore the model may be overrating the incumbent party. But it still calls attention to a high level of uncertainty, the likelihood of a messy election outcome, and a tricky period of coalition formation. The Social Democrats will have to pull off a major surprise, outperforming both history and our model, to lead a majority government without the Christian Democrats.5 We still think this is possible. But we will stick with our earlier subjective probabilities: 65% odds that the Christian Democrats take part in the next coalition, 35% odds that they do not. Bottom Line: The chancellorship will go to the Social Democrats but the coalition will constrain the business unfriendly aspects of their agenda. This is positive for Germany’s corporate earnings outlook. Macro Outlook: A Temporary Economic Dip Our election model does not account for the economic backdrop and hence ignores the “pocketbook voter.” Germany is recovering from the pandemic, which is marginally supportive for an otherwise faltering ruling party. However, the economic data is only good enough to suggest that the Union will not utterly collapse. A rise in unemployment, inflation, and the combination of the two (the “Misery Index”) is a tell-tale sign that the incumbent party will suffer a substantial defeat (Chart 7). However the German economy’s loss of momentum is temporary. Growth will re-accelerate in early 2022. The timing is politically inconvenient for the ruling party but positive news for investors. German economic confidence is deteriorating. The Ifo Business Climate survey has rolled over, lowered by a meaningful decline in the Expectations Survey. Additionally, consumer confidence is turning south, despite already being low (Chart 8). Chart 7Spike In German Misery Index A Tell-Tale Sign Of Poor Election For Incumbent Party
Spike In German Misery Index A Tell-Tale Sign Of Poor Election For Incumbent Party
Spike In German Misery Index A Tell-Tale Sign Of Poor Election For Incumbent Party
Chart 8Deteriorating German Confidence
Deteriorating German Confidence
Deteriorating German Confidence
A combination of factors weighs on German confidence: First, global supply chain bottlenecks are hurting growth. The automotive industry, which is paralyzed by a global chip shortage, accounts for about 20% of industrial production, and its output is once again declining after a sharp but short-lived rebound last year (Chart 9). Similarly, inventories of finished goods are collapsing, which is hurting growth today (Chart 9, second panel). Second, the Delta variant of COVID-19 is causing a spike in infections. The rise in cases prevents containment measures from easing as much as expected, while it also hurts the willingness of households to go out and spend their funds (Chart 9, third panel). Third, German real wages are weak. Negotiated wages are only growing at a 1.7% annual rate, and wages and salaries are expanding at 2.1% annually. Meanwhile, German headline CPI runs at 3.9%. The declining purchasing power of German households accentuates their current malaise. Three crucial forces counterbalance these negatives: First, German house prices are growing at a 9.4% annual rate, which is creating a potent, positive wealth effect (Chart 10). Chart 9Germany's Headwinds
Germany's Headwinds
Germany's Headwinds
Chart 10A Strong Wealth Effect
A Strong Wealth Effect
A Strong Wealth Effect
Second, German household credit remains robust. According to the Bundesbank, the strength in household credit mostly reflects the strong demand for mortgages. Historically, a healthy housing sector is an excellent leading indicator of economic vigor. Third, the Chinese credit impulse is too depressed for Beijing’s political security. The recent decline in the credit impulse to -2.4% of GDP reflects a policy decision in the fall of 2020 to trim down the credit expansion. As a result, Chinese economic growth is slowing. For example, both the Caixin Manufacturing and Services PMIs stand below 50, at post-pandemic lows of 49.2 and 46.7, respectively. In July authorities became uncomfortable and cut the Reserve Requirement Ratio as well as interbank rates to free liquidity and stabilize the economy. A boom is not forthcoming, but the drag on global activity will ebb by next year. Including the headwinds and tailwinds to the economy, German activity will slow down for the remainder of the year before improving anew in 2022. Our election case outlined above – that the conservatives will lose the chancellorship and either be excluded from power or greatly diminished in the Bundestag – means that fiscal policy will not be tightened abruptly and will not create a material risk to this outlook. Chart 11Vaccines Work
Vaccines Work
Vaccines Work
Many of the headwinds will dissipate. The Delta-wave of COVID-19 will diminish. Already, Germany’s R0 is tentatively peaking, which normally precedes a drop in daily new cases. Moreover, Germany’s vaccination campaign is progressing, which limits the impact of the current wave on hospitalization and intensive care-unit usage (Chart 11). Inflation will peak in Germany, which will salvage real wages. As European Investment Strategy wrote last Monday,6 European inflation remains concentrated in sectors linked to commodity prices or directly affected by bottlenecks. Instead, trimmed-mean CPI is muted (Chart 12), which implies that underlying inflationary pressures are small, especially as wage gains are still well contained. Moreover, the one-off impact of the end of the German VAT rebate will also pass. Finally, a stabilization and eventual revival of the Chinese credit impulse will put a floor under German exports, industrial production, and capex (Chart 13). For now, the previous decline in the Chinese credit impulse is consistent with slower German output growth for the remainder of 2021. However, next year, the German industrial sector will start to feel the effect of the current efforts to improve Chinese liquidity conditions. Chart 12Narrow European Inflation
Narrow European Inflation
Narrow European Inflation
Bottom Line: The German economy is set to deteriorate for the remainder of 2021. However, as the current wave of COVID-19 infections ebbs, real wages recover, and China’s credit impulse stabilizes, Germany’s economic activity will re-accelerate in 2022, especially if the upcoming election does not generate a meaningful fiscal shock. We do not think it will. Chart 13China: From Headwinds To Tailwind?
China: From Headwinds To Tailwind?
China: From Headwinds To Tailwind?
Market Implications: German Stocks To Shine German equities are set to outperform their European counterparts and will significantly beat Bunds over the coming 18 months. During the past 5 months, the German MSCI index has underperformed the rest of the Eurozone by 6.2%. The poor performance of German equities is worse than meets the eye. If we adjust for sectoral differences by building equal sector-weight indexes, Germany has underperformed the Euro Area by 22% since early 2017 (Chart 14). Chart 14Not Delivering The Goods
Not Delivering The Goods
Not Delivering The Goods
This underperformance is long in the tooth and should reverse because of four important dynamics. First, German equities are cheap relative to the European benchmark. As Chart 15 highlights, the relative performance of German stock prices has lagged that of profits. This underperformance is also true once we account for the different sectoral composition of the German market. As a result, Germany is cheap on a forward price-to-earnings, price-to-sales, and price-to-book basis versus the Euro Area. Additionally, analysts embed significantly lower long-term and one-year expected growth rates of earnings in Germany than in the rest of the Eurozone, which depresses the German PEG ratios. Second, German operating metrics do not justify the valuation discount of German equities. The return on equity of German stocks stands at 11.39%, which is similar to that of the Euro Area. Profit margins are also comparable, at 5.91% and 5.74%, respectively. However, German firms utilize their capital more efficiently, and their asset turnover stands at 0.3 times compared to 0.2 times for the Eurozone average. Meanwhile, German non-financial firms are less indebted than their Eurozone competitors, which implies that Germany’s return on assets is greater than that of Europe at large (Chart 16). Chart 15Lagging Prices, Not Earnings
Lagging Prices, Not Earnings
Lagging Prices, Not Earnings
Chart 16Why The Discount?
Why The Discount?
Why The Discount?
Third, the drivers of earnings support a German outperformance. Over the past thirty years, commodity prices led the performance of German stocks relative to that of the rest of the Eurozone (Chart 17). While the near-term outlook for natural resource prices is muddy, BCA’s commodity strategists expect Brent prices to average more than $80/bbl in 2023 and industrial metals to outperform energy over the coming years.7 Additionally, German Services PMI are bottoming compared to that of the Eurozone. Over the past decade, this process preceded periods of outperformance by German stocks (Chart 18). Similarly, the collapse in the Chinese credit impulse relative to the robust domestic economic activity in Europe is well reflected in the underperformance of German shares. The Eurozone’s Service PMI is near all-time highs and unlikely to improve further; however, the Chinese credit impulse should recover in the coming quarters. This phenomenon will help German stocks (Chart 19). Chart 17Commodity Bulls Pull Germany
Commodity Bulls Pull Germany
Commodity Bulls Pull Germany
Chart 18German Vs European Activity Matters
German Vs European Activity Matters
German Vs European Activity Matters
Chart 19German Vs Chinese Activity Matters
German Vs Chinese Activity Matters
German Vs Chinese Activity Matters
The German MSCI index is also oversold. The 52-week rate of change of its performance compared to the rest of the Eurozone plunged to its lowest reading since the introduction of the euro in 1999 (Chart 20). Meanwhile, the 13-week rate of change remains low but has begun to improve (not shown). This combination usually heralds a forthcoming rebound in German relative performance. In relation to equities, German Bunds remain an unappealing investment. Based on historical experience, the current yield of -0.36% offered by German 10-year bonds condemns investors to negative returns over the next five years (Chart 21). Chart 20Oversold!
Oversold!
Oversold!
Chart 21Bounded Bunds' Returns
Bounded Bunds' Returns
Bounded Bunds' Returns
Even if realized inflation ebbs in Germany and Europe, inflation expectations remain low and an eventual return to full employment will force CPI swaps higher, especially if the ECB maintains easy monetary conditions and invites further risk-taking in the Eurozone. The global economic cycle will also move from a friend to a foe for Bunds. As Chart 22 illustrates, the recent deceleration in global export growth was consistent with the fresh uptick in the returns of German paper. However, if Chinese credit flows stabilize by year-end and reaccelerate in 2022 while supply-chain bottlenecks dissipate, global export growth will improve. This should hurt Bund prices, especially as the long-term terminal rate proxy embedded in the German curve remains too low. As a result, not only should Bunds underperform German equities, but the German yield curve will also steepen further relative to that of the US, where the Fed will lift the short-end of the curve faster than the ECB. Chart 22Economic Momentum And Bunds Prices
Economic Momentum And Bunds Prices
Economic Momentum And Bunds Prices
Bottom Line: The underperformance of German equities relative to those of the rest of the Eurozone is well advanced, which makes German stocks a bargain. The current deceleration in global and German growth will not extend beyond 2021, which suggests that German stocks prices should converge toward their earnings outperformance next year. Our political forecast suggests that the odds of an early or aggressive fiscal retrenchment are very low. Additionally, German equities will outperform Bunds, which offer particularly poor prospective returns. Matt Gertken Vice President Geopolitical Strategy mattg@bcaresearch.com Mathieu Savary Senior Vice President Mathieu@bcaresearch.com Guy Russell Research Analyst GuyR@bcaresearch.com Jingnan Liu Research Associate JingnanL@bcaresearch.com Footnotes 1 Note that minority governments are rare and have a bad reputation in Germany, partly as a result of the series of weak governments leading up to the 1932 election and Nazi rule. 2 In addition, while the center-left parties can work with the far-left in the Bundestag, the center-right parties cannot work with the far-right Alternative for Germany. Indeed the slightest imputation of a willingness to work with Alternative for Germany cost Merkel’s first pick for successor, Annegret Kramp-Karrenbauer, her job. 3 See: Norpoth, Helmut & Gschwend, Thomas (2010) The chancellor model: Forecasting German elections, International Journal of Forecasting. 26. 42-53. 4 Our model performs well in back-testing but 2017 was an outlier. It correctly predicted the Union to win the highest share of the popular vote but overestimated that vote by seven percentage points. Our only short-term variable, the chancellor’s approval rate, caused a deviation from long-term voting trends. Our other two variables capture medium and long-term effects, which clearly favored the Union. The implication is that Merkel’s high approval rating today could give a misleading impression about the Christian Democrats’ prospects. 5 If they are forced to rely on the Free Democrats instead, that will also constrain the most anti-business elements of their agenda. 6 Please see BCA Research European Investment Strategy Weekly Report, "The ECB Taper Dilemma", dated September 6, 2021, available at eis.bcareseach.com. 7 Please see BCA Research Commodity & Energy Strategy Weekly Report, "Permian Output Approaches Pre-Covid Peak", dated August 19, 2021, available at ces.bcareseach.com.
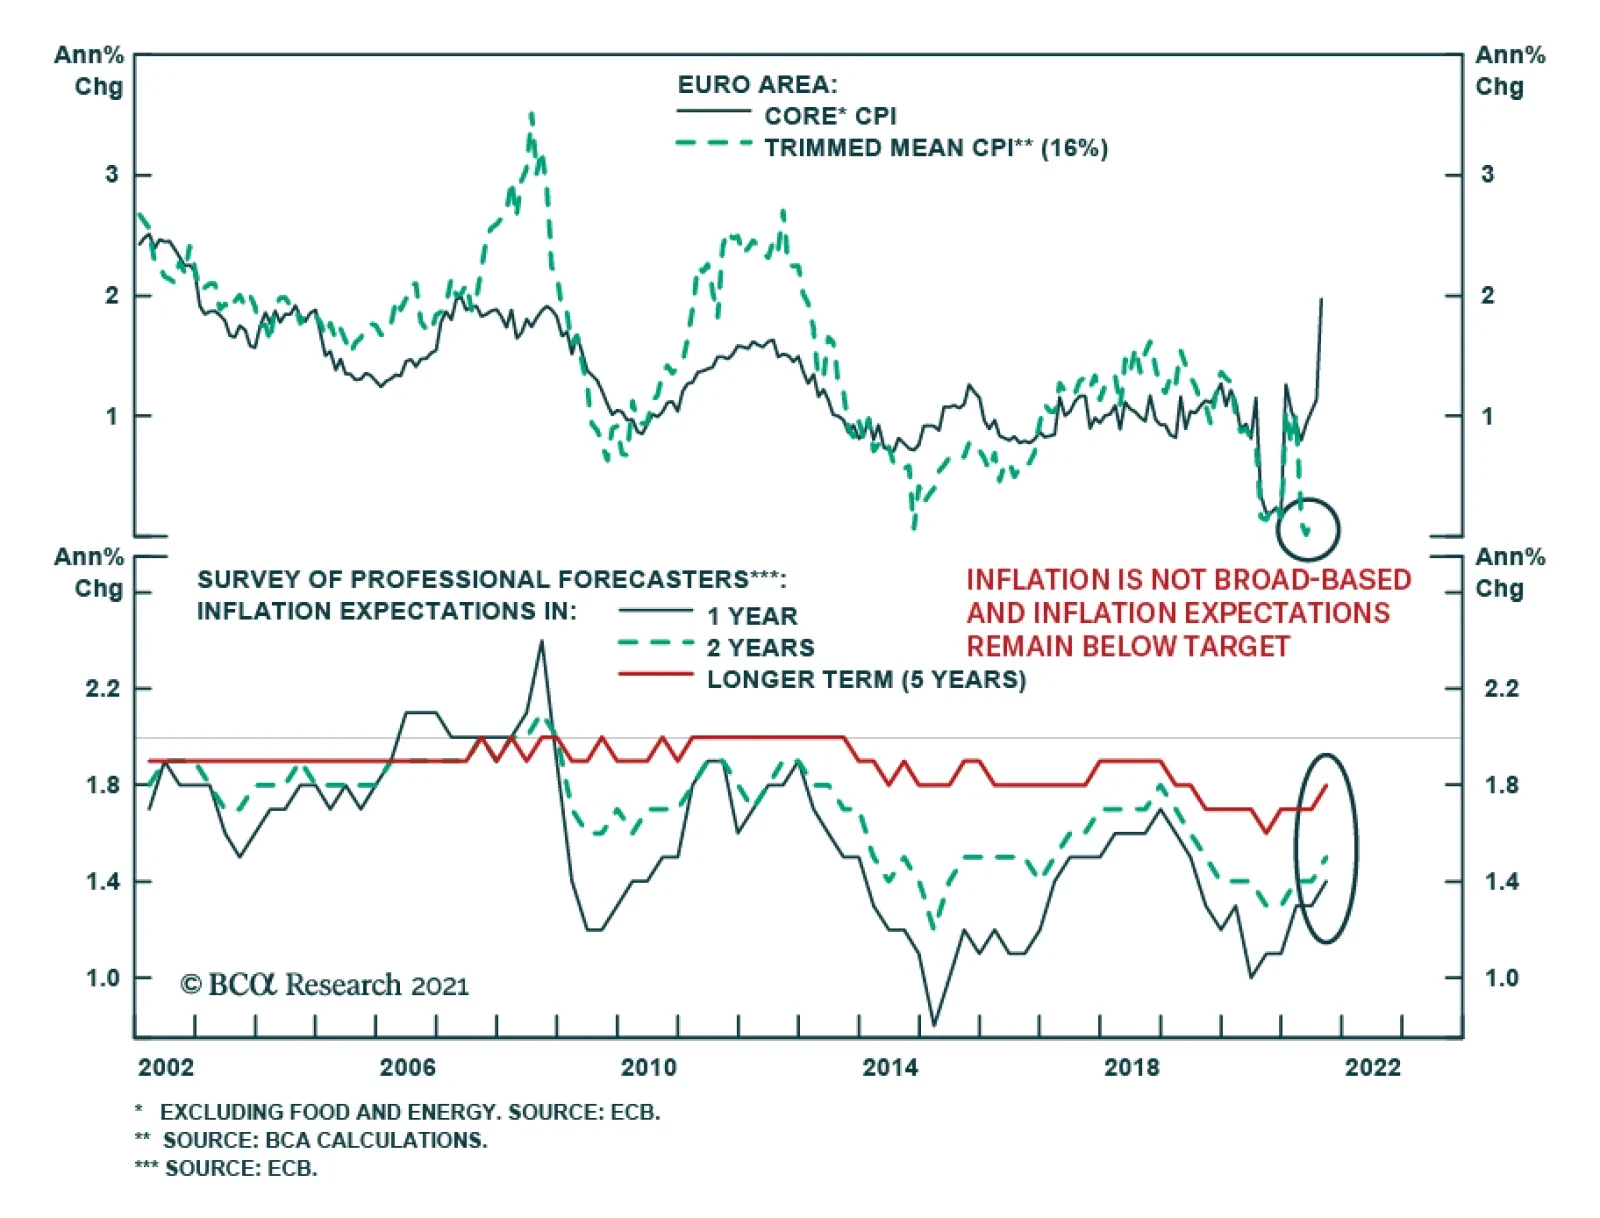
Thursday's ECB meeting concluded with a decision to "moderately" reduce the pace of asset purchases under the PEPP in the final quarter of 2021. The decision to pare back the pace of purchases is in line with the ECB's assessment that the economic…