Policy

Highlights The equity risk premium has turned negative for the first time since 2002. It follows that any significant rise in bond yields will cause risk-asset prices to collapse, quickly flipping any incipient inflationary shock into a deflationary shock. Shorting bonds yielding 2 percent is a ‘widow maker’ trade, as anybody who has tried this with a long list of government bonds has learned to their cost, the most recent being UK gilts. Hence, the next on the list for the ‘widow maker’ is shorting the US 30-year T-bond which is now yielding 2 percent. In fact, the US 30-year T-bond is a must-own structural investment. Fractal analysis: Medical equipment versus healthcare services. Feature Chart of the WeekThe Equity Risk Premium Turns Negative For The First Time Since 2002
The Equity Risk Premium Turns Negative For The First Time Since 2002
The Equity Risk Premium Turns Negative For The First Time Since 2002
Mainstream investments are now priced to deliver negative, zero, or at best, feeble long-term investment returns. Mainstream investments are now priced to deliver negative, zero, or at best, feeble long-term investment returns. For example, the US 10-year Treasury Inflation Protected Security (TIPS) and the UK 10-year index linked gilt are yielding -1.3 percent and -2.8 percent respectively. Meaning that anybody who buys and holds these bonds to redemption is guaranteed a deeply negative 10-year real return. Meanwhile, in nominal yield space, 10-year government bonds yield -0.35 percent in Germany and Switzerland, 0.7 percent in the UK, and 1.3 percent in the US. What about equities? Unlike a bond’s redemption yield, equities do not offer a guaranteed long-term return for buy-and-hold investors. So, some analysts assume that the equity market’s earnings yield is the proxy for this long-term return. According to these analysts, the US equity market’s earnings yield of 4.4 percent means that it will deliver a prospective long-term real return of 4.4 percent per annum. Compared to the 10-year TIPS real yield of -1.3 percent, they argue that this offers an excess return or ‘equity risk premium’ of a comfortable +5.7 percent. Therefore, claim these analysts, equities are reasonably valued, relative to bonds, and in absolute terms. But as we will now demonstrate, this analysis is deeply flawed. The Equity Risk Premium Has Turned Negative The equity market’s earnings yield is a valuation metric, so clearly there is some connection between it and the prospective return delivered by the equity market. Nevertheless, the crucial point to grasp is that: The equity market’s earnings yield does not equal its prospective return. Charts I-2 - I-3 should make this point crystal clear. As you can see, the earnings yield rarely equals the delivered prospective 10-year return, either real or nominal. When the earnings yield is elevated, the prospective return turns out higher. Conversely, when the earnings yield is depressed, as now, the prospective return turns out to be much lower. Chart I-2The Equity Market's Earnings Yield Does NOT Equal Its Prospective Return, Either In Real Terms...
The Equity Market's Earnings Yield Does NOT Equal Its Prospective Return, Either In Real Terms...
The Equity Market's Earnings Yield Does NOT Equal Its Prospective Return, Either In Real Terms...
Chart I-3...Or In Nominal ##br##Terms
...Or In Nominal Terms
...Or In Nominal Terms
Therefore, to take the current earnings yield of 4.4 percent and subtract the real bond yield of -1.3 percent to derive an equity risk premium of +5.7 percent is analytically flawed, just as it is analytically flawed to subtract apples from oranges. To derive the equity risk premium, the correct approach is first to translate the earnings yield into a prospective 10-year return based on the established mathematical relationship between these variables. Chart I-4 does this and shows that, based on a very tight mathematical relationship through the past thirty five years, an earnings yield of 4.4 percent translates into a prospective 10-year nominal return of just 1 percent. Chart I-4We Must Mathematically Map The Earnings Yield Into A Prospective Return...
We Must Mathematically Map The Earnings Yield Into A Prospective Return...
We Must Mathematically Map The Earnings Yield Into A Prospective Return...
Having translated the earnings yield into a prospective 10-year nominal return of 1 percent, we can now make an apples-for-apples comparison with the 10-year T-bond yield of 1.3 percent (Chart I-5). Chart I-5...And Only Then Subtract The Bond Yield
...And Only Then Subtract The Bond Yield
...And Only Then Subtract The Bond Yield
Derived correctly therefore, the equity risk premium has turned negative for the first time since 2002 (Chart of the Week). We deduce that the equity market is very richly valued both in absolute terms and relative to bonds. And crucially, that this rich valuation is contingent on bond yields remaining ultra-low, or going even lower. Shorting Bonds Yielding 2 Percent Is A ‘Widow Maker’ All of which brings us to one of the most pressing questions we get from clients. When a bond is offering a feeble yield, what is the point in owning it? Maybe the best people to answer are the casualties of the now infamous ‘widow maker’ trades. The original widow maker trade was the idea that the yield on the Japanese Government Bond (JGB), at 2 percent, was so feeble that there was no point in owning it. Furthermore, with massive Japanese fiscal stimulus coming down the pike, the ‘no-brainer’ investment strategy was not just to disown the JGBs, but to take an outright short position, as it seemed that the only direction that JGB yields could go was up. In fact, JGB yields did not go up, they continued to trend down. As feeble yields became even feebler, the owners of the short positions got carried out of their careers, feet first. Meanwhile, those investors who owned 30-year JGBs yielding a ‘feeble’ 2 percent in 2013 reaped returns of 75 percent, and even now, are sitting on handsome profits of 55 percent. Some people protest that Japan is an exceptional and isolated case, rather than a template for economies which will not repeat their putative policy-errors. Such protests have always struck us as factually wrong, blinkered, and even prejudiced. Nevertheless, let’s indulge these prejudices with a simple rejoinder – forget Japan, what about Switzerland, or the UK? (Chart I-6) Chart I-6Shorting Bonds Yielding 2 Percent Is A 'Widow Maker'
Shorting Bonds Yielding 2 Percent Is A 'Widow Maker'
Shorting Bonds Yielding 2 Percent Is A 'Widow Maker'
Just like the JGB widow maker, anybody who shorted UK gilts yielding 2 percent is nursing heavy losses. Meanwhile, those investors who owned 30-year UK gilts yielding a ‘feeble’ 2 percent in 2018 reaped returns of 40 percent, and even now are sitting on tidy profits of 30 percent. Just like the JGB widow maker, anybody who shorted UK gilts yielding 2 percent is nursing heavy losses. Bear in mind that a 30-year bond yielding a feeble 2 percent will deliver a cumulative return of more than 80 percent to redemption. And that if the feeble yield becomes even feebler, this return will get front-end loaded, creating widow makers for the short positions and spectacular gains for the long positions, as witnessed in JGBs and UK gilts. The 30-Year T-Bond Is A Must-Own Structural Investment The next candidate for the widow maker is shorting the US 30-year T-bond, which is yielding, you guessed it, 2 percent. Remember that while Japan may not be a great template for the US, the UK certainly is – because the US and UK have very similar economic, financial, political, social, and cultural structures. Until recently therefore, bond yields in the US and UK were moving in near-perfect lockstep (Chart I-7). Chart I-7The Difference Between US And UK Bond Yields Is Just That The UK Has Had One More Deflationary Shock
The Difference Between US And UK Bond Yields Is Just That The UK Has Had One More Deflationary Shock
The Difference Between US And UK Bond Yields Is Just That The UK Has Had One More Deflationary Shock
So, what happened? The one word answer is: Brexit. The recent difference between US and UK bond yields is simply that the UK has had one more deflationary shock than the US. Put the other way around, the US is just one deflationary shock away from a UK level of bond yields – meaning the 30-year yield not at 2 percent, but at 1 percent. But why can’t the next shock be an inflationary shock resulting in much higher yields? The simple answer is that the equity risk premium has turned negative for the first time since 2002. Moreover, as we pointed out in The Road To Inflation Ends At Deflation the extremely rich valuation of $300 trillion of global real estate is also highly contingent on ultra-low bond yields. It follows that any significant rise in bond yields will collapse the value of $500 trillion of risk-assets. In a $90 trillion global economy, this will quickly flip any incipient inflationary shock into a deflationary shock. Any significant rise in bond yields will collapse the value of $500 trillion of risk-assets. We conclude that the US 30-year T-bond is a must-own structural investment. Fractal Analysis Update As hospitals have rushed to clear their backlog of non-pandemic treatments and procedures, medical equipment stock prices have surged. This is particularly true for US medical equipment (ticker IHI) which, since June, is up by 25 percent versus US healthcare services (Iqvia, Veeva, or loosely proxied by ticker XHS). Given that the backlog of treatments will eventually clear, and that the intense rally is now extremely fragile on its 65-day fractal structure (Chart I-8), a recommended countertrend trade is to short US medical equipment versus healthcare services. Set the profit target and symmetrical stop-loss at 8.5 percent. Chart I-8The Intense Rally In Medical Equipment Stocks Has Become Fragile
The Intense Rally In Medical Equipment Stocks Has Become Fragile
The Intense Rally In Medical Equipment Stocks Has Become Fragile
Dhaval Joshi Chief Strategist dhaval@bcaresearch.com Fractal Trading System Fractal Trades 6-Month Recommendations Structural Recommendations Closed Fractal Trades Closed Trades Asset Performance Equity Market Performance Indicators To Watch - Bond Yields Chart II-1Indicators To Watch - Bond Yields ##br##- Euro Area
Indicators To Watch - Bond Yields - Euro Area
Indicators To Watch - Bond Yields - Euro Area
Chart II-2Indicators To Watch - Bond Yields ##br##- Europe Ex Euro Area
Indicators To Watch - Bond Yields - Europe Ex Euro Area
Indicators To Watch - Bond Yields - Europe Ex Euro Area
Chart II-3Indicators To Watch - Bond Yields ##br##- Asia
Indicators To Watch - Bond Yields - Asia
Indicators To Watch - Bond Yields - Asia
Chart II-4Indicators To Watch - Bond Yields ##br##- Other Developed
Indicators To Watch - Bond Yields - Other Developed
Indicators To Watch - Bond Yields - Other Developed
Indicators To Watch - Interest Rate Expectations Chart II-5Indicators To Watch - Interest Rate Expectations
Indicators To Watch - Interest Rate Expectations
Indicators To Watch - Interest Rate Expectations
Chart II-6Indicators To Watch - Interest Rate Expectations
Indicators To Watch - Interest Rate Expectations
Indicators To Watch - Interest Rate Expectations
Chart II-7Indicators To Watch - Interest Rate Expectations
Indicators To Watch - Interest Rate Expectations
Indicators To Watch - Interest Rate Expectations
Chart II-8Indicators To Watch - Interest Rate Expectations
Indicators To Watch - Interest Rate Expectations
Indicators To Watch - Interest Rate Expectations
Feature Chart 1Chinese Offshore Stocks Tumbled Amid Regulatory Crackdowns
Chinese Offshore Stocks Tumbled Amid Regulatory Crackdowns
Chinese Offshore Stocks Tumbled Amid Regulatory Crackdowns
Relative to the global equity index, onshore and offshore Chinese stocks have fallen by 18% and 32%, respectively, since their peaks in mid-February (Chart 1). The panic sell-off in the offshore market, which saw greater losses due to its high concentration in internet stocks, appears to be overdone and may technically rebound in the near term. However, any short-term bounce in Chinese stocks from oversold levels will likely be short-lived (Chart 2). The crackdown on new economy companies reflects socio-political and economic shifts in China, which raises the odds that the restrictions will continue with further actions focused on social welfare and healthcare. August’s official PMIs and economic data indicate a broad-based softening in China’s domestic demand and production. However, compared with 2018/19 when the US-China trade war exacerbated the deterioration in an already slowing economy, the economy now remains well supported by strong exports. Moreover, the magnitude of the slowdown has not exceeded policymakers’ pain thresholds (Chart 3). Chart 2Tactical Bounce Was Short-Lived In Previous Downturns
Tactical Bounce Was Short-Lived In Previous Downturns
Tactical Bounce Was Short-Lived In Previous Downturns
Chart 3China's Economic Recovery Losing Steam, But From An Elevated Level
China's Economic Recovery Losing Steam, But From An Elevated Level
China's Economic Recovery Losing Steam, But From An Elevated Level
In 2018/19, stimulus was measured and the authorities did not meaningfully relax limits on bank lending standards and shadow banking. Furthermore, China recently reiterated its cross-cycle macro policy setting, which means that policymakers will not use significant stimulus to achieve high and short-term economic growth. Given financial stability measures that aim to contain risks associated with the housing market and hidden local government debt, any monetary and fiscal easing will likely help to stabilize credit growth instead of substantially boosting it this year. For the time being, China’s financial assets continue to face downside risks stemming from a confluence of a weakening business cycle and ongoing regulatory tightening. Thus, we recommend investors maintain an underweight allocation to Chinese equities within a global equity portfolio. Qingyun Xu, CFA Associate Editor qingyunx@bcaresearch.com A Shining Moment For Chinese Small And Medium Caps Small and medium-cap (SMID-cap) stocks have outperformed large-caps since February and the recent regulatory restrictions have intensified the situation. The CSI500 index, which comprises 500 SMID-cap companies, has outperformed the large-cap CSI300 by 34% since mid-February (Chart 4, top panel). Uncertainties surrounding the pandemic and corporate earnings growth have fueled extreme dislocations between large-cap and SMID-cap stocks last year. Large-cap stocks were the main contributors to China’s stock rallies in the second half of last year, while the valuation premia in small cap stocks was compressed to near decade lows (Chart 4, bottom panel). Chart 4A Low Valuation Premia And More Policy Support May Further Lift Prices Of SMID-Caps
A Low Valuation Premia And More Policy Support May Further Lift Prices Of SMID-Caps
A Low Valuation Premia And More Policy Support May Further Lift Prices Of SMID-Caps
Chart 5SMID-Caps Tend To Outperform Large-Caps In Late Business Cycle
SMID-Caps Tend To Outperform Large-Caps In Late Business Cycle
SMID-Caps Tend To Outperform Large-Caps In Late Business Cycle
Historically, SMID-caps tend to outperform large-caps in the late cycle of an economic recovery (Chart 5). The spate of regulatory changes aimed at monopolistic behaviors in various sectors has curbed investors’ appetite for the industry leaders. In addition, the government’s increasing efforts to support small and medium corporates (SMEs) will help to shore up confidence in those companies. Therefore, small and medium caps will likely continue to outperform large-cap stocks this year. Fiscal Support: How Much Room In 2H? The July Politburo meeting pledged more fiscal support for the economy later in 2021 and into 2022. We expect local government bond (LGB) issuance to accelerate: a 4.47 trillion RMB new local government bond issuance quota was approved for 2021, including 820 billion in general bonds and 3.65 trillion in special purpose bonds (SPBs). By end-August, 2.37 trillion new local government bonds had been issued, which was only 53% of the entire year’s goal. However, there are some constraints that will likely reduce the reflationary effects on the economy. First, the quota for LGB issuance approved by the National People’s Congress is 16% lower than last year, but the amount of LGBs maturing this year is 30% higher. Therefore, even though this year’s gross LGB issuance has kept pace with that of last year, more than half of the LGBs issued from January to August was used for debt repayment (Chart 6). The move by local governments to use a large portion of their bond issuance quota to pay off existing debt resembles the situation in 2018 when a financial de-risking campaign encouraged local governments to reduce the stockpile of their leverage. As noted in last week’s report, infrastructure investment and the economy did not rebound in 2H2018, even though LGB issuance picked up (Chart 7). Chart 6More Than Half Of LGBs Issued This Year Has Been Used For Debt Repayment
Chinese Small And Medium Caps Are Finding Their Shining Moment
Chinese Small And Medium Caps Are Finding Their Shining Moment
Chart 7Improvement In Infrastructure Investment Was Short-Lived In 2019
Improvement In Infrastructure Investment Was Short-Lived In 2019
Improvement In Infrastructure Investment Was Short-Lived In 2019
Even if we assume that local governments will use all of their remaining bond quota by year end, the gross monthly average in local government bond issuance will be around 580 billion, only slightly higher than in 2H 2020. Secondly, infrastructure investment is discouraged by stringent regulations to approve projects (including project assessment and debt repayment ability) and the accountability of local officials for project failures. Approvals for infrastructure projects remain at the lowest level since March last year (Chart 8). Finally, SPBs made up only about 15% of overall infrastructure spending in the past three years, while the majority came from public-private partnerships (PPP) financing, revenues from government-managed funds, government budgets and bank loans. Falling proceeds from land transfers have dragged down government-managed funds (Chart 9). In addition, government expenditures show no signs of a material increase (Chart 9, bottom panel). Chart 8Infrastructure Investment Will Remain Subdued
Infrastructure Investment Will Remain Subdued
Infrastructure Investment Will Remain Subdued
Chart 9Government Expenditures Remain Muted
Government Expenditures Remain Muted
Government Expenditures Remain Muted
As discussed in previous reports, local government bonds issuance only accounts for 12% of total social financing. As such, without a sizeable acceleration in bank loans, enhanced LGB issuance would not be enough to prompt a substantial increase in infrastructure investment growth. Our argument is underscored by the structural downshift in infrastructure investment since 2017 (Chart 7, top panel). Therefore, additional local government bond issuance this year will help to stabilize but not boost credit growth. August PMIs Confirm Slowing Economic Activity China's official PMIs eased further in August. The non-manufacturing index fell to contractionary territory of 47.5, below the expectation of a more muted 1.3-point decline to 52.0. Similarly, the manufacturing PMI eased by 0.3 points to 50.1, which is a hair above the 50 boom-bust line. Together, weakness in both sectors pushed down the composite index to 48.9 (Chart 10). Stringent restrictions designed to halt rising rates in COVID-19 infections explain much of the deterioration in China’s service-sector activity. The sector will likely rebound in September with the easing in infection levels (Chart 11). Chart 10PMIs Show Slowing Economic Activity
PMIs Show Slowing Economic Activity
PMIs Show Slowing Economic Activity
Chart 11Lingering COVID Effects Curb Service-Sector Recovery In 2H21
Lingering COVID Effects Curb Service-Sector Recovery In 2H21
Lingering COVID Effects Curb Service-Sector Recovery In 2H21
Meanwhile, the construction PMI surprisedly rebounded sharply in August (Chart 10, bottom panel). However, investors should be cautious not to read too much into the idiosyncratic month-on-month moves suggested by the construction PMI. Instead, construction activity has moderated significantly and is set to slow further, hinting at plunged excavator sales and real estate investment in construction (Chart 12). Chart 12Construction Activity Is Unlikely To Pick Up Meaningfully This Year
Construction Activity Is Unlikely To Pick Up Meaningfully This Year
Construction Activity Is Unlikely To Pick Up Meaningfully This Year
It is clear that China’s economy is losing momentum, but greater economic weakness will be needed for policymakers to stimulate meaningfully. Export Sector Remains A Bright Spot China’s exports remain robust. Export growth picked up in August from July on a year-over-year basis. Although the improvement in August reflects a base effect, exports in level reached a new high (Chart 13). Both skyrocketed exports container freight index and strong Korean exports suggest that global demand for Chinese manufacturing goods remains resilient (Chart 14). Even though manufacturing PMIs from developed markets have rolled over, they remain elevated and should continue to support China’s exports (Chart 15). Chart 13Chinese August Exports In Level Reached A New High
Chinese Small And Medium Caps Are Finding Their Shining Moment
Chinese Small And Medium Caps Are Finding Their Shining Moment
Chart 14Exports Will Remain Robust In The Rest Of The Year...
Exports Will Remain Robust In The Rest Of The Year...
Exports Will Remain Robust In The Rest Of The Year...
In contrast to resilient exports, China’s official PMI export new orders subindex has declined for five consecutive months. Even though falling PMI new export orders subindex heralds a slowing in exports growth, a reading of below the 50 boom-bust threshold in the former does not suggest a contraction in the growth rate of the latter. Furthermore, the month-over-month nature of PMI new export orders subindex tends to overstate the volatility in exports. The divergence between the PMI new export orders subindex and real export growth also occurred in 2018/19 during the height of the US-China trade war when export orders were volatile (Chart 16). Chart 15...And Will Continue To Benefit From Strong Global Demand
...And Will Continue To Benefit From Strong Global Demand
...And Will Continue To Benefit From Strong Global Demand
Chart 16A Divergence Between PMI New Export Orders And Export Growth
A Divergence Between PMI New Export Orders And Export Growth
A Divergence Between PMI New Export Orders And Export Growth
Regulatory Tightening In Real Estate Sector Stringent regulations in housing since the beginning of the year have started to cool the sector (Chart 17). However, home prices inflation in tier-one cities is still elevated (Chart 18). Thus, we expect the controls on housing and among property developers will remain in place for the next 6 to 12 months. Chart 17Housing Sector Is Cooling...
Housing Sector Is Cooling...
Housing Sector Is Cooling...
Chart 18...But Housing Prices In First-Tier Cities Keep Rising At A Faster Rate
...But Housing Prices In First-Tier Cities Keep Rising At A Faster Rate
...But Housing Prices In First-Tier Cities Keep Rising At A Faster Rate
Industrial Profits: Rising Prices, Falling Production China’s industrial profit growth remained solid in July despite the waning low base effect. Manufacturing producer prices continued to rise, offsetting weaker production growth (Chart 19). In addition, a low interest-rate environment helped to lift profits in the manufacturing sector by reducing debt servicing costs. While we expect weakening domestic demand and peaking producer prices to weigh on corporate profits in the rest of this year, profit growth is rolling over from a lofty height and will not likely drop sharply in the coming months (Chart 20). In addition, producer prices will likely remain at a historically high level in the next six months given robust global demand for raw materials and persistent global supply shortages. Chart 19Rising Prices And Low Interest Rates Helped To Offset Falling Industrial Production
Rising Prices And Low Interest Rates Helped To Offset Falling Industrial Production
Rising Prices And Low Interest Rates Helped To Offset Falling Industrial Production
Chart 20Peaking Producer Prices Will Weigh On Corporate Profits
Peaking Producer Prices Will Weigh On Corporate Profits
Peaking Producer Prices Will Weigh On Corporate Profits
Meanwhile, there is a large gap between the prices for producer goods and consumer goods, suggesting that manufacturers in mid-to-downstream industries have not been able to fully pass on rising input costs to domestic consumers (Chart 21). Profit growth continues to be disproportionally stronger in the upstream industrial producers than in the downstream industries, while the profit margin in the manufacturing sector remains much more muted (Chart 22). Chart 21Inflation Passthrough From Manufacturers To Domestic Consumers Remains Limited
Inflation Passthrough From Manufacturers To Domestic Consumers Remains Limited
Inflation Passthrough From Manufacturers To Domestic Consumers Remains Limited
Chart 22Profit Growth In Upstream Industries Still Outpaces Manufacturing Sector
Profit Growth In Upstream Industries Still Outpaces Manufacturing Sector
Profit Growth In Upstream Industries Still Outpaces Manufacturing Sector
Table 1
Chinese Small And Medium Caps Are Finding Their Shining Moment
Chinese Small And Medium Caps Are Finding Their Shining Moment
Table 2
Chinese Small And Medium Caps Are Finding Their Shining Moment
Chinese Small And Medium Caps Are Finding Their Shining Moment
Footnotes Market/Sector Recommendations Cyclical Investment Stance
Highlights Economic policy uncertainty is rising in the US and will generate volatility this fall. But by the end of the year the result should be more fiscal reflation. Biden’s approval rating is now “underwater” – net negative – but this was expected. Unless he suffers another black eye, he can still shepherd his two big bills through Congress by year’s end. Public support for Biden’s tax hikes is weak. Some tax hikes are likely but aggressive hikes are now off the table. The midterm elections were already likely to produce a Republican win in the House. History supports this consensus. But the Senate is still an open game. The presidential election outlook is only marginally affected, at most, by the messy Afghanistan pullout. Value stocks are re-testing their low point against growth stocks. We do not expect them to break down when Congress is about to pass historic new spending increases. Feature Economic policy uncertainty is reviving in the US and set to increase this fall. This is true in absolute terms and relative to global uncertainty, even at a time when China’s sweeping regulatory crackdown is generating a lot of global uncertainty (Chart 1). Chart 1US Relative Policy Uncertainty Reviving
US Relative Policy Uncertainty Reviving
US Relative Policy Uncertainty Reviving
Chart 2Policy Uncertainty Breakdown
Policy Uncertainty Breakdown
Policy Uncertainty Breakdown
The latest increase in the policy uncertainty index is largely driven by rising uncertainty over future government spending (Chart 2, panel 2) and expiring tax provisions (Chart 2, panel 3), more so than by public sentiment reflected in the mainstream media or even the inflation debate. The looming budget battle this fall will have major implications for taxes and spending and will lift the uncertainty indicators regarding sentiment and consumer prices. Volatility will ensue in the coming months. But by the end of the year, Congress will have passed at least one, likely two, new laws that will increase government fiscal support for the economy and dispel deflationary tail risks. The lingering pandemic will if anything help concentrate lawmakers’ minds on passing more stimulus. Therefore we expect US equities and cyclical sectors to grind higher. The passage of these bills will mark the high point in policy reflation, after which clouds will loom on the horizon in 2022. Biden’s Net Negative Approval Rating President Biden’s job approval rating is now officially “underwater” – more people disapprove of his leadership than approve (Table 1). This is raising serious doubts about his ability to shepherd legislation through Congress this fall. However, these doubts are overrated. Table 1Biden’s Net Approval Is Officially Negative
Biden Is Underwater But His Legislation Will Float
Biden Is Underwater But His Legislation Will Float
Biden’s approval has mostly fallen due to his mishandling of the US military’s withdrawal from Afghanistan – which most Americans agree was necessary, however much they deplored the commander-in-chief’s handling of it. Therefore Biden’s approval rating will not fall much farther – at least not until he suffers another black eye. Until that happens, Biden’s approval will stabilize in the range of Obama’s and above Trump’s. The reason is that he retains a solid political base of support – and his political base is larger than President Trump’s, so his general approval will stay higher. Indeed his approval is still stronger than Obama’s among Democrats (Charts 3A and 3B). This is counterintuitive since Obama was a charismatic, young, and progressive Democrat. The reason is that Democrats are still very cognizant and fearful of the alternative: President Trump. This anti-Trump tailwind will help Biden for some time. Support among Democrats is critical for maintaining party discipline in passing the reconciliation bill this fall. It is also important for the midterm elections. Chart 3ABiden’s Job Approval Collapses
Biden Is Underwater But His Legislation Will Float
Biden Is Underwater But His Legislation Will Float
Chart 3BBiden’s Approval Holding Up Among Democrats
Biden Is Underwater But His Legislation Will Float
Biden Is Underwater But His Legislation Will Float
On specific issues, Biden is weaker than Obama on foreign policy and than Trump on the economy (Charts 4A and 4B). The economy will remain the central concern, notwithstanding Afghanistan, and on this front Biden should stabilize or improve. However, other foreign policy issues could rise to the fore and hurt him at any time given today’s fraught geopolitical environment. Chart 4ABiden’s Falling Approval On Economy
Biden Is Underwater But His Legislation Will Float
Biden Is Underwater But His Legislation Will Float
Chart 4BBiden’s Falling Approval On Foreign Policy
Biden Is Underwater But His Legislation Will Float
Biden Is Underwater But His Legislation Will Float
We say Biden’s score on the economy will improve because consumer confidence will rebound once the Delta variant of COVID-19 subsides (Chart 5). Both manufacturing and service sectors are performing better than when Biden was elected and employment is holding up in both sectors. The new orders-to-inventories measures suggest the service sector will continue to improve (Chart 6). The headline unemployment rate has dropped to 5.2%. Chart 5Consumer Confidence Should Support Biden
Consumer Confidence Should Support Biden
Consumer Confidence Should Support Biden
Chart 6PMIs Also Offer Some Support For Biden
PMIs Also Offer Some Support For Biden
PMIs Also Offer Some Support For Biden
Given the above, Biden still has enough clout to steer his signature legislation through Congress this fall, albeit with major modifications to his unwieldy $3.5 trillion American Families Plan. Moderate Democratic Senator Joe Manchin of West Virginia has called for a pause in new big spending legislation, but a close look at his words shows that he does not oppose the bill, he merely wants to water it down, which is not a change from his earlier position.1 He speaks for other moderates. The left-wing faction led by Senator Bernie Sanders of Vermont will make counter-threats yet ultimately has no choice other than to support the most progressive social legislation in recent memory. The bill will be watered down. Could this watering down process result in a total jettison of the Democrats’ proposed tax hikes? The Wall Street Journal reports that congressional support for tax hikes is losing steam.2 While aggressive tax hikes are off the table, we highly doubt that all tax hikes will be removed. Financial markets have not responded much to the threat of higher taxes. Small business owners, who are most sensitive to the risk of new taxes and regulation imposed by Democrats, have not shown much concern for either issue this year – they are much more worried about inflation (Chart 7). We assume the equity market would rally if tax hikes were dropped but we do not think this is likely to happen. Americans support higher taxes – but only Democrats are enthusiastic about across-the-board hikes on individuals, corporations, and capital gains. Polls show that 59% of independent voters, not to mention Democrats, support higher taxes on high-income earners, although the proposed 28% corporate is increasingly likely to be cut down (Chart 8). This is the fundamental reason for investors to expect Democrats to band together in the eleventh hour and include tax hikes in their reconciliation bill. If nothing else, a partial reversal of President Trump’s Tax Cut and Jobs Act will be necessary to give a veneer of affordability to Biden’s giant spending bill to get it past Senate moderates. Chart 7Business Will Worry About Tax Hikes When (If) They Pass
Business Will Worry About Tax Hikes When (If) They Pass
Business Will Worry About Tax Hikes When (If) They Pass
Chart 8Look Out: Americans Support Higher Taxes
Biden Is Underwater But His Legislation Will Float
Biden Is Underwater But His Legislation Will Float
The impact of Biden’s corporate tax hike is expected to be a 5%-8% one-off hit to corporate earnings, according to our Global Investment Strategy. The impact could be less than that but the combination of popular opinion and the Democratic Party’s need to finance their social agenda suggests that investors should plan for the worst, which in this case is not that bad – key tax rates will still be lower than they were under President Obama. The chief risk to Biden’s legislation is that passing the bipartisan infrastructure bill (80% subjective odds) consumes so much political capital that there is not enough left for Biden’s reconciliation bill (50%-65% subjective odds, depending on circumstances). This is possible. Congressional Democrat leaders want to tie these two bills together but most likely the quick success of infrastructure, which is more popular than social welfare, will lead Democrats to conclude that a bird in the hand is worth two in the bush. They will pass infrastructure on less-than-perfect assurances from Senate moderates that they will support reconciliation. Then a separate battle over reconciliation will ensue, in which Biden must cajole the left-wing and moderate factions of his party into a “yea” vote while Republicans obstruct. The second major risk to Biden’s legislation – and the macro backdrop – comes if he mismanages foreign policy more generally, such as with the looming crisis over Iran. A foreign policy failure beyond Afghanistan could cause permanent damage to his political capital. And yet Democrats would be even more desperate for a legislative victory then, as they would face a wipeout in the midterm elections if they had no legislative victories and two foreign policy humiliations. In other words, Biden is nowhere near so unpopular that moderate Democrats will abandon his signature legislative agenda and condemn their party and his administration to a heavy defeat in 2022. Bottom Line: Biden’s legislation will pass, including some tax hikes. The revised magnitude of tax hikes will not be known until later this fall when the Senate and House start producing legislative text. Policy uncertainty and equity volatility will trend upward this fall but the end-game is more reflationary policy, which should keep equities grinding higher at least through Christmas. Midterm Elections: The Best Case For Democrats Is Not Good Enough Are Republicans more likely to take Congress now that Biden’s approval is underwater? How would this impact the policy and macroeconomic outlook? While Republicans are highly likely to retake the House of Representatives, the Senate is still slightly tipped for the Democrats. Biden would have to fail to pass legislation or commit another major policy mistake to give Republicans full control of Congress, although this outcome is slightly favored in online betting markets. The House currently consists of 220 Democrats and 212 Republicans. There is always some fluctuation in the exact numbers. Three vacancies should be filled in November’s special elections, which could bring the count to 222 Democrats and 213 Republicans.3 With 218 votes needed to pass legislation on an absolute majority vote, Democrats can only afford to lose three votes at present. This is an extremely tight margin and shows that this fall’s reconciliation bill is at risk in the House as well as the Senate. In the midterm elections, Republicans only need to take five-to-six seats to regain the majority (218). This is easy on paper: the average seat gain for the opposition in midterm House elections is 35. Biden’s latest approval rating puts Democrats in line to lose 37 seats based on history. The opposition typically makes gains in the midterm because it is fired up whereas the presidential party is complacent. In addition Republicans are expected to gain two seats (possibly as many as four) via gerrymandering in 2022. True, Democrats have some underrated supports in 2022. In all probability the pandemic will be waning while the economy will be waxing. Biden will likely have passed at least a bipartisan infrastructure deal. The divisions within Republican ranks over Trumpism will also persist, which may or may not increase Democratic turnout and vote-switching from suburban Republicans. Hence it is reasonable to ask whether Democrats could surprise to the upside and retain the House. Online betting markets put the probability at 29%, and these odds make sense to us. The historical record helps to define what kind of events might alter the outlook for the midterms. Table 2 shows the midterm elections in which the presidential party performed best (the opposition party disappointed the historical norm). The following points are salient: Table 2Best-Case Outcomes For Presidential Party In Midterm Elections
Biden Is Underwater But His Legislation Will Float
Biden Is Underwater But His Legislation Will Float
There are only two cases in which the presidential party gained seats (Clinton 1998, Bush 2002) and three cases in which they only lost a few seats (Kennedy 1962, Reagan 1986, arguably Bush 1990). The Democratic victory of 1998 occurred at the top of an economic boom while the Republican victory of 2002 occurred one year after the 9/11 terrorist attacks. Neither is likely to be replicated for Democrats in 2022. Republicans’ mild losses in 1990 occurred just after Iraq invaded Kuwait. Republican’s mild losses in 1986 occurred despite a big legislative victory (tax reform). If either of the last two scenarios played out for Democrats in 2022, Democrats would likely lose the House by a whisker. Only if the Democrats’ 1962 scenario played out would Democrats retain the House in 2022, and only by a single seat. Yet the 1962 election occurred in the midst of the Cuban Missile Crisis! The takeaway is that a foreign policy crisis could help Democrats pare their losses in the midterms if Biden is deemed to have handled the crisis adroitly. But even then the ruling party would likely lose the House judging by history. Needless to say these are just historical examples. They also show that Democratic fortunes could turn around drastically between now and next fall (e.g. Kennedy went from a recession and the Bay of Pigs fiasco to gaining his party seats). The Senate outlook is less straightforward. Biden’s approval rating suggests a loss of four seats for Democrats based on the historical pattern. But the same pattern suggested Republicans would lose four seats in 2018 and instead they gained two. Our quantitative Senate election model, which we update every week in the Appendix, still tips the Democrats to gain one seat (a 51-49 majority) or at least retain their de facto one seat majority (50-50). Chart 9Presidential Vetoes In History
Biden Is Underwater But His Legislation Will Float
Biden Is Underwater But His Legislation Will Float
What are the macroeconomic implications? A Republican House and Democratic White House would play “constitutional hardball,” just as occurred from 2011-14, given that the country is still at historically peak levels of political polarization.4 There are likely to be critical differences between 2011 and 2023 – populism has fundamentally weakened support for fiscal austerity – but the most likely result is gridlock and deadlock. Republicans will not be able to slash spending or cut taxes as Biden will have the presidential veto, but Democrats will not be able to increase spending or hike taxes (Chart 9). The problem for Biden would be the need to avoid a national default when and if the Republicans insist on spending cuts to raise the debt ceiling. The looming debt ceiling showdown this fall will increase uncertainty and volatility but ultimately Democrats have the votes to avoid a default. That would not necessarily be the case if Republicans controlled the House. And this time around Republicans could be driven to impeach the president, for whatever reason, in retaliation for President Trump’s impeachment in 2019. This situation obviously cannot be ruled out, even though it would be virtually impossible for the Senate to convict. At the same time, some bipartisanship could occur, as it did under Trump following the 2018 midterms. Anti-trust legislation and immigration reform are the two most important policy areas to watch on this front. Republican gains in Congress would marginally weaken the Democrats’ hold on the White House in 2024, though we continue to believe that Democrats are favored. American voters are likely to be better off in November 2024 than they were in November 2020, amid a pandemic, recession, and nationwide social unrest. Our quantitative model tips Democrats with 308 electoral votes (Appendix). Professor Allan Lichtman’s “13 Keys” to the presidency – a nearly flawless prediction system since 1984 – currently suggest that the Democrats only have three keys turned against them. They would need to see six or more in order to lose the White House (Table 3). Obviously the long-term status of the economy will be a critical factor (Chart 10). Table 3Lichtman’s Keys To The Presidency (Updated Sept 2021)
Biden Is Underwater But His Legislation Will Float
Biden Is Underwater But His Legislation Will Float
Chart 10Will Biden's Economy Grow Faster Than That Of His Two Predecessors?
Will Biden's Economy Grow Faster Than That Of His Two Predecessors?
Will Biden's Economy Grow Faster Than That Of His Two Predecessors?
Bringing it all together, US fiscal policy has taken a more proactive turn but it is still likely to freeze after this fall. It will be hard to pass major budget bills in 2022 ahead of the election and gridlock is the likeliest outcome, making 2025 the next realistic chance for major fiscal changes. The immediate implication is that Biden and Democratic leaders will have to disconnect the bipartisan infrastructure bill from the partisan social welfare reconciliation bill this autumn. This will require a major concession from House Speaker Nancy Pelosi. Otherwise both bills could collapse and with them the Democratic Party’s fortunes. Biden and moderate Democrats that face competitive races in 2022 will demand a quick victory before moving onto the less popular part. Investment Takeaways Value stocks are re-testing their cycle lows against growth stocks (Chart 11). The Delta variant and global growth jitters continue to weigh on this trade. Chart 11S&P Value Re-Tests Lows Versus Growth
S&P Value Re-Tests Lows Versus Growth
S&P Value Re-Tests Lows Versus Growth
The S&P 500’s “Big Five” are rallying and outperforming the other 495 companies once again (Chart 12). Chart 12S&P 5 Recovery Versus 495
S&P 5 Recovery Versus 495
S&P 5 Recovery Versus 495
We expect politically induced volatility throughout the fall but we also expect it to be resolved in new and reflationary legislation. Signs that Biden’s legislation will pass should enable cyclical sectors and value stocks to recover, though the pandemic, global growth, and Chinese stability may prevent them from outperforming defensive sectors and growth stocks. A new set of hurdles will face markets if Republicans regain the House and halt fiscal easing from 2022-24. However, they will not be rewarded by voters if they create a fiscal or economic crisis, implying that the proactive fiscal turn in public opinion will prevail over the long run. If Biden’s legislation fails then it suggests that US fiscal policy is dysfunctional even under single-party control. This would heighten the deflationary tail risk and force us to reassess our macro and policy outlook. Matt Gertken Vice President Geopolitical Strategy mattg@bcaresearch.com Appendix Table A1USPS Trade Table
Biden Is Underwater But His Legislation Will Float
Biden Is Underwater But His Legislation Will Float
Table A2Political Risk Matrix
Biden Is Underwater But His Legislation Will Float
Biden Is Underwater But His Legislation Will Float
Chart A1Presidential Election Model
Biden Is Underwater But His Legislation Will Float
Biden Is Underwater But His Legislation Will Float
Chart A2Senate Election Model
Biden Is Underwater But His Legislation Will Float
Biden Is Underwater But His Legislation Will Float
Table A3Political Capital Index
Biden Is Underwater But His Legislation Will Float
Biden Is Underwater But His Legislation Will Float
Table A4APolitical Capital: White House And Congress
Biden Is Underwater But His Legislation Will Float
Biden Is Underwater But His Legislation Will Float
Table A4BPolitical Capital: Household And Business Sentiment
Biden Is Underwater But His Legislation Will Float
Biden Is Underwater But His Legislation Will Float
Table A4CPolitical Capital: The Economy And Markets
Biden Is Underwater But His Legislation Will Float
Biden Is Underwater But His Legislation Will Float
Footnotes 1 See Senator Joe Manchin, “Why I Won’t Support Spending Another $3.5 Trillion,” Wall Street Journal, September 2, 2021, wsj.com. 2 Richard Rubin, “Progressives’ Tax-The-Rich Dreams Fade As Democrats Struggle For Votes,” Wall Street Journal, September 5, 2021, wsj.com. 3 The three special House elections are: Florida’s 20th District, previously Democratic held; Ohio’s 11th District, previously Democratic held; Ohio’s 15th District, previously Republican held. 4 See Mark V. Tushnet, “Constitutional Hardball,” John Marshall Legal Review 37 (2004), pp. 523-53, scholarship.law.georgetown.edu.
Highlights Chart 1Employment Growth Will Rebound
Employment Growth Will Rebound
Employment Growth Will Rebound
August’s weak employment growth reflects the surge of Delta variant COVID cases in the United States. This is evidenced by the fact that Leisure & Hospitality sector payrolls held flat in August after having grown by 415k in July and 397k in June (Chart 1). While Delta could still be a drag on employment growth for another month or two, there is mounting evidence that the daily new case count is close to its peak. Leisure & Hospitality employment growth will regain its prior pace as new Delta cases trend down. This will lead to a resumption of strong monthly payroll reports (500k – 1000k) as we head into the new year. For monetary policy, we calculate that average monthly nonfarm payroll growth of 414k will be sufficient for the Fed to start rate hikes before the end of 2022 (bottom panel). We anticipate that this threshold will easily be met. The Treasury curve will bear-flatten as employment growth improves and the market prices-in an earlier start and quicker pace of Fed rate hikes. Investors should maintain below-benchmark portfolio duration and stay short the 5-year Treasury note versus a duration-matched 2/10 barbell. Feature Table 1Recommended Portfolio Specification
The Delta Drag
The Delta Drag
Table 2Fixed Income Sector Performance
The Delta Drag
The Delta Drag
Investment Grade: Neutral Chart 2Investment Grade Market Overview
Investment Grade Market Overview
Investment Grade Market Overview
Investment grade corporate bonds underperformed the duration-equivalent Treasury index by 5 basis points in August, dragging year-to-date excess returns down to +166 bps. The combination of above-trend economic growth and accommodative monetary policy supports continued positive excess returns for spread product versus Treasuries. At 91 bps, the 3-year/10-year Treasury slope remains steep. This is a strong signal that monetary conditions are accommodative. But despite the positive macro back-drop, investment grade valuations are extremely tight (Chart 2). A recent report looked at what different combinations of Treasury slope and corporate spreads have historically signaled for corporate bond excess returns.1 It shows that tight corporate spreads only correlate with negative excess returns once the 3-year/10-year Treasury slope is below 50 bps. Though we retain a positive view of spread product as a whole, better value can be found outside of the investment grade corporate sector. Specifically, we recommend that investors shift into high-yield corporates, municipal bonds and USD-denominated Emerging Market sovereigns and corporates. We also advise investors to favor long-maturity corporate bonds and those corporate sectors with elevated Duration-Times-Spread.2 Table 3ACorporate Sector Relative Valuation And Recommended Allocation*
The Delta Drag
The Delta Drag
Table 3BCorporate Sector Risk Vs. Reward*
The Delta Drag
The Delta Drag
High-Yield: Overweight Chart 3High-Yield Market Overview
High-Yield Market Overview
High-Yield Market Overview
High-Yield outperformed the duration-equivalent Treasury index by 66 basis points in August, bringing year-to-date excess returns up to +502 bps. A recent report looked at the default expectations that are currently priced into the junk index and considered whether they are likely to be met.3 If we demand an excess spread of 100 bps and assume a 40% recovery rate on defaulted debt, then the High-Yield index embeds an expected default rate of 3.0% (Chart 3). Using a model of the 12-month trailing speculative grade default rate that is based on gross corporate leverage (pre-tax profits over total debt) and C&I lending standards, we estimate that the 12-month default rate will fall to between 2.3% and 2.8%, below what the market currently discounts. Notably, the corporate default rate is tracking at an annualized rate of roughly 1.7% through the first seven months of the year, well below the estimate generated by our macro model. Another recent report looked at the incremental spread pick-up investors can earn by moving out of investment grade corporates and into junk.4 It concluded that the extra spread available in high-yield is worth grabbing and that B-rated bonds look particularly attractive in risk-adjusted terms. MBS: Underweight Chart 4MBS Market Overview
MBS Market Overview
MBS Market Overview
Mortgage-Backed Securities underperformed the duration-equivalent Treasury index by 3 basis points in August, dragging year-to-date excess returns down to -67 bps. The nominal spread between conventional 30-year MBS and equivalent-duration Treasuries tightened 4 bps in August. The spread is wide compared to recent history, but it remains tight compared to the pace of mortgage refinancings (Chart 4). The conventional 30-year MBS option-adjusted spread (OAS) widened 2 bps in August (panel 2), and it is now starting to look attractive compared to other similarly risky spread sectors. The conventional 30-year MBS OAS sits at 38 bps, below the 56 bps offered by Aa-rated corporate bonds but above the 20 bps offered by Aaa-rated consumer ABS and the 35 bps offered by Agency CMBS. In a recent report we looked at MBS performance and valuation across the coupon stack.5 We noted that the higher convexity of high-coupon MBS makes them likely to outperform lower-coupon MBS in a rising yield environment. Higher coupon MBS also have greater OAS than lower coupons. This makes the high-coupon MBS more likely to outperform in a flat bond yield environment as well. Given our view that bond yields will be higher in 6-12 months, we recommend favoring high coupons (4%, 4.5%) over low coupons (2%, 2.5%, 3%) within an overall underweight allocation to Agency MBS. Government-Related: Neutral Chart 5Government-Related Market Overview
Government-Related Market Overview
Government-Related Market Overview
The Government-Related index outperformed the duration-equivalent Treasury index by 27 basis points in August, bringing year-to-date excess returns up to +84 bps (Chart 5). Sovereign debt outperformed duration-equivalent Treasuries by 122 bps in August, bringing year-to-date excess returns up to +7 bps. Foreign Agencies outperformed the Treasury benchmark by 8 bps on the month, bringing year-to-date excess returns up to +44 bps. Local Authority bonds outperformed by 9 bps in August, bringing year-to-date excess returns up to +382 bps. Domestic Agency bonds outperformed by 3 bps, bringing year-to-date excess returns up to +30 bps. Supranationals outperformed by 5 bps, bringing year-to-date excess returns up to +31 bps. USD-denominated Emerging Market (EM) Sovereign bonds outperformed US corporates in August and relative valuation between the two sectors is starting to equalize (panel 4). That said, we retain a preference for EM sovereigns over US corporates, particularly the bonds of Russia, Mexico, Saudi Arabia, UAE and Qatar where value remains attractive. A recent report looked at valuation within the investment grade USD-denominated EM corporate space.6 It found that EM corporates are attractively priced relative to US corporate bonds across the entire investment grade credit spectrum. It also found that EM corporates are attractive relative to EM sovereigns within the A and Baa credit tiers. EM sovereigns have the edge in the Aa credit tier. Municipal Bonds: Overweight Chart 6Municipal Market Overview
Municipal Market Overview
Municipal Market Overview
Municipal bonds underperformed the duration-equivalent Treasury index by 9 basis points in August, dragging year-to-date excess returns down to +262 bps (before adjusting for the tax advantage). The economic and policy back-drop remains favorable for municipal bond performance. Trailing 4-quarter net state & local government savings were already positive through the end of Q1 2021 and they received another significant boost in Q2 as funds from the American Rescue Plan were doled out (Chart 6). With state & local government balance sheets in such good shape, we are comfortable moving down in quality within municipal bonds. A move down in quality is especially compelling because of tight Aaa muni valuations relative to Treasuries (top panel). Valuation is more compelling in the lower investment grade credit tiers, especially at the long-end of the curve.7 GO munis in the 12-17 year maturity bucket offer a 5% breakeven tax rate versus corporates with the same credit rating and duration. 12-17 year Revenue munis actually offer a before-tax yield pick-up (panel 2). Finally, high-yield muni spreads are reasonably attractive relative to high-yield corporates, offering a breakeven tax rate of 23% (panel 4). But despite the attractive spread, we recommend only a neutral allocation to high-yield munis versus high-yield corporates as the deep negative convexity of high-yield munis makes them susceptible to extension risk if bond yields rise. Treasury Curve: Buy 2/10 Barbell Versus 5-Year Bullet Chart 7Treasury Yield Curve Overview
Treasury Yield Curve Overview
Treasury Yield Curve Overview
Treasury yields moved higher in August, with the 5-year and 7-year maturities bearing the brunt of the sell-off. The 2-year/10-year Treasury slope steepened 5 bps to end the month at 110 bps. The 5-year/30-year slope flattened 5 bps to end the month at 115 bps. We expect bond yields to be higher in 6-12 months, but we also anticipate that the next significant move higher in bond yields will coincide with curve flattening, not steepening. At 1.93%, the 5-year/5-year forward Treasury yield is not that far below our target fair value range of 2% - 2.25%. In a recent report, we demonstrated that yield curve steepening only occurs when either the Fed is cutting rates or the 5-year/5-year forward yield rises.8 This means that the 2/10 Treasury curve is more likely to flatten than steepen during the next 6-12 months, even as bond yields move higher. Similarly, we observe that the overnight index swap (OIS) curve is priced for the fed funds rate to be 0.21% in one year’s time and 1.47% in five years (Chart 7). The latter rate has 146 bps of upside if it converges all the way back to its 2018 high, but this pales in comparison to the 265 bps of upside in the 12-month forward rate. The yield curve will flatten as the 12-month forward OIS rate converges with the 5-year forward rate (panel 3). Investors should position in yield curve flatteners on a 6-12 month horizon. Specifically, we recommend shorting the 5-year bullet versus a duration-matched 2/10 barbell. TIPS: Neutral Chart 8TIPS Market Overview
TIPS Market Overview
TIPS Market Overview
TIPS performed in line with the duration-equivalent nominal Treasury index in August, leaving year-to-date excess returns unchanged at +578 bps. The 10-year and 5-year/5-year forward TIPS breakeven inflation rates both fell by 7 bps in August. At 2.37%, the 10-year TIPS breakeven inflation rate is near the middle of the 2.3% to 2.5% range that is consistent with inflation expectations being well anchored around the Fed’s target (Chart 8). Meanwhile, at 2.21%, the 5-year/5-year forward TIPS breakeven inflation rate is only just below target (panel 3). With long-dated inflation expectations close to the Fed’s target levels, we see limited upside on a 6-12 month investment horizon. We also see the cost of short-maturity inflation protection falling during the next few months as realized inflation continues to moderate from its current extremely high level. This will lead to some modest steepening of the inflation curve (bottom panel). While the inflation curve has some room to steepen, we don’t see it returning to positive territory. An inverted inflation curve is simply more consistent with the Fed’s Average Inflation Target than a positively sloped one. This is because the Fed’s new framework calls for it to attack its inflation target from above rather than from below. ABS: Overweight Chart 9ABS Market Overview
ABS Market Overview
ABS Market Overview
Asset-Backed Securities outperformed the duration-equivalent Treasury index by 3 basis points in August, bringing year-to-date excess returns up to +40 bps. Aaa-rated ABS outperformed by 2 bps on the month, bringing year-to-date excess returns up to +30 bps. Non-Aaa ABS outperformed by 4 bps, bringing year-to-date excess returns up to +92 bps. The stimulus from last year’s CARES Act led to a significant increase in household savings when individual checks were mailed in April 2020. That excess savings has still not been spent and the most recent round of stimulus checks has only added to the stockpile (Chart 9). The extraordinarily large stock of household savings means that the collateral quality of consumer ABS is also extraordinarily high. Indeed, many households have been using their windfalls to pay down consumer debt (bottom panel). Investors should remain overweight consumer ABS and should also take advantage of the high quality of household balance sheets by moving down the quality spectrum. Non-Agency CMBS: Neutral Chart 10CMBS Market Overview
CMBS Market Overview
CMBS Market Overview
Non-Agency Commercial Mortgage-Backed Securities outperformed the duration-equivalent Treasury index by 6 basis points in August, bringing year-to-date excess returns up to +193 bps. Aaa Non-Agency CMBS outperformed Treasuries by 10 bps in August, bringing year-to-date excess returns up to +92 bps. Non-Aaa Non-Agency CMBS underperformed Treasuries by 9 bps on the month, dragging year-to-date excess returns down to +529 bps (Chart 10). Though returns have been strong and spreads remain attractive, particularly for lower-rated CMBS, we continue to recommend only a neutral allocation to the sector because of the structurally challenging environment for commercial real estate. Agency CMBS: Overweight Agency CMBS outperformed the duration-equivalent Treasury index by 4 basis points in August, bringing year-to-date excess returns up to +91 bps. The average index option-adjusted spread held flat on the month. It currently sits at 35 bps (bottom panel). Though Agency CMBS spreads have recovered to well below pre-COVID levels, they still look attractive compared to other similarly risky spread products. Stay overweight. Ryan Swift US Bond Strategist rswift@bcaresearch.com Appendix A: Butterfly Strategy Valuations The following tables present the current read-outs from our butterfly spread models. We use these models to identify opportunities to take duration-neutral positions across the Treasury curve. The following two Special Reports explain the models in more detail: US Bond Strategy Special Report, “Bullets, Barbells And Butterflies”, dated July 25, 2017, available at usbs.bcaresearch.com US Bond Strategy Special Report, “More Bullets, Barbells And Butterflies”, dated May 15, 2018, available at usbs.bcaresearch.com Table 4 shows the raw residuals from each model. A positive value indicates that the bullet is cheap relative to the duration-matched barbell. A negative value indicates that the barbell is cheap relative to the bullet. Table 4Butterfly Strategy Valuation: Raw Residuals In Basis Points (As Of August 31st, 2021)
The Delta Drag
The Delta Drag
Table 5 scales the raw residuals in Table 4 by their historical means and standard deviations. This facilitates comparison between the different butterfly spreads. Table 5Butterfly Strategy Valuation: Standardized Residuals (As Of August 31st, 2021)
The Delta Drag
The Delta Drag
Table 6 flips the models on their heads. It shows the change in the slope between the two barbell maturities that must be realized during the next six months to make returns between the bullet and barbell equal. For example, a reading of 12 bps in the 5 over 2/10 cell means that we would only expect the 5-year to outperform the 2/10 if the 2/10 slope steepens by more than 12 bps during the next six months. Otherwise, we would expect the 2/10 barbell to outperform the 5-year bullet. Table 6Discounted Slope Change During Next 6 Months (BPs)
The Delta Drag
The Delta Drag
Appendix B: Excess Return Bond Map The Excess Return Bond Map is used to assess the relative risk/reward trade-off between different sectors of the US bond market. It is a purely computational exercise and does not impose any macroeconomic view. The Map’s vertical axis shows 12-month expected excess returns. These are proxied by each sector’s option-adjusted spread. Sectors plotting further toward the top of the Map have higher expected returns and vice-versa. Our novel risk measure called the “Risk Of Losing 100 bps” is shown on the Map’s horizontal axis. To calculate it, we first compute the spread widening required on a 12-month horizon for each sector to lose 100 bps or more relative to a duration-matched position in Treasury securities. Then, we divide that amount of spread widening by each sector’s historical spread volatility. The end result is the number of standard deviations of 12-month spread widening required for each sector to lose 100 bps or more versus a position in Treasuries. Lower risk sectors plot further to the right of the Map, and higher risk sectors plot further to the left. Chart 11Excess Return Bond Map (As Of August 31st, 2021)
The Delta Drag
The Delta Drag
Footnotes 1 Please see US Bond Strategy Weekly Report, “The Post-FOMC Credit Environment”, dated June 29, 2021. 2 For ideas on how to increase the average spread of a US bond portfolio please see US Bond Strategy Weekly Report, “The Collapsing Credit Risk Premium”, dated July 20, 2021. 3 Please see US Bond Strategy Weekly Report, “The Post-FOMC Credit Environment”, dated June 29, 2021. 4 Please see US Bond Strategy Weekly Report, “The Collapsing Credit Risk Premium”, dated July 20, 2021. 5 Please see US Bond Strategy Weekly Report, “A New Conundrum”, dated April 20, 2021. 6 Please see US Bond Strategy Weekly Report, “The Post-FOMC Credit Environment”, dated June 29, 2021. 7 Please see US Bond Strategy Weekly Report, “The Collapsing Credit Risk Premium”, dated July 20, 2021. 8 Please see US Bond Strategy / Global Fixed Income Strategy Weekly Report, “A Bump On The Road To Recovery”, dated July 27, 2021.
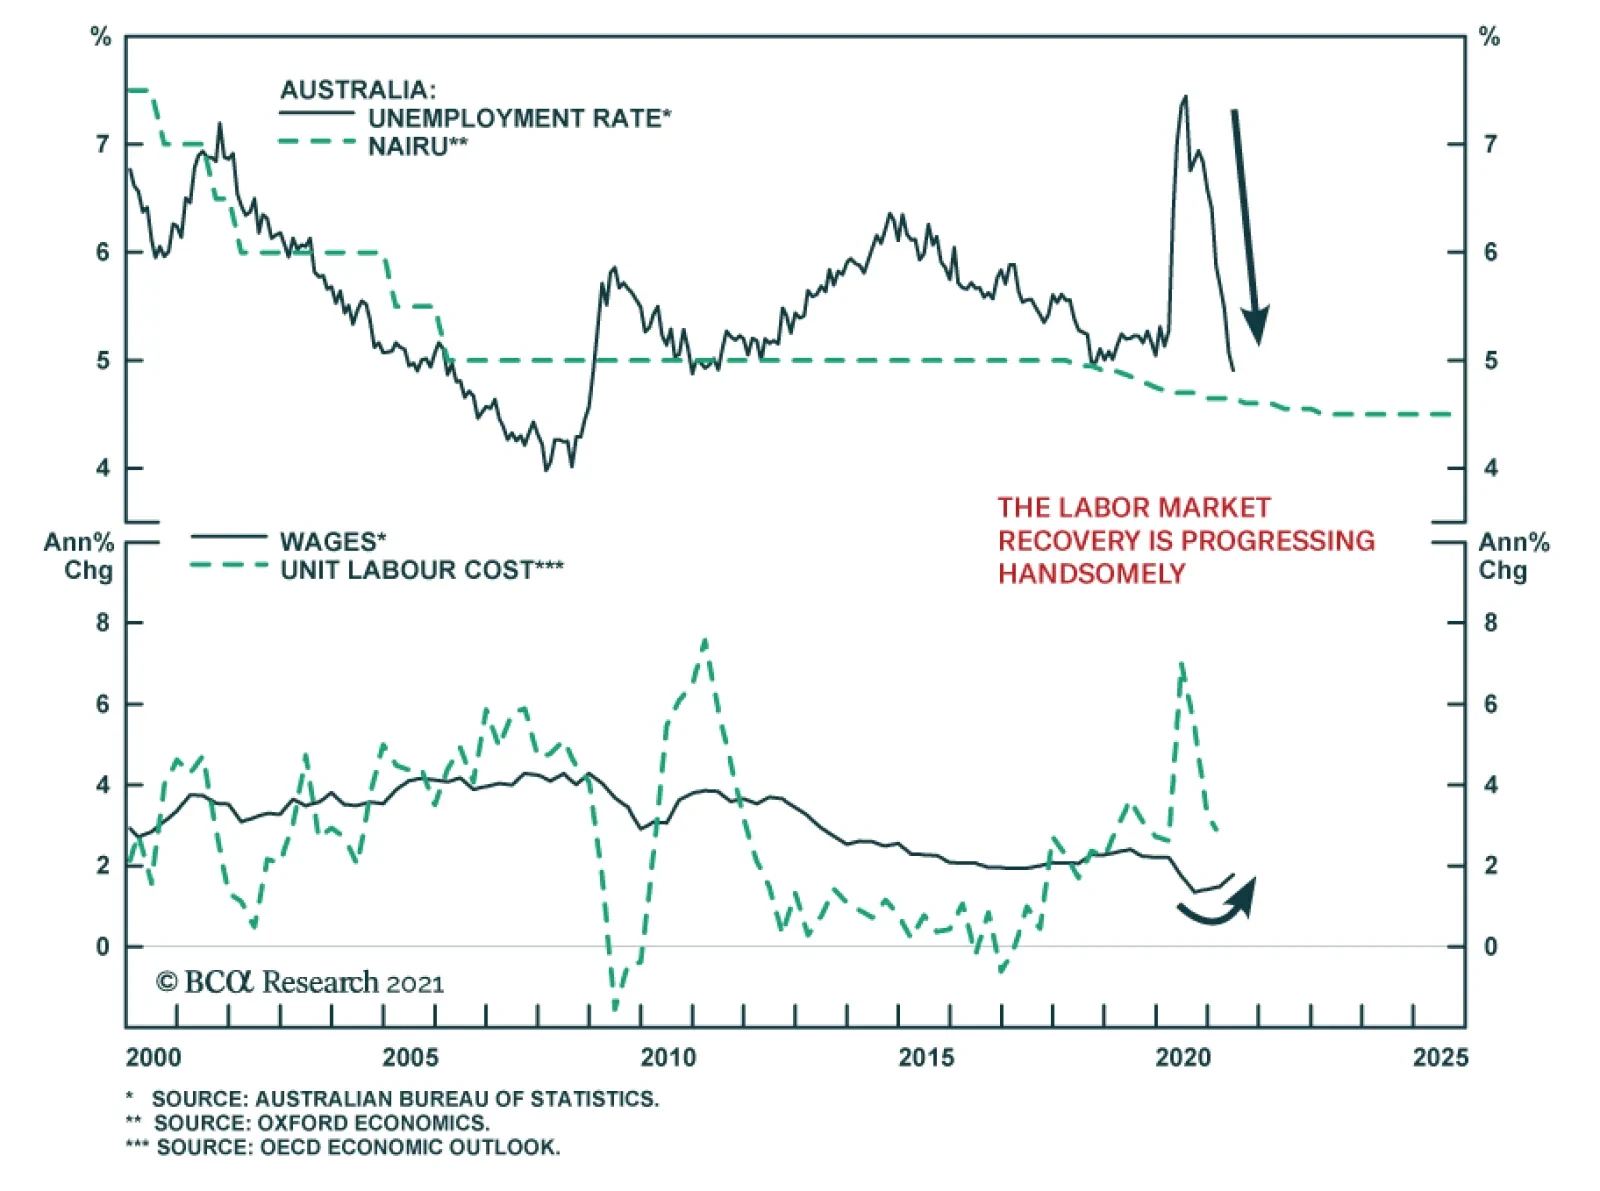
The Reserve Bank of Australia maintained its benchmark cash rate target unchanged at 0.1% at its meeting on Tuesday. Instead, the central bank announced a reduction in the pace of its asset purchases to AUD 4 billion a week from the previous AUD 5 billion. …
Highlights A trio of ECB hawks raised the prospect of an ECB taper. In the past, the current set of economic conditions in the Euro Area would have prompted the ECB to tighten policy. A potential economic deceleration this fall, the transitory nature of the Eurozone’s inflation spike, and the level of inflation expectation in the region limit the ECB’s ability to taper this week. We expect a one-off return to the pre-Q2 2021 level of asset purchases couched in a very dovish forward guidance. Peripheral bonds and European corporate bonds will outperform German and other core European paper. Stay long European curve steepeners, while buying US curve flatteners. Overweight German Bunds versus US Treasury Notes, on a USD-hedged basis. European productivity will remain structurally hampered compared to that of the US. US real bond yields will rise relative to Europe. Feature Last week, a chorus of ECB Governing Council members raised the idea among investors that the central bank may soon begin to taper its asset purchases, which prompted Bund yields to hit -0.35% on Wednesday. Robert Holzmann of Austria, Klaas Knot of the Netherlands, and Jens Weidmann of Germany all suggested that monetary conditions were too accommodative for the Eurozone and that the ECB needed to remedy this problem. The complaints of this hawkish trio reflect the current environment. In August, the Eurozone HICP reached a 3% annual rate while the preliminary estimate for core CPI clicked in at 1.6%. Meanwhile, July PPI rose to 12.1%. Such robust inflation readings are at odds with the low level of interest rates in the Eurozone, where the yields on European IG credit and 10-year Italian BTPs average a paltry 0.45% (Chart 1). Beyond the level of inflation, its broad geographic nature is an additional source of concern. Headline CPI is accelerating across all the bloc’s nations, and it stands above 2% in 82% of the members’ states. Historically, this kind of inflationary backdrop resulted in either higher interest rates or some tapering of asset purchases, especially when economic activity was also improving in the Eurozone (Chart 2). Chart 1A Gap For The Hawks
A Gap For The Hawks
A Gap For The Hawks
Chart 2In The Past, The ECB Would Have Tightened
In The Past, The ECB Would Have Tightened
In The Past, The ECB Would Have Tightened
Will the ECB listen to its most hawkish members and follow its past script? We do not believe that the Governing Council is about to start a sustained period of decreased bond buying, even if a return to the pre-Q2 2021 pace of buying is likely this fall. Thus, a dovish taper is the most likely outcome of this week’s meeting. The ECB’s Three Constraints The outlook for growth, the temporary nature of the current spike in European inflation, and the low-level of Euro Area inflation expectations limit the ECB’s ability to remove monetary accommodation. First, European economic growth is at its apex and will decelerate over the next six months. Currently, domestic activity as approximated by the Services PMI stands at near a 15-year high of almost 60. Moreover, despite the spike in COVD-19 cases linked to the Delta variant, mobility remains very robust. If anything, the decline in cases in Spain and France should lead to further improvement in mobility (Chart 3). Nonetheless, the recent fall in consumer confidence and the recent US experience, which the European economy usually follows, point to a deceleration in the Services PMI. The case for a decline in manufacturing activity is more pronounced. The European manufacturing sector responds strongly to the fluctuation of the global industrial sector. US consumer spending on durable goods is 21% above its pre-pandemic trend and is beginning to weaken as pent-up demand for such products has been satiated and households shift their spending back toward services. Moreover, the Chinese credit cycle, which leads the Eurozone Manufacturing PMI by nine months, indicates a greater deceleration in the coming quarters, because European exports to China will slow (Chart 4, top and middle panels). In response to these two forces, Europe will not diverge from the deterioration in our Global Activity Nowcast (Chart 4, bottom panel). Chart 3So Far, No Delta Impact
So Far, No Delta Impact
So Far, No Delta Impact
Chart 4The Coming Manufacturing Slowdown
The Coming Manufacturing Slowdown
The Coming Manufacturing Slowdown
Chart 5Abnormal Goods Inflation
Abnormal Goods Inflation
Abnormal Goods Inflation
Second, most evidence still suggests that the current inflation increase will be temporary, despite its violence. To begin with, the spike in inflation remains consigned to the goods sectors, while services inflation stands at 1.1%, in line with the experience of the past 10 years (Chart 5). Even within goods prices, the spike in CPI is limited to sectors facing bottlenecks or linked closely to commodity and shipping prices. As Chart 6 illustrates, the categories experiencing abnormal inflation are directly related to higher energy prices, cars, complex machinery, hotels, and fresh food. Meanwhile, underlying inflation as estimated by our trimmed-mean CPI measure is bottoming, but remains at a very low 0.2% annual rate (Chart 7). Chart 6Inflation Remains A Commodity and Bottleneck Story
The ECB Taper Dilemma
The ECB Taper Dilemma
In the same vein, the surge in Selling Price Expectations of the European Commission Business Survey is a function of commodity inflation (Chart 8). In other words, companies feel they can increase their selling prices, because natural resource prices have spiked. However, inflation across many commodities is currently peaking, which suggests that Selling Price Expectations will soon do so as well. Moreover, this process indicates that headline inflation should hit its summit by year end, because Selling Price Expectations are a coincident indicator of inflation (Chart 8, bottom panel). Chart 7Narrow Inflation
Narrow Inflation
Narrow Inflation
Chart 8Rising Selling Prices And Commodities
Rising Selling Prices And Commodities
Rising Selling Prices And Commodities
A wage-inflation spiral also remains far away. Historically, rapidly accelerating wage growth marked periods of elevated inflation. Despite current fears, such a development is not taking place in the Eurozone. For the whole bloc, negotiated wages are growing at a modest 1.7% annual rate (Chart 9). Even in Germany, negotiated wages are only increasing at the same rate. While some labor shortages have been reported, total hours worked remain below the equilibrium level based on the Euro Area demographic profile (Chart 9, bottom panel). Furthermore, the past ten years reveal that labor shortages only caused stronger salary growth with a multi-year delay. Third, the market doubts the credibility of the ECB when it comes to achieving a 2% inflation target. So far, survey-based inflation expectations remain below 2% at all tenors (Chart 10, top panel). The same is true of market-based measures, which are still lower than the levels that prevailed before the sovereign debt crisis of the past decade (Chart 10, bottom panel). Chart 9No Wages/Inflation Spiral
No Wages/Inflation Spiral
No Wages/Inflation Spiral
Chart 10The ECB's Inflation Mandate Is Not Yet Credible
The ECB's Inflation Mandate Is Not Yet Credible
The ECB's Inflation Mandate Is Not Yet Credible
Bottom Line: Risks to growth over the winter, the transitory nature of the recent inflation shock, and inflation expectations that remain significantly below target are constraints limitating the ability of the ECB to announce a true tapering of its asset purchases this Thursday. A Dovish Taper? Considering the current set of conditions prevailing in the Eurozone, we expect the ECB to announce a return to the pace of asset purchases that existed prior to Q2 2021. However, the Governing Council (GC) will go out of its way to issue clear forward guidance that strongly indicates this is not the beginning of a taper campaign. Instead, the GC will hint at the transmutation of a large proportion of the PEPP monthly buying into the PSPP after March 2022. The inflation target change enacted at the conclusion of the ECB’s strategy review in July limits the central bank’s ability to go back to its old rule book and tighten policy at the first hint of inflation. First, the ECB must believe that inflation will overshoot 2% on a durable basis, which will necessitate an upgrade to its long-term inflation forecast above the target. Too many members of the GC do not share this view, which makes it unlikely that inflation forecasts will rise this much this week. Moreover, inflation expectations are also too low to warn of a meaningful change in the behavior of European economic agents, especially if the current spike in inflation proves to be transitory. Another problem for the ECB is the Fed. If the ECB were to announce a durable tapering of its asset purchase this week, it would be doing so ahead of the Fed. The GC fears that this action would put considerable upward pressure on EUR/USD, which would create a grave deflationary tendency in the Eurozone (Chart 11). Despite these shackles, the ECB will also acknowledge that the current emergency pace of asset purchases is no longer warranted. Starting Q2 2021, the ECB increased its average monthly purchase from EUR80 billion in the August 2020 to March 2021 period, to EUR95 billion since April 2021 (Chart 12). However, these increased purchases followed a 0.1% GDP contraction in Q1 in the wake of a spike in COVID-19 cases and deaths, which prompted a large reduction in mobility. Moreover, the larger bond buying also followed large increases in bond yields across the main economies of the continent, a rise which, if it had been left unchecked, would have exacerbated the economic malaise. Chart 11The ECB Fears A Strong Euro
The ECB Fears A Strong Euro
The ECB Fears A Strong Euro
Chart 12Normalizing Purchases
The ECB Taper Dilemma
The ECB Taper Dilemma
None of these factors are still present. The increasing level of vaccination has dulled the economic impact of the third wave of infection. The economy is expanding robustly and, even if it slows in the months ahead, growth will remain well above trend. Crucially, financial conditions are much more generous than in the first half of the year, with a euro that trades 4% below its January peak and with yields in the bloc’s four largest economies 25 to 45 basis points below their spring peaks. Bottom Line: In response to the aforementioned crosscurrents, we anticipate the ECB to announce a return of its monthly asset purchases to the level that prevailed in the August 2020 to March 2021 period. However, the GC will also clearly indicate, as it did last March, that this policy shift is a one-off, and that investors must not anticipate any further curtailment of asset purchases over the next six months. To reinforce this guidance, we expect the ECB’s inflation forecast to show a return of HICP below 2% by the end of 2023. The GC might also hint at the roll-over of the PEPP program into the PSPP after March 2022. Investment Implications An ECB that conducts a dovish taper on Thursday will support our main fixed-income themes in Europe. First, it will remain a tailwind behind an overweight position in peripheral government bonds versus German bonds. The combination of continued purchases of EUR80 billion a month of bonds over the foreseeable future, above-trend growth, and the fiscal risk mutualization from the NGEU and REACT EU programs means that investors can continue to safely pocket the yield premium offered by BTPs and BONOs. Moreover, our geopolitical strategists expect a left-wing coalition to govern Germany after the September 26 election, which will limit the pressures to tighten budgets in the periphery over the coming years. Chart 13European Corporates Remain Attractive
European Corporates Remain Attractive
European Corporates Remain Attractive
Second, continued liquidity injections by the ECB are also consistent with a preference for European corporate credit over government securities, especially in Germany, France, and the Netherlands. European breakeven spreads for IG and high-yield debts are in the 18th and 13th percentile rank, respectively (Chart 13). Easy monetary conditions and above-trend growth will facilitate further yield-seeking behavior in the Eurozone. This process will allow these securities to offer continued excess returns over at least the next six months. Third, we hold on to our box trade of being long Eurozone curve steepeners and long US curve flatteners. In our base case scenario, the Fed will soon indicate the beginning of its tapering campaign and will be on track to raise rates by early 2023, while the ECB will still conduct a very easy monetary policy. In this context, the US yield curve will flatten relative to the European one, driven by a more rapid increase at the short end of the curve. Chart 14Still Favor Bunds Over T-Notes
The ECB Taper Dilemma
The ECB Taper Dilemma
Finally, in a global bond portfolio, it still makes sense to overweight German Bunds (hedged into USD) relative to US Treasury Notes. Bunds display a significantly lower yield beta than their US counterparts, which creates an attractive defensive feature in an environment in which global yields are likely to rise. Moreover, as the model in Chart 14 highlights, the US/German 10-year yield spread is roughly 50bps below an equilibrium estimate based on relative inflation, unemployment and policy rates, and the size of the Fed and ECB balance sheets. US inflation is likely to remain perkier than that of Europe over the coming quarters, and the US unemployment rate will decline faster as well. Additionally, in the unlikely scenario that the Fed declines to taper its purchases this year, but the ECB does, inflation expectations will rise in the US relative to the Euro Area, which will put upward pressure on yield spreads. Bottom Line: A dovish ECB taper, whereby the GC executes a one-off adjustment in asset purchases with an easy forward guidance, will support our overweight in peripheral government bonds relative to bunds, our preference for European corporate credit relative to government paper, our Europe / US box trade, and BCA’s underweight in Treasurys relative to Bunds. Europe’s Productivity Deficit Is Not Over Compared to the US, GDP growth in the Eurozone has been trending lower since the introduction of the euro in 1999. While a weaker demographic profile has hurt Europe, so has slower productivity growth. Going forward, the gap between European and US productivity growth will somewhat narrow compared to last decade, but it will still favor the US. The cross-Atlantic gap in output per hour growth between has a cyclical and a structural component. The cyclical element is set to ebb. Last decade, the Eurozone suffered a double-dip recession, as the European sovereign debt crisis raged. As a result, capex and debt accumulation in Europe lagged that of the US, which hurt demand and, thus, output-per-hour worked (Chart 15, top panel). Going forward, the European debt crisis has been addressed, the ECB has demonstrated its willingness to do “whatever it takes” to support the monetary union and both the European Commission and the German government have thrown their full weight behind the integrity of Europe, even if it means bailing out their profligate southern neighbors. Despite this positive, some structural headwinds will continue to handicap European productivity. Since 2000, total factor productivity in the major Euro Area economies has lagged that of the US (Chart 15, bottom panel). Many factors suggest this will not change: Chart 15Europe’s Productivity Deficit
The ECB Taper Dilemma
The ECB Taper Dilemma
The Eurozone’s big four economies continue to linger well behind the US in terms of ICT investment, which in recent decades has been a crucial driver of productivity. R&D represents a significantly lower share of GDP in the Eurozone than it does in the US (Chart 16). More investment in intangible assets has been linked to higher productivity growth. Additionally, Ortega-Argilés et al. have shown that EU companies do not convert R&D into productivity gains as well as US businesses do, because they generate lower return on investments.1 Confirming this insight, an empirical study using microdata on R&D spending for EU and US firms highlights that both R&D intensity and productivity are lower for EU firms than for their US counterparts.2 For a 10% increase in R&D intensity, US businesses generated a 2.7% increase in productivity, while EU firms enjoyed a much smaller 1% gain. The gap is larger for high-tech companies, where the same rise in R&D intensity produced a 3.3% productivity gain in the US, but only a 1.2% one in the EU. The European economy remains much more fragmented than that of the US, and the greater prevalence of small firms in the Euro Area results in a less efficient use of the human and capital stocks. Finally, the low rate of investments in recent years has caused the European capital stock to age faster than that of the US. An older pool of assets is further away from the technological frontier and thus weighs on TFP and overall labor productivity (Chart 17). Chart 16Lagging European R&D
The ECB Taper Dilemma
The ECB Taper Dilemma
Chart 17The Ageing European Capital Stock
The Ageing European Capital Stock
The Ageing European Capital Stock
Notwithstanding cyclical fluctuations related to the global debt cycle, the Eurozone profit margins and RoEs will not converge meaningfully toward US levels on a structural basis because of this productivity problem. Europe’s lower industry concentration ratios, lower markups, and greater share of output absorbed by wages will only accentuate this problem. Chart 18TIPS Yields Vs Real Bunds
TIPS Yields Vs Real Bunds
TIPS Yields Vs Real Bunds
As a result of the lower trend growth rate caused by lower productivity and its inferior return on invested capital, Europe’s R-Star is unlikely to catch up meaningfully to US levels. Consequently, the gap between US and Germany real rates will remain wide and will drive the increase in US yields relative to those of Germany, as the Fed begins to tighten policy while the ECB stands pat (Chart 18). Bottom Line: Europe’s productivity deficit is not the only consequence of last decade’s sovereign debt crisis. Thus, the Euro Area’s potential GDP growth and return on invested capital will lingers behind those of the US. As a corollary, the Eurozone’s R-star is well below that of the US. Hence, we expect higher real rates to drive the increase in US yields over Germany as the Fed tightens policy ahead of the ECB. Mathieu Savary, Chief European Strategist Mathieu@bcaresearch.com Footnotes 1R. Ortega-Argilés, M. Piva, and M. Vivarelli, “The Transatlantic Productivity Gap: Is R&D the Main Culprit?,” Canadian Journal of Economics 47.4 (2014), pp. 1342-71. 2D. Castellani, M. Piva, T. Schubert, and M. Vivarelli, “The Productivity Impact of R&D Investment: A Comparison between the EU and the US,” IZA Discussion Papers 9937 (2016). Tactical Recommendations
The ECB Taper Dilemma
The ECB Taper Dilemma
Cyclical Recommendations
The ECB Taper Dilemma
The ECB Taper Dilemma
Structural Recommendations
The ECB Taper Dilemma
The ECB Taper Dilemma
Closed Trades
The ECB Taper Dilemma
The ECB Taper Dilemma
Currency Performance Fixed Income Performance Equity Performance
Highlights An Iran crisis is imminent. We still think a US-Iran détente is possible but our conviction is lower until Biden makes a successful show of force. Oil prices will be volatile. Fiscal drag is a risk to the cyclical global macro view. But developed markets are more fiscally proactive than they were after the global financial crisis. Elections will reinforce that, starting in Germany, Canada, and Japan. The Chinese and Russian spheres are still brimming with political and geopolitical risk. But China will ease monetary and fiscal policy on the margin over the coming 12 months. Afghanistan will not upset our outlook on the German and French elections, which is positive for the euro and European stocks. Feature Chart 1Bull Market In Iran Tensions
Biden's Show Of Force (GeoRisk Update)
Biden's Show Of Force (GeoRisk Update)
Iran is now the most pressing geopolitical risk in the short term (Chart 1). The Biden administration has been chastened by the messy withdrawal from Afghanistan and will be exceedingly reactive if it is provoked by foreign powers. Nuclear weapons improve regime survivability. Survival is what the Islamic Republic wants. Iran is surrounded by enemies in its region and under constant pressure from the United States. Hence Iran will never ultimately give up its nuclear program, as we have maintained. Chart 2Biden Unlikely To Lift Iran Sanctions Unilaterally
Biden's Show Of Force (GeoRisk Update)
Biden's Show Of Force (GeoRisk Update)
However, Supreme Leader Ali Khamenei could still agree to a deal in which the US reduces economic sanctions while Iran allows some restrictions on uranium enrichment for a limited period of time (the 2015 nuclear deal’s key provisions expire from 2023 through 2030). This would be a stopgap measure to delay the march into war. The problem is that rejoining the 2015 deal requires the US to ease sanctions first, since the US walked away from the deal in 2018. Iran would need domestic political cover to rejoin it. Biden has the executive authority to ease sanctions unilaterally but after Afghanistan he lacks the political capital to do so (Chart 2). So Biden cannot ease sanctions until Iran pares back its nuclear activities. But Iran has no reason to pare back if the US does not ease sanctions. Iran is now enriching some uranium to a purity of 60%. Israeli Defense Minister Benny Gantz says it will reach “nuclear breakout” capability – enough fissile material to build a bomb – within 10 weeks, i.e. mid-October. Anonymous officials from the Biden administration told the Associated Press it will be “months or less,” which could mean September, October, or November (Table 1). Table 1Iran Nearing "Breakout" Nuclear Capability
Biden's Show Of Force (GeoRisk Update)
Biden's Show Of Force (GeoRisk Update)
Meanwhile the new Iranian government of President Ebrahim Raisi, a hardliner who is tipped to take over as Supreme Leader once Ali Khamenei steps down, is implying that it will not rejoin negotiations until November. All of these timelines are blurry but the implication is that Iran will not resume talks until it has achieved nuclear breakout. Israel will continue its campaign of sabotage against the regime. It may be pressed to the point of launching air strikes, as it did against nuclear facilities in Iraq in 1981 and Syria in 2007 under what is known as the “Begin Doctrine.” Chart 3Israel Cannot Risk Losing US Security Guarantee
Biden's Show Of Force (GeoRisk Update)
Biden's Show Of Force (GeoRisk Update)
The constraint on Israel is that it cannot afford to lose America’s public support and defense alliance since it would find itself isolated and vulnerable in its region (Chart 3). But if Israeli intelligence concludes that the Iranians truly stand on the verge of achieving a deliverable nuclear weapon, the country will likely be driven to launch air strikes. Once the Iranians test and display a viable nuclear deterrent it will be too late. Four US presidents, including Biden, have declared that Iran will not be allowed to get nuclear weapons. Biden and the Democrats favor diplomacy, as Biden made clear in his bilateral summit with Israeli Prime Minister Naftali Bennett last week. But Biden also admitted that if diplomacy fails there are “other options.” The Israelis currently have a weak government but it is unified against a nuclear-armed Iran. At very least Bennett will underscore red lines to indicate that Israel’s vigilance has not declined despite hawkish Benjamin Netanyahu’s fall from power. Still, Iran may decide it has an historic opportunity to make a dash for the bomb if it thinks that the US will fail to support an Israeli attack. The US has lost leverage in negotiations since 2015. It no longer has troops stationed on Iran’s east and west flanks. It no longer has the same degree of Chinese and Russian cooperation. It is even more internally divided. Iran has no guarantee that the US will not undergo another paroxysm of nationalism in 2024 and try to attack it. The faction that opposed the deal all along is now in power and may believe it has the best chance in its lifetime to achieve nuclear breakout. The only reason a short-term deal is possible is because Khamenei may believe the Israelis will attack with full American support. He agreed to the 2015 deal. He also fears that the combination of economic sanctions and simmering social unrest will create a rift when he dies or passes the leadership to his successor. Iran has survived the Trump administration’s “maximum pressure” sanctions but it is still vulnerable (Chart 4). Chart 4Supreme Leader Focuses On Regime Survival
Supreme Leader Focuses On Regime Survival
Supreme Leader Focuses On Regime Survival
Moreover Biden is offering Khamenei a deal that does not require abandoning the nuclear program and does not prevent Iran from enhancing its missile capabilities. By taking the deal he might prevent his enemies from unifying, forestall immediate war, and pave the way for a smooth succession, while still pursuing the ultimate goal of nuclear weaponization. Bringing it all together, the world today stands at a critical juncture with regard to Iran and the unfinished business of the US wars in the Middle East. Unless the US and Israel stage a unified and convincing show of force, whether preemptively or in response to Iranian provocations, the Iranians will be justified in concluding that they have a once-in-a-generation opportunity to pursue the bomb. They could sneak past the global powers and obtain a nuclear deterrent and regime security, like North Korea did. This could easily precipitate a war. Biden will probably continue to be reactive rather than proactive. If the Iranians are silent then it will be clear that Khamenei still sees the value in a short-term deal. But if they continue their march toward nuclear breakout, as is the case as we go to press, then Biden will have to make a massive show of force. The goal would be to underscore the US’s red lines and drive Iran back to negotiating table. If Biden blinks, he will incentivize Iran to make a dash for the bomb. Either way a crisis is imminent. Israel will continue to use sabotage and underscore red lines while the Iranians will continue to escalate their attacks on Israel via militant proxies and attacks on tankers (Map 1). Map 1Secret War Escalates In Middle East
Biden's Show Of Force (GeoRisk Update)
Biden's Show Of Force (GeoRisk Update)
Bottom Line: After a crisis, either diplomacy will be restored, or the Middle East will be on a new war path. The war path points to a drastically different geopolitical backdrop for the global economy. If the US and Iran strike a short-term deal, Iranian oil will flow and the US will shift its strategic focus to pressuring China, which is negative for global growth and positive for the dollar. If the US and Iran start down the war path, oil supply disruptions will rise and the dollar will fall. Implications For Oil Prices And OPEC 2.0 The probability of a near-term conflict is clear from our decision tree, which remains the same as in June 2019 (Diagram 1). Diagram 1US-Iran Conflict: Critical Juncture In Our Decision Tree
Biden's Show Of Force (GeoRisk Update)
Biden's Show Of Force (GeoRisk Update)
Shows of force and an escalation in the secret war will cause temporary but possibly sharp spikes in oil prices in the short term. OPEC 2.0 remains intact so far this year, as expected. The likelihood that the global economic recovery will continue should encourage the Saudis, Russians, Emiratis and others to maintain production discipline to drain inventories and keep Brent crude prices above $60 per barrel. OPEC 2.0 is a weak link in oil prices, however, because Russians are less oil-dependent than the Gulf Arab states and do not need as high of oil prices for their government budget to break even (Chart 5). Periodically this dynamic leads the cartel to break down. None of the petro-states want to push oil prices up so high that they hasten the global green energy transition. Chart 5OPEC 2.0 Keeps Price Within Fiscal Breakeven Oil Price
Biden's Show Of Force (GeoRisk Update)
Biden's Show Of Force (GeoRisk Update)
Chart 6Oil Price Risks Lie To Upside Until US-Iran Deal Occurs
Oil Price Risks Lie To Upside Until US-Iran Deal Occurs
Oil Price Risks Lie To Upside Until US-Iran Deal Occurs
As long as OPEC 2.0 remains disciplined, average Brent crude oil prices will gradually rise to $80 barrels per day by the end of 2024, according to our Commodity & Energy Strategy (Chart 6). Imminent firefights will cause prices to spike at least temporarily when large amounts of capacity are taken offline. Global spare capacity is probably sufficient to handle one-off disruptions but an open-ended military conflict in the Persian Gulf or Strait of Hormuz would be a different story. After the next crisis, everything depends on whether the US and Israel establish a credible threat and thus restore diplomacy. Any US-Iran strategic détente would unleash Iranian production and could well motivate the Gulf Arabs to pump more oil and deny Iran market share. Bottom Line: Given that any US-Iran deal would also be short-term in nature, and may not even stabilize the region, some of the downside risks are fading at the moment. The US and China are also sucking in more commodities as they gear up for great power struggle. The geopolitical outlook is positive for oil prices in these respects. But OPEC 2.0 is the weak link in this expectation so we expect volatility. Global Fiscal Taps Will Stay Open Markets have wavered in recent months over softness in the global economic recovery, COVID-19 variants, and China’s policy tightening. The world faces a substantial fiscal drag in the coming years as government budgets correct from the giant deficits witnessed during the crisis. Nevertheless policymakers are still able to deliver some positive fiscal surprises on the margin. Developed markets have turned fiscally proactive over the past decade. They rejected austerity because it was seen as fueling populist political outcomes that threatened the established parties. Note that this change began with conservative governments (e.g. Japan, UK, US, Germany), implying that left-leaning governments will open the fiscal taps further whenever they come to power (e.g. Canada, the US, Italy, and likely Germany next). Chart 7Global Fiscal Taps Will Stay Open
Biden's Show Of Force (GeoRisk Update)
Biden's Show Of Force (GeoRisk Update)
Chart 7 updates the pandemic-era fiscal stimulus of major economies, with light-shaded bars highlighting new fiscal measures that are in development but have not yet been included in the IMF’s data set. The US remains at the top followed by Italy, which also saw populist electoral outcomes over the past decade. Chart 8US Fiscal Taps Open At Least Until 2023
US Fiscal Taps Open At Least Until 2023
US Fiscal Taps Open At Least Until 2023
The Biden administration is on the verge of passing a $550 billion bipartisan infrastructure bill. We maintain 80% subjective odds of passage – despite the messy pullout from Afghanistan. Assuming it passes, Democrats will proceed to their $3.5 trillion social welfare bill. This bill will inevitably be watered down – we expect a net deficit impact of around $1-$1.5 trillion for both bills – but it can pass via the partisan “budget reconciliation” process. We give 50% subjective odds today but will upgrade to 65% after infrastructure passes. The need to suspend the debt ceiling will raise volatility this fall but ultimately neither party has an interest in a national debt default. The US is expanding social spending even as geopolitical challenges prevent it from cutting defense spending, which might otherwise be expected after Afghanistan and Iraq. The US budget balance will contract after the crisis but then it will remain elevated, having taken a permanent step up as a result of populism. The impact should be a flat or falling dollar on a cyclical basis, even though we think geopolitical conflict will sustain the dollar as the leading reserve currency over the long run (Chart 8). So the dollar view remains neutral for now. Bottom Line: The US is facing a 5.9% contraction in the budget deficit in 2022 but the blow will be cushioned somewhat by two large spending bills, which will put budget deficits on a rising trajectory over the course of the decade. Big government is back. Developed Market Fiscal Moves (Outside The US) Chart 9German Opinion Favors New Left-Wing Coalition
Biden's Show Of Force (GeoRisk Update)
Biden's Show Of Force (GeoRisk Update)
Fiscal drag is also a risk for other developed markets – but here too a substantial shift away from prudence has taken place, which is likely to be signaled to investors by the outperformance of left-wing parties in Germany’s upcoming election. Germany is only scheduled to add EUR 2.4 billion to the 25.6 billion it will receive under the EU’s pandemic recovery fund, but Berlin is likely to bring positive fiscal surprises due to the federal election on September 26. Germany will likely see a left-wing coalition replace Chancellor Angela Merkel and her long-ruling Christian Democrats (Chart 9). The platforms of the different parties can be viewed in Table 2. Our GeoRisk Indicator for Germany confirms that political risk is elevated but in this case the risk brings upside to risk assets (Appendix). Table 2German Party Platforms
Biden's Show Of Force (GeoRisk Update)
Biden's Show Of Force (GeoRisk Update)
While we expected the Greens to perform better than they are in current polling, the point is the high probability of a shift to a new left-wing government. The Social Democrats are reviving under the leadership of Olaf Scholz (Chart 10). Tellingly, Scholz led the charge for Germany to loosen its fiscal belt back in 2019, prior to the global pandemic. Chart 10Germany: Online Markets Betting On Scholz
Biden's Show Of Force (GeoRisk Update)
Biden's Show Of Force (GeoRisk Update)
Chart 11Canada: Trudeau Takes A Calculated Risk
Biden's Show Of Force (GeoRisk Update)
Biden's Show Of Force (GeoRisk Update)
In June, the cabinet approved a draft 2022 budget plan supported by Scholz that would contain new borrowing worth EUR 99.7 bn ($119 billion). This amount is not included in the chart above but it should be seen as the minimum to be passed under the new government. If a left-wing coalition is formed, as we expect, the amount will be larger, given that both the Social Democrats and the Greens have been restrained by Merkel’s party. Canada turned fiscally proactive in 2015, when the institutional ruling party, the Liberals, outflanked the more progressive New Democrats by calling for budget deficits instead of a balanced budget. The Liberals saw a drop in support in 2019 but are now calling a snap election. Prime Minister Trudeau is not as popular in general opinion as he is in the news media but his party still leads the polls (Chart 11). The Conservatives are geographically isolated and, more importantly, are out of step with the median voter on the key issues (Table 3). Table 3Canada: Liberal Agenda Lines Up With Top Voter Priorities
Biden's Show Of Force (GeoRisk Update)
Biden's Show Of Force (GeoRisk Update)
Nevertheless it is a risky time to call an election – our GeoRisk Indicator for Canada is soaring (Appendix). Granting that the Liberals are very unlikely to fall from power, whatever their strength in parliament, the key point is that parliament already approved of CAD 100 billion in new spending over the coming three years. Any upside surprise would give Trudeau the ability to push for still more deficit spending, likely focused on climate change. Chart 12Japan: Suga Will Go, LDP Will Stimulate
Japan: Suga Will Go, LDP Will Stimulate
Japan: Suga Will Go, LDP Will Stimulate
Japanese politics are heating up ahead of the Liberal Democrats’ leadership election on September 29 and the general election, due by November 28. Prime Minister Yoshihide Suga’s sole purpose in life was to stand in for Shinzo Abe in overseeing the Tokyo Olympics. Now they are done and Suga will likely be axed – if he somehow survives the election, he will not last long after, as his approval rating is in freefall. The Liberal Democrats are still the only game in town. They will try to minimize the downside risks they face in the general election by passing a new stimulus package (Chart 12). Rumor has it that the new package will nominally be worth JPY 10-15 trillion, though we expect the party to go bigger, and LDP heavyweight Toshihiro Nikai has proposed a 30 trillion headline number. It is extremely unlikely that the election will cause a hung parliament or any political shift that jeopardizes passage of the bill. Abenomics remains the policy setting – and consumption tax hikes are no longer on the horizon to impede the second arrow of Abenomics: fiscal policy. Not all countries are projecting new spending. A stronger-than-expected showing by the Christian Democrats would result in gridlock in Germany. Meanwhile the UK may signal belt-tightening in October. Bottom Line: Germany, Canada, and Japan are likely to take some of the edge off of expected fiscal drag next year. Emerging Market Fiscal Moves (And China Regulatory Update) Among the emerging markets, Russia and China are notable in Chart 7 above for having such a small fiscal stimulus during this crisis. Russia has announced some fiscal measures ahead of the September 19 Duma election but they are small: $5.2 billion in social spending, $10 billion in strategic goals over three years, and a possible $6.8 billion increase in payments to pensioners. Fiscal austerity in Russia is one reason we expect domestic political risk to remain elevated and hence for President Putin to stoke conflicts in his near abroad (see our Russian risk indicator in the Appendix). There are plenty of signs that Belarussian tensions with the Baltic states and Poland can escalate in the near term, as can fighting in Ukraine in the wake of Biden’s new defense agreement and second package of military aid. China’s actual stimulus was much larger than shown in Chart 7 above because it mostly consisted of a surge in state-controlled bank lending. China is likely to ease monetary and fiscal policy on the margin over the coming 12 months to secure the recovery in time for the national party congress in 2022. But China’s regulatory crackdown will continue during that time and our GeoRisk Indicator clearly shows the uptick in risk this year (Appendix). Chart 13China Expands Unionization?
China Expands Unionization?
China Expands Unionization?
The regulatory crackdown is part of a cyclical consolidation of Xi Jinping’s power as well as a broader, secular trend of reasserting Communist Party and centralization in China. The latest developments underscore our view that investors should not play any technical rebound in Chinese equities. The increase in censorship of financial media is especially troubling. Just as the government struggles to deal with systemic financial problems (e.g. the failing property giant Evergrande, a possible “Lehman moment”), the lack of transparency and information asymmetry will get worse. The media is focusing on the government’s interventions into public morality, setting a “correct beauty standard” for entertainers and limiting kids to three hours of video games per week. But for investors what matters is that the regulatory crackdown is proceeding to the medical sector. High health costs (like high housing and education costs) are another target of the Xi administration in trying to increase popular support and legitimacy. Central government-mandated unionization in tech companies will hurt the tech sector without promoting social stability. Chinese unions do not operate like those in the West and are unlikely ever to do so. If they did, it would compound the preexisting structural problem of rising wages (Chart 13). Wages are forcing an economic transition onto Beijing, which raises systemic risks permanently across all sectors. Bottom Line: Political and geopolitical risk are still elevated in China and Russia. China will ease monetary and fiscal policy gradually over the coming year but the regulatory crackdown will persist at least until the 2022 political reshuffle. Afghanistan: The Refugee Fallout September 2021 will officially mark the beginning of Taliban’s second bout of power in Afghanistan. Will Afghanistan be the only country to spawn an outflux of refugees? Will the Taliban wresting power in Afghanistan trigger another refugee crisis for Europe? How is the rise of the Taliban likely to affect geopolitics in South Asia? Will Afghanistan Be The Last Major Country To Spawn Refugees? Absolutely not. We expect regime failures to affect the global economy over the next few years. The global growth engine functions asymmetrically and is powered only by a fistful of countries. As economic growth in poor countries fails to keep pace with that of top performers, institutional turmoil is bound to follow. This trend will only add to the growing problem of refugees that the world has seen in the post-WWII era. History suggests that the number of refugees in the world at any point in time is a function of economic prosperity (or the lack thereof) in poorer continents (Chart 14). For instance, the periods spanning 1980-90 and 2015-20 saw the world’s poorer continents lose their share in global GDP. Unsurprisingly these phases also saw a marked increase in the number of refugees. With the world’s poorer continents expected to lose share in global GDP again going forward, the number of refugees in the world will only rise. Chart 14Refugee Flows Rise When Growth Weak In Poor Continents
Biden's Show Of Force (GeoRisk Update)
Biden's Show Of Force (GeoRisk Update)
Citizens of Syria, Venezuela, Afghanistan, South Sudan, and Myanmar today account for two-thirds of all refugees globally. To start with, these five countries’ share in global GDP was low at 0.8% in the 1980s. Now their share in global GDP is set to fall to 0.2% over the next five years (Chart 15). Chart 15Refugee Exporters Hit All-Time Low In Global GDP Share
Biden's Show Of Force (GeoRisk Update)
Biden's Show Of Force (GeoRisk Update)
Per capita incomes in top refugee source countries tend to be very low. Whilst regime fractures appear to be the proximate cause of refugee outflux, an economic collapse is probably the root cause of the civil strife and waves of refugee movement seen out of the top refugee source countries. Another factor that could have a bearing is the rise of multipolarity. Shifting power structures in the global economy affect the stability of regimes with weak institutions. Instability in Afghanistan has been a direct result of the rise and the fall of the British and Russian empires. American imperial overreach is just the latest episode. If another Middle Eastern war erupts, the implications are obvious. But so too are the implications of US-China proxy wars in Southeast Asia or Russia-West proxy wars in eastern Europe. Bottom Line: With poorer continents’ economic prospects likely to remain weak and with multipolarity here to stay, the world’s refugee problem is here to stay too. Is A Repeat Of 2015 Refugee Crisis Likely In 2021? No. 2021 will not be a replica of 2015. This is owing to two key reasons. First, Afghanistan has long witnessed a steady outflow of refugees – especially at the end of the twentieth century but also throughout the US’s 20-year war there. The magnitude of the refugee problem in 2021 will be significantly smaller than that in 2015. Secondly, voters are now differentiating between immigrants and refugees with the latter entity gaining greater acceptance (Chart 16). Chart 16DM Attitudes Permissive Toward Refugees
Biden's Show Of Force (GeoRisk Update)
Biden's Show Of Force (GeoRisk Update)
Chart 17Refugees Will Not Change Game In German/French Elections
Biden's Show Of Force (GeoRisk Update)
Biden's Show Of Force (GeoRisk Update)
Concerns about refugees will gain some political traction but it will reinforce rather than upset the current trajectory in the most important upcoming elections, in Germany in September and France next April. True, these countries feature in the list of top countries to which Afghan refugees flee and will see some political backlash (Chart 17). But the outcome may be counterintuitive. In the German election, any boost to the far-right will underscore the likely underperformance of the ruling Christian Democrats. So the German elections will produce a left-wing surprise – and yet, even if the Greens won the chancellorship (the true surprise scenario, looking much less likely now), investors will cheer the pro-Europe and pro-fiscal result. The French election is overcrowded with right-wing candidates, both center-right and far-right, giving President Macron the ability to pivot to the left to reinforce his incumbent advantage next spring. Again, the euro and the equity market will rise on the status quo despite the political risk shown in our indicator (Appendix). Of course, immigration and refugees will cause shocks to European politics in future, especially as more regime failures in the third world take place to add to Afghanistan and Ethiopia. But in the short run they are likely to reinforce the fact that European politics are an oasis of stability given what is happening in the US, China, Brazil, and even Russia and India. Bottom Line: 2021 will not see a repeat of the 2015 refugee crisis. Ironically Afghan refugees could reinforce European integration in both German and French elections. The magnitude of the Afghan crisis is smaller than in the past and most Afghan refugees are likely to migrate to Pakistan and Iran (Chart 17). But more regime failures will ensure that the flow of people becomes a political risk again sometime in the future. What Does The Rise Of Taliban Mean For India? The Taliban first held power in Afghanistan from 1996-2001. This was one of the most fraught geopolitical periods in South Asia since the 1970s. Now optimists argue that Taliban 2.0 is different. Taliban leaders are engaging in discussions with an ex-president who was backed by America and making positive overtures towards India. So, will this time be different? It is worth noting that Taliban 2.0 will have to function within two major constraints. First, Afghanistan is deeply divided and diverse. Afghanistan’s national anthem refers to fourteen ethnic groups. Running a stable government is inherently challenging in this mountainous country. With Taliban being dominated by one ethnic group and with limited financial resources at hand, the Taliban will continue to use brute force to keep competing political groups at bay. Chart 18Taliban In Line With Afghanis On Sharia
Biden's Show Of Force (GeoRisk Update)
Biden's Show Of Force (GeoRisk Update)
At the same time, to maintain legitimacy and power, the Taliban will have to support aligned political groups operating in Afghanistan and neighboring Pakistan. Second, an overwhelming majority of Afghani citizens want Sharia law, i.e. a legal code based on Islamic scripture as the official law of the land (Chart 18). Hence if the Taliban enforces a Sharia-based legal system in Afghanistan then it will fall in line with what the broader population demands. It is against this backdrop that Taliban 2.0 is bound to have several similarities with the version that ruled from 1996-2001. Additionally, US withdrawal from Afghanistan will revive a range of latent terrorist movements in the region. This poses risks for outside countries, not least India, which has a long history of being targeted by Afghani terrorist groups. The US will remain engaged in counter-terrorism operations. To complicate matters, India’s North has an even more unfavorable view of Pakistan than the rest of India. With the northern voter’s importance rising, India’s administration may be forced to respond more aggressively to a terrorist event than would have been the case about a decade ago. It is also possible that terrorism will strike at China over time given its treatment of Uighur Muslims in Xinjiang. China’s economic footprint in Afghanistan could precipitate such a shift. Bottom Line: US withdrawal from Afghanistan is bound to add to geopolitical risks as latent terrorist forces will be activated. India has a long history of being targeted by Afghani terrorist movements. Incidentally, it will take time for transnational terrorism based in Afghanistan to mount successful attacks at the West once again, given that western intelligence services are more aware of the problem than they were in 2000. But non-state actors may regain the element of surprise over time, given that the western powers are increasingly focused on state-to-state struggle in a new era of great power competition. Matt Gertken Vice President Geopolitical Strategy mattg@bcaresearch.com Ritika Mankar, CFA Editor/Strategist ritika.mankar@bcaresearch.com Section II: GeoRisk Indicator China
China: GeoRisk Indicator
China: GeoRisk Indicator
Russia
Russia: GeoRisk Indicator
Russia: GeoRisk Indicator
United Kingdom
UK: GeoRisk Indicator
UK: GeoRisk Indicator
Germany
Germany: GeoRisk Indicator
Germany: GeoRisk Indicator
France
France: GeoRisk Indicator
France: GeoRisk Indicator
Italy
Italy: GeoRisk Indicator
Italy: GeoRisk Indicator
Canada
Canada: GeoRisk Indicator
Canada: GeoRisk Indicator
Spain
Spain: GeoRisk Indicator
Spain: GeoRisk Indicator
Taiwan
Taiwan: GeoRisk Indicator
Taiwan: GeoRisk Indicator
Korea
Korea: GeoRisk Indicator
Korea: GeoRisk Indicator
Turkey
Turkey: GeoRisk Indicator
Turkey: GeoRisk Indicator
Brazil
Brazil: GeoRisk Indicator
Brazil: GeoRisk Indicator
Australia
Australia: GeoRisk Indicator
Australia: GeoRisk Indicator
Section III: Geopolitical Calendar
Highlights The US government issued its first-ever water-shortage declaration for the Colorado River basin in August, due to historically low water levels at the major reservoirs fed by the river (Chart of the Week). The drought producing the water shortage was connected to climate change by US officials.1 Globally, climate-change remediation efforts – e.g., carbon taxes – likely will create exogenous shocks similar to the oil-price shock of the 1970s. Remedial efforts will compete with redressing chronic underfunding of infrastructure. The US water supply infrastructure, for example, faces an investment shortfall of ~ $3.3 trillion over the next 20 years to replace aging plants and equipment, based on an analysis by the American Society of Civil Engineers (ASCE). This will translate to a $6,000 per-capita cost by 2039 if the current funding gap persists. Fluctuating weather and the increasing prevalence of droughts and floods will increase volatility in markets such as agriculture which rely on stable climate and precipitation patterns.We are getting long the FIW ETF at tonight's close. The ETF tracks the performance of equities in the ISE Clean Edge Water Index, which covers firms providing potable water and wastewater treatment technologies and services. This is a strategic recommendation. Feature A decades-long drought in the US Southwest linked by US officials to climate change will result in further water rationing in the region. The drought has reduced total Colorado River system water-storage levels to 40% of capacity – vs. 49% at the same time last year. It has drawn attention to the impact of climate change on daily life, and the acute need for remediation efforts. The US Southwest is a desert. Droughts and low water availability are facts of life in the region. The current drought began in 2012, and is forcing federal, state, and local governments to take unprecedented conservation measures. The first-ever water-shortage declaration by the US Bureau of Reclamation sets in motion remedial measures that will reduce water availability in the Lower Colorado basin starting in October (Map 1). Chart 1Drought Hits Colorado River Especially Hard
Drought Hits Colorado River Especially Hard
Drought Hits Colorado River Especially Hard
Map 1Colorado River Basin
Investing In Water Supply
Investing In Water Supply
The two largest reservoirs in the US – Lake Powell and Lake Meade, part of the massive engineering projects along the Colorado – began in the 1930s and now supply water to 40mm people in the US Southwest. Half of those people get their water from Lake Powell. Emergency rationing began in August, primarily affecting Arizona, but will be extended to the region later in the year. Lake Powell is used to hold run-off from the upper basin of the Colorado River from Colorado, New Mexico, Utah and Wyoming. Water from Powell is sent south to supply the lower-basin states of California, Arizona, and Nevada. Reduced snowpack due to weather shifts caused by climate change has reduced water levels in Powell, while falling soil-moisture levels and higher evaporation rates, contribute to the acceleration of droughts and their persistence down-river. Chart 2Southwests Exceptionally Hard Drought
Southwests Exceptionally Hard Drought
Southwests Exceptionally Hard Drought
Steadily increasing demand for water from agriculture, energy production and human activity brought on by population growth and holiday-makers have made the current drought exceptional (Chart 2). Most of the Southwest has been "abnormally dry or even drier" during 2002-05 and from 2012-20, according to the US EPA. According to data from the National Oceanic and Atmospheric Administration, most of the US Southwest was also warmer than the 1981 – 2010 average temperature during July (Map 2). The Colorado River Compact of 1922 governing the water-sharing rights of the river expires in 2026. Negotiations on the new treaties already have begun, as the seven states in the Colorado basin sort out their rights alongside huge agricultural interest, native American tribes, Mexico, and fast-growing urban centers like Las Vegas. Map 2Most Of The US Southwest Is Warmer Than Average
Investing In Water Supply
Investing In Water Supply
Global Water Emergency States around the globe are dealing with water crises as a result of climate change. "From Yemen to India, and parts of Central America to the African Sahel, about a quarter of the world's people face extreme water shortages that are fueling conflict, social unrest and migration," according to the World Economic Forum. Droughts, and more generally, changing weather patterns will make agricultural markets more volatile. Food production shortages due to unpredictable weather are compounding lingering pandemic related supply chain disruptions, leading to higher food prices (Chart 3). This could also fuel social unrest and political uncertainty. Floods in China’s Henan province - a key agriculture and pork region - inundated farms. Drought and extreme heat in North America are destroying crops in parts of Canada and the US. While flooding in July damaged Europe’s crops, the continent’s main medium-term risk, will be water scarcity.2 Droughts and extreme weather in Brazil have deep implications for agricultural markets, given the variety and quantity of products it exports. Water scarcity and an unusual succession of polar air masses caused coffee prices to rise earlier this year (Chart 4). The country is suffering from what national government agencies consider the worst drought in nearly a century. According to data from the NASA Earth Observatory, many of the agricultural states in Brazil saw more water evaporate from the ground and plants’ leaves than during normal conditions (Map 3). Chart 3The Pandemic and Changing Weather Patterns Will Keep Food Prices High
The Pandemic and Changing Weather Patterns Will Keep Food Prices High
The Pandemic and Changing Weather Patterns Will Keep Food Prices High
Chart 4Unpredictable Weather Will Increase Volatility In Markets For Agricultural Commodities
Unpredictable Weather Will Increase Volatility In Markets For Agricultural Commodities
Unpredictable Weather Will Increase Volatility In Markets For Agricultural Commodities
Map 3Brazil Is Suffering From Its Worst Drought In Nearly A Century
Investing In Water Supply
Investing In Water Supply
Agriculture itself could be part of a longer-term and irreversible problem – i.e. desertification. Irrigation required for modern day farming drains aquifers and leads to soil erosion. According to the EU, nearly a quarter of Spain’s aquifers are exploited, with agricultural states, such as Andalusia consuming 80% of the state’s total water. Irrigation intensive farming, the possibility of higher global temperatures and the increased prevalence of droughts and forest fires are conducive to soil infertility and subsequent desertification. This is a global phenomenon, with the crisis graver still in north Africa, Mozambique and Palestinian regions. Changing weather patterns could also impact the production of non-agricultural goods and services. One such instance is semiconductors, which are used in machines and devices spanning cars to mobile phones. Taiwan, home to the Taiwan Semiconductor Manufacturing Company – the world’s largest contract chipmaker - suffered from a severe drought earlier this year (Chart 5). While the drought did not seriously disrupt chipmaking, in an already tight market, the event did bring the issue of the impact of water shortages on semiconductor manufacturing to the fore. According to Sustainalytics, a typical chipmaking plant uses 2 to 4 million gallons of water per day to clean semiconductors. While wet weather has returned to Taiwan, relying on rainfall and typhoons to satisfy the chipmaking sector’s water needs going forward could lead to volatility in these markets. Chart 5Taiwan Faced Its Worst Drought In History Earlier This Year
Investing In Water Supply
Investing In Water Supply
Climate Change As A Macro Factor The scale of remediating existing environmental damage to the planet and the cost of investing in the technology required to sustain development and growth will be daunting. Unfortunately, there is not a great deal of research looking into how much of a cost households, firms and governments will incur on these fronts. Estimates of the actual price of CO2 – the policy variable most governments and policymakers focus on – range from as little as $1.30/ton to as much as $13/ton, according to the Peterson Institute for International Economics.3 PIIE's Jean Pisani-Ferry estimates the true cost is around $10/ton presently, after accounting for a lack of full reporting on costs and subsidies that reduce carbon costs. The cost of carbon likely will have to increase by an order of magnitude – to $130/ton or more over the next decade – to incentivize the necessary investment in technology required to deal with climate change and to sufficiently induce, via prices, behavioral adaptations by consumers at all levels. The PIIE notes, "… the accelerated pace of climate change and the magnitude of the effort involved in decarbonizing the economy, while at the same time investing in adaptation, the transition to net zero is likely to involve, over a 30-year period, major shifts in growth patterns." These are early days for assessing the costs and global macro effects of decarbonization. However, PIIE notes, these costs can be expected to "include a significant negative supply shock, an investment surge sizable enough to affect the global equilibrium interest rate, large adverse consumer welfare effects, distributional shifts, and substantial pressure on public finances." Much of the investment required to address climate change will be concentrated on commodity markets. Underlying structural issues, such as lack of investment in expanding supplies of metals and hydrocarbons required during the transition to net-zero CO2 emissions, will impart an upward bias to base metals, oil and natural gas prices over the next decade. We remain bullish industrial commodities broadly, as a result. Investment Implications Massive investment in infrastructure will be needed to address emerging water crises around the world. The American Society of Civil Engineers (ASCE) projects an investment shortfall of ~ $3.3 trillion over the next 20 years to replace aging water infrastructure in the US alone. This will translate to a $6,000 per-capita cost by 2039 if the current funding gap persists.4 At tonight's close we will be getting long the FIW ETF, which is focused on US-based firms providing potable water and wastewater treatment services. This ETF provides direct investment exposure to water remediation efforts and needed infrastructure modernization in the US. We also remain long commodity index exposure – the S&P GSCI and the COMT ETF – as a way to retain exposure to the higher commodity-price volatility that climate change will create in grain and food markets. This volatility will keep the balance of price risks to the upside. Robert P. Ryan Chief Commodity & Energy Strategist rryan@bcaresearch.com Ashwin Shyam Research Associate Commodity & Energy Strategy ashwin.shyam@bcaresearch.com Commodities Round-Up Energy: Bullish Hurricane Ida shut in ~ 96% of total US Gulf of Mexico (GoM) oil production. Colonial Pipeline, a major refined product artery for the US South and East coast closed a few of its lines due to the hurricane but has restarted operations since then. Since the share of US crude oil from this region has fallen, WTI and RBOB gasoline prices have only marginally increased, despite virtually zero crude oil production from the GoM (Chart 6). Prices are, however, likely to remain volatile, as energy producers in the region check for damage to infrastructure. Power outages and a pause in refining activity in the region will also feed price volatility over the coming weeks. Despite raising the 2022 demand forecast and pressure from the US, OPEC 2.0 stuck to its 400k b/d per month production hike in its meeting on Wednesday. Base Metals: Bullish A bill to increase the amount of royalties payable by copper miners in Chile was passed in the senate mining committee on Tuesday. As per the bill, taxes will be commensurate with the value of the red metal. If the bill is passed in its current format, it will disincentivize further private mining investments in the nation, warned Diego Hernandez, President of the National Society of Mining (SONAMI). Amid a prolonged drought in Chile during July, the government has outlined a plan for miners to cut water consumption from natural sources by 2050. Increased union bargaining power - due to higher copper prices -, a bill that will increase mining royalties, and environmental regulation, are putting pressure on miners in the world’s largest copper producing nation. Precious Metals: Bullish Jay Powell’s dovish remarks at the Jackson Hole Symposium were bullish for gold prices. The chairman of the US Central Bank stated the possibility of tapering asset purchases before the end of 2021 but did not provide a timeline. Powell reiterated the absence of a mechanical relationship between tapering and an interest rate hike. Raising interest rates is contingent on factors, such as the prevalence of COVID, inflation and employment levels in the US. The fact that the US economy is not close to reaching the maximum employment level, according to Powell, could keep interest rates lower for longer, supporting gold prices (Chart 7). Ags/Softs: Neutral The USDA crop Progress Report for the week ending August 29th reported 60% of the corn crop was good to excellent quality, marginally down by 2% vs comparable dates in 2020. Soybean crop quality on the other hand was down 11% from a year ago and was recorded at 56%. Chart 6
Investing In Water Supply
Investing In Water Supply
Chart 7
Weaker Real Rates Bullish For Gold
Weaker Real Rates Bullish For Gold
Footnotes 1 Please see Reclamation announces 2022 operating conditions for Lake Powell and Lake Mead; Historic Drought Impacting Entire Colorado River Basin. Released by the US Bureau of Reclamation on August 16, 2021. 2 Please refer to Water stress is the main medium-term climate risk for Europe’s biggest economies, S&P Global, published on August 13, 2021. 3 Please see 21-20 Climate Policy is Macroeconomic Policy, and the Implications Will Be Significant by Jean Pisani-Ferry, which was published in August 2021. 4 Please see The Economic Benefits of Investing in Water Infrastructure, published by the ASCE and The Value of Water Campaign on August 26, 2020. Investment Views and Themes Recommendations Strategic Recommendations Commodity Prices and Plays Reference Table Trades Closed in 2021 Summary of Closed Trades
Highlights China’s credit tightening may have surpassed maximum strength. Monetary policy will remain accommodative and fiscal policy will become more supportive in the rest of the year. However, overall regulatory oversight is still restrictive, limiting the scope of reflationary effects on the economy. There were signs that the “cross-cyclical” approach – a new catchphrase from the July Politburo meeting - emerged even before the start of the pandemic. The current policy backdrop resembles the situation in 2H2018. China’s new “common prosperity” plan, which sets up guidance for long-term policy direction, will likely have cyclical implications. Chinese investable stocks are in oversold territory and will probably rebound in the near term. In the next 6 to 12 months, however, we remain cautious given the lack of a catalyst to revive investor sentiment. Feature Chart 1Chinese Stocks Are Oversold In Absolute Terms
Chinese Stocks Are Oversold In Absolute Terms
Chinese Stocks Are Oversold In Absolute Terms
China’s economic momentum has slowed, while regulatory crackdowns show no signs of dissipating. Meanwhile, Chinese investable stocks in absolute terms have slumped into technically oversold territory (Chart 1). Global investors are looking at fiscal and monetary policy easing for clues to what may be next. A shift in policy direction from restrictive to reflationary will help to shore up market sentiment and the outlook for the economy. Fiscal policy implementation in 1H21 was tighter than budgeted, leaving room for more support in 2H21. The PBoC’s unexpected reserve requirement ratio (RRR) cut in early July may have been a signal that policy tightening has ended. In short, China’s financial tightening has most likely passed its peak strength. Chart 2Valuations Are Almost Back To 2018 Lows
Valuations Are Almost Back To 2018 Lows
Valuations Are Almost Back To 2018 Lows
We have no doubt that China will announce some compensatory measures in the coming months in response to rising downward pressures on the domestic economy. However, we continue to hold the view that the bar for a fresh round of material stimulus is higher today than it was in the past. The policy focus pivoting from a countercyclical to cross-cyclical adjustment, the rising emphasis on common prosperity, and the ongoing regulatory clampdowns in an array of industries, all limit the extent to which authorities can deploy the expected magnitude in infrastructure spending and bank lending. Therefore, we continue to recommend investors remain underweight Chinese stocks versus their global peers – a stance we have maintained since earlier this year – despite cheapened relative valuations in Chinese equities (Chart 2). Shifting To A Cross-Cycle Approach China’s policy shift to a cross-cyclical stance has gained more market attention since the late-July Politburo meeting. However, there were signs that the cross-cyclical approach emerged even before the start of the pandemic. Chart 3Size Of Stimulus Was Already Getting Smaller
Size Of Stimulus Was Already Getting Smaller
Size Of Stimulus Was Already Getting Smaller
During the height of the 2018/19 US-China trade war, policymakers responded to the economic shocks from imposed import tariffs with much more measured stimulus than in previous cycles (Chart 3). President Xi repetitively used the “Long March” analogy during the trade war, warning Chinese citizens to prepare for protracted hardship stemming from conflict with the US.1 The metaphor had important market implications because the attitude was fundamental to how the government handled the cyclical slowdown in 2018/19. Despite aggressive RRR and policy rate cuts in the second half of 2018, authorities maintained tight restrictions on bank lending and local government spending. Consequentially, aggregate credit growth continued to slide through end-2018 (Chart 4). Furthermore, authorities became uneasy about the sharp rise in the rate of credit expansion in Q1 2019. Following a public spat between the Premier Li Keqiang and the central bank, bank lending slowed sharply in the rest of the year. As a result, the improvement in infrastructure investment growth was small and short-lived. Despite an acceleration in local government bond issuance in 2H18 and Q1 2019, infrastructure investment growth remained on a structural downward trend throughout most of 2018 and 2019 (Chart 5). Chart 4China: A Deja Vu Of 2018-2019?
China: A Deja Vu Of 2018-2019?
China: A Deja Vu Of 2018-2019?
Chart 5Improvement In Infrastructure Investment Was Short-Lived In 2019
Improvement In Infrastructure Investment Was Short-Lived In 2019
Improvement In Infrastructure Investment Was Short-Lived In 2019
Chart 6Financial De-Risking Mode Is Still On
Financial De-Risking Mode Is Still On
Financial De-Risking Mode Is Still On
The current policy backdrop resembles the situation in 2H2018: while the central bank has kept interest rates at historically low levels and preemptively cut the RRR rate in July, lending standards remain tight and shadow bank credit continues to shrink (Chart 6). In the past Chinese authorities stimulated substantially following exogenous shocks, but did not stimulate much when business cycle was slowing in an orderly manner. A resurgence of domestic COVID cases and the severe flood in central China in July and August represent exogenous shocks and occured when the economy was losing steam. Hence, there are higher odds authorities will provide some support in response to these exogenous shocks. However, the recurring battle against COVID and lingering tensions with the US have likely prompted Chinese top leadership to extend their cross-cycle strategy. Officials may feel that a modest easing in both monetary and fiscal policies will be sufficient to offset the current economic weakness without overstimulating the economy. Bottom Line: A cross-cycle policy approach means not only responding early to small shocks with piecemeal stimulus to stabilize growth but also limiting the scope of stimulus and preparing for “protracted battles”. The response from Chinese leaders during the trade war with the US in 2018/19 may be a roadmap for policy direction in the next 12 months. Cyclical Implications From “Common Prosperity” President Xi Jinping laid out a plan for “common prosperity”, a guideline for the country’s national policy in the coming decades, at the August 18th Central Committee for Financial and Economic Affairs. Most of the plan’s objectives have 2035 deadlines and will be achieved gradually in multiple phases.2 However, in the next 12 months and leading to the 20th National Party Congress in the fall of 2022, we expect the authorities to accelerate some reform agendas that are consistent with the 14th Five-Year Plan (2021-2025). A key area that may gain momentum is increasing labor income and household consumption share in national output. Both labor compensation and household consumption as a share of GDP improved from 2011 to 2016, but the progress stalled in recent years and further deteriorated last year in the wake of the pandemic (Chart 7). Policy decision makers can reverse the falling share by either boosting income/consumption or lowering the share of capital formation in the national output, or a combination of both. Regulatory tightening in the property market has reduced investment growth in the sector, which accounts for 66% of the country’s total fixed-asset formation (Chart 8). We expect policy restrictions to continue curbing real estate investment in the rest of the year and into 2022, further shrinking the share of capital formation in the aggregate output.3 Chart 7China's Economic Rebalancing Progress Has Stalled In The Past Five Years
China's Economic Rebalancing Progress Has Stalled In The Past Five Years
China's Economic Rebalancing Progress Has Stalled In The Past Five Years
Chart 8Policymakers Are Moving Away From The 'Old Economy' Pillars
Policymakers Are Moving Away From The 'Old Economy' Pillars
Policymakers Are Moving Away From The 'Old Economy' Pillars
Chart 9Recovery In Household Income And Consumption Has Significantly Lagged Other Sectors
Recovery In Household Income And Consumption Has Significantly Lagged Other Sectors
Recovery In Household Income And Consumption Has Significantly Lagged Other Sectors
Recovery in household income and consumption has significantly lagged other sectors in China’s recent economic rebound (Chart 9). In addition to short-term, pandemic-related factors, household consumption has been sluggish due to China’s long-standing imbalanced income distribution. Given that China will be under more pressure to deliver economic progress in 2022, boosting wage growth and consumption will help to facilitate both the nation’s cross-cyclical economic strategy and President Xi’s longer-term reform plan for income and wealth redistribution. If successfully implemented, a rebalancing of labor income and consumption as a share of the national aggregate will have long-term economic benefits. However, for investors with a cyclical time frame, the transition will likely have the following implications on the market: Policymakers will keep a large fiscal budget deficit and increase spending in public services and social welfare, but there will be more pressure on the central government to keep local government debt in check. The increased fiscal burden also means that while the government will provide subsidies for households and key new-economy industries, policy at margin may move away from boosting investment in traditional infrastructure and construction (Chart 10). Chart 10Traditional Infrastructure Investment Will Remain Subdued
Traditional Infrastructure Investment Will Remain Subdued
Traditional Infrastructure Investment Will Remain Subdued
Empirical research shows that lower-income households have a higher marginal propensity to consume.4 Last year China refrained from meaningful stimulus to incentivize consumption. In contrast, the statement from the August 18th meeting indicated the focus is on securing living standards and wages among lower-income households. Common prosperity related policies may boost consumption of staples and some durable goods but will likely discourage splurging in high-end luxury goods and services. Large corporations and high-net-worth individuals will be expected to share social responsibility and the cost of reducing income inequality, either through higher and stricter tax burdens, raising minimum wages for employees, and/or donations. Bottom Line: The “common prosperity” theme will mostly entail long-term policy initiatives, but it may also have some cyclical market repercussions. Investment Recommendations Chart 11Tactical Bounce Gave Way To Cyclical Downturn In Previous Cycles
Tactical Bounce Gave Way To Cyclical Downturn In Previous Cycles
Tactical Bounce Gave Way To Cyclical Downturn In Previous Cycles
We do not rule out the possibility of a tactical (within the next three months) / technical rebound in Chinese stocks. Our August 4th report discussed how prices managed to rebound strongly within 90 days of the policy-triggered market riots in both 2015 and 2018. However, the rallies quickly faded and stocks fell to new lows (Chart 11). Prices bottomed when policy decisively turned reflationary. For now, the risks to Chinese equities are largely to the downside. Although there are some remedial measures to ease monetary and fiscal policies, officials have not sent a clear signal to ease on the regulatory front. Conversely, there are two scenarios that could prompt us to upgrade Chinese stocks to either neutral or overweight in both absolute and relative terms. Chart 12No Clear Signal Chinese Policymakers Will Ease On The Regulatory Front
No Clear Signal Chinese Policymakers Will Ease On The Regulatory Front
No Clear Signal Chinese Policymakers Will Ease On The Regulatory Front
The first scenario is that the economy does not slow further and a modest policy easing is sufficient to stabilize the economic outlook. This may happen if strong global economic growth and demand continue to support China’s export and manufacturing sectors, while domestic household consumption improves. In this case, the downside risks on the overall economy would abate, but the gradual underlying downtrend in China's old economy would be intact. We would need an additional reflationary tailwind, such as a boost from fiscal spending or a reversal of industry policy tightening, to upgrade Chinese stocks to overweight. We have argued in the past that housing appears to be the best candidate; the catalyst is missing at the moment (Chart 12). In the second scenario, Chinese policymakers may determine that the downside risks to growth are unacceptably large given existing slowdowns in the industrial and service sectors, and decide to temporarily reverse course on structural reforms. We will watch for indications of a shift in attitude. For now, we think that China’s leadership has a higher pain threshold than in the past, suggesting that this outcome is not yet probable. Jing Sima China Strategist jings@bcaresearch.com Footnotes 1"Xi Jinping calls for ‘new Long March’ in dramatic sign that China is preparing for protracted trade war", South China Morning Post. 2"Xi stresses promoting common prosperity amid high-quality development, forestalling major financial risks", Xinhua, English.news.cn 3We use fixed-asset investment (FAI) as a proxy for gross fixed capital formation (GFCF) because the National Bureau of Statistics of China does not publish the GFCF breakdown by sectors. GFCF comprises FAI, less the purchase of existing fixed assets, land and some minor items. Historically, the two series have closely tracked each other. 4"The Stimulative Effect of Redistribution", Federal Reserve Bank of San Francisco Market/Sector Recommendations Cyclical Investment Stance
Highlights Jackson Hole: The message from Jackson Hole is that the majority of the FOMC – including Fed Chair Powell - is ready to begin tapering asset purchases before year-end. There is less unanimity within the FOMC over the timing of interest rate increases following the taper. Fed Policy: The Fed is trying to communicate a separation of the balance sheet and interest rate components of its monetary policy, hoping to limit bond volatility stemming from markets pulling forward the timing of rate hikes during the taper. A tightening US labor market will make that separation difficult given the shallow path for interest rates currently discounted in the US yield curve - particularly if the current surge in US inflation proves not to be as transitory as the Fed is expecting. US Treasury Yields: Expect higher Treasury yields over the next 12-18 months as the Fed transitions from talking about tapering to actual tapering and, eventually, to rate hikes starting in H2/2022. A September To Remember? Chart 1The Fed Faces Some Tough Decisions
The Fed Faces Some Tough Decisions
The Fed Faces Some Tough Decisions
The much anticipated Jackson Hole speech from Fed Chair Jerome Powell offered a balanced tone.1 Powell did say that the Fed could begin tapering asset purchases by the end of this year, given the “substantial further progress” on the Fed’s 2% average inflation goal, if the US economy evolved in line with the Fed’s forecasts. However, Powell also noted that rate hikes would not occur without greater improvements in the US labor market, particularly given the Fed’s view that the current surge in US inflation will not prove lasting. Several other Fed officials speaking to the media before Powell’s speech hinted at a much more accelerated timetable, with tapering to begin in September and rate hikes potentially starting as soon as mid-2022. The Fed’s messaging is part of an extended conversation with financial markets to prepare for a withdrawal of pandemic-era policy stimulus from quantitative easing (QE). The FOMC is well aware that valuations on asset prices of all stripes have been boosted by loose monetary settings. Powell’s Jackson Hole comments were more nuanced than those of his FOMC colleagues, but this is no surprise as the words of the Fed Chair carry the greatest weight among investors. The Fed Chair does not want to risk a repeat of the 2013 Taper Tantrum in Treasury yields, or the December 2018 plunge in US equity prices, by sounding unexpectedly hawkish and triggering a market rout that tightens US financial conditions (Chart 1). Our baseline assumption has been that the Fed would signal a tapering at the December FOMC meeting and begin to slow asset purchases in January 2022, leading to an eventual liftoff of the fed funds rate by the end of next year. The comments from Powell and others have raised the risk that the Fed moves a bit faster than our expectations on tapering, and perhaps even for liftoff (Chart 2). This would also be faster than the expectations among bond investors. Chart 2The Fed May Be Set To Move Faster Than Our Expected Timeline
The Fed’s Separation Anxiety
The Fed’s Separation Anxiety
The New York Fed’s Survey of Primary Dealers in July showed that tapering is expected by Q1 of next year but a rate hike was not projected until the latter half of 2023 (Table 1). Current pricing in the US overnight index swap (OIS) forward curve is a bit more hawkish than that, with a full 25bp rate hike discounted by January 2023. Table 1Primary Dealers Expect A Taper, Not Rate Hikes
The Fed’s Separation Anxiety
The Fed’s Separation Anxiety
The Fed’s next move will depend on how the questions regarding the Delta variant, the true state of the US labor market and underlying US inflation momentum are resolved. Dismissing The Delta Threat? There has been a clear hit to US economic confidence from the spread of the variant. The August readings from the University of Michigan consumer sentiment survey, the Philadelphia Fed business outlook survey and the ZEW survey of US growth expectations all showed sharp declines (Chart 3). The August flash estimate of the Markit PMIs fell to 8-month and 4-month lows, respectively, indicating that the pace of US economic activity slowed. Higher frequency data like restaurant reservations and hotel bookings have also dipped in recent weeks, potentially a sign of US consumers turning more cautious on leaving home during the Delta surge. Yet there is some tentative positive news on the spread of the variant. The 7-day moving average of new COVID-19 cases in the US appears to be rolling over (Chart 4). In the more stricken states in the US south like Florida, Texas and Louisiana, the effective reproduction number has fallen below one and cases are clearly peaking, suggesting that the transmission of Delta is slowing. If these trends continue, the full hit to US growth from the variant could prove to be minimal and potentially contained to only August data Chart 3A Hit To US Confidence From The Delta Variant
A Hit To US Confidence From The Delta Variant
A Hit To US Confidence From The Delta Variant
Chart 4Has The US Delta Wave ##br##Peaked?
Has The US Delta Wave Peaked?
Has The US Delta Wave Peaked?
Fed officials have been highlighting Delta as a potential near-term risk to the economy, but some comments made last week suggested only a modest level of concern that would not derail tapering plans. For example: Dallas Fed President Robert Kaplan: “[…] what I'm seeing is, in certain sectors, as you would expect, travel-related, you're seeing weakness in some other sectors but by and large, predominantly, what we're seeing is resilience across the indicators that we look at.”2 Kansas City Fed President Esther George: “[…] by and large, I think, unlike what we experienced last year, people have mechanisms to continue to interact with the economy in a way that we didn't before. And so that gives me some confidence in the outlook that we see, that we could continue to push through this.”3 Atlanta Fed President Raphael Bostic: “What I have seen is some suggestion that things are slowing down, but they are still just slowing from extremely high levels. I have not seen big changes in the underlying dynamic.”4 Even Powell himself noted in his speech that “while the Delta variant presents a near-term risk, the prospects are good for continued progress toward maximum employment.” If the hit to the domestic US economy from Delta proves to be modest and short-lived, the Fed will want to see confirmation of this in the US employment data. Labor market slack overestimated? It is clear from other comments made last week that FOMC officials will be watching the August payrolls report very closely, especially given the perception that the US job market may be a lot tighter than the headline unemployment rate suggests. For example, Fed Governor Christopher Waller noted that “when you adjust the labor force for early retirements, if we get another million [jobs in August] we will recover about 85% of the jobs that were lost and that took almost seven years after the last recession.”5 Kaplan noted that “we do think that the labor market is much tighter than the headline statistics indicate. We've had 3 million retirements since February 2020.” Our colleagues at BCA Research’s The Bank Credit Analyst came to a similar conclusion on labor market tightness in a report published last week.6 They determined that the single largest factor driving the US labor force participation rate lower since the onset of the pandemic has been individuals choosing to retire (Chart 5). Only some of that decline has been related to early retirement decisions made in response to COVID. There has been a structural trend of a falling participation rate, by an average of 0.3 percentage points per year, since 2008 due to demographic factors. The labor force participation rate does not need to fully return to pre-pandemic levels for the Fed to conclude that its maximum employment goal has been reached, after accounting for retirements and other demographic shifts (Chart 6). This fits with the comments from Waller and Kaplan indicating that there has likely been enough labor market improvement to begin tapering asset purchases. Chart 5Most Of The Pandemic Decline In Labor Force Participation Has Occurred Due To Retirement
The Fed’s Separation Anxiety
The Fed’s Separation Anxiety
Chart 6Full Employment Without A Pre-COVID Participation Rate
Full Employment Without A Pre-COVID Participation Rate
Full Employment Without A Pre-COVID Participation Rate
Transitory or persistent inflation? In his Jackson Hole speech, Fed Chair Powell downplayed many of the factors that have driven US headline inflation higher in 2021 as “[…] the product of a relatively narrow group of goods and services that have been directly affected by the pandemic and the reopening of the economy.” He also noted that the current surge in durable goods inflation, which has contributed “about one percentage point to the 12-month measures of headline and core inflation”, was likely to end once current supply chain disruptions fade. Durables would then return to the deflationary trend of the past 25 years and help cool off current overheated US inflation. Chart 7US Inflation Is Not Slowing Down
US Inflation Is Not Slowing Down
US Inflation Is Not Slowing Down
Powell also noted the absence of significant US wage growth as reason not to be overly worried about a sustained period of high inflation. He also highlighted that “there is little reason to think” that ongoing structural disinflationary forces like technology and globalization “have suddenly reversed or abated” and that “it seems more likely that they will continue to weigh on inflation as the pandemic passes into history.” This is the message that the Fed has consistently communicated over the past several months, that high inflation was merely “transitory” and the inevitable result of year-over-year base effect comparisons and temporary supply squeezes. The problem with this interpretation is that we are now well into the summer months of 2021, past the period where base effects would be expected to boost US year-over-year inflation rates (the level of both the CPI and PCE deflator indices fell between January and May 2020 before starting to climb again in June). The July 2021 readings on annual headline and core PCE inflation were 4.2% and 3.6%, respectively, the highest rates seen since 1991 (Chart 7, top panel). The year-over-year increase appears to have been concentrated in a few components, with the Dallas Fed’s trimmed mean PCE 12-month inflation for July only climbing to 2.0%. However, the 6-month annualized measure was a more rapid 2.6% - the fastest such pace in 13 years - suggesting that the momentum of US inflation is both broadening and accelerating on the margin (second panel). Chart 8A Sustainable, Not Transitory, Rise In Global Inflation
A Sustainable, Not Transitory, Rise In Global Inflation
A Sustainable, Not Transitory, Rise In Global Inflation
Powell, like many other developed market central bankers, is making a big bet that the “transitory” inflation narrative will prove to be correct and the current surge in inflation will soon subside. Yet already, global supply chain disruptions have lingered longer than the Fed has been expecting. There are also deeper underlying trends in inflation that are challenging the “transitory” narrative. The NFIB small business survey showed that a net 52% of respondents reported raising selling prices in July, while a net 44% planned future price hikes (third panel), both readings last seen during the days of double-digit US inflation in the late 1970s. US firms are successfully passing on rising input costs to US consumers, which is influencing US consumer inflation expectations. The University of Michigan consumer survey for August showed that US households expect inflation over the next year of 4.6% and over the next 5-10 years of 2.9%, with both series well above pre-pandemic lows (bottom panel). The trends in higher inflation seen in the US, and elsewhere, are not just limited to commodity prices where supply squeezes were most prevalent earlier this year and where price momentum is peaking (Chart 8). A GDP-weighted average of core inflation rates for 14 developed market economies reached 2.50% in June and 2.4% in July, levels last seen in the mid-1990s. Higher core inflation readings are consistent with intensifying price pressures stemming from diminished economic slack. The broad swings in our global core inflation measure correlate strongly with the IMF’s estimate of the output gap for the advanced economies (bottom panel). The current acceleration in global core inflation is entirely consistent with the rapid narrowing of the global output gap projected by the IMF for 2021 and, more importantly, 2022. This suggests that underlying inflation pressures, both within and outside the US, will linger into next year, providing an offset the expected drag on “non-core” inflation from slowing commodity price momentum. Already, lingering supply squeezes and stubbornly high US inflation are causing concern among some FOMC members, as noted in these comments last week: Robert Kaplan: “[…] headline PCE inflation next year, we think is going to be in the neighborhood of 2.5%, and there's risk that could be higher. And so we think some of these supply-demand imbalances for materials, some of them will not moderate, but some of them are going to persist longer than people think.” Esther George: “[…] if you continue to have supply constraints and strong demand, you might expect that those will persist more through this year or longer than we originally anticipated.” Chris Waller: “I do think it’s going to be more persistent than I may have thought back in May.” Chart 9Fed Tapering To Deal With Financial Stability Risks?
Fed Tapering To Deal With Financial Stability Risks?
Fed Tapering To Deal With Financial Stability Risks?
Importantly, the senior FOMC leadership - Powell, Lael Brainard, Richard Clarida – has been sticking with the “transitory” narrative. However, even Clarida noted in a speech in early August that he would consider core PCE inflation at or above 3% at year-end to be “much more than a “moderate” overshoot” of the Fed’s 2% inflation objective.7 In his role as Fed Chair, Powell must speak on behalf of the entire FOMC, even if those views are not necessarily his own. Given the growing chorus of Fed voices expressing concern that US inflation could remain higher for longer, it will be increasingly difficult for Powell to do what he did at Jackson Hole – sound more dovish than the individual FOMC members with regards to inflation risks. What about financial stability risks from QE? Fed officials have been understandably cautious in their comments about how QE (and a 0% funds rate) could be influencing asset prices (Chart 9). However, with equity markets at record highs, corporate bond yields near record lows despite high levels of corporate leverage, and US house prices soaring – the S&P CoreLogic Case-Shiller national index rose 18.6% on a year-over-year basis in June, the fastest pace in its 35-year history - it is difficult not to see the role of the Fed’s easy money policies in boosting risk seeking, yield chasing activities. Stimulative financial conditions are also creating future upside growth risks, with the Conference Board leading economic indicator now reaccelerating (bottom panel). Robert Kaplan, Boston Fed President Eric Rosengren and St. Louis Fed President James Bullard have voiced concerns that QE, particularly the Fed’s buying of agency mortgage-backed securities (MBS), have played a significant role in the current US housing boom. The senior FOMC leadership has avoided any such comments for obvious reasons – imagine the market reaction if Powell expressed concerns about high house prices or equity market valuations. However, for those at the Fed already looking to begin tapering sooner, booming asset prices are an additional reason to vote that way as soon as the September FOMC meeting. Separating Tapering From Rate Hikes It seems clear that the majority of the FOMC is now leaning towards starting to taper before year-end, if US growth and employment maintain recent strength. The common message of Fed officials, from Powell on down, is that enough progress has been made on the Fed’s 2% average inflation target objective to justify tapering. Market-based inflation expectations from the TIPS and CPI swap markets are consistent with that interpretation, with breakevens and forward inflation rates within the 2.3-2.5% range consistent with the Fed’s 2% inflation mandate (Chart 10). Yet while our Fed Monitor continues to flag the need for tighter US monetary policy, only 100bps of rate hikes are discounted in the US OIS curve by the end of 2024 – and only after a first rate hike not expected to occur until January 2023. Despite the common messaging on the start of the taper, the Fed voices were singing a bit less in harmony about the potential timing of the first interest rate hike post-taper. Powell went out of his way to note in his Jackson Hole speech that “the timing and pace of the coming reduction in asset purchases will not be intended to carry a direct signal regarding the timing of interest rate liftoff, for which we have articulated a different and substantially more stringent test.” That test, of course, is when the Fed deems that its maximum employment objective has been reached. Can the Fed continue to successfully separate guidance on balance sheet decisions from guidance on future interest rate moves? Current pricing from US OIS and CPI swap forward curves indicates that the market is discounting negative real policy rates, with the Fed never raising rates above inflation, for the next decade (Chart 11). This goes a long way to explain the persistence of negative real US Treasury yields at a time of elevated inflation readings. Although a decade of negative real interest rates is also consistent with the market believing the equilibrium real interest rate (i.e. r-star) is negative – a view currently expressed by no one on the FOMC. Chart 10Too Few Rate Hikes Discounted In The US OIS Curve
Too Few Rate Hikes Discounted In The US OIS Curve
Too Few Rate Hikes Discounted In The US OIS Curve
Chart 11Markets Believe The Fed Will Never Raise Rates Above Inflation
Markets Believe The Fed Will Never Raise Rates Above Inflation
Markets Believe The Fed Will Never Raise Rates Above Inflation
That persistent pricing of negative real rates make sense when there is modest headline inflation and ample spare capacity in the US economy and labor markets. However, that complacency on future rate hikes will be shaken if the US economy approaches full employment and inflation remains above the Fed’s 2% target – outcomes that we expect to occur by the second half of next year. That will lead to the first fed rate hike of the next cycle in Q4 2022, but only after the taper that we expect to start in either December 2021 or January 2022 is completed in Q3 2022. Bottom Line: A tightening US labor market will make the Fed’s current guidance on the separation of tapering from rate hikes increasingly unconvincing, given the shallow path for interest rates currently discounted in the US yield curve - particularly if the current surge in US inflation proves not to be as transitory as the Fed is expecting. Jackson Hole Investment Conclusion – Expect Higher US Treasury Yields Chart 12Stay Below-Benchmark On US Duration
Stay Below-Benchmark On US Duration
Stay Below-Benchmark On US Duration
With such a modest path for future rate hikes, and bond yields, discounted in US forward interest rate curves, we continue to advocate positioning for higher US Treasury yields on a strategic (6-18 months) basis (Chart 12). We see the benchmark 10-year Treasury yield eventually reaching a peak in the 2-2.25% range by the end of 2022. We recommend maintaining a below-benchmark duration stance in the US, while staying underweight US Treasuries in US and global bond portfolios. There is even a case to be made for a more tactical (i.e. shorter-term) bearish stance on US Treasuries with the US data surprise cycle set to turn towards upside surprises, especially if the negative impact of the Delta variant on confidence and spending begins to wane as case numbers start to decline in the coming weeks. Bottom Line: Expect higher Treasury yields over the next 12-18 months as the Fed transitions from talking about tapering to actual tapering and, eventually, to rate hikes starting in H2/2022. Robert Robis, CFA Chief Fixed Income Strategist rrobis@bcaresearch.com Footnotes 1 A transcript of Powell’s speech can be found here: https://www.federalreserve.gov/newsevents/speech/powell20210827a.htm 2 https://finance.yahoo.com/news/dallas-fed-president-robert-kaplan-yahoo-finance-transcript-august-2021-215700082.html 3 https://finance.yahoo.com/news/kansas-city-fed-president-esther-george-yahoo-finance-transcript-august-2021-113024734.html 4 https://www.reuters.com/business/exclusive-feds-bostic-says-reasonable-begin-bond-buying-taper-october-2021-08-27/ 5 https://finance.yahoo.com/news/fed-gov-waller-strong-august-jobs-report-will-be-green-light-for-taper-202340105.html 6 Please see BCA Research The Bank Credit Analyst September 2021 Section II, “The Return To Maximum Employment: It May Be Faster Than You Think”, available at bca.bcaresearch.com 7 https://www.federalreserve.gov/newsevents/speech/clarida20210804a.htm Recommendations Duration Regional Allocation Spread Product Yields & Returns Global Bond Yields Historical Returns