Policy

Highlights Chart 1Still Close To Fair Value
Still Close To Fair Value
Still Close To Fair Value
Treasury yields fell significantly in July, particularly at the long end of the curve. We continue to view this move as an overreaction to mediocre economic data that will be reversed this fall when labor supply constraints ease and employment surprises to the upside. It’s important to note, however, that despite the drop in long-dated yields the 5-year/5-year forward Treasury yield remains within the bounds of its 1.75% to 2.5% fair value range (Chart 1). That is, shorter-maturity Treasury yields have much more upside than long-dated yields on a 6-12 month investment horizon. We expect the next big move in bonds to be a bear-flattening of the yield curve as the market prices in a Fed rate hike cycle that we see starting near the end of 2022. Investors should position for that outcome today by keeping portfolio duration low and by entering yield curve flatteners. Feature Table 1Recommended Portfolio Specification
It’s Time For Bear-Flatteners
It’s Time For Bear-Flatteners
Table 2Fixed Income Sector Performance
It’s Time For Bear-Flatteners
It’s Time For Bear-Flatteners
Investment Grade: Neutral Chart 2Investment Grade Market Overview
Investment Grade Market Overview
Investment Grade Market Overview
Investment grade corporate bonds underperformed the duration-equivalent Treasury index by 37 basis points in July, dragging year-to-date excess returns down to +172 bps. The combination of above-trend economic growth and accommodative monetary policy supports continued positive excess returns for spread product versus Treasuries. At 89 bps, the 3-year/10-year Treasury slope remains steep. This is a strong signal that monetary conditions are accommodative. But despite the positive macro back-drop, investment grade valuations are extremely tight (Chart 2). A recent report looked at what different combinations of Treasury slope and corporate spreads have historically signaled about corporate bond excess returns.1 It shows that tight corporate spreads only correlate with negative excess returns once the 3-year/10-year Treasury slope is below 50 bps. Though we retain a positive view of spread product as a whole, better value can be found outside of the investment grade corporate sector. Specifically, we recommend that investors shift into high-yield corporates, municipal bonds and USD-denominated EM sovereigns and corporates. We also advise investors to favor long-maturity corporate bonds and those corporate sectors with elevated Duration-Times-Spread.2 Table 3ACorporate Sector Relative Valuation And Recommended Allocation*
It’s Time For Bear-Flatteners
It’s Time For Bear-Flatteners
Table 3BCorporate Sector Risk Vs. Reward*
It’s Time For Bear-Flatteners
It’s Time For Bear-Flatteners
High-Yield: Overweight Chart 3High-Yield Market Overview
High-Yield Market Overview
High-Yield Market Overview
High-Yield underperformed the duration-equivalent Treasury index by 34 basis points in July, dragging year-to-date excess returns down to +433 bps. A recent report looked at the default expectations that are currently priced into the junk index and considered whether they are likely to be met.3 If we demand an excess spread of 100 bps and assume a 40% recovery rate on defaulted debt, then the High-Yield index embeds an expected default rate of 3.2% (Chart 3). Using a model of the 12-month trailing speculative grade default rate that is based on gross corporate leverage (pre-tax profits over total debt) and C&I lending standards, we estimate that the 12-month default rate will fall to between 2.3% and 2.8%, below what the market currently discounts. Notably, the corporate default rate is tracking at an annualized rate of roughly 1.6% through the first six months of the year, well below the estimate generated by our macro model. Another recent report looked at the incremental spread pick-up investors can earn by moving out of investment grade corporates and into junk.4 It concluded that the extra spread available in high-yield is worth grabbing and that B-rated bonds look particularly attractive in risk-adjusted terms. MBS: Underweight Chart 4MBS Market Overview
MBS Market Overview
MBS Market Overview
Mortgage-Backed Securities underperformed the duration-equivalent Treasury index by 19 basis points in July, dragging year-to-date excess returns down to -64 bps. The nominal spread between conventional 30-year MBS and equivalent-duration Treasuries widened 8 bps in July. The spread is wide compared to recent history, but it remains tight compared to the pace of mortgage refinancings (Chart 4). The conventional 30-year MBS option-adjusted spread (OAS) widened 3 bps in July (panel 3), and it is now starting to look more competitive compared to other similarly risky spread sectors. The conventional 30-year MBS OAS sits at 36 bps, below the 54 bps offered by Aa-rated corporate bonds but above the 20 bps offered by Aaa-rated consumer ABS and the 34 bps offered by Agency CMBS. In a recent report we looked at MBS performance and valuation across the coupon stack.5 We noted that the higher convexity of high-coupon MBS makes them likely to outperform lower-coupon MBS in a rising yield environment. Higher coupon MBS also have greater OAS than lower coupons. This makes the high-coupon MBS more likely to outperform in a flat bond yield environment as well. Given our view that bond yields will be higher in 6-12 months, we recommend favoring high coupons (4%, 4.5%) over low coupons (2%, 2.5%, 3%) within an overall underweight allocation to Agency MBS. Government-Related: Neutral Chart 5Government-Related Market Overview
Government-Related Market Overview
Government-Related Market Overview
The Government-Related Index underperformed the duration-equivalent Treasury index by 34 basis points in July, dragging year-to-date excess returns down to +57 bps (Chart 5). Sovereign debt underperformed duration-equivalent Treasuries by 149 bps in July, dragging year-to-date excess returns down to -113 bps. Foreign Agencies underperformed the Treasury benchmark by 11 bps on the month, dragging year-to-date excess returns down to +35 bps. Local Authority bonds underperformed by 19 bps in July, dragging year-to-date excess returns down to +372 bps. Domestic Agency bonds outperformed by 2 bps, bringing year-to-date excess returns up to +28 bps. Supranationals performed in line with Treasuries in July, year-to-date excess returns held flat at +26 bps. USD-denominated Emerging Market (EM) Sovereign bonds continue to offer an attractive spread pick-up versus investment grade US corporate bonds with the same credit rating and duration. Attractive countries include: Qatar, UAE, Saudi Arabia, Mexico and Russia. A recent report looked at valuation within the investment grade USD-denominated EM corporate space.6 It found that EM corporates are attractively priced relative to US corporate bonds across the entire investment grade credit spectrum. It also found that EM corporates are attractive relative to EM sovereigns within the A and Baa credit tiers. EM sovereigns have the edge in the Aa credit tier. Municipal Bonds: Overweight Chart 6Municipal Market Overview
Municipal Market Overview
Municipal Market Overview
Municipal bonds underperformed the duration-equivalent Treasury index by 37 basis points in July, dragging year-to-date excess returns down to +271 bps (before adjusting for the tax advantage). The economic and policy back-drop is favorable for municipal bond performance. Trailing 4-quarter net state & local government savings were already positive through the end of Q1 2021 and they received another significant boost in Q2 as funds from the American Rescue Plan were doled out (Chart 6). With state & local government balance sheets in such good shape, we are comfortable moving down in quality within municipal bonds. A move down in quality is especially compelling because of tight Aaa muni valuations relative to Treasuries (top panel). Valuation is more compelling in the lower investment grade credit tiers, especially at the long-end of the curve.7 GO munis in the 12-17 year maturity bucket offer a 10% breakeven tax rate versus corporates with the same credit rating and duration. The breakeven tax rate for Revenue munis is just 2% (panel 2). Finally, high-yield muni spreads are reasonably attractive relative to high-yield corporates, offering a breakeven tax rate of 25% (panel 4). But despite the attractive spread, we recommend only a neutral allocation to high-yield munis versus high-yield corporates as the deep negative convexity of high-yield munis makes them susceptible to extension risk if bond yields rise. Treasury Curve: Buy 2/10 Barbell Versus 5-Year Bullet Chart 7Treasury Yield Curve Overview
Treasury Yield Curve Overview
Treasury Yield Curve Overview
The Treasury curve bull-flattened in July. Bond yields were down across the curve, but by much more at the long end. The 2-year/10-year slope flattened 15 bps to end the month at 105 bps. The 5-year/30-year slope steepened 1 bp to end the month at 120 bps. While we expect the recent decline in bond yields to reverse during the next 6-12 months, we do not think this reversal will coincide with a re-steepening of the 2/10 yield curve. We noted on the first page of this report that the 5-year/5-year forward Treasury yield remains close to its fair value range. Last week’s report demonstrated that yield curve steepening only occurs when either the Fed is cutting rates or the 5-year/5-year forward yield rises.8 This means that the 2/10 Treasury curve is more likely to flatten than steepen during the next 6-12 months, even as bond yields move higher. Similarly, we observe that the overnight index swap (OIS) curve is priced for the fed funds rate to be 0.17% in one year’s time and 1.36% in five years (Chart 7). While the latter rate has 157 bps of upside if it converges all the way back to its 2018 high, this pales in comparison to the 269 bps of upside in the 12-month forward rate. The yield curve will flatten as the 12-month forward OIS rate converges with the 5-year forward rate (panel 3). Investors should position in yield curve flatteners on a 6-12 month horizon. Specifically, we recommend shorting the 5-year bullet versus a duration-matched 2/10 barbell. TIPS: Neutral Chart 8TIPS Market Overview
TIPS Market Overview
TIPS Market Overview
TIPS outperformed the duration-equivalent nominal Treasury index by 112 basis points in July, bringing year-to-date excess returns up to +578 bps. The 10-year and 5-year/5-year forward TIPS breakeven inflation rates rose by 9 bps and 8 bps, respectively, on the month. At 2.43%, the 10-year TIPS breakeven inflation rate is near the middle of the 2.3% to 2.5% range that is consistent with inflation expectations being well anchored around the Fed’s target (Chart 8). Meanwhile, at 2.26%, the 5-year/5-year forward TIPS breakeven inflation rate is just below target (panel 3). With long-dated inflation expectations close to the Fed’s target levels, we see limited upside on a 6-12 month investment horizon. We also see the cost of short-maturity inflation protection falling during the next few months as realized inflation moderates from its extremely high level. This will lead to some modest steepening of the inflation curve (bottom panel). While the inflation curve has some room to steepen, we don’t see it returning to positive territory. An inverted inflation curve is simply more consistent with the Fed’s Average Inflation Target than a positively sloped one. This is because the Fed’s new framework calls for it to attack its inflation target from above rather than from below. ABS: Overweight Chart 9ABS Market Overview
ABS Market Overview
ABS Market Overview
Asset-Backed Securities underperformed the duration-equivalent Treasury index by 2 basis points in July, dragging year-to-date excess returns down to +37 bps. Aaa-rated ABS underperformed by 3 bps on the month, dragging year-to-date excess returns down to +28 bps. Non-Aaa ABS outperformed by 4 bps, bringing year-to-date excess returns up to +88 bps. The stimulus from last year’s CARES act led to a significant increase in household savings when individual checks were mailed in April 2020. That excess savings has still not been spent and the most recent round of stimulus checks has only added to the stockpile, pushing the savings rate higher yet again (Chart 9). The extraordinarily large stock of household savings means that the collateral quality of consumer ABS is also extraordinarily high. Indeed, many households have been using their windfalls to pay down consumer debt (bottom panel). Investors should remain overweight consumer ABS and should also take advantage of the high quality of household balance sheets by moving down the quality spectrum. Non-Agency CMBS: Neutral Chart 10CMBS Market Overview
CMBS Market Overview
CMBS Market Overview
Non-Agency Commercial Mortgage-Backed Securities outperformed the duration-equivalent Treasury index by 3 basis points in July, bringing year-to-date excess returns up to +187 bps. Aaa Non-Agency CMBS performed in-line with Treasuries in July, keeping year-to-date excess returns steady at +82 bps. Non-Aaa Non-Agency CMBS outperformed Treasuries by 16 bps on the month, bringing year-to-date excess returns up to +539 bps (Chart 10). Though returns have been strong and spreads remain attractive, particularly for lower-rated CMBS, we continue to recommend only a neutral allocation to the sector because of the structurally challenging environment for commercial real estate. Agency CMBS: Overweight Agency CMBS underperformed the duration-equivalent Treasury index by 28 basis points in July, dragging year-to-date excess returns down to +87 bps. The average index option-adjusted spread widened 5 bps on the month and it currently sits at 34 bps (bottom panel). Though Agency CMBS spreads have recovered to well below pre-COVID levels, they still look attractive compared to other similarly risky spread products. Stay overweight. Appendix A: Butterfly Strategy Valuations The following tables present the current read-outs from our butterfly spread models. We use these models to identify opportunities to take duration-neutral positions across the Treasury curve. The following two Special Reports explain the models in more detail: US Bond Strategy Special Report, “Bullets, Barbells And Butterflies”, dated July 25, 2017, available at usbs.bcaresearch.com US Bond Strategy Special Report, “More Bullets, Barbells And Butterflies”, dated May 15, 2018, available at usbs.bcaresearch.com Table 4 shows the raw residuals from each model. A positive value indicates that the bullet is cheap relative to the duration-matched barbell. A negative value indicates that the barbell is cheap relative to the bullet. Table 4Butterfly Strategy Valuation: Raw Residuals In Basis Points (As Of July 30TH, 2021)
It’s Time For Bear-Flatteners
It’s Time For Bear-Flatteners
Table 5 scales the raw residuals in Table 4 by their historical means and standard deviations. This facilitates comparison between the different butterfly spreads. Table 5Butterfly Strategy Valuation: Standardized Residuals (As Of July 30TH, 2021)
It’s Time For Bear-Flatteners
It’s Time For Bear-Flatteners
Table 6 flips the models on their heads. It shows the change in the slope between the two barbell maturities that must be realized during the next six months to make returns between the bullet and barbell equal. For example, a reading of 26 bps in the 5 over 2/10 cell means that we would only expect the 5-year to outperform the 2/10 if the 2/10 slope steepens by more than 26 bps during the next six months. Otherwise, we would expect the 2/10 barbell to outperform the 5-year bullet. Table 6Discounted Slope Change During Next 6 Months (BPs)
It’s Time For Bear-Flatteners
It’s Time For Bear-Flatteners
Appendix B: Excess Return Bond Map The Excess Return Bond Map is used to assess the relative risk/reward trade-off between different sectors of the US bond market. It is a purely computational exercise and does not impose any macroeconomic view. The Map’s vertical axis shows 12-month expected excess returns. These are proxied by each sector’s option-adjusted spread. Sectors plotting further toward the top of the Map have higher expected returns and vice-versa. Our novel risk measure called the “Risk Of Losing 100 bps” is shown on the Map’s horizontal axis. To calculate it, we first compute the spread widening required on a 12-month horizon for each sector to lose 100 bps or more relative to a duration-matched position in Treasury securities. Then, we divide that amount of spread widening by each sector’s historical spread volatility. The end result is the number of standard deviations of 12-month spread widening required for each sector to lose 100 bps or more versus a position in Treasuries. Lower risk sectors plot further to the right of the Map, and higher risk sectors plot further to the left. Chart 11Excess Return Bond Map (As Of July 30TH, 2021)
It’s Time For Bear-Flatteners
It’s Time For Bear-Flatteners
Ryan Swift US Bond Strategist rswift@bcaresearch.com Footnotes 1 Please see US Bond Strategy Weekly Report, “The Post-FOMC Credit Environment”, dated June 29, 2021. 2 For ideas on how to increase the average spread of a US bond portfolio please see US Bond Strategy Weekly Report, “The Collapsing Credit Risk Premium”, dated July 20, 2021. 3 Please see US Bond Strategy Weekly Report, “The Post-FOMC Credit Environment”, dated June 29, 2021. 4 Please see US Bond Strategy Weekly Report, “The Collapsing Credit Risk Premium”, dated July 20, 2021. 5 Please see US Bond Strategy Weekly Report, “A New Conundrum”, dated April 20, 2021. 6 Please see US Bond Strategy Weekly Report, “The Post-FOMC Credit Environment”, dated June 29, 2021. 7 Please see US Bond Strategy Weekly Report, “The Collapsing Credit Risk Premium”, dated July 20, 2021. 8 Please see US Bond Strategy / Global Fixed Income Strategy Weekly Report, “A Bump On The Road To Recovery”, dated July 27, 2021.
Dear Client, This week, in lieu of our regular report, I am sending you a special report written by my colleague Jonathan LaBerge, chief strategist of our flagship The Bank Credit Analyst service. Jonathan argues that investors should see social media as a technological innovation that harms productivity. While Jonathan concedes that social media was not the main driver of policy uncertainty and political risk over the past decade, he makes a good case that it plays an aggravating role. He warns that social media and political polarization still pose risks to the macroeconomic outlook in the coming years, while also highlighting idiosyncratic risks threatening social media stocks. We trust that you will find this report insightful. We will resume regular publication next week. All very best, Matt Gertken Vice President Geopolitical Strategy US Political Strategy BCA Research Highlights Investors should view social media as a technological innovation with negative productivity growth. Social media has contributed to policy mistakes – such as fiscal austerity and protectionism – that have acted as shocks to aggregate demand over the past 15 years. The cyclical component of productivity was long lasting in nature during the last economic expansion. Forces that negatively impact economic growth but do not change the factors of production necessarily reduce measured productivity, and repeated policy mistakes strongly contributed to the slow growth profile of the last economic cycle. Political polarization in a rapidly changing world is the root cause of these policy shocks, but social media likely facilitated and magnified them. The risks of additional mistakes from populism remain present, even before considering other risks to society from social media: a reduction in mental health among young social media users, and the role that social media has played in spreading misinformation. A potential revival in protectionist sentiment is a risk to a constructive cyclical view that we will be closely monitoring over the coming 12-24 months. Investors with concentrated positions in social media stocks should be aware of the potential idiosyncratic risks facing these companies from the public’s impression of the impact of social media on society – especially if social media companies come to be widely associated with political gridlock, the polarization of society, and failed economic policies (as already appears to be the case). Feature Investors should view social media as a technological innovation with negative productivity growth. Social media has contributed to policy mistakes – such as fiscal austerity and protectionism – that have acted as shocks to aggregate demand over the past 15 years. Political polarization in a rapidly changing world is the root cause of these policy shocks, but social media likely facilitated and magnified them. While the risk of premature fiscal consolidation appears low today compared to the 2010-14 period, the pandemic and its aftermath could force the Biden administration or Congressional Democrats toward protectionist or otherwise populist actions over the coming year in the lead up to the 2022 mid-term elections. The midterms, for their part, are expected to bring gridlock back into US politics, which could remove fiscal options should the economy backslide. Frequent shocks during the last economic expansion reinforced the narrative of secular stagnation. In the coming years, any additional policy shocks following a return to economic normality will again be seen by both investors and the Fed as strong justification for low interest rates – despite the case for cyclically and structurally higher bond yields. In addition, investors with concentrated positions in social media companies should take seriously the long-term idiosyncratic risks facing these stocks. These risks stem from the public’s impression of the impact of social media on society, particularly if social media comes to be widely associated with political gridlock, the polarization of society, and failed economic policies. A Brief History Of Social Media The earliest social networking websites date back to the late 1990s, but the most influential social media platforms, such as Facebook and Twitter, originated in the mid-2000s. Prior to the advent of modern-day smartphones, user access to platforms such as Facebook and Twitter was limited to the websites of these platforms (desktop access). Following the release of the first iPhone in June 2007, however, mobile social media applications became available, allowing users much more convenient access to these platforms. Charts 1 and 2 highlight the impact that smartphones have had on the spread of social media, especially since the release of the iPhone 3G in 2008. In 2006, Facebook had roughly 12 million monthly active users; by 2009, this number had climbed to 360 million, growing to over 600 million the year after. Twitter, by contrast, grew somewhat later, reaching 100 million monthly active users in Q3 2011. Social media usage is more common among those who are younger, but Chart 3 highlights that usage has risen over time for all age groups. As of Q1 2021, 81% of Americans aged 30-49 reported using at least one social media website, compared to 73% of those aged 50-64 and 45% of those aged 65 and over. Chart 4 highlights that the usage of Twitter skews in particular toward the young, and that, by contrast, Facebook and YouTube are the social media platforms of choice among older Americans. Chart 1Facebook: Monthly Active Users
The Social Media Magnification Effect: Austerity, Populism, And Slower Growth
The Social Media Magnification Effect: Austerity, Populism, And Slower Growth
Chart 2Twitter: Monthly Active Users Worldwide
The Social Media Magnification Effect: Austerity, Populism, And Slower Growth
The Social Media Magnification Effect: Austerity, Populism, And Slower Growth
Chart 3A Sizeable Majority Of US Adults Regularly Use Social Media
A Sizeable Majority Of US Adults Regularly Use Social Media
A Sizeable Majority Of US Adults Regularly Use Social Media
Chart 4Older Americans Use Facebook Far More Than Twitter
The Social Media Magnification Effect: Austerity, Populism, And Slower Growth
The Social Media Magnification Effect: Austerity, Populism, And Slower Growth
As a final point documenting the development and significance of social media, Chart 5 highlights that more Americans now report consuming news often (roughly once per day) from a smartphone, computer, or tablet other than from television. Radio and print have been completely eclipsed as sources of frequent news. The major news publications themselves are often promoted through social media, but the rise of the Internet has weighed heavily on the journalism industry. Social media has, for better and for worse, enabled the rapid proliferation of alternative news, citizen journalism, rumor, conspiracy theories, and foreign disinformation. Chart 5Social Media Has Changed The Way People Consume News
The Social Media Magnification Effect: Austerity, Populism, And Slower Growth
The Social Media Magnification Effect: Austerity, Populism, And Slower Growth
The Link Between Social Media And Post-GFC Austerity Following the 2008-2009 global financial crisis (GFC), there have been at least five deeply impactful non-monetary shocks to the US and global economies that have contributed to the disconnection between growth and interest rates: A prolonged period of US household deleveraging from 2008-2014 The Euro Area sovereign debt crisis Fiscal austerity in the US, UK, and Euro Area from 2010 – 2012/2014 The US dollar / oil price shock of 2014 The rise of populist economic policies, such as the UK decision to leave the European Union, and the US-initiated trade war of 2018-2019. Among these shocks to growth, social media has had a clear impact on two of them. In the case of austerity in the aftermath of the Great Recession, a sharp rise in fiscal conservatism in 2009 and 2010, emblematized by the rise of the US Tea Party, profoundly affected the 2010 US midterm elections. It is not surprising that there was a fiscally conservative backlash following the crisis: the US budget deficit and debt-to-GDP ratio soared after the economy collapsed and the government enacted fiscal stimulus to bail out the banking system. And midterm elections in the US often lead to significant gains for the opposition party However, Tea Party supporters rapidly took up a new means of communicating to mobilize politically, and there is evidence that this contributed to their electoral success. Chart 6 illustrates that the number of tweets with the Tea Party hashtag rose significantly in 2010 in the lead-up to the election, which saw the Republican Party take control of the House of Representatives as well as the victory of several Tea Party-endorsed politicians. Table 1 highlights that Tea Party candidates, who rode the wave of fiscal conservatism, significantly outperformed Democrats and non-Tea Party Republicans in the use of Twitter during the 2010 campaign, underscoring that social media use was a factor aiding outreach to voters. Chart 6Tea Party Supporters Rapidly Adopted Social Media To Mobilize Politically
Tea Party Supporters Rapidly Adopted Social Media To Mobilize Politically
Tea Party Supporters Rapidly Adopted Social Media To Mobilize Politically
Table 1Tea Party Candidates Significantly Outperformed In Their Use Of Social Media
The Social Media Magnification Effect: Austerity, Populism, And Slower Growth
The Social Media Magnification Effect: Austerity, Populism, And Slower Growth
And while it is more difficult to analyze the use and impact of Facebook by Tea Party candidates and supporters owing to inherent differences in the structure of the Facebook platform, interviews with core organizers of both the Tea Party and Occupy Wall Street movements have noted that activists in these ideologically opposed groups viewed Facebook as the most important social networking service for their political activities.1 Under normal circumstances, we agree that fiscal policy should be symmetric, with reduced fiscal support during economic expansions following fiscal easing during recessions. But in the context of multi-year household deleveraging, the fiscal drag that occurred in following the 2010 midterm elections was clearly a policy mistake. This mistake occurred partially under full Democratic control of government and especially under a gridlocked Congress after 2010. Chart 7 highlights that the contribution to growth from government spending turned sharpy negative in 2010 and continued to subtract from growth for some time thereafter. In addition, panel of Chart 7 highlights that the US economic policy uncertainty index rose in 2010 after falling during the first year of the recovery, reaching a new high in 2011 during the Tea Party-inspired debt ceiling crisis. Chart 7The Fiscal Drag That Followed The 2010 Midterm Elections Was A Clear Policy Mistake
The Fiscal Drag That Followed The 2010 Midterm Elections Was A Clear Policy Mistake
The Fiscal Drag That Followed The 2010 Midterm Elections Was A Clear Policy Mistake
In addition to the negative impact of government spending on economic growth, this extreme uncertainty very likely damaged confidence in the economic recovery, contributing to the subpar pace of growth in the first half of the last economic expansion. Chart 8 highlights the weak evolution in real per capita GDP from 2009-2019 compared with previous economic cycles, which was caused by a prolonged household balance sheet recovery process that was made worse by policy mistakes. To be sure, the UK and the EU did not have a Tea Party, and yet political elites imposed fiscal austerity. It is also the case that President Obama was the first president to embrace social media as a political and public relations tool. So it cannot be said that either social media or the Republican Party are uniquely to blame for the policy mistakes of that era. But US fiscal policy would have been considerably looser in the 2010s if not for the Tea Party backlash, which was partly enabled by social media. Too tight of fiscal policy in turn fed populism and produced additional policy mistakes down the road. Chart 8Policy Mistakes Significantly Contributed To Last Cycle's Subpar Growth Profile
Policy Mistakes Significantly Contributed To Last Cycle's Subpar Growth Profile
Policy Mistakes Significantly Contributed To Last Cycle's Subpar Growth Profile
From Fiscal Drag To Populism While social media is clearly not the root cause of the recent rise of populist policies, it has had a hand in bringing them about – in both a direct and indirect manner. The indirect link between social media use and the rise in populist policies has mainly occurred through the highly successful use of social media by international terrorist organizations (chiefly ISIL) and its impact on sentiment toward immigration in several developed market economies. Chart 9 highlights that public concerns about immigration and race in the UK began to rise sharply in 2012, in lockstep with both the rise in UK immigrants from EU accession countries and a series of events: the Syrian refugee crisis, the establishment and reign of the Islamic State, and three major terrorist attacks in European countries for which ISIL claimed responsibility. Given that the main argument for “Brexit” was for the UK to regain control over its immigration policies, these events almost certainly increased UK public support for withdrawing from the EU. In other words, it is not clear that Brexit would have occurred (at least at that moment in time) without these events given the narrow margin of victory for the “leave” campaign. The absence of social media would not have prevented the rise of ISIL, as that occurred in response to the US’s precipitous withdrawal from Iraq. The inevitable rise of ISIL would still have generated a backlash against immigration. Moreover, fiscal austerity in the UK and EU also fed other grievances that supported the Brexit movement. But social media accelerated and amplified the entire process. Chart 10 presents fairly strong evidence that Brexit weakened UK economic performance relative to the Euro Area prior to the pandemic, with the exception of the 2018-2019 period. In this period Euro Area manufacturing underperformed during the Trump administration’s trade war as a result of its comparatively higher exposure to automobile production and its stronger ties to China. Panel 2 highlights that GBP-EUR fell sharply in advance of the referendum, and remains comparatively weak today. Chart 9Terrorism And Immigration Likely Contributed To Brexit
Terrorism And Immigration Likely Contributed To Brexit
Terrorism And Immigration Likely Contributed To Brexit
Chart 10Brexit Weakened UK Economic Performance Prior To The Pandemic
Brexit Weakened UK Economic Performance Prior To The Pandemic
Brexit Weakened UK Economic Performance Prior To The Pandemic
Turning to the US, Donald Trump’s election as US President in 2016 was aided by both the direct and indirect effects of social media. In terms of indirect effects, Trump benefited from similar concerns over immigration and terrorism that caused the UK to leave the EU: Chart 11 highlights that terrorism and foreign policy were second and third on the list of concerns of registered voters in mid-2016, and Chart 12 highlights that voters regarded Trump as the better candidate to defend the US against future terrorist attacks. Chart 11Terrorism Ranked Highly As An Issue In The 2016 US Election
The Social Media Magnification Effect: Austerity, Populism, And Slower Growth
The Social Media Magnification Effect: Austerity, Populism, And Slower Growth
Chart 12Voters Regarded Trump As Better Equipped To Defend Against Terrorism
The Social Media Magnification Effect: Austerity, Populism, And Slower Growth
The Social Media Magnification Effect: Austerity, Populism, And Slower Growth
Trump’s election; and the enactment of populist policies under his administration, were directly aided by Trump’s active use of social media (mainly Twitter) to boost his candidacy. Chart 13 highlights that there were an average of 15-20 tweets per day from Trump’s Twitter account from 2013-2015, and 80% of those tweets occurred before he announced his candidacy for president in June 2015. This strongly underscores that Trump mainly used Twitter to lay the groundwork for his candidacy as an unconventional political outsider rather than as a campaign tool itself, which distinguishes his use of social media from that of other politicians. In other words, new technology disrupted the “good old boys’ club” of traditional media and elite politics. Chart 13Trump Used Twitter To Lay The Groundwork For His Candidacy
Trump Used Twitter To Lay The Groundwork For His Candidacy
Trump Used Twitter To Lay The Groundwork For His Candidacy
Chart 14The Trump Tax Cuts A Huge Rise In Corporate Earnings
The Trump Tax Cuts A Huge Rise In Corporate Earnings
The Trump Tax Cuts A Huge Rise In Corporate Earnings
Some policies of the Trump administration were positive for financial markets, and it is fair to say that Trump fired up animal spirits to some extent: Chart 14 highlights that the Tax Cuts and Jobs Act caused a significant rise in stock market earnings per share. But the Trump tax cuts were a conventional policy pushed mostly by the Congressional leadership of the Republican Party, and they did not meaningfully boost economic growth. Chart 15 highlights that, while the US ISM manufacturing index rose sharply in the first year of Trump’s administration, an uptrend was already underway prior to the election as a result of a significant improvement in Chinese credit growth and a recovery in oil prices after the devastating collapse that took place in 2014-2015. Chart 15But The Tax Cuts Did Not Do Much To Boost Growth
But The Tax Cuts Did Not Do Much To Boost Growth
But The Tax Cuts Did Not Do Much To Boost Growth
Similarly, Chart 15 highlights that the Trump trade war does not bear the full responsibility of the significant slowdown in growth in 2019, as China’s credit impulse decelerated significantly between the passage of the Tax Cuts and Jobs Act and the onset of the trade war because Chinese policymakers turned to address domestic concerns. But Chart 16 highlights that the aggressive imposition of tariffs, especially between the US and China, caused an explosion in trade uncertainty even when measured on an equally-weighted basis (i.e., when overweighting trade uncertainty, in countries other than the US and China), which undoubtedly weighed on the global economy and contributed to a very significant slowdown in US jobs growth in 2019 (panel 2). Moreover, Chinese policymakers responded to the trade onslaught by deleveraging, which weighed on the global economy; and consolidating their grip on power at home. In essence, Trump was a political outsider who utilized social media to bypass the traditional media and make his case to the American people. Other factors contributed to his surprising victory, not the least of which was the austerity-induced, slow-growth recovery in key swing states. While US policy was already shifting to be more confrontational toward China, the Trump administration was more belligerent in its use of tariffs than previous administrations. The trade war thus qualifies as another policy shock that was facilitated by the existence of social media. Chart 16The Trade War Caused An Explosion In Global Trade Uncertainty
The Trade War Caused An Explosion In Global Trade Uncertainty
The Trade War Caused An Explosion In Global Trade Uncertainty
Viewing Social Media As A Negative Productivity-Innovation A rise in fiscal conservatism leading to misguided austerity, the UK’s decision to leave the European Union, and the Trump administration’s trade war have represented significant non-monetary shocks to both the US and global economies over the past 12 years. These shocks strongly contributed to the subpar growth profile of the last economic expansion, as demonstrated above. Given the above, it is reasonable for investors to view social media as a technological innovation with negative productivity growth, given that it has facilitated policy mistakes during the last economic expansion. Chart 17 underscores this point, by highlighting that multi-factor productivity growth has been extremely weak in the post-GFC environment. While productivity is usually driven by supply-side factors over the longer term, it has a cyclical component to it – and in the case of the last economic expansion, the cyclical component was long lasting in nature. Any forces negatively impacting economic growth that do not change the factors of production necessarily reduce measured productivity; it is for this reason that measured productivity declines during recessions; and policy mistakes negatively impact productivity growth. Chart 17Policy Mistakes, Partially Enabled By Social Media, Reduced Productivity During The Last Expansion
Policy Mistakes, Partially Enabled By Social Media, Reduced Productivity During The Last Expansion
Policy Mistakes, Partially Enabled By Social Media, Reduced Productivity During The Last Expansion
Chart 18State & Local Government Finances Are In Much Better Shape Today
State & Local Government Finances Are In Much Better Shape Today
State & Local Government Finances Are In Much Better Shape Today
The Risk Of Aggressive Austerity Seems Low Today… Fiscal austerity in the early phase of the last economic cycle was the first social media-linked shock that we identified, but the risk of aggressive austerity appears low today. Much of the fiscal drag that occurred in the aftermath of the global financial crisis happened because of insufficient financial support to state and local governments – and the subsequent refusal by Congress to authorize more aid. But Chart 18 highlights that state and local government finances have already meaningfully recovered, on the back of bipartisan stimulus in 2020, while the American Rescue Plan provides significant additional funding. While it is true that US fiscal policy is set to detract from growth over the coming 6-12 months, this will merely reflect the unwinding of fiscal aid that had aimed to support household income temporarily lost, as a result of a drastic reduction in services spending. As we noted in last month’s report,2 goods spending will likely slow as fiscal thrust turns to fiscal drag, but services spending will improve meaningfully – aided not just by a post-pandemic normalization in economic activity, but also by the deployment of some of the sizable excess savings that US households have accumulated over the past year. Fiscal drag will also occur outside of the US next year. For example, the IMF is forecasting a two percentage point increase in the Euro Area’s cyclically-adjusted primary budget balance, which would represent the largest annual increase over the past two decades. But here too the reduction in government spending will reflect the end of pandemic-related income support, and is likely to occur alongside a positive private-sector services impulse. During the worst of the Euro Area sovereign debt crisis, the impact of austerity was especially acute because it was persistent, and it occurred while the output gap was still large in several Euro Area economies. Chart 19 highlights that Euro Area fiscal consolidation from 2010-2013 was negatively correlated with economic activity during that period, and Chart 20 highlights that, with the potential exception of Spain, this austerity does not appear to have led to subsequently stronger rates of growth. Chart 19Euro Area Austerity Lowered Growth During The Consolidation Phase…
The Social Media Magnification Effect: Austerity, Populism, And Slower Growth
The Social Media Magnification Effect: Austerity, Populism, And Slower Growth
Chart 20…And Did Not Seem To Subsequently Raise Growth
The Social Media Magnification Effect: Austerity, Populism, And Slower Growth
The Social Media Magnification Effect: Austerity, Populism, And Slower Growth
This experiment in austerity led the IMF to conclude that fiscal multipliers are indeed large during periods of substantial economic slack, constrained monetary policy, and synchronized fiscal adjustment across numerous economies.3 Similarly, attitudes about austerity have shifted among policymakers globally in the wake of the populist backlash. Given this, despite the significant increase in government debt levels that has occurred as a result of the pandemic, we strongly doubt that advanced economies will attempt to engage in additional austerity prematurely, i.e., before unemployment rates have returned close-to steady-state levels. …But The Risk Of Protectionism And Other Populist Measures Looms Large The role that social media has played at magnifying populist policies should be concerning for investors, especially given that there has been a rising trend towards populism over the past 20 years. In a recent paper, Funke, Schularick, and Trebesch have compiled a cross-country database on populism dating back to 1900, defining populist leaders as those who employ a political strategy focusing on the conflict between “the people” and “the elites.” Chart 21 highlights that the number of populist governments worldwide has risen significantly since the 1980s and 1990s, and Chart 22 highlights that the economic performance of countries with populist leaders is clearly negative. Chart 21Populism Has Been On The Rise For The Past 30 Years
The Social Media Magnification Effect: Austerity, Populism, And Slower Growth
The Social Media Magnification Effect: Austerity, Populism, And Slower Growth
The authors found that countries’ real GDP growth underperformed by approximately one percentage point per year after a populist leader comes to power, relative to both the country’s own long-term growth rate and relative to the prevailing level of global growth. To control for the potential causal link between economic growth and the rise of populist leaders, Chart 23 highlights the results of a synthetic control method employed by the authors that generates a similar conclusion to the unconditional averages shown in Chart 22: populist economic policies are significantly negative for real economic growth. Chart 22Populist Leaders Are Clearly Growth Killers Even After…
The Social Media Magnification Effect: Austerity, Populism, And Slower Growth
The Social Media Magnification Effect: Austerity, Populism, And Slower Growth
Chart 23… Controlling For The Odds That Weak Growth Leads To Populism
The Social Media Magnification Effect: Austerity, Populism, And Slower Growth
The Social Media Magnification Effect: Austerity, Populism, And Slower Growth
This is especially concerning given that wealth and income inequality, perhaps the single most important structural cause of rising populism and political polarization, is nearly as elevated as it was in the 1920s and 1930s (Chart 24). This trend, at least in the US, has been exacerbated by a decline in public trust of mainstream media among independents and Republicans that began in the early 2000s and helped to fuel the public’s adoption of alternative news and social media. The decline in trust clearly accelerated as a result of erroneous reporting on what turned out to be nonexistent weapons of mass destruction in Iraq and other controversies of the Bush administration. Chart 21 showed that the rise in populism has also yet to abate, suggesting that social media has the potential to continue to amplify policy mistakes for the foreseeable future. Chart 24Inequality: The Most Important Structural Cause Of Populism And Polarization
Inequality: The Most Important Structural Cause Of Populism And Polarization
Inequality: The Most Important Structural Cause Of Populism And Polarization
It is not yet clear what economic mistakes will occur under the Biden administration, but investors should not rule out the possibility of policies that are harmful for growth. The likely passage of a bipartisan infrastructure bill or a partisan reconciliation bill in the second half of this year will most likely be the final word on fiscal policy until at least 2025,4 underscoring that active fiscal austerity is not likely a major risk to investors. Spending levels will probably freeze after 2022: Republicans will not be able to slash spending, and Democrats will not be able to hike spending or taxes, if Republicans win at least one chamber of Congress in the midterms (as is likely). Biden has preserved the most significant of Trump’s protectionist policies by maintaining US import tariffs against China, and the lesson from the Tea Party’s surge following the global financial crisis is that major political shifts, magnified by social media, can manifest themselves as policy with the potential to impact economic activity within a two-year window. Attitudes toward China have shifted negatively around the world because of deindustrialization and now the pandemic.5 White collar workers in DM countries have clearly fared better during lockdowns than those of lower-income households. This has created extremely fertile ground for a revival in populist sentiment, which could force the Biden administration or Congressional Democrats toward protectionist or otherwise populist actions over the coming year, in the lead up to the 2022 mid-term elections. Investment Conclusions In this report, we have documented the historical link between social media, populism, and policy mistakes during the last economic expansion. It is clear that neither social media nor even populism is solely responsible for all mistakes – the UK’s and EU’s ill-judged foray into austerity was driven by elites. Furthermore, we have not addressed in this report the impact of populism on actions of emerging markets, such as China and Russia, whose own behavior has dealt disinflationary blows to the global economy. Nevertheless, populism is a potent force that clearly has the power to harness new technology and deliver shocks to the global economy and financial markets. The risks of additional mistakes from populism are still present, and that is even before considering other risks to society from social media: a reduction in mental health among young social media users, and the role that social media has played in spreading misinformation – contributing to the vaccine hesitancy in some DM countries that we discussed in Section 1 of our report. Two investment conclusions emerge from our analysis. First, we noted in our April report that there is a chance that investor expectations for the natural rate of interest (“R-star”) will rise once the economy normalizes post-pandemic, but that this will likely not occur as long as investors continue to believe in the narrative of secular stagnation. Despite the fact that the past decade’s shocks occurred against the backdrop of persistent household deleveraging (which has ended in the US), these shocks reinforced that narrative, and any additional policy shocks following a return to economic normality will again be seen by both investors and the Fed as strong justification for low interest rates. Thus, while the rapid closure of output gaps in advanced economies over the coming year argues for both cyclically and structurally higher bond yields, a revival in protectionist sentiment is a risk to this view that we will be closely monitoring over the coming 12-24 months. Second, for tech investors, the bipartisan shift in public sentiment to become more critical of social media companies is gradually becoming a real risk, potentially affecting user growth. Based solely on Facebook, Twitter, Pinterest, and Snapchat, social media companies do not account for a very significant share of the overall equity market (Chart 25), suggesting that the impact of a negative shift in sentiment toward social media companies would not be an overly significant event for equity investors in general. Chart 25 highlights that the share of social media companies as a percent of the broad tech sector rises if Google is included; YouTube accounts for less than 15% of Google’s total advertising revenue, however, suggesting modest additional exposure beyond the solid line in Chart 25. Chart 25The Underperformance Of Social Media Would Not Excessively Weigh On The Broad Market
The Underperformance Of Social Media Would Not Excessively Weigh On The Broad Market
The Underperformance Of Social Media Would Not Excessively Weigh On The Broad Market
Still, investors with concentrated positions in social media stocks should be aware of the potential idiosyncratic risks facing social media companies as a result of the public’s impression of the impact of social media on society. If social media companies come to be widely associated with political gridlock, the polarization of society, and failed economic policies (as already appears to be the case), then the fundamental performance of these stocks is likely to be quite poor regardless of whether or not tech companies ultimately enjoy a relatively friendly regulatory environment under the Biden administration. Jonathan LaBerge, CFA Vice President The Bank Credit Analyst Footnotes 1 Grassroots Organizing in the Digital Age: Considering Values and Technology in Tea Party and Occupy Wall Street by Agarwal, Barthel, Rost, Borning, Bennett, and Johnson, Information, Communication & Society, 2014. 2 Please see The Bank Credit Analyst “July 2021,” dated June 24, 2021, available at bca.bcaresearch.com 3 “Are We Underestimating Short-Term Fiscal Multipliers?”,IMF World Economic Outlook, October 2012 4 Please see US Political Strategy Outlook "Third Quarter Outlook 2021: Game Time," dated June 30, 2021, available at usps.bcaresearch.com 5 “Unfavorable Views of China Reach Historic Highs in Many Countries,” PEW Research Center, October 2020.
Highlights The countertrend yield rally is near its end. Despite the deteriorating Chinese credit impulse, the outlook for global growth remains robust. An ample global liquidity backdrop, an inventory restocking cycle, and an upbeat capex outlook will increase aggregate demand and global capacity utilization. In this context, safe-haven bonds have sufficiently rallied. German yields will rise too, because the European yield curve will steepen. European banks will benefit from this trend. Investors should buy European momentum stocks and sell growth stocks. Investors should favor industrial equities and Sweden. Feature On April 12 of this year, we warned that a countertrend rally in bonds was increasingly likely. The decline in the Chinese credit impulse and the increasingly oversold state of Treasuries created the perfect conditions to generate disappointments in a lopsided market. As a corollary, we grew worried about our equity positioning, which calls for a large exposure to pro-cyclical stocks. Consequently, we recommended investors hedge this portfolio bias with some defensive bets. On July 20, Treasury yields fell to as low as 1.13%. Did this level mark the end of the Treasury rally? The bulk of the decline is behind us, and investors with a 12- to 18-month investment horizon should resume shortening portfolio duration. In Europe too, German yields are likely to trend higher. As a result, European financials and momentum stocks should generate significant outperformance in the coming quarters. Industrial equities are also set to shine, which will benefit the Swedish market, our favorite. Should I Stay Or Should I Go? The near-term outlook for Treasuries is currently more complex than it was in April, when forces lined up neatly to warn of an imminent pullback in yields. Technical indicators show that the oversold conditions that prevailed this spring have mostly cleared up. In April, the BCA Composite Technical Indicator for Treasuries reached its most oversold level in more than 20 years, which provided a very reliable buy signal (Chart 1). Now that the 10-year yield has reclaimed its 40-week moving average, the technical indicator is back to neutral. Normally, when bonds are in a cyclical bear market, which is BCA’s House View, the indicator rarely dips significantly into overbought territory. Meanwhile, the Marketvane Bullish Sentiment survey stands at 60%, which indicates that bonds are once again favored by many newsletters, traders, and investors. Chinese credit growth continues to send a bond-bullish signal (Chart 2). Slowing credit growth could hurt Chinese capex, which in turn has the potential to slow the demand for capital at the global level. This risk could still decrease global yields. Chart 1Bonds Are Not Oversold Anymore...
Bonds Are Not Oversold Anymore...
Bonds Are Not Oversold Anymore...
Chart 2...But China Still Consistutes A Risk
...But China Still Consistutes A Risk
...But China Still Consistutes A Risk
Chart 3A Synchronous Global Upswing
A Synchronous Global Upswing
A Synchronous Global Upswing
The global economic recovery remains sufficiently broad-based to compensate for the risk of a Chinese slowdown. Our Global Synchronicity Indicator shows that manufacturing PMIs among the world’s major economies are all expanding (Chart 3), which usually elevates yields. This is especially important today, because the far-reaching and generalized nature of the current recovery gives more scope to the global economy to withstand a Chinese economic deceleration. Bottom Line: The variables that called for lower yields in early April are currently sending a mixed message. “Go!” The Global Business Cycle Responds Outside of China’s TSF impulse, most economic variables point toward higher yields. Chart 4Financial Liquidity Lifts The Business Cycle
Financial Liquidity Lifts The Business Cycle
Financial Liquidity Lifts The Business Cycle
Global liquidity conditions remain consistent with higher growth and thus also with rising global interest rates. BCA’s US Financial Liquidity Index still stands near record highs and confirms that the Global Leading Economic Indicator (LEI) will remain at elevated levels (Chart 4). As a result, we expect the current fall in the Global LEI Diffusion Index to be short lived. Any softening in global growth, therefore, will prove to be transitory. Markets are forward looking. The recent decline in yields anticipated the deceleration in the Global LEI. Long-term rates will also increase before the LEI firms anew. Excess money growth tells a similar story. Historically, an expansion of the global money supply in excess of the demand for credit sends a strong signal that global economic activity is well supported by reflationary policies. It forecasts above-trend industrial production growth, robust international trade and rising global export prices. Currently, excess money growth in the US, Eurozone and Japan has overtaken its post-GFC high and is consistent with higher US and German yields (Chart 5). Global capacity utilization also points toward higher yields. Our US Composite Capacity Utilization indicator is back in the neutral zone after a steep decline in 2020. Furthermore, US industrial capacity utilization is currently back above its structural trend. Most importantly, capacity utilization should be evaluated at the global level. Even when slower-growing economies such as the Euro Area and Japan are included, global capacity utilization is improving enough to be consistent with rising yields (Chart 6). Chart 5Excess Money Points To Higher Yields
Excess Money Points To Higher Yields
Excess Money Points To Higher Yields
Chart 6Rising CAPU Lifts Yields
Rising CAPU Lifts Yields
Rising CAPU Lifts Yields
Capacity utilization should climb higher in the coming quarters as the world experiences an inventory re-stocking cycle. The US, with its rich data, provides a good example. The sales-to-inventory ratio is at an extremely elevated level and is climbing very rapidly (Chart 7). Meanwhile, the level of inventories is still 1% below its pre-pandemic peak, while GDP overtook it previous high in the second quarter, and business sales are 11% above their 2018 high. The recent rise in inflation highlights the inability of companies to fulfil demand for their goods and services and, consequently, the need to restock. Hence, we expect companies to increase their inventory spending, which will add to demand and to capacity utilization as the adjustment process takes place. Capex will also lift capacity utilization and put upward pressure on yields. US capex intentions are rising swiftly as firms are unable to meet demand (Chart 8, top panel). Our Japanese Capex Indicator reiterates this message, while the European Commission’s Investment Surveys are also recovering (Chart 8 bottom panels). Historically, capex intentions are an excellent, leading indicator of actual investments, hence, the recent poor capex numbers will not last. Chart 7Restocking Ahead!
Restocking Ahead!
Restocking Ahead!
Chart 8Climbing Capex Intentions Everywhere
Climbing Capex Intentions Everywhere
Climbing Capex Intentions Everywhere
Greater global cash flow growth is also consistent with higher capex. The growth in EBITDA among global companies has bottomed, and it is currently around 14%. Incidentally, this suggests that capex among quoted firms around the world should expand in the second half of the year by a similar amount (Chart 9). Ultimately, robust cash flows finance expansion plans and also send a strong signal to corporate boards that the environment is ripe for investment spending. Already, capital goods orders are strengthening, which confirms the signal from both the capex surveys and profits. This strength portends very strong private capex numbers in the coming quarters and thus, a greater level of demand in the economy (Chart 10). Chart 9Rising Cash Flows Lead To Higher Capex
Rising Cash Flows Lead To Higher Capex
Rising Cash Flows Lead To Higher Capex
Chart 10Strong Global Orders
Strong Global Orders
Strong Global Orders
Public infrastructure plans will create the final boost to global capex. $550 billion of the Biden administration’s infrastructure plan is getting close to bipartisan approval, and the budget reconciliation process might still result in an even bigger package before yearend. In Europe, the EUR800 billion NGEU plan that has been approved by all the EU’s national parliaments also includes large infrastructure spending envelopes to deploy over the coming five years. This context suggests that yields are unlikely to decline much further from current levels, since the oversold conditions that prevailed in March have been purged. Chart 11 shows that specific events are needed to prompt a greater 90-trading day collapse in yields than the one just registered. In 2019 and 2020, the Fed was cutting rates. Today, it is gearing up to raise them. In 2010 and 2011, the European sovereign debt crisis was hurting global growth and creating massive deflationary risks. In 2015, China was mired in deep deflation and devalued the RMB, which exported these negative pressures around the world and lowered yields. By late 2018, the yield curve was moving toward an inversion, which signaled that monetary policy was too tight. Today, none of these conditions are present and, consequently, the odds of a greater decline in yields are low. Chart 11Yields Have Moved Enough
Yields Have Moved Enough
Yields Have Moved Enough
Bottom Line: The broad-based nature of the global recovery will limit the decline in yields. Global liquidity conditions remain extremely accommodative, global capacity utilization is improving, and inventories and capex spending will add to demand in the coming quarters. In this context, the recent decline in yields corrected this spring’s oversold condition in the bond market sufficiently. Investment Implications Bonds Investors with an investment horizon of more than six months should reduce their portfolio duration and remove hedges protecting against higher yields. The low in Treasury yields is likely to stay around 1.1%. The exact timing of the rebound is imprecise, and yields could churn for a brief period and retest their recent lows, but the balance of risks points toward a much greater probability of higher yields in the coming six to twelve months, and a limited probability of significantly lower yields from current levels. In fact, the CRB-to-gold ratio, often shown by BCA’s US bond strategists, clearly favors higher yields (Chart 12). Higher yields are not inconsistent with BCA’s view that the current inflation spike is transitory. TIPS yields are at a record low. As global growth recovers and the Fed moves closer to removing some accommodation, real yields will increase (Chart 13, top panel). Meanwhile, 5-year/5-year forward inflation breakeven rates remain well below the 2.5%-to-3% zone that prevailed prior to 2014, when long-term inflation expectations were still well anchored (Chart 13, bottom panel). The Fed is actively aiming to push this inflation expectation measure higher. Chart 12The CRB/Gold Ratio Points To Higher Yields
The CRB/Gold Ratio Points To Higher Yields
The CRB/Gold Ratio Points To Higher Yields
Chart 13TIPS Yields Will Rise
TIPS Yields Will Rise
TIPS Yields Will Rise
Chart 14The European Yield Curve Will Steepen
The European Yield Curve Will Steepen
The European Yield Curve Will Steepen
German yields have some upside too, even if the ECB will lag well behind the Fed in terms of both ending its QE program and lifting interest rates. The ECB policy rate mostly anchors the short end of the curve, and the large European excess savings warrant lower Bund yields than those of T-Note. However, the nominal and real terminal rates embedded in the German curve remain lower than at the apex of the European sovereign debt crisis and are extremely low compared to the US. As a result, the European yield curve will steepen, which is confirmed by the comparative strength of the earnings revisions of Europe’s cyclical equity sectors (Chart 14). Equities An environment in which yields rise again should favor financials, industrials, and momentum stocks at the expense of growth stocks. In Europe, banks and financials will be the prime beneficiaries of higher yields. Historically, higher German Bund yields are associated with an outperformance of banks relative to the broad market, because a steeper yield curve boosts net interest margins (Chart 15). European banks also have scope for some re-rating. There is little case to significantly upgrade the sectors’ expected long-term profitability significantly, considering that the European economy remains replete with an excessively large capital stock. Nonetheless, at a price-to-book ratio of 0.6 or 55% below that of US banks and 67% below the European broad market, European banks are also priced as risky investments. However, European NPLs have declined significantly, and the public sector support during the pandemic will limit how high NPLs can rise (Chart 16, top panel). Moreover, European banks are much better capitalized than they once were, which further decreases their riskiness (Chart 16). Additionally, the ECB has allowed banks to pay dividends again. Finally, the fiscal risk sharing created by the NGEU funds and continued bond purchases by the ECB will cap the upside for peripheral yield spreads, which will limit the odds of the emergence of the kind of doom-loop that once plagued the European banking system. UK bank stocks look particularly attractive. Chart 15European Banks Have Upside
European Banks Have Upside
European Banks Have Upside
Chart 16Less Risky
Less Risky
Less Risky
The massive underperformance of European momentum stocks relative to growth stocks is also likely to reverse (Chart 17). As Chart 18 shows, momentum stocks currently trade at an exceptionally large discount to both growth stocks and the European broad market. Most importantly, momentum equities tend to outperform growth stocks in the wake of a rise in German yields (Chart 19). This sensitivity to yields is currently accentuated by the sector bias of momentum stocks. Relative to growth stocks, momentum equities greatest overweights are financials, industrials and materials (Table 1), three sectors that thrive on higher interest rates. Meanwhile, their largest relative underweights are consumer staples and healthcare, two sectors with strong defensive characteristics that benefit from lower yields. Chart 17Bomned Out Momentum Stocks...
Bomned Out Momentum Stocks...
Bomned Out Momentum Stocks...
Chart 18...Have Become Very Cheap
...Have Become Very Cheap
...Have Become Very Cheap
Chart 19Momentum Stocks Outperform When Yields Rise
Momentum Stocks Outperform When Yields Rise
Momentum Stocks Outperform When Yields Rise
Table 1Sector Biases: Momentum Vs Growth Stocks
The Ageing Bond Rally
The Ageing Bond Rally
Chart 20The Capex Outlook Favors Industrials
The Capex Outlook Favors Industrials
The Capex Outlook Favors Industrials
Finally, we recommend investors move more aggressively into industrial equities. Industrials are the best-placed sector to benefit from the rise in global capex and the excess money supply growth. As Chart 20 highlights, even if the rate of growth of global capital goods orders decelerates, industrials should outperform the European broad market as long as the rate of growth remains positive. Nonetheless, the sector’s outperformance could moderate because it has become more expensive than the broad market. However, a stronger profitability compensates for this negative. As a corollary, we continue to favor Swedish equities because of their 38% weight in industrials and 27% allocation to financials. Moreover, their superior return on equity and profit margins, as well as the EUR/SEK’s downside potential, add to Sweden’s allure. The largest risk for industrials remains the slowdown in the Chinese credit impulse. However, the upbeat picture for DM capex and inventory growth counters this negative side. We continue to recommend some hedges against this risk. When it comes to our Sweden overweight, we still advise selling Norway, a position that has worked out well. We also still like selling consumer discretionary equities / long European telecoms to protect portfolios against a greater-than-anticipated global slowdown. Bottom Line: Global safe-haven yields are unlikely to decline significantly from current levels. Instead, they will rise meaningfully in the coming quarters, even in Germany. Consequently, investors with an investment horizon greater than six months should curtail their portfolio duration once again. Higher yields will also benefit European bank equities. We also recommend investors buy European momentum stocks and sell growth stocks. Finally, European industrials are set to shine compared to the rest of the European market, which will give a fillip to Swedish stocks, our favored European market. Mathieu Savary, Chief European Strategist Mathieu@bcaresearch.com Currency Performance Currency Performance
The Ageing Bond Rally
The Ageing Bond Rally
Fixed Income Performance Government Bonds
The Ageing Bond Rally
The Ageing Bond Rally
Corporate Bonds
The Ageing Bond Rally
The Ageing Bond Rally
Equity Performance Major Stock Indices
The Ageing Bond Rally
The Ageing Bond Rally
Geographic Performance
The Ageing Bond Rally
The Ageing Bond Rally
Sector Performance
The Ageing Bond Rally
The Ageing Bond Rally
Highlights Economy – The Fed remains unperturbed about inflation, even as it continues to surprise to the upside: At his latest press conference, Chair Powell repeated the mantra that the spike in inflation will prove to be temporary. The shape of the inflation expectations curve supports the Fed’s view and the key expectations boxes of our inflation checklist remain unchecked. Markets – The decline in Treasury yields indicates that investors aren’t too worried about it, either: Although inflation data have continued to surprise to the upside, investors and the broader public seem to have moved on after the release of the March and April numbers. Inflation agita is not gone for good, but it may remain dormant until the fall. Strategy – The economic and policy backdrops remain favorable for risk assets and we remain overweight equities and spread product: Stop us if you’ve heard this one before, but risk assets will continue to generate positive excess returns over Treasuries and cash unless the Delta variant disrupts activity. Feature What a difference ten weeks make. When we rolled out our checklist on May 24th, inflation was Topic A for BCA clients and Google searchers, but it has been coming up less in our meetings and the internet queries are half of what they were (Chart 1). Inflation is a critical element of bond and currency markets, however, and it can have significant implications when it diverges from market expectations. Its currently elevated level and the novelty and uncertainty of the Fed’s revised approach to it ensure that it will intermittently command the spotlight. Chart 1Oh, Never Mind
Oh, Never Mind
Oh, Never Mind
Down the road, we think it has a good chance to break above a range that investors and policymakers are comfortable with, and we will review our inflation checklist every month or two to keep clients apprised of its course. We have checked the same three boxes that we did six weeks ago and the story from the charts underlying them is unchanged. Inflation remains well above 2% year-over-year and it will stay there for the foreseeable future. The Fed is nowhere close to deploying its tools to guide it back down to its stated target, however, so it presents no danger to the potent post-pandemic expansion, and households’ and businesses’ mindsets do not appear to have changed in any way that would presage a self-reinforcing dynamic that would feed an inflation spiral. If inflation isn’t going to become problematic any time soon, overheating is not a pressing risk over our twelve-month investment timeframe. If we are correct that the new Delta-powered wave of COVID infections will not strain the health care system’s capacity or spark an unsettling pickup in fatalities, we won’t need to increase our probability of a growth shortfall. From an investment strategy perspective, diminishing probabilities of too-hot and too-cold tail outcomes support continued risk-friendly positioning. The Goldilocks outcome of strong growth backed by ultra-accommodative monetary policy should allow risk assets to continue generating positive excess returns over Treasuries and cash over the next twelve months. Updating The Inflation Checklist Table 1Inflation Checklist
Resolute
Resolute
As mentioned above, we have checked the same three boxes on our inflation checklist that we did in late May and late June (Table 1). The labor market story remains unchanged: employer demand is at all-time highs as measured by the Job Openings components of the NFIB and JOLTS surveys (Chart 2). Labor supply has not risen to meet it, however, as a range of factors, including reduced caregiver availability (for children and adults), reluctance to risk infection and generous unemployment insurance benefits, converge to limit the number of job seekers. Though record demand and limited supply would be expected to lead to much higher prices, wage growth has remained contained (Chart 3), especially in the more refined series that adjust for composition effects or include benefits (Chart 3, bottom two panels). Chart 2Help Wanted
Help Wanted
Help Wanted
Chart 3Wage Growth Has Remained In Check
Wage Growth Has Remained In Check
Wage Growth Has Remained In Check
Year-over-year increases in core CPI and the core PCE price index have continued to accelerate (Chart 4, solid lines). They seem to have lost their ability to shock after April, however, as inflation expectations have taken little note of them and Google “inflation” searches have come off the boil. Investors apparently accept the Fed’s contention that the base inflation readings are being distorted by price moves in spaces that have been especially impacted by the pandemic and subsequent component shortages. Though the Fed's explanation may seem awfully convenient, its read is supported by the much more modest moves in the trimmed-mean CPI and PCE indexes (Chart 4, dashed lines). Chart 4Inflation Is Not Quite As Bad As It May Seem ...
Inflation Is Not Quite As Bad As It May Seem ...
Inflation Is Not Quite As Bad As It May Seem ...
We continue to check the inflation pipeline box as our Pipeline Inflation Pressure Index is still pointing steeply higher (Chart 5). With components like the CRB’s Raw Industrials Index showing no sign of letting up, pipeline pressures will not just go away. The dollar’s recovery is limiting inflation pressure from the import channel, though inflation is comparatively muted in both the euro zone (Chart 6, top panel) and China (Chart 6, bottom panel) in any event. Chart 5... But Its Got Legs
... But Its Got Legs
... But Its Got Legs
Chart 6Global Pressures Are Mild For Now
Global Pressures Are Mild For Now
Global Pressures Are Mild For Now
Chart 7Markets Are Looking Through Temporary Inflation Pressures ...
Markets Are Looking Through Temporary Inflation Pressures ...
Markets Are Looking Through Temporary Inflation Pressures ...
Chart 8... And So Are Consumers
... And So Are Consumers
... And So Are Consumers
We continue to view inflation expectations as the key to a meaningful inflection. If households, businesses and investors begin to anticipate a much higher rate of inflation over the longer term, they will change their behavior in ways that will cause their expectations to become self-fulfilling. We are therefore especially focused on the inflation expectations curve and have been relieved to see that market measures (Chart 7) and surveys (Chart 8) indicate that investors and other economic participants believe that an elevated rate of consumer price increases will not persist beyond the next year or two. As Table 2 illustrates, the inverted TIPS and CPI swaps expectations curves project a significant decline in inflation from the near term to the intermediate and long term. Table 2The Inflation Expectations Curve Is Solidly Inverted
Resolute
Resolute
The Fed Stays The Course The FOMC meeting and Chair Powell’s subsequent press conference were thin gruel, as the committee neither made nor telegraphed any meaningful course changes. Our main takeaway from the press conference was that the Fed is in no hurry to remove monetary accommodation because it is unperturbed by the inflation data that have come out over the last several months. As for accommodation, tapering is first on the agenda, but it doesn’t look like Powell will tackle the issue at Jackson Hole later this month: “We have not reached substantial further progress yet. So we’re not there, and … we see ourselves as having some ground to cover to get there.” Following the meeting, market consensus coalesced around a November or December announcement preceding a reduction in purchases beginning in January. Powell continued to stick to his ongoing inflation story, arguing that elevated inflation prints have resulted from idiosyncratic disruptions or base effects in segments that have been particularly affected by the pandemic. “What we’re seeing is a handful of things that really account for the overshoot of inflation. … [N]ew, used and rental cars have moved up in price because of the car shortage because of the semiconductor shortage. And hotels and airfares have moved back up, but that really just is retracing the very large downward movement in prices that they had before (Chart 9). [T]hat’s a big, big part of why the inflation readings are so high. And those frankly don’t carry significant implications in the long run for inflation or for the American economy.” Chart 9Inflation Isnt So Bad On A Two-Year Basis
Inflation Isnt So Bad On A Two-Year Basis
Inflation Isnt So Bad On A Two-Year Basis
Powell also riffed on the meaning of “transitory” in response to a reporter’s question, offering some further insight into the Fed’s inflation perspective. “[W]hat I mean by transitory is just something that doesn’t leave a permanent mark on the inflation process. I don’t mean that producers are going to take those price increases back. That’s not the idea. It’s just that they won’t go on indefinitely. So to the extent people are implementing price increases because raw materials are going up or labor costs or something’s going up, you know, the question for inflation really is, does that mean they’re going to go up the next year by the same amount?” Yet Another Great Quarter For Earnings Chart 10Following The New Script To A T
Resolute
Resolute
Last week, with 25% of S&P 500 constituents having reported results, we noted that 2Q21 was shaping up to be the index’s fifth consecutive quarter of dramatically outsized earnings beats. Now that 60% of the S&P has reported, including all five of the mega-cap FAAMG companies, we can declare that the streak will reach five when this reporting season is complete. Once again, knockout results (Chart 10, bottom panel) have stood the long-established guide-down-a-little-before-reporting-then-beat-by-a-modest-margin pattern (Chart 10, top panel) on its head. This quarter’s beat, currently tracking to 13%, will join the previous four pandemic quarters’ beats in obliterating the 1-to-6% range that contained every single quarter from 2012 to 2019 (Chart 11). Chart 11The Monster Beats Continue
Resolute
Resolute
The immediate upshot has been for the consensus second quarter earnings estimate to be revised higher to a level that surpasses first quarter earnings and our “easily attainable” $50 ballpark estimate (Table 3). If the Delta variant does not upend economic activity, as per our base case, we think there is scope for forward estimates to be revised higher. The current forecast has four-quarter earnings through 2Q22 ($204.70) barely rising from the current quarter’s annualized run rate ($203.84). That is unusual in a series that has a lifetime mean of 18% and rarely contracts, especially given that the economy is expanding at a gangbusters clip. Table 32Q21's Been Fixed, But The Out Quarters Still Have Scope To Rise
Resolute
Resolute
Investment Implications Chart 12The Shelves Are Almost Bare
The Shelves Are Almost Bare
The Shelves Are Almost Bare
We are undeterred by last week’s GDP disappointment, broader concerns about deceleration or overwrought talk about stagflation. 6.5% real second-quarter GDP growth came in well short of the consensus 8.4% expectation, but the number wasn’t as bad as it may have appeared to the naked eye. Real final domestic demand, which looks through inventory swings and net exports to provide a truer barometer of ongoing activity, grew at an 8.1% rate, powered by nearly 12% growth in consumption. The continued depletion of retail inventories, which must be restocked to meet ravenous consumer demand (Chart 12), pushed some growth into subsequent quarters, so growth may not have peaked in 2Q after all. As for stagflation, it simply doesn’t apply when the world’s largest economy is growing at the rate of a developing economy, three times its trend, over a year into an expansion. On balance, the new information we received last week was favorable. The Fed reiterated its resolve to keep supporting the economy with emergency levels of monetary accommodation even though the emergency has passed; S&P 500 earnings continue to shoot the lights out, forcing analysts into lifting their estimates once future quarters get closer; and consumers are spending with gusto, suggesting that excess pandemic savings and robust gains in household net worth will provide an ongoing lift to the economy well into 2022. All in all, the macroeconomic backdrop remains favorable for investors in risk assets and we continue to recommend overweighting them. Doug Peta, CFA Chief US Investment Strategist dougp@bcaresearch.com
Highlights Globalization is recovering to its pre-pandemic trajectory. But it will fail to live up to potential, as the “hyper-globalization” trends of the 1990s are long gone. China was the biggest winner of hyper-globalization. It now faces unprecedented risks in the context of hypo-globalization. Global investors woke up to China’s domestic political risks this year, which include arbitrary regulatory crackdowns on tech and private business. While Chinese officials will ease policy to soothe markets, the cyclical and structural outlook is still negative for this economy. Growth and stimulus have peaked. Political risk will stay high through the national party congress in fall 2022. US-China relations have not stabilized. India, the clearest EM alternative for global investors, is high-priced relative to China and faces troubles of its own. It is too soon to call a bottom for EM relative to DM. Feature Global investors woke up to China’s domestic political risk over the past week, as Beijing extended its regulatory crackdown to private education companies. Our GeoRisk Indicator shows Chinese political risk reaching late 2017 levels while the broad Chinese stock market continued this year’s slide against emerging market peers (Chart 1). Chart 1China: Domestic Political Risk Takes Investors By Surprise
Hypo-Globalization (A GeoRisk Update)
Hypo-Globalization (A GeoRisk Update)
A technical bounce in Chinese tech stocks will very likely occur but we would not recommend playing it. The first of our three key views for 2021 is the confluence of internal and external headwinds for China. True, today’s regulatory blitz will pass over like previous ones and the fast money will snap up Chinese tech firms on the cheap. The Communist Party is making a show of force, not destroying its crown jewels in the tech sector. However, the negative factors weighing on China are both cyclical and structural. Until Chinese President Xi Jinping adjusts his strategy and US-China relations stabilize, investors do not have a solid foundation for putting more capital at risk in China. Globalization is in retreat and this is negative for China, the big winner of the past 40 years. Hypo-Globalization Globalization in the truest sense has expanded over millenia. It will only reverse amid civilizational disasters. But the post-Cold War era of “hyper-globalization” is long gone.1 The 2010s saw the emergence of de-globalization. In the wake of COVID-19, global trade is recovering to its post-2008 trend but it is nowhere near recovering the post-1990 trend (Chart 2). Trade exposure has even fallen within the major free trade blocs, like the EU and USMCA (Chart 3). Chart 2Hypo-Globalization
Hypo-Globalization
Hypo-Globalization
Chart 3Trade Intensity Slows Even Within Trade Blocs
Trade Intensity Slows Even Within Trade Blocs
Trade Intensity Slows Even Within Trade Blocs
Of course, with vaccines and stimulus, global trade will recover in the coming decade. We coined the term “hypo-globalization” to capture this predicament, in which globalization is set to rebound but not to its previous trajectory.2 We now inhabit a world that is under-globalized and under-globalizing, i.e. not as open and free as it could be. A major factor is the US-China economic divorce, which is proceeding apace. China’s latest state actions – in diplomacy, finance, and business – underscore its ongoing disengagement from the US-led global architecture. The US, for its part, is now on its third presidency with protectionist leanings. American and European fiscal stimulus are increasingly protectionist in nature, including rising climate protectionism. Bottom Line: The stimulus-fueled recovery from the global pandemic is not leading to re-globalization so much as hypo-globalization. A cyclical reboot of cross-border trade and investment is occurring but will fall short of global potential due to a darkening geopolitical backdrop. Still No Stabilization In US-China Relations Chart 4Do Nations Prefer Growth? Or Security?
Hypo-Globalization (A GeoRisk Update)
Hypo-Globalization (A GeoRisk Update)
A giant window of opportunity is closing for China and Russia – they will look back fondly on the days when the US was bogged down in the Middle East. The US current withdrawal from “forever wars” incentivizes Beijing and Moscow to act aggressively now, whether at home or abroad. Investors tend to overrate the Chinese people’s desire for economic prosperity relative to their fear of insecurity and domination by foreign powers. China today is more desirous of strong national defense than faster economic growth (Chart 4). The rise of Chinese nationalism is pronounced since the Great Recession. President Xi Jinping confirmed this trend in his speech for the Communist Party’s first centenary on July 1, 2021. Xi was notably more concerned with foreign threats than his predecessors in 2001 and 2011 (Chart 5).3 China has arrived as a Great Power on the global stage and will resist being foisted into a subsidiary role by western nations. Chart 5Xi Jinping’s Centenary Speech Signaled Nationalist Turn
Hypo-Globalization (A GeoRisk Update)
Hypo-Globalization (A GeoRisk Update)
Meanwhile US-China relations have not stabilized. The latest negotiations did not produce agreed upon terms for managing tensions in the relationship. A bilateral summit between Presidents Biden and Xi Jinping has not been agreed to or scheduled, though it could still come together by the end of October. Foreign Minister Wang Yi produced a set of three major demands: that the US not subvert “socialism with Chinese characteristics,” obstruct China’s development, or infringe on China’s sovereignty and territorial integrity (Table 1). The US’s opposition to China’s state-backed economic model, export controls on advanced technology, and attempts to negotiate a trade deal with the province of Taiwan all violate these demands.4 Table 1China’s Three Demands From The United States (July 2021)
Hypo-Globalization (A GeoRisk Update)
Hypo-Globalization (A GeoRisk Update)
The removal of US support for China’s economic, development – recently confirmed by the Biden administration – will take a substantial toll on sentiment within China and among global investors. US President Joe Biden and four executive departments have explicitly warned investors not to invest in Hong Kong or in companies with ties to China’s military-industrial complex and human rights abuses. The US now formally accuses China of genocide in the Xinjiang region.5 Bottom Line: There is no stabilization in US-China relations yet. This will keep the risk premium in Chinese currency and equities elevated. The Sino-American divorce is a major driver of hypo-globalization. China’s Regulatory Crackdown President Xi Jinping’s strategy is consistent. He does not want last year’s stimulus splurge to create destabilizing asset bubbles and he wants to continue converting American antagonism into domestic power consolidation, particularly over the private economy. Now China’s sweeping “anti-trust” regulatory crackdown on tech, education, and other sectors is driving a major rethink among investors, ranging from Ark-founder Cathie Wood to perma-bulls like Stephen Roach. The driver of the latest regulatory crackdown is the administration’s reassertion of central party control. The Chinese economy’s potential growth is slowing, putting pressure on the legitimacy of single-party rule. The Communist Party is responding by trying to improve quality of life while promoting nationalism and “socialism with Chinese characteristics,” i.e. strong central government control and guidance over a market economy. Beijing is also using state power and industrial policy to attempt a great leap forward in science and technology in a bid to secure a place in the sun. Fintech, social media, and other innovative platforms have the potential to create networks of information, wealth, and power beyond the party’s control. Their rise can generate social upheaval at home and increase vulnerability to capital markets abroad. They may even divert resources from core technologies that would do more to increase China’s military-industrial capabilities. Beijing’s goal is to guide economic development, break up the concentration of power outside of the party, prevent systemic risks, and increase popular support in an era of falling income growth. Sociopolitical Risks: Social media has demonstrably exacerbated factionalism and social unrest in the United States, while silencing a sitting president. This extent of corporate power is intolerable for China. Economic And Financial Risks: Innovative fintech companies like Ant Group, via platforms like Alipay, were threatening to disrupt one of the Communist Party’s most important levers of power: the banking and financial system. The People’s Bank of China and other regulators insisted that Ant be treated more like a bank if it were to dabble in lending and wealth management. Hence the PBoC imposed capital adequacy and credit reporting requirements.6 Data Security Risks: Didi Chuxing, the ride-sharing company partly owned by Uber, whose business model it copied and elaborated on, defied authorities by attempting to conduct its initial public offering in the United States in June. The Communist Party cracked down on the company after the IPO to show who was in charge. Even more, Beijing wanted to protect its national data and prevent the US from gaining insights into its future technologies such as electric and autonomous vehicles. Foreign Policy Risks: Beijing is also preempting the American financial authorities, who will likely take action to kick Chinese companies that do not conform to common accounting and transparency standards off US stock exchanges. Better to inflict the first blow (and drive Chinese companies to Hong Kong and Shanghai for IPOs) than to allow free-wheeling capitalism to continue, giving Americans both data and leverage. Thus Beijing is continuing the “self-sufficiency” drive, divorcing itself from the US economy and capital markets, while curbing high-flying tech entrepreneurs and companies. The party’s muscle-flexing will culminate in Xi Jinping’s consolidation of power over the Politburo and Central Committee at the twentieth national party congress in fall 2022, where he is expected to take the title of “Chairman” that only Mao Zedong has held before him. The implication is that the regulatory crackdown can easily last for another six-to-12 more months. True, investors will become desensitized to the tech crackdown. But health care and medical technology are said to be in the Chinese government’s sights. So are various mergers and acquisitions. Both regulatory and political risk premia in different sectors can persist. The current administration has waged several sweeping regulatory campaigns against monopolies, corruption, pollution, overcapacity, leverage, and non-governmental organizations. The time between the initial launch of one of these campaigns and their peak intensity ranges from two to five years (Chart 6). Often, but not always, central policy campaigns have an express, three-year plan associated with them. Chart 6ABeijing Cracked Down On Monopolies, Corruption, Pollution...
Beijing Cracked Down On Monopolies, Corruption, Pollution...
Beijing Cracked Down On Monopolies, Corruption, Pollution...
Chart 6B...NGOs, Overcapacity, And Leverage
...NGOs, Overcapacity, And Leverage
...NGOs, Overcapacity, And Leverage
Chart 7China Tech: Buyer Beware
China Tech: Buyer Beware
China Tech: Buyer Beware
The first and second year mark the peak impact. The negative profile of Chinese tech stocks relative to their global peers suggests that the current crackdown is stretched, although there is little sign of bottom formation yet (Chart 7). The crackdown began with Alibaba founder Jack Ma, and Alibaba stocks have yet to arrest their fall either in absolute terms or relative to the Hang Seng tech index. Bottom Line: A technical bounce is highly likely for Chinese stocks, especially tech, but we would not recommend playing it because of the negative structural factors. For instance, we fully expect the US to delist Chinese companies that do not meet accounting standards. The Chinese Government’s Pain Threshold? The government is not all-powerful – it faces financial and economic constraints, even if political checks and balances are missing. Beijing does not have an interest in destroying its most innovative companies and sectors. Its goal is to maintain the regime’s survival and power. China’s crackdown on private companies goes against its strategic interest of promoting innovation and therefore it cannot continue indefinitely. The hurried meeting of the China Securities Regulatory Commission with top bankers on July 28 suggests policymakers are already feeling the heat.7 In the case of Ant Group, the company ultimately paid a roughly $3 billion fine (which is 18% of its annual revenues) and was forced to restructure. Ant learned that if it wants to behave more like a bank athen it will be regulated more like a bank. Yet investors will still have to wrestle with the long-term implications of China’s arbitrary use of state power to crack down on various companies and IPOs. This is negative for entrepreneurship and innovation, regardless of the government’s intentions. Chart 8China's Pain Threshold = Property Sector
China's Pain Threshold = Property Sector
China's Pain Threshold = Property Sector
Ultimately the property sector is the critical bellwether: it is a prime target of the government’s measures against speculative asset bubbles. It is also an area where authorities hope to ease the cost of living for Chinese households, whose birth rates and fertility rates are collapsing. While there is no risk of China’s entire economy crumbling because of a crackdown on ride-hailing apps or tutoring services, there is a risk of the economy crumbling if over-zealous regulators crush animal spirits in the $52 trillion property sector, as estimated by Goldman Sachs in 2019. Property is the primary store of wealth for Chinese households and businesses and falling property prices could well lead to an unsustainable rise in debt burdens, a nationwide debt-deflation spiral, and a Japanese-style liquidity trap. Judging by residential floor space started, China is rapidly approaching its overall economic pain threshold, meaning that property sector restrictions should ease, while monetary and credit policy should get easier as necessary to preserve the economic recovery (Chart 8). The economy should improve just in time for the party congress in late 2022. Bottom Line: China will be forced to maintain relatively easy monetary and fiscal policy and avoid pricking the property bubble, which should lend some support to the global recovery and emerging markets economies over the cyclical (12-month) time frame. China’s Regulation And Demographic Pressures Is the Chinese government not acting in the public interest by tamping down financial excesses, discouraging anti-competitive corporate practices, and combating social ills? Yes, there is truth to this. But arbitrary administrative controls will not increase the birth rate, corporate productivity, or potential GDP growth. First, it is true that Chinese households cite high prices for education, housing, and medicine as reasons not to have children (Chart 9). However, price caps do not attack the root causes of these problems. The lack of financial security and investment options has long fueled high house prices. The rabid desire to get ahead in life and the exam-oriented education system have long fueled high education prices. Monetary and fiscal authorities are forced to maintain an accommodative environment to maintain minimum levels of economic growth amid high indebtedness – and yet easy money policies fuel asset price inflation. In Japan, fertility rates began falling with economic development, the entrance of women in the work force, and the rise of consumer society. The fertility rate kept falling even when the country slipped into deflation. It perked up when prices started rising again! But it relapsed after the Great Recession and Fukushima nuclear crisis (Chart 10, top panel). Chart 9China: Concerns About Having Children
Hypo-Globalization (A GeoRisk Update)
Hypo-Globalization (A GeoRisk Update)
China’s fertility rate bottomed in the 1990s and has gradually recovered despite the historic surge in property prices (Chart 10, second panel), though it is still well below the replacement rate needed to reverse China’s demographic decline in the absence of immigration. A lower cost of living and a higher quality of life will be positive for fertility but will require deeper reforms.8 Chart 10Fertility Fell In Japan Despite Falling Prices
Fertility Fell In Japan Despite Falling Prices
Fertility Fell In Japan Despite Falling Prices
At the same time, arbitrary regulatory crackdowns that punish entrepreneurs are not likely to boost productivity. Anti-trust actions could increase competition, which would be positive for productivity, but China’s anti-trust actions are not conducted according to rule of law, or due process, so they increase uncertainty rather than providing a more stable investment environment. China’s tech crackdown is also aimed at limiting vulnerability to foreign (American) authorities. Yet disengagement with the global economy will reduce competition, innovation, and productivity in China. Bottom Line: China’s demographic decline will require larger structural changes. It will not be reversed by an arbitrary game of whack-a-mole against the prices of housing, education, and health. India And South Asia Chart 11China Will Ease Policy... Or India Will Break Out
China Will Ease Policy... Or India Will Break Out
China Will Ease Policy... Or India Will Break Out
Global investors have turned to Indian equities over the course of the year and they are now reaching a major technical top relative to Chinese stocks (Chart 11). Assuming that China pulls back on its policy tightening, this relationship should revert to mean. India faces tactical geopolitical and macroeconomic headwinds that will hit her sails and slow her down. In other words, there is no great option for emerging markets at the moment. Over the long run, India benefits if China falters. Following the peak of the second COVID-19 wave in May 2021, some high frequency indicators have showed an improvement in India’s economy. However, activity levels appear weaker than of other emerging markets (Chart 12). Given the stringency levels of India’s first lockdown last spring, year-on-year growth will look faster than it really is. As the base effect wanes, underlying weak demand will become evident. Moreover India is still vulnerable to COVID-19. Only 25% of the population has received one or more vaccine shots which is lower than the global level of 28%. The result will be a larger than expected budget deficit. India refrained from administering a large dose of government spending in 2020 (Chart 13). With key state elections due from early 2022 onwards, the government could opt for larger stimulus. This could assume the form of excise duty cuts on petroleum products or an increase in revenue expenditure. These kinds of measures will not enhance India’s productivity but will add to its fiscal deficit. Chart 12Weak Post-COVID Rebound In India – And Losing Steam
Hypo-Globalization (A GeoRisk Update)
Hypo-Globalization (A GeoRisk Update)
Chart 13India Likely To Expand Fiscal Spending Soon
Hypo-Globalization (A GeoRisk Update)
Hypo-Globalization (A GeoRisk Update)
Such an unexpected increase in India’s fiscal deficit could be viewed adversely by markets. India’s fiscal discipline tends to be poorer than that of peers (see Chart 13 above). Meanwhile India’s north views Pakistan unfavorably and key state elections are due in this region. Consequently, Indian policy makers may be forced to adopt a far more aggressive foreign policy response to any terrorist strikes from Pakistan or territorial incursions by China over August 2021. The US withdrawal from Afghanistan poses risks for India as it has revived the Taliban’s influence. India has a long history of being targeted by Afghani terrorist groups. And its diplomatic footprint in Afghanistan has been diminishing. Earlier in July, India decided temporarily to close its consulate in Kandahar and evacuated about 50 diplomats and security personnel. As August marks the last month of formal US presence in Afghanistan, negative surprises emanating from Afghanistan should be expected. Bottom Line: Pare exposure to Indian assets on a tactical basis. Our Emerging Markets Strategy takes a more optimistic view but geopolitical changes could act as a negative catalyst in the short term. We urge clients to stay short Indian banks. Investment Takeaways US stimulus contrasts with China’s turmoil. The US Biden administration and congressional negotiators of both parties have tentatively agreed on a $1 trillion infrastructure deal over eight years. Even if this bipartisan deal falls through, Democrats alone can and will pass another $1.3-$2.5 trillion in net deficit spending by the end of the year. Stay short the renminbi. Prefer a balance of investments in the dollar and the euro, given the cross-currents of global recovery yet mounting risks to the reflation trade. A technical bounce in Chinese stocks and tech stocks is nigh. China’s policymakers are starting to respond to immediate financial pressures. However, growth has peaked and structural factors are still negative. The geopolitical outlook is still gloomy and China’s domestic political clock is a headwind for at least 12 more months. Prefer developed market equities over emerging markets (Chart 14). Emerging markets failed to outperform in the first half of the year, contrary to our expectation that the global reflation trade would lift them. China/EM will benefit when Beijing eases policy and growth rebounds. Chart 14Emerging Markets: Not Out Of The Woods Yet
Emerging Markets: Not Out Of The Woods Yet
Emerging Markets: Not Out Of The Woods Yet
Stay short Indian banks and strongman EM currencies, including the Turkish lira, the Brazilian real, and the Philippine peso. The biggest driver of EM underperformance this year is the divergence between the US and China. But until China’s policy corrects, the rest of EM faces downside risks. Matt Gertken Vice President Geopolitical Strategy mattg@bcaresearch.com Ritika Mankar, CFA Editor/Strategist ritika.mankar@bcaresearch.com Footnotes 1 Dani Rodrik, The Globalization Paradox: Democracy and the Future of the World Economy (New York: Norton, 2011). 2 See my "Nationalism And Globalization After COVID-19," Investments & Wealth Monitor (Jan/Feb 2021), pp13-21, investmentsandwealth.org. 3 Our study of Xi’s speech is not limited to this quantitative, word-count analysis. A fuller comparison of his speech with that of his predecessors on the same occasion reveals that Xi was fundamentally more favorable toward Marx, less favorable toward Deng Xiaoping and the pro-market Third Plenum, utterly silent on notions of political reform or liberal reform, more harsh in his rhetoric toward the outside world, and hawkish about the mission of reunifying with Taiwan. 4 The Chinese side also insisted that the US stop revoking visas, punishing companies and institutes, treating the press as foreign agents, and detaining executives. It warned that cooperation – which the US seeks on the environment, Iran, North Korea, and other areas – cannot be achieved while the US imposes punitive measures. 5 See US Department of State, "Xinjiang Supply Chain Business Advisory," July 13, 2021, and "Risks and Considerations for Businesses Operating in Hong Kong," July 16, 2021, state.gov. 6 Top business executives are also subject to these displays of state power. For example, Alibaba founder Jack Ma caricatured China’s traditional banks as “pawn shops” and criticized regulators for stifling innovation. He is now lying low and has taken to painting! 7 See Emily Tan and Evelyn Cheng, "China will still allow IPOs in the United States, securities regulator tells brokerages," CNBC, July 28, 2021, cnbc.com. Officials are sensitive to the market blowback but the fact remains that IPOs in the US have been discouraged and arbitrary regulatory crackdowns are possible at any time. 8 Increasing social spending also requires local governments to raise more revenue but the central government had been cracking down on the major source of revenues for local government: land sales and local government financing vehicles. With the threat of punishment for local excesses and lack of revenue source, local governments have no choice but to cut social services, pushing affluent residents towards private services, while leaving the less fortunate with fewer services. As with financial regulations, the central government may backpedal from too tough regulation of local governments, but more economic and financial pain will be required to make it happen. The Geopolitics Of The Olympics The 2020 Summer Olympics are currently underway in Tokyo, even though it is 2021. The arenas are mostly empty given the global pandemic and economic slowdown. Every four years the Summer Olympics create a golden opportunity for the host nation to showcase its achievements, infrastructure, culture, and beauty. But the Olympics also have a long history of geopolitical significance: terrorist acts, war protests, social demonstrations, and boycotts. In 1906 an Irish athlete climbed a flag pole to wave the Irish flag in protest of his selection to the British team instead of the Irish one. In 1968 two African American athletes raised their fists as an act of protest against racial discrimination in the US after the assassination of Martin Luther King Jr. In 1972, the Palestinian terrorist group Black September massacred eleven Israeli Olympians in Munich, Germany. In 1980 the US led the western bloc to boycott the Moscow Olympics while the Soviet Union and its allies retaliated by boycotting the 1984 Los Angeles Olympics. In 2008, Russia used the Olympics as a convenient distraction from its invasion of Georgia, a major step in its geopolitical resurgence. So far, thankfully, the Tokyo Olympics have gone without incident. However, looking forward, geopolitics is already looming over the upcoming 2022 Winter Olympics in Beijing.
Hypo-Globalization (A GeoRisk Update)
Hypo-Globalization (A GeoRisk Update)
How the world has changed. The 2008 Summer Olympics marked China’s global coming-of-age celebration. The breathtaking opening ceremony featured 15,000 performers and cost $100 million. The $350 million Bird’s Nest Stadium showcased to the world China’s long history, economic prowess, and various other triumphs. All of this took place while the western democratic capitalist economies grappled with what would become the worst financial and economic crisis since the Great Depression. In 2008, global elites spoke of China as a “responsible stakeholder” that was conducting a “peaceful rise” in international affairs. The world welcomed its roughly $600 billion stimulus. Now elites speak of China as primarily a threat and a competitor, a “revisionist” state challenging the liberal world order. China is blamed for a lack of transparency (if not virological malfeasance) in handling the COVID-19 pandemic. It is blamed for breaking governance promises and violating human rights in Hong Kong, for alleged genocide in Xinjiang, and for a list of other wrongdoings, including tough “Wolf Warrior” diplomacy, cyber-crime and cyber-sabotage, and revanchist maritime-territorial claims. Even aside from these accusations it is clear that China is suffering greater financial volatility as a result of its conflicting economic goals. Talk of a diplomatic or even full boycott of Beijing’s winter games is already brewing. Sponsors are also second-guessing their involvement. More than half of Canadians support boycotting the winter games. Germany is another bellwether to watch. In 2014, Germany’s president (not chancellor) boycotted the Sochi Olympics; in 2021, the EU and China are witnessing a major deterioration of relations. Parliamentarians in the UK, Italy, Sweden, Switzerland, and Norway have asked their governments to outline their official stance on the winter games. In the age of “woke capitalism,” a sponsorship boycott of the games is a possibility. This is especially true given the recent Chinese backlash against European multinational corporations for violating China’s own rules of political correctness. A boycott which includes any members of the US, Norway, Canada, Sweden, Germany, or the Netherlands would be substantial as these are the top performers in the Winter Olympics. Even if there is no boycott, there is bound to be some political protests and social demonstrations, and China will not be able to censor anything said by Western broadcasters televising the events. Athletes usually suffer backlash at home if they make critical statements about their country, but they run very little risk of a backlash for criticizing China. If anything, protests against China’s handling of human rights will be tacitly encouraged. Beijing, for its part, will likely overreact, as these days it not only controls the message at home but also attempts more actively to export censorship. This is precisely what the western governments are now trying to counteract, for their own political purposes. The bottom line is that the 2008 Beijing Olympics reflected China’s strengths in stark contrast with the failures of democratic capitalism, while the 2022 Olympics are likely to highlight the opposite: China’s weaknesses, even as the liberal democracies attempt a revival of their global leadership. Jesse Anak Kuri Associate Editor Jesse.Kuri@bcaresearch.com Section II: GeoRisk Indicator China
China: GeoRisk Indicator
China: GeoRisk Indicator
Russia
Russia: GeoRisk Indicator
Russia: GeoRisk Indicator
United Kingdom
UK: GeoRisk Indicator
UK: GeoRisk Indicator
Germany
Germany: GeoRisk Indicator
Germany: GeoRisk Indicator
France
France: GeoRisk Indicator
France: GeoRisk Indicator
Italy
Italy: GeoRisk Indicator
Italy: GeoRisk Indicator
Canada
Canada: GeoRisk Indicator
Canada: GeoRisk Indicator
Spain
Spain: GeoRisk Indicator
Spain: GeoRisk Indicator
Taiwan
Taiwan: GeoRisk Indicator
Taiwan: GeoRisk Indicator
Korea
Korea: GeoRisk Indicator
Korea: GeoRisk Indicator
Turkey
Turkey: GeoRisk Indicator
Turkey: GeoRisk Indicator
Brazil
Brazil: GeoRisk Indicator
Brazil: GeoRisk Indicator
Australia
Australia: GeoRisk Indicator
Australia: GeoRisk Indicator
Section III: Geopolitical Calendar
Highlights Investors should view social media as a technological innovation with negative productivity growth. Social media has contributed to policy mistakes – such as fiscal austerity and protectionism – that have acted as shocks to aggregate demand over the past 15 years. The cyclical component of productivity was long lasting in nature during the last economic expansion. Forces that negatively impact economic growth but do not change the factors of production necessarily reduce measured productivity, and repeated policy mistakes strongly contributed to the slow growth profile of the last economic cycle. Political polarization in a rapidly changing world is the root cause of these policy shocks, but social media likely facilitated and magnified them. The risks of additional mistakes from populism remain present, even before considering other risks to society from social media: a reduction in mental health among young social media users, and the role that social media has played in spreading misinformation. A potential revival in protectionist sentiment is a risk to a constructive cyclical view that we will be closely monitoring over the coming 12-24 months. Investors with concentrated positions in social media stocks should be aware of the potential idiosyncratic risks facing these companies from the public’s impression of the impact of social media on society – especially if social media companies come to be widely associated with political gridlock, the polarization of society, and failed economic policies (as already appears to be the case). Feature Investors should view social media as a technological innovation with negative productivity growth. Social media has contributed to policy mistakes – such as fiscal austerity and protectionism – that have acted as shocks to aggregate demand over the past 15 years. Political polarization in a rapidly changing world is the root cause of these policy shocks, but social media likely facilitated and magnified them. While the risk of premature fiscal consolidation appears low today compared to the 2010-14 period, the pandemic and its aftermath could force the Biden administration or Congressional Democrats toward protectionist or otherwise populist actions over the coming year in the lead up to the 2022 mid-term elections. The midterms, for their part, are expected to bring gridlock back into US politics, which could remove fiscal options should the economy backslide. Frequent shocks during the last economic expansion reinforced the narrative of secular stagnation. In the coming years, any additional policy shocks following a return to economic normality will again be seen by both investors and the Fed as strong justification for low interest rates – despite the case for cyclically and structurally higher bond yields. In addition, investors with concentrated positions in social media companies should take seriously the long-term idiosyncratic risks facing these stocks. These risks stem from the public’s impression of the impact of social media on society, particularly if social media comes to be widely associated with political gridlock, the polarization of society, and failed economic policies. A Brief History Of Social Media The earliest social networking websites date back to the late 1990s, but the most influential social media platforms, such as Facebook and Twitter, originated in the mid-2000s. Prior to the advent of modern-day smartphones, user access to platforms such as Facebook and Twitter was limited to the websites of these platforms (desktop access). Following the release of the first iPhone in June 2007, however, mobile social media applications became available, allowing users much more convenient access to these platforms. Charts II-1 and II-2 highlight the impact that smartphones have had on the spread of social media, especially since the release of the iPhone 3G in 2008. In 2006, Facebook had roughly 12 million monthly active users; by 2009, this number had climbed to 360 million, growing to over 600 million the year after. Twitter, by contrast, grew somewhat later, reaching 100 million monthly active users in Q3 2011. Chart II-1Facebook: Monthly Active Users
August 2021
August 2021
Chart II-2Twitter: Monthly Active Users Worldwide
August 2021
August 2021
Social media usage is more common among those who are younger, but Chart II-3 highlights that usage has risen over time for all age groups. As of Q1 2021, 81% of Americans aged 30-49 reported using at least one social media website, compared to 73% of those aged 50-64 and 45% of those aged 65 and over. Chart II-4 highlights that the usage of Twitter skews in particular toward the young, and that, by contrast, Facebook and YouTube are the social media platforms of choice among older Americans. Chart II-3A Sizeable Majority Of US Adults Regularly Use Social Media
A Sizeable Majority Of US Adults Regularly Use Social Media
A Sizeable Majority Of US Adults Regularly Use Social Media
Chart II-4Older Americans Use Facebook Far More Than Twitter
August 2021
August 2021
Chart II-5Social Media Has Changed The Way People Consume News
August 2021
August 2021
As a final point documenting the development and significance of social media, Chart II-5 highlights that more Americans now report consuming news often (roughly once per day) from a smartphone, computer, or tablet other than from television. Radio and print have been completely eclipsed as sources of frequent news. The major news publications themselves are often promoted through social media, but the rise of the Internet has weighed heavily on the journalism industry. Social media has, for better and for worse, enabled the rapid proliferation of alternative news, citizen journalism, rumor, conspiracy theories, and foreign disinformation. The Link Between Social Media And Post-GFC Austerity Following the 2008-2009 global financial crisis (GFC), there have been at least five deeply impactful non-monetary shocks to the US and global economies that have contributed to the disconnection between growth and interest rates: A prolonged period of US household deleveraging from 2008-2014 The Euro Area sovereign debt crisis Fiscal austerity in the US, UK, and Euro Area from 2010 – 2012/2014 The US dollar / oil price shock of 2014 The rise of populist economic policies, such as the UK decision to leave the European Union, and the US-initiated trade war of 2018-2019. Among these shocks to growth, social media has had a clear impact on two of them. In the case of austerity in the aftermath of the Great Recession, a sharp rise in fiscal conservatism in 2009 and 2010, emblematized by the rise of the US Tea Party, profoundly affected the 2010 US midterm elections. It is not surprising that there was a fiscally conservative backlash following the crisis: the US budget deficit and debt-to-GDP ratio soared after the economy collapsed and the government enacted fiscal stimulus to bail out the banking system. And midterm elections in the US often lead to significant gains for the opposition party However, Tea Party supporters rapidly took up a new means of communicating to mobilize politically, and there is evidence that this contributed to their electoral success. Chart II-6 illustrates that the number of tweets with the Tea Party hashtag rose significantly in 2010 in the lead-up to the election, which saw the Republican Party take control of the House of Representatives as well as the victory of several Tea Party-endorsed politicians. Table II-1 highlights that Tea Party candidates, who rode the wave of fiscal conservatism, significantly outperformed Democrats and non-Tea Party Republicans in the use of Twitter during the 2010 campaign, underscoring that social media use was a factor aiding outreach to voters. Chart II-6Tea Party Supporters Rapidly Adopted Social Media To Mobilize Politically
Tea Party Supporters Rapidly Adopted Social Media To Mobilize Politically
Tea Party Supporters Rapidly Adopted Social Media To Mobilize Politically
Table II-1Tea Party Candidates Significantly Outperformed In Their Use Of Social Media
August 2021
August 2021
And while it is more difficult to analyze the use and impact of Facebook by Tea Party candidates and supporters owing to inherent differences in the structure of the Facebook platform, interviews with core organizers of both the Tea Party and Occupy Wall Street movements have noted that activists in these ideologically opposed groups viewed Facebook as the most important social networking service for their political activities.1 Under normal circumstances, we agree that fiscal policy should be symmetric, with reduced fiscal support during economic expansions following fiscal easing during recessions. But in the context of multi-year household deleveraging, the fiscal drag that occurred in following the 2010 midterm elections was clearly a policy mistake. This mistake occurred partially under full Democratic control of government and especially under a gridlocked Congress after 2010. Chart II-7 highlights that the contribution to growth from government spending turned sharpy negative in 2010 and continued to subtract from growth for some time thereafter. In addition, panel of Chart II-7 highlights that the US economic policy uncertainty index rose in 2010 after falling during the first year of the recovery, reaching a new high in 2011 during the Tea Party-inspired debt ceiling crisis. Chart II-7The Fiscal Drag That Followed The 2010 Midterm Elections Was A Clear Policy Mistake
The Fiscal Drag That Followed The 2010 Midterm Elections Was A Clear Policy Mistake
The Fiscal Drag That Followed The 2010 Midterm Elections Was A Clear Policy Mistake
Chart II-8Policy Mistakes Significantly Contributed To Last Cycle's Subpar Growth Profile
Policy Mistakes Significantly Contributed To Last Cycle's Subpar Growth Profile
Policy Mistakes Significantly Contributed To Last Cycle's Subpar Growth Profile
In addition to the negative impact of government spending on economic growth, this extreme uncertainty very likely damaged confidence in the economic recovery, contributing to the subpar pace of growth in the first half of the last economic expansion. Chart II-8 highlights the weak evolution in real per capita GDP from 2009-2019 compared with previous economic cycles, which was caused by a prolonged household balance sheet recovery process that was made worse by policy mistakes. To be sure, the UK and the EU did not have a Tea Party, and yet political elites imposed fiscal austerity. It is also the case that President Obama was the first president to embrace social media as a political and public relations tool. So it cannot be said that either social media or the Republican Party are uniquely to blame for the policy mistakes of that era. But US fiscal policy would have been considerably looser in the 2010s if not for the Tea Party backlash, which was partly enabled by social media. Too tight of fiscal policy in turn fed populism and produced additional policy mistakes down the road. From Fiscal Drag To Populism While social media is clearly not the root cause of the recent rise of populist policies, it has had a hand in bringing them about – in both a direct and indirect manner. The indirect link between social media use and the rise in populist policies has mainly occurred through the highly successful use of social media by international terrorist organizations (chiefly ISIL) and its impact on sentiment toward immigration in several developed market economies. Chart II-9Terrorism And Immigration Likely Contributed To Brexit
Terrorism And Immigration Likely Contributed To Brexit
Terrorism And Immigration Likely Contributed To Brexit
Chart II-9 highlights that public concerns about immigration and race in the UK began to rise sharply in 2012, in lockstep with both the rise in UK immigrants from EU accession countries and a series of events: the Syrian refugee crisis, the establishment and reign of the Islamic State, and three major terrorist attacks in European countries for which ISIL claimed responsibility. Given that the main argument for “Brexit” was for the UK to regain control over its immigration policies, these events almost certainly increased UK public support for withdrawing from the EU. In other words, it is not clear that Brexit would have occurred (at least at that moment in time) without these events given the narrow margin of victory for the “leave” campaign. The absence of social media would not have prevented the rise of ISIL, as that occurred in response to the US’s precipitous withdrawal from Iraq. The inevitable rise of ISIL would still have generated a backlash against immigration. Moreover, fiscal austerity in the UK and EU also fed other grievances that supported the Brexit movement. But social media accelerated and amplified the entire process. Chart II-10Brexit Weakened UK Economic Performance Prior To The Pandemic
Brexit Weakened UK Economic Performance Prior To The Pandemic
Brexit Weakened UK Economic Performance Prior To The Pandemic
Chart II-10 presents fairly strong evidence that Brexit weakened UK economic performance relative to the Euro Area prior to the pandemic, with the exception of the 2018-2019 period. In this period Euro Area manufacturing underperformed during the Trump administration’s trade war as a result of its comparatively higher exposure to automobile production and its stronger ties to China. Panel 2 highlights that GBP-EUR fell sharply in advance of the referendum, and remains comparatively weak today. Turning to the US, Donald Trump’s election as US President in 2016 was aided by both the direct and indirect effects of social media. In terms of indirect effects, Trump benefited from similar concerns over immigration and terrorism that caused the UK to leave the EU: Chart II-11 highlights that terrorism and foreign policy were second and third on the list of concerns of registered voters in mid-2016, and Chart II-12 highlights that voters regarded Trump as the better candidate to defend the US against future terrorist attacks. Chart II-11Terrorism Ranked Highly As An Issue In The 2016 US Election
August 2021
August 2021
Chart II-12Voters Regarded Trump As Better Equipped To Defend Against Terrorism
August 2021
August 2021
Trump’s election; and the enactment of populist policies under his administration, were directly aided by Trump’s active use of social media (mainly Twitter) to boost his candidacy. Chart II-13 highlights that there were an average of 15-20 tweets per day from Trump’s Twitter account from 2013-2015, and 80% of those tweets occurred before he announced his candidacy for president in June 2015. This strongly underscores that Trump mainly used Twitter to lay the groundwork for his candidacy as an unconventional political outsider rather than as a campaign tool itself, which distinguishes his use of social media from that of other politicians. In other words, new technology disrupted the “good old boys’ club” of traditional media and elite politics. Some policies of the Trump administration were positive for financial markets, and it is fair to say that Trump fired up animal spirits to some extent: Chart II-14 highlights that the Tax Cuts and Jobs Act caused a significant rise in stock market earnings per share. But the Trump tax cuts were a conventional policy pushed mostly by the Congressional leadership of the Republican Party, and they did not meaningfully boost economic growth. Chart II-15 highlights that, while the US ISM manufacturing index rose sharply in the first year of Trump’s administration, an uptrend was already underway prior to the election as a result of a significant improvement in Chinese credit growth and a recovery in oil prices after the devastating collapse that took place in 2014-2015. Chart II-13Trump Used Twitter To Lay The Groundwork For His Candidacy
Trump Used Twitter To Lay The Groundwork For His Candidacy
Trump Used Twitter To Lay The Groundwork For His Candidacy
Chart II-14The Trump Tax Cuts A Huge Rise In Corporate Earnings
The Trump Tax Cuts A Huge Rise In Corporate Earnings
The Trump Tax Cuts A Huge Rise In Corporate Earnings
Chart II-15But The Tax Cuts Did Not Do Much To Boost Growth
But The Tax Cuts Did Not Do Much To Boost Growth
But The Tax Cuts Did Not Do Much To Boost Growth
Similarly, Chart II-15 highlights that the Trump trade war does not bear the full responsibility of the significant slowdown in growth in 2019, as China’s credit impulse decelerated significantly between the passage of the Tax Cuts and Jobs Act and the onset of the trade war because Chinese policymakers turned to address domestic concerns. Chart II-16The Trade War Caused An Explosion In Global Trade Uncertainty
The Trade War Caused An Explosion In Global Trade Uncertainty
The Trade War Caused An Explosion In Global Trade Uncertainty
But Chart II-16 highlights that the aggressive imposition of tariffs, especially between the US and China, caused an explosion in trade uncertainty even when measured on an equally-weighted basis (i.e., when overweighting trade uncertainty, in countries other than the US and China), which undoubtedly weighed on the global economy and contributed to a very significant slowdown in US jobs growth in 2019 (panel 2). Moreover, Chinese policymakers responded to the trade onslaught by deleveraging, which weighed on the global economy; and consolidating their grip on power at home. In essence, Trump was a political outsider who utilized social media to bypass the traditional media and make his case to the American people. Other factors contributed to his surprising victory, not the least of which was the austerity-induced, slow-growth recovery in key swing states. While US policy was already shifting to be more confrontational toward China, the Trump administration was more belligerent in its use of tariffs than previous administrations. The trade war thus qualifies as another policy shock that was facilitated by the existence of social media. Viewing Social Media As A Negative Productivity-Innovation A rise in fiscal conservatism leading to misguided austerity, the UK’s decision to leave the European Union, and the Trump administration’s trade war have represented significant non-monetary shocks to both the US and global economies over the past 12 years. These shocks strongly contributed to the subpar growth profile of the last economic expansion, as demonstrated above. Chart II-17Policy Mistakes, Partially Enabled By Social Media, Reduced Productivity During The Last Expansion
Policy Mistakes, Partially Enabled By Social Media, Reduced Productivity During The Last Expansion
Policy Mistakes, Partially Enabled By Social Media, Reduced Productivity During The Last Expansion
Given the above, it is reasonable for investors to view social media as a technological innovation with negative productivity growth, given that it has facilitated policy mistakes during the last economic expansion. Chart II-17 underscores this point, by highlighting that multi-factor productivity growth has been extremely weak in the post-GFC environment. While productivity is usually driven by supply-side factors over the longer term, it has a cyclical component to it – and in the case of the last economic expansion, the cyclical component was long lasting in nature. Any forces negatively impacting economic growth that do not change the factors of production necessarily reduce measured productivity; it is for this reason that measured productivity declines during recessions; and policy mistakes negatively impact productivity growth. The Risk Of Aggressive Austerity Seems Low Today… Chart II-18State & Local Government Finances Are In Much Better Shape Today
State & Local Government Finances Are In Much Better Shape Today
State & Local Government Finances Are In Much Better Shape Today
Fiscal austerity in the early phase of the last economic cycle was the first social media-linked shock that we identified, but the risk of aggressive austerity appears low today. Much of the fiscal drag that occurred in the aftermath of the global financial crisis happened because of insufficient financial support to state and local governments – and the subsequent refusal by Congress to authorize more aid. But Chart II-18 highlights that state and local government finances have already meaningfully recovered, on the back of bipartisan stimulus in 2020, while the American Rescue Plan provides significant additional funding. While it is true that US fiscal policy is set to detract from growth over the coming 6-12 months, this will merely reflect the unwinding of fiscal aid that had aimed to support household income temporarily lost, as a result of a drastic reduction in services spending. As we noted in last month’s report,2 goods spending will likely slow as fiscal thrust turns to fiscal drag, but services spending will improve meaningfully – aided not just by a post-pandemic normalization in economic activity, but also by the deployment of some of the sizable excess savings that US households have accumulated over the past year. Fiscal drag will also occur outside of the US next year. For example, the IMF is forecasting a two percentage point increase in the Euro Area’s cyclically-adjusted primary budget balance, which would represent the largest annual increase over the past two decades. But here too the reduction in government spending will reflect the end of pandemic-related income support, and is likely to occur alongside a positive private-sector services impulse. During the worst of the Euro Area sovereign debt crisis, the impact of austerity was especially acute because it was persistent, and it occurred while the output gap was still large in several Euro Area economies. Chart II-19 highlights that Euro Area fiscal consolidation from 2010-2013 was negatively correlated with economic activity during that period, and Chart II-20 highlights that, with the potential exception of Spain, this austerity does not appear to have led to subsequently stronger rates of growth. Chart II-19Euro Area Austerity Lowered Growth During The Consolidation Phase…
August 2021
August 2021
Chart II-20…And Did Not Seem To Subsequently Raise Growth
August 2021
August 2021
This experiment in austerity led the IMF to conclude that fiscal multipliers are indeed large during periods of substantial economic slack, constrained monetary policy, and synchronized fiscal adjustment across numerous economies.3 Similarly, attitudes about austerity have shifted among policymakers globally in the wake of the populist backlash. Given this, despite the significant increase in government debt levels that has occurred as a result of the pandemic, we strongly doubt that advanced economies will attempt to engage in additional austerity prematurely, i.e., before unemployment rates have returned close-to steady-state levels. …But The Risk Of Protectionism And Other Populist Measures Looms Large The role that social media has played at magnifying populist policies should be concerning for investors, especially given that there has been a rising trend towards populism over the past 20 years. In a recent paper, Funke, Schularick, and Trebesch have compiled a cross-country database on populism dating back to 1900, defining populist leaders as those who employ a political strategy focusing on the conflict between “the people” and “the elites.” Chart II-21 highlights that the number of populist governments worldwide has risen significantly since the 1980s and 1990s, and Chart II-22 highlights that the economic performance of countries with populist leaders is clearly negative. Chart II-21Populism Has Been On The Rise For The Past 30 Years
August 2021
August 2021
The authors found that countries’ real GDP growth underperformed by approximately one percentage point per year after a populist leader comes to power, relative to both the country’s own long-term growth rate and relative to the prevailing level of global growth. To control for the potential causal link between economic growth and the rise of populist leaders, Chart II-23 highlights the results of a synthetic control method employed by the authors that generates a similar conclusion to the unconditional averages shown in Chart II-22: populist economic policies are significantly negative for real economic growth. Chart II-22Populist Leaders Are Clearly Growth Killers Even After…
August 2021
August 2021
Chart II-23… Controlling For The Odds That Weak Growth Leads To Populism
August 2021
August 2021
Chart II-24Inequality: The Most Important Structural Cause Of Populism And Polarization
Inequality: The Most Important Structural Cause Of Populism And Polarization
Inequality: The Most Important Structural Cause Of Populism And Polarization
This is especially concerning given that wealth and income inequality, perhaps the single most important structural cause of rising populism and political polarization, is nearly as elevated as it was in the 1920s and 1930s (Chart II-24). This trend, at least in the US, has been exacerbated by a decline in public trust of mainstream media among independents and Republicans that began in the early 2000s and helped to fuel the public’s adoption of alternative news and social media. The decline in trust clearly accelerated as a result of erroneous reporting on what turned out to be nonexistent weapons of mass destruction in Iraq and other controversies of the Bush administration. Chart II-21 showed that the rise in populism has also yet to abate, suggesting that social media has the potential to continue to amplify policy mistakes for the foreseeable future. It is not yet clear what economic mistakes will occur under the Biden administration, but investors should not rule out the possibility of policies that are harmful for growth. The likely passage of a bipartisan infrastructure bill or a partisan reconciliation bill in the second half of this year will most likely be the final word on fiscal policy until at least 2025,4 underscoring that active fiscal austerity is not likely a major risk to investors. Spending levels will probably freeze after 2022: Republicans will not be able to slash spending, and Democrats will not be able to hike spending or taxes, if Republicans win at least one chamber of Congress in the midterms (as is likely). Biden has preserved the most significant of Trump’s protectionist policies by maintaining US import tariffs against China, and the lesson from the Tea Party’s surge following the global financial crisis is that major political shifts, magnified by social media, can manifest themselves as policy with the potential to impact economic activity within a two-year window. Attitudes toward China have shifted negatively around the world because of deindustrialization and now the pandemic.5 White collar workers in DM countries have clearly fared better during lockdowns than those of lower-income households. This has created extremely fertile ground for a revival in populist sentiment, which could force the Biden administration or Congressional Democrats toward protectionist or otherwise populist actions over the coming year, in the lead up to the 2022 mid-term elections. Investment Conclusions In this report, we have documented the historical link between social media, populism, and policy mistakes during the last economic expansion. It is clear that neither social media nor even populism is solely responsible for all mistakes – the UK’s and EU’s ill-judged foray into austerity was driven by elites. Furthermore, we have not addressed in this report the impact of populism on actions of emerging markets, such as China and Russia, whose own behavior has dealt disinflationary blows to the global economy. Nevertheless, populism is a potent force that clearly has the power to harness new technology and deliver shocks to the global economy and financial markets. The risks of additional mistakes from populism are still present, and that is even before considering other risks to society from social media: a reduction in mental health among young social media users, and the role that social media has played in spreading misinformation – contributing to the vaccine hesitancy in some DM countries that we discussed in Section 1 of our report. Two investment conclusions emerge from our analysis. First, we noted in our April report that there is a chance that investor expectations for the natural rate of interest (“R-star”) will rise once the economy normalizes post-pandemic, but that this will likely not occur as long as investors continue to believe in the narrative of secular stagnation. Despite the fact that the past decade’s shocks occurred against the backdrop of persistent household deleveraging (which has ended in the US), these shocks reinforced that narrative, and any additional policy shocks following a return to economic normality will again be seen by both investors and the Fed as strong justification for low interest rates. Thus, while the rapid closure of output gaps in advanced economies over the coming year argues for both cyclically and structurally higher bond yields, a revival in protectionist sentiment is a risk to this view that we will be closely monitoring over the coming 12-24 months. Chart II-25The Underperformance Of Social Media Would Not Excessively Weigh On The Broad Market
The Underperformance Of Social Media Would Not Excessively Weigh On The Broad Market
The Underperformance Of Social Media Would Not Excessively Weigh On The Broad Market
Second, for tech investors, the bipartisan shift in public sentiment to become more critical of social media companies is gradually becoming a real risk, potentially affecting user growth. Based solely on Facebook, Twitter, Pinterest, and Snapchat, social media companies do not account for a very significant share of the overall equity market (Chart II-25), suggesting that the impact of a negative shift in sentiment toward social media companies would not be an overly significant event for equity investors in general. Chart II-25 highlights that the share of social media companies as a percent of the broad tech sector rises if Google is included; YouTube accounts for less than 15% of Google’s total advertising revenue, however, suggesting modest additional exposure beyond the solid line in Chart II-25. Still, investors with concentrated positions in social media stocks should be aware of the potential idiosyncratic risks facing social media companies as a result of the public’s impression of the impact of social media on society. If social media companies come to be widely associated with political gridlock, the polarization of society, and failed economic policies (as already appears to be the case), then the fundamental performance of these stocks is likely to be quite poor regardless of whether or not tech companies ultimately enjoy a relatively friendly regulatory environment under the Biden administration. Jonathan LaBerge, CFA Vice President The Bank Credit Analyst Footnotes 1 Grassroots Organizing in the Digital Age: Considering Values and Technology in Tea Party and Occupy Wall Street by Agarwal, Barthel, Rost, Borning, Bennett, and Johnson, Information, Communication & Society, 2014. 2 Please see The Bank Credit Analyst “July 2021,” dated June 24, 2021, available at bca.bcaresearch.com 3 “Are We Underestimating Short-Term Fiscal Multipliers?” IMF World Economic Outlook, October 2012 4 Please see US Political Strategy Outlook "Third Quarter Outlook 2021: Game Time," dated June 30, 2021, available at usps.bcaresearch.com 5 “Unfavorable Views of China Reach Historic Highs in Many Countries,” PEW Research Center, October 2020.
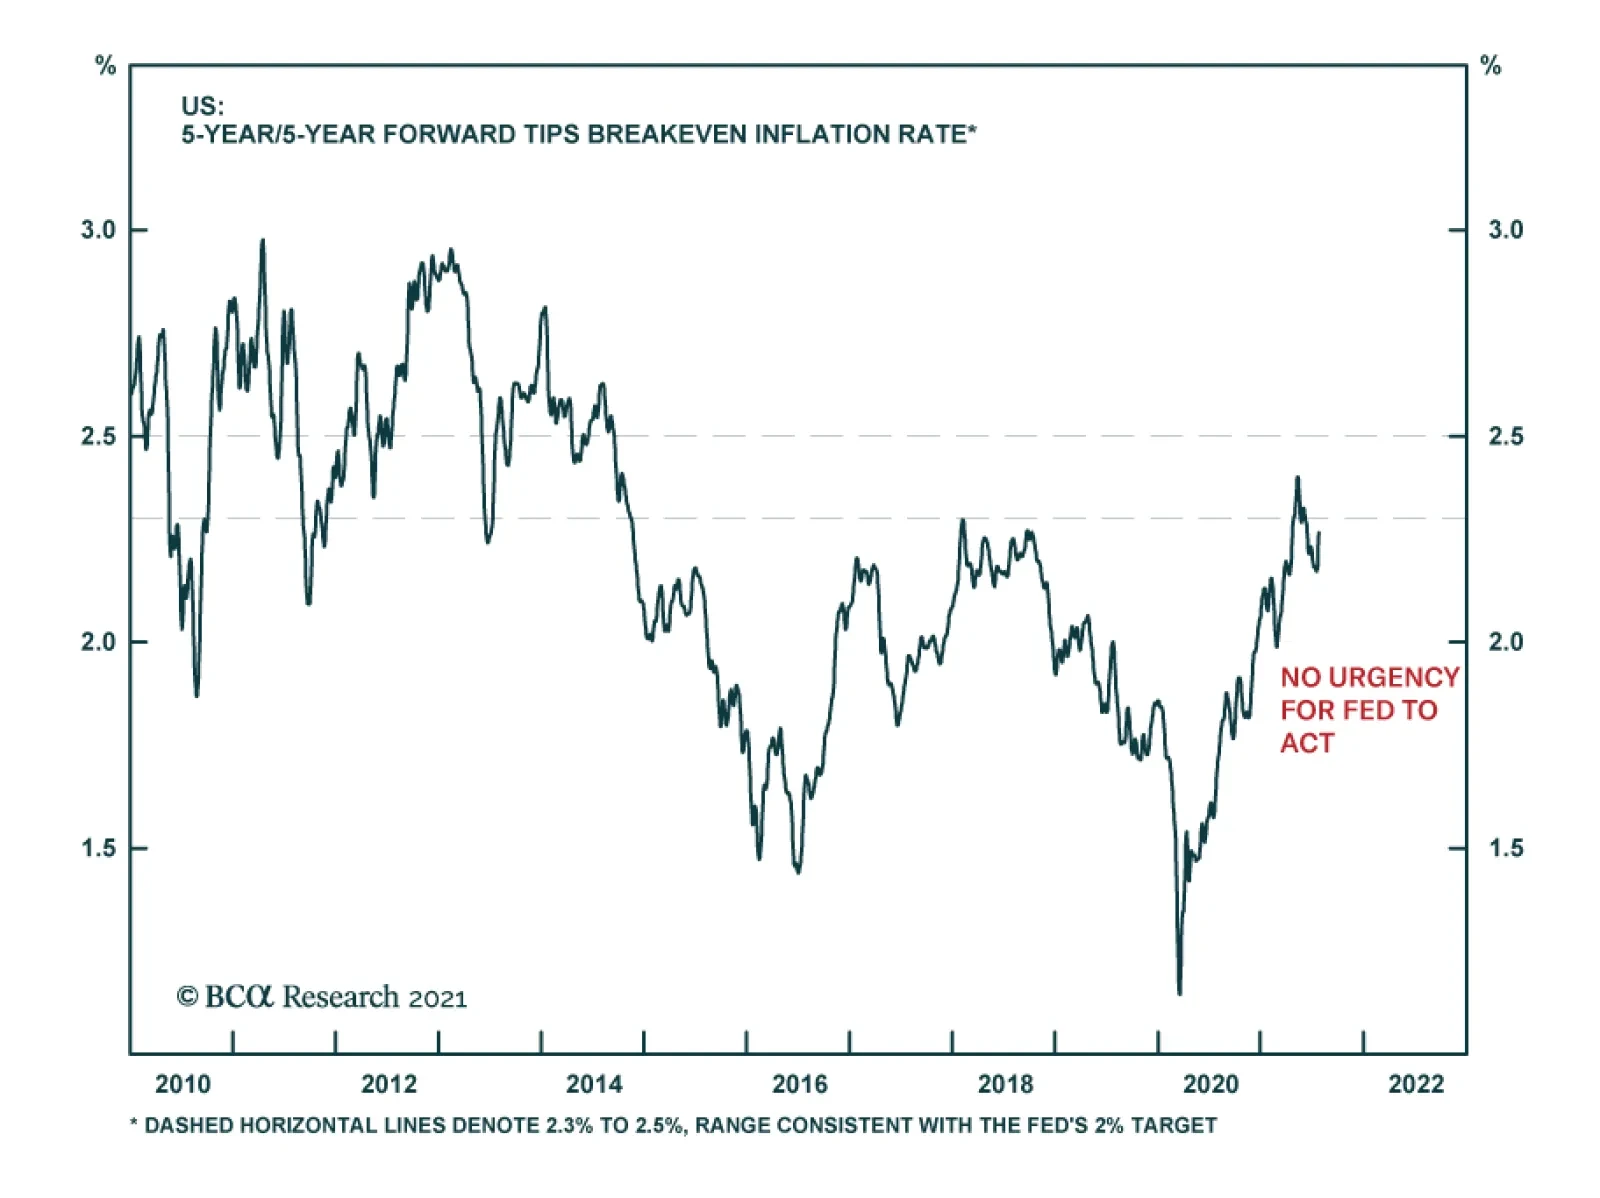
The US Federal Reserve has a test for when it will be appropriate to start tapering its asset purchases. It wants to see “substantial further progress” toward its maximum employment and price stability goals. Yesterday’s FOMC statement revealed that “progress…
Highlights China’s broad equity market performance since the PBoC cut its reserve requirement ratio (RRR) is consistent with our view. While the central bank’s policy tone remains dovish, a single reduction in the RRR rate has a limited impact on the economy. Divergent sector performance points to an ongoing pressure for structural reforms, ranging from traditional economic pillars to some of the new economy sectors. The bond market is betting on more rate cuts. While we expect more monetary policy easing later this year, the bond market may be ahead of itself and vulnerable to a near-term reassessment of policy and growth. Stay underweight Chinese stocks until sure signs of policy easing emerge. Feature Chart 1Overexcited Bond buyers, Unimpressed Equity Investors
Messages From The Market
Messages From The Market
China’s bond markets rallied in the two weeks following the PBoC’s 50bps reduction in the RRR. The A-share market, on the other hand, moved sideways until the big selloff earlier this week (Chart 1). Chinese policymakers’ continued crackdown on internet companies forced offshore Chinese equities to drop by 13% so far in July. As we previously highlighted, a single RRR cut, at the most, represents a continuation in the central bank’s dovish policy stance.Meanwhile, China continues to push for structural reforms and shows no signs of easing industry regulations. In this week's report, we review the response of investors to the RRR cut and recent policy moves, both at the broad market and sector levels. We expect that China’s macro policy measures will eventually become more reflationary to shore up domestic demand next year. However, to change our underweight stance on Chinese stocks, we would need more evidence before concluding that policies on the macro level have eased enough and will lead to a cyclical uptrend in the country’s economy. While Chinese policymakers are unlikely to lift the existing sector regulations anytime soon, the strength in policy tightening may start to moderate in the next 12 months given that regulators’ ultimate goal is to promote domestic innovation and productivity. Chinese equities, particularly the ones in the offshore market, have underperformed global stocks for most of this year. We think a bottom in Chinese stocks’ relative performance may be near, however, we recommend investors stay the course for now. Unimpressed Equity Investors The performance in both China’s onshore and offshore equity markets suggests market participants agree with our assessment, that a single reduction in RRR does not signal the beginning of broad-based reflationary efforts by Chinese authorities. Moreover, the divergence in sector performance continues pointing to a policy pivoting away from the traditional pillars in the economy. Charts 2A and 2B present the relative performance of Chinese investable and onshore stocks versus the emerging market (EM) and global benchmarks, both in USD and rebased to 100 on the day of the RRR cut announcement. The initial reaction to the announcement was modestly positive, with Chinese equities gaining in relative terms versus their global peers. However, the small gains disappeared less than a week after the RRR’s trim, reflecting investors’ lack of confidence in the stimulative effects from a one-off cut. Chart 2AA Lackluster Offshore Equity Market...
A Lackluster Offshore Equity Market...
A Lackluster Offshore Equity Market...
Chart 2B...The Pickup In The Onshore Market Did Not Last Long Either
...The Pickup In The Onshore Market Did Not Last Long Either
...The Pickup In The Onshore Market Did Not Last Long Either
Chart 3The Real-Economy Sectors In The Offshore Market Also Underperformed
The Real-Economy Sectors In The Offshore Market Also Underperformed
The Real-Economy Sectors In The Offshore Market Also Underperformed
China’s heightened regulatory oversight on its internet companies, including the recent clampdown on private tutoring firms, has further dampened the appetite for Chinese offshore stocks, which are concentrated in internet titans. Nonetheless, the real economy sectors in the MSCI China Index also underperformed their global peers, indicating that investors’ risk-off sentiment towards Chinese stocks is widespread (Chart 3). Furthermore, divergent sector performance is consistent with our view that it is too early to call a loosening in China’s macro policy. In addition to a continued underperformance in real estate sector stocks, domestic infrastructure stocks also failed to break above their technical resistance relative to the overall domestic market and global stocks (Charts 4A and 4B). The market signals suggest that a significant ramp up in infrastructure spending in China is not imminent. Presumably, any meaningful improvement in the country’s fiscal spending would cause the earnings outlook for domestic infrastructure stocks to brighten considerably relative to the domestic market and the global average. Chart 4AProperty Stocks On A Free Fall Due To Tightened Regulations
Property Stocks On A Free Fall Due To Tightened Regulations
Property Stocks On A Free Fall Due To Tightened Regulations
Chart 4BNo Sign Of Improvement In Infrastructure Stocks
No Sign Of Improvement In Infrastructure Stocks
No Sign Of Improvement In Infrastructure Stocks
Interestingly, the BCA China Play Index, which tracks a portfolio of assets sensitive to the outlook for Chinese growth and reflation,1 has soared since the second quarter of last year. It presents nearly a mirror image of onshore Chinese infrastructure stocks (Chart 5). Such a stark contrast in the performance between the BCA China Play Index and onshore Chinese infrastructure stocks occurred in the past and we are inclined to trust the market signals from the latter rather than the former. The Chinese Li-Keqiang Index (LKI) of industrial activity leads the BCA China Play Index by about two to three months (Chart 6). The LKI declined non-trivially in the face of a sharp reduction in credit growth and pressing structural reforms in 1H21, suggesting that risks to the China Play Index will be to the downside in the coming months. Chart 5Which One Is Sending The Right Signal?
Which One Is Sending The Right Signal?
Which One Is Sending The Right Signal?
Chart 6China's Li Keqiang Index May Be Flashing Amber
China's Li Keqiang Index May Be Flashing Amber
China's Li Keqiang Index May Be Flashing Amber
On the surface, the divergence between the performance in China’s blue-chip stocks and ChiNext, a NASDAQ-style subsidiary of the Shenzhen Stock Exchange, seems consistent with falling financing costs this year (Chart 7). ChiNext is tech-heavy and sensitive to changes in interest rates. However, ChiNext’s outperformance relative to the aggregate A-share market also reflects China’s policy direction, which is a strategic push for technology self-sufficiency and a significant increase in high-tech infrastructure investment (Chart 8). Chart 7Chinese 'High-Tech' Stocks Benefit From Lower Rates...
Chinese 'High-Tech' Stocks Benefit From Lower Rates...
Chinese 'High-Tech' Stocks Benefit From Lower Rates...
Chart 8...But Policy Supports Have Been A Non-Trivial Factor
...But Policy Supports Have Been A Non-Trivial Factor
...But Policy Supports Have Been A Non-Trivial Factor
Bottom Line: Signals from China’s equities, both in general and on a per-sector basis, suggest that investors are not betting on a meaningful easing in the country’s policy. Making Sense Of The Bond Market The RRR cut exacerbated China’s nascent bond market rally as expectations continue to climb that additional policy easing will be forthcoming. While we agree with the bond market that China’s monetary policy will eventually turn more accommodative, the timing and speed of easing may disappoint investors. The depth in the decline of sovereign bond yields in recent weeks makes the fixed-income market vulnerable to repricing in the coming months. After hitting a peak of 3.3% in November last year, China’s 10-year government bond yield has fluctuated on a downward trend. The rollover in yields coincided with a top in several key economic indicators, such as the PMI, credit impulse and the China Economic Surprise Index (ESI) (Chart 9). Falling demand for bank credit relative to liquidity supply - indicating corporates' lower propensity to invest in the real economy - further depressed bond yields (Chart 10). Chart 9Yields Fell When The Economy Peaked
Yields Fell When The Economy Peaked
Yields Fell When The Economy Peaked
Chart 10Lower Propensity To Invest In Real Economy Also Helped Pushing Down Bond Yields
Lower Propensity To Invest In Real Economy Also Helped Pushing Down Bond Yields
Lower Propensity To Invest In Real Economy Also Helped Pushing Down Bond Yields
Although the momentum in China’s economic growth has peaked, the magnitude of the decline in the 10-year bond yield has likely overstated the degree of the economic slowdown. As illustrated in Chart 9, the pace of the decline in the 10-year bond yield in the past three months was as rapid as during the height of previous economic downturns. Those economic slowdowns involved more than a single RRR cut, including the ones that coincided with the US-China trade war in 2018 and those triggered by a prolonged deflationary cycle in 2015/16. Chart 11Is The Bond Market Ahead Of Itself?
Is The Bond Market Ahead Of Itself?
Is The Bond Market Ahead Of Itself?
From a technical perspective, the 10-year government yield has become stretched versus the underlying trend in yields as defined by the 200-day moving average (Chart 11). The steep decline in the long-date bond yield suggests that the market has priced in more potential rate cuts as well as weaknesses in China’s economy. China’s ESI, which is a gauge of market psychology, has ticked up of late. If authorities at the Politburo meeting later this month show any reluctance in further reducing rates, then a reassessment of policy will likely push up bond yields in the coming weeks. COVID-19 remains a risk to this view, however, given China’s zero tolerance towards domestic infection cases. Even localized outbreaks will probably cause sporadic disruptions in economic activity and dampen optimism, helping to push sovereign yields even lower. Bottom Line: We remain cautious about the sustainability of the recent bond market rally, barring large disruptions caused by the COVID-19 Delta variant. The market lacks catalysts for Chinese government bond yields to trigger significant moves in either direction. Moreover, the plummet in yields in the past few weeks makes bonds vulnerable to a price correction in the near term. Investment Conclusions While the bond market is betting on slower economic growth and more rate cuts, the timing of further policy easing is in question and the magnitude may be smaller than the market has already priced in. Meanwhile, China’s onshore and offshore market investors remain cautious, particularly given China’s renewed focus on structural reforms. In light of these aspects, we would not recommend that investors with a time horizon of less than three months take a long position in Chinese stocks, either in absolute terms or relative to the global benchmark. However, on a cyclical (i.e. 6-12 month) time frame, we could turn more constructive on Chinese stocks if the authorities show more willingness to respond to slowing economic activity by easing policies. Jing Sima China Strategist jings@bcaresearch.com Footnotes 1The assets included in the BCA China Play Index are: Chinese iron ore prices in USD; Swedish industrial equities in USD; Brazilian equities in USD; AUD/JPY; and EM high-yield bonds denominated in USD. Market/Sector Recommendations Cyclical Investment Stance
Highlights Portfolio Duration: The decline in US bond yields is overdone. We anticipate that strong US employment data will catalyze a jump in bond yields this fall and that the 10-year US Treasury yield will reach a range of 2% - 2.25% by the time that the Fed is ready to lift rates, likely by the end of 2022. Maintain below-benchmark duration in bond portfolios. US Yield Curve: Investors should position for a rebound in bond yields but not a reversal of recent US Treasury curve flattening. In fact, we advocate owning 2/10 flatteners on the US Treasury curve as we see ample room for further curve flattening as Fed rate hikes approach in late-2022. ECB: The ECB’s new forward interest rate guidance has moved it that much closer to the Fed’s ultra-accommodative stance. This reinforces the defensive nature of the European bond market. Investors should overweight European bonds within global fixed income portfolios with a particular emphasis on peripheral European bond markets like Italy and Spain. Feature Chart 1Can The Bond Rally Continue?
Can The Bond Rally Continue?
Can The Bond Rally Continue?
The bond rally continues to rip. The selloff that started last August when Jay Powell officially announced the Federal Reserve’s adoption of an Average Inflation Target ended on March 31st 2021. Since then, the 10-year US Treasury yield has retraced from 1.74% to 1.29% and the Bloomberg Barclays US Treasury index has clawed back 285 bps of excess return versus cash, partially offsetting the 465 bps that were lost between August 2020 and March 2021 (Chart 1). The US Bond Strategy Weekly Report from two weeks ago and last week’s Global Fixed Income Strategy Weekly Report both discuss the reasons for recent bond market strength.1 We won’t re-hash those arguments this week except to reiterate our conclusion that the decline in US bond yields is overdone. We anticipate that strong US employment data will catalyze a jump in bond yields this fall and that the 10-year US Treasury yield will reach a range of 2% - 2.25% by the time that the Fed is ready to lift rates, likely by the end of 2022. The first section of this week’s report looks at whether correlations between different asset classes have held up during the recent bond rally, with a focus on whether those relationships give us any information about the near-term direction for bond yields. The second section considers the outlook for the slope of the US Treasury curve and the third section discusses the recently released results of the European Central Bank’s strategy review. Cross-Market Correlations During The Bond Rally The bond rally has been just as intense as the prior sell-off. The US Treasury index has outperformed a position in cash by an annualized 9% since March 31st, matching the annualized losses of 9% seen between August 2020 and March 2021 (Chart 2). An important question to answer is whether this bond market performance is consistent with other asset classes. If it is, then it may suggest that the economy is experiencing a deflationary episode and that bond yields have further downside. If it isn’t, then it is more likely that the drop in bond yields will be temporary. Chart 2Bonds Versus Credit And Equities
Bonds Versus Credit And Equities
Bonds Versus Credit And Equities
Bonds Versus Equities And Corporate Credit Chart 3Equity Sector Performance Consistent With Yields
Equity Sector Performance Consistent With Yields
Equity Sector Performance Consistent With Yields
Looking first at corporate bonds, we find that – consistent with stronger Treasury performance – excess US corporate bond returns have slowed since March 31st. Baa-rated corporates have been outperforming at an annualized rate of 3% since March 31st compared to an annualized rate of 12% between August 2020 and March 2021 (Chart 2, panel 2). Equities, on the other hand, have maintained their strong performance. The S&P 500 returned an annualized 30% between August 2020 and March 2021 and has returned an even greater 42% (annualized) since the end of March (Chart 2, panel 3). Extremely tight spreads are the most likely explanation for lower corporate bond excess returns. Meanwhile, the fact that equities continue to perform well is an indication that the drop in bond yields may be overdone. Interestingly, while overall equity returns haven’t dropped in line with bond yields, the relative performance of equity sectors has been totally consistent with the movement in yields (Chart 3). Cyclical equity sectors (Industrials, Energy and Materials) have underperformed defensive equity sectors (Healthcare, Telecoms, Consumer Staples and Utilities) and Banks have underperformed the overall index. The correlation between long-maturity real Treasury yields and the relative performance of value and growth stocks has also held up, with growth stocks outperforming since the end of March (Chart 3, bottom panel). Bonds Versus Commodities Chart 4Commodities And Bonds Have Diverged
Commodities And Bonds Have Diverged
Commodities And Bonds Have Diverged
We see the biggest divergence in relative performance between bond yields and commodities. Historically, the ratio between the CRB Raw Industrials commodity price index and Gold is tightly correlated with the 10-year US Treasury yield. However, the CRB/Gold ratio has increased since the end of March while bond yields have fallen (Chart 4). In our view, this is the strongest piece of evidence suggesting that bond yields have overshot to the downside. Bonds Versus Currencies Chart 5Bonds Versus Currencies
Bonds Versus Currencies
Bonds Versus Currencies
Finally, we observe that the US dollar has strengthened as bond yields have dropped. This is not that unusual. There are other periods when significant declines in US bond yields have coincided with dollar strength, 2019 and 2014/15 immediately come to mind (Chart 5). The common theme of those prior episodes is that the global economy was experiencing a deflationary shock. Commodity prices also fell during those periods and Emerging Market (EM) currencies depreciated versus the dollar. However, so far this year, EM currencies have held firm versus the dollar (Chart 5, bottom panel) and commodity prices continue to rise. On balance, financial markets don’t appear to be pricing-in a deflationary economic shock. In summary, since US Treasury yields peaked on March 31st, we have observed a sector rotation within US equities, but overall stock market performance has been strong. Corporate bonds continue to outperform Treasuries, though gains are limited by tight valuations. Commodity prices have held up and while the US dollar has firmed, dollar strength has not bled into EM currency weakness. All in all, we don’t view financial market performance as consistent with a deflationary economic episode. This suggests that bond yields are an outlier within the financial landscape and that the recent drop in yields won’t persist. A Quick Word On Sentiment And Positioning Chart 6A Rebound In Yields May Require A Shift In Sentiment
A Rebound In Yields May Require A Shift In Sentiment
A Rebound In Yields May Require A Shift In Sentiment
One possible reason why bond performance has been inconsistent with some other markets is that there had simply been too much consensus around the “bond-bearish trade”. It’s certainly true that portfolio managers have been running large net-short positions and that the MarketVane survey of bond bullish sentiment is much less bullish than it was last year (Chart 6). We suspect that we may need to see bond market positioning and sentiment get more bullish before yields move meaningfully higher. Chart 6 shows that major troughs in the 30-year US Treasury yield often occur when portfolio manager positioning is “net long” bonds and when bond bullish sentiment is significantly higher than current levels. For this reason, we don’t anticipate an immediate rebound in bond yields. Rather, we suspect that yields will remain near current levels for the next month or two before strong employment data in the fall sets off the next phase of bearish bond action. Position For A Rebound In Bond Yields, But Don’t Expect Much Curve Steepening Chart 7The 5-Year/5-Year Yield Remains Close To Target
The 5-Year/5-Year Yield Remains Close To Target
The 5-Year/5-Year Yield Remains Close To Target
We see bond yields re-gaining their March 2021 highs, and then some, on a 6-12 month investment horizon. However, we don’t think this rebound in yields will coincide with a significant re-steepening of the US Treasury curve. For context, the 2/10 US Treasury slope peaked at 159 bps near the end of March. It is currently 51 bps lower, at 108 bps. We can categorize periods of yield curve steepening as falling into two categories. Bull-steepening: The curve steepens as yields fall. This tends to occur when the Fed is cutting interest rates. Bear-steepening: The curve steepens as yields rise. We can identify these periods as being when the 5-year/5-year forward Treasury yield rises from low levels toward its fair value range. Since 2012, we can identify a fair value range for the 5-year/5-year forward US Treasury yield using survey estimates of the long-run neutral fed funds rate. At present, the fair value range from the New York Fed’s Survey of Primary Dealers is from 2.06% to 2.50%, with a median of 2.31%. The fair value range from the New York Fed’s Survey of Market Participants is from 1.75% to 2.50%, with a median of 2.00%. The 5-year/5-year forward US Treasury yield is currently 1.93% (Chart 7). We identify seven significant periods of 2/10 Treasury curve steepening since 2009 (Table 1). Six of those episodes were bear-steepening episodes that coincided with an increase in the 5-year/5-year yield, the other was a bull-steepening episode that coincided with Fed rate cuts in 2019/20. If we assume that our fair value ranges provide a reasonable target for how high the 5-year/5-year forward US Treasury yield can rise during the next bear-steepening move, it means that – at most – we could see an increase of 57 bps in the 5-year/5-year yield as it moves all the way up to the 2.50% top-end of our target ranges. A linear regression of changes in the 2/10 slope versus changes in the 5-year/5-year forward yield during the six bear-steepening episodes we identified suggests that a 57 bps increase in the 5-year/5-year yield would lead to 12 bps of 2/10 curve steepening (Chart 8). In fact, we can see in both Table 1 and Chart 8 that it would take about 100 bps of upside in the 5-year/5-year yield to bring the 2/10 slope back to its March highs. This is extremely unlikely. Table 1Periods Of US Treasury Curve Steepening In The Zero-Lower-Bound Era
A Bump On The Road To Recovery
A Bump On The Road To Recovery
Chart 8Bear-Steepening Episodes Since 2009
A Bump On The Road To Recovery
A Bump On The Road To Recovery
In fact, if the 5-year/5-year forward Treasury yield only rises back to the middle of its fair value range – somewhere between 2% and 2.31% - then our regression suggests that the yield curve slope will probably stay close to its current level. The bottom line is that while investors should position for a rebound in bond yields by keeping portfolio duration low, they should avoid US Treasury curve steepeners. In fact, we advocate owning 2/10 flatteners on the US Treasury curve as we see ample room for further curve flattening as Fed rate hikes approach in late-2022. The ECB’s New Guidance Solidifies The Defensive Nature Of European Bonds Last week, the European Central Bank (ECB) revised its forward rate guidance in light of its recently concluded Strategy Review.2 The ECB’s new rate guidance is as follows: In support of its symmetric two per cent inflation target and in line with its monetary policy strategy, the Governing Council expects the key ECB interest rates to remain at their present or lower levels until it sees inflation reaching two per cent well ahead of the end of its projection horizon and durably for the rest of the projection horizon, and it judges that realised progress in underlying inflation is sufficiently advanced to be consistent with inflation stabilising at two per cent over the medium term. This may also imply a transitory period in which inflation is moderately above target.3 This may sound familiar, and it should. Though not explicitly an Average Inflation Target, the ECB has moved a long way toward the Federal Reserve’s new dovish reaction function. Specifically, both the ECB and Federal Reserve now acknowledge that a temporary period of above-2% inflation will be tolerated, if not explicitly sought. Also, both central banks have linked the timing of the first rate increase to some form of outcome-based forward guidance. The Federal Reserve has explicitly said that it will not lift rates until inflation is above 2% and the economy has reached “maximum employment”. The ECB now claims that interest rates won’t rise until inflation is seen reaching 2% “well ahead of its projection horizon”, a criterion that Christine Lagarde described as having an element of outcome-based guidance.4 The ECB’s new forward guidance may not be as explicitly dovish as the Fed’s. The ECB has no “maximum employment” target and its inflation trigger for lifting rates still relies on the Governing Council’s forecasts. But for investors, the big signal is that the ECB has recognized that the risk of tightening policy prematurely is greater than the risk of remaining on hold for too long. This gives us even more confidence that there will be no ECB tightening on the horizon, and we should continue to view European bond markets as being highly defensive. This is hardly news. European bond markets performed relatively well during the bearish bond episode that lasted from August 2020 to March 2021, they have then gained less than cyclical bond markets (like US and Canada) since March (Table 2). The ECB’s new reaction function ensures that this relationship will remain place for many years to come. Table 27-10 Year Government Bond Returns (In USD, %)
A Bump On The Road To Recovery
A Bump On The Road To Recovery
The new reaction function is also a boon for peripheral European bond markets (like Italy and Spain) where yields trade at a spread above German bunds. The ECB’s commitment to staying dovish will only reinforce the downward pressure on peripheral European bond spreads versus Germany (Chart 9). Chart 9Grab The Extra Spread In Spanish And Italian Bonds
Grab The Extra Spread In Spanish And Italian Bonds
Grab The Extra Spread In Spanish And Italian Bonds
The bottom line is that investors should continue to overweight European bonds within global fixed income portfolios, with a particular emphasis on peripheral European bond markets like Italy and Spain. The defensive nature of European bonds will protect investors from losses during the next move higher in global yields. Italian and Spanish bond markets may not perform quite as well during the next bond bear market as they did between August 2020 and March 2021, as spreads have already compressed a lot. But ultra-accommodative ECB policy will limit the amount of spread widening that can occur, making any additional spread worth grabbing. Ryan Swift US Bond Strategist rswift@bcaresearch.com Footnotes 1 Please see US Bond Strategy Weekly Report, “Overreaction”, dated July 13, 2021 and Global Fixed Income Strategy Weekly Report, “The Message From Falling US Bond Yields”, dated July 21, 2021. 2 The results of the Strategy Review itself are discussed in Global Fixed Income Strategy Weekly Report, “The Reflationary Backdrop Is Still In Place”, dated July 14, 2021. 3 https://www.ecb.europa.eu/press/pr/date/2021/html/ecb.mp210722~48dc3b436b.en.html 4 https://www.ecb.europa.eu/press/pressconf/2021/html/ecb.is210722~13e7f5e795.en.html Recommended Portfolio Specification Other Recommendations
A Bump On The Road To Recovery
A Bump On The Road To Recovery
Treasury Index Returns
A Bump On The Road To Recovery
A Bump On The Road To Recovery
Spread Product Returns
A Bump On The Road To Recovery
A Bump On The Road To Recovery
Highlights The Delta variant will continue causing jitters but there is much greater evidence today than there was in early 2020 that humanity can curb the virus, both with vaccines and government stimulus. Delta jitters will reinforce the Fed’s dovishness and will, if anything, increase the odds that President Biden passes his mammoth spending package this fall. The very near term could easily see more volatility but by the end of the year the reflationary cast of global policy will have won the day. Tax hikes and rate hikes lurk beyond 2021. There is still no stabilization in US-China policy and the US and its allies have called out China for cyber aggression, signaling a new front of open competition. A cyber event is one of the leading contenders for the next negative shock to the global economy. Structural factors strongly support rising concerns among the global elite about cyber insecurity. Stick to this year’s key themes and views: long gold, long value over growth, long international stocks, long Mexico, long aerospace and defense, and short emerging market “strongmen” regimes. Feature Global equities sank and rose over the past week as investors struggled with “peak growth” in the US and China, the prospect of monetary policy normalization, and other risks on the horizon, including immediate concerns over the Delta variant of COVID-19. The rapid rebound, including for cyclicals like European stocks, suggested that investors are still buying the dip given a very supportive macro and policy backdrop (Chart 1). The BCA House View consists of accommodative policy, economic recovery, a weakening dollar, and the outperformance of cyclical risk assets. We largely agree, with the caveat that there will be “No Return To Normalcy” in the geopolitical realm. Meaning that over the medium and long term the US dollar will remain firmer than expected and cyclical economies and sectors will face headwinds. Chart 1Equity Market Hits Wall Of Worry
Equity Market Hits Wall Of Worry
Equity Market Hits Wall Of Worry
The pandemic will have unforeseen consequences, such as social unrest and regime failures, while China’s secular slowdown and the Great Power competition between the US and its rivals will intensify. Not only is China slowing but also President Joe Biden has been confirmed as a China hawk, coopting President Trump’s aggressive stance and courting US allies to pile the pressure on Beijing. For most of this year the “normalcy” narrative has prevailed. Now investors are becoming fearful of the “abnormalcy” narrative. The US dollar has surprised its doubters on the basis of relative growth and interest rate differentials (Chart 2). Chart 2Dollar Remains Firm, Reflation Indicator Abates
Dollar Remains Firm, Reflation Indicator Abates
Dollar Remains Firm, Reflation Indicator Abates
Over the next six months, the key point is that until these geopolitical risks boil over and explode, they reinforce the bullish macro view, since government spending will surge to address national challenges. The rich democracies have awoken to the threat posed by malaise at home and autocracy abroad. They have reactivated fiscal policy to rebuild their states and expand the social safety net. They are increasing investments in infrastructure, renewables, and defense. This trend is especially positive for US allied economies, global manufacturers ex-China, commodity prices, and commodity producing emerging markets, at least until the next shock erupts. We discuss the risk of a cyber shock as well as the points above in this report. Policy Responses To The Delta Variant The Delta variant began in India and has now swept the world. So far the variants respond to COVID vaccines, which are being rolled out globally. National and local political leaders will promote vaccination campaigns first – only if hospital systems are clogged will they resort to social restrictions. New infections have risen much faster than hospitalizations and deaths, although the latter are lagging indicators and will eventually follow cases (Chart 3). But financial markets will largely look past the scare, as they looked past the various waves of the original virus over the past 15 months. Today investors have greater evidence of humanity’s ability to curb the virus and can expect government spending to tide over the economy if new restrictions are necessary. New social restrictions should not be ruled out. They are not politically impossible. Public opinion in the developed countries shows that about 77% of people believe restrictions were about right or should have been tighter, while only 23% believe there should have been fewer restrictions (Chart 4). About 40% of Germans oppose the lifting of restrictions even for the vaccinated! Chart 3Delta Variant: A Limited Risk Unless Hospitals Clog
Delta Variant: A Limited Risk Unless Hospitals Clog
Delta Variant: A Limited Risk Unless Hospitals Clog
Chart 4ANew Lockdowns Not Impossible
Stay The Course (But Gird For Cyber War)
Stay The Course (But Gird For Cyber War)
Chart 4BNew Lockdowns Not Impossible
Stay The Course (But Gird For Cyber War)
Stay The Course (But Gird For Cyber War)
Any financial or economic distress from virus variants will reinforce ultra-accommodative monetary policy. The European Central Bank adopted a symmetric inflation target of 2% as it completed its strategic review, up from a previous goal which simply aimed at inflation just under 2%. It is likely to expand rather than taper asset purchases (Chart 5). At the Fed, the balance of power between hawks and doves on the Federal Open Market Committee reflects the political and geopolitical trends of the day. In the wake of the Great Recession, the doves overwhelmed the hawks (Chart 6). The institution has fully transitioned today – it now aims to generate an inflation overshoot – and it will not jeopardize its new average inflation targeting regime by tightening policy too soon this year or next. Chart 5Central Banks Will Delay Normalization If COVID Crisis Persists
Central Banks Will Delay Normalization If COVID Crisis Persists
Central Banks Will Delay Normalization If COVID Crisis Persists
Chart 6Doves Firmly In Ascendancy At Federal Reserve
Stay The Course (But Gird For Cyber War)
Stay The Course (But Gird For Cyber War)
The Delta variant makes it more likely that governments will increase fiscal support. The European Union’s Recovery Fund has a modest impact but the EU Commission is not patrolling budget deficits anymore, in the event that new social restrictions set back the recovery. The Democratic Party will pass President Biden’s $3.5-$4.1 trillion American Jobs and Families Plan through Congress by Christmas (with a net deficit increase of $1.3-$2.5 trillion over eight years). Support rates among independents and Democrats suggest Biden will come up with the votes (Chart 7). A renewed sense of crisis will compel any straggling senators. Chart 7ADelta Variant Makes Biden Stimulus Even More Likely To Pass
Stay The Course (But Gird For Cyber War)
Stay The Course (But Gird For Cyber War)
Chart 7BDelta Variant Makes Biden Stimulus Even More Likely To Pass
Stay The Course (But Gird For Cyber War)
Stay The Course (But Gird For Cyber War)
Markets will cheer more government spending as they have done throughout the vast surge in budget deficits across the world, not least in the developed markets, where austerity stunted the recovery in the wake of the Great Recession (Chart 8). Beyond Delta jitters and reactive stimulus, there are clouds forming on the horizon over the medium and long term. Budget deficits will start contracting, central banks will start hiking rates, and taxes will go up (and not only in the US). Geopolitical risks that are suppressed today will erupt later. Bottom Line: The very near term could easily see more volatility but by the end of the year the reflationary cast of global economic policy will have won the day. The bigger problems come clearly into review after the ink dries on the last installment of the great Biden budget blowout. Chart 8Market Will Cheer Another Round Of Government Spending
Market Will Cheer Another Round Of Government Spending
Market Will Cheer Another Round Of Government Spending
China Policy And Cyber War What might the next major negative shock be? A leading candidate is China, with its confluence of internal and external risks. China’s policymakers opened the floodgates of credit-and-fiscal stimulus to combat the global pandemic in 2020. They quickly shifted to tightening policy to prevent destabilizing asset bubbles. Now they are easing again. Stimulus and growth have both peaked. Authorities are on the verge of overtightening policy but tactical shifts in economic policy often occur in July. Right on cue the State Council ordered across-the-board cuts to bank reserve requirements on July 9. The Politburo’s July meeting on economic policy will bring an even more important policy signal. The concrete impact of the RRR cut should not be overstated. China has been lowering RRRs since late 2011 as its broad money growth has continually declined. The trend is indicative of China’s secular slowdown. A new series of RRR cuts is often attended by a global equity selloff (Chart 9). Chart 9China Blinked - But One RRR Cut Will Not Prevent A Global Selloff
China Blinked - But One RRR Cut Will Not Prevent A Global Selloff
China Blinked - But One RRR Cut Will Not Prevent A Global Selloff
Our China Investment Strategy highlights that policy remains restrictive in other areas. Local governments have been told not to borrow if they have hidden debts. Moreover the crackdown on China’s tech sector also continues apace. These regulatory crackdowns are characteristic of the Xi Jinping administration and can continue for a while as it further consolidates power in advance of the twentieth National Party Congress in fall 2022. The US-China conflict is getting worse. The Biden administration took several punitive actions over the past month. It warned businesses against investing in Hong Kong and Xinjiang. It rejected a restart of the strategic and economic dialogue. While a bilateral summit between Biden and Xi Jinping is possible on October 30-31, it is not yet scheduled and would only temporarily improve relations. One of Biden’s more significant recent moves was to orchestrate a joint statement with allies condemning China for aggressive behavior in cyber space.1 A massive cyber attack should be high up on any investor’s list of “gray rhino” events (high-probability, high-impact events). The world has suffered large shocks from global terrorism, financial crisis, and pandemic. Lightning rarely strikes the same place twice. Of course, nobody knows what will cause the next upset. But a devastating cyber event has been underrated in the investment community and that is changing (Table 1). Fed Chair Powell, asked by a reporter what was the chief risk to the global financial system, said “cyber risk.” To quote in full: So you would worry about a cyber event. That's something that many, many government agencies, including the Fed and all large private businesses and all large private financial companies in particular, monitor very carefully, invest heavily in. And that's really where the risk I would say is now, rather than something that looked like the global financial crisis.2 Table 1Cyber Event Underrated In Consensus View Of Global Risks
Stay The Course (But Gird For Cyber War)
Stay The Course (But Gird For Cyber War)
Here are six structural reasons that cyber risk will continue to escalate: Cyber space is one of the truly ungoverned spaces. The US is the preponderant power in cyber space, as elsewhere, but there is no regular order or code of conduct. The US cyber bureaucracy is decentralized and uncoordinated while its opponents are centrally commanded, aggressive, and sophisticated. Great power competition is escalating. The US is struggling with China, Russia, and Iran and all sides seek to intimidate enemies and gain allies. Cyber capabilities enhance essential tasks like spying, sabotage, and information warfare. The tech race is intensifying, with companies and governments investing heavily in innovation and industry, while US export controls exacerbate China’s frantic efforts to obtain advanced tech by any means. The pandemic boosted digital dependency across industry and commerce, creating a “perfect storm” for cyber attacks and hacking.3 The US and its allies are threatening to retaliate more actively against cyber attacks, which may initially lead to an increase in the total number of attacks. In addition, Israel will need to sabotage Iran’s nuclear program if it is not halted by diplomacy. The US is polarized and war-weary yet claiming greater commitment to its allies, a paradox that encourages foreign rivals to use cyber tools to foment US divisions; strike at regional opponents that lack US security guarantees; and test the US commitment to its allies. The current US-Russia negotiations toward a truce against cyber attacks on critical infrastructure are the sole example of a potential structural improvement. The US and Russia could conceivably lay down some rules of the road in cyber space. There may be a basis for an agreement in that already this year the US refrained from blocking the Nordstream II pipeline with Germany while Russia refrained from re-invading Ukraine. However, a Russo-American truce would not dispel the risk of a global cyber surprise. It could even increase the odds. Russia this year alone showed with the Colonial Pipeline hack and the JBS meat-packing hack that its proxies can disrupt critical US infrastructure. It would make sense to agree to a truce so that the US does not demonstrate the same capability against Russia. Even without a truce, Russia does not benefit from provoking massive US cyber attacks. The US is the world’s leading cyber power and has pledged that it will retaliate. Rather Russia will concentrate its efforts closer to home: suppressing dissent, intimidating the former Soviet Union, and testing the US’s willingness to defend its allies. It would be useful for Russia to use cyber attacks to undermine NATO unity and demonstrate that the US is reluctant to defend NATO members’ critical infrastructure. Remember the cyber strike against Estonia in 2007. Hence huge shocks could still emerge in Europe or elsewhere even if the US and Russia make a ceasefire regarding their own critical infrastructure. The same can be said for China, Iran, and North Korea. Attacks in their neighborhood are even more likely than direct provocations against the United States now that the US is threatening graver consequences. Beijing is concentrating its cyber power on technological acquisition. But it will also try to intimidate its neighbors into neutrality and test America’s commitment to its allies. This applies to markets like Taiwan, South Korea, the Philippines, and Vietnam. Not all cyber attacks would cause a global shock but the danger of Biden’s emphasis on alliances and multilateralism is that the US will be tested and its commitments will expand. Local cyber attacks could escalate if the US believes it must prove its resolve. Bottom Line: Cyber firms’ share prices have risen since we made our contrarian buy call back in March. True, fundamentals are poor despite the strong geopolitical tailwind. The BCA Equity Analyzer shows that valuations, debt, liquidity, and return on equity have deteriorated relative to the global large cap equity universe (Chart 10). Still, as long as liquidity is ample and geopolitical risk is high we expect cyber firms’ share prices to keep grinding upward. Chart 10Cyber Stocks: Poor Fundamentals But Geopolitics A Secular Driver
Stay The Course (But Gird For Cyber War)
Stay The Course (But Gird For Cyber War)
Investment Takeaways We are sticking with our key themes and views: long gold; long value over growth; long DM-ex-US stocks such as FTSE100 (Chart 11) and European industrials; long US neighbors Mexico and Canada; long defense and cyber stocks; and short the assets of emerging market “strongman” regimes from China and Russia to Brazil, Turkey, and the Philippines. Taking several of our trade recommendations alongside the copper-to-gold ratio, a key measure of global reflation, there could be more near-term downside (Chart 12). Nevertheless these are strategic trades designed to bear rewards over 12 months and beyond. Mainland Chinese investors should book gains on long Chinese 10-year government bonds. We would not rule out a bigger bond rally later given China’s risks at home and abroad, but RRR cuts often lead to a selloff and the signal is that the socialist policy “put” remains in place. Book gains on long Italian / short Spanish equities. This tactical trade is now hitting the top of its range and will likely mean revert. We are still optimistic on European stocks and the euro as a whole and view the German election as a positive catalyst almost regardless of outcome. Chart 11Stay The Course: Long Value Over Growth
Stay The Course: Long Value Over Growth
Stay The Course: Long Value Over Growth
Matt Gertken Vice President Geopolitical Strategy mattg@bcaresearch.com Chart 12Stick To Cyclical Trades Over Near-Term Volatility
Stick To Cyclical Trades Over Near-Term Volatility
Stick To Cyclical Trades Over Near-Term Volatility
Footnotes 1 White House, “The United States, Joined by Allies and Partners, Attributes Malicious Cyber Activity and Irresponsible State Behavior to the People’s Republic of China,” July 19, 2021, whitehouse.gov. 2 “Jerome Powell: Full 2021 60 Minutes Interview Transcript,” CBS News, April 11, 2021, cbsnews.com. 3 Connor Fairman, “2020: Cybercrime’s Perfect Storm,” Council on Foreign Relations, January 20, 2021, cfr.org.