Policy
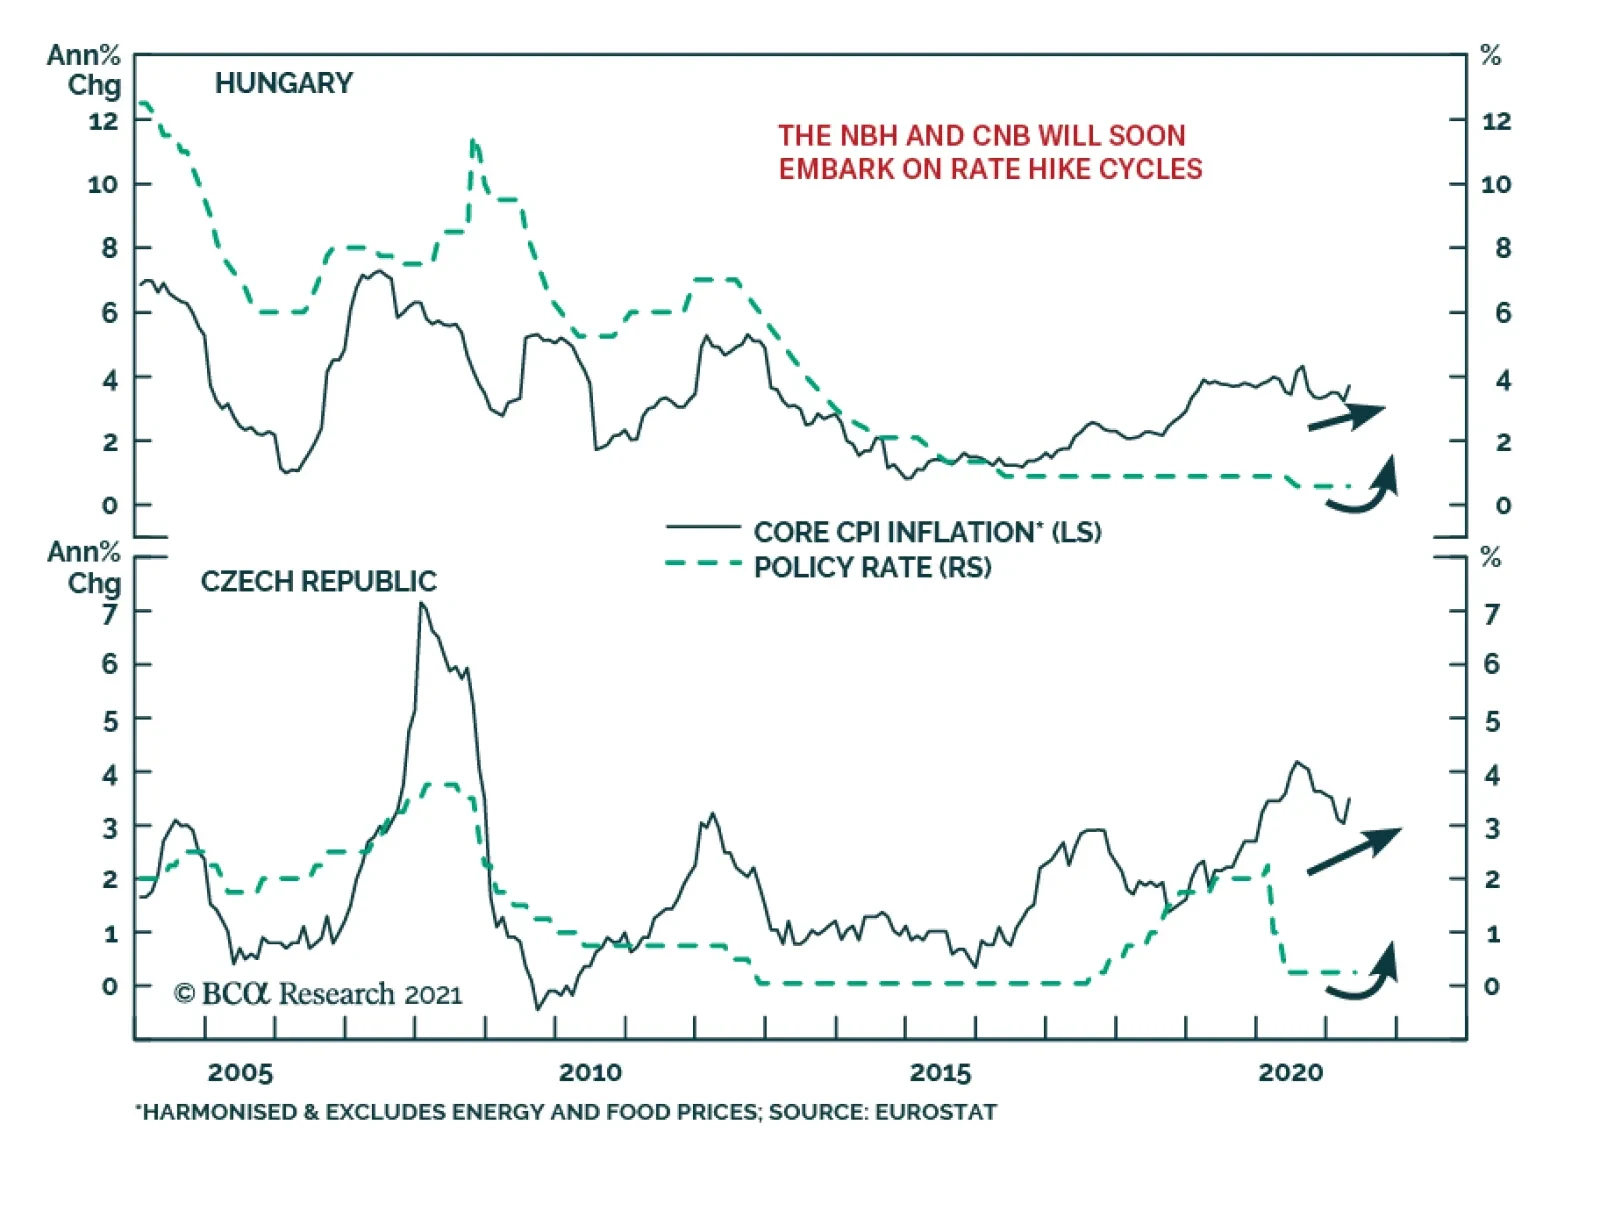
BCA Research’s Emerging Markets Strategy service concludes that the Czech koruna will outperform the Hungarian forint. Conditions for central bank rate hike cycles are in place in Hungary and the Czech Republic. Yet Czech authorities are following a more…

Highlights Political and corporate climate activism will increase the cost of developing the resources required to produce and deliver energy going forward – e.g., oil and gas wells; pipelines; copper mines, and refineries. Over the short run, the fastest way for investor-owned companies (IOCs) to address accelerated reductions in CO2 emissions imposed by courts and boards is to walk away from the assets producing them, which could be disruptive over the medium term. Longer term, state-owned companies (SOCs) not facing the constraints of IOCs likely will be required to provide an increasing share of the resources needed to produce and distribute energy. The real difficulty will come in the medium term. Capex for critical metals like copper languishes, just as the call on these metals steadily increases over the next 30 years (Chart of the Week). The evolution to a low-carbon future has not been thought through at the global policy level. A real strategy must address underinvestment in base metals and incentivize the development of technology via a carbon tax – not emissions trading schemes – so firms can innovate to avoid it. We remain long energy and metals exposures.1 Feature And you may ask yourself, "Well … how did I get here?" David Byrne, Once In A Lifetime Energy markets – broadly defined – are radically transforming from week to week. The latest iteration of these markets' evolution is catalyzed by climate activists, who are finding increasing success in court and on corporate boards – sometimes backed by major institutional investors – and forcing oil and gas producers to accelerate CO2 emission-reduction programs.2 Climate activists' arguments are finding increasing purchase because they have merit: Years of stiff-arming investors seeking clarity on the oil and gas producers' decarbonization agendas, coupled with a pronounced failure to provide returns in excess of their cost of capital, have given activists all of the ammo needed to argue their points. Chart of the WeekCall On Metals For Energy Will Increase
A Perfect Energy Storm On The Way
A Perfect Energy Storm On The Way
This activism is not limited to the courts or boardrooms. Voters in democratic societies with contested elections also are seeking redress for failures of their governments to effectively channel mineral wealth back into society on an equitable basis, and to protect their environments and the habitats of indigenous populations. This voter activism is especially apparent in Chile and Peru, where elections and constitutional conventions likely will result in higher taxes and royalties on metals IOCs operating in these states, which will increase production costs and ultimately be passed on to consumers.3 These states account for ~ 40% of world copper output. IOCs Walk Away Earlier this week, Exxon walked away from an early-stage offshore oil development project in Ghana.4 This followed the unfavorable court rulings and boardroom setbacks experienced by Royal Dutch Shell, Chevron and Exxon recently (referenced in fn. 2). While the company had no comment on its abrupt departure, its action shows how IOCs can exercise their option to put a project back to its host government, thus illustrating one of the most readily available alternatives for energy IOCs to meet court- or board-mandated CO2 emissions targets. If these investments qualify as write-offs, the burden will be borne by taxpayers. As climate activism increases, state-owned companies (SOCs) not facing the constraints of IOCs likely will be required to provide an increasing share of the resources – particularly oil and gas – needed to produce and distribute energy going forward. This is not an unalloyed benefit, as the SOCs still face stranded-asset risks, if they invest in longer-lived assets that are obviated by a successful renewables + grid buildout globally. That is a cost that will have to be compensated, when the SOCs work up their capex allocations. Still, if legal and investor activism significantly accelerates IOCs' capex reductions in oil and gas projects, the SOCs – particularly those in OPEC 2.0 – will be able to expand their position as the dominant supplier in the global oil market, and could perhaps increase their influence on price levels and forward-curve dynamics (Chart 2).5 Chart 2OPEC 2.0s Could Expand If Investor Activism Increases
OPEC 2.0s Could Expand If Investor Activism Increases
OPEC 2.0s Could Expand If Investor Activism Increases
Higher Call On Metals At present, there is a lot of talk about the need to invest in renewable electricity generation and the grid structure supporting it, but very little in the way of planning for this transition. Other than repeated assertions of its necessity, little is being said regarding how exactly this strategy will be executed given the magnitude of the supply increase in metals required. Nowhere is this more apparent than in the refined copper market, which has been in a physical deficit – i.e., production minus consumption is negative – for the last 6 years (Chart 3). Physical copper markets in China, which consumes more than 50% of refined output, remain extremely tight, as can be seen in the ongoing weakness of treating charges and refining charges (TC/RC) for the past year (Chart 4). These charges are inversely correlated to prices – when TC/RCs are low, it means there is surplus refining capacity for copper – unrefined metal is scarce, which drives down demand for these services. Chart 3Coppers Physical Deficit Likely Persist
Coppers Physical Deficit Likely Persist
Coppers Physical Deficit Likely Persist
Chart 4Chinas Refined Copper Supply Remains Tight
Chinas Refined Copper Supply Remains Tight
Chinas Refined Copper Supply Remains Tight
Theoretically, high prices will incentivize higher levels of production. However, after the last decade’s ill-timed investment in new mine discoveries and expansions, mining companies have become more wary with their investments, and are using earnings to pay dividends and reduce debt. This leads us to believe that mining companies will not invest in new mine discoveries but will use capital expenditure to expand brownfield projects to meet rising demand. In the last decade, as copper demand rose, capex for copper rose from 2010-2012, and fell from 2013-2016 (Chart 5). During this time, the copper ore grade was on a declining trend. This implies that the new copper brought online was being mined from lower-grade ore, due to the expansion of existing projects(Chart 6). Chart 5Copper Capex Growth Remains Weak
A Perfect Energy Storm On The Way
A Perfect Energy Storm On The Way
Chart 6Copper Ore-Quality Declines Persist Through Capex Cycle
A Perfect Energy Storm On The Way
A Perfect Energy Storm On The Way
Capex directed at keeping ore production above consumption will not be sufficient to avoid major depletions of ore supplies beginning in 2024, according to Wood Mackenzie. The consultancy foresees a cumulative deficit of ~ 16mm MT by 2040. Plugging this gap will require $325-$500 billion of investment in the copper mining sector.6 The Case For A Carbon Tax The low-carbon future remains something of a will-o'-the-wisp – seen off in the future but not really developed in the present. Most striking in discussions of the low-carbon transition is the assumption of resource availability – particularly bases metals –in, e.g., the IEA's Net Zero by 2050, A Roadmap for the Global Energy Sector, published last month. In the IEA's document, further investment in hydrocarbons is not required beyond 2025. The copper, aluminum, steel, etc., required to build the generation and supporting grid infrastructure will be available and callable as needed to build all the renewable generation the world requires. The document is agnostic between carbon trading and carbon taxes as a way to price carbon and incentivize the technology that would allow firms and households to avoid a direct cost on carbon. A real strategy must address the fact that most of the world will continue to rely on fossil fuels for decades, as development goals are pursued. Underinvestment in base metals and its implications for the buildout of generation and grids has to be a priority if these assets are to be built. Given the 5-10-year lead times base metals mines require to come online, it is obvious that beyond the middle of this decade, the physical reality of demand exceeding supply will assert itself. A good start would be a global effort to impose and collect carbon taxes uniformly across states.7 This would need to be augmented with a carbon club, which restricts admission and trading privileges to those states adopting such a scheme. Harmonizing the multiple emissions trading schemes worldwide will be a decades-long effort that is unlikely to succeed. Such schemes also can be gamed by larger players, producing pricing distortions. A hard and fast tax that is enforced in all of the members of such a carbon club would immediately focus attention on the technology required to avoid paying it – mobilizing capital, innovation and entrepreneurial drive to make it a reality. This would support carbon-capture, use and storage technologies as well, thus extending the life of existing energy resources as the next generation of metals-based resources is built out. In addition, a carbon tax raises revenue for governments, which can be used for a variety of public policies, including reducing other taxes to reduce the overall burden of taxation. Lastly, a tax eliminates the potential for short-term price volatility in the pricing of carbon – as long as households and firms know what confronts them they can plan around it. Tax revenues also can be used to reduce the regressive nature of such levies. Investment Implications The lack of a coherent policy framework that addresses the very real constraints on the transition to a low-carbon economy makes the likelihood of a volatile, years-long evolution foreordained. We believe this will create numerous investment opportunities as underinvestment in hydrocarbons and base metals production predisposes oil, natural gas and base metals prices to move higher in the face of strong and rising demand. We remain long commodity index exposure – the S&P GSCI and GSCI Commodity Dynamic Roll Strategy ETF (COMT), which is optimized to take advantage of the most backwardated commodity forward curves in the index. These positions were up 5.3% and 7.2% since inception on December 7, 2017 and March 12, 2021, respectively, at Tuesday's close. We also remain long the MSCI Global Metals & Mining Producers ETF (PICK), which is up 33.9% since it was put on December 10, 2020. Expecting continued volatility in metals – copper in particular – we will look for opportunities to re-establish positions in COMEX/CME Copper after being stopped out with gains. A trailing stop was elected on our long Dec21 copper position established September 10, 2020, which was closed out with a 48.2% gain on May 21, 2021. Our long calendar 2022 vs short calendar 2023 COMEX copper backwardation trade established April 22, 2021, was closed out on May 20, 2021, leaving us with a return of 305%. Robert P. Ryan Chief Commodity & Energy Strategist rryan@bcaresearch.com Ashwin Shyam Research Associate Commodity & Energy Strategy ashwin.shyam@bcaresearch.com Commodities Round-Up Energy: Bullish OPEC 2.0 offered no surprises to markets this week, as it remained committed to returning just over 2mm b/d of production to the market over the May-July period, 70% of which comes from the Kingdom of Saudi Arabia (KSA), according to Platts. While Iran's return to the market is not a given in OPEC 2.0's geometry, we have given better than even odds it will return to the market beginning in 3Q21 and restore most of the 1.4mm b/d not being produced at present to the market over the course of the following year. OPEC itself expects demand to increase 6mm b/d this year, somewhat above our expectation of 5.3mm b/d. Stronger demand could raise Brent prices above our average $63/bbl forecast for this year (Chart 7). Brent was trading above $71/bbl as we went to press. Base Metals: Bullish BHP declared operations at its Escondida and Spence mines were running at normal rates despite a strike by some 200 operations specialists. BHP is employing so-called substitute workers to conduct operation, according to reuters.com, which also reported separate unions at both mines are considering strike actions in the near future. Precious Metals: Bullish The Fed’s reluctance to increase nominal interest rates despite indications of higher inflation will reduce real rates, which will support higher gold prices (Chart 8). We agree with our colleagues at BCA Research's US Bond Strategy that the Fed is waiting for the US labor market to reach levels consistent with its assessment of maximum employment before it makes its initial rate hike in this interest-rate cycle. Subsequent rate changes, however, will be based on realized inflation and inflation expectations. In our opinion, the Fed is following this ultra-accommodative monetary policy approach to break the US liquidity trap, brought about by a rise in precautionary savings due to the pandemic. In addition, we continue to expect USD weakness, which also will support gold and precious metals prices. We remain long gold, expecting prices to clear $2,000/oz this year. Ags/Softs: Neutral Corn prices fell more than 2% Wednesday, following the release of USDA estimates showing 95% of the corn crop was planted by 31 May 2021, well over the 87% five-year average. This was in line with expectations. However, the Department's assessment that 76% of the crop was in good-to-excellent condition exceeded market expectations. Chart 7
By 2023 Brent Trades to $80/bbl
By 2023 Brent Trades to $80/bbl
Chart 8
Gold Prices Going Up
Gold Prices Going Up
Footnotes 1 Please see Trade Tables below. 2 Please see OPEC, Russia seen gaining more power with Shell Dutch ruling and EXCLUSIVE BlackRock backs 3 dissidents to shake up Exxon board -sources published by reuters.com June 1, 2021 and May 25, 2021. 3 Please see Chile's govt in shock loss as voters pick independents to draft constitution published by reuters.com May 17, 2021, and Peru’s elite in panic at prospect of hard-left victory in presidential election published by ft.com June 1, 2021. Peru has seen significant capital flight on the back of these fears. See also Results from Chile’s May 2021 elections published by IHS Markit May 21, 2021 re a higher likelihood of tax increases for the mining sector. The risk of nationalization is de minimis, according to IHS. 4 Please see Exxon walks away from stake in deepwater Ghana block published by worldoil.com June 1, 2021. 5 Please see OPEC 2.0's Production Strategy In Focus, which we published on May 20, 2021, for a recap our how we model OPEC 2.0's strategy. It is available at ces.bcaresearch.com. 6 Please see Will a lack of supply growth come back to bite the copper industry?, published by Wood Mackenzie on March 23, 2021. 7 Please see The Challenges and Prospects for Carbon Pricing in Europe published by the Oxford Institute for Energy Studies last month for a discussion of carbon taxes vs. emissions trading schemes. Investment Views and Themes Strategic Recommendations Tactical Trades Commodity Prices and Plays Reference Table Trades Closed in 2021 Summary of Closed Trades
Higher Inflation On The Way
Higher Inflation On The Way
Highlights Asset Management Regulation (AMR) represents a critical and successful structural reform that is defusing risks in the most hazardous parts of China’s credit system. This bodes well for long-term sustainability of the nation’s financial system and, hence, its long-term economic outlook. That said, the sheer size of risky products and shadow banking makes it impossible to reduce systemic risk without hampering overall credit origination. AMR will dampen bank and shadow banking credit growth further and the credit impulse will be negative by year-end. As a result, China's growth will decelerate. The risk-reward profile of Chinese stocks remains poor. Favor Chinese local currency government bonds as yields will drop further. Feature Chart 1China’s Growth Is Set To Decelerate
China's Growth Is Set To Decelerate
China's Growth Is Set To Decelerate
China’s broad credit and money growth have relapsed substantially. Given that they have historically been reliable leading indicators of business cycles (Chart 1), the question is: how far will credit growth decelerate. When gauging the magnitude of a money/credit slowdown, one should not only look at borrowing costs but also at the willingness and capacity of creditors to extend credit. In this context, it is essential to examine the impact of Asset Management Regulation (AMR) in China on both bank and non-bank credit growth. Please refer to Box 1 below for a more detailed discussion on AMR. BOX 1 What Is AMR? AMR (Asset Management Regulation) was introduced in 2018 to mitigate financial system risks, increase transparency of financial products, and, hence, enhance investor protection. Financial institutions (banks and non-banks) were originally obliged to meet AMR requirements by the end of 2020. However, after the pandemic broke out, this term was extended to the end of 2021. The main objectives of AMR are: To restrict financial institutions from dodging financial regulations and prevent them from engaging in regulatory arbitrage. To prohibit financial institutions from providing other financial organizations with “channels” for evading regulatory requirements. To preclude banks from investing in high-risk assets. To forbid financial institutions from providing explicit or implicit guarantees for the principal and return on asset management products. AMR non-compliant products need to be either terminated or revamped to become AMR compliant before December 31, 2021. Assessing the value of outstanding AMR non-compliant products will help to gauge the actual impact of AMR on credit growth over the course of this year. A portion of banks’ wealth management products (WMP) and single fund trust products are AMR non-compliant and will need to be terminated or revamped. Commercial banks’ WMPs represent fund investment and management plans developed, designed and sold by commercial banks to individuals or institutions. In China, individual investors are the main customers for banks’ WMPs. In 2020, individual investors accounted for more than 99% in number of investors and 87% in investment amounts.1 The outstanding amount of WMPs is presently RMB 25 trillion. Single fund trusts have one investor – usually a bank or another financial institution. Given the disclosure regulation for single fund trusts is much looser than other fund trusts, it was prevalently used by financial institutions, including banks, to channel funds into investments to achieve regulatory arbitrage. Chart 2China Has Not Yet Deleveraged
China Has Not Yet Deleveraged
China Has Not Yet Deleveraged
AMR represents regulatory tightening and will negatively affect bank and non-bank credit growth over the course of this year. In this report we examine what its impact will be on broad credit growth as banks and shadow banking attempt to comply with AMR by end of December this year. Authorities in China have been conducting well-thought-out surgical reforms – AMR being the cornerstone of these – to curb and restructure the risky elements of the credit system. By doing so, they have already dramatically reduced systemic risk in the financial system. Regardless of how deft and precise these reforms have been, they will continue to weigh on bank and shadow banking credit growth. The basis is that the sheer size of risky products and shadow banking makes it impossible to reduce systemic risk without hampering overall credit origination. It should also be noted that China has not yet deleveraged (Chart 2). How Large Are AMR Non-Compliant Assets? We reckon that AMR’s effect on broad credit is mainly through its impact on commercial banks’ Wealth Management Products (WMP) and single fund trusts. S&P Global2 estimates that by the end of 2020, banks will still have RMB 8.5 trillion in off-balance sheet WMP to restructure. Single fund trusts’ assets stood at RMB 7.7 trillion in March 2021. However, to avoid double counting, flows from banks to trust funds (“bank-trust cooperation”) should be deducted from this value. The basis is that channeling funds by banks via trust companies is already captured in banks’ WMP statistics. Overall, non-compliant AMR assets that need to be revamped by year-end are as follows: Banks’ non-compliant WPM 8.5 trillion Single fund trust assets excluding “bank-trust cooperation” 1.2 trillion Total RMB 9.7 trillion This RMB 9.7 trillion represents 3.6% of total social financing (TSF) excluding equity issuance and 4.2% of private credit. The latter is defined as TSF excluding equity and central and local government bond issuance as well as special bonds. Chart 3China: Various Borrowing Costs
China: Various Borrowing Costs
China: Various Borrowing Costs
SP Global2 estimates that around RMB 5 trillion WMP will be revamped and made AMR compliant during this year. To put this figure into perspective, banks revamped RMB 4.8 trillion in 2020 and RMB 5.7 trillion in 2019. This will leave RMB 3.5 trillion of non-compliant WMP that banks are likely to take on their balance sheet before year-end. Even in the case of revamped WMP and single fund trusts, there will be unintended consequences for borrowers. In particular, the cost of borrowing could rise and/or the maturity of loans could be shortened. Both will weigh down on economic activity in general, and investment in the real economy in particular. With full transparency and no implicit guarantee from banks, investors will require higher interest rates to invest in these products (Chart 3). In addition, investors will opt for shorter maturities of these products. Impact On Bank Credit… Chart 4China: Bank Loan Approvals And Bank Credit Impulse
China: Bank Loans Approvals And Bank Credit Impulse
China: Bank Loans Approvals And Bank Credit Impulse
As banks take these AMR non-compliant WMP onto their balance sheets, their assets will automatically expand even though they will not originate new loans/provide financing to the real economy. The estimated RMB 3.5 trillion of WMP is equivalent to 1.5% of commercial bank broad credit and 1.2% of their assets. Hence, AMR will reinforce the deceleration in new credit origination. Both bank assets and broad bank credit will slow and their impulses will contract further (Chart 4). Importantly, bringing these assets onto their balance sheet will require banks to both (1) allocate more capital to support these new assets and (2) increase provisions for the portion of these assets that are non-performing. The non-performing share of these AMR-non-compliant assets could be significant given that funds from off-balance sheet WMP were often invested in high-risk, high-return projects. These often represent claims on risky businesses, including property developers and local government financing vehicles (LGFV). In brief, there were reasons why banks did not initially put these assets on their balance sheets and doing so now will not be inconsequential. Overall, this move will hinder commercial banks’ ability and willingness to originate new credit, i.e., to provide new funding to the real economy (Chart 4). …And Shadow Banking Chart 5 demonstrates that shadow banking credit – comprised of trust loans, entrust loans, and unrealized banker acceptance bills – has been contracting. Outstanding shadow banking credit at RMB 23.9 trillion makes up 9% of TSF excluding equity issuance. Single fund trust loans – please refer to Box 1 above for more information – are the most vulnerable part of shadow banking to AMR. Despite their having contracted since 2017, single fund trust assets excluding “bank-trust cooperation” still amount to RMB 1.2 trillion or 0.5% of TSF, excluding equity issuance (Chart 6). Chart 5China’s Shadow Banking Continues To Shrink
China's Shadow Banking Continues To Shrink
China's Shadow Banking Continues To Shrink
Chart 6Single Fund Trusts Are The Most Vulnerable To AMR Regulation
Single Fund Trusts Are The Most Vulnerable To AMR Regulation
Single Fund Trusts Are The Most Vulnerable To AMR Regulation
This type of financing will continue to shrink, weighing on aggregate credit flow. Although investors in these products might reinvest their funds in AMR-compliant funds, they will demand higher interest rates to offset higher credit risk. The basis is that full transparency will inform them that the trust companies and banks can neither guarantee principal nor interest on their investments. Higher interest rates demanded by investors in trust funds or their reduced financing will affect borrowers that rely on funding from this source. Specifically, trust funds investment in property developers and LGFV has been and will continue to shrink (Chart 7). Impact On Property Developers And LGFV Property developers and LGFV are among the most vulnerable segments to reduced financing because of AMR. Trust companies have meaningful exposure to both real estate developers and LGFV. RMB 2.3 trillion in trust funds are invested in real estate and RMB 1.2 trillion in government projects, mostly representing claims on LGFV. Trust companies’ claims to both segments have been and will continue contracting (Chart 7). Property developers and LGFV are not only vulnerable to curtailed funding due to AMR but also from authorities’ campaign to limit their debt. Three Red Lines policy for property developers imposes caps on their debt. In addition, bank regulators have imposed limits on banks’ claims on property developers as well as residential mortgages (Chart 8, top panel). Loans are capped at 40% for the largest state-owned lenders, while banks’ mortgage lending should be no more than 32.5% of large banks’ outstanding credit. The regulations are even more rigorous for smaller banks. For smaller banks, caps on loans to real estate and mortgage loans are 27.5% and 20%, respectively.3 Banks’ credit to property developers and household mortgages are growing at a historically low pace and will likely decelerate further (Chart 8, bottom panel). To sum up, banks and shadow banking will curtail their exposure to property developers and LGFV. Consequently, these credit-intensive sectors will have to shrink their capital spending and construction activity. The latter will have ramifications for raw materials and industrial sectors exposed to traditional infrastructure and construction. Chart 7Trust Funds’ Exposure To Property Developers And LGFVs
Trust Funds' Exposure To Property Developers And LGFVs
Trust Funds' Exposure To Property Developers And LGFVs
Chart 8Banks’ Exposure To Property Developers And Residential Mortgages
Banks' Exposure To Property Developers And Residential Mortgages
Banks' Exposure To Property Developers And Residential Mortgages
Investment Conclusions On the positive side, AMR represents critical and successful structural reform that is defusing risks in the most hazardous parts of China’s credit system. This bodes well for long-term sustainability of the nation’s financial system and, hence, its long-term economic outlook. Nevertheless, this regulatory tightening along with clampdown on the property market and local government debt will weigh on the Chinese business cycle over the next six-to-nine months: Private credit growth will continue downshifting and its impulse will turn negative, weighing on credit-exposed sectors (Chart 9). Although the private credit impulse is unlikely to reach -10% of GDP like it did in 2018, it will likely turn negative by year-end. Our guess it might be negative 3-4 % of GDP later this year. Chart 9China: Private Credit Impulse Will Turn Negative By Year-End
China: Private Credit Impulse Will Turn Negative By Year-End
China: Private Credit Impulse Will Turn Negative By Year-End
Chart 10China: Fiscal Spending Impulse Will Be Modestly Positive In 2021
China: Fiscal Spending Impulse Will Be Modestly Positive In 2021
China: Fiscal Spending Impulse Will Be Modestly Positive In 2021
Public sector credit – measured as borrowing by central and local government, including special-purpose bonds – will continue decelerating according to bond quotas for this year. Still, higher government revenue will offset the slump in government borrowing so that government spending will grow in 2021 from a year ago. In aggregate, the fiscal spending impulse for all of 2021 will be positive at 1.6% of GDP (Chart 10). Overall, the fiscal spending impulse of 1.6% of GDP in 2021 will not offset the private credit impulse that we reckon to be about negative 3-4% of GDP. The upshot will be a modestly negative aggregate credit and fiscal spending impulse. The latter will be slightly worse than the readings of this indicator during the 2011 and 2014-15 slowdowns but more positive than in 2018 (please refer to Chart 1 above). This heralds a non-trivial business cycle slowdown. The latter will be concentrated in areas that usually benefit from credit and fiscal stimulus. Construction activity and traditional infrastructure spending are the most vulnerable areas. This entails that Chinese demand for raw materials will disappoint and base metals prices are vulnerable. With regard to investment strategy, investors should continue favoring Chinese local currency government bonds over stocks. As the economy decelerates, bond yields will drift lower. Share prices remain vulnerable. Chart 11 illustrates that net EPS revisions for the MSCI China A-share index has rolled over but has not yet dropped to their previous lows. Our hunch that EPS slowdown is not yet fully priced into the Chinese onshore equity market. Concerning MSCI China Investable non-TMT stocks, they have rolled over at their previous high (Chart 12). Given the negative corporate profit outlook, the risk-reward is unattractive both in absolute terms and relative to global equities. Chart 11Chinese Stocks: EPS Growth Expectations Will Downshift Further
Chinese Sotkcs: EPS Growth Expectations Will Downshift Further
Chinese Sotkcs: EPS Growth Expectations Will Downshift Further
Chart 12An Intermediate-Term Top In Chinese Non-TMT Stocks?
An Intermediate-Term Top In Chinese Non-TMT Stocks?
An Intermediate-Term Top In Chinese Non-TMT Stocks?
In the long run, however, the de-risking of the credit system is bullish for Chinese share prices. Declining systemic financial risks entail a lower equity risk premium. Consequently, equity valuations will ultimately be re-rated. Arthur Budaghyan Chief Emerging Markets Strategist arthurb@bcaresearch.com Qingyun Xu Associate Editor Qingyun@bcaresearch.com Footnotes 1 2020 Bank’s Wealth Management Product Report 2 Source: SP Global "China Banks May Still Have RMB3 Trillion In Shadow Assets By Year-End Deadline." 3 https://www.cbirc.gov.cn/cn/view/pages/ItemDetail.html?docId=955074&ite… Cyclical Investment Stance Equity Sector Recommendations
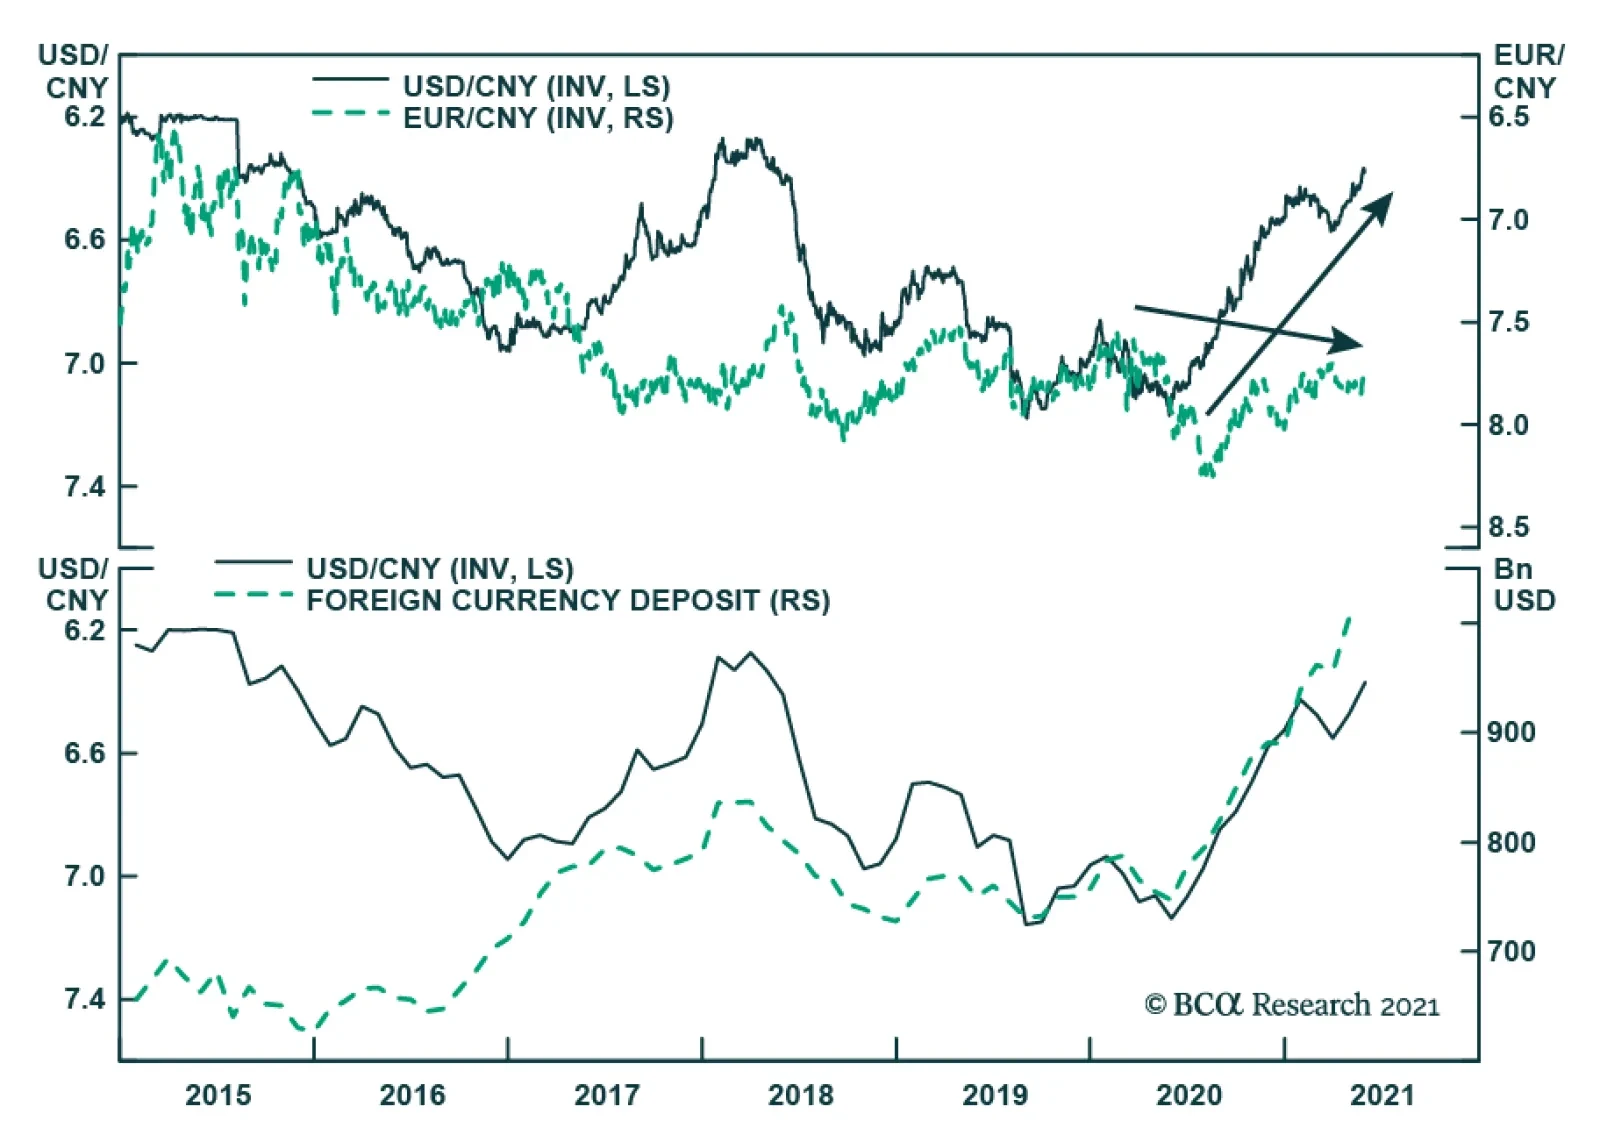
The PBoC announced on Monday that it will raise the reserve requirement ratio rate for FX deposits at financial institutions –the first FX deposit RRR rate hike in 14 years – effective on June 15. The RMB fell by a meager half percentage point against the USD…
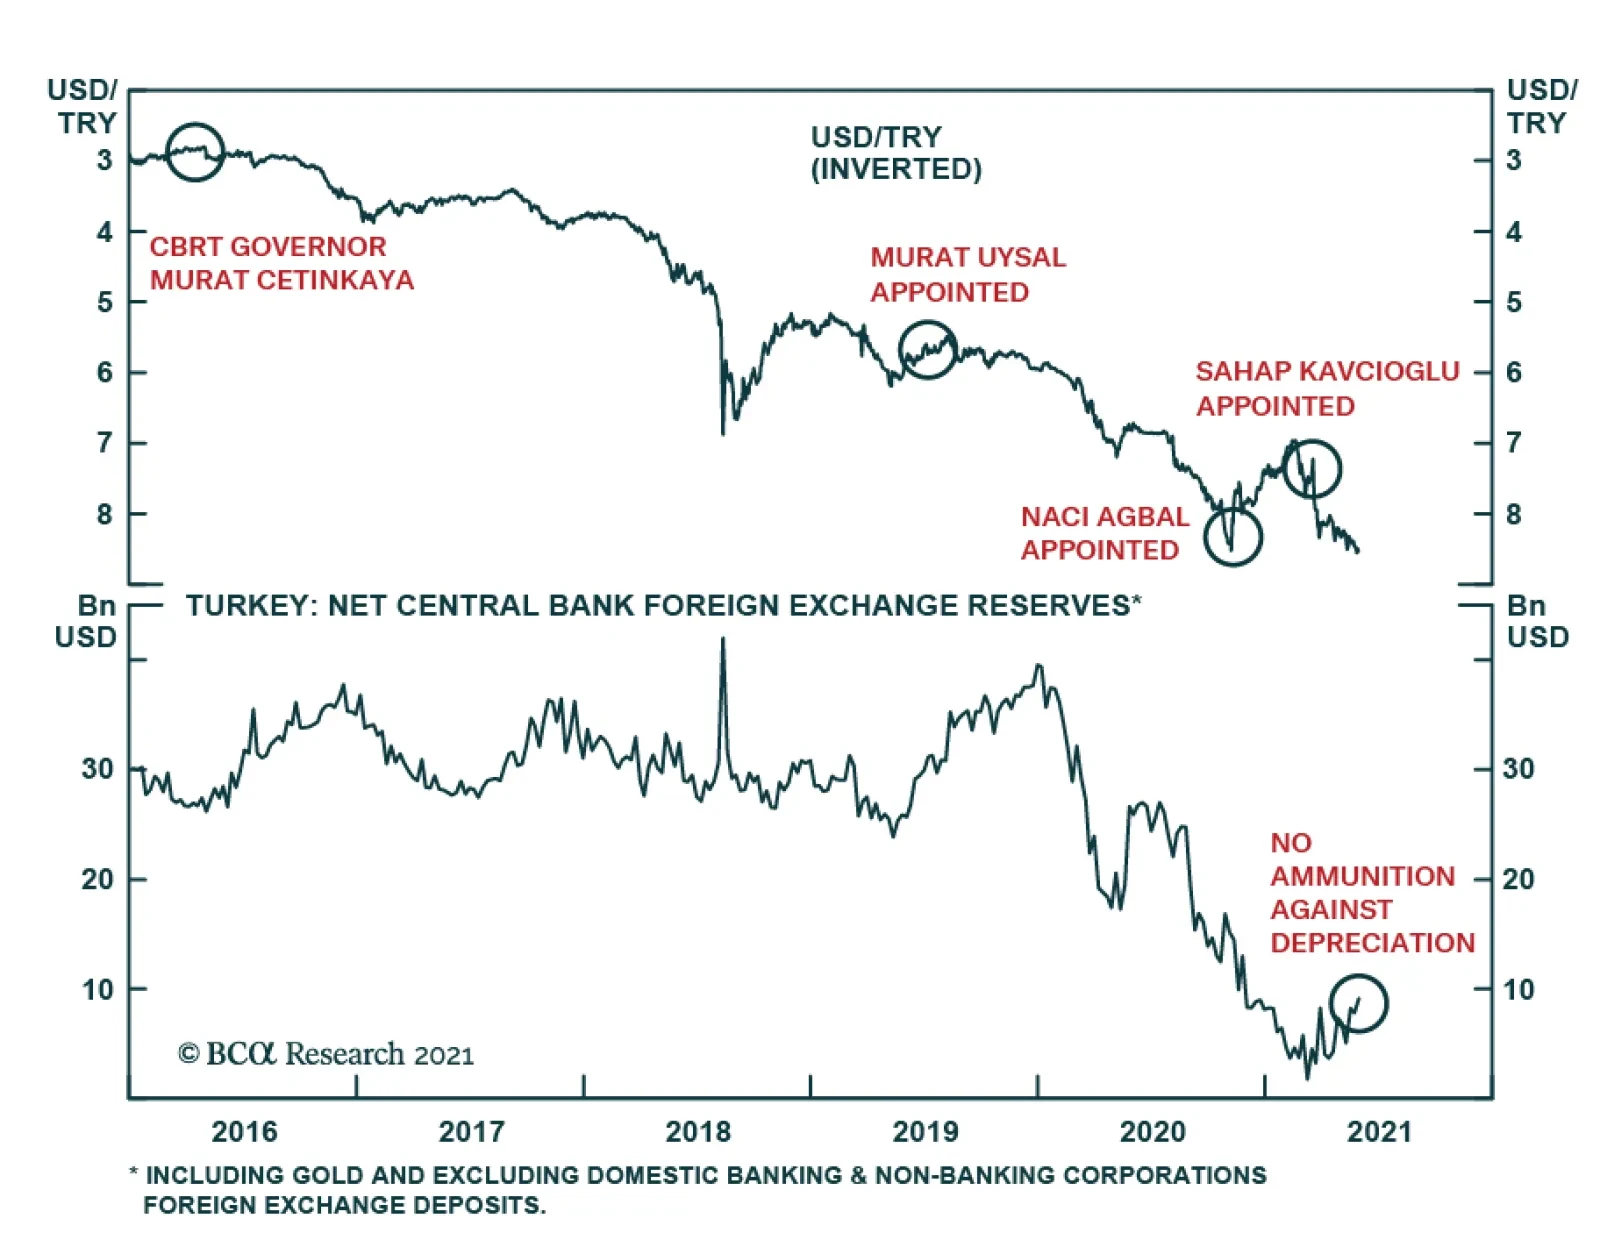
President Erdogan is once again injecting himself into the Turkish monetary policy. In an interview on Tuesday, the president stated “it’s an imperative that we lower interest rates. For that, we will reach July and August thereabouts so that rates can begin…
BCA Research’s US Political Strategy service concludes that the looming “fiscal cliff” is probably overrated from an economic point of view even though it may contribute to a pullback in the stock market. The FY2022 presidential budget, which assumes that…
Highlights President Biden’s FY2022 budget largely confirms consensus views of the economy – which means that it overrates the government’s tax-collecting powers and underrates its fiscal profligacy. The US fiscal thrust will turn negative as the budget deficit contracts in the coming years but the private economic recovery looks robust and positive government spending surprises will mitigate the fiscal cliff. The Biden administration may attempt to pass its capital gains tax hike in the next budget reconciliation bill and make it retroactive to 2021. We doubt this will occur but investors will need to book some profits to be on the safe side. Big Tech still faces a “slow boil” when it comes to government regulation. Stay long materials and infrastructure relative to tech. We were stopped out of our long energy large caps trade. The energy sector is still a beneficiary of a strong macro backdrop for oil and commodities. Close our long municipal bonds trade for a gain of 2%. Feature President Biden’s budget proposal for fiscal 2022 is a confirmation of macro policy trends that the market is well aware of and has already priced. The presidential budget, released on May 27, is a symbolic document. Congress controls the purse strings and congressional dynamics will work out differently from what the White House intends. Still, the budget is significant for highlighting the administration’s big spending preferences and the critical structural theme: the return of Big Government. That is not to say that Biden will fail to overcome various checks and balances with regard to his major legislative priorities, the American Jobs Plan (AJP) and American Families Plan (AFP). Biden’s measurable political capital is still moderate-to-strong. His popular approval remains above 50% and slightly improved in the latest opinion surveys (Chart 1). It should stay above the halfway line as the economy recovers. Chart 1ABiden’s Approval Rating Holding Up
Forget Biden's Budget
Forget Biden's Budget
Chart 1BBiden’s Approval Rating Holding Up
Forget Biden's Budget
Forget Biden's Budget
Consumer confidence improved again in May, on the back of what promises to be a rollicking disease-free summer for households. Political polarization continued to abate in the wake of the contested 2020 election. It may be hitting resistance levels (we expect polarization to remain elevated despite dropping off from Trump-era peaks) but the market implications will only become relevant after Biden’s legislative agenda grinds to a halt following the passage of his second reconciliation bill. Polarization will revive around September with the debt ceiling and the 2022 budget appropriations process and ahead of the 2022 midterm elections, which have a subjective 75% chance of gridlocking Congress. But that time has not yet come and Biden is still capable of signing one or two major bills into law. New data on government spending underscores the big government trend. Fiscal thrust – in this case the unadjusted change in the budget deficit – grew substantially in the first quarter of 2021 relative to the fourth quarter of 2020. It went from 4.6% of GDP in Q4 to 13.1% of GDP in Q1, an increase of 8.5%. The budget deficit will contract in the coming years, a headwind for the economy, but not too dangerous of a headwind as long as the private economy continues to recover, as it should. Real wages are growing at a steady pace, leaping up from a 1.9% growth rate in November to 11.7% in April. What is more notable is the continued decline in consumer loan delinquencies from 1.8% to 1.7% in the first quarter – i.e. flat and marginally declining. It is impressive that the US suffered a recession without considerable consumer or business bankruptcies or delinquencies. When government support ends – when the moratorium on home evictions expires this month and unemployment insurance dries up in September 6 – it will be critical to watch for an increase in distress to determine if the Fed will become more or less inclined to taper asset purchases, the preliminary to raising interest rates. Given that the pandemic caused the recession, and that the pandemic is ebbing on the back of vaccinations, our base case is that the private economy will recover even as government support declines. Most of the good news of the US recovery and government stimulus is priced into the market. Investors will now focus on the Federal Reserve and the passage of Biden’s two big bills. We agree with the BCA House View that the Fed will deliver dovish surprises despite the improving economy as it cannot afford to renege on its new monetary policy strategy but must convince the market that it remains dedicated to an inflation overshoot. Biden’s Budget In A Few Simple Charts Biden’s first presidential budget projects a sea change in US government spending, a “normalization” in US government taxation (reversal of President Trump’s tax cuts), and an economy whose underlying conditions remain the same despite the policy sea change. In reality the economy will respond to the sea change in policy. Real economic growth is projected to slow from 5.2% this calendar year to 4.3% in 2022 and then to settle at around 2% through 2031 (Chart 2). This is in line with forecasts from the Congressional Budget Office and consensus expectations of potential GDP growth. Productivity and labor force growth, which make up potential GDP, are hard to predict. We would note that the Biden administration has drastically cut back on immigration law enforcement. It will be hard to dislodge the Democrats in 2024 given that the economy will be robust and the Republican Party is divided. Therefore immigration policy will not undergo a substantial tightening at least through 2028, though bipartisan immigration reform is possible after 2022 and would marginally tighten inflows. Chart 2Presidential Budget Growth Rate Assumption
Forget Biden's Budget
Forget Biden's Budget
Meanwhile a substantial increase in federal funding for infrastructure, research and development, and STEM education could improve productivity later in the decade, if only on a cyclical rather than structural basis. In other words the administration is not too optimistic regarding growth assumptions even though it assumes higher growth than the Fed or CBO. Inflation is expected to peak at 2.3% in 2025 and continue at that rate throughout the decade (Chart 3). We will not enter into the inflation debate here. Suffice it to say that the risk lies to the upside despite the above points regarding potential growth. Republican voters have abandoned any semblance of fiscal austerity, as signified by President Trump’s success, while the Democrats under Biden are flirting with modern monetary theory. The Fed has adopted a new monetary policy that is aimed at fighting deflationary tail risks at all costs. The budget deficit and trade deficit are ballooning and the US dollar is weakening. The US has fundamentally shifted trade policy, at least with regard to China, which is pushing up input costs. Chinese and global demographics imply a falling ratio of workers to dependents, which implies a secular rise in wages. Chart 3Presidential Budget Inflation Assumption
Forget Biden's Budget
Forget Biden's Budget
In terms of taxing and spending, the presidential budget is overly optimistic about the ability of the federal government to maintain policy orthodoxy. Budgetary receipts are expected to rise on Biden’s tax hikes and the expiration of the Trump tax cuts in 2025. This is exaggerated, since Biden has already said he will accept a corporate tax hike half as large as that in the budget (25% instead of 28%). It is true that finding the votes to extend the Trump tax cuts will be politically difficult and the expiration date arrives at the beginning of a new administration in a non-election year when some fiscal tightening is manageable. But the projection that spending will stay stable at less than 25% of GDP despite Biden’s “Great Society”-style spending is infeasible (Chart 4). Chart 4Presidential Budget Tax-And-Spend Assumptions
Forget Biden's Budget
Forget Biden's Budget
Major spending cuts are far less likely in the foreseeable future than they were back in 2011, when the Budget Control Act was passed. True, Republicans will rediscover their fiscal rectitude in the opposition. But in a social environment of populism and anti-austerity they will either fail to obtain full control of Congress or they will fail to execute deep spending cuts. The party’s political base is now the working class so it will have to rethink cuts to entitlements (mandatory spending), just as it is already rethinking its commitment to corporate tax cuts. Democrats will not cut mandatory or non-defense discretionary spending and will oppose any Republican efforts aggressively (Chart 5). Chart 5Presidential Budget Mandatory Versus Discretionary Spending
Forget Biden's Budget
Forget Biden's Budget
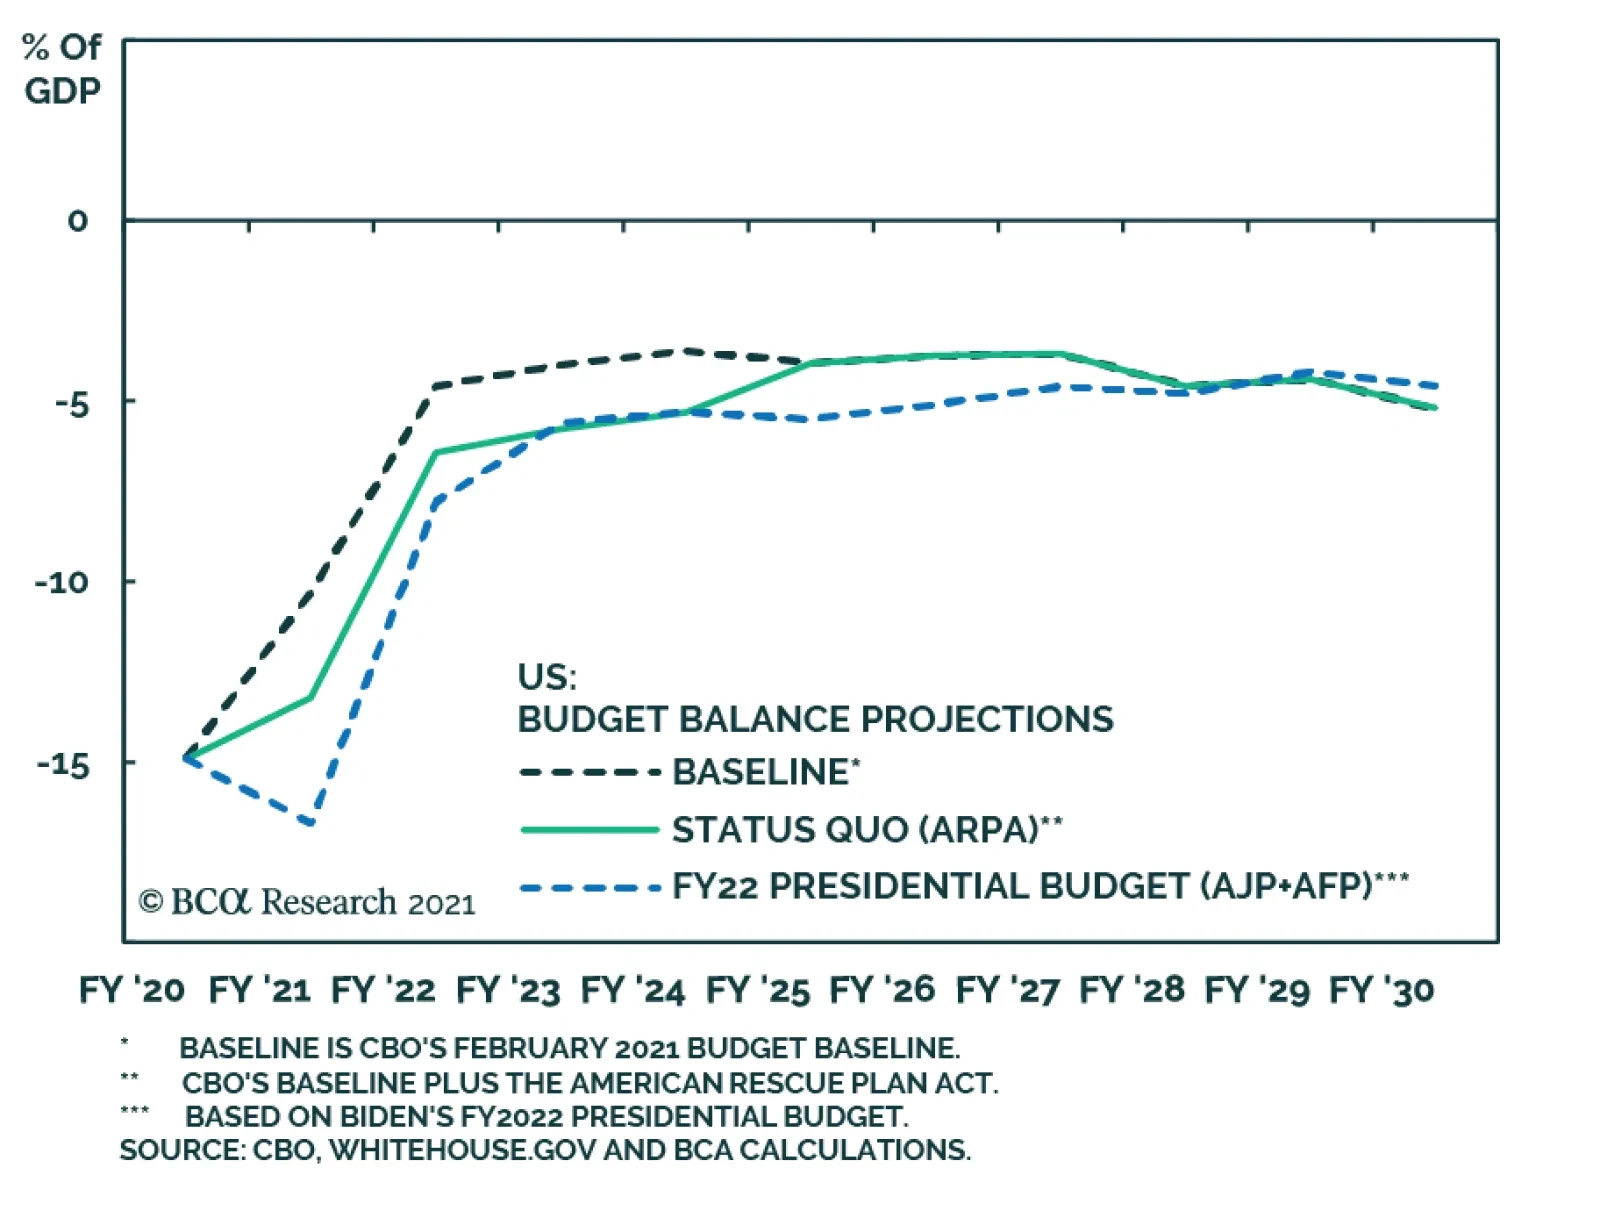
While the presidential budget envisions stable defense spending, the truth is that the one area where Republicans are likely to succeed in influencing fiscal policy substantially lies in defense, which will grow. The US is phasing out its “small wars” and focusing on struggle among the Great Powers. Biden anticipates that defense spending will be flat while non-defense rises sharply but this is unlikely to occur. Regardless of Biden’s specific budget, the US is engaged in the largest government spending since the 1940s and yet there is neither a Great Depression nor a World War II taking place. However, this extravagant peacetime spending looks less extravagant when one considers that there are some historical parallels to the 1930s-40s. There have been two major economic shocks over the past 13 years and there is an emerging cold war with China. The US public has taken a populist turn, the political establishment is determined to provide more largesse to win back the hearts and minds of the people, and the defense and intelligence establishment are well aware of the rising security threats from China and Russia. Federal spending will persistently surprise to the upside while tax hikes could be stymied as early as the 2022 midterm elections. The result is a larger-than-expected budget deficit. The implication for the short-to-medium term is higher inflation and a weaker US dollar. But soaring geopolitical conflict and China’s structural slowdown will eventually put a floor under the dollar. Fiscal Thrust And Budget Deficit Projections Financial markets are already pretty well aware of these trends. The FY2022 presidential budget, which assumes that Biden’s entire legislative agenda passes Congress, does not project a budget deficit that is very different from a back-of-the-envelope “Status Quo” scenario, which assumes that the American Jobs and Families Plans do not pass (Chart 6). Chart 6Presidential Budget Deficit Scenario Alongside Previous Scenarios
Forget Biden's Budget
Forget Biden's Budget
Of course, the AJP, at least, is likely to pass. If a bipartisan deal is struck this week or shortly thereafter then full passage is possible by the end of July. The Democrats would then spend the entire fall legislative session crafting a bill that combines some of the remaining portions of the AJP with the high-priority parts of the AFP into a single budget reconciliation bill that would be likely to pass by Christmas or early 2022. Nevertheless Biden’s budget reveals that there is not much distance in budget deficit projections with regard to the AFP (Chart 7). Even though the price tag of the AFP is huge, at $1.8 trillion, the truth is that it will be watered down in negotiation and it will also be accompanied by at least some tax hikes. Thus the market already has most of the information it needs regarding US budget deficit projections. Everything else depends on events in the private economy and external sector. The good news of the US budget deficit blowout is largely priced. Future upward surprises in the deficit, which we expect, serve to mitigate the contraction in the budget deficit, i.e. to reduce the negative fiscal thrust that drags on the economy as stimulus wanes. In other words the looming “fiscal cliff” is probably overrated from an economic point of view even though it may contribute to a pullback in the stock market. Chart 7Small Difference Between Biden’s Two Plans
Forget Biden's Budget
Forget Biden's Budget
Changes In The Post-Infrastructure Agenda After Biden passes his infrastructure plan (the AJP), whether via bipartisanship or reconciliation, the AFP presents a much tougher political slog in Congress. The revised AFP promises to be a Frankenstein monster of social spending – a new “Alphabet Soup” of government programs including affordable child care, elderly care, universal pre-kindergarten schooling, subsidized community college, and paid leave. It will have to be pared back somewhat to appease moderate Democratic senators. The administration has tried to pitch the new social spending as “human infrastructure,” since infrastructure is more popular than welfare, but while Democrats accept this rhetorical gimmick, a majority of independent voters (along with opposition Republicans) apparently do not (Chart 8). Still the AFP could very well pass before the midterm on the condition that Biden signs the AJP this summer. We stick with our 50/50 odds for now. Chart 8Much Tougher Slog On Social Spending Bill
Forget Biden's Budget
Forget Biden's Budget
The presidential budget introduced a new risk regarding the impending capital gains tax hike: the possibility that it will be enacted retroactively, taking effect in 2021, rather than in 2022 or thereafter as expected. The administration proposes to raise the long-term capital gains rate to 39.6%, which, combined with the Obamacare surtax of 3.8% would result in a 43.4% rate on capital gains for investors making over $1 million. A compromise will be necessary but the top rate could still end up above 32%. If Biden completes a bipartisan infrastructure deal this summer then he is much more likely to get this and other individual tax hikes into the reconciliation bill at the end of this year. Retroactivity is possible but it would be bad politics ahead of the midterm election. Therefore we stick with our view that individual tax hikes will take effect in 2023 if at all. But from a prudential perspective, investors will have to book some gains to prepare for negative tax surprises and that suggests near-term profit taking could weigh on the stock market (Chart 9). Chart 9A Retroactive Capital Gains Tax?
A Retroactive Capital Gains Tax?
A Retroactive Capital Gains Tax?
Since Biden is guaranteed to get a lot of spending through two or three reconciliation bills (one already passed), he will not get much when it comes to regular appropriations. We are more likely to see the GOP refuse to cooperate on budgetary appropriations. This could lead to a debt ceiling crisis and government shutdown at the end of this year or early next year; hence the aforementioned return of polarization. However, these events will play out very differently from 2011-13. The GOP must tread carefully as they are already divided among pro-Trump and anti-Trump factions and will suffer even worse in public support if they induce a shutdown. A government shutdown would not be market negative in an already highly stimulated economy but it could jeopardize Republican odds in 2022, thus marginally increasing the risk of upward surprises in Democrats’ tax-and-spend policies. Congress is also moving forward on a raft of other legislative proposals, highlighted in Table 1. Most of these proposals will fall short of the bipartisan support necessary to get the required 60 votes in the Senate. The most promising bills involve efforts to resurrect US industrial policy, research and development, technological leadership (particularly in semiconductors), supply chain resilience, and domestic manufacturing. Anything that aims to coordinate the two parties in the face of geopolitical competition with China is likely to pass, as we have highlighted in our sister Geopolitical Strategy service. The result, as mentioned above, is likely to be a cyclical uptick in productivity (we will not speculate here on whether the structural downtrend will be broken). Table 1Pending Legislation In Congress Under Biden
Forget Biden's Budget
Forget Biden's Budget
The Slow Boil Of Tech Regulation In a recent report on the Biden administration’s regulatory threat to the tech sector we argued that while popular opinion and government interest were creating a “slow boil” for Big Tech, nevertheless the reflationary macroeconomic backdrop posed a much larger short-term risk. We stand by this view especially in light of recent developments. In particular, legislative priorities, gridlock in all key agencies, slow movement in the Department of Justice’s staffing, an evenly divided Senate, and a recent Supreme Court judgement against the Federal Trade Commission all lend confirmation to our thesis, at least for now. To elaborate: A bipartisan consensus in public opinion holds that Big Tech needs tougher regulation (Chart 10) and this consensus grew substantially over the controversial 2020 political cycle. However, not all surveys show strong majorities in favor of regulation, even if they show strong majorities are skeptical of Big Tech’s influence. And Republicans and Democrats disagree on the aims of regulation, with Republicans averse to “content moderation,” or ideological censorship, and Democrats eager to retain their advantage in political fundraising from Silicon Valley. Any bill requiring 60 votes in the Senate would be an opportunity for Republicans to demand that their speech and press rights be preserved, which would be a poison pill for Democrats. The lack of cooperation on the proposed commission to investigate the January 6 riot at the US Capitol highlights the inability to bridge the ideological gap. Chart 10Bipartisan Consensus On Tech Regulation
Forget Biden's Budget
Forget Biden's Budget
Most of the Democrats’ political capital will be spent on passing the infrastructure bill and the next budget reconciliation bill. There is limited space for other legislation, aside from the strategic competition with China. Minnesota Senator Amy Klobuchar’s anti-trust efforts, including parts of the Competition and Antitrust Enforcement Reform Act, have some chance of passage. She has proposed steps that Republicans can agree on, such as increasing fees on big mergers to fund anti-trust agencies, preventing anti-competitive pricing, and protecting whistleblowers. Her main bill avoids the debate over censorship and arguably preserves the almighty “consumer welfare” standard for determining where harm has occurred and government intervention may be necessary. Republican Senator Mike Lee of Utah has said some positive things about the bill and argues that it would not replace consumer welfare (though not all Republicans will agree and the judicial system will separately defend the consumer welfare standard). Regulatory reform is far more effective when backed by a new legislative overhaul. For example, reform of Section 230 of the Communications Decency Act becomes more difficult without new legislation. Regulation via the executive branch can be important but requires focus from the president and a strong consensus in key positions in the bureaucracy. Democrats must confirm two nominations to the Federal Communications Commission, which is currently deadlocked, in order to achieve a partisan majority and make headway on policy priorities (Table 2). Cybersecurity, net neutrality, and overseeing broadband internet expansion will compete with any regulatory probes into Big Tech. The Senate will also have to confirm two nominations for the Federal Trade Commission, which is also deadlocked at the moment (Table 3). One of these, for anti-trust scholar Lina Khan, a critic of Big Tech, is in process. Yet the FTC has possibly lost some of its bite after a Supreme Court ruling in April (AMG Capital v. FTC) determined that the agency cannot seek monetary relief under one of its most frequently used legal authorities (Section 13b of the Federal Trade Commmission Act). The FTC will thus lose some ability to impose penalties, particularly in consumer protection cases. Facebook is already attempting to use this ruling to dismiss the FTC’s case against it, which could result in a forced sale of popular subsidiaries WhatsApp and Instagram. Table 2Balance Of Power On The FCC
Forget Biden's Budget
Forget Biden's Budget
Table 3Balance Of Power On The FTC
Forget Biden's Budget
Forget Biden's Budget
As for the Department of Justice, while Biden’s appointments have all been confirmed, the anti-trust division is bogged down by ethics concerns since several officials would have to recuse themselves in cases against Big Tech due to their previous work representing plaintiffs against Big Tech. The bottom line is that Big Tech is in the hot seat after the various controversies of the pandemic and 2016-2020 elections, just as Big Banks faced tougher regulation in the wake of the subprime mortgage crisis. Both public and government willingness to prosecute and regulate Big Tech have gone up, creating a permanently higher level of regulatory risk. Yet government focus and capability are lacking in the short run. Investment Takeaways Most of the major reflation trades have taken a pause in recent weeks, as expected. The stock-to-bond ratio has stalled, the cyclicals to defensives ratio has peaked twice, and TIPS have lost momentum relative to duration-matched nominal treasuries. The big five tech firms’ shares have tentatively arrested their fall relative to the other 495 companies on the S&P500. It is not clear if they will break down further but the above analysis suggests that they will. We are sticking with our long materials / short tech trade (Chart 11). Chart 11Long Materials Versus Technology
Long Materials Versus Technology
Long Materials Versus Technology
Investors should stay invested, maintain pro-cyclical trades, favor value stocks relative to growth stocks, but avoid taking on large new risks in the current environment. The post-vaccine rally has lost steam but the overall macro backdrop remains favorable as the global economy recovers. We are closing our long municipal bonds trade for a gain of 2.3%. Our large cap energy trade has stopped out at -5% with small caps outperforming in the face of regulatory and ESG headwinds for the supermajors. Biden’s regulatory risk to energy small caps has been outweighed by the macro context but will become relevant at some point. Matt Gertken Vice President Geopolitical Strategy mattg@bcaresearch.com Jesse Anak Kuri Associate Editor jesse.Kuri@bcaresearch.com Appendix Table A1USPS Trade Table
Forget Biden's Budget
Forget Biden's Budget
Table A2Political Risk Matrix
Forget Biden's Budget
Forget Biden's Budget
Table A3Political Capital Index
Forget Biden's Budget
Forget Biden's Budget
Table A4APolitical Capital: White House And Congress
Forget Biden's Budget
Forget Biden's Budget
Table A4BPolitical Capital: Household And Business Sentiment
Forget Biden's Budget
Forget Biden's Budget
Table A4CPolitical Capital: The Economy And Markets
Forget Biden's Budget
Forget Biden's Budget
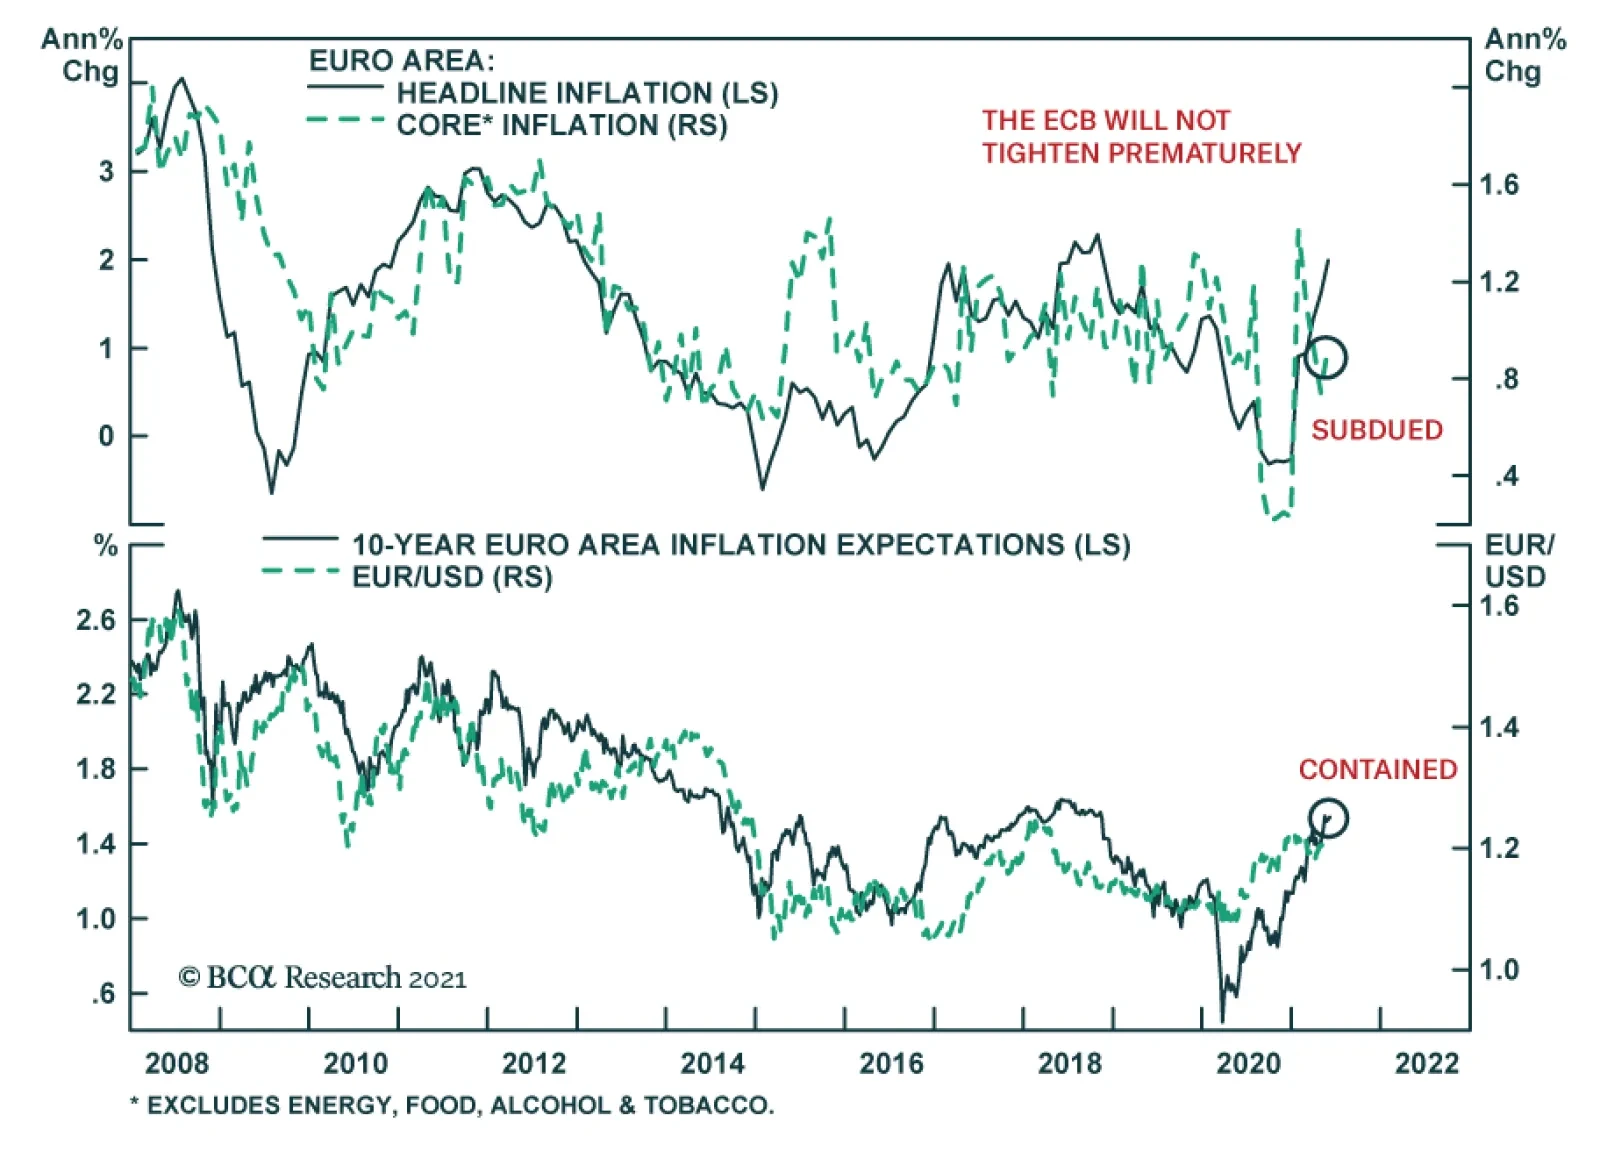
Consumer prices accelerated in the Euro Area in May. The headline consumer price index rose to 2.0% y/y from 1.6% y/y in April. Although the May figure is above the ECB’s target “of below 2%”, the central bank will not hint toward policy tightening on June 10…
BCA Research’s Global Fixed Income Strategy and US Bond Strategy services conclude that investors should maintain below-benchmark portfolio duration in US fixed income portfolios. According to their anticipated timeline for when the Federal…
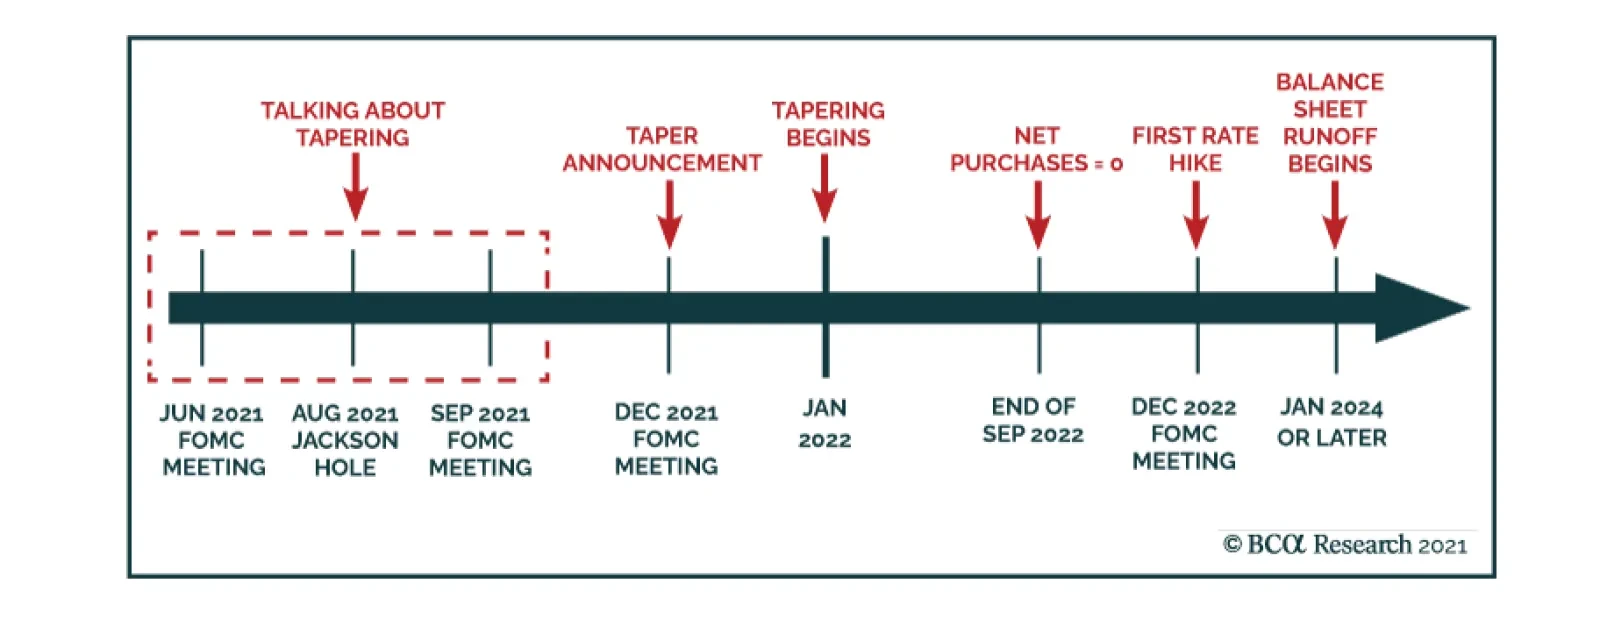
Highlights The Fed: The Fed will formally discuss tapering plans over the course of this summer and fall and announce the slowing of asset purchases before the end of 2021. Its labor market objectives will also be achieved in time to lift rates in 2022. Non-US Developed Markets: The central banks outside the US most likely to deliver tapering and/or outright rate hikes over the next 1-2 years are those facing housing bubbles – the Bank of Canada and Reserve Bank of New Zealand. The ECB will do nothing on rates while adjusting asset purchase programs to preserve the size of its balance sheet, while the Reserve Bank of Australia will also sit on their hands for longer. Bond Strategy Recommendations: Investors should maintain below-benchmark portfolio duration in US-only and global fixed income portfolios. Global bond investors should also favor exposure in markets where central banks will be more dovish than expected (core Europe, Australia), while limiting exposure to markets where hawkish surprises are more likely (the US, Canada, New Zealand). Feature The recovery from the 2020 COVID recession is now well underway and many investors are getting antsy about when central bankers might respond by removing monetary policy accommodation. Some central banks appear more eager than others. Both the Bank of Canada and Bank of England, for instance, have already started to reduce their rates of bond buying. Meanwhile, the US Federal Reserve is only just now starting to talk about the timing of its own tapering. This Special Report lays out a timeline for what central bank actions we should expect during the next two years. The first section focuses exclusively on the US Federal Reserve and the second section incorporates likely announcements from other central banks. Based on a comparison of our expected central bank timeline with current market prices, we conclude that investors should maintain below-benchmark portfolio duration in US-only and global fixed income portfolios. Global bond investors should also favor government bonds in countries where central banks are likely to be less hawkish than markets expect (core Europe, Australia) versus bonds from countries where hawkish surprises are more likely (US, Canada, New Zealand and, potentially, the UK and Sweden). The Federal Reserve’s Timeline Chart 1 shows our anticipated timeline for when the Federal Reserve will make specific policy announcements between now and the start of 2024. Chart 1The Federal Reserve’s Timeline
A Central Bank Timeline For The Next Two Years
A Central Bank Timeline For The Next Two Years
First, over the course of this summer, the Fed will initiate discussions about when to taper its asset purchases. Then, asset purchase tapering will be announced at the December 2021 FOMC meeting with purchases set to decline as of the beginning of 2022. We expect that net Fed purchases will fall to zero by the end of Q3 2022. That is, by that time the Fed will no longer be adding to its securities holdings. Rather, it will keep the size of its balance sheet constant. Then, with its balance sheet no longer growing, the Fed will begin the process of lifting interest rates. We expect the first rate hike to occur at the December 2022 FOMC meeting. Finally, some time after the fed funds rate is well above the zero bound, the Fed will try to reduce the size of its securities portfolio. How do we arrive at this timeline? Table 1A Checklist For Liftoff
A Central Bank Timeline For The Next Two Years
A Central Bank Timeline For The Next Two Years
We start with the Fed’s forward guidance about the timing of the first rate hike (Table 1). The Fed has told us that it will lift rates off the zero bound once (i) PCE inflation is above 2%, (ii) the labor market is at “maximum employment” and (iii) inflation is expected to remain above 2% for some time. The first item on the Fed’s liftoff checklist has already been met and the third item logically follows from the other two. That is, if inflation is above 2% and the labor market is at “maximum employment” then the Fed will certainly expect inflation to remain high. This means that the second item on the Fed’s checklist is the most critical for assessing the timing of liftoff. In assessing the US labor market’s progress toward “maximum employment” we first have to define what “maximum employment” means. Based on the Fed’s communications, we infer that “maximum employment” means an unemployment rate between 3.5% and 4.5% - a range consistent with the Fed’s NAIRU estimates – and a labor force participation rate that has recovered back to pre-pandemic levels (Chart 2). Table 2 presents the average monthly growth in nonfarm payrolls that is required to reach that definition of maximum employment by specific future dates. For example, we calculate that average monthly payroll growth of 698k to 830k will cause the labor market to reach maximum employment by the end of this year. Average monthly payroll growth of 412k to 493k is required to hit the Fed’s target by the end of 2022. Chart 2Defining "Maximum Employment"
Defining "Maximum Employment"
Defining "Maximum Employment"
Table 2Average Monthly Nonfarm Payroll Growth Required To Reach Maximum Employment By The Given Date
A Central Bank Timeline For The Next Two Years
A Central Bank Timeline For The Next Two Years
The most recent issue of the Bank Credit Analyst posits several reasons why US employment growth will pick up steam in the coming months.1 We agree with this view and note that indicators of labor demand such as job openings, the NFIB “jobs hard to get” survey and the Conference Board’s “jobs plentiful” survey also point to accelerating employment gains.2 All told, we think that average monthly payroll growth of 412k to 493k is eminently achievable (Chart 3). This means that the Fed will hit its three liftoff criteria in time to hike rates before the end of 2022. Chart 3Max Employment By The End of 2022
Max Employment By The End of 2022
Max Employment By The End of 2022
Working backwards from the expected liftoff date, the Fed has said that it needs to see “substantial progress” toward the criteria listed in Table 1 before it will taper its pace of asset purchases. The definition of “substantial progress” remains somewhat unclear, but a few recent Fed communications provide some clues. First, Fed Chair Jay Powell said that he wants to see a “string of months” like the strong March employment report before it will be appropriate to reduce the pace of asset purchases. The question of how many months constitutes a “string” remains unclear, but it certainly seems plausible that we could see two or three more strong employment reports over the course of the summer. Other Fed Governors appear to agree with this timeline. Governor Randal Quarles: If my expectations about economic growth, employment, and inflation over the coming months are borne out, however, and especially if they come in stronger than I expect, then, as noted in the minutes of the last FOMC meeting, it will become important for the FOMC to begin discussing our plans to adjust the pace of asset purchases at upcoming meetings.3 Fed Vice-Chair Richard Clarida: I myself think that the pace of labor market improvement will pick up. […] It may well be the time that – there will come a time in upcoming meetings we’ll be at the point where we can begin to discuss scaling back the pace of asset purchases …4 Fed Governor Christopher Waller: The May and June jobs report[s] may reveal that April was an outlier, but we need to see that first before we start thinking about adjusting our policy stance.5 Our takeaway from these comments is that two or three more strong employment reports, say 500k or higher, would be sufficient for the Fed to more formally discuss tapering plans. Further, several Fed Governors seem to agree with our forecast that nonfarm payroll growth will accelerate in the coming months. With that in mind, it seems reasonable to expect that the Fed will discuss tapering plans over the course of the summer and fall, and that it will have seen sufficient labor market gains to announce a formal plan before the end of this year. Assuming that a tapering announcement occurs before the end of this year and that asset purchases actually start declining as of Jan 1st 2022, we estimate that the tapering process will conclude by the end of Q3 2022. That is, the Fed will hold the size of its balance sheet constant as of that date. Chart 4Balance Sheet Growth Will End Before The First Rate Hike
Balance Sheet Growth Will End Before The First Rate Hike
Balance Sheet Growth Will End Before The First Rate Hike
At the very least, the Fed will certainly bring its net purchases to zero before it lifts rates. This is because it would be incoherent for the Fed to be tightening policy through its interest rate actions while it eases policy with its balance sheet strategy. Indeed, this is the roadmap that the Fed followed leading up to the 2015 rate hike cycle (Chart 4). Finally, we note that the Fed will try to reduce the size of its balance sheet only after the process of rate hikes is well underway. This will be consistent with the last tightening cycle when the Fed waited until the funds rate was 1.5% before it pared the size of its securities portfolio (Chart 4). We also want to stress that the Fed will only try to reduce the size of its balance sheet. In fact, we doubt that this process will get very far. The main reason for our skepticism is that there is an ongoing structural issue in the Treasury market where the supply of securities keeps growing while stricter regulations make it more costly for primary dealers to intermediate trades.6 In this environment, there are strong odds that Treasury market liquidity will evaporate whenever there is a significant shock to financial markets. When that happens, the Fed will be forced to support Treasury market liquidity through large-scale purchases, as was the case during last March’s market turmoil (Chart 5). In essence, the likelihood of future shocks that will necessitate Fed intervention in the Treasury market makes it unlikely that the Fed will make much progress reducing the size of its balance sheet. Chart 5Fed Had To Support Treasury Market In March 2020
Fed Had To Support Treasury Market In March 2020
Fed Had To Support Treasury Market In March 2020
Market Expectations And Investment Implications We can get a sense of how our Fed timeline compares to consensus expectations by looking at the New York Fed’s Surveys of Market Participants and Primary Dealers (Tables 3A & 3B). Respondents to these surveys expect tapering to start in early 2022, in line with our expectations, though they generally see it taking longer for net purchases to fall to zero. Respondents also expect a later Fed liftoff date than we do and don’t see the Fed trying to reduce the size of its balance sheet until well after rate hikes have begun. Table 3ASurvey of Market Participants Expected Fed Timeline
A Central Bank Timeline For The Next Two Years
A Central Bank Timeline For The Next Two Years
Table 3BSurvey Of Primary Dealers Expected Fed Timeline
A Central Bank Timeline For The Next Two Years
A Central Bank Timeline For The Next Two Years
But more important for investors than survey results is what is currently priced into the yield curve. In that regard, the overnight index swap curve is priced for Fed liftoff in February 2023 and a total of 75 bps of rate hikes by the end of 2023 (Chart 6). We expect rate hikes to start earlier and proceed more quickly than that, and therefore recommend running below-benchmark duration in US bond portfolios. Chart 6Market Rate Expectations
Market Rate Expectations
Market Rate Expectations
The Timelines For Other Central Banks Policymakers outside the US are facing many of the same issues that the Fed is – rapidly recovering economies coming out of the pandemic, inflation overshoots, and surging asset prices. However, not every central bank will respond at the same time, or same pace, as the Fed. In Charts 7a and 7b, we show additional timelines for two of the most important non-Fed central banks: the European Central Bank (ECB) and the BoE. We see the likely dates and policy decisions playing out as follows. Chart 7AThe ECB’s Timeline
A Central Bank Timeline For The Next Two Years
A Central Bank Timeline For The Next Two Years
Chart 7BThe Bank Of England’s Timeline
A Central Bank Timeline For The Next Two Years
A Central Bank Timeline For The Next Two Years
European Central Bank For the ECB, the timing of its upcoming inflation strategy review is the most critical element. That report is due to be delivered in the latter half of this year, most likely in September or October (no firm release date has been announced by the ECB). It is highly unlikely that any meaningful policy changes will be implemented before that strategic review is completed. Some ECB officials have hinted that a move to a Fed-like interpretation of the ECB inflation target, tolerating overshoots of the target to make up for past undershoots, could result from the strategy review. The more likely option will be a move to an inflation target range, perhaps a 1-3% tolerance band, that offers more policy flexibility than the current target of just below 2%. This will potentially “move the goalposts” for the ECB in a way that will make monetary tightening even less likely compared to previous cycles. Looking at past ECB tightening episodes dating back to the central bank’s inception in 1998, it is clear that a majority of countries within the euro area must be seeing inflation that is high enough, with unemployment low enough, before any policy tightening can take place. Chart 8 illustrates this point, by showing “breadth” measures for unemployment and inflation across the euro area.7 Chart 8The ECB Usually Tightens When Growth AND Inflation Are Broad Based
The ECB Usually Tightens When Growth AND Inflation Are Broad Based
The ECB Usually Tightens When Growth AND Inflation Are Broad Based
Specifically, the chart shows the percentage of euro area countries with an unemployment rate below the OECD’s estimate of full employment (second panel), the percentage of euro area countries with headline inflation higher than one year earlier (third panel) and the percentage of euro area countries with headline inflation above the ECB’s 2% target (bottom panel). We compare those breadth measures to the actual path of policy interest rates and the size of the ECB’s balance sheet (top panel). The conclusion from the chart is that the euro area is still a long way from having the sort of broad-based rise in inflation or fall in unemployment necessary to trigger a reduction in the size of its balance sheet or actual interest rate hikes. Chart 9The ECB Is Under No Pressure To Tighten Pre-Emptively
The ECB Is Under No Pressure To Tighten Pre-Emptively
The ECB Is Under No Pressure To Tighten Pre-Emptively
Nonetheless, our expectation is that the ECB will want to begin preparing the markets for the end of the Pandemic Emergency Purchase Program (PEPP) - which has been buying government bonds since March 2020 in a less constrained fashion than previous asset purchase programs - shortly after the inflation strategy review is concluded. Much of the euro area economy is already showing signs of rapid recovery from pandemic induced lockdowns, amid an accelerating pace of vaccinations. On top of that, the Next Generation European Union (NGEU) recovery fund is set to begin distributing funds in the final quarter of 2021, providing a meaningful lift to government investment and expected growth in 2022. It will be difficult for the ECB to justify the need for an “emergency” program like the PEPP to continue against such a growth backdrop, especially with euro area inflation no longer at the depressed levels seen in 2020. We expect the ECB to begin preparing the market for the end of PEPP heading into the December 2021 ECB policy meeting, when it will be announced that the program will not be renewed when it expires in March 2022 (Chart 9). As always for such major policy announcements, the ECB will wish to do so when there is a new set of economic forecasts used to justify any changes. This is why December – the first meeting after the strategic review is completed that will also have new forecasts – is the earliest realistic date for an announcement on the PEPP. The communication around the PEPP announcement will need to be delicate, as the PEPP has significantly increased the ECB’s footprint in European bond markets. The share of government bonds owned by the ECB has increased by anywhere from five to ten percentage points since the PEPP began (Chart 10). We expect the ECB will be forced to expand its existing Public Sector Purchase Program (PSPP) to make up for the eventual disappearance of the PEPP. This means that the PEPP will be effectively “rolled into” the PSPP, to limit the damage from a likely post-PEPP surge in bond yields in the more fragile markets like Italy, Spain and even Greece – especially with the euro now trading close to pre-2008 highs on a trade-weighted basis (Chart 11). Chart 10The PEPP Can Expire, But Cannot Disappear
A Central Bank Timeline For The Next Two Years
A Central Bank Timeline For The Next Two Years
Chart 11ECB Must Avoid A 'PEPP Taper Tantrum'
ECB Must Avoid A 'PEPP Taper Tantrum'
ECB Must Avoid A 'PEPP Taper Tantrum'
There is a chance that the ECB will want to avoid any “PEPP taper tantrum” in Peripheral European yields (and spreads versus Germany) by making an announcement on PEPP expiry and PSPP expansion at the same meeting. If that happens, we suspect it would happen in December of this year rather than sometime in the first quarter of 2022. Beyond that, the ECB will likely seek to keep financial conditions as accommodative as possible by keeping policy interest rates unchanged well into 2023, with an actual rate hike not likely until mid-2024 at the earliest. The ECB could deliver a more modest form of “tightening” before then by letting some of the cheap bank funding programs (TLTROs) expire. Although we suspect that even those programs will need to be renewed, perhaps at less attractive financing terms, to prevent an unwanted tightening of credit conditions in the euro area banking system. Bank Of England Chart 12BoE Forecasts Are Conservative
BoE Forecasts Are Conservative
BoE Forecasts Are Conservative
Having already announced a tapering of the pace of its bond buying in early May, the BoE is likely to continue along that path over the next year. We expect the BoE, like the ECB, to make any future taper announcements when new sets of economic forecasts are published in Monetary Policy Reports. Thus, the next taper announcements are expected in August 2021, November 2021 and February 2022, with a full tapering down to zero net purchases (new buying only replacing maturing bonds) by May 2022 at the latest. The first rate hike will occur between 6-12 months after the end of tapering, possibly as early as November 2022 but, more likely in our view, sometime closer to mid-2023. The most recent set of BoE economic forecasts calls for headline UK CPI inflation to rise to 2.3% in 2022 before settling down to 2% in 2023 and 1.9% in 2024 (Chart 12). This would be a mild inflation outcome by recent UK standards during what will certainly be a period of strong post-pandemic growth over the next 12-18 months. Longer-term inflation expectations, both survey-based and extracted from CPI swaps and inflation-linked Gilts, are priced for a bigger inflation upturn above 3%. The BoE has been one of the least active central banks in the developed world since the 2008 financial crisis. The BoE main policy rate, the Bank Rate, has been no higher than 0.75% since then, even with the BoE threatening to lift rates to higher levels many times under the leadership of former Governor Mark Carney when inflation was overshooting the bank’s 2% target. Of course, the Brexit uncertainty since mid-2016 effectively tied the hands of the central bank and prevented any possible policy tightening. Now that Brexit has actually happened, however, the BoE has more flexibility to respond to developments with UK economic growth and inflation, as needed. A possible path for the UK Cash Rate was laid out in a recent speech by BoE Monetary Policy Committee (MPC) member Gertjan Vlieghe.8 He triggered a selloff across the Gilt market with his comment that a BoE rate hike could occur as early as Q2 2022 – with the Bank Rate rising to 1.25% from the current 0.1% by 2024 - under more optimistic scenarios for UK growth and employment. His base case, however, was that the coming uptick in UK inflation will prove to be temporary, but that a move towards full employment will make the first hike more likely toward the end of 2022 with modest rate increases in 2023 and 2024 that will take the Bank Rate to 0.75% (Chart 13). Chart 13Gilts Are Vulnerable To A Hawkish Surprise
Gilts Are Vulnerable To A Hawkish Surprise
Gilts Are Vulnerable To A Hawkish Surprise
Vlighe’s base case scenario on growth and interest rates is in line with the BoE’s current forecasts that call for spare capacity in the UK economy to be fully eliminated by mid-2022, with rate hikes to begin in mid-2023. That is broadly in line with our projected BoE timeline and with current pricing in the UK OIS curve, although we see risks tilted towards faster growth and inflation – and the BoE moving more aggressively than projected – over the next 12-18 months. Other Major Developed Market Central Banks Looking beyond the “Big Three” of the Fed, ECB and BoE, central bank timelines have become increasingly dependent on a single factor – the strength of domestic housing markets. House prices are booming in Canada, New Zealand and Sweden, with valuation measures like the ratio of median house prices to median incomes soaring to historical extremes according to the OECD (Chart 14). House prices are also climbing fast in the US and UK, but the valuation measures have not surpassed the peaks seen during the mid-2000s housing bubble. The housing boom has already motivated some central banks to respond by turning less dovish sooner than expected, even with unemployment rates still above pre-pandemic peaks (Chart 15).9 The BoC noted that soaring Canadian housing values motivated the taper announcement in April. The Reserve Bank of New Zealand (RBNZ) has come under political pressure over the growing unaffordability of New Zealand homes, with the government changing the central bank’s remit earlier this year to force the RBNZ to explicitly consider house price inflation when setting monetary policy. Chart 14Surging House Prices Can Turn Doves Into Hawks
Surging House Prices Can Turn Doves Into Hawks
Surging House Prices Can Turn Doves Into Hawks
Chart 15These CBs Could Turn More Hawkish Before Reaching Full Employment
These CBs Could Turn More Hawkish Before Reaching Full Employment
These CBs Could Turn More Hawkish Before Reaching Full Employment
We expect more tapering announcements from the BoC over the latter half of 2021, with a first rate hike likely sometime in the first quarter of 2022. We see the RBNZ moving aggressively, as well, tapering over the remainder of 2021 before lifting rates by the spring of 2022 at the latest. Sweden’s Riksbank will be the next central bank to turn more hawkish because of surging home values, although they will lag the pace of the BoC and RBNZ with Sweden only now beginning to emerge from lockdowns associated with a third wave of COVID-19 cases. Importantly, Australia – a country that has dealt with house price surges in the past – has seen house price valuations retreat over the past few years, even with the Reserve Bank of Australia (RBA) slashing policy rates to historic lows. The RBA also introduced yield curve control in 2020 to anchor the level of short-term bond yields, while also engaging in outright bond purchases to mitigate the rise in longer-term bond yields. With Australian inflation still remaining well below target in a year of rising global inflation, and with subdued labor costs likely to keep price pressures moderate over the next 12-18 months, we expect the RBA to move very slowly on both tapering and rate hikes. Finally, for completeness, we should note that we do not expect any policy changes from the Bank of Japan (BoJ) over the next two years, with inflation likely to remain far below the central bank’s 2% target. Non-US Investment Implications In Table 4, we show the timing of the first rate hike (i.e. “liftoff”), and the subsequent amount of total rate hikes to the end of 2024, as currently discounted in the OIS curves of the eight countries discussed in this report. We rank the countries in the table in order of liftoff dates, starting with the closest to today. Table 4The “Pecking Order” Of Central Bank Rate Hikes
A Central Bank Timeline For The Next Two Years
A Central Bank Timeline For The Next Two Years
The RBNZ is expected to hike first in May 2022, followed by the BoC (September 2022), the Fed (February 2023), the RBA (April 2023), the Riksbank (May 2023), the BoE (May 2023), the ECB (June 2023) and the BoJ (October 2025). The cumulative amount of rate hikes discounted to the end of 2024 rank similarly: more rate increases are expected in New Zealand (167bps), Canada (150bps), the US (137bps) and Australia (113bps); while fewer rate increases are expected in the Sweden (63bps), the UK (61bps), the euro area (31bps) and Japan (7bps). According to our various central bank timelines discussed in this report, we see the risks of a rate hike coming sooner than discounted by markets in the US, Canada and New Zealand. We see central banks moving slower than markets expect in the euro area and Australia, while we see Sweden and UK priced in line with our base case views (although we see risks tilted towards a more hawkish turn faster than expected in the latter two). The story is the same in terms of cumulative rate hikes discounted in OIS curves, with markets not pricing in enough rate hikes in New Zealand, Canada and the US – and, possibly, Sweden and the UK – while pricing too many hikes in Australia and the euro area. This leads us to recommend the following country allocations in a global government bond portfolio: Underweight the US, Canada and New Zealand Overweight Australia and core Europe (and Japan) Neutral Sweden and the UK, but with a bias to downgrade. Ryan Swift US Bond Strategist rswift@bcaresearch.com Robert Robis, CFA Chief Fixed Income Strategist rrobis@bcaresearch.com Footnotes 1 Please see The Bank Credit Analyst June 2021 Monthly Report, "Global House Prices: A New Threat For Policymakers", dated May 27, 2021. 2 Please see US Bond Strategy Weekly Report, “Lower For Longer, Then Faster Than You Think”, dated May 25, 2021. 3 https://www.federalreserve.gov/newsevents/speech/quarles20210526b.htm 4 https://ca.news.yahoo.com/federal-reserve-vice-chair-richard-clarida-yahoo-finance-transcript-may-2021-173007192.html 5 https://www.federalreserve.gov/newsevents/speech/waller20210513a.htm 6 For a longer discussion of Treasury market liquidity issues please see US Investment Strategy / US Bond Strategy Special Report, “Alphabet Soup 2: Shocked And Awed”, dated July 28, 2020. 7 For more details, please see Global Fixed Income Strategy Report, “ECB Outlook: Walking On Eggshells”, dated May 19, 2021. 8 The full speech can be found here: https://www.bankofengland.co.uk/speech/2021/may/gertjan-vlieghe-speech-hosted-by-the-department-of-economics-and-the-ipr 9 For more details on the global housing boom, see Global Fixed Income Strategy Special Report, “Global House Prices: A New Threat For Policymakers”, dated May 28, 2021. Fixed Income Sector Performance Recommended Portfolio Specification