Policy

Highlights House prices are rising rapidly across the developed markets, in response to the extraordinary monetary and fiscal policy stimulus implemented to fight the pandemic. Evidence points to the house price surge being driven by monetary policy that has left real interest rates far below equilibrium levels. Supply factors are a secondary cause of the house price boom. Financial stability risks stemming from rising house prices are less acute than the pre-2008 experience, as overall household leverage has grown more slowly during the pandemic and global banks are better capitalized. Rapidly rising house prices are forcing some central banks to turn less accommodative earlier than expected. The recent hawkish turns by the Bank of Canada and Reserve Bank of New Zealand may be canaries in the coal mine for other central banks – perhaps even the Fed – if house prices and household leverage start rising together. Feature The COVID-19 pandemic led to the sharpest economic recession since World War II, alongside an enormous rise in unemployment. Consensus expectations call for the output gap to be closed (or mostly closed) in most advanced economies by the end of this year, but it remains an open question how quickly these economies will be able to return to full employment amid potentially permanent shifts in demand for office space and goods sold at physical, “brick and mortar” retail locations. Despite this sizeable and swift economic shock, house price appreciation accelerated last year in the developed world. Chart 1 highlights that US house prices rose at an 18% annualized pace in the second half of 2020, whereas they accelerated at a high-single digit pace in developed markets ex-US (on a GDP-weighted basis). This, in conjunction with a sharp rise in the household sector credit-to-GDP ratio (Chart 2), has unnerved some investors while raising questions about the implications for monetary policy. Chart 1House Prices Are Surging Around The World
House Prices Are Surging Around The World
House Prices Are Surging Around The World
Chart 2Rising Fears About Deteriorating Household Balance Sheets
Rising Fears About Deteriorating Household Balance Sheets
Rising Fears About Deteriorating Household Balance Sheets
Before we discuss the investment implications of the global housing boom, however, we must first accurately determine the reasons why it is happening. The Work-From-Home Effect: Less Than Meets The Eye When analyzing the surprising behavior of the housing market last year, the working-from-home effect brought upon by the pandemic emerges as an obvious factor potentially explaining house price gains. Last year, following recommended or mandatory stay-at-home orders from governments, most office-based businesses rapidly shifted to work-from-home arrangements as an emergency response. However, in the month or two following the beginning of stay-at-home orders, several national US surveys found many office workers preferred the flexibility afforded by work-from-home arrangements. Many employers, correspondingly, found that the productivity of their employees did not suffer while working from home, or that it even improved. Several prominent corporations in the US have subsequently made some work-from-home options permanent, or even allowed employees to work from offices in a different city than they did prior to the pandemic. Newfound work-from-home options have undoubtedly created new demand for housing, and thus explained the surge in house prices seen over the past year in the minds of some investors. However, in our view, evidence from the US, the UK, and France suggests that the work-from-home effect better explains differences in price gains across housing types and within large metropolitan areas, rather than aggregate or national-level changes in house prices. Chart 3 provides some quantification of the impact of work-from-home policies by plotting US resident migration patterns by city. This data has been compiled by CBRE, and the impact of COVID is shown as the change in net move-ins from 2019 to 2020 per 1000 people. This helps control for the underlying migration pattern that existed in US cities prior to the pandemic. Chart 3Work From Home Policies Have Impacted Migration Trends…
Global House Prices: A New Threat For Policymakers
Global House Prices: A New Threat For Policymakers
The chart highlights that the negative migration impact from COVID has been mostly concentrated in New York City and the three most populous cities on the West Coast (by metro area): Los Angeles, San Francisco, and Seattle. And yet, Chart 4 highlights that house price inflation in these four cities has accelerated to a double-digit pace, only modestly below the national average. Chart 4...But Cities With Outward Migration Still Have Very Strong House Price Gains
...But Cities With Outward Migration Still Have Very Strong House Price Gains
...But Cities With Outward Migration Still Have Very Strong House Price Gains
The house price indexes shown in Chart 4 represent aggregate, metro area trends, and clearly some regions within these metro areas have experienced house price deceleration or outright deflation versus gains in areas outside the urban core. But Chart 5 highlights that house prices have declined in Manhattan basically in line with the change in net move-ins as a share of the population, underscoring that double-digit metro area-wide house price gains appear to be vastly disproportionate to changes in net migration. Similarly, Chart 6 highlights that rents decelerated in the US over the past year but remained in positive territory and grew at a 3.5% annualized rate from February to April. Chart 5In Manhattan, House Prices Have Tracked Net Migration
Global House Prices: A New Threat For Policymakers
Global House Prices: A New Threat For Policymakers
Chart 6Rent Costs Have Decelerated, But Have Not Contracted
Rent Costs Have Decelerated, But Have Not Contracted
Rent Costs Have Decelerated, But Have Not Contracted
Evidence from Paris and London also suggests that a work-from-home effect is insufficient to explain broad house price gains. Panel 1 of Chart 7 highlights that house prices in France have accelerated significantly, but that apartment prices have decelerated only fractionally in lockstep. Panel 2 shows that the acceleration in house prices does reflect a work-from-home effect, as prices have risen faster in inner Parisian suburbs. Panel 3, however, highlights that Parisian apartment prices, the dominant property type in the urban core, have decelerated modestly. Chart 8 highlights that house price gains have not even decelerated in greater London; they have been merely been modestly outstripped by gains in Outer South East (outside of the Outer Metropolitan Area). Chart 7In France, Parisian Apartment Prices Are Simply Lagging, Not Falling
In France, Parisian Apartment Prices Are Simply Lagging, Not Falling
In France, Parisian Apartment Prices Are Simply Lagging, Not Falling
Chart 8In The UK, Greater London Property Prices Are Accelerating
In The UK, Greater London Property Prices Are Accelerating
In The UK, Greater London Property Prices Are Accelerating
The Policy Effect: The Fundamental Driver Of The Housing Market Despite the broader location flexibility that work-from-home policies now provide to potential homeowners, it seems inconceivable that the housing market would have responded in the manner that it has over the past year given the size of the economic shock brought on by the pandemic without significant support from policy. Above-the-line fiscal measures to the pandemic have totaled in the double-digits in advanced economies (Chart 9), and monetary policy has contributed to easier financial conditions via rate cuts, asset purchases, and sizeable programs to support financial market liquidity. Chart 9There Has Been A Massive Fiscal Policy Response To The Crisis
Global House Prices: A New Threat For Policymakers
Global House Prices: A New Threat For Policymakers
In fact, Charts 10-13 present compelling evidence that fiscal and monetary policy have been the core drivers of significant house price gains over the past year. Charts 10 and 11 plot the above-the-line fiscal response of advanced economies against the year-over-year growth rate in house prices as well as its acceleration (the change in the year-over-year growth rate). The charts show a clearly positive relationship, with a stronger link between the pandemic fiscal response and the acceleration in house prices. Chart 10Differences In Last Year’s Fiscal Response…
June 2021
June 2021
Chart 11…Help Explain Differences In House Price Gains
June 2021
June 2021
Chart 12Pre-Pandemic Differences In The Monetary Policy Stance…
June 2021
June 2021
Chart 13…Do An Even Better Job Of Explaining 2020 House Price Gains
June 2021
June 2021
Charts 12 and 13 highlight the even stronger link between house prices and the pre-pandemic monetary policy stance in advanced economies, defined as the difference between each country’s 2-year government bond yield and its Taylor Rule-implied policy interest rate as of Q4 2019. We construct each country’s Taylor Rule using the original specification, with core consumer price inflation, a 2% inflation target, and real potential GDP growth as the definition of the real equilibrium interest rate. The charts make it clear that easy monetary policy strongly explains house price gains in 2020, particularly the year-over-year percent change rather than its acceleration. This makes sense, given that monetary policy was already quite easy in many countries at the onset of the pandemic – meaning that changes were less pronounced than they would have been had interest rates been higher. The explanation that emerges from Charts 10-13 is that historic fiscal easing, combined with an easy starting point for monetary policy – that became even easier last year – enabled demand from work-from-home policies to manifest during an extremely severe recession. We agree that work-from-home policies have shifted the geographic preferences of some home buyers and likely provided a new source of net demand from renters in urban cores purchasing homes in outlying areas. But we strongly doubt that the net effect of work-from-home policies in the midst of an extreme shock to economic activity would have caused the rise in house prices that we have observed, certainly not to this level, without major support from policy. This underscores that policy, and not the work-from-home effect, has and will likely remain the core driver of the global housing market. The Supply Effect: Mostly A Red Herring Chart 14Countries Fall Into Two Groups In Terms Of The Relative Trend In Real Residential Investment
Countries Fall Into Two Groups In Terms Of The Relative Trend In Real Residential Investment
Countries Fall Into Two Groups In Terms Of The Relative Trend In Real Residential Investment
One perennial question that emerges when analyzing the housing market, particularly in markets with outsized house price gains, is the impact of constrained supply. It is frequently argued that constrained supply is squeezing prices higher in many markets, and that the appropriate policy solution to extreme house price gains is to enable widespread housing construction – not to raise interest rates. We do not rule out the potential impact of constrained supply in certain cities or regional housing markets, and we have highlighted in previous research that a positive relationship does exist between population density in urban regions and median house price-to-income ratios.1 But as a broad explanation for supercharged house price gains, the supply argument appears to fall flat. Chart 14 presents the most standardized measure of cross-country housing supply available for several advanced economies, the trend in real residential investment relative to real GDP over time. These series are all rebased to 100 as of 1997, prior to the 2002-2007 US housing market boom. The chart makes it clear that advanced economies generally fall into two groups based on this metric: those that have seen declines in real residential investment relative to GDP, especially after the global financial crisis (panel 1), and those that have experienced either an uptrend in housing construction relative to output or have seen a flat trend (panel 2). If scarce housing supply was the core driver of outsized house price gains, then we would expect to see stronger gains in the countries shown in panel 1 and smaller gains in the countries shown in panel 2. In fact, mostly the opposite is true: Charts 15 and 16 highlight that the relationship between the level of these indexes today relative to their 1997 or 2005 levels is positively related to the magnitude of house price gains last year, suggesting that housing market supply has generally been responding to demand over the past decade. The US and possibly New Zealand stand as possible exceptions to the trend, suggesting that relatively scarce supply may be boosting prices even further in these markets beyond what fiscal and monetary policy would suggest. Chart 15Countries That Have Seen A Stronger Pace Of Residential Investment…
June 2021
June 2021
Chart 16…Have Experienced Stronger House Price Gains
June 2021
June 2021
Chart 17Is This Not Enough Supply, Or Too Much Demand?
Global House Prices: A New Threat For Policymakers
Global House Prices: A New Threat For Policymakers
As a final point about the inclination of investors to gravitate towards supply-side arguments related to the housing market, Chart 17 presents a simple thought experiment. The chart shows a simple housing supply-demand curve diagram, in a scenario where the demand curve for housing has shifted out more than the supply curve has (thus raising house prices). Is this a scenario in which supply is too tight? Or is it a case in which demand is too strong? In our view, the tight supply answer is reasonable in circumstances where the increase in demand is normal or otherwise sustainable. But Charts 10-13 clearly showed that housing demand is being boosted by easy policy, which in the case of some countries has occurred for years: interest rates have remained well below levels that macroeconomic theory would traditionally consider to be in equilibrium, and this has occurred alongside significant household sector leveraging (Chart 18). As such, in our view, investors should be more inclined to view the global housing market as generally being driven by demand-side rather than supply-side factors. This Is Not 2007/08 … Yet We highlighted in Chart 2 above that the household sector debt-to-GDP ratio increased sharply last year, which has raised some questions about debt sustainability among investors. For the most part, the rise in this ratio actually reflects denominator effects (namely a sharp contraction in nominal GDP) rather than a huge surge in household debt. Chart 19 shows BIS data for the annual growth in total household debt in developed economies was roughly stable last year, at least until Q3 (the most recent datapoint available from the BIS). Chart 18Low Interest Rtaes Have Fueled Household Leveraging
Low Interest Rtaes Have Fueled Household Leveraging
Low Interest Rtaes Have Fueled Household Leveraging
Chart 19Total Credit Growth Has Been Stable, But Mortgage Credit Growth Is Accelerating
Total Credit Growth Has Been Stable, But Mortgage Credit Growth Is Accelerating
Total Credit Growth Has Been Stable, But Mortgage Credit Growth Is Accelerating
Chart 20US Mortgage Growth Is Picking Up, As Repayments Slow Consumer Credit Growth
US Mortgage Growth Is Picking Up, As Repayments Slow Consumer Credit Growth
US Mortgage Growth Is Picking Up, As Repayments Slow Consumer Credit Growth
But Chart 19 shows the recent trend in total household debt, which masks diverging mortgage and non-mortgage debt trends. In the US, euro area, Canada, and Sweden, household mortgage debt has accelerated to varying degrees, underscoring that households have likely paid down non-mortgage debt with some of the savings that they have accumulated from a significant reduction in spending on services. Chart 20 shows this effect directly in the case of the US; mortgage debt growth accelerated by roughly 1.5 percentage points in the second half of the year, whereas consumer credit growth (made up of student loans, auto loans, credit cards, and other revolving credit) decelerated significantly. This aligns with data showing that US households have used some of their savings windfall to pay down their credit card balances. This changing mix within household debt - less higher-interest-rate consumer credit, more lower-interest-rate collateralized mortgage debt – could, on the margin, help mitigate financial stability risks from the housing boom by moderating overall debt service burdens. The starting point for the latter matters, though, in accurately assessing the risks from rising house prices and increased mortgage debt, particularly in countries where household debt levels are already high. According to data from the BIS, the US already has one of the lowest household debt service ratios (7.6%) among the developed economies (Chart 21).2 This compares favorably to the double-digit debt service ratios in the “higher-risk” countries like Canada (12.6%), Sweden (12.1%) and Norway (16.2%). On top of that, US commercial banks have become far more prudent with mortgage loan underwriting standards since the 2008 financial crisis. The New York Fed’s Household Debt and Credit report shows that an increasing majority of mortgage lending made by US banks since the 2008 crisis has been to those with very high FICO credit scores (Chart 22). This is in sharp contrast to the steady lending to “subprime” borrowers with poor credit scores that preceded the 2008 financial crisis. The median FICO score for new mortgage originations as of Q1 2021 was 788, compared to 707 in Q4 2006 at the peak of the mid-2000s US housing boom. Chart 21Diverging Trends In Global Household Debt Servicing Costs
Diverging Trends In Global Household Debt Servicing Costs
Diverging Trends In Global Household Debt Servicing Costs
Chart 22US Banks Have Become More Prudent With Mortgage Lending
US Banks Have Become More Prudent With Mortgage Lending
US Banks Have Become More Prudent With Mortgage Lending
US bank balance sheets are also now less directly exposed to a fall in housing values. Residential loans now represent only 10% of the assets on US bank balance sheets, compared to 20% at the peak of the last housing bubble (Chart 23). This puts the US in the “lower-risk” group of countries in Europe, the UK and Japan where mortgages are less than 20% of bank balance sheets. This compares favorably to the “higher risk” group of countries where residential loans are a far larger share of bank assets (Chart 24), like Canada (32%), New Zealand (49%), Sweden (45%) and Australia (40%). Chart 23Banks Have Limited Direct Exposure To Housing Here
Banks Have Limited Direct Exposure To Housing Here
Banks Have Limited Direct Exposure To Housing Here
Chart 24Banks Are Far More Exposed To Housing Here
Banks Are Far More Exposed To Housing Here
Banks Are Far More Exposed To Housing Here
Like nature, however, the financial ecosystem abhors a vacuum. “Non-bank” mortgage lenders have filled the void from traditional US banks reducing their lending to lower-quality borrowers, and they now represent around two-thirds of all US mortgage origination, a big leap from the 20% origination share in 2007. Non-bank lenders have also taken on growing shares of new mortgage origination in other countries like the UK, Canada and Australia. Chart 25Global Banks Can Withstand A Housing Shock
Global House Prices: A New Threat For Policymakers
Global House Prices: A New Threat For Policymakers
Non-bank lenders do not take deposits and typically fund themselves via shorter-term borrowings, which raises the potential for future instability if credit markets seize up. These lenders also, on average, service mortgages with a higher probability of default, so they are exposed to greater credit losses when house prices decline. However, the risk of a full-blown 2008-style commercial banking crisis, with individual depositors’ funds at risk from a bank failure, are reduced with a greater share of riskier mortgage lending conducted by non-bank entities. This is especially true with global commercial banks far better capitalized today, with double-digit Tier 1 capital ratios (Chart 25), thanks to regulatory changes made after the Global Financial Crisis. Net-net, we conclude that the overall financial stability implications of the current surge in house prices in the developed economies are relatively modest on average. The acceleration in mortgage growth has occurred alongside reductions in non-mortgage growth, at a time when banks are better able to withstand a shock from any sustained future downturn in house prices. However, if house prices continue to accelerate and new homebuyers are forced to take on ever increasing amounts of mortgage debt, financial stability issues could intensify in some countries. Services spending will recover in a vaccinated post-COVID world, as economies reopen and consumer confidence improves, which will likely end the trend of falling non-residential consumer debt offsetting rising mortgage debt in countries like the US and Canada. Overall levels of household debt could begin to rise again relative to incomes, building up future financial stability risks when central banks begin to normalize pandemic-related monetary policies – a process that has already started in some countries because of the housing boom. The Monetary Policy Implications Of Surging House Prices Rapidly appreciating house prices are becoming an area of concern for policymakers in countries like Canada and New Zealand, where the affordability of housing is becoming a political, as well as an economic, issue. In the case of New Zealand, the government has actually altered the remit of the Reserve Bank of New Zealand (RBNZ) to more explicitly factor in the impact of monetary policy on housing costs. The Bank of Canada announced in April that it would taper its pace of government debt purchases and signaled that its decision was based, at least in small part, on signs of speculative behavior in Canada’s housing market. Macroprudential measures like limiting loan-to-value ratios of new mortgage loans are a policy option that governments in those countries have already implemented to try and cool off housing demand. Yet while such measures can help alleviate demand-supply mismatches in certain cities and regions, the efficacy of such measures in sustainably slowing the ascent of house prices on a national scale is unclear. In the April 2021 IMF Global Financial Stability Report, researchers estimated that, for a broad group of countries, the implementation of a new macro-prudential measure designed to cool loan demand reduced national household debt/GDP ratios by a mere one percentage point, on average, over a period encompassing four years.3 If macroprudential measures are that ineffective in sustainably reducing demand for mortgage loans, then the burden of slowing house price appreciation will have to fall on the more blunt instruments of monetary policy. Importantly, surging house price inflation is not likely to give a boost to realized inflation measures – an important issue given the current backdrop of rapidly rising realized inflation rates in many countries. Housing costs do represent a significant portion of consumer price indices in many developed countries, ranging from 19% in New Zealand to 33% in the US (Chart 26), with the euro area being the outlier with housing having a mere 2% weighting in the headline inflation index. Chart 26A Limited Impact On Actual Inflation From Housing
June 2021
June 2021
Yet those so-called “housing” categories overwhelmingly measure only housing rental costs and not actual house prices. This is an important distinction because rents – which are often imputed measures like in the US and not even actual rental costs - are rising at a far slower pace than actual house prices in most countries, so the housing contribution to realized inflation is relatively modest. So the good news is that booming house prices will not worsen the acceleration of realized global inflation that has concerned investors and policymakers in 2021. Yet that does not mean that central bankers will not be forced to tighten policy to cool off red-hot housing demand that is clearly being fueled by persistently negative real interest rates. In Chart 27 and Chart 28, we show both nominal and real policy interest rates for the “lower risk” and “higher risk” country groupings that we described earlier. The real policy rates are nominal policy rates versus realized headline CPI inflation. The dotted lines in the charts represent the future path of rates discounted by markets. Specifically, the projection for nominal rates is taken from overnight index swap (OIS) forward curves, while the projection for real rates is calculated by subtracting the discounted path of inflation expectations extracted from CPI swap forwards. Chart 27Markets Discounting Negative Real Rates For The Next Decade
Markets Discounting Negative Real Rates For The Next Decade
Markets Discounting Negative Real Rates For The Next Decade
Chart 28Negative Real Rates Are Unsustainable During A Housing Bubble
Negative Real Rates Are Unsustainable During A Housing Bubble
Negative Real Rates Are Unsustainable During A Housing Bubble
There are two key takeaways from these charts: Real policy interest rates are at or very close to the most deeply negative levels seen since the 2008 financial crisis. Markets are discounting that real rates will be at or below 0% for most of the next decade. Admittedly, there is room for debate over what the equilibrium level of real interest rates (a.k.a. “r-star”) should be in the coming years. However, we deem it a major stretch to believe that real rates need to be persistently low or negative for the next ten years to support even trend growth across the developed economies. In our view, the current boom in housing demand and mortgage borrowing provides clear evidence that negative real rates are below equilibrium and, thus, are stimulating credit demand. Thus, the only way for a central bank to cool off housing demand will be to raise both nominal and, more importantly, real interest rates. Canada and New Zealand will be the “canaries in the coal mine” among developed market central banks for such a move. According to the latest Bank of Canada Financial Stability Review, nearly 22% of Canadian mortgages are highly levered, with a loan-to-value ratio greater than 450%, a greater share of such mortgages than during the 2016/17 housing boom (Chart 29). Canadian house prices have risen to such an extent that home prices in major cities like Toronto, Vancouver and Montreal are among the most expensive in North America.4 Stunningly, a recent Bloomberg Nanos opinion poll revealed that nearly 50% of Canadians would support Bank of Canada rate hikes to cool off the red-hot housing market (Chart 30). The central bank will be unable to resist the pressure to use monetary policy to slam on the brakes of the housing market – investors should expect more tapering and, eventually, rate hikes from the Bank of Canada over at least the next couple of years. Chart 29Canadians Are Leveraging Up To Buy Expensive Homes
Canadians Are Leveraging Up To Buy Expensive Homes
Canadians Are Leveraging Up To Buy Expensive Homes
Chart 3050% Of Canadians Want A Rate Hike To Cool Housing
June 2021
June 2021
In New Zealand, worsening housing affordability has reached a point where a 20% down payment on the median national house price is equal to 223% of median disposable income (Chart 31). This is forcing more first-time home buyers to take on levels of mortgage debt that the RBNZ deems highly risky (top panel). Like the Bank of Canada, the RBNZ will prove to be one of the most hawkish central banks in the developed world over the next couple of years as the central bank follows their newly-revised remit to try and cool off housing demand in New Zealand. Who is next? Housing values, measured by the ratio of median national house prices to median national household incomes, are rising in the US and UK but are still below the peaks of the mid-2000s housing bubble (Chart 32). Meanwhile, housing is becoming more expensive across the euro area, but not in a consistent manner, with valuations in Germany and Spain having increased far more than in France or Italy. Housing valuations have actually improved in Australia over the past couple of years on a price-to-income basis. The most likely candidates for a housing-related hawkish turn are in Scandinavia, with housing valuations in Sweden and Norway closing in on Canada/New Zealand levels. Chart 31New Zealand Housing Is Wildly Unaffordable
New Zealand Housing Is Wildly Unaffordable
New Zealand Housing Is Wildly Unaffordable
Chart 32Global House Price/Income Ratios Are Trending Higher
Global House Price/Income Ratios Are Trending Higher
Global House Price/Income Ratios Are Trending Higher
Investment Conclusions The current acceleration in global house prices is an inevitable outcome of the extraordinary monetary and fiscal easing implemented during the pandemic. Higher realized inflation is pushing real rates deeper into negative territory in many countries, fueling the demand for housing. Central banks in countries with more stretched housing valuations will be forced to turn more hawkish sooner than expected, leading to tapering and, eventually, rate hikes to cool housing demand. This has negative implications for government bond markets in countries where housing is more expensive and real yields remain too low, like Canada, New Zealand and Sweden (Chart 33). Investors should limit exposure to government bonds in those markets over the next 6-12 months. Chart 33Negative Real Yields & Expensive Housing Valuations – An Unsustainable Mix
June 2021
June 2021
Bond markets in countries where house prices are not rising rapidly enough to force policymakers to turn more hawkish more quickly – like core Europe, Australia and even Japan - are likely to be relative outperformers. The US and UK are “cuspy” bond markets, as housing valuations are becoming more expensive in those two countries but the Fed and Bank of England are not facing the same domestic political pressure to use monetary policy tools to fight the growing unaffordability of housing. That could change, though, if overall household leverage begins to rise alongside house price inflation as the US and UK economies emerge from the pandemic. Current pricing in OIS curves shows that markets expect the RBNZ and Bank of Canada to begin hiking rates in May 2022 and September 2022, respectively (Table 1). This is well ahead of expectations for “liftoff” from other developed markets central banks, including the Fed in April 2023. The cumulative amount of rate hikes following liftoff to the end of 2024 is highest in Canada, New Zealand, the US and Australia. Those are also countries with currencies that are trading at or above the purchasing power parity levels derived from our currency strategists’ valuation models. This highlights the difficult choice that central bankers facing housing bubbles must confront, as the rate hikes that will help cool off housing demand will lead to currency appreciation that could impact other parts of their economies like exports and manufacturing. Table 1Hawkish Central Banks Must Live With Currency Strength
Global House Prices: A New Threat For Policymakers
Global House Prices: A New Threat For Policymakers
Tracking the second-round economic consequences of eventual monetary policy actions to control excessive house price inflation, particularly in “higher risk” countries, is likely to be the subject of future Bank Credit Analyst / Global Fixed Income Strategy reports. Robert Robis, CFA Chief Fixed Income Strategist Jonathan LaBerge, CFA Vice President The Bank Credit Analyst Footnotes 1 Please see Global Investment Strategy "Canada: A (Probably) Happy Moment In An Otherwise Sad Story," dated July 14, 2017, available at gis.bcaresearch.com 2 Importantly, the BIS debt service ratios include the payment of both principal and interest, thus making it a true measure of debt service costs that includes repayment of borrowed funds – a critical issue in countries with high loan-to-value ratios for home mortgages. 3 Please see page 46 of Chapter 2 of the April 2021 IMF Global Financial Stability Report, which can be found here: https://www.imf.org/en/Publications/GFSR/Issues/2021/04/06/global-financial-stability-report-april-2021 4 “Vancouver, Toronto and Hamilton are the least affordable cities in North America: report”, CBC News, May 20, 2021
Highlights President Biden has called for the US intelligence community to investigate the origins of COVID-19 and one of Biden’s top diplomats has stated the obvious: the era of “engagement” with China is over. This clinches our long-held view that any Democratic president would be a hawk like President Trump. The US-China conflict – and global geopolitical risk – will revive and undermine global risk appetite. China faces a confluence of geopolitical and macroeconomic challenges, suggesting that its equity underperformance will continue. Domestic Chinese investors should stay long government bonds. Foreign investors should sell into the bond rally to reduce exposure to any future sanctions. The impending agreement of a global minimum corporate tax rate has limited concrete implications that are not already known but it symbolizes the return of Big Government in the western world. Our updated GeoRisk Indicators are available in the Appendix, as well as our monthly geopolitical calendar. Feature In our quarterly webcast, “Geopolitics And Bull Markets,” we argued that geopolitical themes matter to investors when they have a demonstrable relationship with the macroeconomic backdrop. When geopolitics and macro are synchronized, a simple yet powerful investment thesis can be discerned. The US war on terror, Russia’s resurgence, the EU debt crisis, and Brexit each provided cases in which a geopolitically informed macro view was both accessible and actionable at an early stage. Investors generally did well if they sold the relevant country’s currency and disfavored its equities on a relative basis. Chart 1China's Decade Of Troubles
China's Decade Of Troubles
China's Decade Of Troubles
Of course, the market takeaway is not always so clear. When geopolitics and macroeconomics are desynchronized, the trick is to determine which framework will prevail over the financial markets and for how long. Sometimes the market moves to its own rhythm. The goal is not to trade on geopolitics but rather to invest with geopolitics. One of our key views for this year – headwinds for China – is an example of synchronization. Two weeks ago we discussed China’s macroeconomic challenge. In this report we discuss China’s foreign policy challenge: geopolitical pressure from the US and its allies. In particular we address President Biden’s call for a deeper intelligence dive into the origins of COVID-19. The takeaway is negative for China’s currency and risk assets. The Great Recession dealt a painful blow to the Chinese version of the East Asian economic miracle. By 2015, China’s financial turmoil and currency devaluation should have convinced even bullish investors to keep their distance from Chinese stocks and the renminbi. If investors stuck with this bearish view despite the post-2016 rally, on fear of trade war, they were rewarded in 2018-19. Only with China’s containment of COVID-19 and large economic stimulus in 2020 has CNY-USD threatened to break out (Chart 1). We expect the renminbi to weaken anew, especially once the Fed begins to taper asset purchases. Our cyclical view is still bullish but US-China relations are unstable so we remain tactically defensive. Forget Biden’s China Review, He’s A Hawk Chinese financial markets face a host of challenges this year, despite the positive factors for China’s manufacturing sector amid the global recovery. At home these challenges consist of a structural economic slowdown, a withdrawal of policy stimulus, bearish sentiment among households, and an ongoing government crackdown on systemic risk. Abroad the Democratic Party’s return to power in Washington means that the US will bring more allies to bear in its attempt to curb China’s rise. This combination of factors presents a headwind for Chinese equities and a tailwind for government bonds (Chart 2). This is true at least until the government should hit its pain threshold and re-stimulate. Chart 2Global Investors Still Wary
Global Investors Still Wary
Global Investors Still Wary
New stimulus may not occur in 2022. The Communist Party’s leadership rotation merely requires economic stability, not rapid growth. While the central government has a record of stimulating when its pain threshold is hit, even under the economically hawkish President Xi Jinping, a financial market riot is usually part of this threshold. This implies near-term downside, particularly for global commodities and metals, which are also facing a Chinese regulatory backlash to deter speculation. In this context, President Biden’s call for a deeper US intelligence investigation into the origin of COVID-19 is an important confirming signal of the US’s hawkish turn toward China. Biden gave 90 days for the intelligence community to report back to him. We will not enter into the debate about COVID-19’s origins. From a geopolitical point of view it is a moot point. The facts of the virus origin may never be established. According to Biden’s statement, at least one US intelligence agency believes the “lab leak theory” is the most likely source of the virus (while two other agencies decided in favor of animal-to-human transmission). Meanwhile Chinese government spokespeople continue to push the theory that the virus originated at the US’s Fort Detrick in Maryland or at a US-affiliated global research center. What is certain is that the first major outbreak of a highly contagious disease occurred in Wuhan. Both sides are demanding greater transparency and will reject each other’s claims based on a lack of transparency. If the US intelligence report concludes that COVID originated from the Wuhan Institute of Virology, the Chinese government and media will reject the report. If the report exonerates the Wuhan laboratory, at least half of the US public will disbelieve it and it will not deter Biden from drawing a hard line on more macro-relevant policy disputes with China. The US’s hawkish bipartisan consensus on China took shape before COVID. Biden’s decision to order the fresh report introduces skepticism regarding the World Health Organization’s narrative, which was until now the mainstream media’s narrative. Previously this skepticism was ghettoized in US public discourse: indeed, until Biden’s announcement on May 26, the social media company Facebook suppressed claims that the virus came from a lab accident or human failure. Thus Biden’s action will ensure that a large swathe of the American public will always tend to support this theory regardless of the next report’s findings. At the same time Biden discontinued a State Department effort to prove the lab leak theory, which shows that it is not a foregone conclusion what his administration will decide. The good news is that even if the report concluded in favor of the lab leak, the Biden administration would remain highly unlikely to demand that China pay “reparations,” like the Trump administration demanded in 2020. This demand, if actualized, would be explosive. The bad news is that a future nationalist administration could conceivably use the investigation as a basis to demand reparations. Nationalism is a force to be reckoned with in both countries and the dispute over COVID’s origin will exacerbate it. Traditionally the presidents of both countries would tamp down nationalism or attempt to keep it harnessed. But in the post-Xi, post-Trump era it is harder to control. The death toll of COVID-19 will be a permanent source of popular grievance around the world and a wedge between the US and China (Chart 3). China’s international image suffered dramatically in 2020. So far in 2021 China has not regained any diplomatic ground. Chart 3Death Toll Of COVID-19
Biden Confirmed As A China Hawk (GeoRisk Update)
Biden Confirmed As A China Hawk (GeoRisk Update)
The US is repairing its image via a return to multilateralism while the Europeans have put their Comprehensive Agreement on Investment with China on hold due to a spat over sanctions arising from western accusations of genocide (a subject on which China pointedly answered that it did not need to be lectured by Europeans). Notably Biden’s Department of State also endorsed its predecessor’s accusation of genocide in Xinjiang. Any authoritative US intelligence review that solidifies doubts about the WHO’s initial investigation – even if it should not affirm the lab leak theory – would give Biden more ammunition in global opinion to form a democratic alliance to pressure China (for example, in Europe). An important factor that enables the US to remain hawkish on China is fiscal stimulus. While stimulus helps bring about economic recovery, it also lowers the bar to political confrontation (Chart 4). Countries with supercharged domestic demand do not have as much to fear from punitive trade measures. The Biden administration has not taken new punitive measures against China but it is clearly not worried about Chinese retaliation. Chart 4Large Fiscal Stimulus Lowers The Bar To Geopolitical Conflict
Biden Confirmed As A China Hawk (GeoRisk Update)
Biden Confirmed As A China Hawk (GeoRisk Update)
China’s stimulus is underrated in this chart (which excludes non-fiscal measures) but it is still true that China’s policy has been somewhat restrained and it will need to stimulate its economy again in response to any new punitive measures or any global loss of confidence. At least China is limited in its ability to tighten policy due to the threat of US pressure and western trade protectionism. Simultaneous with Biden’s announcement on COVID-19, his administration’s coordinator for Indo-Pacific affairs, Kurt Campbell, proclaimed in a speech that the era of “engagement” with China is officially over and the new paradigm is one of “competition.” By now Campbell is stating the obvious. But this tone is a change both from his tone while serving in President Obama’s Department of State and from his article in Foreign Affairs last year (when he was basically auditioning for his current role in the Biden administration).1 Campbell even said in his latest remarks that the Trump administration was right about the “direction” of China policy (though not the “execution”), which is candid. Campbell was speaking at Stanford University but his comments were obviously aimed for broader consumption. Investors no longer need to wait for the outcome of the Biden administration’s comprehensive review of policy toward China. The answer is known: the Biden administration’s hawkishness is confirmed. The Department of Defense report on China policy, due in June, is very unlikely to strike a more dovish posture than the president’s health policy. Now investors must worry about how rapidly tensions will escalate and put a drag on global sentiment. Bottom Line: US-China relations are unstable and pose an immediate threat to global risk appetite. The fundamental geopolitical assessment of US-China relations has been confirmed yet again. The US is seeking to constrain China’s rise because China is the only country capable of rivaling the US for supremacy in Asia and the world. Meanwhile China is rejecting liberalization in favor of economic self-sufficiency and maintaining an offensive foreign policy as it is wary of US containment and interference. Presidents Biden and Xi Jinping are still capable of stabilizing relations in the medium term but they are unlikely to substantially de-escalate tensions. And at the moment tensions are escalating. China’s Reaction: The Example Of Australia How will China respond to Biden’s new inquiry into COVID’s origins? Obviously Beijing will react negatively but we would not expect anything concrete to occur until the result of the inquiry is released in 90 days. China will be more constrained in its response to the US than it has been with Australia, which called for an international inquiry early last year, as the US is a superior power. Australia was the first to ban Chinese telecom company Huawei from its 5G network (back in 2018) and it was the first to call for a COVID probe. Relations between China and Australia have deteriorated steadily since then, but macro trends have clearly driven the Aussie dollar. The AUD-JPY exchange rate is a good measure for global risk appetite and it is wavering in recent weeks (Chart 5). Chart 5Australian Dollar Follows Macro Trends, Rallies Amid China Trade Spat
Australian Dollar Follows Macro Trends, Rallies Amid China Trade Spat
Australian Dollar Follows Macro Trends, Rallies Amid China Trade Spat
Tensions have also escalated due to China’s dependency on Australian commodity exports at a time of spiking commodity prices. This is a recurring theme going back to the Stern Hu affair. The COVID spat led China to impose a series of sanctions against Australian beef, barley, wine, and coal. But because China cannot replace Australian resources (at least, not in the short term), its punitive measures are limited. It faces rising producer prices as a result of its trade restrictions (Chart 6). This dependency is a bigger problem for China today than it was in previous cycles so China will try to diversify. Chart 6Constraints On China's Tarrifs On Australia
Constraints On China's Tarrifs On Australia
Constraints On China's Tarrifs On Australia
By contrast, China is not likely to impose sanctions on the US in response to Biden’s investigation, unless Biden attacks first. China’s imports from the US are booming and its currency is appreciating sharply. Despite Beijing’s efforts to keep the Phase One trade deal from collapsing, Biden is maintaining Trump’s tariffs and the US-China trade divorce is proceeding (Chart 7). Bilateral tariff rates are still 16-17 percentage points higher than they were in 2018, with US tariffs on China at 19% (versus 3% on the rest of the world) while Chinese tariffs on the US stand at 21% (versus 6% on the rest of the world). The Biden administration timed this week’s hawkish statements to coincide with the first meeting of US trade negotiators with China, which was a more civil affair. Both countries acknowledged that the relationship is important and trade needs to be continued. However, US Trade Representative Katherine Tai’s comments were not overly optimistic (she told Reuters that the relationship is “very, very challenging”). She has also been explicit about maintaining policy continuity with the Trump administration. We highly doubt that China’s share of US imports will ever surpass its pre-Trump peaks. The Biden administration has also refrained so far from loosening export controls on high-tech trade with China. This has caused a bull market in Taiwan while causing problems for Chinese semiconductor stocks’ relative performance (Chart 8). If Biden’s policy review does not lead to any relaxation of export controls on commercial items then it will mark a further escalation in tensions. Chart 7US Tarrifs Reduce China In Trade Deficit
US Tarrifs Reduce China In Trade Deficit
US Tarrifs Reduce China In Trade Deficit
Bottom Line: Until Presidents Biden and Xi stabilize relations at the top, the trade negotiations over implementing the Phase One trade deal – and any new Phase Two talks – cannot bring major positive surprises for financial markets. Chart 8US Export Controls Amid Chip Shortage
US Export Controls Amid Chip Shortage
US Export Controls Amid Chip Shortage
Congress Is More Hawkish Than Biden Biden’s ability to reduce frictions with China, should he seek to, will also be limited by Congress and public opinion. With the US deeply politically divided, and polarization at historically high levels, China has emerged as one of the few areas of agreement. The hawkish consensus is symbolized by new legislation such as the Strategic Competition Act, which is making its way through the Senate rapidly. Congress is also trying to boost US competitiveness through bills such as the Endless Frontier Act. These bills would subject China to scrutiny and potential punitive measures over a broad range of issues but most of all they would ignite US industrial policy , STEM education, and R&D, and diversify the US’s supply chains. We would highlight three key points with regard to the global impact of this legislation: Global supply chains are shifting regardless: This trend is fairly well established in tech, defense, and pharmaceuticals. It will continue unless we see a major policy reversal from China to try to court western powers and reduce frictions. The EU and India are less enthusiastic than the US and Australia about removing China from supply chains but they are not opposed. The EU Commission has recommended new defensive economic measures that cover supply chains in batteries, cloud services, hydrogen energy, pharmaceuticals, materials, and semiconductors. As mentioned, the EU is also hesitating to ratify the Comprehensive Agreement on Investment with China. Hence the EU is moving in the US’s direction independently of proposed US laws. After all, China’s rise up the tech value chain (and its decision to stop cutting back the size of its manufacturing sector) ultimately threatens the EU’s comparative advantage. The EU is also aligned with the US on democratic values and network security. India has taken a harder stance on China than usual, which marks an important break with the past. India’s decision to exclude Huawei from its 5G network is not final but it is likely to be at least partially implemented. A working group of democracies is forming regardless. The Strategic Competition Act calls for the creation of a working group of democracies but the truth is that this is already happening through more effective forums like the G7 and bilateral summits. Just as the implementation of the act would will ultimately depend on President Biden, so the willingness of other countries to adopt the recommendations of the working group would depend on their own executives. Allies have leeway as Biden will not use punitive measures against them: Any policy change from the EU, UK, India, and Australia will be independent of the US Congress passing the Strategic Competition Act. These countries will be self-directed. The US would have to devote diplomatic energy to maintaining a sustained effort by these states to counter China in the face of economic costs. This will be limited by the fact that the Biden administration will be very reluctant to impose punitive measures on allies to insist on their cooperation. The allies will set the pace of pressure on China rather than the United States. This gives the EU an important position, particularly Germany. And yet the trends in Germany suggest that the government will be more hawkish on China after the federal elections in September. Bottom Line: The Biden administration is unlikely to use punitive measures against allies so new US laws are less important than overall US diplomacy with each of the allies. Some allies will be less compliant with US policies given their need for trade with China. But so far there appears to be a common position taking shape even with the EU that is prejudicial to China’s involvement in key sectors of emerging technologies. If China does not respond by reducing its foreign policy assertiveness, then China’s economic growth will suffer. That drag would have to be offset by new supply chain construction in Southeast Asia and other countries. Investment Takeaways The foregoing highlights the international risks facing China even at a time when its trend growth is slowing (Chart 9) and its ongoing struggle with domestic financial imbalances is intensifying. China’s debt-service costs have risen sharply and Beijing is putting pressure on corporations and local governments to straighten out their finances (Chart 10), resulting in a wave of defaults. This backdrop is worrisome for investors until policymakers reassure them that government support will continue. Chart 9China's Growth Potential Slowing
China's Growth Potential Slowing
China's Growth Potential Slowing
Chart 10China's Leaders Struggle With Debt
China's Leaders Struggle With Debt
China's Leaders Struggle With Debt
China’s domestic stability is a key indicator of whether geopolitical risks could spiral out of control. In particular we think aggressive action in the Taiwan Strait is likely to be delayed as long as the Chinese economy and regime are stable. China has rattled sabers over the strait this year in a warning to the United States not to cross its red line (Chart 11). It is not yet clear how Biden’s policy continuity with the Trump administration will affect cross-strait stability. We see no basis yet for changing our view that there is a 60% chance of a market-negative geopolitical incident in 2021-22 and a 5% chance of full-scale war in the short run. Chart 11China PLA Flights Over Taiwan Strait
Biden Confirmed As A China Hawk (GeoRisk Update)
Biden Confirmed As A China Hawk (GeoRisk Update)
Putting all of the above together, we see substantial support for two key market-relevant geopolitical risks: Chinese domestic politics (including policy tightening) and persistent US-China tensions (including but not limited to the Taiwan Strait). We remain tactically defensive, a stance supported by several recent turns in global markets: The global stock-to-bond ratio has rolled over. China is a negative factor for global risk appetite (Chart 12). Global cyclical equities are no longer outperforming defensives. There is a stark divergence between Chinese cyclicals and global cyclicals stemming from the painful transition in China’s bloated industrial economy (Chart 13). Global large caps are catching a bid relative to small caps (Chart 14). Chart 12Global Stock-To-Bond Ratio Rolled Over
Global Stock-To-Bond Ratio Rolled Over
Global Stock-To-Bond Ratio Rolled Over
Chart 13Global Cyclicals-To-Defensives Pause
Biden Confirmed As A China Hawk (GeoRisk Update)
Biden Confirmed As A China Hawk (GeoRisk Update)
Chart 14Global Large Caps Catch A Bid Versus Small Caps
Global Large Caps Catch A Bid Versus Small Caps
Global Large Caps Catch A Bid Versus Small Caps
Cyclically the global economic recovery should continue as the pandemic wanes. China will eventually relax policy to prevent too abrupt of a slowdown. Therefore our strategic portfolio reflects our high-conviction view that the current global economic expansion will continue even as it faces hurdles from the secular rise in geopolitical risk, especially US-China cold war. Measurable geopolitical risk and policy uncertainty are likely to rebound sooner rather than later, with a negative impact on high-beta risk assets. Matt Gertken Vice President Geopolitical Strategy mattg@bcaresearch.com Coda: Global Minimum Tax Symbolizes Return Of Big Government On Thursday, the US Treasury Department released a proposal to set the global minimum corporate tax rate at 15%. The plan is to stop what Treasury Secretary Janet Yellen has referred to as a global “race to the bottom” and create the basis for a rehabilitation of government budgets damaged by pandemic-era stimulus. Although the newly proposed 15% rate is significantly below President Biden’s bid to raise the US Global Intangible Low-Taxed Income (GILTI) rate to 21% from 10.5%, it is the same rate as his proposed minimum tax on corporate book income. Biden is also raising the headline corporate tax rate from 21% to around 25% (or at highest 28%). Negotiators at the OECD were initially discussing a 12.5% global minimum rate. The finance ministers of both France and Germany – where the corporate income tax rates are 32.0% and 29.9%, respectively – both responded positively to the announcement. However, Ireland, which uses low corporate taxes as an economic development strategy, is obviously more comfortable with a minimum closer to its own 12.5% rate. Discussions are likely to occur when G7 finance ministers meet on June 4-5. Countries are hoping to establish a broad outline for the proposal by the G20 meeting in early July. It is highly likely that the OECD will come to an agreement. However, it is not a truly “global” minimum as there will still be tax havens. Compliance and enforcement will vary across countries. A close look at the domestic political capital of the relevant countries shows that while many countries have the raw parliamentary majorities necessary to raise taxes, most countries have substantial conservative contingents capable of preventing stiff corporate tax hikes (Table 1, in the Appendix). Our Geopolitical strategists highlight that the Biden administration’s compromise on the minimum rate reflects its pragmatism as well as emphasis on multilateralism. Any global deal will be non-binding but the two most important low-tax players are already committed to raising corporate rates well above this level: Biden’s plan is noted above, while the UK’s budget for March includes a jump in the business rate to 25% in April 2023 from the current 19%. Ireland and Hungary are the only outliers but they may eventually be forced to yield to such a large coalition of bigger economies (Chart 15). Chart 15Global Minimum Corporate Tax Impact Is Symbolic Rather Than Concrete
Biden Confirmed As A China Hawk (GeoRisk Update)
Biden Confirmed As A China Hawk (GeoRisk Update)
Thus a nominal minimum corporate tax rate is likely to be forged but it will not be truly global and it will not change the corporate rate for most countries. The reality of what companies pay will also depend on loopholes, tax havens, and the effective tax rate. Bottom Line: On a structural horizon, the global minimum corporate tax is significant for showing a paradigm shift in global macro policy: western governments are starting to raise taxes and revenue after decades of cutting taxes. The experiment with limited government has ended and Big Government is making a comeback. On a cyclical horizon, the US concession on global minimum tax is that the Biden administration aims to be pragmatic and “get things done.” Biden is also working with Republicans to pass bills covering some bipartisan aspects of his domestic agenda, such as trade, manufacturing, and China. The takeaway from a global point of view is that Biden may prove to be a compromiser rather than an ideologue, unlike his predecessors. Matt Gertken Vice President Geopolitical Strategy mattg@bcaresearch.com Roukaya Ibrahim Vice President Daily Insights RoukayaI@bcaresearch.com Footnotes 1 Kurt M. Campbell and Jake Sullivan, "Competition Without Catastrophe," Foreign Affairs, September/October 2019, foreignaffairs.com. Section II: Appendix Table 1OECD: Which Countries Are Willing And Able To Raise Corporate Tax Rates?
Biden Confirmed As A China Hawk (GeoRisk Update)
Biden Confirmed As A China Hawk (GeoRisk Update)
GeoRisk Indicator China
China: GeoRisk Indicator
China: GeoRisk Indicator
Russia
Russia: GeoRisk Indicator
Russia: GeoRisk Indicator
UK
UK: GeoRisk Indicator
UK: GeoRisk Indicator
Germany
Germany: GeoRisk Indicator
Germany: GeoRisk Indicator
France
France: GeoRisk Indicator
France: GeoRisk Indicator
Italy
Italy: GeoRisk Indicator
Italy: GeoRisk Indicator
Canada
Canada: GeoRisk Indicator
Canada: GeoRisk Indicator
Spain
Spain: GeoRisk Indicator
Spain: GeoRisk Indicator
Taiwan – Province Of China
Taiwan-Province of China: GeoRisk Indicator
Taiwan-Province of China: GeoRisk Indicator
Korea
Korea: GeoRisk Indicator
Korea: GeoRisk Indicator
Turkey
Turkey: GeoRisk Indicator
Turkey: GeoRisk Indicator
Brazil
Brazil: GeoRisk Indicator
Brazil: GeoRisk Indicator
Australia
Australia: GeoRisk Indicator
Australia: GeoRisk Indicator
Section III: Geopolitical Calendar
Highlights China's high-profile jawboning draws attention to tightness in metals markets, and raises the odds the State Reserve Board (SRB) will release some of its massive copper and aluminum stockpiles in the near future. Over the medium- to long-term, the lack of major new greenfield capex raises red flags for the IEA's ambitious low-carbon pathway released last week, which foresees the need for a dramatic increase in renewable energy output and a halt in future oil and gas investment to achieve net-zero emissions by 2050. Copper demand is expected to exceed mined supply by 2028, according to an analysis by S&P, which, in line with our view, also sees refined-copper consumption exceeding production this year (Chart of the Week). A constitution re-write in Chile and elections in Peru threaten to usher in higher taxes and royalties on mining in these metals producers, placing future capex at risk. Chile's state-owned Codelco, the largest copper producer in the world, fears a bill to limit mining near glaciers could put as much as 40% of its copper production at risk. We remain bullish copper and look to get long on politically induced sell-offs as the USD weakens. Feature Politicians are inserting themselves in the metals markets' supply-demand evolutions to a greater degree than in the past, which is complicating the short- and medium-term analysis of prices. This adds to an already-difficult process of assessing markets, given the opacity of metals fundamentals – particularly inventories, which are notoriously difficult to assess. Chinese Communist Party (CCP) jawboning of market participants in iron ore, steel, copper and aluminum markets over the past two weeks has weakened prices, but, with the exception of steel rebar futures in Shanghai – down ~ 17% from recent highs, and now trading at ~ 4911 RMB/MT – the other markets remain close to records. Benchmark 62% Fe iron ore at the port of Tianjin was trading ~ 4% lower at $211/MT, while copper and aluminum were trading ~ 5.5% and 6.5% off their recent records at $4.535/lb and $2,350/MT, respectively. In addition to copper, aluminum markets are particularly tight (Chart 2). Jawboning aside, if fundamentals continue to keep prices elevated – or if we see a new leg up – China's high-profile jawboning could presage a release by the State Reserve Board (SRB) of some of its massive copper and aluminum stockpiles in the near term. In the case of copper, market guesses on the size of this stockpile are ~ 2mm to 2.7mm MT. On the aluminum side, Bloomberg reported CCP officials were considering the release of 500k MT to quell the market's demand for the metal. Chart of the WeekContinue Tightening In Copper Expected
Continue Tightening In Copper Expected
Continue Tightening In Copper Expected
Chart 2Aluminum Remains Tight
Aluminum Remains Tight
Aluminum Remains Tight
Brownfield Development Not Sufficient Our balances assessments continue to indicate key base metals markets are tight and will remain so over the short term (2-3 years). Economies ex-China are entering their post-COVID-19 recovery phase. This will be followed by higher demand from renewable generation and grid build-outs that will put them in direct competition with China for scarce metals supplies for decades to come. Markets will continue to tighten. In the bellwether copper market, we expect this tightness to remain a persistent feature of the market over the medium term – 3 to 5 years out – given the dearth of new supply coming to market. Copper prices are highly correlated with the other base metals (Chart 3) – the coefficient of correlation with the other base metals making up the LME's metals index is ~ 0.86 post-GFC – and provide a useful indicator of systematic trends in these markets. Chart 3Copper Correlation With LME Index Ex-Copper
Less Metal, More Jawboning
Less Metal, More Jawboning
Copper ore quality has been falling for years, as miners focused on brownfield development to extend the life of mines (Chart 4). In Chart 5, we show the ratio of capex (in billion USD) to ore quality increases when capex growth is expanding faster than ore quality, and decreases when capex weakens and/or ore quality degradation is increasing. Chart 4Copper Capex, Ore Quality Declines
Less Metal, More Jawboning
Less Metal, More Jawboning
Chart 5Capex-to-Ore-Quality Decline Set Market Up For Higher Prices
Less Metal, More Jawboning
Less Metal, More Jawboning
Falling prices over the 2012-19 interval coincide with copper ore quality remaining on a downward trend, likely the result of previous higher prices that set off the capex boom pre-GFC. The lower prices favored brownfield over greenfield development. Goehring and Rozencwajg found in their analysis of 24 mines, about 80% of gross new reserves booked between 2001-2014 were due not to new mine discoveries but to companies reclassifying what was once considered to be waste-rock into minable reserves, lowering the cut-off grade for development.1 This is consistent with the most recent datapoints in Chart 5, due to falling ore grade values, as companies inject less capex into their operations and use it to expand on brownfield projects. Higher prices will be needed to incentivize more greenfield projects. A new report from S&P Global Market Intelligence shows copper reserves in the ground are falling along with new discoveries.2 According to the S&P analysts, copper demand is expected to exceed mined supply by 2028, which, in line with our view, sees refined-copper consumption exceeding production this year. Renewables Push At Risk Just last week, the IEA produced an ambitious and narrow path for governments to collectively reach a net-zero emissions (NZE) goal by 2050.3 Among its many recommendations, the IEA singled out the overhaul of the global electric grid, which will be required to accommodate the massive renewable-generation buildout the agency forecasts will be needed to achieve its NZE goals. The IEA forecasts annual investment in transmission and distribution grids will need to increase from $260 billion to $820 billion p.a. by 2030. This is easier said than done. Consider the build-out of China's grid, which is the largest grid in the world. To become carbon neutral by 2060, per its stated goals, investment in China’s grid and associated infrastructure is expected to approach ~ $900 billion, maybe more, over the next 5 years.4 The world’s largest fossil-fuel importer is looking to pivot away from coal and plans to more than double solar and wind power capacity to 1200 GW by 2030. Weening China off coal and rebuilding its grid to achieve these goals will be a herculean lift. It comes as no surprise that IEA member states have pushed back on the agency's NZE-by-2050 plan. This primarily is because of its requirement to completely halt fossil-fuel exploration and spending on new projects. Japan and Australia have pushed back against this plan, citing energy security concerns. Officials from both countries have stated that they will continue developing fossil fuel projects, as a back-up to renewables. Japan has been falling behind on renewable electricity generation (Chart 6). Expensive renewables and the unpopularity of nuclear fuel could make it harder for the world’s fifth largest fossil fuels consumer to move away from fossil fuels. Around the same time the IEA released its report, Australia committed $464 million to build a new gas-fired power station as a backup to renewables. Chart 6Japan Will Continue Building Fossil-Fuel Back-Up Generation
Japan Will Continue Building Fossil-Fuel Back-Up Generation
Japan Will Continue Building Fossil-Fuel Back-Up Generation
Just days after the IEA report was published, the G7 nations agreed to stop overseas coal financing. This could have devastating effects for emerging and developing nations‘ electricity grids which are highly dependent on coal. In 2020 70% and 60% of India and China’s electricity respectively were produced by coal (Chart 7).5 Chart 7EM Economies Remain Reliant On Coal-Fired Generation
Less Metal, More Jawboning
Less Metal, More Jawboning
Near-Term Copper Supply Risks Rise Even though inventories appear to be rebuilding, mounting political risks keep us bullish copper (Chart 8). Lawmakers in Chile and Peru are in the process of re-writing their constitutions to, among other things, raise royalties and taxes on mining activities in their respective countries. This could usher in higher taxes and royalties on mining for these metals producers, placing future capex at risk. In addition, Chile's state-owned Codelco, the largest copper producer in the world, fears a bill to limit mining near glaciers could put as much as 40% of its copper production at risk.6 None of these events is certain to occur. Peruvian elections, for one thing, are too close to call at this point, and Chile has a history of pro-business government. However, these are non-trivial odds – i.e., greater than Russian roulette odds of 1:6 – and if any or all of these outcomes are realized, higher costs in copper and lithium prices would result, and miners would have to pass those costs on to buyers. Bottom Line: We remain bullish base metals, especially copper. Another leg up in copper would pull base metals higher with it. We would look to get long on politically induced sell-offs, particularly with the USD weakening, as expected Chart 8Global Copper Inventories Rebuilding But Still Down Y/Y
Global Copper Inventories Rebuilding But Still Down Y/Y
Global Copper Inventories Rebuilding But Still Down Y/Y
Robert P. Ryan Chief Commodity & Energy Strategist rryan@bcaresearch.com Ashwin Shyam Research Associate Commodity & Energy Strategy ashwin.shyam@bcaresearch.com Commodities Round-Up Energy: Bullish Next Tuesday's OPEC 2.0 meeting appears to be a fairly staid affair, with little of the drama attending previous gatherings. Russian minister Novak observed the coalition would be jointly "calculating the balances" when it meets, taking into account the likely official return of Iran as an exporter, according to reuters.com. We expect a mid-year deal on allowing Iran to return to resume exports under the nuclear deal abrogated by the Trump administration in 2019, and reckon Iran has ~ 1.5mm b/d of production it can bring back on line, which likely would return its crude oil production to something above 3.8mm b/d by year-end. We are maintaining our forecast for Brent to average $64.45/bbl in 2H21; $75 and $78/bbl, in 2022 and 2023, respectively. By end 2023, prices trade to $80/bbl. Our forecast is premised on a wider global recovery going into 2H21, and continued production discipline from OPEC 2.0 (Chart 9). Base Metals: Bullish Our stop-losses was elected on our long Dec21 copper position on May 21, which means we closed the position with 48.2% return. The stop loss on our long 2022 vs short 2023 COMEX copper futures backwardation recommendation also was elected on May 20, leaving us with a return of 305%. We will be looking for an opportunity to re-establish these positions. Precious Metals: Bullish We expect the collapse in bitcoin prices, the US Fed’s decision to not raise interest rates, and a weakening US dollar to keep gold prices well bid (Chart 10). China’s ban on cryptocurrency services and Musk’s acknowledgment of the energy intensity of Bitcoin mining sent Bitcoin prices crashing. The Fed’s decision to keep interest rates constant, despite rising inflation and inflation expectations will reduce the opportunity cost of holding gold. According to our colleagues at USBS, the Fed will make its first interest rate hike only after the US economy has reached "maximum employment". The Job Openings and Labor Turnover Survey reported that job openings rose nearly 8% in March to 8.1 million jobs, however, overall hiring was little changed, rising by less than 4% to 6 million. As prices in the US rise and the dollar depreciates, gold will be favored as a store of value. On the back of these factors, we expect gold to hit $2,000/oz. Ags/Softs: Neutral Corn futures were trading close to 20% below recent highs earlier in the week at ~ $6.27/bu, on the back of much faster-than-expected plantings. Chart 9
Brent Prices Going Up
Brent Prices Going Up
Chart 10
US Dollar To Keep Gold Prices Well Bid
US Dollar To Keep Gold Prices Well Bid
Footnotes 1 Please refer to Goehring & Rozencwajg’s Q1 2021 market commentary. 2 Please see Copper cupboard remains bare as discoveries dwindle — S&P study published by mining.com 20 May 2021. 3 Please see Net Zero by 2050 – A Roadmap for the Global Energy Sector, published by the IEA. 4 Please see China’s climate goal: Overhauling its electricity grid, published by Aljazeera. 5 We discuss this in detail in Surging Metals Prices And The Case For Carbon-Capture published 13 May 2021, and Renewables ESG Risks Grow With Demand, which was published 29 April 2021. Both are available at ces.bcaresearch.com. 6 Please see A game of chicken is clouding tax debate in top copper nation, Fujimori looks to speed up projects to tap copper riches in Peru and Codelco says 40% of its copper output at risk if glacier bill passes published by mining.com 24, 23 and 20 May 2021, respectively. Investment Views and Themes Strategic Recommendations Tactical Trades Commodity Prices and Plays Reference Table Trades Closed in 2021 Summary of Closed Trades
Higher Inflation On The Way
Higher Inflation On The Way
Highlights House prices are rising rapidly across the developed markets, in response to the extraordinary monetary and fiscal policy stimulus implemented to fight the pandemic. Evidence points to the house price surge being driven by monetary policy that has left real interest rates far below equilibrium levels. Supply factors are a secondary cause of the house price boom. Financial stability risks stemming from rising house prices are less acute than the pre-2008 experience, as overall household leverage has grown more slowly during the pandemic and global banks are better capitalized. Rapidly rising house prices are forcing some central banks to turn less accommodative earlier than expected. The recent hawkish turns by the Bank of Canada and Reserve Bank of New Zealand may be canaries in the coal mine for other central banks – perhaps even the Fed – if house prices and household leverage start rising together. Feature The COVID-19 pandemic led to the sharpest economic recession since World War II, alongside an enormous rise in unemployment. Consensus expectations call for the output gap to be closed (or mostly closed) in most advanced economies by the end of this year, but it remains an open question how quickly these economies will be able to return to full employment amid potentially permanent shifts in demand for office space and goods sold at physical, “brick and mortar” retail locations. Despite this sizeable and swift economic shock, house price appreciation accelerated last year in the developed world. Chart II-1 highlights that US house prices rose at an 18% annualized pace in the second half of 2020, whereas they accelerated at a high-single digit pace in developed markets ex-US (on a GDP-weighted basis). This, in conjunction with a sharp rise in the household sector credit-to-GDP ratio (Chart II-2), has unnerved some investors while raising questions about the implications for monetary policy. Chart II-1House Prices Are Surging Around The World
House Prices Are Surging Around The World
House Prices Are Surging Around The World
Chart II-2Rising Fears About Deteriorating Household Balance Sheets
Rising Fears About Deteriorating Household Balance Sheets
Rising Fears About Deteriorating Household Balance Sheets
Before we discuss the investment implications of the global housing boom, however, we must first accurately determine the reasons why it is happening. The Work-From-Home Effect: Less Than Meets The Eye When analyzing the surprising behavior of the housing market last year, the working-from-home effect brought upon by the pandemic emerges as an obvious factor potentially explaining house price gains. Last year, following recommended or mandatory stay-at-home orders from governments, most office-based businesses rapidly shifted to work-from-home arrangements as an emergency response. However, in the month or two following the beginning of stay-at-home orders, several national US surveys found many office workers preferred the flexibility afforded by work-from-home arrangements. Many employers, correspondingly, found that the productivity of their employees did not suffer while working from home, or that it even improved. Several prominent corporations in the US have subsequently made some work-from-home options permanent, or even allowed employees to work from offices in a different city than they did prior to the pandemic. Newfound work-from-home options have undoubtedly created new demand for housing, and thus explained the surge in house prices seen over the past year in the minds of some investors. However, in our view, evidence from the US, the UK, and France suggests that the work-from-home effect better explains differences in price gains across housing types and within large metropolitan areas, rather than aggregate or national-level changes in house prices. Chart II-3 provides some quantification of the impact of work-from-home policies by plotting US resident migration patterns by city. This data has been compiled by CBRE, and the impact of COVID is shown as the change in net move-ins from 2019 to 2020 per 1000 people. This helps control for the underlying migration pattern that existed in US cities prior to the pandemic. Chart II-3Work From Home Policies Have Impacted Migration Trends…
June 2021
June 2021
The chart highlights that the negative migration impact from COVID has been mostly concentrated in New York City and the three most populous cities on the West Coast (by metro area): Los Angeles, San Francisco, and Seattle. And yet, Chart II-4 highlights that house price inflation in these four cities has accelerated to a double-digit pace, only modestly below the national average. Chart II-4...But Cities With Outward Migration Still Have Very Strong House Price Gains
...But Cities With Outward Migration Still Have Very Strong House Price Gains
...But Cities With Outward Migration Still Have Very Strong House Price Gains
The house price indexes shown in Chart II-4 represent aggregate, metro area trends, and clearly some regions within these metro areas have experienced house price deceleration or outright deflation versus gains in areas outside the urban core. But Chart II-5 highlights that house prices have declined in Manhattan basically in line with the change in net move-ins as a share of the population, underscoring that double-digit metro area-wide house price gains appear to be vastly disproportionate to changes in net migration. Similarly, Chart II-6 highlights that rents decelerated in the US over the past year but remained in positive territory and grew at a 3.5% annualized rate from February to April. Chart II-5In Manhattan, House Prices Have Tracked Net Migration
June 2021
June 2021
Chart II-6Rent Costs Have Decelerated, But Have Not Contracted
Rent Costs Have Decelerated, But Have Not Contracted
Rent Costs Have Decelerated, But Have Not Contracted
Evidence from Paris and London also suggests that a work-from-home effect is insufficient to explain broad house price gains. Panel 1 of Chart II-7 highlights that house prices in France have accelerated significantly, but that apartment prices have decelerated only fractionally in lockstep. Panel 2 shows that the acceleration in house prices does reflect a work-from-home effect, as prices have risen faster in inner Parisian suburbs. Panel 3, however, highlights that Parisian apartment prices, the dominant property type in the urban core, have decelerated modestly. Chart II-8 highlights that house price gains have not even decelerated in greater London; they have been merely been modestly outstripped by gains in Outer South East (outside of the Outer Metropolitan Area). Chart II-7In France, Parisian Apartment Prices Are Simply Lagging, Not Falling
In France, Parisian Apartment Prices Are Simply Lagging, Not Falling
In France, Parisian Apartment Prices Are Simply Lagging, Not Falling
Chart II-8In The UK, Greater London Property Prices Are Accelerating
In The UK, Greater London Property Prices Are Accelerating
In The UK, Greater London Property Prices Are Accelerating
The Policy Effect: The Fundamental Driver Of The Housing Market Despite the broader location flexibility that work-from-home policies now provide to potential homeowners, it seems inconceivable that the housing market would have responded in the manner that it has over the past year given the size of the economic shock brought on by the pandemic without significant support from policy. Above-the-line fiscal measures to the pandemic have totaled in the double-digits in advanced economies (Chart II-9), and monetary policy has contributed to easier financial conditions via rate cuts, asset purchases, and sizeable programs to support financial market liquidity. Chart II-9There Has Been A Massive Fiscal Policy Response To The Crisis
June 2021
June 2021
In fact, Charts II-10-II-13 present compelling evidence that fiscal and monetary policy have been the core drivers of significant house price gains over the past year. Charts II-10 and II-11 plot the above-the-line fiscal response of advanced economies against the year-over-year growth rate in house prices as well as its acceleration (the change in the year-over-year growth rate). The charts show a clearly positive relationship, with a stronger link between the pandemic fiscal response and the acceleration in house prices. Chart II-10Differences In Last Year’s Fiscal Response…
June 2021
June 2021
Chart II-11…Help Explain Differences In House Price Gains
June 2021
June 2021
Chart II-12Pre-Pandemic Differences In The Monetary Policy Stance…
June 2021
June 2021
Chart II-13…Do An Even Better Job Of Explaining 2020 House Price Gains
June 2021
June 2021
Charts II-12 and II-13 highlight the even stronger link between house prices and the pre-pandemic monetary policy stance in advanced economies, defined as the difference between each country’s 2-year government bond yield and its Taylor Rule-implied policy interest rate as of Q4 2019. We construct each country’s Taylor Rule using the original specification, with core consumer price inflation, a 2% inflation target, and real potential GDP growth as the definition of the real equilibrium interest rate. The charts make it clear that easy monetary policy strongly explains house price gains in 2020, particularly the year-over-year percent change rather than its acceleration. This makes sense, given that monetary policy was already quite easy in many countries at the onset of the pandemic – meaning that changes were less pronounced than they would have been had interest rates been higher. The explanation that emerges from Charts II-10-II-13 is that historic fiscal easing, combined with an easy starting point for monetary policy – that became even easier last year – enabled demand from work-from-home policies to manifest during an extremely severe recession. We agree that work-from-home policies have shifted the geographic preferences of some home buyers and likely provided a new source of net demand from renters in urban cores purchasing homes in outlying areas. But we strongly doubt that the net effect of work-from-home policies in the midst of an extreme shock to economic activity would have caused the rise in house prices that we have observed, certainly not to this level, without major support from policy. This underscores that policy, and not the work-from-home effect, has and will likely remain the core driver of the global housing market. The Supply Effect: Mostly A Red Herring Chart II-14Countries Fall Into Two Groups In Terms Of The Relative Trend In Real Residential Investment
Countries Fall Into Two Groups In Terms Of The Relative Trend In Real Residential Investment
Countries Fall Into Two Groups In Terms Of The Relative Trend In Real Residential Investment
One perennial question that emerges when analyzing the housing market, particularly in markets with outsized house price gains, is the impact of constrained supply. It is frequently argued that constrained supply is squeezing prices higher in many markets, and that the appropriate policy solution to extreme house price gains is to enable widespread housing construction – not to raise interest rates. We do not rule out the potential impact of constrained supply in certain cities or regional housing markets, and we have highlighted in previous research that a positive relationship does exist between population density in urban regions and median house price-to-income ratios.1 But as a broad explanation for supercharged house price gains, the supply argument appears to fall flat. Chart II-14 presents the most standardized measure of cross-country housing supply available for several advanced economies, the trend in real residential investment relative to real GDP over time. These series are all rebased to 100 as of 1997, prior to the 2002-2007 US housing market boom. The chart makes it clear that advanced economies generally fall into two groups based on this metric: those that have seen declines in real residential investment relative to GDP, especially after the global financial crisis (panel 1), and those that have experienced either an uptrend in housing construction relative to output or have seen a flat trend (panel 2). If scarce housing supply was the core driver of outsized house price gains, then we would expect to see stronger gains in the countries shown in panel 1 and smaller gains in the countries shown in panel 2. In fact, mostly the opposite is true: Charts II-15 and II-16 highlight that the relationship between the level of these indexes today relative to their 1997 or 2005 levels is positively related to the magnitude of house price gains last year, suggesting that housing market supply has generally been responding to demand over the past decade. The US and possibly New Zealand stand as possible exceptions to the trend, suggesting that relatively scarce supply may be boosting prices even further in these markets beyond what fiscal and monetary policy would suggest. Chart II-15Countries That Have Seen A Stronger Pace Of Residential Investment…
June 2021
June 2021
Chart II-16…Have Experienced Stronger House Price Gains
June 2021
June 2021
Chart II-17Is This Not Enough Supply, Or Too Much Demand?
June 2021
June 2021
As a final point about the inclination of investors to gravitate towards supply-side arguments related to the housing market, Chart II-17 presents a simple thought experiment. The chart shows a simple housing supply-demand curve diagram, in a scenario where the demand curve for housing has shifted out more than the supply curve has (thus raising house prices). Is this a scenario in which supply is too tight? Or is it a case in which demand is too strong? In our view, the tight supply answer is reasonable in circumstances where the increase in demand is normal or otherwise sustainable. But Charts II-10-II-13 clearly showed that housing demand is being boosted by easy policy, which in the case of some countries has occurred for years: interest rates have remained well below levels that macroeconomic theory would traditionally consider to be in equilibrium, and this has occurred alongside significant household sector leveraging (Chart II-18). As such, in our view, investors should be more inclined to view the global housing market as generally being driven by demand-side rather than supply-side factors. This Is Not 2007/08 … Yet We highlighted in Chart II-2 above that the household sector debt-to-GDP ratio increased sharply last year, which has raised some questions about debt sustainability among investors. For the most part, the rise in this ratio actually reflects denominator effects (namely a sharp contraction in nominal GDP) rather than a huge surge in household debt. Chart II-19 shows BIS data for the annual growth in total household debt in developed economies was roughly stable last year, at least until Q3 (the most recent datapoint available from the BIS). Chart II-18Low Interest Rates Have Fueled Household Leveraging
Low Interest Rtaes Have Fueled Household Leveraging
Low Interest Rtaes Have Fueled Household Leveraging
Chart II-19Total Credit Growth Has Been Stable, But Mortgage Credit Growth Is Accelerating
Total Credit Growth Has Been Stable, But Mortgage Credit Growth Is Accelerating
Total Credit Growth Has Been Stable, But Mortgage Credit Growth Is Accelerating
Chart II-20US Mortgage Growth Is Picking Up, As Repayments Slow Consumer Credit Growth
US Mortgage Growth Is Picking Up, As Repayments Slow Consumer Credit Growth
US Mortgage Growth Is Picking Up, As Repayments Slow Consumer Credit Growth
But Chart II-19 shows the recent trend in total household debt, which masks diverging mortgage and non-mortgage debt trends. In the US, euro area, Canada, and Sweden, household mortgage debt has accelerated to varying degrees, underscoring that households have likely paid down non-mortgage debt with some of the savings that they have accumulated from a significant reduction in spending on services. Chart II-20 shows this effect directly in the case of the US; mortgage debt growth accelerated by roughly 1.5 percentage points in the second half of the year, whereas consumer credit growth (made up of student loans, auto loans, credit cards, and other revolving credit) decelerated significantly. This aligns with data showing that US households have used some of their savings windfall to pay down their credit card balances. This changing mix within household debt - less higher-interest-rate consumer credit, more lower-interest-rate collateralized mortgage debt – could, on the margin, help mitigate financial stability risks from the housing boom by moderating overall debt service burdens. The starting point for the latter matters, though, in accurately assessing the risks from rising house prices and increased mortgage debt, particularly in countries where household debt levels are already high. According to data from the BIS, the US already has one of the lowest household debt service ratios (7.6%) among the developed economies (Chart II-21).2 This compares favorably to the double-digit debt service ratios in the “higher-risk” countries like Canada (12.6%), Sweden (12.1%) and Norway (16.2%). On top of that, US commercial banks have become far more prudent with mortgage loan underwriting standards since the 2008 financial crisis. The New York Fed’s Household Debt and Credit report shows that an increasing majority of mortgage lending made by US banks since the 2008 crisis has been to those with very high FICO credit scores (Chart II-22). This is in sharp contrast to the steady lending to “subprime” borrowers with poor credit scores that preceded the 2008 financial crisis. The median FICO score for new mortgage originations as of Q1 2021 was 788, compared to 707 in Q4 2006 at the peak of the mid-2000s US housing boom. Chart II-21Diverging Trends In Global Household Debt Servicing Costs
Diverging Trends In Global Household Debt Servicing Costs
Diverging Trends In Global Household Debt Servicing Costs
Chart II-22US Banks Have Become More Prudent With Mortgage Lending
US Banks Have Become More Prudent With Mortgage Lending
US Banks Have Become More Prudent With Mortgage Lending
US bank balance sheets are also now less directly exposed to a fall in housing values. Residential loans now represent only 10% of the assets on US bank balance sheets, compared to 20% at the peak of the last housing bubble (Chart II-23). This puts the US in the “lower-risk” group of countries in Europe, the UK and Japan where mortgages are less than 20% of bank balance sheets. This compares favorably to the “higher risk” group of countries where residential loans are a far larger share of bank assets (Chart II-24), like Canada (32%), New Zealand (49%), Sweden (45%) and Australia (40%). Chart II-23Banks Have Limited Direct Exposure To Housing Here
Banks Have Limited Direct Exposure To Housing Here
Banks Have Limited Direct Exposure To Housing Here
Chart II-24Banks Are Far More Exposed To Housing Here
Banks Are Far More Exposed To Housing Here
Banks Are Far More Exposed To Housing Here
Like nature, however, the financial ecosystem abhors a vacuum. “Non-bank” mortgage lenders have filled the void from traditional US banks reducing their lending to lower-quality borrowers, and they now represent around two-thirds of all US mortgage origination, a big leap from the 20% origination share in 2007. Non-bank lenders have also taken on growing shares of new mortgage origination in other countries like the UK, Canada and Australia. Chart II-25Global Banks Can Withstand A Housing Shock
June 2021
June 2021
Non-bank lenders do not take deposits and typically fund themselves via shorter-term borrowings, which raises the potential for future instability if credit markets seize up. These lenders also, on average, service mortgages with a higher probability of default, so they are exposed to greater credit losses when house prices decline. However, the risk of a full-blown 2008-style commercial banking crisis, with individual depositors’ funds at risk from a bank failure, are reduced with a greater share of riskier mortgage lending conducted by non-bank entities. This is especially true with global commercial banks far better capitalized today, with double-digit Tier 1 capital ratios (Chart II-25), thanks to regulatory changes made after the Global Financial Crisis. Net-net, we conclude that the overall financial stability implications of the current surge in house prices in the developed economies are relatively modest on average. The acceleration in mortgage growth has occurred alongside reductions in non-mortgage growth, at a time when banks are better able to withstand a shock from any sustained future downturn in house prices. However, if house prices continue to accelerate and new homebuyers are forced to take on ever increasing amounts of mortgage debt, financial stability issues could intensify in some countries. Services spending will recover in a vaccinated post-COVID world, as economies reopen and consumer confidence improves, which will likely end the trend of falling non-residential consumer debt offsetting rising mortgage debt in countries like the US and Canada. Overall levels of household debt could begin to rise again relative to incomes, building up future financial stability risks when central banks begin to normalize pandemic-related monetary policies – a process that has already started in some countries because of the housing boom. The Monetary Policy Implications Of Surging House Prices Rapidly appreciating house prices are becoming an area of concern for policymakers in countries like Canada and New Zealand, where the affordability of housing is becoming a political, as well as an economic, issue. In the case of New Zealand, the government has actually altered the remit of the Reserve Bank of New Zealand (RBNZ) to more explicitly factor in the impact of monetary policy on housing costs. The Bank of Canada announced in April that it would taper its pace of government debt purchases and signaled that its decision was based, at least in small part, on signs of speculative behavior in Canada’s housing market. Macroprudential measures like limiting loan-to-value ratios of new mortgage loans are a policy option that governments in those countries have already implemented to try and cool off housing demand. Yet while such measures can help alleviate demand-supply mismatches in certain cities and regions, the efficacy of such measures in sustainably slowing the ascent of house prices on a national scale is unclear. In the April 2021 IMF Global Financial Stability Report, researchers estimated that, for a broad group of countries, the implementation of a new macro-prudential measure designed to cool loan demand reduced national household debt/GDP ratios by a mere one percentage point, on average, over a period encompassing four years.3 If macroprudential measures are that ineffective in sustainably reducing demand for mortgage loans, then the burden of slowing house price appreciation will have to fall on the more blunt instruments of monetary policy. Importantly, surging house price inflation is not likely to give a boost to realized inflation measures – an important issue given the current backdrop of rapidly rising realized inflation rates in many countries. Housing costs do represent a significant portion of consumer price indices in many developed countries, ranging from 19% in New Zealand to 33% in the US (Chart II-26), with the euro area being the outlier with housing having a mere 2% weighting in the headline inflation index. Chart II-26A Limited Impact On Actual Inflation From Housing
June 2021
June 2021
Yet those so-called “housing” categories overwhelmingly measure only housing rental costs and not actual house prices. This is an important distinction because rents – which are often imputed measures like in the US and not even actual rental costs - are rising at a far slower pace than actual house prices in most countries, so the housing contribution to realized inflation is relatively modest. So the good news is that booming house prices will not worsen the acceleration of realized global inflation that has concerned investors and policymakers in 2021. Yet that does not mean that central bankers will not be forced to tighten policy to cool off red-hot housing demand that is clearly being fueled by persistently negative real interest rates. In Chart II-27 and Chart II-28, we show both nominal and real policy interest rates for the “lower risk” and “higher risk” country groupings that we described earlier. The real policy rates are nominal policy rates versus realized headline CPI inflation. The dotted lines in the charts represent the future path of rates discounted by markets. Specifically, the projection for nominal rates is taken from overnight index swap (OIS) forward curves, while the projection for real rates is calculated by subtracting the discounted path of inflation expectations extracted from CPI swap forwards. Chart II-27Markets Discounting Negative Real Rates For The Next Decade
Markets Discounting Negative Real Rates For The Next Decade
Markets Discounting Negative Real Rates For The Next Decade
Chart II-28Negative Real Rates Are Unsustainable During A Housing Bubble
Negative Real Rates Are Unsustainable During A Housing Bubble
Negative Real Rates Are Unsustainable During A Housing Bubble
There are two key takeaways from these charts: Real policy interest rates are at or very close to the most deeply negative levels seen since the 2008 financial crisis. Markets are discounting that real rates will be at or below 0% for most of the next decade. Admittedly, there is room for debate over what the equilibrium level of real interest rates (a.k.a. “r-star”) should be in the coming years. However, we deem it a major stretch to believe that real rates need to be persistently low or negative for the next ten years to support even trend growth across the developed economies. In our view, the current boom in housing demand and mortgage borrowing provides clear evidence that negative real rates are below equilibrium and, thus, are stimulating credit demand. Thus, the only way for a central bank to cool off housing demand will be to raise both nominal and, more importantly, real interest rates. Canada and New Zealand will be the “canaries in the coal mine” among developed market central banks for such a move. According to the latest Bank of Canada Financial Stability Review, nearly 22% of Canadian mortgages are highly levered, with a loan-to-value ratio greater than 450%, a greater share of such mortgages than during the 2016/17 housing boom (Chart II-29). Canadian house prices have risen to such an extent that home prices in major cities like Toronto, Vancouver and Montreal are among the most expensive in North America.4 Stunningly, a recent Bloomberg Nanos opinion poll revealed that nearly 50% of Canadians would support Bank of Canada rate hikes to cool off the red-hot housing market (Chart II-30). The central bank will be unable to resist the pressure to use monetary policy to slam on the brakes of the housing market – investors should expect more tapering and, eventually, rate hikes from the Bank of Canada over at least the next couple of years. Chart II-29Canadians Are Leveraging Up To Buy Expensive Homes
Canadians Are Leveraging Up To Buy Expensive Homes
Canadians Are Leveraging Up To Buy Expensive Homes
Chart II-3050% Of Canadians Want A Rate Hike To Cool Housing
June 2021
June 2021
In New Zealand, worsening housing affordability has reached a point where a 20% down payment on the median national house price is equal to 223% of median disposable income (Chart II-31). This is forcing more first-time home buyers to take on levels of mortgage debt that the RBNZ deems highly risky (top panel). Like the Bank of Canada, the RBNZ will prove to be one of the most hawkish central banks in the developed world over the next couple of years as the central bank follows their newly-revised remit to try and cool off housing demand in New Zealand. Who is next? Housing values, measured by the ratio of median national house prices to median national household incomes, are rising in the US and UK but are still below the peaks of the mid-2000s housing bubble (Chart II-32). Meanwhile, housing is becoming more expensive across the euro area, but not in a consistent manner, with valuations in Germany and Spain having increased far more than in France or Italy. Housing valuations have actually improved in Australia over the past couple of years on a price-to-income basis. The most likely candidates for a housing-related hawkish turn are in Scandinavia, with housing valuations in Sweden and Norway closing in on Canada/New Zealand levels. Chart II-31New Zealand Housing Is Wildly Unaffordable
New Zealand Housing Is Wildly Unaffordable
New Zealand Housing Is Wildly Unaffordable
Chart II-32Global House Price/Income Ratios Are Trending Higher
Global House Price/Income Ratios Are Trending Higher
Global House Price/Income Ratios Are Trending Higher
Investment Conclusions The current acceleration in global house prices is an inevitable outcome of the extraordinary monetary and fiscal easing implemented during the pandemic. Higher realized inflation is pushing real rates deeper into negative territory in many countries, fueling the demand for housing. Central banks in countries with more stretched housing valuations will be forced to turn more hawkish sooner than expected, leading to tapering and, eventually, rate hikes to cool housing demand. This has negative implications for government bond markets in countries where housing is more expensive and real yields remain too low, like Canada, New Zealand and Sweden (Chart II-33). Investors should limit exposure to government bonds in those markets over the next 6-12 months. Chart II-33Negative Real Yields & Expensive Housing Valuations – An Unsustainable Mix
June 2021
June 2021
Bond markets in countries where house prices are not rising rapidly enough to force policymakers to turn more hawkish more quickly – like core Europe, Australia and even Japan - are likely to be relative outperformers. The US and UK are “cuspy” bond markets, as housing valuations are becoming more expensive in those two countries but the Fed and Bank of England are not facing the same domestic political pressure to use monetary policy tools to fight the growing unaffordability of housing. That could change, though, if overall household leverage begins to rise alongside house price inflation as the US and UK economies emerge from the pandemic. Current pricing in OIS curves shows that markets expect the RBNZ and Bank of Canada to begin hiking rates in May 2022 and September 2022, respectively (Table II-1). This is well ahead of expectations for “liftoff” from other developed markets central banks, including the Fed in April 2023. The cumulative amount of rate hikes following liftoff to the end of 2024 is highest in Canada, New Zealand, the US and Australia. Those are also countries with currencies that are trading at or above the purchasing power parity levels derived from our currency strategists’ valuation models. This highlights the difficult choice that central bankers facing housing bubbles must confront, as the rate hikes that will help cool off housing demand will lead to currency appreciation that could impact other parts of their economies like exports and manufacturing. Table II-1Hawkish Central Banks Must Live With Currency Strength
June 2021
June 2021
Tracking the second-round economic consequences of eventual monetary policy actions to control excessive house price inflation, particularly in “higher risk” countries, is likely to be the subject of future Bank Credit Analyst / Global Fixed Income Strategy reports. Jonathan LaBerge, CFA Vice President The Bank Credit Analyst Robert Robis, CFA Chief Fixed Income Strategist Footnotes 1 Please see Global Investment Strategy "Canada: A (Probably) Happy Moment In An Otherwise Sad Story," dated July 14, 2017, available at gis.bcaresearch.com 2 Importantly, the BIS debt service ratios include the payment of both principal and interest, thus making it a true measure of debt service costs that includes repayment of borrowed funds – a critical issue in countries with high loan-to-value ratios for home mortgages. 3 Please see page 46 of Chapter 2 of the April 2021 IMF Global Financial Stability Report, which can be found here: https://www.imf.org/en/Publications/GFSR/Issues/2021/04/06/global-finan… 4 “Vancouver, Toronto and Hamilton are the least affordable cities in North America: report”, CBC News, May 20, 2021
Highlights Domestic and foreign supply-side constraints are now exerting a significant effect on the US economy. Consumer prices may increase at a faster pace than we initially expected over the coming 3-4 months, but supply-side constraints are likely to wane later this year and thus do genuinely appear to be transitory. The idea that even a temporary period of high inflation could persist over the longer term has legitimate grounding in macro theory, and is explicitly recognized in the Fed’s inflation framework. But it would necessitate a very large increase in inflation expectations, which have yet to rise to abnormal levels. The baseline for inflation has shifted back closer to the Fed’s target, but deviations above or below target over the coming 12-18 months are likely to be driven by demand-side rather than supply-side factors. The Fed’s checklist for liftoff now entirely depends on employment, and there are compelling arguments in favor of outsized jobs growth in the second half of the year that would move forward the timing of the first rate hike. But the reality for investors is that there is tremendous uncertainty concerning the magnitude of these job gains, given the likelihood of some lasting changes to consumer behavior following the pandemic. Visibility about the employment consequences of these changes will remain very low until investors receive more information about likely urban office footprint and downtown commuter presence, the speed at which international travel will return, and to what degree any pandemic control measures remain in place in the second half of the year. For now, investors should remain cyclically overweight stocks versus bonds, short duration, and invested in other procyclical positions, with an eye to reassess the monetary policy and growth outlook in the late summer / early fall. Feature Chart I-1Investors Have Focused On The April Jobs And Inflation Data
Investors Have Focused On The April Jobs And Inflation Data
Investors Have Focused On The April Jobs And Inflation Data
Investors’ attention in May was focused squarely on two, ostensibly contradictory US data surprises: an extremely disappointing April jobs report, and a surge in consumer prices (Chart I-1). Abstracting from the typically lagging nature of consumer prices, a weak labor market is typically disinflationary / deflationary, not inflationary. But this is only to be expected in a typical environment where demand-side factors are predominantly driving the jobs market and the pricing decisions of firms, and the April data has made it clear that domestic and foreign supply-side constraints are now exerting a significant effect on the US economy, more forcefully than we initially thought. This warrants a further analysis of our prior view that supply-side effects would have a moderate effect on activity and prices this year, which we present below. A Deep Dive Into April’s Employment And Inflation Data Chart I-2 shows the difference between the April monthly gain in US jobs by industry compared with those of March. Almost all US industries saw a slower pace of jobs gains in April than March, but the slowdown was particularly acute in the professional & business services, transportation & warehousing, education & health services, construction, and manufacturing industries. By contrast, leisure & hospitality, the industry with the largest employment gap relative to pre-pandemic levels, saw a faster pace of April job gains relative to March. Chart I-2Breaking Down Disappointing April Payroll Gains
June 2021
June 2021
In our view, several facts from the April jobs report characterize the labor market as being in a transition towards a post-pandemic state, but also legitimately impacted by labor supply constraints at the low-skilled and blue-collar levels: Within professional & business services, almost all of the slowdown in monthly job gains occurred within temporary help services. Temp help services is a cyclical employment category over the longer-term, but over short periods of time it can also be negatively correlated with gains in full-time positions. April saw a large decline in the number of employed persons at work part time, suggesting that the slowdown in temp help may reflect a shift back to full-time work. Within transportation & warehousing, the slowdown in jobs was entirely attributed to the couriers and messengers subsector, which includes delivery services. In combination with the acceleration in jobs in the leisure & hospitality sector, this likely reflects a shift away from home food delivery towards in-person restaurant orders and the use of aggressive hiring tactics by restaurant owners (including advertisements of cash bonuses following 90 days of completed work, paid vacations, health insurance, and other perks). The slowdown in jobs growth in the construction & manufacturing industries is likely due to two, separate supply constraints: the negative impact of higher input costs such as lumber, semiconductors, and other raw materials, as well as the disincentivizing effects of supplementary unemployment benefits that appears to be limiting the willingness of lower-wage workers to return to work. Chart I-3April's Rise In Core CPI Was Extreme, Even After Removing Some Outliers
April's Rise In Core CPI Was Extreme, Even After Removing Some Outliers
April's Rise In Core CPI Was Extreme, Even After Removing Some Outliers
On the inflation front, Chart I-3 highlights that the April surge in core consumer prices did not just occur because of year-over-year base effects, but because of significant month-over-month increases in prices. Outsized gains in used car prices driven by the impact of the semiconductor shortage on new car production, as well as surging airline fares, did significantly contribute to April’s month-over-month gain, but the dotted line in the chart highlights that the monthly change would still have been extreme relative to history even if these components had increased instead at a 2% annual rate. Taken together, the April employment and inflation data, in conjunction with surveys of US firms as well as the trend in commodity prices, suggest that the labor market and consumer prices are being affected by four separate but related factors: An underlying demand effect, driven by extremely stimulative fiscal & monetary policy as well as economic reopening; A domestic labor shortage Coordination failures and bottlenecks impacting the production of key supply chain components and resource inputs Coordination failures and bottlenecks impacting the logistics of international trade Strong domestic aggregate demand is not likely to wane over the coming 6-12 months, which has been the basis for our view that inflation would rise to modestly above-target levels this year. Given this new evidence of their prominence and impact, it does seem likely that the remaining three supply-side factors will persist for a few more months, suggesting that core inflation may remain quite elevated over the near term. But several points underscore why it remains difficult to accept a view that supply-side factors will remain an important driver of employment and consumer price trends on a 1-year time horizon. Chart I-4Home Schooling Is Impacting The Labor Market
June 2021
June 2021
First, domestic labor shortages are occurring in the context of a gap of 8.2 million jobs relative to pre-pandemic levels, underscoring that substantial barriers to returning to work exist. The three most cited barriers are an unwillingness to return to employment for health reasons, an unwillingness to return to work because of supplementary unemployment insurance benefits that are in excess of regular income, and an inability to return to work due to childcare requirements. For example, Chart I-4 highlights that the labor force participation rate has declined the most for women with young children, whose children in many cases are being schooled online rather that in person. But all three of these factors are clearly linked to the pandemic, and are likely to be greatly reduced (or eliminated) in the fall once schools have reopened and income support has ended. Federal supplementary UI benefits are set to expire by labor day, and several US states have already opted out of the program – with benefits set to end in June or July.1 Second, global producers of important commodity inputs (such as lumber) significantly cut production last year under the expectation that the pandemic would greatly reduce spending, only to be whipsawed by a surge in demand stemming from a combination of working from home effects and a massive policy response. Chart I-5 highlights that US industrial production of wood products fell to -10% on a year-over-year basis last April, but that it has subsequently rebounded to a new high. Unlike other supply chain inputs, global semiconductor sales did not decline last April (in the face of enormous PC, tablet, and server/data center demand), but Chart I-6 highlights that DRAM prices, lumber prices, and prices of raw industrial goods may be peaking or have already peaked. Chart I-5Lumber Prices Are Soaring, In Part, Because Supply Was Cut Last Year
Lumber Prices Are Soaring, In Part, Because Supply Was Cut Last Year
Lumber Prices Are Soaring, In Part, Because Supply Was Cut Last Year
Chart I-6Costs of Key Inputs May Be Peaking (Or Have Peaked)
Costs of Key Inputs May Be Peaking (Or Have Peaked)
Costs of Key Inputs May Be Peaking (Or Have Peaked)
Chart I-7Logistical Issues, Which Will Be Resolved, Are Driving Shipping Costs
Logistical Issues, Which Will Be Resolved, Are Driving Shipping Costs
Logistical Issues, Which Will Be Resolved, Are Driving Shipping Costs
Third, while some market participants have attributed the enormous rise in global shipping costs entirely to the underlying demand effect that we noted above, Chart I-7 highlights that this is clearly not the case. The chart shows that the surge in loaded inbound container trade to the Los Angeles and Long Beach ports, to its strongest level since the inception of the data in the mid 1990s, could potentially explain a 75-100% year-over-year rise in shipping costs – less than half of the 250% surge that has occurred over the past 12 months. This strongly points to logistical issues such as the incorrect positioning of cargo containers amid pandemic-related port congestion (and other disruptions such as the temporary grounding of the Ever Given in the Suez canal) as the dominant driver of global shipping costs, which have likely pushed up US non-oil import prices by more than what would normally be implied by the decline in the US dollar (Chart I-8). Global shipping costs have yet to peak, but we expect that these logistical problems will likely be resolved sometime in Q3, or potentially over the summer. This view is underpinned by the fact that the number of global container ships arriving on time rose in March, the first month-over-month increase since June of last year.2 Chart I-8Rising Transport Costs Have Pushed Up US Import Prices
Rising Transport Costs Have Pushed Up US Import Prices
Rising Transport Costs Have Pushed Up US Import Prices
For investors, the key conclusion of this review is that while consumer prices may increase at a faster pace than we initially expected over the coming 3-4 months, supply-side factors are clearly driving outsized gains, and have likely or definite end points before the end of the year. As such, despite the surprising magnitude of these supply-side factors, they do genuinely appear to be transitory. The “Transitory” Debate Most investors would agree that 3-4 months of outsized consumer price increases would not be, in and of themselves, economically significant or investment relevant. But the question of whether even a temporary period of high inflation could persist over a 12-month or multi-year time horizon has become prominent in the marketplace, with some investors believing that it has high odds of fueling an already-established, demand-side narrative supporting higher prices in a way that becomes self-reinforcing among consumers and firms. Indeed, this view has a legitimate grounding in macro theory, and is explicitly recognized in the Fed’s inflation framework – which is called the expectations-augmented or Modern-Day Phillips Curve (“MDPC”). In anticipation of the coming debate about inflation and its causes, we thoroughly reviewed the MDPC in our January report.3 One crucial takeaway from the MDPC framework is that economic activity relative to its potential determines the degree to which inflation deviates from expectations of inflation, not the Fed’s inflation target. If, for example, inflation expectations are meaningfully below target, then the Fed would need to aim for an unemployment rate below its natural rate for some period of time in an attempt to re-anchor expectations closer to its target rate (based on the view that inflation expectations adapt to the actual inflation experience). This is essentially what occurred in the latter half of the last economic expansion, and is what motivated the Fed’s shift to its average inflation targeting regime. The Modern-Day Phillips Curve is “modern” because of the experience of inflation in the late 1960s and 1970s, where ever-rising expectations for inflation (alongside extremely easy monetary policy) became self-reinforcing and caused core PCE inflation to rise to high single-digit territory in the second half of the decade. Thus, the notion that elevated consumer prices over the short-term could increase actual inflation over the longer term via higher expectations – meaning that it would not be transitory – is plausible. Chart I-9The Fed's New Index Of Common Inflation Expectations (CIE)
The Fed's New Index Of Common Inflation Expectations (CIE)
The Fed's New Index Of Common Inflation Expectations (CIE)
Is it likely? In our view, while the odds have increased somewhat over the past month, the answer is no. Chart I-9 presents the Fed’s quarterly index of common inflation expectations (CIE), alongside a model designed to track movements in the index on a monthly frequency. While the Fed’s index includes over 21 inflation expectation indicators, our condensed model uses just six: the 10-year annualized rate of change in headline inflation, the 10-year annualized rate of change in the headline PCE deflator, 5-year/5-year forward and 10-year/10-year forward TIPS breakeven inflation rates, the 3-month moving average of long-term surveyed consumer expectations for inflation, and a proprietary measure of inflation expectations based on an adaptive expectations framework. Chart I-10 highlights that among these six series (shown standardized since mid 2004), three of them have risen quite significantly over the past year: long-dated TIPS breakeven inflation rates (5-5 and 10-10), and long-term consumer expectations for inflation. In our view, the latter series from the University of Michigan is one of the most important for investors to monitor over the coming year, as it is one of the few available measures of “main-street” inflation expectations with a long history. Chart I-10Important Drivers Of The CIE Index Have Risen, But From A Low Base
Important Drivers Of The CIE Index Have Risen, But From A Low Base
Important Drivers Of The CIE Index Have Risen, But From A Low Base
Chart I-11A Deeply Negative Output Gap Last Cycle Made Inflation Expectations Vulnerable To Shocks
A Deeply Negative Output Gap Last Cycle Made Inflation Expectations Vulnerable To Shocks
A Deeply Negative Output Gap Last Cycle Made Inflation Expectations Vulnerable To Shocks
But while the series in the top panel of Chart I-10 have risen sharply, they are rising from an extremely low base and are currently only fractionally above their average since 2004. As noted in our January report, inflation expectations fell significantly in 2014 first because they were highly vulnerable to shocks following a long period of a deeply negative output gap (Chart I-11), and second because they were catalyzed by a substantial US dollar / oil price shock that occurred in that year. We noted above that the odds of extreme near-term price changes ultimately becoming non-transitory have risen somewhat, and Chart I-12 highlights why. The chart presents the annual change in long-term consumer expectations of inflation alongside the annual change in 2-year government bond yields, and notes that the past three cases of a similar-sized spike in expectations were all ultimately met with either a significant rise in short-term interest rates or a major deflationary shock – neither of which we expect to occur over the coming year. Chart I-12Other Consumer Price Expectation Spikes Have Been Met By Rising Rates Or A Deflationary Shock
Other Consumer Price Expectation Spikes Have Been Met By Rising Rates Or A Deflationary Shock
Other Consumer Price Expectation Spikes Have Been Met By Rising Rates Or A Deflationary Shock
However, the fact that the rise in expectations clearly has a mean-reversion component to it, and that the supply-side factors driving month-over-month price increases are temporary in nature, argues against the idea that expectations will rise above the average that prevailed from 2002 – 2014. This suggests that while the baseline for inflation has moved back closer to the Fed’s target, deviations above or below target are likely to be driven by demand-side rather than supply-side factors. The Fed’s Checklist: Focus On Employment Table I-1The Fed’s Checklist For Liftoff
June 2021
June 2021
From an investment perspective, the outlook for inflation is important mostly because of its implications for Fed policy, and thus interest rates and equity valuation multiples. My colleague Ryan Swift, BCA’s US Bond Strategist, has presented the Fed’s checklist for liftoff in Table I-1. The Fed has been explicit that they will not raise interest rates until all three boxes are checked, regardless of what is occurring to inflation expectations or actual inflation. The first box in the list is essentially checked, as tomorrow’s April Personal Income and Outlays report will very likely confirm that the core PCE deflator rose in excess of 2% (the headline PCE deflator was already in excess of this in March). And the third criterion is essentially a derivative of the other two, barring the emergence of a significant deflationary shock at the time that the Fed would otherwise begin to raise rates. This means that investors should be entirely focused on labor market developments, and whether they are consistent with the Fed’s assessment of maximum employment. Table I-2 highlights the average monthly nonfarm payroll growth that will be required for the unemployment rate to reach 3.5-4.5%, the range of the Fed’s NAIRU estimates. The table underscores that large gains will be required for the Fed’s maximum employment criteria to be met by the end of this year or year-end 2022, on the order of 410-830k per month. Table I-2Calculating The Distance To Maximum Employment
June 2021
June 2021
But the nature of the pandemic and the factors that drove what is still an 8.2 million jobs gap underscore the extreme difficulty in forecasting what monthly job gains are likely to occur on average over the coming 12-18 months. From March to August of last year, monthly changes in nonfarm payrolls exceeded +/-1 million per month, with 20.7 million jobs lost in the month of April 2020 alone. Payroll gains averaged 3.8 million per month in the two months that followed, and if that pace were to be repeated this fall as schools reopen and supplementary unemployment benefits draw to a close in all states it would close 93% of the outstanding jobs gap. This implies that monthly job growth will follow a bimodal distribution over the coming year, with large gains in Q3/Q4 followed by a much more normal pace of jobs growth in Q1/Q2 2022. In our view, the outlook for Fed policy depends significantly on the magnitude of those outsized gains in employment this fall, and there are three main arguments favoring a larger pace of monthly job growth during this period. First, Table I-3 highlights that the jobs gap is most prominent in the leisure & hospitality, government, education & health services, and professional & business services industries, and several observations suggest that Q3/Q4 job gains in these sectors may be sizeable: Table I-3Breaking Down The Pandemic Employment Gap By Industry
June 2021
June 2021
70% of the government employment gap shown in Table I-3 can be attributed to education, as government employment also includes education employment at the state and local government level. Many of these jobs, along with those in the education & health services industry, are likely to recover in the fall as schools reopen across the country. As noted in our discussion of the April jobs data, the professional & business services industry includes the “administrative & support services” sector, which accounts for 85% of the overall job gap for the industry. These jobs have likely been impacted heavily by reduced office presence as well as business travel, and may recover further in the fall as many employees shift partially or fully away from working from home. Chart I-13Leisure & Hospitality Employment Is Closely Tracking Hotel Occupancy
Leisure & Hospitality Employment Is Closely Tracking Hotel Occupancy
Leisure & Hospitality Employment Is Closely Tracking Hotel Occupancy
Chart I-13 highlights that the year-over-year growth rates of leisure & hospitality employment and the US hotel occupancy rate are tracking each other quite closely, and that the latter is in a solid uptrend.4 While international travel is likely to remain muted this summer, the rebound in hotel occupancy suggests that Americans are choosing to travel domestically this year and that further gains in occupancy may occur over the coming months. Chart I-14 highlights the second argument in favor of a larger pace of monthly job growth in the second half of the year. The chart shows the clear relationship between reopening and the employment gap, with states that have fully reopened having substantially smaller gaps than states that have not. It is true that some states that have fully reopened are still experiencing a sizeable gap, but this is at least in part due to leisure & hospitality employment that is dependent on the travel patterns of consumers. For example, Nevada still has a 10% employment gap despite having fully reopened, clearly reflecting the impact of reduced tourism to Las Vegas. Thus, as all states move towards being fully reopened later this year, including large states such as New York and California, Chart I-14 suggests that the US jobs gap is likely to narrow significantly. Chart I-14US States That Have Reopened Have A Smaller Employment Gap
June 2021
June 2021
Chart I-15Real Output Per Worker Is Not Likely To Rise Further
Real Output Per Worker Is Not Likely To Rise Further
Real Output Per Worker Is Not Likely To Rise Further
Finally, Chart I-15 highlights that the 2020 recession is the only one in which real output per person rose sharply during the recession. It is true that productivity tends to rise over time and that it usually increases in the early phase of an economic recovery, but the rise in real output per worker last year clearly reflects the massive decline in employment and services spending that resulted from pandemic-related control measures and lockdowns. Our sense is that this sharp rise in real output per worker is not likely to be sustained following full reopening and the elimination of barriers to employment, and if real output per worker were to even modestly converge to its prior trend (the dotted line in Chart I-15) it would more than fully close the jobs gap shown in Table I-3 by the end of the year based on consensus growth forecasts for this year. Investment Conclusions Despite compelling arguments for outsized jobs growth in the second half of the year, the bottom line for investors is that there is tremendous uncertainty concerning its magnitude. It seems likely that there will be some lasting changes to consumer behavior following the pandemic, and visibility about the employment consequences of these changes will remain very low until investors receive more information about the likely urban office footprint and downtown commuter presence, the speed at which international travel will return, and the degree to which any pandemic control measures remain in place in the second half of the year. Given the Fed’s criteria for liftoff, developments that imply a pace of jobs recovery that is in line with or slower than the Fed’s unemployment rate projections will ensure that the monetary policy regime will remain supportive of risky asset prices over the coming year. If the employment gap closes rapidly in Q3/Q4, then investor expectations for the timing of the first rate hike will move sharply closer, which could act as a negative inflection point for stock prices. This is now more probable than it was a month ago, as Chart I-16 highlights that the OIS curve has shifted towards expectations of an initial rate hike at the end of next year or early 2023, from mid 2022 previously. Chart I-16Market Rate Hike Expectations Have Shifted Back To Late 2022 / Early 2023
Market Rate Hike Expectations Have Shifted Back To Late 2022 / Early 2023
Market Rate Hike Expectations Have Shifted Back To Late 2022 / Early 2023
Still, abstracting from knee-jerk market reactions, it is the pace of hikes and investor expectations for the terminal Fed funds rate that are the more important fundamental drivers of 10-year Treasury yields, and investors would need to see a very large revision to the latter in order for yields to rise to a point that would restrict economic activity or threaten equity market multiples. Such a revision is highly unlikely over the summer unless incoming evidence strongly suggests that the employment gap will be closed by the end of the year. As highlighted above, this may indeed occur later in the year, but probably not over the coming 3 months. For now, investors should remain cyclically overweight stocks versus bonds, short duration, and invested in other procyclical positions, with an eye to reassess the monetary policy and growth outlook in the late summer / early fall. Jonathan LaBerge, CFA Vice President The Bank Credit Analyst May 27, 2021 Next Report: June 24, 2021 II. Global House Prices: A New Threat For Policymakers House prices are rising rapidly across the developed markets, in response to the extraordinary monetary and fiscal policy stimulus implemented to fight the pandemic. Evidence points to the house price surge being driven by monetary policy that has left real interest rates far below equilibrium levels. Supply factors are a secondary cause of the house price boom. Financial stability risks stemming from rising house prices are less acute than the pre-2008 experience, as overall household leverage has grown more slowly during the pandemic and global banks are better capitalized. Rapidly rising house prices are forcing some central banks to turn less accommodative earlier than expected. The recent hawkish turns by the Bank of Canada and Reserve Bank of New Zealand may be canaries in the coal mine for other central banks – perhaps even the Fed – if house prices and household leverage start rising together. The COVID-19 pandemic led to the sharpest economic recession since World War II, alongside an enormous rise in unemployment. Consensus expectations call for the output gap to be closed (or mostly closed) in most advanced economies by the end of this year, but it remains an open question how quickly these economies will be able to return to full employment amid potentially permanent shifts in demand for office space and goods sold at physical, “brick and mortar” retail locations. Despite this sizeable and swift economic shock, house price appreciation accelerated last year in the developed world. Chart II-1 highlights that US house prices rose at an 18% annualized pace in the second half of 2020, whereas they accelerated at a high-single digit pace in developed markets ex-US (on a GDP-weighted basis). This, in conjunction with a sharp rise in the household sector credit-to-GDP ratio (Chart II-2), has unnerved some investors while raising questions about the implications for monetary policy. Chart II-1House Prices Are Surging Around The World
House Prices Are Surging Around The World
House Prices Are Surging Around The World
Chart II-2Rising Fears About Deteriorating Household Balance Sheets
Rising Fears About Deteriorating Household Balance Sheets
Rising Fears About Deteriorating Household Balance Sheets
Before we discuss the investment implications of the global housing boom, however, we must first accurately determine the reasons why it is happening. The Work-From-Home Effect: Less Than Meets The Eye When analyzing the surprising behavior of the housing market last year, the working-from-home effect brought upon by the pandemic emerges as an obvious factor potentially explaining house price gains. Last year, following recommended or mandatory stay-at-home orders from governments, most office-based businesses rapidly shifted to work-from-home arrangements as an emergency response. However, in the month or two following the beginning of stay-at-home orders, several national US surveys found many office workers preferred the flexibility afforded by work-from-home arrangements. Many employers, correspondingly, found that the productivity of their employees did not suffer while working from home, or that it even improved. Several prominent corporations in the US have subsequently made some work-from-home options permanent, or even allowed employees to work from offices in a different city than they did prior to the pandemic. Newfound work-from-home options have undoubtedly created new demand for housing, and thus explained the surge in house prices seen over the past year in the minds of some investors. However, in our view, evidence from the US, the UK, and France suggests that the work-from-home effect better explains differences in price gains across housing types and within large metropolitan areas, rather than aggregate or national-level changes in house prices. Chart II-3 provides some quantification of the impact of work-from-home policies by plotting US resident migration patterns by city. This data has been compiled by CBRE, and the impact of COVID is shown as the change in net move-ins from 2019 to 2020 per 1000 people. This helps control for the underlying migration pattern that existed in US cities prior to the pandemic. Chart II-3Work From Home Policies Have Impacted Migration Trends…
June 2021
June 2021
The chart highlights that the negative migration impact from COVID has been mostly concentrated in New York City and the three most populous cities on the West Coast (by metro area): Los Angeles, San Francisco, and Seattle. And yet, Chart II-4 highlights that house price inflation in these four cities has accelerated to a double-digit pace, only modestly below the national average. Chart II-4...But Cities With Outward Migration Still Have Very Strong House Price Gains
...But Cities With Outward Migration Still Have Very Strong House Price Gains
...But Cities With Outward Migration Still Have Very Strong House Price Gains
The house price indexes shown in Chart II-4 represent aggregate, metro area trends, and clearly some regions within these metro areas have experienced house price deceleration or outright deflation versus gains in areas outside the urban core. But Chart II-5 highlights that house prices have declined in Manhattan basically in line with the change in net move-ins as a share of the population, underscoring that double-digit metro area-wide house price gains appear to be vastly disproportionate to changes in net migration. Similarly, Chart II-6 highlights that rents decelerated in the US over the past year but remained in positive territory and grew at a 3.5% annualized rate from February to April. Chart II-5In Manhattan, House Prices Have Tracked Net Migration
June 2021
June 2021
Chart II-6Rent Costs Have Decelerated, But Have Not Contracted
Rent Costs Have Decelerated, But Have Not Contracted
Rent Costs Have Decelerated, But Have Not Contracted
Evidence from Paris and London also suggests that a work-from-home effect is insufficient to explain broad house price gains. Panel 1 of Chart II-7 highlights that house prices in France have accelerated significantly, but that apartment prices have decelerated only fractionally in lockstep. Panel 2 shows that the acceleration in house prices does reflect a work-from-home effect, as prices have risen faster in inner Parisian suburbs. Panel 3, however, highlights that Parisian apartment prices, the dominant property type in the urban core, have decelerated modestly. Chart II-8 highlights that house price gains have not even decelerated in greater London; they have been merely been modestly outstripped by gains in Outer South East (outside of the Outer Metropolitan Area). Chart II-7In France, Parisian Apartment Prices Are Simply Lagging, Not Falling
In France, Parisian Apartment Prices Are Simply Lagging, Not Falling
In France, Parisian Apartment Prices Are Simply Lagging, Not Falling
Chart II-8In The UK, Greater London Property Prices Are Accelerating
In The UK, Greater London Property Prices Are Accelerating
In The UK, Greater London Property Prices Are Accelerating
The Policy Effect: The Fundamental Driver Of The Housing Market Despite the broader location flexibility that work-from-home policies now provide to potential homeowners, it seems inconceivable that the housing market would have responded in the manner that it has over the past year given the size of the economic shock brought on by the pandemic without significant support from policy. Above-the-line fiscal measures to the pandemic have totaled in the double-digits in advanced economies (Chart II-9), and monetary policy has contributed to easier financial conditions via rate cuts, asset purchases, and sizeable programs to support financial market liquidity. Chart II-9There Has Been A Massive Fiscal Policy Response To The Crisis
June 2021
June 2021
In fact, Charts II-10-II-13 present compelling evidence that fiscal and monetary policy have been the core drivers of significant house price gains over the past year. Charts II-10 and II-11 plot the above-the-line fiscal response of advanced economies against the year-over-year growth rate in house prices as well as its acceleration (the change in the year-over-year growth rate). The charts show a clearly positive relationship, with a stronger link between the pandemic fiscal response and the acceleration in house prices. Chart II-10Differences In Last Year’s Fiscal Response…
June 2021
June 2021
Chart II-11…Help Explain Differences In House Price Gains
June 2021
June 2021
Chart II-12Pre-Pandemic Differences In The Monetary Policy Stance…
June 2021
June 2021
Chart II-13…Do An Even Better Job Of Explaining 2020 House Price Gains
June 2021
June 2021
Charts II-12 and II-13 highlight the even stronger link between house prices and the pre-pandemic monetary policy stance in advanced economies, defined as the difference between each country’s 2-year government bond yield and its Taylor Rule-implied policy interest rate as of Q4 2019. We construct each country’s Taylor Rule using the original specification, with core consumer price inflation, a 2% inflation target, and real potential GDP growth as the definition of the real equilibrium interest rate. The charts make it clear that easy monetary policy strongly explains house price gains in 2020, particularly the year-over-year percent change rather than its acceleration. This makes sense, given that monetary policy was already quite easy in many countries at the onset of the pandemic – meaning that changes were less pronounced than they would have been had interest rates been higher. The explanation that emerges from Charts II-10-II-13 is that historic fiscal easing, combined with an easy starting point for monetary policy – that became even easier last year – enabled demand from work-from-home policies to manifest during an extremely severe recession. We agree that work-from-home policies have shifted the geographic preferences of some home buyers and likely provided a new source of net demand from renters in urban cores purchasing homes in outlying areas. But we strongly doubt that the net effect of work-from-home policies in the midst of an extreme shock to economic activity would have caused the rise in house prices that we have observed, certainly not to this level, without major support from policy. This underscores that policy, and not the work-from-home effect, has and will likely remain the core driver of the global housing market. The Supply Effect: Mostly A Red Herring Chart II-14Countries Fall Into Two Groups In Terms Of The Relative Trend In Real Residential Investment
Countries Fall Into Two Groups In Terms Of The Relative Trend In Real Residential Investment
Countries Fall Into Two Groups In Terms Of The Relative Trend In Real Residential Investment
One perennial question that emerges when analyzing the housing market, particularly in markets with outsized house price gains, is the impact of constrained supply. It is frequently argued that constrained supply is squeezing prices higher in many markets, and that the appropriate policy solution to extreme house price gains is to enable widespread housing construction – not to raise interest rates. We do not rule out the potential impact of constrained supply in certain cities or regional housing markets, and we have highlighted in previous research that a positive relationship does exist between population density in urban regions and median house price-to-income ratios.5 But as a broad explanation for supercharged house price gains, the supply argument appears to fall flat. Chart II-14 presents the most standardized measure of cross-country housing supply available for several advanced economies, the trend in real residential investment relative to real GDP over time. These series are all rebased to 100 as of 1997, prior to the 2002-2007 US housing market boom. The chart makes it clear that advanced economies generally fall into two groups based on this metric: those that have seen declines in real residential investment relative to GDP, especially after the global financial crisis (panel 1), and those that have experienced either an uptrend in housing construction relative to output or have seen a flat trend (panel 2). If scarce housing supply was the core driver of outsized house price gains, then we would expect to see stronger gains in the countries shown in panel 1 and smaller gains in the countries shown in panel 2. In fact, mostly the opposite is true: Charts II-15 and II-16 highlight that the relationship between the level of these indexes today relative to their 1997 or 2005 levels is positively related to the magnitude of house price gains last year, suggesting that housing market supply has generally been responding to demand over the past decade. The US and possibly New Zealand stand as possible exceptions to the trend, suggesting that relatively scarce supply may be boosting prices even further in these markets beyond what fiscal and monetary policy would suggest. Chart II-15Countries That Have Seen A Stronger Pace Of Residential Investment…
June 2021
June 2021
Chart II-16…Have Experienced Stronger House Price Gains
June 2021
June 2021
Chart II-17Is This Not Enough Supply, Or Too Much Demand?
June 2021
June 2021
As a final point about the inclination of investors to gravitate towards supply-side arguments related to the housing market, Chart II-17 presents a simple thought experiment. The chart shows a simple housing supply-demand curve diagram, in a scenario where the demand curve for housing has shifted out more than the supply curve has (thus raising house prices). Is this a scenario in which supply is too tight? Or is it a case in which demand is too strong? In our view, the tight supply answer is reasonable in circumstances where the increase in demand is normal or otherwise sustainable. But Charts II-10-II-13 clearly showed that housing demand is being boosted by easy policy, which in the case of some countries has occurred for years: interest rates have remained well below levels that macroeconomic theory would traditionally consider to be in equilibrium, and this has occurred alongside significant household sector leveraging (Chart II-18). As such, in our view, investors should be more inclined to view the global housing market as generally being driven by demand-side rather than supply-side factors. This Is Not 2007/08 … Yet We highlighted in Chart II-2 above that the household sector debt-to-GDP ratio increased sharply last year, which has raised some questions about debt sustainability among investors. For the most part, the rise in this ratio actually reflects denominator effects (namely a sharp contraction in nominal GDP) rather than a huge surge in household debt. Chart II-19 shows BIS data for the annual growth in total household debt in developed economies was roughly stable last year, at least until Q3 (the most recent datapoint available from the BIS). Chart II-18Low Interest Rates Have Fueled Household Leveraging
Low Interest Rtaes Have Fueled Household Leveraging
Low Interest Rtaes Have Fueled Household Leveraging
Chart II-19Total Credit Growth Has Been Stable, But Mortgage Credit Growth Is Accelerating
Total Credit Growth Has Been Stable, But Mortgage Credit Growth Is Accelerating
Total Credit Growth Has Been Stable, But Mortgage Credit Growth Is Accelerating
Chart II-20US Mortgage Growth Is Picking Up, As Repayments Slow Consumer Credit Growth
US Mortgage Growth Is Picking Up, As Repayments Slow Consumer Credit Growth
US Mortgage Growth Is Picking Up, As Repayments Slow Consumer Credit Growth
But Chart II-19 shows the recent trend in total household debt, which masks diverging mortgage and non-mortgage debt trends. In the US, euro area, Canada, and Sweden, household mortgage debt has accelerated to varying degrees, underscoring that households have likely paid down non-mortgage debt with some of the savings that they have accumulated from a significant reduction in spending on services. Chart II-20 shows this effect directly in the case of the US; mortgage debt growth accelerated by roughly 1.5 percentage points in the second half of the year, whereas consumer credit growth (made up of student loans, auto loans, credit cards, and other revolving credit) decelerated significantly. This aligns with data showing that US households have used some of their savings windfall to pay down their credit card balances. This changing mix within household debt - less higher-interest-rate consumer credit, more lower-interest-rate collateralized mortgage debt – could, on the margin, help mitigate financial stability risks from the housing boom by moderating overall debt service burdens. The starting point for the latter matters, though, in accurately assessing the risks from rising house prices and increased mortgage debt, particularly in countries where household debt levels are already high. According to data from the BIS, the US already has one of the lowest household debt service ratios (7.6%) among the developed economies (Chart II-21).6 This compares favorably to the double-digit debt service ratios in the “higher-risk” countries like Canada (12.6%), Sweden (12.1%) and Norway (16.2%). On top of that, US commercial banks have become far more prudent with mortgage loan underwriting standards since the 2008 financial crisis. The New York Fed’s Household Debt and Credit report shows that an increasing majority of mortgage lending made by US banks since the 2008 crisis has been to those with very high FICO credit scores (Chart II-22). This is in sharp contrast to the steady lending to “subprime” borrowers with poor credit scores that preceded the 2008 financial crisis. The median FICO score for new mortgage originations as of Q1 2021 was 788, compared to 707 in Q4 2006 at the peak of the mid-2000s US housing boom. Chart II-21Diverging Trends In Global Household Debt Servicing Costs
Diverging Trends In Global Household Debt Servicing Costs
Diverging Trends In Global Household Debt Servicing Costs
Chart II-22US Banks Have Become More Prudent With Mortgage Lending
US Banks Have Become More Prudent With Mortgage Lending
US Banks Have Become More Prudent With Mortgage Lending
US bank balance sheets are also now less directly exposed to a fall in housing values. Residential loans now represent only 10% of the assets on US bank balance sheets, compared to 20% at the peak of the last housing bubble (Chart II-23). This puts the US in the “lower-risk” group of countries in Europe, the UK and Japan where mortgages are less than 20% of bank balance sheets. This compares favorably to the “higher risk” group of countries where residential loans are a far larger share of bank assets (Chart II-24), like Canada (32%), New Zealand (49%), Sweden (45%) and Australia (40%). Chart II-23Banks Have Limited Direct Exposure To Housing Here
Banks Have Limited Direct Exposure To Housing Here
Banks Have Limited Direct Exposure To Housing Here
Chart II-24Banks Are Far More Exposed To Housing Here
Banks Are Far More Exposed To Housing Here
Banks Are Far More Exposed To Housing Here
Like nature, however, the financial ecosystem abhors a vacuum. “Non-bank” mortgage lenders have filled the void from traditional US banks reducing their lending to lower-quality borrowers, and they now represent around two-thirds of all US mortgage origination, a big leap from the 20% origination share in 2007. Non-bank lenders have also taken on growing shares of new mortgage origination in other countries like the UK, Canada and Australia. Chart II-25Global Banks Can Withstand A Housing Shock
June 2021
June 2021
Non-bank lenders do not take deposits and typically fund themselves via shorter-term borrowings, which raises the potential for future instability if credit markets seize up. These lenders also, on average, service mortgages with a higher probability of default, so they are exposed to greater credit losses when house prices decline. However, the risk of a full-blown 2008-style commercial banking crisis, with individual depositors’ funds at risk from a bank failure, are reduced with a greater share of riskier mortgage lending conducted by non-bank entities. This is especially true with global commercial banks far better capitalized today, with double-digit Tier 1 capital ratios (Chart II-25), thanks to regulatory changes made after the Global Financial Crisis. Net-net, we conclude that the overall financial stability implications of the current surge in house prices in the developed economies are relatively modest on average. The acceleration in mortgage growth has occurred alongside reductions in non-mortgage growth, at a time when banks are better able to withstand a shock from any sustained future downturn in house prices. However, if house prices continue to accelerate and new homebuyers are forced to take on ever increasing amounts of mortgage debt, financial stability issues could intensify in some countries. Services spending will recover in a vaccinated post-COVID world, as economies reopen and consumer confidence improves, which will likely end the trend of falling non-residential consumer debt offsetting rising mortgage debt in countries like the US and Canada. Overall levels of household debt could begin to rise again relative to incomes, building up future financial stability risks when central banks begin to normalize pandemic-related monetary policies – a process that has already started in some countries because of the housing boom. The Monetary Policy Implications Of Surging House Prices Rapidly appreciating house prices are becoming an area of concern for policymakers in countries like Canada and New Zealand, where the affordability of housing is becoming a political, as well as an economic, issue. In the case of New Zealand, the government has actually altered the remit of the Reserve Bank of New Zealand (RBNZ) to more explicitly factor in the impact of monetary policy on housing costs. The Bank of Canada announced in April that it would taper its pace of government debt purchases and signaled that its decision was based, at least in small part, on signs of speculative behavior in Canada’s housing market. Macroprudential measures like limiting loan-to-value ratios of new mortgage loans are a policy option that governments in those countries have already implemented to try and cool off housing demand. Yet while such measures can help alleviate demand-supply mismatches in certain cities and regions, the efficacy of such measures in sustainably slowing the ascent of house prices on a national scale is unclear. In the April 2021 IMF Global Financial Stability Report, researchers estimated that, for a broad group of countries, the implementation of a new macro-prudential measure designed to cool loan demand reduced national household debt/GDP ratios by a mere one percentage point, on average, over a period encompassing four years.7 If macroprudential measures are that ineffective in sustainably reducing demand for mortgage loans, then the burden of slowing house price appreciation will have to fall on the more blunt instruments of monetary policy. Importantly, surging house price inflation is not likely to give a boost to realized inflation measures – an important issue given the current backdrop of rapidly rising realized inflation rates in many countries. Housing costs do represent a significant portion of consumer price indices in many developed countries, ranging from 19% in New Zealand to 33% in the US (Chart II-26), with the euro area being the outlier with housing having a mere 2% weighting in the headline inflation index. Chart II-26A Limited Impact On Actual Inflation From Housing
June 2021
June 2021
Yet those so-called “housing” categories overwhelmingly measure only housing rental costs and not actual house prices. This is an important distinction because rents – which are often imputed measures like in the US and not even actual rental costs - are rising at a far slower pace than actual house prices in most countries, so the housing contribution to realized inflation is relatively modest. So the good news is that booming house prices will not worsen the acceleration of realized global inflation that has concerned investors and policymakers in 2021. Yet that does not mean that central bankers will not be forced to tighten policy to cool off red-hot housing demand that is clearly being fueled by persistently negative real interest rates. In Chart II-27 and Chart II-28, we show both nominal and real policy interest rates for the “lower risk” and “higher risk” country groupings that we described earlier. The real policy rates are nominal policy rates versus realized headline CPI inflation. The dotted lines in the charts represent the future path of rates discounted by markets. Specifically, the projection for nominal rates is taken from overnight index swap (OIS) forward curves, while the projection for real rates is calculated by subtracting the discounted path of inflation expectations extracted from CPI swap forwards. Chart II-27Markets Discounting Negative Real Rates For The Next Decade
Markets Discounting Negative Real Rates For The Next Decade
Markets Discounting Negative Real Rates For The Next Decade
Chart II-28Negative Real Rates Are Unsustainable During A Housing Bubble
Negative Real Rates Are Unsustainable During A Housing Bubble
Negative Real Rates Are Unsustainable During A Housing Bubble
There are two key takeaways from these charts: Real policy interest rates are at or very close to the most deeply negative levels seen since the 2008 financial crisis. Markets are discounting that real rates will be at or below 0% for most of the next decade. Admittedly, there is room for debate over what the equilibrium level of real interest rates (a.k.a. “r-star”) should be in the coming years. However, we deem it a major stretch to believe that real rates need to be persistently low or negative for the next ten years to support even trend growth across the developed economies. In our view, the current boom in housing demand and mortgage borrowing provides clear evidence that negative real rates are below equilibrium and, thus, are stimulating credit demand. Thus, the only way for a central bank to cool off housing demand will be to raise both nominal and, more importantly, real interest rates. Canada and New Zealand will be the “canaries in the coal mine” among developed market central banks for such a move. According to the latest Bank of Canada Financial Stability Review, nearly 22% of Canadian mortgages are highly levered, with a loan-to-value ratio greater than 450%, a greater share of such mortgages than during the 2016/17 housing boom (Chart II-29). Canadian house prices have risen to such an extent that home prices in major cities like Toronto, Vancouver and Montreal are among the most expensive in North America.8 Stunningly, a recent Bloomberg Nanos opinion poll revealed that nearly 50% of Canadians would support Bank of Canada rate hikes to cool off the red-hot housing market (Chart II-30). The central bank will be unable to resist the pressure to use monetary policy to slam on the brakes of the housing market – investors should expect more tapering and, eventually, rate hikes from the Bank of Canada over at least the next couple of years. Chart II-29Canadians Are Leveraging Up To Buy Expensive Homes
Canadians Are Leveraging Up To Buy Expensive Homes
Canadians Are Leveraging Up To Buy Expensive Homes
Chart II-3050% Of Canadians Want A Rate Hike To Cool Housing
June 2021
June 2021
In New Zealand, worsening housing affordability has reached a point where a 20% down payment on the median national house price is equal to 223% of median disposable income (Chart II-31). This is forcing more first-time home buyers to take on levels of mortgage debt that the RBNZ deems highly risky (top panel). Like the Bank of Canada, the RBNZ will prove to be one of the most hawkish central banks in the developed world over the next couple of years as the central bank follows their newly-revised remit to try and cool off housing demand in New Zealand. Who is next? Housing values, measured by the ratio of median national house prices to median national household incomes, are rising in the US and UK but are still below the peaks of the mid-2000s housing bubble (Chart II-32). Meanwhile, housing is becoming more expensive across the euro area, but not in a consistent manner, with valuations in Germany and Spain having increased far more than in France or Italy. Housing valuations have actually improved in Australia over the past couple of years on a price-to-income basis. The most likely candidates for a housing-related hawkish turn are in Scandinavia, with housing valuations in Sweden and Norway closing in on Canada/New Zealand levels. Chart II-31New Zealand Housing Is Wildly Unaffordable
New Zealand Housing Is Wildly Unaffordable
New Zealand Housing Is Wildly Unaffordable
Chart II-32Global House Price/Income Ratios Are Trending Higher
Global House Price/Income Ratios Are Trending Higher
Global House Price/Income Ratios Are Trending Higher
Investment Conclusions The current acceleration in global house prices is an inevitable outcome of the extraordinary monetary and fiscal easing implemented during the pandemic. Higher realized inflation is pushing real rates deeper into negative territory in many countries, fueling the demand for housing. Central banks in countries with more stretched housing valuations will be forced to turn more hawkish sooner than expected, leading to tapering and, eventually, rate hikes to cool housing demand. This has negative implications for government bond markets in countries where housing is more expensive and real yields remain too low, like Canada, New Zealand and Sweden (Chart II-33). Investors should limit exposure to government bonds in those markets over the next 6-12 months. Chart II-33Negative Real Yields & Expensive Housing Valuations – An Unsustainable Mix
June 2021
June 2021
Bond markets in countries where house prices are not rising rapidly enough to force policymakers to turn more hawkish more quickly – like core Europe, Australia and even Japan - are likely to be relative outperformers. The US and UK are “cuspy” bond markets, as housing valuations are becoming more expensive in those two countries but the Fed and Bank of England are not facing the same domestic political pressure to use monetary policy tools to fight the growing unaffordability of housing. That could change, though, if overall household leverage begins to rise alongside house price inflation as the US and UK economies emerge from the pandemic. Current pricing in OIS curves shows that markets expect the RBNZ and Bank of Canada to begin hiking rates in May 2022 and September 2022, respectively (Table II-1). This is well ahead of expectations for “liftoff” from other developed markets central banks, including the Fed in April 2023. The cumulative amount of rate hikes following liftoff to the end of 2024 is highest in Canada, New Zealand, the US and Australia. Those are also countries with currencies that are trading at or above the purchasing power parity levels derived from our currency strategists’ valuation models. This highlights the difficult choice that central bankers facing housing bubbles must confront, as the rate hikes that will help cool off housing demand will lead to currency appreciation that could impact other parts of their economies like exports and manufacturing. Table II-1Hawkish Central Banks Must Live With Currency Strength
June 2021
June 2021
Tracking the second-round economic consequences of eventual monetary policy actions to control excessive house price inflation, particularly in “higher risk” countries, is likely to be the subject of future Bank Credit Analyst / Global Fixed Income Strategy reports. Jonathan LaBerge, CFA Vice President The Bank Credit Analyst Robert Robis, CFA Chief Fixed Income Strategist III. Indicators And Reference Charts BCA’s equity indicators highlight that the “easy” money from expectations of an eventual end to the pandemic have already been made. Our technical, valuation, and sentiment indicators are very extended, highlighting that investors should expect positive but more modest returns from stocks over the coming 6-12 months. Our monetary indicator has aggressively retreated from its high last year, reflecting a meaningful recovery in government bond yields since last August. The indicator remains above the boom/bust line, however, highlighting that monetary policy remains supportive for risky asset prices. Forward equity earnings already price in a complete earnings recovery, but for now there is no meaningful sign of waning forward earnings momentum. Net revisions remain positive, and positive earnings surprises have risen to their strongest levels on record. Within a global equity portfolio, there has been a modest tick up in global ex-US equity performance, led by European stocks. EM stocks had previously dragged down global ex-US performance, and they continue to languish. Japanese stocks have cratered in relative terms since the beginning of the year, seemingly driven by service sector underperformance resulting from a surge in COVID-19 cases since the beginning of March. While Japanese equity performance may stage a reversal over the coming 3 months as cases counts decline and progress continues on the vaccination front, we expect global ex-US performance to continue to be led by European stocks. The US 10-Year Treasury yield has traded sideways since mid-March, after having risen to levels that were extremely technically stretched. Despite this pause, our valuation index highlights that bonds are still expensive, and that yields could move higher over the cyclical investment horizon if employment growth in Q3/Q4 implies a faster return to maximum employment than currently projected by the Fed. We expect the rise to be more modest than our valuation index would imply, but we would still recommend a short duration stance within a fixed-income portfolio. Commodity prices, particularly copper, lumber, and agricultural commodities, have screamed higher over the past several months. This reflects bullish cyclical conditions, but also pandemic-induced supply shortages that are likely to wane later this year. Commodity prices are extremely technically stretched and sentiment is very bullish for most commodities, suggesting that a breather in commodity prices is likely at some point over the coming several months. US and global LEIs remain in a solid uptrend, and global manufacturing PMIs are strong. Our global LEI diffusion index has declined significantly, but this likely reflects the outsized impact of a few emerging market countries (whose vaccination progress is lagging). Strong leading and coincident indicators underscore that the global demand for goods is robust, and that output is below pre-pandemic levels in most economies because of very weak services spending. The latter will recover significantly later this year, as social distancing and other pandemic control measures disappear. EQUITIES: Chart III-1US Equity Indicators
US Equity Indicators
US Equity Indicators
Chart III-2Willingness To Pay For Risk
Willingness To Pay For Risk
Willingness To Pay For Risk
Chart III-3US Equity Sentiment Indicators
US Equity Sentiment Indicators
US Equity Sentiment Indicators
Chart III-4Revealed Preference Indicator
Revealed Preference Indicator
Revealed Preference Indicator
Chart III-5US Stock Market Valuation
US Stock Market Valuation
US Stock Market Valuation
Chart III-6US Earnings
US Earnings
US Earnings
Chart III-7Global Stock Market And Earnings: Relative Performance
Global Stock Market And Earnings: Relative Performance
Global Stock Market And Earnings: Relative Performance
Chart III-8Global Stock Market And Earnings: Relative Performance
Global Stock Market And Earnings: Relative Performance
Global Stock Market And Earnings: Relative Performance
FIXED INCOME: Chart III-9US Treasurys And Valuations
US Treasurys And Valuations
US Treasurys And Valuations
Chart III-10Yield Curve Slopes
Yield Curve Slopes
Yield Curve Slopes
Chart III-11Selected US Bond Yields
Selected US Bond Yields
Selected US Bond Yields
Chart III-1210-Year Treasury Yield Components
10-Year Treasury Yield Components
10-Year Treasury Yield Components
Chart III-13US Corporate Bonds And Health Monitor
US Corporate Bonds And Health Monitor
US Corporate Bonds And Health Monitor
Chart III-14Global Bonds: Developed Markets
Global Bonds: Developed Markets
Global Bonds: Developed Markets
Chart III-15Global Bonds: Emerging Markets
Global Bonds: Emerging Markets
Global Bonds: Emerging Markets
CURRENCIES: Chart III-16US Dollar And PPP
US Dollar And PPP
US Dollar And PPP
Chart III-17US Dollar And Indicator
US Dollar And Indicator
US Dollar And Indicator
Chart III-18US Dollar Fundamentals
US Dollar Fundamentals
US Dollar Fundamentals
Chart III-19Japanese Yen Technicals
Japanese Yen Technicals
Japanese Yen Technicals
Chart III-20Euro Technicals
Euro Technicals
Euro Technicals
Chart III-21Euro/Yen Technicals
Euro/Yen Technicals
Euro/Yen Technicals
Chart III-22Euro/Pound Technicals
Euro/Pound Technicals
Euro/Pound Technicals
COMMODITIES: Chart III-23Broad Commodity Indicators
Broad Commodity Indicators
Broad Commodity Indicators
Chart III-24Commodity Prices
Commodity Prices
Commodity Prices
Chart III-25Commodity Prices
Commodity Prices
Commodity Prices
Chart III-26Commodity Sentiment
Commodity Sentiment
Commodity Sentiment
Chart III-27Speculative Positioning
Speculative Positioning
Speculative Positioning
ECONOMY: Chart III-28US And Global Macro Backdrop
US And Global Macro Backdrop
US And Global Macro Backdrop
Chart III-29US Macro Snapshot
US Macro Snapshot
US Macro Snapshot
Chart III-30US Growth Outlook
US Growth Outlook
US Growth Outlook
Chart III-31US Cyclical Spending
US Cyclical Spending
US Cyclical Spending
Chart III-32US Labor Market
US Labor Market
US Labor Market
Chart III-33US Consumption
US Consumption
US Consumption
Chart III-34US Housing
US Housing
US Housing
Chart III-35US Debt And Deleveraging
US Debt And Deleveraging
US Debt And Deleveraging
Chart III-36US Financial Conditions
US Financial Conditions
US Financial Conditions
Chart III-37Global Economic Snapshot: Europe
Global Economic Snapshot: Europe
Global Economic Snapshot: Europe
Chart III-38Global Economic Snapshot: China
Global Economic Snapshot: China
Global Economic Snapshot: China
Jonathan LaBerge, CFA Vice President The Bank Credit Analyst Footnotes 1 The New York Times “Texas, Indiana and Oklahoma join states cutting off pandemic unemployment benefits,” May 18, 2021. 2 The Wall Street Journal, “Shipments Delayed: Ocean Carrier Shipping Times Surge in Supply-Chain Crunch,” May 18, 2021 3 Please see The Bank Credit Analyst "The Modern-Day Phillips Curve, Future Inflation, And What To Do About It," dated December 18, 2020, available at bca.bcaresearch.com 4 To eliminate the pandemic base effect for both series, we adjust the year-over-year growth rates in March and April of this year by comparing them to March and April 2019. 5 Please see Global Investment Strategy "Canada: A (Probably) Happy Moment In An Otherwise Sad Story," dated July 14, 2017, available at gis.bcaresearch.com 6 Importantly, the BIS debt service ratios include the payment of both principal and interest, thus making it a true measure of debt service costs that includes repayment of borrowed funds – a critical issue in countries with high loan-to-value ratios for home mortgages. 7 Please see page 46 of Chapter 2 of the April 2021 IMF Global Financial Stability Report, which can be found here: https://www.imf.org/en/Publications/GFSR/Issues/2021/04/06/global-finan… 8 “Vancouver, Toronto and Hamilton are the least affordable cities in North America: report”, CBC News, May 20, 2021
Highlights A first Fed funds rate hike by early 2023 is cloud cuckoo land – because it will take years to meet the Fed’s pre-condition of full employment. More likely, the first rate hike will happen after mid-2024, and even this is a coin toss which assumes no further shock(s). Buy the March 2024 US interest rate future contract. An alternative expression is to buy the 5-year T-bond, or to go long the 5-year T-bond versus the 5-year German bund. For equity investors, the current overestimation of Fed rate hikes structurally favours growth sectors versus value sectors. Thereby, it also structurally favours the S&P500 versus the Eurostoxx50. Bitcoin has support at $32500, and then at $22750. The latest correction in cryptocurrencies is a good entry point into a diversified basket that includes ‘proof of stake’ coins, such as ethereum. Fragile iron ore prices confirm the onset of a commodity correction. Feature Chart of the WeekAfter A Recession, It Takes Many Years To Reabsorb The Unemployed
After A Recession, It Takes Many Years To Reabsorb The Unemployed
After A Recession, It Takes Many Years To Reabsorb The Unemployed
After a recession, an economy takes years to reabsorb the unemployed. Here’s how long it took in the US after each of the last five recessions.1 1974-75 recession: 4 years Early-1980s recession: 6 years Early-1990s recession: 5 years Dot com bust: 3 years Global financial crisis: 8 years After the pandemic recession, reabsorbing the unemployed (that are not just on ‘temporary layoff’) will also take many years (Chart I-1). Full Employment Is Many Years Away There is a remarkable consistency in employment recoveries. The last five recessions were different in their severities and durations, and therefore in their peak unemployment rates. Yet in the recoveries that followed each of the last five recessions, the unemployment rate declined at a consistent pace of 0.4-0.5 percent per year. After the mild recessions of the early-1990s and the dot com bust, the pace of recovery in the unemployment rate was at the lower end of 0.4 percent per year. Whereas after the global financial crisis and its surge in permanent unemployment, the pace of recovery was at the upper end of 0.5 percent per year. But the difference in the pace of the five employment recovery was marginal (Table I-1). Table 1After Every Recession, The Pace Of Recovery In The Jobs Market Is Near-Identical
A Fed Rate Hike By Early 2023 Is Pie In The Sky
A Fed Rate Hike By Early 2023 Is Pie In The Sky
Another near-constant through the past fifty years is the definition of ‘full employment’. It is achieved when the (permanent) unemployment rate reaches 1.5 percent. Combining the latest (permanent) unemployment rate of 2.7 percent, the unemployment rate at full employment, and the remarkably consistent recovery paces, we can deduce that: The US economy will reach full employment between September 2023 and June 2024. The Federal Reserve has promised that it will not raise the Fed funds rate until the economy has reached full employment. Based on the remarkably consistent pace of the past five employment recoveries, it means September 2023 at the earliest, but more likely closer to June 2024. Yet US interest rate futures are pricing the first Fed funds rate hike through December 2022-March 2023 (Chart I-2). Chart I-2Cloud Cuckoo Land: A First Rate Hike In Dec 22-Mar 23
Cloud Cuckoo Land: A First Rate Hike In Dec 22-Mar 23
Cloud Cuckoo Land: A First Rate Hike In Dec 22-Mar 23
This makes US interest rate future contracts from December 2022 to June 2024 a compelling buy (Chart I-3). Chart I-3Cloud Cuckoo Land: 4 Rate Hikes By June 24
Cloud Cuckoo Land: 4 Rate Hikes By June 24
Cloud Cuckoo Land: 4 Rate Hikes By June 24
Buy The March 2024 US Interest Rate Future The post-pandemic jobs market recovery will likely be at the lower end of its 0.4-0.5 percent a year pace, for two reasons. First, reducing the unemployment rate doesn’t only mean creating jobs for the currently unemployed. It also means creating jobs for those that have left the labour force but plan on re-joining. When these so-called ‘inactive’ people re-join the labour force they add to the number that are counted as unemployed. As the millions of inactives re-join the labour market, it will weigh on the pace of the recovery in the unemployment rate. During the pandemic, the number of inactive people surged by an unprecedented 8 million. Even now, the excess inactive stands at 5 million (Chart I-4). As these millions gradually re-join the labour market, it will weigh on the pace of the recovery in the unemployment rate. Chart I-4Massive Slack In The US Labour Market
Massive Slack In The US Labour Market
Massive Slack In The US Labour Market
Second, after every recession, there is a surge in productivity (Chart I-5). This is because the period immediately after a recession is when the economy experiences the most intensive clearing out of dead wood, restructuring of capital and labour, and absorption of new technologies and ways of working. Chart I-5The Post-Pandemic Productivity Boom Will Be A Super-Boom
The Post-Pandemic Productivity Boom Will Be A Super-Boom
The Post-Pandemic Productivity Boom Will Be A Super-Boom
If anything, the post-pandemic productivity boom will be even larger than normal. Whereas most recessions upend one or two sectors of the economy, the pandemic has forced all of us to adopt new technologies and ways of working and living. The unfortunate corollary of this post-pandemic productivity super-boom is that the pace of absorption of the excess unemployed and inactive will be slower. Moreover, even achieving full employment by June 2024 assumes blue skies through the next few years, which is to say no further shocks. Yet as we explained in The Shock Theory Of Bond Yields, deflationary shocks tend to come once every three years, meaning there is an evens chance that dark clouds ruin the blue skies. One complication is that the Fed will start tapering its asset purchases much sooner, and that this will be interpreted as the precursor of a rate hike. However, in the last cycle the taper of asset purchases in early 2014 preceded the first rate hike by two years (Chart I-6). On a similar timeframe, a taper at the end of 2021 would imply the first rate hike at the end of 2023, and not the start of 2023 as is implied by the interest rate futures. Chart I-6The First Rate Hike Came Two Years After The Taper
The First Rate Hike Came Two Years After The Taper
The First Rate Hike Came Two Years After The Taper
Pulling all of this together, a first Fed funds rate hike by early 2023 is cloud cuckoo land. More likely it will happen after mid-2024, and even this is a coin toss which assumes no further shock(s) in the interim. The investment conclusion is to buy any of the US interest rate futures that expire from December 2022 out to June 2024. The earlier contracts have the higher probabilities of expiring in profit while the later contracts have the greater upside if the Fed stays pat. Our choice is the March 2024 contract. An alternative expression is to buy the 5-year T-bond, or to go long the 5-year T-bond versus the 5-year German bund. For equity investors, the current overestimation of Fed rate hikes structurally favours growth sectors versus value sectors. Thereby, it also structurally favours the S&P500 versus the Eurostoxx50. The 419th Time That Cryptos Have ‘Died’ Rumours of crypto’s death have been greatly exaggerated. Apparently, last week was the 419th time that cryptocurrencies have died. Get used to it. As we pointed out in Why Cryptocurrencies Are Here To Stay… cryptocurrencies can suffer deep corrections from which they fully resurrect. Since 2013, the bitcoin price has suffered 17 drawdowns of more than 50 percent and an additional 11 drawdowns of 25-50 percent.2 Rumours of crypto’s death have been greatly exaggerated. We will not repeat the arguments why cryptos are here to stay, which were detailed in our Special Report, but we will discuss the recent price action. Why did cryptos correct? The simple answer is that their fractal structure had become extremely fragile, making the price extremely vulnerable to the slightest negative catalyst (Chart I-7). Chart I-7The Fractal Structure Of Cryptos Had Become Very Fragile
The Fractal Structure Of Cryptos Had Become Very Fragile
The Fractal Structure Of Cryptos Had Become Very Fragile
A fragile fractal structure signifies that longer-term investors have disappeared from the price setting process. This means that price evolution is the result of more and more short-term traders joining the trend. Eventually though, there are no more short-term traders left to buy at the current price. So, when somebody wants to sell – perhaps on some negative news – a longer-term investor must step in as the buyer. But the longer-term investor will only buy at a much lower price, meaning that the price suffers a deep correction. Empirically and theoretically, the price correction meets support at successive Fibonacci retracements of the preceding momentum-fuelled rally, because a new cohort of buyers enters at each retracement level. Hence, the key support levels in the current correction are the 23.6 percent and 38.2 percent retracements of the preceding rally. In the case of bitcoin, this equates to support at $32500 and $22750. Which of these support level will prevail? Our bias is the higher level, because successive crypto corrections are becoming less and less extreme – possibly because more and more institutional investors are now involved in the asset class (Chart I-8). Chart I-8Crypto Corrections Are Becoming Less Extreme
Crypto Corrections Are Becoming Less Extreme
Crypto Corrections Are Becoming Less Extreme
Hence, the latest correction in cryptos offers a good entry point. Albeit it is important to own a diversified basket that includes ‘proof of stake’ coins, such as ethereum. The Onset Of A Commodity Correction Finally this week, we highlight that iron ore prices are at the same level of fractal fragility that has marked previous major turning points in 2015 and 2019 (Chart I-9). Chart I-9Iron Ore Is Very Fragile
Iron Ore Is Very Fragile
Iron Ore Is Very Fragile
Combined with the fragility we have recently highlighted in lumber, agricultural commodities, industrial metals, and DRAM prices, it confirms the onset of a commodity correction. We have already discussed this theme in Don’t Panic About US Inflation and are exposed to it through short positions in PKB, CAD, and inflation expectations. Hence, there are no new trades this week. Dhaval Joshi Chief Strategist dhaval@bcaresearch.com Footnotes 1 Throughout this analysis, the unemployment rate is based on the unemployed that are ‘not on temporary layoff’. Full employment is defined as this unemployment rate reaching 1.5 percent, or the cycle low, whichever is the higher. 2 The drawdown is calculated versus the highest price in the preceding 6 months. Fractal Trading System Fractal Trades 6-Month Recommendations Structural Recommendations Closed Fractal Trades Closed Trades Asset Performance Equity Market Performance Indicators To Watch - Bond Yields Indicators To Watch - Bond Yields - Euro Area
Indicators To Watch - Bond Yields - Euro Area
Indicators To Watch - Bond Yields - Euro Area
Indicators To Watch - Bond Yields - Europe Ex Euro Area
Indicators To Watch - Bond Yields - Europe Ex Euro Area
Indicators To Watch - Bond Yields - Europe Ex Euro Area
Indicators To Watch - Bond Yields - Asia
Indicators To Watch - Bond Yields - Asia
Indicators To Watch - Bond Yields - Asia
Indicators To Watch - Bond Yields - Other Developed
Indicators To Watch - Bond Yields - Other Developed
Indicators To Watch - Bond Yields - Other Developed
Indicators To Watch - Interest Rate Expectations Indicators To Watch - Interest Rate Expectations
Indicators To Watch - Interest Rate Expectations
Indicators To Watch - Interest Rate Expectations
Indicators To Watch - Interest Rate Expectations
Indicators To Watch - Interest Rate Expectations
Indicators To Watch - Interest Rate Expectations
Indicators To Watch - Interest Rate Expectations
Indicators To Watch - Interest Rate Expectations
Indicators To Watch - Interest Rate Expectations
Indicators To Watch - Interest Rate Expectations
Indicators To Watch - Interest Rate Expectations
Indicators To Watch - Interest Rate Expectations
Highlights Monetary Policy: The Fed will not immediately change its policy stance in response to rising inflation and inflation expectations. Rather, it will follow its current forward guidance and only lift rates off zero once the labor market has reached “maximum employment”. However, once the first rate hike has occurred, the Fed will shift its focus toward inflation and inflation expectations. Duration: The overnight index swap curve is priced for a total of 77 bps of rate hikes by the end of 2023. We see strong odds that more hikes will be delivered and therefore continue to recommend a below-benchmark portfolio duration stance. Corporate Bonds: High and rising inflation expectations will eventually pose a risk to credit spreads, but only once the Fed tightens policy in response. For now, we remain overweight spread product versus Treasuries, though we maintain a preference for high-yield corporates, USD-denominated EM Sovereigns and municipal bonds over investment grade corporate bonds. Feature Recent inflationary trends are making the Fed’s job more difficult. Not only was April’s increase in core CPI the largest since 1981, but measures of long-term inflation expectations have also jumped. The 5-year/5-year TIPS breakeven inflation rate has quickly risen to levels that are consistent with the Fed’s 2% inflation target (Chart 1). What’s more, survey measures of inflation expectations have also moved up, in many cases to uncomfortably high levels (Chart 2). Chart 1Back To Target
Back To Target
Back To Target
Chart 2Inflation Expectations Have Jumped
Inflation Expectations Have Jumped
Inflation Expectations Have Jumped
All of this makes the Fed’s zero-lower-bound interest rate policy look increasingly untenable. Can the Fed really just sit on the sidelines as inflation and inflation expectations rise to above-target levels? Our expectation is that the Fed will ignore rising inflation until the labor market is fully recovered, but it may then need to move quickly to contain inflationary pressures. The result could very well be a rate hike cycle that takes a long time to start, but then proceeds at a rapid pace. The Fed’s Liftoff Criteria Are Different Than Its Criteria For Pace A crucial point about the Fed’s forward guidance is that the criteria that will determine the timing of the first rate hike are different than the criteria that will determine the post-liftoff pace of rate hikes. Liftoff Criteria Table 1A Checklist For Liftoff
Lower For Longer, Then Faster Than You Think
Lower For Longer, Then Faster Than You Think
For liftoff, the Fed has been very explicit that three conditions must be met before it will raise rates off the zero bound (Table 1). Of the three conditions listed in Table 1, the timing of when the labor market will reach “maximum employment” is the most uncertain. We have written extensively about how the Fed defines “maximum employment” and about the pace of employment growth that’s necessary to achieve that goal by specific future dates.1 To summarize, we calculate that average monthly nonfarm payroll growth of at least 698k is required to reach “maximum employment” by the end of this year and average monthly payroll growth of at least 412k is required to hit that target by the end of 2022 (Chart 3). Chart 3Employment Growth
Employment Growth
Employment Growth
Chart 4Labor Demand Is Strong
Labor Demand Is Strong
Labor Demand Is Strong
Our assessment is that “maximum employment” will be achieved in time for the Fed to lift rates in 2022, largely because employment growth must rise quickly in order to catch up with skyrocketing indicators of labor demand (Chart 4). The risk, of course, is that inflation continues to run hot as the Fed waits for its “maximum employment” condition to be met. If this occurs, we believe that the Fed will stick to its current forward guidance. It will ignore rising inflation until its liftoff criteria are met. Only then, will Fed policy turn toward containing inflation. Pace Criteria In a recent speech, Fed Vice-Chair Richard Clarida laid out three indicators that he will track to guide the pace of policy tightening post Fed liftoff.2 First, he pointed to inflation expectations. In particular, the Fed’s index of Common Inflation Expectations (CIE):3 Other things being equal, my desired pace of policy normalization post-liftoff to return inflation to 2 percent […] would be somewhat slower than otherwise if the CIE index is, at time of liftoff, below the pre-ELB level. [ELB = effective lower bound]. Chart 2 shows that the CIE index has already broken above its 2018 peak. It stands to reason that, all else equal, an elevated CIE index would speed up the post-liftoff pace of rate hikes. Chart 5Inflation Since August 2020
Inflation Since August 2020
Inflation Since August 2020
Second, Clarida noted that: Another factor I will consider in calibrating the pace of policy normalization post-liftoff is the average rate of PCE inflation since the new framework was adopted in August 2020. The annualized rate of change in core PCE since August 2020 is almost at the Fed’s 2% target already, and it will certainly rise to above-target levels when the April data are released, as was the case with core CPI (Chart 5). Finally, Clarida offered up a detailed Taylor-type monetary policy rule that he says he will consult once the conditions for liftoff are met: Consistent with our new framework, the relevant policy rule benchmark I will consult once the conditions for liftoff have been met is an inertial Taylor-type rule with a coefficient of zero on the unemployment gap, a coefficient of 1.5 on the gap between core PCE inflation and the 2 percent longer-run goal, and a neutral real policy rate equal to my SEP forecast of long-run r*. Chart 6Balanced Approach (Shortfalls) Rule* Recommendations
Lower For Longer, Then Faster Than You Think
Lower For Longer, Then Faster Than You Think
Chart 6 shows the results of a very similar policy rule using median FOMC estimates for r*, NAIRU and the path of inflation. We use a slightly more pessimistic forecast for the unemployment rate and assume that it reaches 4.5% by the end of 2022 and 4% by the end of 2023. Even with those conservative assumptions, the rule still recommends a policy rate of 1.5% by the end of 2022 and 2.65% by the end of 2023. This is not to say that the Fed will immediately lift rates to those levels once it is ready to hike, only that the Fed will have a strong incentive to pursue a rapid pace of rate hikes once it finally lifts rates off the zero bound. Investment Implications For investors, the bottom line is that the Fed will not immediately change its policy stance in response to rising inflation and inflation expectations. Rather, it will follow its current forward guidance and only lift rates off zero once the labor market has reached “maximum employment”. However, once the first rate hike has occurred, the Fed will shift its focus toward inflation and inflation expectations. If inflation and inflation expectations rise further, or even remain sticky near current levels, the Fed will lift rates more quickly than many anticipate. At present, the overnight index swap curve is priced for a total of 77 bps of rate hikes by the end of 2023. We see strong odds that more hikes will be delivered and therefore continue to recommend a below-benchmark portfolio duration stance. Is Inflation A Risk For Spread Product? Yes it is, but not just yet. In past reports, we’ve often pointed to 5-year/5-year forward TIPS breakeven inflation rates in a range between 2.3% and 2.5% as a reason to turn more cautious on spread product (see Chart 1), and the recent rise in inflation expectations certainly does set off some alarm bells. High inflation expectations pose a risk to credit spreads because of what they signal about the future course of Fed policy. If the Fed responds to high inflation expectations by tightening policy into restrictive territory, then economic growth and credit spreads are at risk. All this remains true, but the Fed’s willingness to ignore rising inflation expectations – at least until “maximum employment” and fed funds liftoff are achieved – gives spread product a little more runway than usual. One way to illustrate this dynamic is with the slope of the yield curve (Chart 7). Historically, corporate bond (both investment grade and junk) excess returns are strong at least until the 3-year/10-year Treasury slope flattens to below 50 bps (Table 2). Currently, the 3-year/10-year Treasury slope is well above 100 bps and has shown few signs of rolling over. If the Fed was still following its old forward-looking policy framework, then the yield curve would likely be much flatter today. That is, the curve would be pricing-in some policy tightening in response to high and rising inflation expectations. However, as discussed above, inflation expectations are not currently the Fed’s primary concern and they will only become the Fed’s primary concern once “maximum employment” has been achieved and the funds rate has been lifted off the zero bound. Chart 7Spread Product Returns Are Strong When The Curve Is Steep
Spread Product Returns Are Strong When The Curve Is Steep
Spread Product Returns Are Strong When The Curve Is Steep
Table 2Corporate Bond Performance In Different Phases Of The Cycle
Lower For Longer, Then Faster Than You Think
Lower For Longer, Then Faster Than You Think
All in all, we are concerned that, if inflation expectations remain elevated, the Fed may quickly ramp up its post-liftoff pace of rate hikes, sending credit spreads wider. But we are reluctant to position for that outcome when we are still many months away from Fed liftoff and the slope of the yield curve remains so steep. Chart 8Low Expected Returns In IG
Low Expected Returns in IG
Low Expected Returns in IG
Another factor to consider is that value in spread product is extremely tight. In fact, our measure of the 12-month breakeven spread for the quality-adjusted investment grade corporate bond index is almost at its most expensive level since 1995 (Chart 8). This doesn’t change our assessment of when restrictive Fed policy will cause spreads to widen, but it does reduce our return expectations in the interim. All else equal, since the rewards from being overweight spread product versus Treasuries are low, we will be quicker to reduce our recommended spread product allocation when our indicators start to point toward the end of the credit cycle. Though, at the very least, we will still want to see the 3-year/10-year Treasury slope start to flatten and approach 50 bps before we get too pessimistic on spread product. The bottom line is that high and rising inflation expectations will eventually pose a risk to credit spreads, but only once the Fed tightens policy in response. For now, we remain overweight spread product versus Treasuries, though we maintain a preference for high-yield corporates, USD-denominated EM Sovereigns and municipal bonds over investment grade corporate bonds. Ryan Swift US Bond Strategist rswift@bcaresearch.com Footnotes 1 Please see US Bond Strategy Weekly Report, “Overshoot Territory”, dated April 13, 2021. 2 https://www.federalreserve.gov/newsevents/speech/clarida20210113a.htm 3 The CIE is a composite measure of different market-based and survey-based indicators of inflation expectations. https://www.federalreserve.gov/econres/notes/feds-notes/index-of-common-inflation-expectations-20200902.htm Fixed Income Sector Performance Recommended Portfolio Specification
Highlights The selloff in crypto-currencies on May 19 may be overblown but the risk of government intervention is a rising headwind for this asset class. While environmental concerns are a threat to Bitcoin, the entire crypto-currency complex faces a looming confrontation over governance. Digital currencies are a natural evolution of money following coinage and paper. Moreover a sizable body of consumers is skeptical of governments and traditional banking. Loose monetary conditions are fueling a speculative mania. However, governments fought for centuries to gain a monopoly over money. As crypto-currencies become more popular, governments will step in to regulate and restrict them. Central bank digital currencies (CBDCs) threaten to remove the speed and transactional advantage of crypto-currencies, leaving privacy/anonymity as their main use-case. Feature The prefix “crypto” derives from the Greek kruptos or “hidden.” This etymology highlights one of the biggest problems confronting the crypto-currency craze in financial markets today. Speed and anonymity are the greatest assets of the digital tokens. But the former advantage is being eroded by competitors while the latter is becoming a political liability. In the 2020s, governments are growing stronger and more interventionist, not weaker and more laissez faire. Chart 1Loose Money Fuels Crypto Mania
Loose Money Fuels Crypto Mania
Loose Money Fuels Crypto Mania
Bitcoin and rival crypto-currency Ethereum fell by 29.5% and 43.2% in intra-day trading on May 19, only to finish the day down by 13.8% and 27.2%, respectively. The market panicked on news that China’s central bank had banned firms from handling transactions in crypto-currencies. What really happened was that China’s National Internet Finance Association, China Banking Association, and Payment and Clearing Association issued a statement merely reiterating a 2013 and 2017 policy that already banned firms from handling transactions in crypto-currencies. These three institutions also warned about financial speculation regarding crypto-currencies.1 The crypto market suffered a spike in volatility because it is in the midst of a speculative mania. In the last five years, total market capitalization of crypto-currencies has risen from around $7 billion to $2.3 trillion,2 recording a 34,000% gain. Some crypto-currencies have even recorded returns in excess of that number over a shorter horizon. Price gains have been driven by retail buyers who may or may not know much about this new asset class (Chart 1). Prior to the May 19 selloff, prices had grown overextended and recent concerns over the environment, sustainability, and governance (ESG) had shaken confidence in Bitcoin and its peers. Chinese authorities have already banned financial firms from providing crypto services in a bid to deter ownership of crypto-currencies. And China is not alone. The latest market jitters are a warning sign that government interference in the crypto-currency market is a real threat. Regulation and sovereign-issued digital currencies are starting to enter the fray. While ultra-dovish central bank policies are not changing soon, and therefore crypto-currency price bubbles can continue to grow, crypto-currencies will remain subject to extreme volatility and precipitous crashes. In this report we argue that the fundamental problem with crypto-currencies is that they threaten the economic sovereignty of nation-states. Environmental degradation, financial instability, and black market crime, and other concerns about cryptos have varying degrees of merit. But they provide governments with ample motivation to pursue a much deeper interest in regulating a technological innovation that has the power to undermine state influence over the economy and society. Government scrutiny is a legitimate reason for crypto buyers to turn sellers. Does The World Need Crypto-Currencies? Broadly speaking, there are two primary justifications for crypto-currencies, centered on a transactional basis: speed and privacy/anonymity. The crux of crypto-currency creation rests on these two use cases.3 The speed of crypto-currencies comes from their ability to increase efficiency in local and global payment systems by facilitating financial transactions without the need of a third party (e.g. a financial institution). Cross-border settlement of traditional (fiat) currency transactions processed through the standard SWIFT communications system takes up to two business days. Most transactions involving crypto-currencies over a blockchain network are realized in less than an hour, cross-border or not.4 The fees involved with third-party payments are often more expensive than transacting with crypto-currencies. Simply put, excluding the “middleman” can save money. This is a selling point in a global market that expects to see retail cross-border transactions reach $3.5 trillion by the end of 2021, of which up to 5% are associated with transaction-based fees.5 But this breakthrough in payment system technology can be overstated and is not the main reason for using crypto-currency. Speculation drives current use, especially given that there is speculative behavior even among those who believe that cryptos are safe-haven assets or promising long-term investments (Chart 2). Chart 2Crypto-Currency Use Driven By Speculation
Cryptocurrencies: They Can Run But They Can’t Hide
Cryptocurrencies: They Can Run But They Can’t Hide
Chart 3Consumers Growing Skeptical Of Banking Regulation
Cryptocurrencies: They Can Run But They Can’t Hide
Cryptocurrencies: They Can Run But They Can’t Hide
If a person wants to buy an item from a company in a distant country, that person could use a crypto-currency just as he or she could use a credit card. Both parties would have a secure medium of exchange but, unlike with a credit card, both would avoid using fiat currencies. Neither party could conduct the same transaction using gold or silver. The crucial premise is the existence of an online community of individuals and firms who for one reason or another want to avoid fiat currencies. From a descriptive point of view, the crypto-currency phenomenon implies a lack of trust in modern governments, or at least their monetary systems, and an assertion of individual property rights. The list of crypto-currencies continues to grow. To date, there are approximately 9,800 of them. Some are trying to prove their economic value or use, while others have been created with no intended purpose or problem to solve. Even so, there has yet to be a crypto-currency that overwhelms the use of slower fiat money. In a recent Special Report, BCA Research’s Foreign Exchange Strategist Chester Ntonifor showed that crypto-currencies still have a long way to go to have a chance at replacing fiat monies. While crypto-currencies are showing signs of significant improvement as mediums of exchange, they still fall short as stores of value and units of account. The other primary case for crypto-currencies is privacy or anonymity. The bypassing of intermediaries implies a greater control of funds by the two parties of a transaction. Crypto-currencies are said to be more “private” compared to fiat money. Fiat money is controlled by governments and banks while crypto-currencies have only “owners.” Crypto-currencies are anonymous because they are stored in digital wallets with alphanumeric sequences – there is a limited personal data trail that follows crypto-currency compared to those of electronic fiat currency transactions. In a post-9/11, post-GFC, post-COVID world where a sizable body of consumers is growing more skeptical of government surveillance and regulation and banking industry practices (Chart 3), crypto-currencies give users more than just a means to transact with. However, privacy is not the same as security. Hacking and fraud can affect cryptos as well as other forms of money and attacks will increase with the value of the currencies. Bitcoin At The Helm Of Crypto-Currency Market Chart 4Bitcoin Slows
Bitcoin Slows
Bitcoin Slows
Bitcoin has cemented its status as the number one currency in the crypto-verse.6 It is considered to be the first crypto-currency created, it is the most widely accepted, it is touted as a store of value or “digital gold,” and it is the most featured in quoting alternative crypto-currency pairs across crypto exchanges. As it stands, Bitcoin accounts for around 42% of total crypto-currency market capitalization.7 This share has declined from around 65% at the start of 2021 on the back of the frenzied rise of several alternative coins.8 But rising risks to Bitcoin’s standing will cause the entire crypto-market to retreat. In a Special Report penned in February, BCA Research’s Chief Global Strategist Peter Berezin argued that Bitcoin is more of a trend than a solution and that its usefulness is diminishing. Bitcoin’s transaction speed is slowing and its transaction cost is rising (Chart 4). Slowing speed and rising cost on the Bitcoin network are linked to a scalability problem. The crypto-currency’s network has a limited rate at which it can process transactions related to the fact that records (or “blocks”) in the Bitcoin blockchain are limited in size and frequency. This means that one of its fundamental justifications, transactional speed, will become less attractive over time, should the network not address these issues. Bitcoin also consumes a significant amount of energy, a controversy that is gaining traction in the crypto-currency market after Elon Musk, the “techno-king” of Tesla, cited environmental concerns in reversing his decision to accept Bitcoin payment for his company’s electric vehicles. Energy consumption rises as more coins are mined, since mining each new Bitcoin becomes more computer-power intensive. The need for computing power and energy will continue to increase until all 21 million Bitcoins (total supply) are mined, which is currently estimated to occur by the year 2140. Strikingly, the energy needed to mine Bitcoin over a year are comparable to a small country’s annual power consumption, such as Sweden or Argentina (Chart 5). Chart 5Bitcoin Consumes More Energy Than A Small Country …
Cryptocurrencies: They Can Run But They Can’t Hide
Cryptocurrencies: They Can Run But They Can’t Hide
Bitcoin also generates significant quantities of electronic waste (Chart 6). Chart 6… And Generates A Lot Of Electronic Waste
Cryptocurrencies: They Can Run But They Can’t Hide
Cryptocurrencies: They Can Run But They Can’t Hide
Bitcoin mining is heavily domiciled in China, which accounts for 65% of global mining activity (Figure 1). China’s energy mix is dominated by coal power, which makes up approximately 65% of the country’s total energy mix even after a decade of aggressive state-led efforts to reduce coal reliance. Of this, coal powered energy makes up approximately 60% of Bitcoin’s energy mix in China.9 With several countries aiming to minimize carbon emissions, and with approximately 60% of Bitcoin mining powered by coal-fired energy globally,10 Bitcoin imposes a major negative environmental impact. Figure 1Bitcoin Mining Well Anchored In Asia
Cryptocurrencies: They Can Run But They Can’t Hide
Cryptocurrencies: They Can Run But They Can’t Hide
Bitcoin does not shape up well when compared to gold’s energy intensity either. Bitcoin mining now consumes more energy than gold mining over a single year. While the energy difference is not large, the economic value is. Gold’s energy consumption to economic value trade-off is lower than that of Bitcoin. The production value of gold in 2020 was close to $200 billion, while Bitcoin was measured at less than $25 billion (Chart 7A). On a one-to-one basis, gold even has a lower carbon footprint than Bitcoin (Chart 7B). Chart 7AGold Outshines Bitcoin On Production Value And Carbon Footprint
Cryptocurrencies: They Can Run But They Can’t Hide
Cryptocurrencies: They Can Run But They Can’t Hide
Chart 7BGold Outshines Bitcoin On Production Value And Carbon Footprint
Cryptocurrencies: They Can Run But They Can’t Hide
Cryptocurrencies: They Can Run But They Can’t Hide
Crypto-currency energy consumption and carbon footprint will attract the attention of government regulators. Of course, not all crypto-currencies are heavy polluters. But if the supply of cryptos is constrained by mining difficulties then they will require a lot of energy. If the supply is not constrained then the price will be low. Government Regulation Is Coming Environmental concerns point to the single greatest threat to crypto-currencies – the Leviathan, i.e. the state. In this sense the crypto market’s wild fluctuations on May 19, at the mere whiff of tougher Chinese regulation, are a sign of what is to come. Governments around the world have so far left crypto-currencies largely unregulated but this laissez-faire attitude is already changing. Environmental regulation has already been mentioned. Governments will also be eager to expand their regulatory powers to “protect” consumers, businesses, and banks from extreme volatility in crypto markets. But investors will underrate the regulatory threat if they focus on these issues. At the most basic level, governments around the world will not sit idly by and lose what could become significant control of their monetary systems. The ability to establish and control legal tender is a critical part of economic sovereignty. Governments won control of the printing press over centuries and will not cede that control lightly. If crypto-currencies are adopted widely, then finance ministries and central banks will lose their ability to manipulate the money supply and the general level of prices effectively. Politicians will lose the ability to stimulate the economy or keep inflation in check. Most importantly, while one may view such threats as overblown, it is governments, not other organizations, that will make the critical judgment on whether crypto-currencies threaten their sovereignty. Throughout the world, most crypto-currency exchanges are regulated to prevent money laundering. Crypto-currencies are not legal tender and, aside from Bitcoin, their use is mostly banned in China (Table 1). However, more specialized regulation that targets energy and economic use has yet to be brought into law across the world. Table 1World Governments Will Not Relinquish Hard-Fought Monopolies Over Money Supply
Cryptocurrencies: They Can Run But They Can’t Hide
Cryptocurrencies: They Can Run But They Can’t Hide
In China, initial coin offerings (ICOs – the equivalent of an initial public offering on the stock market) and trading platforms are banned from engaging in exchanges between the yuan and crypto-currencies or tokens. In fact, China recognizes crypto-currencies only as virtual commodities or virtual property. India is another country where exchanges and ICOs are banned. While crypto-currencies are not banned, they are not legal tender. Indian policymakers have recently proposed banning crypto-currencies, however. The proposed legislation is one of the world’s strictest policies against crypto-currencies. It would criminalize possession, issuance, mining, trading, and transferring crypto-assets. If the ban becomes law, India would be the first major economy to make holding crypto-currency illegal. Even China, which has banned mining and trading, does not penalize possession. In the US, Secretary of the Treasury Janet Yellen has already expressed concerns regarding the illicit use of cryptos for supposed criminal gain.11 She is in alignment with European Central Bank President Christine Lagarde. Because of the anonymity of crypto-currencies, identifying users behind illicit transactions is difficult. This means regulators face headwinds in identifying transactions that are made for criminal gain, as compared to fiat transactions. Governments have long dealt with the anonymity of cash but they have ways of monitoring bank accounts and paper bills. Crypto-currencies are beyond their immediate sight of control and therefore will attract growing scrutiny and legislative action in this regard. The Colonial Pipeline ransomware attack on May 7, which temporarily shuttered about 45% of the fuel supply line for the eastern United States, illustrates the point. The DarkSide group of hackers who orchestrated the attack demanded a ransom payment of $4.4 million worth of Bitcoin, which Colonial Pipeline paid them on May 7. Shortly thereafter, unspecified “law enforcement agencies” clawed back the $4.4 million from the hackers’ account (transferring it to an unknown address) and DarkSide lost access to its payment server, DOS servers, and blog. This episode should not be underrated. It was a successful, large-scale cyber-attack on critical infrastructure in the world’s most powerful country. It highlighted the illicit uses to which crypto-currencies can be put. True, criminals demand ransoms in fiat money as well – and many crypto-currency operators will distance themselves from the criminal underworld. Nevertheless governments will give little slack to an emerging technology that presents big new law enforcement challenges and is not widely used by the general public. Ultimately governments will pursue their sovereign interests in controlling money, the economy, and trade, listening to their banking lobby, expanding their remit to “protect” consumers, and cracking down on illicit activity. Governments are not capable of abolishing crypto-currencies altogether, or the underlying technology of blockchain. But they will play a large and growing role in regulating them. Central Banks Advancing On Digital Currencies Central bank digital currencies (CBDCs) will leave crypto-currencies in the realm of speculative assets. CBDCs are a form of digital money denominated in a country’s national unit of account and represent a liability on a central bank’s balance sheet. This is different from current e-money that represents a claim on a private financial institution’s balance sheet. It is also different from crypto-currencies, because there is a central authority behind a CBDC, unlike with crypto-currencies due to their decentralized nature. In China, the People’s Bank of China (PBoC) has suggested its rollout of a digital yuan is “ready” despite no release to date. Beta testing is ongoing in several provinces. The PBoC’s justification for a digital yuan comes from China’s growing cashless economy. The transition away from cash is largely thanks to mobile payment platforms like Alibaba’s Alipay and Tencent’s WeChat Pay, which, between the two of them, control almost the entire mobile payments market of some 850 million users. There is a significant amount of systemic risk in this system – one reason why Chinese authorities have recently subjected these companies to new scrutiny and regulation. Should Alibaba or Tencent go bankrupt, the local payment system will crash. The PBoC’s efforts will increase competition in the local payments space and reduce this systemic risk. Policymakers are also concerned that as Chinese citizens choose to hold their money in digital wallets provided by Alibaba and Tencent instead of bank accounts, liquidity is being drained from the traditional banking system, putting deposit levels at banks under strain, and posing risks to liability matching. The digital yuan will still involve a third party, unlike crypto-currencies which do not. Doing away with commercial banks is not a reality – indeed the Chinese Communist Party seeks to buttress the state-owned commercial banks in order to maintain control of the economy. What the digital yuan does, and other CBDCs will do too, is utilize blockchain technology, which is faster and more secure than traditional payment networks. In the US, the Fed has been studying the viability of a CBDC US dollar. The Fed has stated that it is carefully exploring whether a CBDC will lead to “safer, less expensive, faster, or otherwise more efficient payments.” While the Fed has yet to find a single standout case for a CBDC US Dollar, Fed Chair Jerome Powell said last year that the US has a “competitive payments market” with “fast and cheap services, particularly in comparison to other nations exploring a CBDC.” To date, the Fed’s observation is that many of the challenges that CBDCs hope to address do not apply to the US, including disuse of physical cash, narrow reach or high concentration of banking, and weak infrastructure for payment systems. Rather, the Fed is more focused on developing the FedNow real-time payment system for private banks. This is much the same as in Europe, where physical cash still plays a major role in day-to-day economic activity and where local payment systems are fast and secure. But central banks around the world continue to engage in work centered around CBDCs (Charts 8A and 8B) – and China’s progress will encourage others to move faster. Advanced economies are mostly interested in creating a safer and more efficient payment system, while emerging and developed economies have interest across several areas such as financial stability, monetary policy setting, and inclusiveness of banking, as well as efficiency and safety (Chart 9). CBDCs are especially attractive to emerging market policy makers at targeting those who lack access to traditional banking. Chart 8ACentral Banks Advancing On CBDC Work
Cryptocurrencies: They Can Run But They Can’t Hide
Cryptocurrencies: They Can Run But They Can’t Hide
Chart 8BCentral Banks Advancing On CBDC Work
Cryptocurrencies: They Can Run But They Can’t Hide
Cryptocurrencies: They Can Run But They Can’t Hide
Chart 9Central Banks CBDC Interest Areas
Cryptocurrencies: They Can Run But They Can’t Hide
Cryptocurrencies: They Can Run But They Can’t Hide
In remote areas, access to banking is scarce and expensive. CBDCs can help solve this problem. Individuals would have CBDC accounts directly on a central bank ledger. They could then access their money and transact through a digital wallet application that is linked to the CBDC account. Giving people access to digital currency would allow them to transact quickly, in remote settings, without the need of hard currency. Monetary policy transmission is also better in advanced economies. In emerging markets, there are bottlenecks in local financial markets. Looser central monetary policy does not always translate into cheaper financing across the economy. In remote and poverty stricken areas, monetary policy transmission is sticky, meaning high costs of borrowing can persist even through accommodative policy cycles. This is a smaller issue in advanced economies. Payment systems in advanced economies are due an overhaul in security and efficiency, and CBDCs and blockchain technology will provide this. CBDCs will prove to be just as efficient to transact with as any crypto-currencies available today. CBDCs will also be legal tender and accepted by all vendors. The anonymity factor will be lost but this will not be a problem for most users (whereas legal issues will become a problem for crypto-currencies). The probability of central banks issuing CBDCs in both the short and medium term, both in the retail and wholesale space, is rising. If advanced economies like those of the G7 issue CBDCs soon, policy makers will undoubtedly ensure the use of it over the currently circulating and partially accepted crypto-currencies. The endgame will leave crypto-currencies in the highly speculative asset class, perhaps even in the black market where anonymity is valued for transactions that wish not to be tracked. Investment Takeaways Prices of crypto-currencies may continue to rise given sky-high fiat money creation amid the COVID pandemic and ultra-low interest rates. Digitalization is the natural next step in the evolution of money from precious metals to paper banknotes to electronic coin. But the market leader, Bitcoin, is encountering more headwinds. The primary case for the use of Bitcoin is challenged due to slowing transaction speeds and rising transaction costs. The virtual currency is primarily mined using coal-powered energy, resulting in growing scrutiny from governments and consumers. Government regulation is entering the ring and policymakers will take an increasingly heavy-handed role in trying to ensure that cryptos do not undermine economic sovereignty, financial stability, and law and order. When central banks begin to rollout digital currencies, especially those domiciled in advanced economies, crypto-currencies as medium of exchange will lose much of their allure. Crypto-currencies will remain as anti-fiat currencies and speculative assets. Risks To The View Given the controversy surrounding crypto-currencies, it is only fair to state outright the risks to our view. We would also recommend clients read our colleague Dhaval Joshi’s latest bullish take on Bitcoin. First, scaling up Bitcoin’s network and processing transactions in batches instead of single transactions will resolve transaction time and cost risks, restoring efficiency. This is a clear solution to efficiency concerns. However, scaling and batching transactions are not on the immediate horizon of Bitcoin developers. Bitcoin’s network will still need to undergo another “halving” in order for this risk to subside and for the network to scale. A halving of the network will only occur again in 2024.12 Second, on the environment: Bitcoin mining is not solely dependent on fossil fuel energy that gives it a “dirty” footprint. Renewables already make up some 25% of Bitcoin mining. Increasing the use of renewables in Bitcoin’s energy mix will help lower its environmental impact. However, this is easier said than done. Global renewable energy has yet to scale up to a point where it can consistently out-supply existing fossil-fuel energy. Mining hardware also has its associated carbon footprint that would need to be addressed. And location matters too. Crypto-currency mining farms are large-scale projects. Simply uprooting operations to a country that could lower the carbon footprint of a mining farm or two is not viable due to the costs involved. Hence crypto-currency mining will probably continue to be a “dirty” operation but a rapid shift to renewables would challenge our thesis. Bitcoin’s network is also based off a “proof of work” protocol. Miners must prove that a certain amount of computational effort has been expended for confirming blocks on the network, allowing transactions to be processed. Proof of work is energy intensive. Other crypto-currencies, like Ethereum, will adopt a “proof of stake” protocol. Simply put, transactions are confirmed by users and their stake in the associated crypto-currency. Proof of stake is less energy intensive compared to proof of work. Third, as to government regulation, the longer policymakers take to enact legislation targeting crypto-currencies, the larger their market will grow. Regulation in China and India may set a benchmark for major economies but not all will follow in the Asian giants’ footsteps. Some governments have been slow to study crypto-currencies, meaning legislation aimed at governing or regulating them may still be long in coming. Innovation is a good thing and free economies will not wish to restrain crypto-currencies or blockchain technology unduly, for fear of missing out. Fourth, on CBDCs, some central banks may only adopt them based on their respective economic needs. However, rising crypto-currency populism drives associated economic risks which can force the hands of central banks to adopt CBDCs in lieu of said needs. Each country faces unique challenges. Some central banks may not want to be left behind even if they believe their policy framework is facilitating economic activity efficiently. While the Fed has stated that it will not adopt a CBDC for the primary reason of ensuring payment security since it believes it already has a safe system in place, this view will change. The Fed could justify a move to a CBDC US dollar on the single basis of transitioning to a more sophisticated technology for the future. The Fed will not want to be caught behind the curve considering the PBoC is priming its digital yuan for release soon. Technological leadership is a strategic imperative of the United States and that imperative applies to financial technology as well as other areas. Guy Russell Research Analyst GuyR@bcaresearch.com Matt Gertken Vice President Geopolitical Strategy mattg@bcaresearch.com Footnotes 1 Muyao Shen, “China Reiterates Crypto Bans From 2013 and 2017”, coindesk, May 18, 2021, coindesk.com. 2 As of May 11, 2021. 3 There are several other reasons or “problems” that crypto-currencies are created for or to solve, but speed and privacy form the basis of crypto-currencies first coming into existence. 4 Not all crypto-currencies transact in less than an hour. But there are many that transact in several minutes and in some cases, mere seconds. As the leading crypto-currency, Bitcoin takes approximately one hour for a transaction to be fully verified over its network. 5 “McKinsey’s Global Banking Annual Review”, McKinsey, Dec. 9, 2020, mckinsey.com. 6 We use Bitcoin as an example to understand the risk and impact of forthcoming government regulation and competition. Because of Bitcoin’s status, any significant risks that threaten the crypto-currency’s standing as the number one currency will threaten the entire market. 7 As of May 20, 2021. Figure varies daily. See www.coinmarketcap.com for more information. 8 Alternative currencies such as Ethereum, Ripple, Binance Coin, Dogecoin, and Cardano have chipped away at Bitcoin’s crypto-market dominance through 2021. 9 According to The Center For Alternative Finance, The University Of Cambridge. 10 According to The Center For Alternative Finance, The University Of Cambridge. 11 Data on the use of crypto-currencies for illicit activitiessays otherwise. Of all crypto-currency transactions, it is estimated that only 2.1% are used for illicit activities. See “2021 Crypto Crime Report”, Chainalysis, chainalysis.com. 12 A Bitcoin halving is when the reward for mining Bitcoin transactions is cut in half. This event also cuts Bitcoin's inflation rate and the rate at which new Bitcoins enter circulation, in half. Bitcoin last halved on May 11, 2020.
Highlights ECB Tapering?: Investor fears that the ECB could follow the Bank of Canada and Bank of England and begin to taper its bond buying sooner than expected – perhaps as soon as next month’s policy meeting – are misplaced. The last thing the ECB wants to see is the surge in the euro and Italian bond yields that would surely follow any move to pre-emptively begin reducing monetary accommodation in response to faster European growth and inflation. Euro Area Bond Strategy: We are sticking with our current European bond recommendations: overweighting Europe within global bond portfolios - favoring Peripheral sovereigns and corporates versus government debt of the core countries - while also overweighting inflation-linked bonds in France, Italy and Germany where breakevens are undervalued. We also suggest a new tactical trade to fade the current market pricing of ECB rate hikes by going long the December 2023 euribor interest rate futures contract. Feature Dear Client, Next week, we will be jointly publishing a Special Report, discussing the investment implications of the current global housing boom, with our colleagues at the monthly Bank Credit Analyst. You will be receiving that report on Friday, May 28. We will return to regular weekly publishing schedule on Tuesday, June 1. - Rob Robis Chart of the WeekAn Underwhelming Rise In European Bond Yields
An Underwhelming Rise In European Bond Yields
An Underwhelming Rise In European Bond Yields
For next month’s monetary policy meeting, European Central Bank (ECB) President Christine Lagarde reportedly plans to invite the Governing Council members to meet in person for the first time since the start of the pandemic. That provides an interesting subtext to a meeting that will surely involve a debate over how much monetary support is still necessary for an increasingly vaccinated Europe that is emerging from the depths of COVID-19. Some ECB officials have already noted that the risks to economic growth and inflation expectations were now “tilted to the upside”, according to the minutes of the last ECB meeting in April. With European economic confidence improving, European bond yields have moved higher in response (Chart of the Week). The benchmark 10-year German bund yield now sits at -0.11%, up 46bps year-to-date but with half of that move occurring over the past month. The pickup up in yields has not been contained to the core countries of Germany and France – the 10-year Italian government bond yield is now up to 1.11%, over twice the level that began 2021 (0.52%). Inflation expectations have picked up sharply, with the 5-year/5-year forward euro CPI swap now up to 1.63%, a level last seen in December 2018. These yield increases have lagged the big moves seen in other countries; 10-year government bond yields in the US and Canada have seen year-to-date increases of 72bps and 90bps, respectively. In those countries, yields have surged because of rising inflation expectations and worries about a tapering of central bank bond buying – concerns that turned out to be accurate in the case of Canada, where the Bank of Canada did indeed announce a slower pace of bond buying last month. In our view, it is still too soon for the ECB to contemplate such a shift to a less dovish policy stance. This message is corroborated by our ECB Monitor that has risen but is still not signaling a need for tighter monetary policy. The bond selloff in Europe looks like a case of "too much, too fast". The ECB Now Has A Lot To Think About Recent euro area economic data has not only caught up to the earlier strength visible in the US, but in some cases is back to levels not seen for many years. The expectations component of the German ZEW survey surged nearly 14 points in May and is now up to levels last seen in 2000. The Markit PMI for manufacturing reached an all-time high of 62.9 in April. The European Commission’s consumer confidence index for the euro area is nearly back to pre-pandemic levels (Chart 2), which bodes well for a continued recovery of the Markit PMI for services. More positive news on the pandemic is driving the surge in growth expectations. The pace of new COVID-19 cases has fallen steadily, with Italy – one of the hardest-stricken regions during the initial months of the pandemic – now seeing the lowest rate of new cases since October (on a rolling 7-day basis). Meanwhile, the pace of vaccinations has accelerated after a slow initial rollout; the number of daily jabs administered (per 100 people) is now greater in Germany, France and Italy than in the US (Chart 3). Chart 2European Growth Is Recovering
European Growth Is Recovering
European Growth Is Recovering
Chart 3Inoculation Acceleration In Europe
Inoculation Acceleration In Europe
Inoculation Acceleration In Europe
Chart 4How Much Spare Capacity Is There In Europe?
How Much Spare Capacity Is There In Europe?
How Much Spare Capacity Is There In Europe?
The rapid increase in inoculations is setting Europe up for a solid recovery from the lockdown-driven double-dip recession of Q4/2020 and Q1/2021. The European Commission upgraded its growth forecasts for the euro area last week, with real GDP now expected to expand by 4.3% in 2021 and 4.4% in 2022, compared with previous forecasts of 3.8% in both years. All euro area countries are now expected to see a return to the pre-pandemic level of economic output by the end of 2022 – a number boosted by a pickup in public investment through the Next Generation EU (NGEU) package, which is expected to begin paying out funds later this summer. The ECB will surely raise its own forecasts at the June meeting, both for economic growth and inflation. The outlook for the latter will likely turn into the biggest source of debate within the ECB Governing Council. Despite the fairly coordinated recovery of survey-based data like the manufacturing PMIs, there remains a wide divergence of unemployment rates - and measures of spare capacity, more generally - within the euro area (Chart 4). This will make it difficult for the ECB to determine if the current surge in realized inflation, which has pushed the annual growth of headline HICP inflation towards the 2% level in many euro zone nations, can persist with countries like Italy and Spain still suffering from very high unemployment. The wide dispersion of unemployment rates within the euro zone also suggests that the current level of policy rates (at or below 0%) is appropriate. One simple metric to measure the “breadth” of European labor market strength is to look at the percentage of euro area countries that have an unemployment rate below the OECD’s estimate of the full employment NAIRU.1 That metric correlates well with an estimate of the appropriate level of euro area short-term interest rates generated by a basic Taylor Rule. Currently, only 43% of euro zone countries are beyond full employment, which is consistent with an ECB policy rate round 0% (Chart 5). Chart 5Policy Rates Near 0% Are Still Appropriate
Policy Rates Near 0% Are Still Appropriate
Policy Rates Near 0% Are Still Appropriate
A slightly larger share of countries (47%) is witnessing an acceleration in wage growth (bottom panel). This could mean that some of the NAIRU estimates for the individual countries are too low, which would fit with the acceleration in overall euro area wage growth seen since 2015. With so many euro area countries still working off the rise in unemployment generated by the pandemic, however, it will take some time for the ECB to get a clear enough read on labor market dynamics to determine if any necessary monetary policy adjustments should be made. The “breadth” of data trends do not only correlate to theoretical interest rate measures like the Taylor Rule. Actual ECB policy decisions are motivated by the degree to which higher growth and inflation is evident across the euro area. In Chart 6, we show a similar metric to the labor market breadth measures from Chart 5, but using other economic and inflation data. Specifically, we show the percentage of euro area countries that are seeing: Chart 6ECB Typically Tightens When Growth AND Inflation Are Broad Based
ECB Typically Tightens When Growth AND Inflation Are Broad Based
ECB Typically Tightens When Growth AND Inflation Are Broad Based
a) Accelerating growth momentum, indicated by an OECD leading economic indicator that is higher than the level of one year earlier; b) Accelerating inflation momentum, comparing the latest reading on headline HICP inflation to that of one year earlier; c) Relatively high inflation, measured by headline HICP inflation being above the ECB’s “just below 2%” target. Looking at all previous periods of ECB monetary tightening since the inception of the euro in 1998 – taking the form of actual policy rate hikes or a flat-to-declining trend in the ECB’s balance sheet – it is clear that the ECB does not tighten without at least 75% of euro area countries seeing both economic growth and inflation accelerate. Actual rate hikes occur when at least 75% of countries had inflation above 2%, as occurred during the hiking cycles of 2000, 2005-2007 and 2011. More recently, the ECB paused the expansion of its balance sheet in 2017 when growth and inflation accelerated, but did not make any policy rate adjustments as only 50% of countries had inflation above 2%. Today, essentially all euro area countries are seeing accelerating growth momentum compared to the pandemic-depressed levels of a year ago. 59% of the euro area is seeing faster inflation, a number that is likely to move higher as more of Europe reopens from lockdown amid a surge in global commodity prices. Yet only 12% of euro area countries have headline inflation above 2%, suggesting that realized inflation is not yet strong enough to trigger even an ECB balance sheet adjustment, based on the 2017 experience. Don’t Bet On A June ECB Taper So judging by past ECB behavior, an announcement to taper bond buying at the June policy meeting would be highly premature. A more likely scenario is that an upgrade of the ECB’s growth and inflation forecast prompts a discussion of what to do with all the varying parts of the ECB’s monetary stimulus – quantitative easing, bank funding programs like TLTROs, as well as policy interest rates. Yet it will be impossible for the ECB Governing Council to reach any conclusions on their next step(s) at the June meeting because the very nature of the ECB's inflation target might soon change. The ECB is currently conducting a review of its monetary policy strategy – the first since 2003 – that is scheduled for completion later this year. Some adjustment to the ECB inflation target is expected to allow more flexibility, but it is not yet clear what that change will look like. Could the ECB follow the lead of the Federal Reserve and move to an “average inflation target” regime, tolerating overshoots of the inflation target after periods of below-target inflation? ECB Chief Economist Philip Lane noted back in March that “there was a very strong logic” to the Fed’s new approach. He also said that the “very different histories of inflation” in some European countries may make it difficult to reach an agreement on any system that allows even temporary periods of higher inflation.2 More recently, Bank of Finland Governor Olli Rehn – a moderate member of the Governing Council who was considered a candidate for the current ECB presidency – came out in favor of the ECB shifting to a Fed-like average inflation target for Europe in a recent Financial Times interview.3 Rehn noted that a Fed-like focus on aiming for maximum unemployment “makes sense in the current context of a lower natural rate of interest.” Rehn went on to describe the ECB’s current wording of its inflation target as having “generated a perception of asymmetry” such that “2 per cent is perceived as a ceiling and that is dampening inflation expectations.” We imagine that Jens Weidmann from the Bundesbank would vehemently oppose any move to change the ECB inflation target to tolerate even a temporary period of inflation above 2%. German headline HICP inflation already reached 2.1% in April, with more increases likely as the German economy reopens from extended pandemic lockdowns. Yet even if Weidmann were to not dig in his heels against any “loosening” of the ECB inflation target, the looming conclusion of the ECB strategy review makes it highly unlikely that any change in policy – like tapering – could credibly be announced before then. If higher inflation will be tolerated, then why bother to taper at all? Looking beyond the inflation strategy review, there are other factors that could weigh on the ECB in its deliberations on the next monetary policy move: China policy tightening: China – Europe’s largest trading partner – has seen its policymakers begin to rein in credit growth, and fiscal spending, after allowing a surge in borrowing in 2020 to help boost growth during the pandemic. Our measure of the China credit impulse leads the annual growth rate of European exports to China by around nine months (Chart 7), and is flagging a dramatic slowing of exports in the latter half of this year. This represents a downside risk to euro area growth, particularly in countries that export more heavily to China like Germany. Slowing loan growth: The annual growth rate of overall euro area bank lending peaked at 12.2% back in February and is now down to 10.9% (Chart 8). Much of the softening has occurred in Germany and France – countries that had seen a big take-up of subsidized bank funding through the ECB’s TLTROs. The pricing incentives set up by the ECB for the latest TLTRO program were highly attractive, and it appears that German and French banks took advantage of the cheap funding to ramp up lending activity. This makes the economic interpretation of the bank lending data more challenging for the ECB, especially with Italian loan growth – and TLTRO usage – now accelerating. Chart 7Warning Signs For European Export Demand
Warning Signs For European Export Demand
Warning Signs For European Export Demand
Chart 8ECB LTROs Are Becoming Italy-Focused
ECB LTROs Are Becoming Italy-Focused
ECB LTROs Are Becoming Italy-Focused
NGEU spending: As mentioned earlier, disbursements from the €750bn NGEU (a.k.a. “recovery fund”) are expected to begin later this year, pending EU approval of government investment proposals. NGEU funds are intended to finance initiatives that can boost future economic growth, like investments in digital and green programs. Most euro area countries have already submitted their proposals, led by Italy’s request for €192bn. Chart 9NGEU Will Give A Big Boost To European Growth Over The Next Five Years
ECB Outlook: Walking On Eggshells
ECB Outlook: Walking On Eggshells
Chart 10NGEU Impact Will Be Front Loaded
NGEU Impact Will Be Front Loaded
NGEU Impact Will Be Front Loaded
A recent study by S&P Global concluded that NGEU investments could boost overall euro area growth by between 1.3 and 3.9 percentage points, cumulatively, between 2021 and 2026 (Chart 9).4 That same study also noted that the impacts of the spending will be front-loaded over the next two years (Chart 10). The Italian government believes that NGEU investment could double Italy’s anemic trend growth rate to 1.5%. Many ECB officials have noted that NGEU is the kind of structural fiscal stimulus that makes it less necessary to maintain highly accommodative monetary policy. Until the NGEU proposals are finalized and the final approved amounts are dispersed, however, the ECB will be unable to adjust its economic forecasts to account for more government investment. Given all of these immediate uncertainties, including how successfully Europe can reopen from pandemic lockdowns, we do not see a plausible scenario where the ECB Governing Council could conclude at the June policy meeting that an immediate change in the current monetary policy tools and guidance was needed. Bottom Line: Investor fears that the ECB could follow the Bank of Canada and Bank of England and begin to taper its bond buying sooner than expected – perhaps as soon as next month’s policy meeting – are misplaced. Likely ECB Next Moves & Investment Implications While a June taper announcement from the ECB is unlikely, a hint towards a future move is quite possible. The ECB is notorious for preparing markets well in advance of any policy shifts, thus the official statement following the June meeting – as well as ECB President Lagarde’s press conference – could contain clues as to what the ECB will do next. Chart 11ECB Easing Takes Many Forms
ECB Easing Takes Many Forms
ECB Easing Takes Many Forms
A discussion of what will happen with the Pandemic Emergency Purchase Program (PEPP) – which is scheduled to end next March – could come up in June. We deem it more likely that the topic will be raised at the September policy meeting when there will be more clarity on the success of the reopening of Europe’s economy, and to the final approved size of the NGEU funds, which will determine the need to maintain an asset purchase program introduced because of the COVID-19 shock. There are certainly many policy options available for the ECB to choose from when they do decide to dial back accommodation. There are several policy interest rates that could be adjusted. Although it is likely that when the ECB next tries to hike interest rates, the first rate to move will be the overnight deposit rate which is currently at -0.5% and represents the “floor” for short-term interest rates in Europe (Chart 11). Rate hikes will not occur before the balance sheet tools are reduced or unwound, however, which means asset purchases will be dialed back first. Market participants are well aware of that order of policy choices, as a very flat path for short-term interest rates is currently discounted in the European overnight index swap (OIS) curve. The spread between forward rates in the OIS and CPI swap curves can be used as a proxy for the market forward pricing of real interest rates. Currently, the market-implied real ECB policy rate is expected to stay between -2% and -1% over the next decade (Chart 12). Put another way, the markets are pricing in a very flat path for ECB policy rates that will stay below expected inflation over the next ten years. While the natural real rate of interest in Europe is likely very low given low trend growth, a real rate as low as -2% discounts a lot of bad structural news for the European economy. By comparison, the NY Fed’s last estimate of the natural real rate (r-star) for Europe – calculated in Q2/2020 before the economic volatility surrounding the pandemic made r-star estimation more unreliable – was positive at +0.6%. The prolonged path of negative expected real interest rates in Europe goes a long way in explaining the persistence of negative real bond yields in the benchmark German government yield curve. Simply put, there is little belief that the ECB will ever be able to engineer a full-blown rate hike cycle – an outcome that Japanese fixed income investors are quite familiar with. Given the ECB’s constant worry about the level of the euro, and its role in impacting European growth and inflation expectations, markets are correct in thinking that it will be difficult for the ECB to lift rates much without triggering unwanted currency appreciation. It is no coincidence that the euro has been consistently undervalued on a purchasing power parity (PPP) basis ever since the ECB moved to a negative interest rate policy back in 2014 (Chart 13). Chart 12Markets Expect Negative European Real Rates For The Next Decade
Markets Expect Negative European Real Rates For The Next Decade
Markets Expect Negative European Real Rates For The Next Decade
Looking ahead, the ECB will need to be careful about signaling any changes in monetary policy, including tapering, that would force markets to revise up the future path of European interest rates and give the euro a large boost. Chart 13Low ECB Rates Keeping The Euro Undervalued
Low ECB Rates Keeping The Euro Undervalued
Low ECB Rates Keeping The Euro Undervalued
That means that European real bond yields are likely to stay deeply negative over at least the latter half of 2021, with any additional nominal yield increases coming from higher inflation expectations (Chart 14). This will limit how much more European bond yields can rise from current levels. Chart 14European Bond Strategy Summary
European Bond Strategy Summary
European Bond Strategy Summary
We continue to believe that core European bond yields will trade with a “low yield beta” to US Treasury yields over at least the second half of 2021 and likely into 2022 when we expect the Fed to begin tapering its bond buying. Thus, we are sticking with our strategic recommendation to overweight core European government bonds versus US Treasuries in global bond portfolios. We simply see greater odds of a taper occurring in the US than in Europe, with the Fed more likely to deliver subsequent post-taper rate hikes than the ECB. We still recommend a moderately below-benchmark duration stance within dedicated European bond portfolios, although if the 10-year German bund yield rises significantly into positive territory, we would likely look to raise our suggested European duration exposure. We are also maintaining our recommended overweight on European inflation-linked bonds, as breakeven spreads in Germany, France and Italy are the only ones that remain below fair value in our suite of global valuation models. On European credit, we continue to recommend overweighting spread product versus sovereign bonds. That includes Italian and Spanish government bonds, as well as both investment grade and high-yield corporate debt. The time to turn more bearish on those markets will be when the ECB does begin to taper its asset purchases, as credit spreads have tended to widen during periods when the growth of the ECB’s balance sheet has been decelerating (Chart 15). We expect that when the ECB does finally decide to taper, the net amount of TLTROs will likely be maintained near current levels (by introducing new TLTROs to replace expiring ones). This will ensure that borrowing costs in the more fragile countries like Italy do not spike higher from the double-whammy of reduced ECB buying of Italian bonds and diminished access to cheap ECB bank funding. One final note – we are introducing a new trade in our Tactical Overlay portfolio on page 19 this week, as a way to fade the markets pricing in a more hawkish ECB outlook. A 10bp rate hike – the most likely size of any first attempt for the ECB to lift rates – is now priced in the OIS curve around mid-2023. By the end of 2023, nearly 25bps of hikes are discounted in forward rate curves. We do not expect the ECB to lift rates at all in 2023, but even if rates were increased, a cumulative 25bps of hikes within six months is unlikely to be delivered. Thus, we recommend going long the December 2023 3-month Euribor interest rate futures contract at an entry price of 100.27 (Chart 16). Chart 15ECB Tapering Would Be Bad News For European Credit
ECB Tapering Would Be Bad News For European Credit
ECB Tapering Would Be Bad News For European Credit
Chart 16Go Long Dec/2023 Euribor Futures
Go Long Dec/2023 Euribor Futures
Go Long Dec/2023 Euribor Futures
Bottom Line: The last thing the ECB wants to see is the surge in the euro and Italian bond yields that would surely follow any move to pre-emptively begin reducing monetary accommodation in response to faster European growth and inflation. We are sticking with our current European bond recommendations: overweighting Europe within global bond portfolios - favoring Peripheral sovereigns and corporates versus government debt of the core countries - while also overweighting inflation-linked bonds in France, Italy and Germany where breakevens are undervalued. Robert Robis, CFA Chief Fixed Income Strategist rrobis@bcaresearch.com Footnotes 1 NAIRU is an acronym for the Non-Accelerating Inflation Rate of Unemployment. 2 Lane’s comments came from a wide-ranging interview with the Financial Times published on March 16, 2021, which can be found here: https://www.ft.com/content/2aa6750d-48b7-441e-9e84-7cb6467c5366 3 Rehn’s comments were published earlier this month on May 9 and can be found here: https://www.ft.com/content/05a12645-ceb2-4cd5-938e-974b778e16e0 4 The S&P Global report, titled “Next Generation EU Will Shift European Growth Into A Higher Gear”, can be found here: https://www.spglobal.com/ratings/en/research/articles/210427-next-generation-eu-will-shift-european-growth-into-a-higher-gear-1192994 Recommendations The GFIS Recommended Portfolio Vs. The Custom Benchmark Index
ECB Outlook: Walking On Eggshells
ECB Outlook: Walking On Eggshells
Duration Regional Allocation Spread Product Tactical Trades Yields & Returns Global Bond Yields Historical Returns
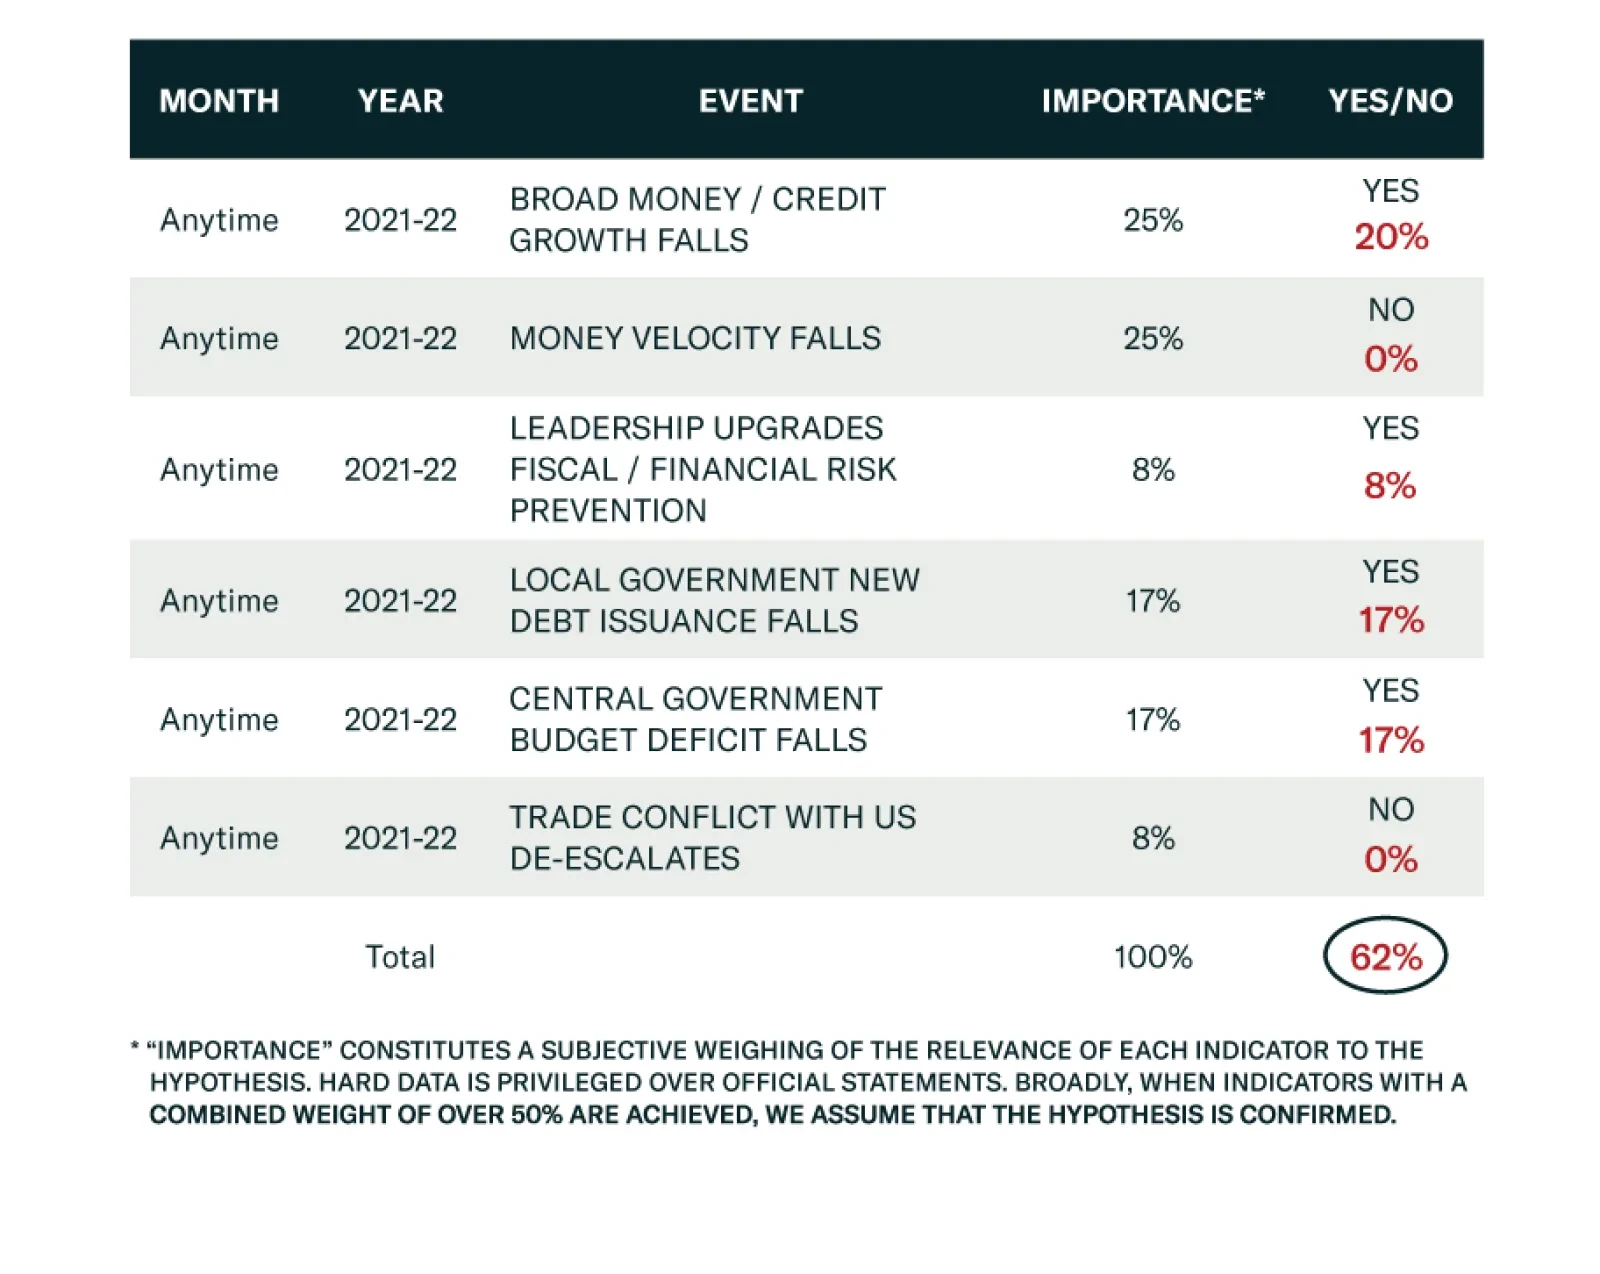
BCA Research’s Geopolitical Strategy service believes that global equities, commodities, and “China plays” are at risk of a substantial correction as a result of China’s policy tightening. China’s troubles stem from the ongoing change of its economic model…