Policy

Dear Client, This week, the US Bond Strategy service is hosting its Quarterly Webcast (May 19 at 10:00 AM EDT, 3:00 PM BST, 4:00 PM CEST, 11:00 PM HKT). In addition, we are sending this Quarterly Chartpack that provides a recap of our key recommendations and some charts related to those recommendations and other areas of interest for US bond investors. Please tune in to the Webcast and browse the Chartpack at your leisure, and do let us know if you have any questions or other feedback. To view the Quarterly Chartpack PDF please click here. Best regards, Ryan Swift, US Bond Strategist
Highlights The ECB is not repressing interest rates and penalizing savers. The Eurozone shows none of the symptoms associated with financial repression. Global excess savings are keeping US rates depressed. If US rates are low, then European rates must be lower because of structural problems in the region’s economy, independent of the ECB’s preferences. Structurally, there is still no case for European yields to rise meaningfully compared to the rest of the world. Despite positive forces over the next year or two, European financials will remain long-term underperformers. European utilities will outperform US ones. The euro is transforming into a safe haven like the yen and the Swiss franc. Feature By maintaining negative short rates, the European Central Bank is conducting severe financial repression, which distorts rates of return and penalizes savers. This is a common refrain among many insurers and pension plan managers investing in Europe and among a large number of the region’s politicians. Chart 1The ECB's Financial Repression?
The ECB's Financial Repression?
The ECB's Financial Repression?
At first glance, this criticism is apt. For the past five years, negative policy rates have forced safe-haven Bund yields to trade well below the Euro Area’s nominal GDP growth (Chart 1). Moreover, the real ECB deposit rate remains well below the Holston, Laubach-Williams estimate of R-star (the real neutral rate of interest). If we go beyond these superficial observations, it is far from clear that the ECB is conducting financial repression or distorting market rates any more than other major global central banks. Is It Financial Repression? The ECB is not conducting financial repression; rather, it is responding to powerful economic forces in Europe and beyond that are depressing interest rates. The definition of financial repression is crucial to this assessment. Financial repression involves monetary authorities actively suppressing interest rates to the advantage of the borrowers and users of capital at the expense of the savers, whose risk-free investments then provide subpar rates of returns. Following this definition, financial repression shows these clear symptoms: A low savings rate. Suppressed interest rates do not adequately compensate savers to forgo consumption. Thus, they are less likely to put money aside. A significant build-up of debt. Real interest rates are below fair market value, which subsidizes borrowing. A significant expansion of the money supply. Money supply expands rapidly in response to strong credit demand in the economy. Plentiful capital expenditures. Savers must take on more financial risk to make appropriate returns on their assets, which compresses risk premia. Depressed internal rates of return boost the net present value of investment projects and thus cause investments to account for a large share of output. A current account deficit. A nation’s current account balance equals its savings minus its investments. By depressing savings and stimulating investments, financial repression results in a current account deficit or a sharply deteriorating current account balance. Above-trend GDP growth. By depressing savings and boosting investments, financial repression lifts cyclical spending and forces the GDP to rise above its potential. The problem for commentators who argue that the ECB is conducting financial repression is that the Euro Area meets none of these criteria. First, Eurozone money and credit growth has run well below that of the US ever since the euro crisis, despite ECB policy rates that are constantly lower than the Fed Funds rate. Moreover, since the ECB cut rates to zero, the pace of money and credit creation has decelerated significantly compared to their pre-crisis trends (Chart 2). Second, the Euro Area’s real GDP per capita, nominal GDP per capita, and the GDP deflator have also fallen 4.6%, 5.2% and 5%, respectively, behind those of the US, since the ECB has cut interest rates to zero (Chart 3). Moreover, the growth of these variables has also decelerated significantly over this period, which is consistent with depressed credit demand. Additionally, despite the inferior performance of European activity metrics compared to those of the US since the introduction of the common currency, European government bonds have performed exactly in line with those of the US (Chart 3, bottom panel) and have therefore outperformed in real terms. This is inconsistent with financial repression by the ECB. Chart 2Europe's Money And Credit Trends Are Too Tame...
Europe's Money And Credit Trends Are Too Tame...
Europe's Money And Credit Trends Are Too Tame...
Chart 3... So Are Output Volume And Price Trends
... So Are Output Volume And Price Trends
... So Are Output Volume And Price Trends
Finally, the Euro Area runs a current account surplus of 2.3% of GDP, which has grown by 4.1% of GDP since late 2008. This is the clearest sign that Eurozone savings have become excessive relative to investment, despite the surge in government deficits in the wake of the COVID-19 pandemic. Excess savings are not typically associated with central banks artificially distorting interest rates. Bottom Line: The economic developments in the Euro Area do not correspond to what would be anticipated if the ECB were repressing interest rates. The growth rate of money and credit has structurally slowed both in absolute terms and compared to that of the US. The same deceleration is evident in both real and nominal output per person, as well as in price levels. Finally, the Eurozone’s current account surplus has widened, which highlights that savings have grown in excess of investments. The Eurozone Needs Lower Interest Rates Than The US The ECB must set appropriately low interest rates, if US yields are low across the curve. In a way, the case that the Federal Reserve is conducting financial repression is stronger than the case against the ECB. Over the past twelve years, nominal and real output per capita have grown more robustly in the US, while money as well as credit expansion and inflation have also been stronger. The US runs a persistent current account deficit of 3.1% of GDP, which also indicates that it is not awash in excess domestic savings. Chart 4Maybe The Fed Is Repressing Interest Rates
Maybe The Fed Is Repressing Interest Rates
Maybe The Fed Is Repressing Interest Rates
We could even argue that the case for the Fed repressing interest rates is growing stronger. The federal budget deficit has expanded to 19% of GDP, even as the unemployment rate tumbles (Chart 4). Moreover, US quarterly GDP growth has averaged 8.5% since the fourth quarter of 2020 and, according to Bloomberg consensus estimates, is anticipated to average 6.3% for the remainder of the year. US inflation is also strong. Annual core CPI Inflation hit 3% in April; monthly core inflation was 0.92%, or an annualized rate of 11.6%, the strongest reading in almost 40 years. Yet, even in the US, the argument that the Fed is repressing interest rates is ultimately weak, despite the aforementioned economic strength. The Fed is accommodating global market pressures that are greater than those of the US economy. In other words, even if the Fed did not set short rates, US interest rates would be low across the curve because of global excess savings. Chart 5Too Much Savings, Everywhere
Too Much Savings, Everywhere
Too Much Savings, Everywhere
Excess savings around the world constitute an exceptionally strong gravitational force that anchor global rates at low levels. As Chart 5 shows, since the early 1990s, global private savings have outpaced investments by a cumulative 163% of GDP. Accumulated government deficit, which has accounted for 99% of global GDP, has been far too small to absorb fully this surplus of savings. The resulting imbalance places downward pressure on global inflation (a consequence of demand falling short of supply) and real interest rates, which means it depresses nominal interest rates across the curve. US interest rates also feel the yield-compressing effect of these excess global savings, even if the US economy does not generate excess savings itself (it runs a current account deficit). The major DM central banks are removing a greater proportion of the float of safe-haven from their jurisdictions than the Fed (Chart 6). The resulting scarcity of safe-haven securities means that US fixed-income products remain the natural outlet for global investors seeking safety and liquidity. Thus, despite the US lack of excess savings, Treasury yields have traded below nominal GDP growth 55% of the time over the past 30 years, no matter how strong US activity is or how wide federal deficits become. If the Fed has little choice but to accept low US interest rates, then the Eurozone must accept even lower interest rates because of its large excess savings. As Chart 7 illustrates, the 2-year and 10-year interest rate spreads (both in nominal and real terms) between the Eurozone and the US track the gap between the US current account deficit and the Europe’s current account surplus. Chart 6Treasurys Are The World Only Plentiful Safe-Haven
Treasurys Are The World Only Plentiful Safe-Haven
Treasurys Are The World Only Plentiful Safe-Haven
Chart 7Europe's Excess Savings Justify Lower Rates Across The Curve
Europe's Excess Savings Justify Lower Rates Across The Curve
Europe's Excess Savings Justify Lower Rates Across The Curve
The Eurozone lower rate of return on capital is another force depressing rates relative to the US (Chart 8). This lower return on capital reflects the following structural problems with the European economies: Excess capital stock. The Eurozone peripheral nations have abnormally large capital stocks in relation to their GDPs (Chart 9). As we previously argued, this feature means that Europe suffers from large amounts of misallocated capital, which hurt the return on capital. Chart 8Capital Is Not Rewarded In Europe
Capital Is Not Rewarded In Europe
Capital Is Not Rewarded In Europe
Chart 9Too Much Capital!
Too Much Capital!
Too Much Capital!
Ageing capital stock. Not only is the Eurozone capital stock too large relative to the size of its economy, it is also older than that of the US (Chart 10). An ageing capital stock, especially in a world where ICT spending is one of the key sources of innovation and growth, further hurts the Euro Area’s return on capital. Lower incremental output-to-capital ratio (Chart 11). The Euro Area generates significantly less output per unit of investment than the US. This confirms the notion that capital is misallocated and that it is used less productively than in the US. Chart 10Europe's Capital Is Ageing Too
Europe's Capital Is Ageing Too
Europe's Capital Is Ageing Too
Chart 11Poor Capital Utilization
Poor Capital Utilization
Poor Capital Utilization
Chart 12Europe's Inferior Productivity Problem
Europe's Inferior Productivity Problem
Europe's Inferior Productivity Problem
The final force limiting European interest rates compared to the US is the Euro Area’s inferior potential growth rate. The Eurozone’s population is ageing, and it will start to contract in 2030. Moreover, multifactor productivity growth is weaker than in the US (Chart 12). A lower potential GDP growth accentuates the discount in the Euro Area neutral rate of interest compared to the US. Bottom Line: Despite the relative economic vigor of the US, global excess savings lower US rates across the curve. The ECB has no choice but to accept even lower European rates, because the European economy suffers from greater excess savings than the US: its return on capital is inferior, and its neutral rate of interest is hampered by its lower potential GDP growth. Investment Conclusions For European rates to avoid the fate of Japan and to circumvent suffering many more decades wedged near zero, some important changes must take place. First, at the global level, excess savings must recede. This will allow global interest rates to increase, especially those of the US. Even if Eurozone rates continue to trade at a discount to the US, safe-haven yields in Europe would nonetheless climb in absolute terms. The fall in the global ratio of workers relative to dependent people, most notably in China where the 2020 population census has just highlighted the trend, is one factor pointing toward a potential gradual decline in global savings. For the moment, absorbing excess savings means that global fiscal policy must remain accommodative. Although fiscal authorities around the world continue to display greater profligacy than they did in the wake of the Great Financial Crisis, there is no guarantee that they will not revert to their old ways. In fact, BCA’s Global Investment Strategy service recently showed that the US fiscal policy is set to become more of a constraint on growth next year than it has been in 2020 and 2021 (Chart 13). One factor to monitor is the international shift in voters’ preferences toward left-wing economic policies, which often results in more generous fiscal spending. If this trend persists, then global fiscal deficits will close more slowly than the private sector savings will decline. This process will both be inflationary over the long run and impose upward pressure on real interest rates worldwide. But the fiscal excesses of the current moment may force opposition parties to restrain spending whenever they come into power. Chart 13Will Global Fiscal Policy Morph Into a Headwind?
The ECB Is Not In Charge
The ECB Is Not In Charge
Second, to narrow the spread between the Eurozone and US interest rates, the Euro Area must tackle its low rate of return on capital. Practically, this means that much of the excess capital stock weighing on European rates of returns must be written down. Doing so will require more cross border mergers and acquisitions within sectors in the Eurozone. However, the loss-recognition process on nonviable capital will be deflationary. Thus, to facilitate these asset write-downs, the region’s fiscal policy and monetary policy must first remain extremely accommodative. It is far from certain that European authorities will resist reverting to their old ways. A structural underweight on European financial equities remains appropriate. Even if the Eurozone enacts the reforms necessary to invite the peripheral asset write-downs required to boost rates of return in the long-run, in the interim, these reforms will be deflationary. Consequently, no matter what, Eurozone yields will remain well below the US for years to come. Moreover, European credit demand is unlikely to outperform the rest of the world for the coming few years. In this context, the RoE of European banks will remain low. Therefore, our current recommendation to overweight this sector is only valid as a near-term play on the global economic recovery and is not a strategic recommendation. By contrast, European utilities will structurally outperform their US counterparts. European utilities offer higher RoE than US ones and have healthier leverage (Chart 14). Moreover, European utilities trade at discounts to US firms on a price-to-book, price-to-cash flow, price-to-sales and dividend yield basis (Chart 15). Additionally, as yield plays, structurally lower European yields relative to those of the US will advantage European utilities on a long-term basis. Chart 14European Utilities Offer More Appealing Operating Metrics...
European Utilities Offer More Appealing Operating Metrics...
European Utilities Offer More Appealing Operating Metrics...
Chart 15... And Are More Attractively Priced Than US Ones
... And Are More Attractively Priced Than US Ones
... And Are More Attractively Priced Than US Ones
Finally, the euro will increasingly trade as a safe-haven currency like the yen and the Swiss franc. First, after a decade of trial by fire, EU integration and solidarity have gained rather than lost momentum and the EU break-up risk has proved to be limited to Brexit. Second, although the Eurozone economy is pro-cyclical, so are the Swiss and Japanese economies. Instead, the Euro Area’s structurally elevated savings rate and current account balance are transforming this economy into a net creditor, with a positive net international investment position equal to -0.1% of GDP. Moreover, the bloc’s low inflation will continue to put upward pressure on the euro’s long-term fair value. If we add the Euro Area’s low interest rates to the mix, then the euro is likely to behave increasingly as a funding currency. Thus, while the euro will benefit from the USD’s weakness forecasted by our Foreign Exchange Strategists, it will underperformed more pro-cyclical currencies such as the SEK, the NOK, or the GBP, which do not suffer from the same ills as the Eurozone. Mathieu Savary, Chief European Investment Strategist Mathieu@bcaresearch.com
Highlights Global currencies are at a critical level versus the dollar. From a positioning standpoint today, a break below 89-90 on the DXY index will be extremely bearish, while a bounce from current levels should be capped in the 3-4% range. Two key factors have pushed the dollar down: lower real rates in the US and recovering economic momentum outside the US. There could be some seasonal strength in the dollar as equity markets churn in May. However, this will provide an opportunity for fresh short positions. The Federal Reserve will maintain its resolve to view the current inflation overshoot as transitory, while it will still focus on the labor market. This will keep real rates in the US depressed relative to other countries. New trade idea: Go long CHF/NZD as a play on rising currency volatility. Also sell USD/JPY if it touches 110. Feature Chart I-1The Dollar Is At A Critical Juncture
The Dollar Is At A Critical Juncture
The Dollar Is At A Critical Juncture
After a brief rally from January to March, the dollar is once again on the verge of a technical breakdown. Both the DXY index, the Federal Reserve trade-weighted dollar and EM currency benchmarks are sitting at critical levels (Chart I-1). A breakdown will confirm that the dollar bear market that began in March 2020 remains intact. It will also trigger a flurry of speculative outflows from the dollar. In our December FX outlook,1 our view was that the DXY was headed towards 80 on a cyclical (12-18- month horizon). However, we also predicted the DXY index would hit 94-95 in the first quarter, a view we have reinforced multiple times since then. With the DXY index having peaked at 93.5, it is now instructive to explore the most likely next move. To do this, we will revisit what has changed and what has remained the same since our December piece. Gauging Investor Positioning Chart I-2Dollar Bulls Are Capitulating
Dollar Bulls Are Capitulating
Dollar Bulls Are Capitulating
Going into 2021, selling the dollar was a consensus trade and the currency was very much oversold. For contrarians, it paid to be bullish (Chart I-2). Since then, investors have closed their short positions on the dollar, shifting their focus to JPY- and CHF-funded carry trades. Speculators are still long the euro, but the magnitude of this bet has declined from a net 30% of open interest to around 10% today. Positioning in GBP and CAD are still elevated, which suggests that these currencies remain vulnerable to a technical pullback. Interestingly, the Citigroup sentiment indicator for the USD is close to its January nadir. From the vantage point of this gauge, there has been an accumulation of dollar short positions in recent weeks. This helps explain recent dollar weakness. Going forward, positioning will not be particularly useful in dictating the next move in the dollar since it only works well at extremes. Even then, it is only useful for gauging countertrend moves. For much of the early 2000s, sentiment on the dollar was bearish yet rallies were capped at 4-6%. During last decade’s dollar bull market, sentiment remained mostly in bullish territory, but the dollar achieved escape velocity (Chart I-3). Chart I-3The Dollar And Regime Shifts
The Dollar And Regime Shifts
The Dollar And Regime Shifts
From today’s positioning standpoint, a break below 89-90 on the DXY index will be an extremely bearish sign, while a bounce from current levels should be capped in the 3-4% range. This puts the greenback at a critical crossroad in technical terms. The Federal Reserve, Inflation And Interest Rates At the start of 2021, interest rates were moving in favor of the dollar, which continued a trend that has been in place since the middle of last year. The gap between the US and German 10-year yields rose from a low of around 100 basis points last year to a high of over 200 basis points in March. More recently, interest rate differentials have started to move against the dollar, explaining the broad reversal in dollar indices since March. The US-German 10-year spread now sits at 180 basis points. Exchange rates tend to reflect real interest rate differentials, since inflation erodes the purchasing power of a currency. As such, it is important to gauge not only what is happening to nominal rates, but also to underlying inflation trends. This complicates matters because inflation is often a lagging variable, so getting a sense of where inflation is headed can be greatly useful for currency strategy. As a starting point, the US does not rank well when it comes to real interest rates. Chart I-4 shows the broad correlation between real interest rates and the dollar. For low interest rate countries such as Switzerland, Sweden and the euro area, the peak in US real rates also coincided with a cyclical rebound in these currencies. Even for a currency such as the Japanese yen, real rates are favorable compared to the US. Nominal 10-year rates are 10bps and inflation swaps at the 10-year tenor are 23bps. This pins Japanese real rates almost 100bps above rates in the US. Chart I-4AInterest Rates Have Moved Against The Dollar
Interest Rates Have Moved Against The Dollar
Interest Rates Have Moved Against The Dollar
Chart I-4BInterest Rates Have Moved Against The Dollar
Interest Rates Have Moved Against The Dollar
Interest Rates Have Moved Against The Dollar
Chart I-4CInterest Rates Have Moved Against The Dollar
Interest Rates Have Moved Against The Dollar
Interest Rates Have Moved Against The Dollar
Of course, with inflation surprising to the upside in the US, the Fed could taper sooner than they have communicated and/or raise interest rates faster than the market expects. This will not be surprising given other central banks such as the Bank of Canada and the Bank of England have already telegraphed reduced asset purchases. However, even if the Fed does decide to taper its asset purchases, the impact on the dollar will not be as straightforward as some market participants expect. To understand why, consider Chart I-5, which shows that relative to other central banks, the Fed’s balance sheet impulse is already shrinking by approximately 13% of GDP. In essence, the Fed has already been "stealthily" tapering asset purchases compared to other G10 central banks. This action supported the dollar this year. It has also pushed market pricing of the Fed funds rate well above the median dots of the FOMC in 2 years (Chart I-6). Thus the prospect of the Fed tapering asset purchases might already be embedded in the price of assets. Chart I-5Stealth Tapering By The Fed?
Stealth Tapering By The Fed?
Stealth Tapering By The Fed?
Chart I-6Markets Have Already Priced A Hawkish Fed
Markets Have Already Priced A Hawkish Fed
Markets Have Already Priced A Hawkish Fed
Going forward, our Global Fixed Income colleagues have noted that the Fed is already moving down the ladder in terms of who is expected to taper next.2 The Bank of Japan and the European Central Bank have barely tapered their asset purchases. They might not announce anything significant in their June 10 and June 18 meetings respectively, but markets will still be squarely focused on any change in language. Chart I-7A Profligate US Government Has Historically Been Dollar Bearish
A Profligate US Government Has Historically Been Dollar Bearish
A Profligate US Government Has Historically Been Dollar Bearish
If investors decide to take the Fed’s messaging at face value, which suggests that the FOMC will look through any upside surprises in inflation, then real rates will remain depressed in the US—which will pressure the dollar lower. We have little conviction about whether US inflation is transient or more permanent. However, we do know that the US economy is more inflationary than most other developed markets because the US is stimulating domestic demand by much more than is required to close the output gap. Historically, this is a bearish development for the US dollar (Chart I-7). Economic Momentum As A Catalyst To the extent that monetary policy is tailored to suit domestic economic conditions, growth momentum is clearly rotating from the US to other countries. This suggests that the case for other central banks, such as the ECB or the RBA, to follow the steps of the BoE or BoC is rising at the margin. Manufacturing PMIs around the world have overtaken US levels, and it is only a matter of time before the services PMIs catchup. Chart I-8 shows that euro area data continues to surprise to the upside, with the economic surprise index between the euro area and the US at a decade high. This has historically been synonymous with modestly higher Eurozone bond yields relative to the US, which has also provided some support for the currency. The expectations component of both the ZEW and the Sentix surveys came out stronger this month, which confirms that both European and German growth should remain healthy over the summer (Chart I-9). Chart I-8Small Window For European Yields To Rise
Small Window For European Yields To Rise
Small Window For European Yields To Rise
Chart I-9Euro Area Data To Stay Strong
Euro Area Data To Stay Strong
Euro Area Data To Stay Strong
As for the slowdown in Chinese stimulus, we agree it is a risk to global growth as our China Strategists highlight, but two opposing factors are also at play: Chinese stimulus leads the economy by a long lag. Last cycle, the apex of Chinese credit was in 2016, but it took until 2018 for global trade to slow down (Chart I-10). This partly explains why commodity prices have not relapsed, despite slowing credit creation from their largest buyer. An economy cannot rely on credit formation alone. At some point, the baton has to be passed to the forces of animal spirits. The velocity of money, or how many units of GDP are created for every unit of money creation, is one of these forces. Chart I-11 shows that the velocity of money has been rising faster outside the US, led by China. Chart I-10Chinese Credit Impulse Works With A Lag
Chinese Credit Impulse Works With A Lag
Chinese Credit Impulse Works With A Lag
Chart I-11Money Velocity Versus The US
Money Velocity Versus The US
Money Velocity Versus The US
The above trends give us conviction that any strength in the dollar is a countertrend move that should be faded until the Federal Reserve does a volte face and tightens monetary policy faster than they have telegraphed. A period of weak global growth would constitute another risk to our view. Interestingly, the Chinese RMB has hit new cyclical lows, despite a narrowing of interest rate differentials between the US and China. We suggested in our February Special Report that USD/CNY was headed for 6.2, even if interest rate differentials between the US and China narrowed. If Chinese economic activity is able to stay relatively robust despite slowing credit formation, then USD/CNY will decline further. Chart I-12EM Growth Remains Weak
EM Growth Remains Weak
EM Growth Remains Weak
A break lower in USD/CNY is a necessary but not a sufficient condition for EM currencies to outperform. Relative to the US, EM growth remains worse than at the depths of the COVID-19 recession last year (Chart I-12). Our Emerging Market Strategists reckon a change in economic conditions will be necessary for EM currencies to outperform on a sustained basis. A broadening of the vaccination campaign toward EM countries is likely to hold the key to this change. The Real Risk To Dollar Short Positions The risk from shorting the dollar at current levels comes from the equity market. Developed market currencies have run ahead of the relative performance of their domestic bourses. This is a departure from historical correlations (Chart I-13). A reset in equity markets that favors defensive equities will lead to inflows into the US equity and bond markets, which will hurt DM currencies and buffet the dollar. It is worrisome that this earnings season, the US enjoyed stronger positive earnings revisions. Correspondingly, the US put/call ratio remains very depressed, with complacency reigning across most equity bourses (Chart I-14). Chart I-13ACurrencies Have Ran Ahead Of Equity Outperformance
Currencies Have Ran Ahead Of Equity Outperformance
Currencies Have Ran Ahead Of Equity Outperformance
Chart I-13BCurrencies Have Ran Ahead Of Equity Outperformance
Currencies Have Ran Ahead Of Equity Outperformance
Currencies Have Ran Ahead Of Equity Outperformance
Chart I-14Lots Of Exuberance In US Stocks
Lots Of Exuberance In US Stocks
Lots Of Exuberance In US Stocks
Chart I-15Equities And The Dollar Have Diverged
Equities And The Dollar Have Diverged
Equities And The Dollar Have Diverged
The nature of a potential market reset is important to consider. For example: Global equities correct, but technology and healthcare lead the drop. In this scenario, the dollar underperforms, as is happening now (Chart I-15) because the US has a heavy weighting in these defensive sectors. The reverse will happen if value stocks or cyclicals lead the drop in global equities. Global equities correct, but bond yields drop as well. The initial reaction will be a stronger dollar as US inflows accelerate, but this will also curb the appeal of the US dollar since Treasury yields will converge towards those of Bunds or JGBs. Moreover, US real rates will collapse even further. We will be sellers of the dollar on strength in this scenario. Global equities correct as yields increase. If US yields lead this rise, the dollar will rally at first, but outflows from the US equity market will also accelerate. If this rotation is durable, the dollar will eventually depreciate, because foreign bourses are highly levered to rising yields. In a nutshell, the US bond market offers attractive yields and the US stock market could behave defensively (as has historically been the case) in a market correction. This creates a risk to shorting the dollar today. Currency Strategy Currency markets are at a critical juncture (Chart I-1) where either a breakdown in the dollar or a countertrend reversal is imminent. Our strategy remains the same it has been so far in 2021. Continue to short the USD against a basket of the most attractive currencies. On this basis, we are already long the Scandinavian currencies. Go short USD/JPY given lopsided positioning. We are placing a limit sell on USD/JPY today at 110. We are also raising our limit buy on the euro to 1.18. It is interesting that the EUR/JPY cross broke out from a multi-year downtrend. This cross has an inverse correlation with the dollar. Buy CHF/NZD today as a play on rising currency volatility. This is a good bet as markets grapple with the next central bank taper policy (Fed versus other DM economies) (Chart I-16). Wait for the equity market correction to play out, after which a green light to short the dollar outright will once again emerge. Historically, May is a good month for the dollar and a volatile one for equities (Chart I-17). That said, dollar bear markets often run in long cycles. Chart I-16Buy CHF/NZD As Insurance
Buy CHF/NZD As Insurance
Buy CHF/NZD As Insurance
Chart I-17The Dollar And Seasonality
The Dollar And Seasonality
The Dollar And Seasonality
Chester Ntonifor Foreign Exchange Strategist chestern@bcaresearch.com Footnotes 1 Please see Foreign Exchange Strategy Special Report, "2021 Key Views: Tradeable Themes," dated December 4, 2020. 2Please see Global Fixed Income Strategy Special Report, "Who Tapers Next?," dated December 04, 2020. Currencies US Dollar Chart II-1USD Technicals 1
USD Technicals 1
USD Technicals 1
Chart II-2USD Technicals 2
USD Technicals 2
USD Technicals 2
The recent data out of the US have been mixed: Average hourly earnings improved by 0.7% in April versus March, beating the expected 0.1% increase. Non-farm payrolls increased by 266K in April, far below the expected 978K and 770K in March. The unemployment rate worsened slightly from 6% in March to 6.1% in April, versus an expected improvement to 5.8%. The NFIB Small Business Optimism survey edged higher to 99.8 in April from 98.2 the prior month. CPI came in at 4.2% year on year in April, outpacing expectations of a 3.6% rise. Month on month, CPI grew by 0.8% in April, crushing the 0.2% consensus. Core CPI came in at 3% year on year in April, beating the expected 2.3%. PPI also surprised to the upside, clocking in at 6.2% year on year in April, versus an expected rise of 5.8%. The US dollar DXY index dropped by 1.3% this week. While CPI surged ahead, employment severely lagged expectations. The Fed’s “maximum employment” target, a gateway to any asset purchase tapering, is unlikely to be reached when the market expects it. This combination of persistent Fed dovishness and potential sizable inflation is bearish for the dollar. Report Links: Arbitrating Between Dollar Bulls And Bears - March 19, 2021 The Dollar Bull Case Will Soon Fade - March 5, 2021 Are Rising Bond Yields Bullish For The Dollar? - February 19, 2021 The Euro Chart II-3EUR Technicals 1
EUR Technicals 1
EUR Technicals 1
Chart II-4EUR Technicals 2
EUR Technicals 2
EUR Technicals 2
Recent data from the euro area have been strong: March German imports strengthened by 6.5% month on month, crushing the expected 0.7%. German ZEW current condition registered at -40.1 in May, far ahead of the -48.8 in April. German ZEW economic sentiment also surprised to the upside in May at 84.4 versus the anticipated 72. For the entire euro area, the ZEW economic sentiment increased to 84 in May from 66 in April. Sentix investor confidence improved to 21 in May from 13.1 in April, beating the expected 14. Sentix investor expectations climbed to an all-time high of 36.8. The current situation crossed into positive territory for the first time since February 2020. March industrial production was up by 0.1% month on month, lower than the expected 0.7%. The euro strengthened by 1.3% this week against the USD. The uplifting ZEW survey results reinforce our expectation of a global growth rotation in favor of the euro area. While the ECB may not taper asset purchases, a forceful vaccination campaign should lead to further upside data surprises, especially in services. The Euro Area Economic Surprise Index (ESI) remains elevated in contrast with the US ESI, which has declined sharply from its July 2020 peak. Report Links: Relative Growth, The Euro, And The Loonie - April 16, 2021 Portfolio And Model Review - February 5, 2021 On Japanese Inflation And The Yen - January 29, 2021 The Yen Chart II-5JPY Technicals 1
JPY Technicals 1
JPY Technicals 1
Chart II-6JPY Technicals 2
JPY Technicals 2
JPY Technicals 2
There was scant data out of Japan this week: Household spending strengthened by 7.2% in March versus February, comfortably beating the expected 2.1% increase. The Japanese current account weakened to JPY 2.65tn in March from JPY 2.9tn in February. The Eco Watchers Survey disappointed in April, with current conditions declining from 49 to 39.1 and the expectations component falling from 49.8 to 41.7. The yen was up by 0.5% against the USD this week. The recent extension of the already months-long state of emergency will put downward pressure on the yen in the near term. However, with Japanese equities and the currency in oversold conditions, we are cautiously optimistic on the yen further along in the year. Report Links: The Dollar Bull Case Will Soon Fade - March 5, 2021 On Japanese Inflation And The Yen - January 29, 2021 The Dollar Conundrum And Protection - November 6, 2020 British Pound Chart II-7GBP Technicals 1
GBP Technicals 1
GBP Technicals 1
Chart II-8GBP Technicals 2
GBP Technicals 2
GBP Technicals 2
The recent data out of the UK have been weak: Construction PMI remained mostly unchanged at 61.6 in April. GDP weakened, quarter on quarter, by 1.5% in Q1. More disappointing was business investment that dropped in Q1 by 11.9% quarter on quarter and 18.1% year on year. March GDP strengthened by 2.1% month on month, suggesting the pullback in the first quarter was mostly due to lockdowns. Manufacturing production was up by 2.1% in March versus February, beating the 1% consensus. The trade deficit narrowed to GBP11.71B in March. The pound was up by 1.7% this week against the USD. The soft Q1 output data, primarily a result of the winter lockdown, mask improvements in March. With restrictions being lifted, services output and household consumption (induced by excess savings) should quickly catch up with the recent bounce in manufacturing. However, markets may have priced in too much of the UK’s vaccination outperformance as is reflected in the overpriced small-cap equities. Report Links: Portfolio And Model Review - February 5, 2021 The Dollar Conundrum And Protection - November 6, 2020 Revisiting Our High-Conviction Trades - September 11, 2020 Australian Dollar Chart II-9AUD Technicals 1
AUD Technicals 1
AUD Technicals 1
Chart II-10AUD Technicals 2
AUD Technicals 2
AUD Technicals 2
The recent data out of Australia have been positive: The NAB Business confidence increased to 26 in April from 17 the prior month. The NAB business survey index also edged higher to 32 in April from 25 in March. Retail sales increased by 1.3% in March month on month, slightly below the expected 1.4%. Quarter on quarter, Q1 retail sales weakened by 0.5% versus the estimated drop of 0.4%. Q1 CPI came in below expectations at 0.6% quarter on quarter and 1.1% year on year. The AUD was up by 1.2% this week against the USD. While the NAB business confidence and conditions indices came in at record highs, the price pressures remain weak in Australia and vaccination progress continues to lag. That said, leading indicators such as capex intentions and forward orders are improving. We are short AUD/MXN mainly to capitalize on Mexico’s proximity to the rebounding US. Report Links: The Dollar Bull Case Will Soon Fade - March 5, 2021 Portfolio And Model Review - February 5, 2021 Australia: Regime Change For Bond Yields & The Currency? - January 20, 2021 New Zealand Dollar Chart II-11NZD Technicals 1
NZD Technicals 1
NZD Technicals 1
Chart II-12NZD Technicals 2
NZD Technicals 2
NZD Technicals 2
The recent data out of New Zealand have been scant: Electronic card retail sales increased by 4% month on month in April after a 0.8% drop in March. The food price index came in at 1.1% month on month in April, compared to 0% in March. The NZD was up by 0.8% this week against the dollar. With positive data coming out of New Zealand recently, our Global Fixed Income Strategy colleagues judge the RBNZ to be the next central bank most likely to taper sometime in the second half of 2021. However, with Q2 inflation expectations that remain soft and the tourism sector still held back by broad border shutdowns, we remain cautious on the kiwi. Report Links: Portfolio And Model Review - February 5, 2021 Currencies And The Value-Versus-Growth Debate - July 10, 2020 Updating Our Balance Of Payments Monitor - November 29, 2019 Canadian Dollar Chart II-13CAD Technicals 1
CAD Technicals 1
CAD Technicals 1
Chart II-14CAD Technicals 2
CAD Technicals 2
CAD Technicals 2
The recent data out of Canada have been mildly disappointing: The employment report was disheartening. Canada lost 207.1K jobs in April, and the participation rate dropped from 65.2% to 64.9%. The unemployment rate also weakened from 7.5% to 8.1% in April, higher than expected. The Ivey PMI dropped to 60.6 in April from 72.9 in March, in line with expectations. The CAD was up by 1.35% against the USD this week. Despite the already months-long rallying of the loonie and the housing prices, the CAD is still cheap by its real effective exchange rate. Strengthening oil prices should continue to support the currency. A potential extension to the current COVID-19 lockdown and lagging vaccination progress remain downside risks. Report Links: Relative Growth, The Euro, And The Loonie - April 16, 2021 Will The Canadian Recovery Lead Or Lag The Global Cycle? - February 12, 2021 Currencies And The Value-Versus-Growth Debate - July 10, 2020 Swiss Franc Chart II-15CHF Technicals 1
CHF Technicals 1
CHF Technicals 1
Chart II-16CHF Technicals 2
CHF Technicals 2
CHF Technicals 2
The recent Swiss data have been neutral: Unemployment rate remained relatively unchanged at 3.3% in April, in line with expectations. The Swiss franc was up by 1% this week against the USD. The franc is cheap with a real effective exchange rate that is at one standard deviation below fair value. Should the pickup in global trade continue, this will buffet the franc. However, our bias is that the SNB will continue to fight excessive franc strength, especially against the euro. So we think the franc will lag the euro over the longer term. We are also going long CHF/NZD today should currency volatility pick up. Report Links: Portfolio And Model Review - February 5, 2021 The Dollar Conundrum And Protection - November 6, 2020 On The DXY Breakout, Euro, And Swiss Franc - February 21, 2020 Norwegian Krone Chart II-17NOK Technicals 1
NOK Technicals 1
NOK Technicals 1
Chart II-18NOK Technicals 2
NOK Technicals 2
NOK Technicals 2
The recent data out of Norway have been mixed: CPI came in at 3% in April, in line with expectations. PPI growth registered at 22.5% in April, year on year. GDP dropped by 0.6% in Q1 quarter on quarter, a disappointment given an estimated 0.4% decrease. Mainland GDP also undershot expectations, decreasing by 1% in Q1 quarter on quarter. The NOK was up by 1% this week against the dollar. The soft Q1 data may hold back the NOK in the very near term, especially considering its remarkable performance since its March 2020 lows. That said, the rally in oil prices will continue to provide support to the NOK. Vaccination progress, on par with that of the euro area, should also benefit the currency. Report Links: Portfolio And Model Review - February 5, 2021 Revisiting Our High-Conviction Trades - September 11, 2020 A New Paradigm For Petrocurrencies - April 10, 2020 Swedish Krona Chart II-19SEK Technicals 1
SEK Technicals 1
SEK Technicals 1
Chart II-20SEK Technicals 2
SEK Technicals 2
SEK Technicals 2
Recent Swedish data have been mildly positive: The unemployment rate came down from 8.4% in March to 8.2% in April. CPI came in at 2.2% year on year and 0.2% month on month in April, in line with expectations. CPIF registered at 2.5% year on year and 0.3% month on month in April, both beating the consensus. The SEK was up by 2% this week against the USD. Vaccination progress in Sweden is only notches below that of the euro area. A potential shift of sentiment out of the crowded commodity-driven trades could also lend support to the export-driven SEK, on the back of a recovery in Europe in the near term. Report Links: Revisiting Our High-Conviction Trades - September 11, 2020 Updating Our Balance Of Payments Monitor - November 29, 2019 Where To Next For The US Dollar? - June 7, 2019 Footnotes 1 Please see Foreign Exchange Strategy Special Report, "2021 Key Views: Tradeable Themes," dated December 4, 2020. 2 Please see Global Fixed Income Strategy Special Report, "Who Tapers Next?," dated December 04, 2020. Trades & Forecasts Forecast Summary Core Portfolio Tactical Trades Limit Orders Closed Trades
Highlights Global stocks are very vulnerable to a correction. But cyclically the Fed is committed to an inflation overshoot and the global economy is recovering. China’s fiscal-and-credit impulse fell sharply, which leaves global cyclical stocks and commodities exposed to a pullback. Beyond the near term, China’s need for political stability should prevent excessive policy tightening. The risk is frontloaded. China’s population census underscores one of our mega-themes: China’s domestic politics are unstable and can bring negative surprises. India’s state elections, held amid a massive COVID-19 wave, suggest that the ruling party is still favored in 2024. This implies policy continuity. Stick with a bullish cyclical bias but be prepared to shift if China commits a policy mistake. Feature Chart 1Inflation Rears Its Head
Inflation Rears Its Head
Inflation Rears Its Head
Global markets shuddered this week in the face of a strong core inflation print in the US as well as broader fears as inflation rears its head after a long slumber (Chart 1). Cyclically we still expect investors to rotate away from US stocks into international stocks and for the US dollar to fall as the global economy recovers (Chart 2). However, this view also entails that emerging market stocks should start outperforming their developed market peers, which has not panned out so far this year. Emerging markets are not only technology-heavy and vulnerable to rising US bond yields but also further challenged now by China’s stimulus having peaked. Chart 2Equity Market Trembles
Equity Market Trembles
Equity Market Trembles
Chart 3Global Economy And Sentiment Recovering
Global Economy And Sentiment Recovering
Global Economy And Sentiment Recovering
Chart 4Global Cyclicals Versus Defensives Wavering
Global Cyclicals Versus Defensives Wavering
Global Cyclicals Versus Defensives Wavering
The one thing we can rely on is that the COVID-19 vaccine rollout will continue to enable a global growth recovery (Chart 3). The US dollar is signaling as much. The greenback bounced in the first quarter on US relative growth outperformance but it has since fallen back. A falling dollar is positive for cyclical stocks relative to defensives, although cyclicals are flagging that the reflation trade is overdone in the near term (Chart 4). China’s growth now becomes the critical focal point. A policy mistake in China would upset the bullish cyclical view. China’s tightening of monetary and fiscal policy is a major global policy risk that we have highlighted this year and it is now materializing. However, we have also highlighted the constraints to tightening. At present China is standing right on the threshold of overtightening according to our benchmarks. If China tightens further, we will take a fundamentally more defensive view. Also in this report we will review the results of China’s population census and the implications of India’s recent state elections in the face of the latest big wave of COVID-19 infections. We are not making any changes to our bullish view on India yet but we are putting it on watch. China: The Overtightening Risk China’s troubles stem from the ongoing change of its economic model from reliance on foreign trade to reliance on domestic demand. This was a strategic decision that the Communist Party made prior to the rise of President Xi Jinping. Xi also has come to embody it and reinforce it through his strategic vision and confrontation with the United States. Beijing’s goal was to manage a smooth and stable transition. The financial turmoil of 2015 and the trade war of 2018-19 jeopardized that goal but policymakers ultimately prevailed. Then COVID-19 broke out and caused the first real economic contraction since the 1970s. While China contained the virus and bounced back with another massive round of stimulus (13.8% of GDP from the onset of the trade war to the 2021 peak), it now faces an even more difficult transition. Chart 5China's Rising Propensity To Save
China's Rising Propensity To Save
China's Rising Propensity To Save
The need to improve quality of life is more urgent given that potential GDP has slowed. The need to contain systemic financial risk is more urgent given the big new increase in debt. And the need to diversify the economy is more urgent given that the US is now creating a coalition of democracies to confront China over a range of policies. The spike in the “marginal propensity to save” among Chinese people and corporations – as measured by the ratio of long-term cash deposits to short-term deposits – is an indication that the country is beset by troubles and animal spirits are depressed (Chart 5). China’s fiscal-and-credit impulse is turning down after the large expansion in 2018-21. Policymakers have signaled since last year that they would withdraw emergency stimulus and now the impact is apparent in the hard data. China’s money, credit, and combined credit-and-fiscal impulses all correlate with economic growth after a six-to-nine-month lag. This is true regardless of which indicators one uses for China’s money and credit cycles and economic activity (Charts 6A and 6B). China’s economic momentum is peaking and will become a headwind for the global economy later this year and in 2022, even though the world is otherwise enjoying the tailwinds of vaccination and economic reopening. Chart 6AChina’s Fiscal-And-Credit Impulse Falls Sharply …
China's Fiscal-And-Credit Impulse Falls Sharply...
China's Fiscal-And-Credit Impulse Falls Sharply...
Chart 6B… As Do Money-And-Credit Impulses
... As Do Money-And-Credit Impulses
... As Do Money-And-Credit Impulses
The downshift in the fiscal-and-credit impulse portends a slowdown in demand for commodities, materials, and other goods that China imports, especially for domestic consumption. (Chinese imports of parts and inputs that go into its manufacturing exports to the rest of the world look healthier as the rest of the world recovers.) This shift will make it hard for high-flying metals prices and other China plays, such as Swedish stocks, to continue rising without a correction (Chart 7). Speculative positioning is heavily in favor of commodities at the moment. The divergence between China and the metals markets that it dominates looks untenable in the short run (Chart 8). Chart 7China Reflation Trades Near Peaks
China Reflation Trades Near Peaks
China Reflation Trades Near Peaks
Chart 8Money Cycle And Commodity Prices Clash
Money Cycle And Commodity Prices Clash
Money Cycle And Commodity Prices Clash
The global shift to green or renewable energy systems (i.e. de-carbonization) is bullish for metals, especially copper, but will not be able to make up for the fall in Chinese demand in the short run, as our Emerging Markets Strategy has shown. China’s domestic uses of copper for construction and industry make up about 56.5% of global copper demand while the green energy race – namely the production of solar panels, windmills, electric cars – makes up only about 3.5% of global demand. This number somewhat understates the green program since re-gearing and retrofitting existing systems and structures is also projected, such as with electricity grids. But the point is that a drop in China’s copper consumption will work against the big increase in American and European consumption – especially given that the US infrastructure program will not kick in until 2022 at the earliest. Hence global copper demand will slow over the next 12 months in response to China even though the rest of the world’s demand is rising. Chinese policymakers have not yet signaled that they are worried about overtightening policy or that they will ease policy anew. The Politburo meeting at the end of April did not contain a major policy change from the Central Economic Work Conference in December or the Government Work Report in March (Table 1). But if there was a significant difference, it lay in reducing last year’s sense of emergency further while projecting some kind of scheme to hold local government officials accountable for hidden debt. The implication is continued tight policy – and hence the risk of overtightening remains substantial. Table 1China’s Recent Macroeconomic Policy Statements: Removing Stimulus
China Verges On Overtightening
China Verges On Overtightening
Chart 9Benchmarks For China's Policy Tightening
Benchmarks For China's Policy Tightening
Benchmarks For China's Policy Tightening
True, the tea leaves of the April meeting can be read in various ways. The April statement left out phrases about “maintaining necessary policy support” from the overarching macroeconomic policy guidance, which would imply less support for the economy. But it also left out the goal of keeping money supply (M2) and credit growth (total social financing) in line with nominal GDP growth, which could be seen as enabling a new uptick in credit growth. However, the People’s Bank of China did maintain this credit goal in its first quarter monetary policy report, so one cannot be sure. Notice that according to this rubric, China is right on the threshold of “overtightening” policy that we have utilized to measure the risk (Chart 9). Based on Chinese policymaking over the past two decades, we would expect any major inflection point to be announced at the July Politburo meeting, not the April one. We do not consider April a major change from the preceding meetings – nor does our China Investment Strategy. Therefore excessive policy tightening remains a genuine risk for the Chinese and global economy over the next 12 months. Our checklist for excessive tightening underscores this point (Table 2). Table 2Checklist For Chinese Policy Tightening
China Verges On Overtightening
China Verges On Overtightening
China’s fiscal-and-credit downshift is occurring in advance of the twentieth national party congress, which will take place throughout 2022 and culminate with the rotation of the top leadership (the Politburo Standing Committee) in the autumn. The economy is sufficiently stimulated for the Communist Party’s hundredth birthday on July 1 of this year, so policymakers are focused on preventing excesses. Financial risk prevention, anti-monopoly regulation, and tamping down on the property bubble are the orders of the day. The increase in corporate and government bond defaults and bankruptcies underscore the leadership’s willingness to push forward with economic restructuring and reform, which is well-attested in recent years (Chart 10). Chart 10Creative Destruction In China
China Verges On Overtightening
China Verges On Overtightening
Investors cannot assume that the party congress in 2022 is a reason for the leadership to ease policy. The contrary occurred in the lead-up to the 2017 party congress. However, investors also cannot assume that China will overtighten and sink its own economy ahead of such an important event. Stability will be the goal – as was the case in 2017 and previous party congresses – and this means that policy easing will occur at some point if the current round of tightening becomes too painful financially and economically. China-linked assets are vulnerable in the short run until policymakers reach their inflection point. Incidentally, the approach of the twentieth national party congress will be a magnet for political intrigue and shocking events. The top leader normally sacks a prominent rival ahead of a party congress as a show of force in the process of promoting his faction. The government also tightens media controls and cracks down on dissidents, who may speak up or protest around the event. But in 2022 the stakes are higher. President Xi was originally expected to step down in 2022 but now he will not, which will arouse at least some opposition. Moreover, under Xi, China has undertaken three historic policy revolutions: it is adopting a strongman leadership model, to the detriment of the collective leadership model under the two previous presidents; it is emphasizing economic self-sufficiency, at the expense of liberalization and openness; and it is emphasizing great power status, at the expense of cooperation with the United States and its allies. Bottom Line: Global equities, commodities, and “China plays” stand at risk of a substantial correction as a result of China’s policy tightening. Our base case is that China will avoid overtightening but the latest money and credit numbers run up against our threshold for changing that view. Another sharp drop in these indicators will necessitate a change. China’s Disappearing Workforce Ultimately one of the constraints on overtightening policy is the decline in China’s potential GDP growth as a result of its shrinking working-age population. China’s seventh population census came out this week and underscored the deep structural changes affecting the country and its economy. Population growth over the past ten years slowed to 5.4%, the lowest rate since the first census in 1953. The fertility rate fell to 1.3 in 2020, lower than the 2.1 replacement rate and the 1.8 target set when Chinese authorities relaxed the one-child policy in 2016. The fertility rate is also lower than the World Bank’s estimates (1.7 in 2019) and even Japan’s rate. The birthrate (births per 1,000 people) also fell, with the number of newborns in 2020 at the lowest point since 1961, the year of the Great Famine. The birth rate has converged to that of high-income countries, implying that economic development is having the same effect of discouraging childbearing in China, although China is less developed than these countries. Chart 11China’s Working Population Falling Faster Than Japan’s In 1990s
China Verges On Overtightening
China Verges On Overtightening
The youngest cohort rose from 16.6% to 17.95% of the population, the oldest cohort rose 8.9% in 2010 to 13.5% today, while the working-age cohort fell from 75.3% to 68.6%. The working-age population peaked in 2010 and fell by 6.79 percentage points over the past ten years. By contrast, Japan’s working-age population peaked in 1992 and fell 2.18 percentage points in the subsequent decade (Chart 11). In other words China is experiencing the demographic transition that hit Japan in the early 1990s – but China’s working-age population might fall even faster. The country is experiencing this tectonic socioeconomic shift at a lower level of per capita wealth than Japan had attained. The demographic challenge will put pressure on China’s socioeconomic and political system. The China miracle, like other Asian miracles, was premised on the use of export-manufacturing to generate large piles of savings that could be repurposed for national development. The decline in China’s working-age population coincides with economic development and a likely decline in the saving rate over the long run. This is shown in Chart 12, which shows two different pictures of China’s working population alongside the gross national saving rate. As China’s dependency ratio rises the saving rate will fall and fewer funds will be available for repurposing. The cost of capital will rise and economic restructuring will accelerate. In the case of Japan, the demographic shift coincided with the 1990 financial crisis and then a nationwide shift in economic behavior. The saving rate fell as the economy evolved but the savings that were generated still exceeded investment due to the shortfall in private demand and the pressure of large debt burdens. Companies focused on paying down debt rather than expanding investment and production (Chart 13). All of this occurred when the external environment was benign, whereas China faces a similar demographic challenge in the context of rising economic pressure due to geopolitical tensions. Chart 12Chinese Workers Getting Scarcer
Chinese Workers Getting Scarcer
Chinese Workers Getting Scarcer
Chart 13High Savings Enable Debt Splurge Until Debt Overwhelms
High Savings Enable Debt Splurge Until Debt Overwhelms
High Savings Enable Debt Splurge Until Debt Overwhelms
China has so far avoided a debilitating financial crisis and collapse in real estate prices that would saddle the country with a traumatizing liquidity trap. The Chinese authorities are painfully aware of the danger of the property bubble and are therefore eager to prevent financial excesses and curb bubble-like activity. This is what makes the risk of overtightening significant. But a mistake in either direction can lead to a slide into deflation. The Xi administration has stimulated the economy whenever activity slowed too much or financial instability threatened to get out of hand, as noted above, but this is a difficult balancing act, which is why we monitor the risk of excessive tightening so closely. A few other notable takeaways from China’s population census include: The two-child policy is not succeeding so far. COVID-19 might have had a negative effect on fertility but it could not have affected births very much due to the timing. So the trends cannot be distorted too much by the pandemic. Rapid urbanization continues, with the rate hitting 64% of the population, up 14 percentage points from 2010. Policy discussions are emphasizing lifting the retirement age; providing financial incentives for having babies; a range of price controls to make it more affordable to have babies, most notably by suppressing the property bubble; and measures to ensure that property prices do not fall too rapidly in smaller cities as migration from the country continues. China’s ethnic minority population, which consists of 9% of the total population, grew much faster (10% rate) over the past decade than the Han majority, which makes up 91% of the population (growing at a 5% rate). Minorities are exempt from the one-child (and two-child) policy. Yet ethnic tensions have arisen, particularly in autonomous regions like Xinjiang, prompting greater international scrutiny of China’s policies toward minorities. China’s demographic challenge is widely known but the latest census reinforces the magnitude of the challenge. China’s potential growth is falling while the rising dependency ratio underscores social changes that will make greater demands of government. Greater fiscal and social spending needs will require difficult economic tradeoffs and unpopular political decisions. Economic change and the movement of people will also deepen regional and wealth disparities. All of these points underscore one of our consistent Geopolitical Strategy mega-themes: China’s domestic political risks are underrated. Bottom Line: China’s 2020 census reinforces the demographic decline that lies at the root of China’s rising socioeconomic and political challenges. While China has a strong central government with power consolidated under a single ruling party, and a track record of managing its various challenges successfully in recent decades, nevertheless the magnitude of the changes happening are overwhelming and will bring negative economic and political surprises. India: State Elections Not A Turning Point Against Modi At the height of the second COVID-19 wave in India, elections were held in five Indian states. Results for the state of West Bengal were most important. West Bengal is a large state, accounting for nearly a-tenth of legislators at India’s national assembly, and the ruling Bharatiya Janata Party (BJP) of Prime Minister Narendra Modi had declared that it would win nearly 70% of the 294 seats there. In the event West Bengal delivered a landslide victory for the All India Trinamool Congress (AITMC), a regional party. Despite the fact that the AITMC was facing a two term anti-incumbency, the AITMC seat count hit an all-time high. Few had seen this coming as evinced by the fact that AITMC’s performance exceeded forecasts made by most pollsters. What should investors make of the BJP’s loss in this key state? Was it a backlash against Modi’s handling of the pandemic? Does it portend a change of government and national policy in the general elections in 2024? Not really. Here we highlight three key takeaways: Takeaway #1: The BJP’s performance was noteworthy Chart 14India: BJP Gets Foot In Door In West Bengal
China Verges On Overtightening
China Verges On Overtightening
Whilst the BJP fell short of its goals in West Bengal, the state is not a BJP stronghold. The BJP is known to have natural traction in Hindi-speaking regions of India and West Bengal is a non-Hindi speaking state where the BJP was traditionally seen as an outsider. Also, this state is known to be unusually unwilling to accept change. For instance, before AITMC, the Left was in power for a record spell of 34 years in this state. In such a setting, the BJP’s performance in 2021 in West Bengal is noteworthy: the party increased its seat count to 77 seats, compared to only 3 seats in 2016 (Chart 14). This performance now catapults the BJP into becoming the key opposition party in West Bengal. It also indicates that the BJP may take time but has what it takes to build traction in states that are not traditional strongholds. Given that it achieved this feat in a state where it has little historic strength, its performance is noteworthy as a sign that the BJP remains a force to be reckoned with. Takeaway #2: The BJP’s popularity slipped but it is still favored to retain power in 2024 Whilst discontent against the BJP is rising on account of its poor handling of COVID-19 and the accompanying economic distress, there remains no viable alternative to the BJP at the national level. The recent state elections, not only in West Bengal, confirm that the opposition Indian National Congress (INC) is yet to get its act in order. The Congress party collapsed from 44 seats in Bengal to 0 seats. More importantly, the Congress is yet to resolve two critical issues, i.e. the need to appoint or elect an internal leader with mass appeal, and the need to develop an identifiable policy agenda. The weakness of the Congress means that while the BJP’s seat count could diminish as against its 2019 peak performance, nevertheless our base-case scenario for 2024 remains that of a BJP-led government maintaining power in India. Policy continuity and the chance of some structural reform are still the base case. Takeaway #3: The rise and rise of India’s regional parties The rise of the BJP over the last decade has coincided with losses in seats by both the Congress party and India’s regional parties. However, the most recent round of state elections signals that the BJP cannot compress regional parties’ seat share drastically. For instance, in West Bengal, it managed to win 77 seats by itself but this was not at the expense of the AITMC, which is the dominant player in this state. In another large state where elections were held earlier this month, i.e. Tamil Nadu, control continues to fluctuate between two well-entrenched regional parties. Chart 15India: BJP Peaked In 2019 But Still Favored 2024
China Verges On Overtightening
China Verges On Overtightening
The 2019 general elections saw the share of regional parties (defined as all parties excluding the BJP and Congress) fall to 35% from the near 40% levels seen at the general elections of 2014 (Chart 15). The 2024 elections could in fact see regional parties’ seat share move up a notch as the BJP’s peak seat count could diminish from the highs of 2019. The coming rise of India’s regional parties is a trend rooted in a simple dynamic. With the BJP as a two-term incumbent in the 2024 elections, voters could choose to gratify regional parties at the margin, in the absence of any alternative to the BJP at the national level. The BJP remains in a position to be the single largest party in India in 2024 with a seat count in excess of the half-way mark. But could a situation arise where the ruling party pulls in a regional party to stay ahead of the half-way mark with a large buffer? Absolutely. But of course 2024 is a long way away. Managing COVID-19 and its economic fallout will make it harder than otherwise for the BJP to beat its 2019 performance. The next bout of key state elections in India are due in February 2022 and India’s largest state, Uttar Pradesh, will see elections. With the BJP currently in power in this Hindi-speaking state, the February 2022 elections will shed more light on BJP’s ability to mitigate the anti-incumbency effect of the pandemic and economic shock. Bottom-Line: BJP’s popularity in India has been shaken but not dramatically so. The BJP remains firmly in a position to be the single largest party in India with a seat count that should cross the half-way mark in 2024. So government stability is not a concern in this emerging market for now. In light of China’s domestic political risks, and India’s political continuity, we will maintain our India trades for the time being (Charts 16A and 16B). However, we are undertaking a review of India as a whole and will update clients with our conclusions in a forthcoming special report. Chart 16AStay Long Indian Bonds Versus EM
Stay Long Indian Bonds Versus EM
Stay Long Indian Bonds Versus EM
Chart 16BStick To Long India / Short China
Stick To Long India / Short China
Stick To Long India / Short China
Investment Takeaways Maintain near-term safe-haven trades. Close long natural gas futures for a 19.8% gain. Maintain cyclical (12-month) bullish positioning with a preference for value over growth stocks. Maintain long positions in commodities, including rare earth metals, and emerging markets. But be prepared to cut these trades if China overtightens policy according to our benchmarks. For now, continue to overweight Indian local currency bonds relative to emerging market peers and Indian stocks relative to Chinese stocks. But we are reviewing our bullish stance on India. Chart 17Cyber Security Stocks Perk Up Amid Tech Rout
Cyber Security Stocks Perk Up Amid Tech Rout
Cyber Security Stocks Perk Up Amid Tech Rout
Stay long cyber security stocks – though continue to prefer aerospace and defense over cyber security as a geopolitical “back to work” trade. Cyber security stocks perked up relative to the tech sector during the general tech selloff over the past week. The large-scale Colonial Pipeline ransomware cyber attack in the US temporarily shuttered a major network that supplies about 45% of the East Coast’s fuel (Chart 17). Nevertheless the attack on critical infrastructure highlights that cyber security is a secular theme and investors should maintain exposure. Cyber stocks have outperformed tech in general since the vaccine discovery (Chart 18). Chart 18Cyber Security Is A Secular Theme
Cyber Security Is A Secular Theme
Cyber Security Is A Secular Theme
Matt Gertken Vice President Geopolitical Strategy mattg@bcaresearch.com Yushu Ma Research Associate yushu.ma@bcaresearch.com Ritika Mankar, CFA Editor/Strategist Ritika.Mankar@bcaresearch.com
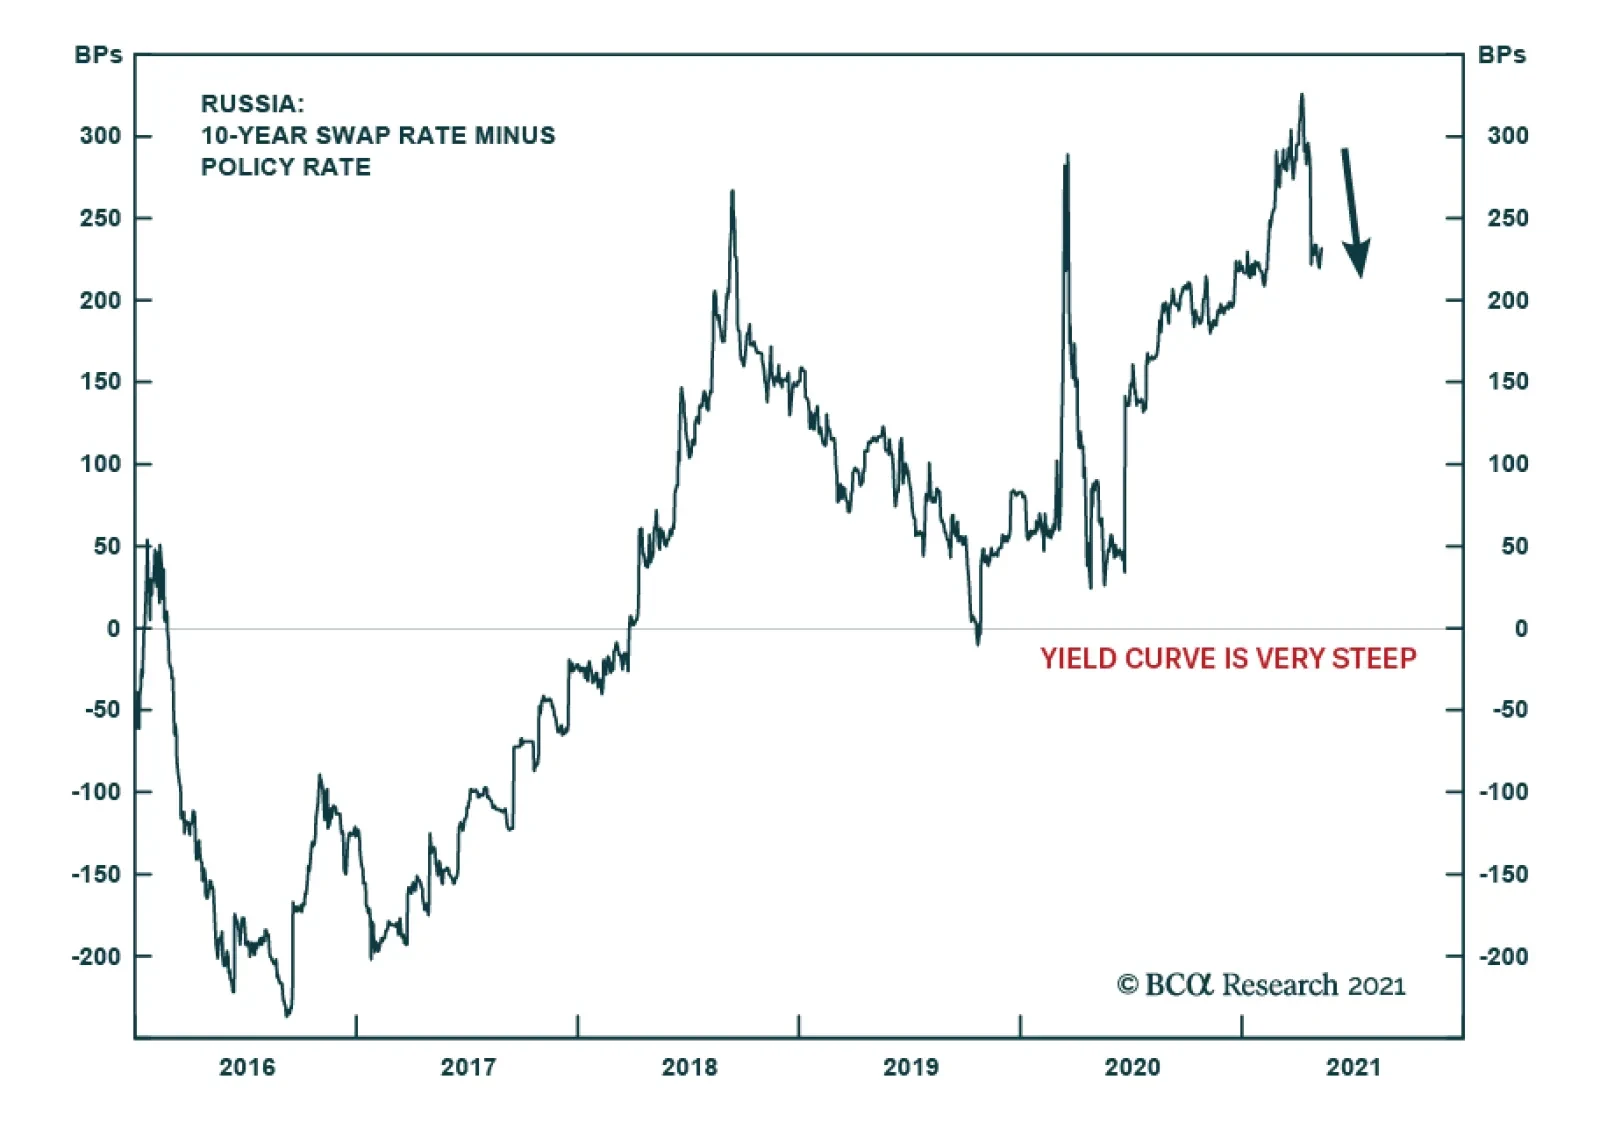
Rising consumer price inflation and inflation expectations have led the Central Bank of Russia (CBR) to hike interest rates from 4.25% to 5% over the past two months. This is a level of hawkishness that stands out globally, as many elements contributing to…
Highlights Over the 2021-22 period, renewable capacity will account for 90% of global electricity-generation additions, per the IEA's latest forecast. This will follow the 45% surge (y/y) in renewable generation capacity added last year, which occurred despite the COVID-19 pandemic (Chart of the Week). Continued investment in renewables and EVs – along with a global economic rebound – are pushing forecasts at banks and trading companies to a $13k - $20k/MT range for copper, vs. ~ $10.6k/Mt (~ $4.80/lb) at present. Should these stronger metals forecasts prove out, investments that extend low-carbon use of fossil fuels via carbon-capture and circular-use technologies will become more attractive. Investment in these technologies has been limited because there is no explicit global reference price to assess investments against. A carbon market or tax would provide such a bogey and accelerate investment. It could be monitored via a Carbon Market Club, which would limit trade to states posting and collecting the tax.1 Feature At almost 280GW, renewable energy capacity additions last year increased 45% y/y, the most since 1999, according to the IEA's most recent update on renewable energy.2 For this year and next, renewables are expected to account for 90% of capacity additions, led by solar PV investment increasing ~ 50% to 162GW. Wind capacity grew 90% last year, increasing to 114GW, and is expected to increase ~ 50% to end-2022. As renewables generation – and EV investment – continues to grow, demand for bulks (steel and iron ore) and base metals, led by copper, will pull prices higher. This is occurring against a backdrop of flat supply growth and physical deficits over the four years ended 2020 (Chart 2). According to the IEA, a 40% increase in steel and copper prices over the September 2020 to March 2021 period played a role in higher solar PV module prices. Chart of the WeekRenewables Capacity Surges
Surging Metals Prices And The Case For Carbon-Capture
Surging Metals Prices And The Case For Carbon-Capture
The supply side of the copper market will remain in deficit this year and next, in our assessment, and may continue on that trajectory if, as Wood Mackenzie expects, demand grows at a 2% p.a. rate over the next 20 years and miners remain reluctant to commit to the capex required to keep up with demand.3 Chart 2Physical Deficits Will Draw Copper Stocks...
Physical Deficits Will Draw Copper Stocks...
Physical Deficits Will Draw Copper Stocks...
ESG risk for copper – and other metals required to build the generation and infrastructure required in the renewables buildout – will increase as prices rise, which also will add to cost.4 Cost increases coupled with increasing ESG risks in this buildout will increase the attractiveness of carbon-capture and circular-economy technology investment, in our view. This would extend the use of low-carbon fossil fuels if the technology can move the world closer to a net-zero carbon future. However, unless and until policy catalyzes this investment, – e.g., via a global carbon trading price or tax – investment in these technologies likely will continue to languish. Carbon-Capture Tech's Unfulfilled Promise The history of Carbon Capture, Utilization and Storage (CCUS) has been one of high hopes and unmet expectations. It is generally recognized as a route to mitigate climate change; however, its deployment has been slower than expected. Low-carbon technology requires more critical metals than its fossil-fuel counterpart (Chart 3). Apart from the issue of cost, the ESG risks of mining metals for the renewable energy transition will increase as more metals are demanded, which we discussed in previous research.5 According to Wood Mackenzie, mining companies will need to invest nearly $1.7 trillion in the next 15 years to help supply enough metals to transition to a low carbon world.6 Chart 3Low-Carbon Tech Is Metals Intensive
Surging Metals Prices And The Case For Carbon-Capture
Surging Metals Prices And The Case For Carbon-Capture
Given these looming physical requirements for metals, fossil fuels most likely will need to be used for longer than markets currently anticipate, as a bridge to the low-carbon future, or as part of that future, depending on how successfully carbon is removed from the hydrocarbons used to power modern society. If so, using fossil fuels while mitigating their environmental impact will require highly focused technology to lower CO2 and other green-house gas (GHG) emissions during the transition to a low-carbon future. Enter CCUS technology: This technology traps CO2 from sources that use fossil fuels or biomass to make the energy required to run modern societies. In the current iterations of this technology, CO2 can either be compressed and transported, or stored in geological or oceanic reservoirs. This can then be used for Enhanced Oil Recovery (EOR) to extract harder-to-reach oil by injecting CO2 into the reservoirs holding the hydrocarbons.7 The Scope For CCUS Investment CCUS investment spending is increasing, as are the number of planned facilities using or demonstrating this technology. In the 2020 edition of its Energy Technology Perspectives, the IEA noted 30 new integrated CCUS facilities have been announced since 2017, mostly in advanced economies such as US and Europe, but also in some EM nations. As of 2020, projects at advanced stages of planning represented a total of $27 billion, more than double the investment planned in 2017 (Chart 4). Among its many goals, the Paris Agreement seeks a balance between emissions by man-made sources and removal by greenhouse gas (GHGs) sinks (absorption of the gases) in the second half of the 21st century. Practically, many countries – especially EM economies – will still need to use fossil fuels to develop during this period (Chart 5).8 Chart 4Carbon-Capture Projects To Date
Surging Metals Prices And The Case For Carbon-Capture
Surging Metals Prices And The Case For Carbon-Capture
Chart 5EM Development Will Require Fossil-Fuel Energy
Surging Metals Prices And The Case For Carbon-Capture
Surging Metals Prices And The Case For Carbon-Capture
CCUS In The Energy Sector As a fuel that emits fewer GHGs than coal – i.e., half the CO2 of coal – natural gas can be used effectively as a bridge to green-power generation (Chart 6). Chart 6Natural Gas Will Remain Attractive As A Bridge Fuel
Surging Metals Prices And The Case For Carbon-Capture
Surging Metals Prices And The Case For Carbon-Capture
The CO2 in natgas needs to be removed before dry gas is sold as pipeline-quality gas or LNG. This CO2 is normally vented to the atmosphere; however, by using CCUS technology, it can be reinjected into geological formations and used for EOR. For this reason, LNG companies in the US, the world’s largest LNG exporter, have been looking into investing in CCUS technology in a bid to become greener.9 CCUS can also be used to produce low-cost hydrogen – so-called blue hydrogen – using natural gas and coal, as opposed to the more expensive electrolysis process, which uses renewables-based electricity to produce "green" hydrogen. The lower blue-hydrogen costs will make clean hydrogen more accessible to emerging nations, opening new avenues for the world to use the energy carrier in its decarbonization effort. The Value Of Ccus In Other Industries CCUS technology can be retrofitted to existing power and industrial plants, which, according to the IEA, could otherwise still emit 8 billion tons of CO2 in 2050, around one-quarter of annual energy-sector emissions in 2020. Of the fossil fuel generators, coal-fired power generation presents the biggest CO2 challenge, with most of the emissions coming from China and other EM Asia nations, where the average plant age is less than 20 years. Since the average age of a coal fired power plant is 40 years, according to the US National Association of Regulatory Commissioners, this implies that these plants have a long remaining life and could still be operating until 2050. CCUS is the only alternative to retiring or repurposing existing power and industrial plants. The IEA believes that CCUS is imperative to reach net-zero carbon emissions. In its Sustainable Development Scenario - in which global CO2 emissions from the energy sector decline to net-zero by 2070 – CCUS accounts for 15% of the cumulative reduction in emissions. If the world needs to reach net-zero by 2050 instead, it will need almost 50% more CCUS deployment.10 Properly implemented and scaled, CCUS can allow industries to continue using oil, gas and coal and to attain net-zero carbon emission targets, boosting demand for fossil fuels in the medium term. This is especially important to EM development. Why Aren’t We Further Along In CCUS? What Can Be Done? The main reason CCUS isn’t used more widely is because of its cost. Currently, the cost of capturing carbon varies, based on the amount of CO2 concentration, with Direct Air Capture being most expensive (Chart 7). Given the prohibitive costs, CCUS has not been commercially viable. However, the same argument could have been used against implementing renewable sources of energy. While at one point the Levelized Cost of Energy from renewable sources was high, as these sources have been scaled up – aided in no small part by government subsidies – costs have fallen, following something akin to a Moore’s Law cost-decay curve. A Levelized Cost of Energy for solar generation reported by Lazard Ltd., which allows for comparisons across technologies (e.g., fossil-fuel vs renewable), shows generation costs fell by 89% to $40/MWh from $359/MWh from 2009-2019 (Chart 8). This learning curve was able to take place because of government subsidies, which promoted the deployment of solar technology. Chart 7CCUS Can Be Expensive
Surging Metals Prices And The Case For Carbon-Capture
Surging Metals Prices And The Case For Carbon-Capture
Chart 8Subsides Could Support CCUS, Just As Was Done For Solar
Subsides Could Support CCUS, Just As Was Done For Solar
Subsides Could Support CCUS, Just As Was Done For Solar
The cost of CCUS technology is falling. For example, in 2019 the Global CCS Institute reported it cost $100/ton to capture carbon from the Canada-based Boundary Dam using a CCS unit built in 2014. The cost of carbon captured at the US-based Petra Nova plant – built three years later – using improved technology was $65/ton. Both are coal-powered electricity plants. The report also noted coal-fired power plants planning to commence operations in 2024-28 using the same CCS technology as those at Boundary Dam and Petra Nova expect carbon costs to be ~ $43/ton, due to steeper learning curves, research, lower capital costs due to economies of scale, and digitalization. One commonality amongst these sources of cost reductions is that companies need to invest more into CCUS and familiarize themselves with this technology. As was the case with renewables, government subsidies would reduce the prohibitive costs of operating CCUS technology, and draw more participation to refining this technology. Early, first-of-its-kind CCUS will be expensive, however subsidies in the form of capital support or tax credits will increase CCUS implementation and research. Boundary Dam and Petra Nova are examples of facilities that benefitted from government subsidies. The facilities received $170 million and $200 million respectively from Canadian and US Government agencies at the time of the CCS units’ construction. The US has also implemented a 45Q tax credit system which pays facilities $50/ton of CO2 stored and $35/ton of CO2 if it is used in applications like Enhanced Oil Recovery. According to the Global CCS Institute, in late-2019, of the eight new CCUS projects that were added in the US, four cited the presence of 45Q as the key driver. Putting Carbon Markets And Taxes To Work The EU’s Emissions Trading System (ETS) market, which was implemented in 2005, is an example of innovative policy which incentivizes companies to curb emissions, using market forces. The price of carbon measured in these markets puts a tangible value on a negative externality, which before this went unrecorded. The downside of this ETS is its reliance on the EU's environmental policy implementation, which is subject to policy changes that complicate supply-demand analysis for longer-term planning – e.g., the recent increase in its emissions target to a minimum of 55% net reduction in GHG emissions by 2030. An alternative to policy-driven trading of emissions rights is a per-ton tax on emissions, which governments would impose and collect. This would raise costs of technologies using fossil fuels – including those used in the mining industry to increase supply of critical bulks and base metals needed for the renewables transition. At the same time, such a tax would give firms supplying and using technologies that raise CO2 levels an incentive to lower CO2 output using CCUS technologies. ETS markets and governments imposing CO2 taxes could form Carbon Market Clubs – a technology developed by William Nordhaus, the 2018 Nobel Laureate in Economics – that restrict trading to states that can demonstrate their participation and support of actual carbon-reduction detailed in the Paris Agreement via trading or tax schemes.11 As the green energy transition gains traction and governments implement more net-zero emissions policies, the price of carbon will rise. As the price of carbon rises, the price tag associated with companies’ carbon emissions will increase with it. With market participants expecting the price of carbon to continue to rise after hitting record values, the incentive for companies operating in the EU to use CCUS technology will rise, as would the incentive for firms facing a carbon tax.12 Bottom Line: Given the meteoric price rise of green metals, underfunded capex, and the ESG risks associated with mining metals for the low carbon future, we expect fossil fuels to play a larger role in the transition to a low-carbon society than markets are currently expecting. For countries to be able to use fossil fuels while ensuring they achieve their climate goals, the use of CCUS technology is important. To increase CCUS uptake, governments will need to subsidize this technology until demand for it gains traction, just like in the case of renewables. Encouraging ETS and carbon-tax schemes also will be required to catalyze action. Robert P. Ryan Chief Commodity & Energy Strategist rryan@bcaresearch.com Ashwin Shyam Research Associate Commodity & Energy Strategy ashwin.shyam@bcaresearch.com Commodities Round-Up Energy: Bullish Brent prices were knocking against the $70/bbl door going to press, following the IEA's assessment of a robust demand recovery in 2H21 (Chart 9). The IEA took its 1H21 demand growth down 270k b/d, owing to COVID-19-induced demand destruction in India, OECD Americas and Europe, but left its 2H21 estimate intact, making overall demand growth for this year 5.4mm b/d. The EIA also expects 5.4mm b/d demand growth for this year, and growth of 3.7mm b/d next year. OPEC left its full-year 2021 demand growth estimate at 6mm b/d. OPEC 2.0 meets again on June 1 and will look to return more of its sidelined production to the market, in our estimation. We will be updating our supply-demand balances and price forecasts in next week's report. Base Metals: Bullish Spot copper prices traded on either side of $4.80/lb on the CME/COMEX market this week as we went to press. Threats of a tax increase in Chile, where a bill calling for such a measure is making its way through Congress; a potential strike by mine workers; and a shortage of sulfuric acid used in the extraction of ore brought about, according to Bloomberg, by reduced global sulfur supplies due to lower refinery runs during the pandemic all are keeping copper well bid. Our target for Dec21 COMEX copper remains $5/lb (~ $11k/ton on the LME). We remain long calendar 2022 COMEX copper vs short 2023 COMEX copper expecting physical supply deficits to continue to force storage draws, which will backwardate the metal's forward curve. Precious Metals: Bullish US CPI data on Wednesday showed that headline inflation rose by 4.2% for the month of April compared to the previous year. While this increase is the highest since 2008, this jump could also be fueled by a low base effect – Inflation levels were falling this time last year as the pandemic picked up. While rising prices increases demand for gold as an inflation hedge, if the Federal Reserve increases interest rates on the back of this data, the US dollar will rise, negatively affecting gold prices (Chart 10). However, we do not expect the Fed to abruptly change its guidance on this report, and therefore expect the central bank will treat this blip as transitory. As of yesterday’s close, COMEX gold was trading at $1,835.9/oz. Ags/Softs: Neutral Going to press, the Chicago soybean market was surging ahead of the scheduled World Agriculture Supply and Demand Estimates (WASDE) report due out later Wednesday. Front-month beans were trading ~ $16.70/bu, up 2% on the day. This month's WASDE will contain the USDA's first estimate for demand in ag markets for the 2021/22 crop year. Markets are expecting supplies to tighten as demand strengthens. Chart 9
Brent Prices Going Up
Brent Prices Going Up
Chart 10
Covid Uncertainty Could Push Up Gold Demand
Covid Uncertainty Could Push Up Gold Demand
Footnotes 1 Please see Carbon Market Clubs and the New Paris Regime published by the World Bank in July 2016. The intellectual and computational framework for such technology was developed by William Nordhaus, the 2018 Nobel Laureate in Economics. 2 Please see Renewable Energy Market Update, Outlook for 2021 and 2022.pdf, published by the IEA this week. 3 WoodMac notes, "without additional substantial investment, production will decline from 2024 onwards. Coupled with demand growth, this decline in output will lead to a theoretical shortfall of around 16 Mt by 2040." The consultancy estimates an additional $325 - $500+ billion will be needed to meet copper demand over this period. Please see Will a lack of supply growth come back to bite the copper industry? Published 23 March 2021 by woodmac.com. 4 Please see Renewables ESG Risks Grow With Demand, which we published 29 April 2021. It is available at ces.bcaresearch.com. 5 Refer to footnote 4. 6 Please see Low carbon world needs $1.7 trillion in mining investment, published by Reuters. 7 This method is used to increase oil production. It changes the properties of the hydrocarbons, restores formation pressure and enhances oil displacement in the reservoir. Using EOR, oil companies can recover 30% to 60% of the original oil level in the reservoir. Please see Enhanced Oil Recovery published by the US Department of Energy. 8 Please see the Reuter’s column CO2 emission limits and economic development. 9 Please see World Oil’s U.S. LNG players tout carbon capture in bid to boost green image. 10 Please see IEA’s Special Report on Carbon Capture Utilisation and Storage, published as a part of the Energy Technology Perspective 2020. 11 See footnote 1 above. 12 Please see Cost of polluting in EU soars as carbon price hits record €50 by the Financial Times. Investment Views and Themes Strategic Recommendations Tactical Trades Commodity Prices and Plays Reference Table Trades Closed in 2021 Summary of Closed Trades
Higher Inflation On The Way
Higher Inflation On The Way
Highlights The US is only one deflationary shock away from a European level of bond yields. On a multi-year horizon, a deflationary shock is a near-certainty. The shock will be deflationary, because even if it starts inflationary, it will quickly morph into deflationary. The reason is that the sharp backup in bond yields resulting from an inflationary shock would undermine the value of $300 trillion worth of global real estate, and thereby unleash a massive deflationary impulse. Hence, the US 30-year bond will ultimately deliver an absolute return approaching 100 percent, in absolute terms… …and relative to core European and Japanese bonds. Fractal trade shortlist: Stocks to consolidate versus bonds; Commodities look dangerously frothy; Buy USD/CAD. Feature Chart of The WeekThe Structural Level Of Bond Yields Depends On The Number Of Lasting Deflationary Shocks
The Structural Level Of Bond Yields Depends On The Number Of Lasting Deflationary Shocks
The Structural Level Of Bond Yields Depends On The Number Of Lasting Deflationary Shocks
Ten years ago, 30-year bond yields in the US, UK and Germany stood at near-identical levels, around 3 percent. Today though, those yields are widely dispersed: the US at 2.3 percent, the UK at 1.3 percent, and Germany at 0.3 percent. What happened? In 2012, the German bond yield decoupled from the UK and the US, because the deflationary shock from the euro debt crisis was focussed in the euro area. Then, in 2016, the UK bond yield decoupled from the US, because the deflationary shock from Brexit was focussed in the UK and EU27 (Chart Of The Week). The ‘Shock Theory’ Of Bond Yields Welcome to a new concept – the ‘shock theory’ of bond yields. According to this theory, the structural level of high-quality government bond yields is simply a function of the number of lasting deflationary shocks that the economy has suffered. Each successive deflationary shock takes the bond yield to a lower structural level until it can go no lower (Chart I-2). Chart I-2Each Successive Deflationary Shock Takes The Bond Yield To A Lower Structural Level, Until It Can Go No Lower
Each Successive Deflationary Shock Takes The Bond Yield To A Lower Structural Level, Until It Can Go No Lower
Each Successive Deflationary Shock Takes The Bond Yield To A Lower Structural Level, Until It Can Go No Lower
Since 2011, US, UK and German bond yields have decoupled because the US has suffered the legacies of one fewer deflationary shock than the UK, and two fewer deflationary shocks than Germany. But the important corollary is that the US is only one deflationary shock away from a European level of bond yields. When that deflationary shock arrives and the US 30-year bond yield reaches the recent low achieved in the UK, it will equate to a price gain of over 50 percent. And if the yield reaches the recent low achieved in Germany, it will equate to a price gain of well over 100 percent. Many people say that such gains are impossible. Yet ten years ago these same people were saying that UK and German long-duration bonds could never reach near-zero yields, and look what happened! Our high-conviction view is that the long-duration US bond will ultimately deliver a stellar absolute return, and a stellar relative return versus core European and Japanese bonds. The simple reason is that another deflationary shock is just a matter of time away. Long-Term Investors Must Always Plan For A Shock Most strategists and investors claim that shocks, such as the pandemic, are inherently unpredictable, and therefore that you cannot plan for them. We disagree. Yes, the timing and nature of individual shocks are inherently unpredictable. But as we explained in How To Predict Shocks, the statistical distribution of shocks is highly predictable. What constitutes a shock? There is no established definition, so our definition is any event that causes the long-duration bond price in a major economy to rally or slump by at least 25 percent.1 (Chart I-3) Using this definition through the last 50 years, we can say that the statistical distribution of the number of shocks in any ten-year period is Poisson (3.33) and the statistical distribution of the time between shocks is Exponential (3.33). Chart I-3A Shock Is A 25 Percent Move In The Long Duration Bond Price, And A Shock Tends To Come Every 3 Years
A Shock Is A 25 Percent Move In The Long Duration Bond Price, And A Shock Tends To Come Every 3 Years
A Shock Is A 25 Percent Move In The Long Duration Bond Price, And A Shock Tends To Come Every 3 Years
It follows that in any ten-year period, the likelihood of suffering a shock is a near-certain 96 percent (Chart I-4). And even in any five-year period, the likelihood of a shock is an extremely high 81 percent. Chart I-4On A Multi-Year Horizon, A Shock Is A Near-Certainty
The 'Shock Theory' Of Bond Yields
The 'Shock Theory' Of Bond Yields
For many people, this creates a cognitive dissonance. Even though a shock is a near-certainty, they cannot visualise its exact nature or timing, so they resist planning for it. Yet long-term investors must always plan for shocks. Not to do so is unforgiveable. An Inflationary Shock Will Quickly Morph Into A Deflationary Shock The crucial question is, will the next shock be deflationary, or inflationary? Our high-conviction view is that it will be net deflationary. Meaning that even if the shock starts as inflationary, it will quickly morph into deflationary. The simple reason is that the sharp backup in bond yields that would come from an inflationary shock would undermine the value of $300 trillion worth of global real estate, and thereby unleash a massive deflationary impulse. The 2010s housing boom was unprecedented in its penetration and regional breadth, simultaneously encompassing cities, suburbs, and rural areas across North America, Europe, Asia and Australasia. As prices doubled almost everywhere, the value of global real estate surged by $150 trillion (Chart I-5), of which $75 trillion was due to the valuation uplift from lower bond yields (Chart I-6). To put this into context, lower bond yields have boosted the value of global real estate by the equivalent of world GDP! Chart I-5In The 2010s Housing Boom, The Value Of Global Real Estate Surged By $150 Trillion…
In The 2010s Housing Boom, The Value Of Global Real Estate Has Surged By $150 Trillion...
In The 2010s Housing Boom, The Value Of Global Real Estate Has Surged By $150 Trillion...
Chart I-6…Of Which $75 Trillion Was Due To Lower Bond Yields
...Of Which $75 Trillion Is Due To Lower Bond Yields
...Of Which $75 Trillion Is Due To Lower Bond Yields
Many people believe that real assets, such as real estate and equities, perform well in an inflationary shock, but this is a misunderstanding. Granted, the income generated by real assets should keep pace with nominal GDP. But the valuation paid for that income will collapse if it starts off at an elevated level, such as now. The starting valuation needed to generate a given real return during an inflationary shock is much lower than during price stability. For example, for equities in the low-inflation 1990s and 2000s, a starting price to earnings multiple of 15 consistently generated a prospective 10-year real return of 10 percent. But in the inflation shock of the 1970s, the same starting multiple of 15 generated a real return of zero. To generate a real return of 10 percent, the starting multiple had to halve to 7 (Chart I-7). Chart I-7In The 1970s Inflationary Shock, Valuations Collapsed
In The 1970s Inflationary Shock, Valuations Collapsed
In The 1970s Inflationary Shock, Valuations Collapsed
How much can bond yields rise before undermining the value of global real estate? Over the past decade the global rental yield has not been able to deviate from the global long-duration bond yield by more than 100 bps.2 Given that the bond yield is already around 25 bps above the rental yield, we deduce that the long-duration bond yield can rise by no more than 75 bps before global real estate prices start getting hurt (Chart I-8). Chart I-8The Bond Yield Can Rise By No More Than 75 Bps Before Global Real Estate Prices Get Hurt
The Bond Yield Can Rise By No More Than 75 Bps Before Global Real Estate Prices Get Hurt
The Bond Yield Can Rise By No More Than 75 Bps Before Global Real Estate Prices Get Hurt
To repeat our key structural recommendation, the long-duration US bond will ultimately deliver a stellar absolute return, and a stellar relative return versus core European and Japanese bonds. Candidates For Countertrend Reversal This week we note that the rally in stocks versus bonds (MSCI All Country World versus 30-year T-bond) is likely to consolidate in the coming months – given the fragility in the 260-day fractal structure similar to previous turning points in 2008, 2010, 2013, and 2020 (Chart I-9). Chart I-9The Rally In Stocks Versus Bonds Is Likely To Consolidate In The Coming Months
The Rally In Stocks Versus Bonds Is Likely To Consolidate In The Coming Months
The Rally In Stocks Versus Bonds Is Likely To Consolidate In The Coming Months
We also repeat our warning to steer clear of commodities. The rally in all commodities is becoming dangerously frothy, displaying the extremes of fractal fragility seen in 2008. (Chart I-10and Chart I-11). Chart I-10The Rally In Commodities Is Becoming Dangerously Frothy...
The Rally In Commodities Is Becoming Dangerously Frothy...
The Rally In Commodities Is Becoming Dangerously Frothy...
Chart I-11...Displaying The Extremes Of Fractal Fragility Seen In 2008
...Displaying The Extremes Of Fractal Fragility Seen In 2008
...Displaying The Extremes Of Fractal Fragility Seen In 2008
A good trade right now is to short the Canadian dollar. Based on the loonie’s composite fractal structure, a lot of good news is already priced in, including the dangerously frothy commodity markets and the Bank of Canada’s (hawkish) taper of asset purchases. As such we expect the Canadian dollar to reverse in the coming months (Chart I-12). Chart I-12Short The Canadian Dollar
Short The Canadian Dollar
Short The Canadian Dollar
Go long USD/CAD, setting a profit-target and symmetrical stop-loss at 3.7 percent. Dhaval Joshi Chief Strategist Footnotes 1 As bond yields approach their lower limit, this definition of a shock will need to change as it will become impossible for long-duration bond prices to rally by 25 percent. 2 Here, the global long-duration bond yield is defined as the average of the 30-year yields in the US and China. Fractal Trading System Fractal Trades 6-Month Recommendations Structural Recommendations Closed Fractal Trades Closed Trades Asset Performance Equity Market Performance Indicators To Watch - Bond Yields Chart II-1Indicators To Watch - Bond Yields - Euro Area
Indicators To Watch - Bond Yields - Euro Area
Indicators To Watch - Bond Yields - Euro Area
Chart II-2Indicators To Watch - Bond Yields - Europe Ex Euro Area
Indicators To Watch - Bond Yields - Europe Ex Euro Area
Indicators To Watch - Bond Yields - Europe Ex Euro Area
Chart II-3Indicators To Watch - Bond Yields - Asia
Indicators To Watch - Bond Yields - Asia
Indicators To Watch - Bond Yields - Asia
Chart II-4Indicators To Watch - Bond Yields - Other Developed
Indicators To Watch - Bond Yields - Other Developed
Indicators To Watch - Bond Yields - Other Developed
Indicators To Watch - Interest Rate Expectations Chart II-5Indicators To Watch - Interest Rate Expectations
Indicators To Watch - Interest Rate Expectations
Indicators To Watch - Interest Rate Expectations
Chart II-6Indicators To Watch - Interest Rate Expectations
Indicators To Watch - Interest Rate Expectations
Indicators To Watch - Interest Rate Expectations
Chart II-7Indicators To Watch - Interest Rate Expectations
Indicators To Watch - Interest Rate Expectations
Indicators To Watch - Interest Rate Expectations
Chart II-8Indicators To Watch - Interest Rate Expectations
Indicators To Watch - Interest Rate Expectations
Indicators To Watch - Interest Rate Expectations
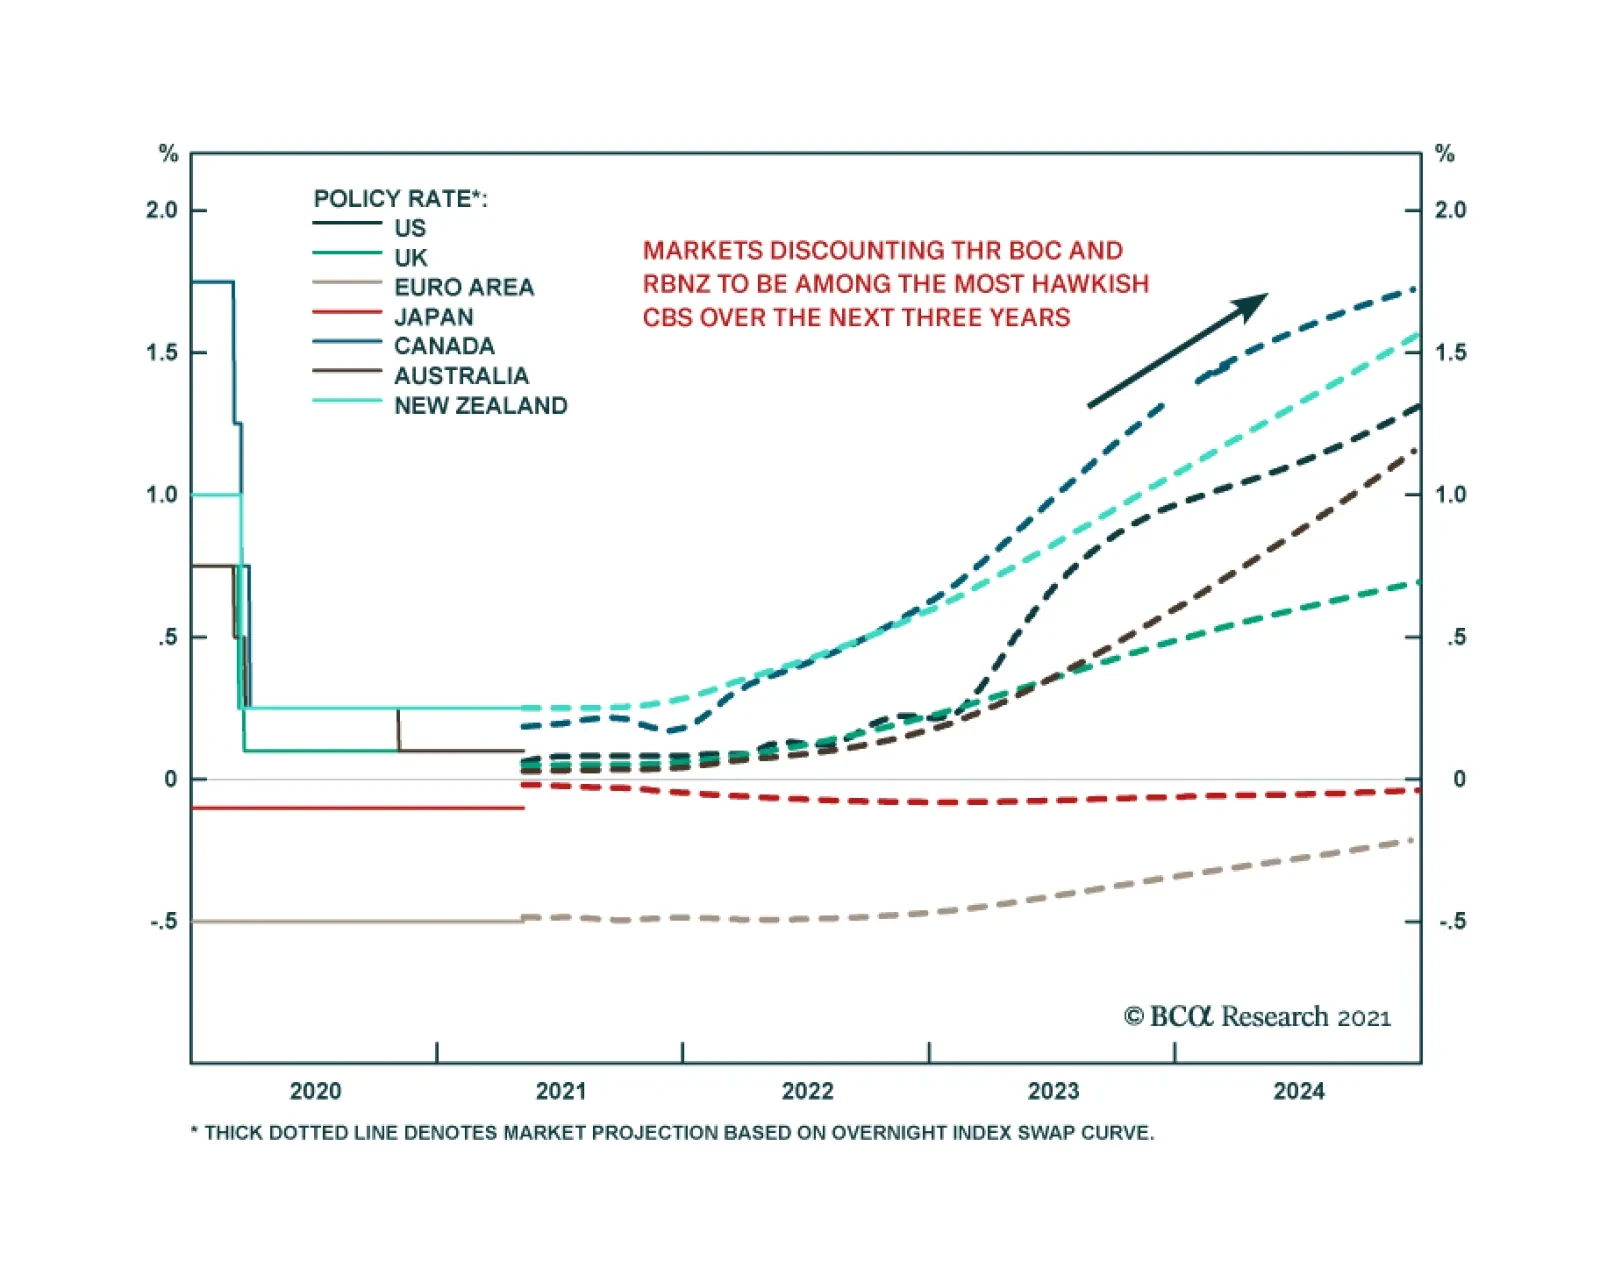
BCA Research’s Global Fixed Income Strategy service concludes that the Federal Reserve will not be the next central bank to taper the pace of bond buying. The team recently assessed the most important factors that could drive central banks to consider a…
Highlights Global Tapering: The Bank of England has joined the Bank of Canada as central banks tapering the pace of bond buying. Markets are now trying to sort out who is next and concluding that it will not be the Federal Reserve, with US employment still well below the pre-pandemic peak. US Treasury yields will continue trading sideways until there is greater clarity on the pace of US labor market improvement, especially after the big downside miss in the April jobs report. US Treasury Curve: We are adding a new recommended US butterfly trade to our Tactical Overlay portfolio, going long the 5-year bullet and short the 2/30 barbell using US Treasury futures. This trade should benefit with US Treasury curve steepening overshooting the pace of past cycles, while offering attractive carry if persistent Fed dovishness slows the cyclical transition to a bear-flattening curve regime. Feature Heading into 2021, one of our key investment themes for the year was that no major central bank would shift to a less dovish monetary policy stance before the Fed. Not even five months into the year, our theme has already been proven incorrect. Last week, the Bank of England (BoE) announced a slower pace of its asset purchases, following a similar tapering decision by the Bank of Canada (BoC) last month. Chart of the WeekUS Jobs Recovery Lagging, Despite Vaccine Success
Who Tapers Next?
Who Tapers Next?
We had assumed that no central bank could tolerate the currency strength that would inevitably occur by tapering ahead of the Fed. That was clearly not the case in Canada, and the Canadian dollar has already appreciated 4.6% versus the greenback since the BoC taper announcement April 21. The British pound also rallied solidly against both the US dollar and euro immediately after the BoE taper announcement last week. Markets are beginning to speculate on future taper candidates, like the Reserve Bank of New Zealand (RBNZ), with the New Zealand dollar being one of the strongest currencies in the G10 versus the US dollar since the end of March (+4.4%). Investors had been debating the possibility that the Fed could begin tapering sometime in the second half of 2020, largely based on what has to date been a successful US vaccination campaign. Yet while that led to optimism that the US economy can quickly reopen and return to normal, the fact remains that the recovery in US employment from the COVID shock has lagged other major economies (Chart of the Week). The big downside miss on the April US payrolls report highlights how the Fed can be patient before joining the tapering club. US Treasury yields are likely to continue trading sideways, and the US dollar will trade soft, until markets can sort out the true state of US labor demand versus supply. Which Central Bank Could Follow The BoC And BoE? Back in March, we published a report that discussed what we called the “pecking order of global liftoff”.1 We looked at how interest rate markets were pricing in an increasingly diverse path out of the coordinated global monetary easing enacted last year during the COVID recession (Chart 2). We looked at both the timing of “liftoff” (the first rate hike) and the pace of hikes afterward to the end of 2024. We then ranked the countries by the market-implied timing of liftoff. Chart 2Sorting Out The Relative Hawks & Doves Among Global CBs
Sorting Out The Relative Hawks & Doves Among Global CBs
Sorting Out The Relative Hawks & Doves Among Global CBs
At the time, overnight index swap (OIS) curves were discounting the earliest liftoff from the RBNZ (June 2022) and BoC (August 2022). The Fed was expected to hike in January 2023, followed by the BoE in June 2023 and Reserve Bank of Australia (RBA) in July 2023. The European Central Bank (ECB) and Bank of Japan (BoJ) were the laggards, with no rate hiked discounted until September 2023 and February 2025, respectively. In terms of the pace of rate hikes after liftoff through 2024, our list was broken into two groups. The more aggressive central banks were expected to be the BoC (+175bps), RBA (+156bps), RBNZ (+140bps) and the Fed (+139bps). Much smaller amounts of rate hikes were anticipated from the BoE (+63bps), ECB (+25bps) and BoJ (+9bps). In the two months since our March report, the market timing of liftoff, and the pace of subsequent hikes, has shifted for all those countries (Table 1). The BoC is now expected to move in September 2022, ahead of the RBNZ (October 2022). In 2023, the Fed is now priced for liftoff in March 2023, followed by the BoE and RBA (both in July 2023). The ECB liftoff date is little changed (now August 2023), while the market has dramatically pushed out the timing of any BoJ hike (now November 2025). The cumulative rate hikes through 2024 are moderately lower for all countries except Australia (a reduction in total tightening of 56bps). Table 1The Fed Is Sliding Down The “Pecking Order Of Liftoff” List
Who Tapers Next?
Who Tapers Next?
What is interesting about these changes is that the market has pulled forward the timing of liftoff for the BoE and RBA, while pushing it out for the BoC, RBNZ, BoJ and, most importantly, the Fed. The Fed is now drifting down the “pecking order” for liftoff, expected to lift rates only a couple of months before the BoE or RBA. This is a major change from previous monetary policy cycles, when the Fed would typically be a first mover when it comes to tightening policy. Chart 3The Momentum Of Global QE Has Already Been Slowing
The Momentum Of Global QE Has Already Been Slowing
The Momentum Of Global QE Has Already Been Slowing
While the BoC and BoE decisions to taper quantitative easing (QE) have garnered the headlines, the pace of global central bank balance sheet expansion had already peaked at the start of 2021 (Chart 3). The pace has slowed most dramatically in Canada and the US, but this was a result of certain emergency programs expiring – most notably the Fed’s corporate bond buying vehicles late last year and the BoC’s short-term repo facilities more recently. Greater financial market stability was the reason cited to end those programs, while still leaving government bond QE buying in place unchanged. The year-over-year pace of global QE was set to slow, simply from less favorable comparisons to 2020 after the surge in central bank balance sheet expansion last year. Yet now we are starting to see actual tapering of government bond purchases from some central banks. Is such “early tightening” warranted? Back in that same March report where we discussed the order of global liftoff, we gave our assessment of the most important factors that could drive central banks to consider a shift to a less dovish stance (like tapering). For the BoC, we cited booming house prices and robust business confidence as reasons the BoC could turn less dovish sooner (Chart 4). For the BoE, we noted a sharper-than-expected recovery in domestic investment and consumer spending, as the locked-down UK economy reopens, as reasons why the BoE could begin to tweak its policy settings. For both central banks, all those indicators were mentioned as factors leading to their decision to taper. For the Fed, we determined that rising inflation expectations and increasing labor market tightness would both be required for the Fed to turn less dovish. Only inflation expectations have reached that goal, with the US Employment/Population ratio still well below the pre-pandemic peak (Chart 5). For the RBA, we looked solely at realized inflation measures, as the RBA has explicitly noted that Australian wage growth must rise sustainably towards 3% - nearly double current levels - before realized CPI inflation could return to the 2-3% target range. For both the Fed and RBA, the necessary conditions for a change in current policy settings have not yet been met. Chart 4What The More Hawkish CBs Are Watching
What The More Hawkish CBs Are Watching
What The More Hawkish CBs Are Watching
Chart 5What The More Dovish CBs Are Watching
What The More Dovish CBs Are Watching
What The More Dovish CBs Are Watching
For the ECB, we noted that realized inflation (and the ECB’s inflation forecasts), along with the Italy-Germany government bond spread as a measure of financial conditions, were the most important indicators to watch before the ECB could consider any move to taper its QE programs (Chart 6). Italian spreads have widened a bit in recent months, while the latest set of ECB economic forecasts still call for headline euro area inflation to remain well south of the 2% target out to 2023. For the BoJ, we simply cited a rise in realized inflation as the only possible development that could lead to a BoJ taper. The BoJ now forecasts that Japanese inflation will not reach the 2% central bank target until at least 2024. So for both the ECB and BoJ, the conditions do not warrant any imminent tapering of bond buying. Chart 6What The Most Dovish CBs Are Watching
What The Most Dovish CBs Are Watching
What The Most Dovish CBs Are Watching
As another way to determine who could taper next, we turn to our Central Bank Monitors, which are designed to measure the pressure on policymakers to ease or tighten monetary setting. All the Monitors have responded to the recovery in global growth and inflation, along with the easing of financial conditions implied by booming markets, over the past year. Yet only the RBA Monitor is calling for tightening (Chart 7), indicating that the RBA’s current focus on only wages and realized inflation is a departure from their behavior in the past. The Fed and BoE Monitors have risen to the zero line, suggesting no further pressure to ease policy but no tightening is needed either. The ECB, BoJ and RBNZ Monitors are all close, but just below, the zero line, suggesting diminishing need for more monetary stimulus (Chart 8). Chart 7Bond Yields Have Moved Ahead Of Our CB Monitors
Bond Yields Have Moved Ahead Of Our CB Monitors
Bond Yields Have Moved Ahead Of Our CB Monitors
Chart 8Yields Overshooting Tightening Pressures Here Too
Yields Overshooting Tightening Pressures Here Too
Yields Overshooting Tightening Pressures Here Too
Based on our assessment of the above indicators, we judge the RBNZ to be the next central bank most likely to taper, sometime in the 2nd half of 2021. We still see the Fed starting to signal tapering later this year, but with actual slowing of US Treasury (and Agency MBS) purchases not occurring until early 2022. The year-over-year momentum of bond yields correlates strongly with the Central Bank Monitors. The rise in global bond yields seen over the past year has exceeded the pace implied by the Monitors. This is unsurprising given how rapidly the global economy has recovered from pandemic-fueled recession in 2020. Supply chain disruptions and surging commodity prices have also given a lift to bond yields via rising inflation expectations, even as central banks have promised to keep rates on hold for at least the next couple of years. Yet purely from a monetary policy perspective, the surge in global bond yields looks to have gone a bit too far, too fast. Bottom Line: Markets are now trying to sort out who will taper next after the BoC and BoE, and have concluded that it will not be the Federal Reserve, with US employment still well below the pre-pandemic peak. US Treasury yields will continue trading sideways until there is greater clarity on the pace of US labor market improvement, especially after the big downside miss in the April jobs report. Bond yields in other developed markets appear to have overshot economic momentum, and a period of consolidation is needed before yields can begin moving higher again. US Treasury Curve: How Much Steepening Left? Chart 9A Pause In The UST Bear-Steepening Trend
A Pause In The UST Bear-Steepening Trend
A Pause In The UST Bear-Steepening Trend
For most of the past year, the primary trend in the US Treasury curve has been one of bear steepening. Longer maturity yields have borne the brunt of the upward pressure stemming from the rapid recovery in US (and global) economic growth from the depths of the 2020 COVID-19 recession. In recent weeks, however, the surge in longer-maturity Treasury yields has stalled, as have the immediate steepening pressures (Chart 9). Purely from a fundamental economic perspective, a steepening Treasury curve is an expected result of the reflationary mix of growth, inflation and monetary policy currently at work in the US. For example, since the 2020 lows, 5-year/5-year forward inflation expectations from the TIPS market have risen 143bps while the ISM manufacturing index surged from a low of 41 to a high of 65 in March of this year (Chart 10). Combine that with the Fed cutting rates to 0% last year, while promising to keep rates unchanged through 2023 and reinforcing that commitment through QE, and it is no surprise to see a steeper US Treasury curve. Chart 10UST Curve Steepening Has Been Driven By Reflation
UST Curve Steepening Has Been Driven By Reflation
UST Curve Steepening Has Been Driven By Reflation
Yet even despite these obvious steepening pressures, the pace of the Treasury curve steepening does seem to be a bit rapid compared to history. In Chart 11, we show a “cycle-on-cycle” analysis, comparing the slope of various US Treasury curve segments (2-year versus 5-year, 5-year versus 10-year, 10-year versus 30-year) to the average of the previous five US business cycles, dating back to the 1970s. The curves are lined up to the start date of the previous recession, with the vertical line in the chart representing that date. Thus, this chart allows us to see how the Treasury curve evolved heading into, and coming out of, economic downturns. Chart 11 shows that the current 2-year/5-year curve, with a steepness of 63bps, is in line with past steepening moves coming out of recession. For the curve segments at longer maturities, the pace of steepening has been much more rapid than in the past. In fact, the current 5-year/10-year slope of 82bps is already above the average past peak level, as is the 10-year/30-year curve of 72bps. If we do the same cycle-on-cycle analysis for the three previous US recessions dating back to 1990, the current curve slopes are more in line with levels seen one year into the economic expansion (Chart 12). During those previous cycles, the curve steepening trend ended around two years into the expansion. This suggests that the current curve steepening could continue into 2022, except for one major difference – the Fed cut rates to 0% very rapidly last year, far faster than in the previous easing cycles. This suggests that additional curve steepening from current levels can only occur through a surge in US inflation. Chart 11Current UST Steepening Has Moved Fast Compared To Past Cycles
Current UST Steepening Has Moved Fast Compared To Past Cycles
Current UST Steepening Has Moved Fast Compared To Past Cycles
Chart 12Can More UST Curve Steepening Occur With A 0% Funds Rate?
Can More UST Curve Steepening Occur With A 0% Funds Rate?
Can More UST Curve Steepening Occur With A 0% Funds Rate?
The slope of the Treasury curve is typically correlated to the level of the nominal fed funds rate, but is even more strongly correlated to the funds rate minus actual inflation, or the real fed funds rate. When the real funds rate is below the natural real rate of interest, a.k.a. r-star, the Treasury curve has historically exhibited its strongest steepening trend. That can be seen in Chart 13, where we show the real fed funds rate (adjusted by US core CPI inflation) compared to the New York Fed’s estimate of r-star. The gap between the two series is shown in the bottom panel, correlating very strongly to the 2-year/30-year Treasury curve slope. Chart 13Curve Steepening Results When Real Rates Are Below R*
Curve Steepening Results When Real Rates Are Below R*
Curve Steepening Results When Real Rates Are Below R*
With the nominal funds rate at zero, that gap between r-star and the real fed funds rate can only widen in a fashion that would support more curve steepening if a) realized US inflation moves higher or b) r-star moves higher. Both outcomes are possible as the US economic recovery, fueled by expanding vaccinations and fiscal stimulus. Both real rates and r-star are much lower in the current cycle than in previous economic recoveries, although the r-star/real funds rate gap appears to be following a more typical path that suggests potential additional steepening pressure (Chart 14). The wild card in this analysis is the Fed itself. If US economic growth and inflation evolve in way that makes it more likely the Fed would have to begin tapering QE and, eventually, signal future rate hikes, the Treasury curve may shift to a more typical bear-flattening trend seen during tightening cycles. We saw an example of that after the release of the March US employment report, where over a million jobs were created in a single month, causing 5-year Treasury yields to jump higher than longer-maturity Treasuries (i.e. curve flattening). Looking ahead, it appears that the US yield curve is more likely to slowly transition to a bear-flattening/bull-steepening regime than continue the bear-steepening/bull-flattening: trend of the past twelve months. One way to position for this is to enter into butterfly curve trades that offer attractive carry or valuation. For that, we turn to our Treasury curve valuation models. We have been recommending a Treasury yield curve trade in our Tactical Overlay portfolio on page 19, going long a 7-year bullet versus going short a 5-year/10-year barbell (Chart 15). This barbell is now very cheap on our models, which measure value by regressing the butterfly spread on the underlying slope of the curve. In this case, the spread between the 5/7/10 butterfly is unusually wide compared to the slope of the 5/10 Treasury curve. According to our model, this butterfly spread discounts nearly 100bps of additional 5/10 steepening, an excessive amount compared to past cycles. Chart 14R* - Real Funds Rate Gap Below Previous Cyclical Peaks
R* - Real Funds Rate Gap Below Previous Cyclical Peaks
R* - Real Funds Rate Gap Below Previous Cyclical Peaks
Chart 15Maintain Our Current 5/7/10 UST Butterfly Trade
Maintain Our Current 5/7/10 UST Butterfly Trade
Maintain Our Current 5/7/10 UST Butterfly Trade
While the valuation is attractive on the 5/7/10 butterfly (Table 2), the carry on this position is a modest 12bps. A butterfly with more attractive carry is the 2/5/30 butterfly. Table 2US Butterfly Strategy Valuation: Standardized Residuals
Who Tapers Next?
Who Tapers Next?
Table 3US Butterfly Strategies: Carry
Who Tapers Next?
Who Tapers Next?
Chart 16Enter A New 2/5/30 UST Butterfly Trade
Enter A New 2/5/30 UST Butterfly Trade
Enter A New 2/5/30 UST Butterfly Trade
This butterfly has a neutral valuation (Chart 16) on our model, but offers 35bps of carry - the most attractive among all butterflies involving a 5-year bullet (Table 3). With US Treasury yields, and the Treasury curve slope, likely to remain rangebound for the next few months, going for higher carry trades is an attractive strategy – particularly if used in conjunction with a below-benchmark duration stance, which we still advocate. The 2/5/30 butterfly represents an attractive near-term hedge to that more defensive duration posture. Bottom Line: We are adding a new recommended US Treasury butterfly trade to our Tactical Overlay portfolio, going long the 5-year bullet and short the 2/30 barbell. This trade should benefit with US Treasury curve steepening overshooting the pace of past cycles, while offering attractive carry if persistent Fed dovishness slows the cyclical transition to a bear-flattening curve regime. Robert Robis, CFA Chief Fixed Income Strategist rrobis@bcaresearch.com Footnotes 1 Please see BCA Research Global Fixed Income Strategy Report, "Harder, Better, Faster, Stronger", dated March 16, 2021, available at gfis.bcaresearch.com. Recommendations The GFIS Recommended Portfolio Vs. The Custom Benchmark Index
Who Tapers Next?
Who Tapers Next?
Duration Regional Allocation Spread Product Tactical Trades Yields & Returns Global Bond Yields Historical Returns
Highlights Important leading indicators of Eurozone activity point to record growth in the coming quarters. Progress on the vaccination front, global pent-up demand, and easing fiscal policy will fuel the Euro Area recovery. Consensus growth expectations for the Eurozone do not reflect this upbeat outlook; hence, European economic surprises will remain firm. Robust economic surprises will help European stocks, especially small-cap ones. They will also allow for a stronger EUR/USD and rising German 10-year yields. The UK economy is strong, and the BoE will be among the first central banks to tighten policy meaningfully. However, investors understand the UK’s strength well. While the cyclical outlook for the pound is bright against both the USD and the EUR, the GBP is vulnerable to some near-term profit taking. Downgrade UK small-cap stocks to neutral on a tactical basis. Feature The case for the Eurozone’s recovery is only growing stronger. However, consensus growth forecasts for the Euro Area remain modest. Faced with this dichotomy, the European economy has ample room to generate positive surprises in the coming months. This process will support European financial assets, small-cap stocks in particular. This contrasts with UK assets, where investors have already embedded generous growth assumptions in response to the country’s rapid pace of vaccination. A tactical downgrade of UK small-cap equities is appropriate. Surprise! Two indicators from outside the Eurozone point to an elevated likelihood that the European economy will generate some exceptionally strong growth numbers over the coming 12 months. First, the Swiss KOF Economic Barometer hit an all-time high in April. The KOF series is an excellent leading indicator of Switzerland’s economic activity, and it currently forecasts record GDP growth and PMIs for that country (Chart 1). This message of strength for Switzerland bodes well for the Eurozone. While the Swiss market is defensive, owing to its heavy exposure to healthcare and consumer staple stocks, the Swiss economy is pro-cyclical. Exports represent 60% of GDP, and exports to the Eurozone account for 40% of this total. Moreover, the growth-sensitive machinery, consumer goods, and chemicals categories account for almost 50% of shipments. Based on these observations, the KOF Economic Barometer forecasting ability unsurprisingly extends beyond Swiss economic variables; it also anticipates positive growth for the Global Manufacturing PMI, the Euro Area Manufacturing PMI, and the Eurozone’s forward earnings (Chart 2). Chart 1Climbing Swiss Peaks
Climbing Swiss Peaks
Climbing Swiss Peaks
Chart 2A Good Sign For The Eurozone
A Good Sign For The Eurozone
A Good Sign For The Eurozone
Second, an aggregation of Swedish economic data confirms the KOF indicator’s message and also calls for record economic activity in Europe. Our Swedish Economic Diffusion Index, which incorporates 14 data series from the Nordic country, points toward a further acceleration in the Euro Area PMIs relative to the US (Chart 3). It is also consistent with a pick-up in the performance of European equities relative to the US. These important indicators of the European economy reflect a variety of forces at play that increasingly point toward stronger growth. Among them, the improvement in the pace of vaccination is crucial to lifting the mood across the continent. As the top panel of Chart 4 illustrates, the number of daily vaccine doses administered across major Euro Area economies is accelerating sharply. While it took three months to inoculate 20% of the population, it only took one month to raise the vaccinated population to nearly 40% (Chart 4, bottom panel). Chart 3Sweden Leads The Eurozone
Sweden Leads The Eurozone
Sweden Leads The Eurozone
Chart 4Accelerating Vaccinations
Accelerating Vaccinations
Accelerating Vaccinations
Euro Area fiscal policy is also moving in a more growth-friendly direction. The Italian Budget announced on April 26 will add EUR248 billion in spending over the next six years. For the moment, Germany has abandoned its debt brake, and, as we wrote three weeks ago, the September election is likely to reify this outcome and further ease fiscal policy in Europe’s biggest economy. Spain is the second largest recipient of the NGEU funds, and it is expected to increase fiscal spending by EUR167 billion over the coming six years. In addition, France has yet to give clear hints about its plan, but next year’s elections are likely to result in further stimulus measures as well. Thus, fiscal easing in Europe will only increase from this point on (Chart 5). Chart 5The Expanding European Stimulus
A Surprising Dance
A Surprising Dance
Accumulated pent-up demand remains another potent fuel for growth in the Euro Area. Unlike in the US, spending on durable goods in the Eurozone has not overtaken its pre-pandemic levels (Chart 6). Furthermore, global inventory-to-sales ratio are low, which hints at a coming inventory restocking cycle. These two trends will benefit Euro Area economic activity. The service sector recovery has more to go. Despite some recent improvements, the Eurozone’s Service PMI remains depressed compared to that of the US (Chart 7, top panel). However, the acceleration in the European vaccination campaign and the continued injection of fiscal support at the same time as the lockdowns ebb should result in a significant catch up in service activity in the Euro Area. Thus, the double-dip recession is on the verge of ending and giving way to a robust GDP expansion (Chart 7, bottom panel). Chart 6Ample European Pent-up Demand
Ample European Pent-up Demand
Ample European Pent-up Demand
Chart 7The Service Sector Recovery Is Paramount
The Service Sector Recovery Is Paramount
The Service Sector Recovery Is Paramount
Even though the recovery in GDP growth will lead to strong positive economic surprises for the Euro Area, consensus growth expectations for the region remain conservative. According to Bloomberg, Eurozone annual GDP growth is expected to reach 12.6% in Q2 because of an extremely strong base effect. However, growth will decelerate suddenly and hit 2.3% in Q3 and 4.3% in Q4. Growth is anticipated to be 4.1% in 2022. These are low thresholds to beat, and thus, economic surprises will remain positive. Chart 8Decomposing The Surprises
Decomposing The Surprises
Decomposing The Surprises
The source of positive economic surprises is likely to be broad-based. If the service sector recaptures some of its previous shine, the Surveys and Business Cycle component and the Labor Market component of the Bloomberg surprises index will improve and remain positive for many months (Chart 8). Moreover, the absorption of pent-up demand will allow the Retail and Wholesale as well the Personal/Household components to remain robust or firm up further. Finally, the strength of the global manufacturing sector and the elevated potential for a global inventory restocking will allow the Industrial component to firm up anew. Bottom Line: The European economy is in a good place to validate the upbeat message from the KOF Economic Barometer or the Swedish Economic Diffusion Index. Since expectations for European economic activity are still limited for the second half of 2021, this strong growth performance will result in positive economic surprises. Investment Implications The heightened odds that Europe will generate significant positive economic surprises for the coming quarters means that investors’ perspective of the Euro Area will gradually improve. While this process will ultimately curtail the ability of Europe to beat expectations, it will also lift Eurozone assets. If our forecast is correct that European economic surprises will largely be positive over the coming 6 to 12 months, then European equities are more likely to generate generous returns than otherwise. Table 1 highlights that positive changes in the Economic Surprise Index (ESI) on a 3-month, 6-month, and 12-month horizon coincide with returns of the Euro Area MSCI equity benchmarks that have positive batting averages of 72%, 70%, and 73%, respectively. Moreover, the average and median returns are significantly higher than when the ESI deteriorates. Table 1Forecasting Strong Surprises Means Forecasting Strong Equity Returns
A Surprising Dance
A Surprising Dance
The signal from the ESI is weaker if we do not make forecasts about its direction. The batting averages of subsequent 3-month and 6-month equity returns following an improving ESI are 63% and 69%, respectively, and the median subsequent returns are higher than if today’s ESI is deteriorating, but not to the same extent as when we make a forecast of the ESI. 12-month returns for the Eurozone MSCI index have a 58% chance of being positive, if the ESI increases over a 12-month window, which is lower than the 63% batting average if the ESI worsens. Moreover, average and median 12-month expected returns are somewhat higher if the ESI has been deteriorating rather than improving over the past 12-month period. European small cap equities will be prime beneficiaries of the coming growth outperformance. From an economic perspective, this makes sense because small-cap stocks are geared more toward domestic growth than large-cap equities, which are dominated by multinationals. Table 2 shows that 3-month, 6-month, and 12-month periods of improvement in the surprise index precede an outperformance of small-cap relative to large-cap stocks over similar windows of time. Thus, the current positive level of the European ESI and its ability to rise further should favor small-cap European equities. Table 2Favor Small-Cap Stocks
A Surprising Dance
A Surprising Dance
Table 3A Bullish Backdrop For EUR/USD
A Surprising Dance
A Surprising Dance
The same exercise shows that the outlook also favors the euro. European economic surprises should continue to outpace the US, because Eurozone growth will catch up to the US, but investors already have much loftier expectations for US activity than for the Euro Area. Table 3 illustrates that periods when the Eurozone’s ESI is greater than that of the US, EUR/USD generates a positive 3-month return 65% of the time, with a median gain of 1.3%. When the US ESI is higher, the EUR/USD depreciates 55% of the time, with a median loss of -0.5%. Chart 9Rising German Yields?
Rising German Yields?
Rising German Yields?
Finally, the potential for stronger European ESI is negative for Bunds. Speeches by various members of the European Central Bank Governing Council indicate that the ECB will tolerate higher yields, if they reflect stronger economic activity. As the European vaccination campaign advances and the fiscal stimulus increases, the need to maintain depressed Bunds yields recedes. Hence, a continuation of positive ESI readings is now more likely to boost these yields. Additionally, the gap between the European ESI and the US one will remain positive, thus, a period of rising German yields relative to the US is more likely (Chart 9). Bottom Line: The ability of the European economy to continue to surprise positively should generate attractive equity returns on the continent. Moreover, this economic backdrop is consistent with an outperformance of small-cap equities, as well as an appreciating EUR/USD. Under these circumstances, Bunds yields should experience more upside. Country Focus: The UK’s Outlook Is Brightening, Unsurprisingly Last week, the Bank of England left the total size of its asset purchase program in place at GBP875 billion, even if the weekly pace of purchases was slowed to GBP3.4 billion from GBP4.4 billion. The BoE also raised its 2021 growth forecast to 7.5%, from 5% in February. The BoE is joining the Bank of Canada as one of the first central banks to taper its asset purchase program. It will also be one of the first central banks to increase interest rates, after the Norges Bank, but ahead of the Fed. In a way, the UK shares many similarities with our recent positive depiction of the Swedish economy. Chart 10Support For Household Net Worth
Support For Household Net Worth
Support For Household Net Worth
The rapid pace of vaccination in the UK allows for a vigorous economic recovery. In all likelihood, the UK economy will have contracted in Q1 2021 because of the severe lockdowns that prevailed then; however, these lockdowns are being eased and economic fundamentals point up. Our Global Fixed Income and Foreign Exchange strategists recently demonstrated that house prices are increasing on the back of rising mortgage approvals and falling household debt-servicing obligations (Chart 10). The robust readings of the RICS House Prices survey only confirm the positive outlook for housing prices. Expanding house prices will elevate consumption. An appreciating housing stock boosts the wealth of households and leads to higher UK consumer confidence. Moreover, business confidence is improving; the rise in capex intentions not only indicates that investments will increase, but is also a precursor to climbing job vacancies (Chart 11). Brighter labor market prospects often result in rising consumption, especially if wages firm up, as we argued seven weeks ago. The current bout of economic strength points to some upside in UK inflation as well. The elevated PMI readings and the rapid increase in construction activity are reliable forecasters of higher CPI prints (Chart 12). However, this not a uniquely British phenomenon, and it remains to be seen how durable this rising inflation will be. Chart 11UK Consumption Will Rise More
UK Consumption Will Rise More
UK Consumption Will Rise More
Chart 12Accelerating UK Inflation
Accelerating UK Inflation
Accelerating UK Inflation
Despite this positive economic outlook, investors should adopt a more cautious tactical stance toward UK markets. The problem for British assets is that investors have understood UK’s vaccination strength so well that they embed much optimism in the price of financial instruments levered to domestic economic activity. In contrast to the Eurozone, Bloomberg consensus forecast anticipate Q2 year-on-year GDP growth of 20.7%, 6.1% for Q3 and 6.5% for Q4. Cable is particularly ripe for some near-term profit taking. Our Intermediate-Term Technical Indicator and the 52-week rate of change of GBP/USD, as well as net speculative positions and sentiment, all point to a correction in that pair (Chart 13). Moreover, the 13-week momentum measure for EUR/GBP shows that the rapid decline in this cross is also overdone. As a result, BCA’s Foreign Exchange strategists closed their short EUR/GBP position to book some gains. It is also time to downgrade British mid- and small-cap stocks from our current overweight stance, at least on a tactical basis. Compared to large-cap UK stocks, small-cap names have moved in a parabolic fashion, and the ratio’s elevated 52-week rate-of-change measure warns of a pullback, especially in light of the deterioration in near-term momentum (Chart 14). The message from technical indicators is particularly concerning, because the forward earnings of small-cap stocks are plunging relative to large cap ones (Chart 15). Additionally, valuation multiples on UK small-cap stocks have vastly outpaced those of their larger counterparts, despite a rapid decline in relative RoE (Chart 16). Chart 13Cable Is Ripe For Some Near-Term Profit Taking
Cable Is Ripe For Some Near-Term Profit Taking
Cable Is Ripe For Some Near-Term Profit Taking
Chart 14UK Small-Cap Stocks Are Technically Vulnerable
UK Small-Cap Stocks Are Technically Vulnerable
UK Small-Cap Stocks Are Technically Vulnerable
Chart 15Deteriorating Profit Performance
Deteriorating Profit Performance
Deteriorating Profit Performance
Chart 16Quite The Valuation Premium
Quite The Valuation Premium
Quite The Valuation Premium
Ultimately, these cautious views are of a short-term nature. BCA’s Foreign Exchange strategists remain upbeat on the pound on a 12- to 24-month basis. Cable continues to trade at a deep discount to our purchasing-power parity estimate, which adjusts for the composition of price indexes in the UK and the US (Chart 17). Moreover, real short rate differentials still favor GBP/USD. The pound also trades at a discount to the euro based on long-term valuation metrics. Most importantly, real interest rates differentials at both the short- and long-end of the curve, as well as the outlook for the evolution of monetary policy in the UK relative to the Euro Area, indicate a significantly lower EUR/GBP (Chart 18). Chart 17Despite Nera-term risks, Cable's Cyclical Underpinning Is Strong
Despite Nera-term risks, Cable's Cyclical Underpinning Is Strong
Despite Nera-term risks, Cable's Cyclical Underpinning Is Strong
Chart 18Lower EUR/GBP Ahead
Lower EUR/GBP Ahead
Lower EUR/GBP Ahead
For small-cap equities, the cyclical picture is more complex. On the one hand, their domestic exposure and a higher pound over the coming 12 to 24 months should help them, unlike the large-cap UK stocks, which derive most of their income from abroad and are negatively affected by a higher GBP. On the other hand, UK small-cap stocks have become so expensive that we need to see how an appreciating pound will boost their earnings relative to large-cap stocks before adjusting our neutral stance. Bottom Line: The strong UK economy will allow the BoE to be one of the first major DM central banks to tighten policy. This will support a further appreciation of the pound against both the dollar and the euro over the coming 12 to 24 months. Nonetheless, the GBP has been overbought on a tactical basis and is vulnerable to a near-term pullback. Similarly, compared to large-cap equities, we are downgrading small-cap UK stocks from overweight to neutral on a tactical basis. Mathieu Savary, Chief European Investment Strategist Mathieu@bcaresearch.com Jeremie Peloso, Associate Editor JeremieP@bcaresearch.com Cyclical Recommendations Structural Recommendations Trades Currency Performance
A Surprising Dance
A Surprising Dance
Fixed Income Performance Government Bonds
A Surprising Dance
A Surprising Dance
Corporate Bonds
A Surprising Dance
A Surprising Dance
Equity Performance Major Stock Indices
A Surprising Dance
A Surprising Dance
Geographic Performance
A Surprising Dance
A Surprising Dance
Sector Performance
A Surprising Dance
A Surprising Dance
Closed Trades