Policy

Highlights We are lowering our expectation for oil-demand growth this year, bringing it more in line with levels expected by OPEC, the IEA and EIA. Our GDP-driven demand estimates have proven too bullish for 1Q21, considering the wide margin by which we missed actual demand in January and February. Our expectation for oil demand growth this year is lowered to 5.5mm b/d, down from 6.6mm b/d last month. For 2022, we are increasing our growth assumption to 4.1mm b/d, up from 2.8mm b/d. We continue to expect Brent prices to reflect an accommodation between Russia's and KSA's preferred Brent ranges of $50-$55/bbl and $70-$75/bbl, respectively. We are keeping our forecast for average prices at $65/bbl and $70/bbl for this year and next, with WTI averaging $2-$3/bbl below that (Chart of the Week). Brent benchmark pricing confusion subsided, following the decision of S&P Global Platts to revert to free-on-board (FOB) reporting of prices. However, as the center of gravity for crude oil demand settles on Asia, confusion around the North Sea benchmark could provide an opening for regional benchmarks and consolidation of futures platforms trading crudes delivered to the region. Feature The decision by the Kingdom of Saudi Arabia (KSA) to voluntarily remove 1mm b/d of its production from the market over February – April will be remembered as one of the more prescient reads on the state of global oil demand during the COVID-19 pandemic. KSA's insistence on seeing improvement in actual demand – as opposed to forecasted demand – before it commits to returning production to the market could not have been more clear-sighted. The upcoming April 1 meeting of OPEC 2.0 will convey useful information to the market re changes, if any, to the production-management strategy of the coalition, which is led by KSA and Russia. Perhaps the most important information coming out of the meeting will be how KSA reads the current state of global oil demand, as it has not committed to a date-certain when it will return this production to market. We expect the Kingdom to extend its production cuts and to lobby for continued restraint by the other member states of OPEC 2.0 at the meeting. Going into the meeting, OPEC 2.0 will be assessing global demand against a deteriorating public-health backdrop in important consuming markets. The EU's policy failures in securing sufficient vaccinations to protect its population, and public-health missteps regarding the AstraZeneca vaccine continue to retard Europe's efforts to contain the pandemic.1 Chart of the WeekOPEC 2.0 Expected To Maintain Production Discipline
OPEC 2.0 Expected To Maintain Production Discipline
OPEC 2.0 Expected To Maintain Production Discipline
Increasing lockdowns in several EU countries and a higher likelihood of a resurgence in COVID-19 infection rates in the US – particularly in the states that are reopening before they have achieved herd immunity or have vaccinated a large share their populations – will slow demand recovery. The annual Spring Break holidays in the US potentially could become a world-class super-spreader event. Elsewhere, LatAm is distressed, particularly Brazil, which, like the EU, has misjudged and mishandled its vaccination policy and rollout, leaving its populations at higher risk for infection. This also has the attendant risk of producing an environment ripe for further COVID-19 mutations and the spread of new variants. Lower Oil Demand Forecast For 2021 We were wrong on our call expecting stronger demand growth in 1Q21 – our consumption forecasts exceeded realized demand an average of 2.3mm b/d in 1Q21. We are now more aligned with demand expectations of IEA, EIA, and OPEC (Chart 2). Our expectation for oil demand growth this year is lowered to 5.5mm b/d, down from 6.6mm b/d last month. For 2022, we are increasing our growth assumption to 4.1mm b/d, up from 2.8mm b/d. We expect non-OECD oil consumption, our proxy for EM demand, to average 53.2mm b/d this year and 55.5mm b/d next year, vs. 54mm b/d and 55.4mm b/d last month. DM demand, proxied by OECD oil consumption, is expected to average 44.5mm b/d and 46.3mm b/d next year, versus our previous forecast of 44.9mm and 46.3mm b/d last month. Chart 2Lower Oil Demand In 2021, Higher Next Year
Lower Oil Demand In 2021, Higher Next Year
Lower Oil Demand In 2021, Higher Next Year
We continue to expect the massive fiscal and monetary stimulus to support markets and lead to stronger growth going forward. The recently approved package by the US Congress calling for an additional $1.9 trillion of fiscal stimulus will have global knock-on effects, which will be bullish for commodity demand, once the COVID-19 pandemic is contained (Chart 3). Chart 3Pandemic Recovery Will Spur Pent-Up Demand
OPEC 2.0 Production Discipline Still Required To Balance Markets
OPEC 2.0 Production Discipline Still Required To Balance Markets
OPEC 2.0 Production Discipline Persists The salient feature of the oil market during the pandemic has been the cohesion of OPEC 2.0 and its production discipline. We expect that to continue going into and coming out of the coalition's April 1 meeting. Our view that OPEC 2.0 's overall strategy as the dominant producer in the market is to calibrate the level of supply to the level of demand remains intact. We expect production for the coalition to average 46.0mm b/d in 2021 and 46.2mm b/d in 2022 (Chart 4). We do not expect OPEC 2.0 to raise production, given the increasing uncertainty around demand vis-à-vis getting the COVID-19 pandemic under control in large consuming markets like the EU and LatAm, and higher infection rates out of the US. However, as we noted above, we are closely watching what KSA does and says at the upcoming meeting for any clue that global demand is improving faster than we now expect. Chart 4OPEC 2.0 Production Discipline Persists
OPEC 2.0 Production Discipline Persists
OPEC 2.0 Production Discipline Persists
Outside OPEC 2.0, our expectation for the bellwether US shale-oil producers' output remains relatively unchanged. We continue to expect production to move higher, and to remain constrained by capital availability. US shale output is expected to average 10.7mm b/d this year, and 12.1mm b/d next year. In our modeling, the shale producers lead the price-taking cohort, which produces whatever the market allows it to produce. We continue to expect capital-market discipline to keep US oil producers from getting too far out ahead of their balance sheets' ability to profitably grow production. The same holds for producers outside the OPEC 2.0 coalition ex-US (Table 1). Table 1BCA Global Oil Supply - Demand Balances (MMb/d, Base Case Balances)
OPEC 2.0 Production Discipline Still Required To Balance Markets
OPEC 2.0 Production Discipline Still Required To Balance Markets
Markets Balance On OPEC 2.0 Discipline OPEC 2.0's production strategy will keep markets balanced, as relatively high compliance among those producers capable of increasing production is observed and markets are not over-supplied (Chart 5). This will allow inventories to continue to draw then stabilize around mid-year. It is important to point out that this balancing is an iterative process, driven by OPEC 2.0's read on the state of demand, which, perforce, is occurring with lags in the data it is responding to. We continue to keep a weather eye on the USD, given the impact it has on commodity fundamentals. We continue to expect dollar weakening and model for that, but the path of the USD has been difficult to call, given it is highly correlated with global economic policy uncertainty, which is heavily influenced by the evolution of the COVID-19 pandemic (Chart 6). Chart 5Markets Remain Balanced...
Markets Remain Balanced...
Markets Remain Balanced...
Chart 6The USD's Evolution Remains Important
The USD's Evolution Remains Important
The USD's Evolution Remains Important
A Hue and Cry In Brent Additional uncertainty is entering oil markets from an unlikely corner: The Brent benchmark pricing index used to set prices on some two-thirds of all the oil traded in the world. Brent benchmark pricing was thrown into wide-eyed confusion when S&P Global Platts – the leading price reporting agency for the index used as a reference in Brent physical contracts (Dated Brent) – decided to convert the index from a free-on-board (FOB) index to a cost-insurance-freight (CIF) index. Platts' proposed Brent reporting changes two weeks ago essentially would have transformed the pricing index from a pure spot index that assumes the buyer will arrange insurance and freight after purchasing a cargo at a North Sea terminal into a delivered index reflecting CIF-Rotterdam terms provided by the seller. After a great hue and cry went up, Platts reverted to quoting Brent on an FOB basis. But that hardly ends the drama. Brent production is collapsing – by next year, only one 600k-barrel cargo a day of Brent will be loaded out of North Sea terminals. This is a very thin reed supporting the global oil market's primary price index. In an effort to expand the Brent pricing pool, Platts also is looking to include US WTI in one form or another, but nothing's been settled upon to date. The confusion around Brent pricing comes as the center of gravity for crude oil demand and trading continues its inexorable shift to Asia. This could provide an opening for regional benchmarks – e.g., the UAE's Murban crude oil, which supports a just-launched futures contract calling for delivery in Asia, where most of the demand for oil is met by Middle East suppliers. It could even allow for consolidation of other futures platforms in the region (e.g., the Dubai Mercantile Exchange), which also are used to price and hedge Asia-bound crude cargoes out of the Gulf. As interesting and complex as the global oil market is, it is nothing without a viable pricing benchmark. Much of the world's oil business hinges on that index being determined by the price of a single cargo loaded every day. We will be following this with great interest. Robert P. Ryan Chief Commodity & Energy Strategist rryan@bcaresearch.com Commodities Round-Up Energy: Bullish An exceptionally cold winter resulted in a sharp drawdown US natgas inventories down, which are expected to end the 2020-21 winter season at 2021 at 1.6 Tcf by the US EIA's reckoning (Chart 7). This would be 13% lower than the 5-year average level of inventories, according to the EIA. Over the April-October injection season, EIA is expecting natgas inventories to finish at ~ 3.7 Tcf, or ~ 2% below their 5-year average. Spot natgas prices at Henry Hub, LA – the delivery point for NYMEX/CME futures – averaged $5.35/MMBtu in February, the highest level since February 2014, the EIA noted. Natural gas for April 2021 delivery at Henry Hub closed at $2.562/MMBtu on Tuesday. Base Metals: Bullish COMEX copper came close to its 2011 highs late last month, at $4.30/lb but has since retreated. However, we believe fundamental supply-demand factors will keep copper prices moving higher over the longer term. As highlighted in an earlier report (BCA Research - Renewables, China's FYP Underpin Metals Demand), the move to EVs and renewable energy will keep demand for copper and the overall base metals complex well-bid during this decade. The International Renewable Energy Agency (World Energy Transitions Outlook: 1.5°C Pathway (Preview) (irena.org)) reported on Tuesday that copper-intensive renewable power capacity will have to increase by more than 10-fold by 2050 to avert severe climate change. On the supply side, in our recent report entitled BCA Research - Copper's Supply Challenges, we noted falling copper investment and declining copper ore quality inexorably will increase production costs. Only higher copper prices will incentivize producers to increase mining activity. Rising demand and stagnant supply will put copper supply-demand balances in a deficit over the short-to-medium term, causing inventories to decline over this period as well. Precious Metals: Bullish The sharp run-up in 10-year US real rates since the end of 2020 pulled gold prices from down from their 2021 high of ~ $1,950/oz in January to ~ $1,680/oz earlier this month (Chart 8). Price have since rebounded above $1,740/oz as real rates weakened. We expect markets to re-price gold when it becomes apparent the rally in rates was more a function of higher growth expectations for the US economy than a higher likelihood of Fed tightening. Our view that the Fed's ultra-accommodative monetary policy and massively expansive US fiscal policy will spur growth and inflation has not changed. We expect the Fed to remain behind the inflation curve in its rate hikes, which will keep US real rates on their downward trajectory. Chart 7
OPEC 2.0 Production Discipline Still Required To Balance Markets
OPEC 2.0 Production Discipline Still Required To Balance Markets
Chart 8
Gold Prices Down From Their 2021 High
Gold Prices Down From Their 2021 High
Footnotes 1 Please see Extent of damage to AstraZeneca vaccine’s perceived safety in Europe revealed published by yougov.co.uk 7 March 2021. See also States lift Covid restrictions, drop mask mandates and reopen businesses despite warnings from Biden officials published by cnbc.com 11 March 2021, and European travel restrictions: Non-essential travel curbed published by dw.com 15 March 2021. Investment Views and Themes Recommendations Strategic Recommendations Tactical Trades Commodity Prices and Plays Reference Table Summary of Closed Trades
Higher Inflation On The Way
Higher Inflation On The Way
Highlights The American Rescue Plan Act confirms the shift to “Big Government” and proactive fiscal policy in US politics. This sea change in policy is durable for now, given that Democrats can pass one or two more budget reconciliation bills without a Republican vote. Details of forthcoming tax hikes are starting to leak from Washington. Investors should not assume that progressive proposals like a wealth tax, a financial transactions tax, or a minimum corporate tax are dead on arrival. Taxing corporations and the rich is popular. The Republican Party is likely to choose a Trumpian agenda going forward and Trump has a good chance of being the presidential candidate in 2024. But cyclical and structural factors disfavor Republicans at this early stage. Industrials have rallied sharply in advance of Biden’s first law and are now overbought. But we would favor them over health care over a 12-month period, given the macro backdrop and relative policy risks. Feature Were there any surprises in the American Rescue Plan Act (ARPA) signed by President Biden on March 11? Only that some of Biden’s health care and infrastructure agenda slipped into the bill, alongside a provision holding that if states cut taxes and lose revenue, they will lose an equivalent amount in state and local aid. The plan illustrates that the budget reconciliation process is an effective tool for the ruling party to get most of what it wants. The Biden administration will be able to pass one or two more reconciliation bills for FY2022 and FY2023. While the next bills will be harder to pass than the first, and moderate Democratic senators will limit Congress’s options somewhat, the point is that Democrats have just enough political capital to achieve their policy agenda without a single Republican vote. As always, our Political Capital Index is updated in the Appendix and highlights falling political polarization and improving business sentiment, which is positive for Biden’s political capital. Investors will continue to bet on a cyclical recovery but will also become more concerned about tax hikes on one hand and excessive deficit spending on the other. The latter threatens eventually to overheat the economy and speed up the Fed’s rate hike cycle. In this report we conduct a quick recap of the ARPA now that it is official law, we review the tax hike proposals swirling out of the Washington rumor mill, and we update the status of the civil war in the Republican Party. We conclude with a look at industrial stocks, which have rallied tremendously on the back of the cyclical economic upturn (Chart 1) but may still offer some value relative to sectors like health care that face policy risks. Chart 1Cyclical Indicators High On Stimulus
Cyclical Indicators High On Stimulus
Cyclical Indicators High On Stimulus
ARPA Symbolizes The ‘Big Government’ Shift The well-known provisions of the ARPA include: Treasury checks of $1,400 sent directly to individuals who earn less than $80,000 per year; extended unemployment benefits and a renewed federal top-up of $300 per week through September 6, 2021; $65 billion in business aid; and generous funding for various welfare programs such as the expanded Child Tax Credit and larger subsidies for enrollees in the Affordable Care Act health insurance marketplaces (Chart 2).1 Chart 2American Rescue Plan Act
Republicans, Industrials, And Tax Rumors
Republicans, Industrials, And Tax Rumors
In total the US fiscal stimulus amounts to $5 trillion or 23% of GDP since COVID-19 emerged, with $2.8 trillion or 13% of GDP passed since December. It is a gargantuan fiscal stimulus that will supercharge the economy today but lead to a rocky descent once it is exhausted in the coming years (Chart 3). Expiring provisions will occasion political showdowns over whether to make them permanent and how to address waste, corruption, and the long-term budget deficit. Chart 3The COVID-19 Fiscal Blowout
Republicans, Industrials, And Tax Rumors
Republicans, Industrials, And Tax Rumors
The provisions are so far flung that educated American citizens living abroad are reportedly receiving stimulus checks. Nevertheless the bulk of the impact will be felt by low-income people with high marginal propensities to consume. They are the prime beneficiaries of the $850 billion share of the law that funnels cash to individuals as opposed to businesses (Chart 4). This means that at least one-third of the money will be spent, while around two-thirds will be used to pay down debt, enabling consumers to spend more later, according to our Global Investment Strategy. The general effects are very supportive of the recovery. For example, the number of children living in poverty is estimated to fall by 40%, while about one in five renters are expected to catch up on their rent.2 Evictions, bankruptcies, and loan delinquencies will not revive in this context. The total amount of spending is almost twice the size of the output gap, which is now widely expected to be filled by the end of 2022. Chart 4Cash Handouts To Families With High Propensity To Consume
Republicans, Industrials, And Tax Rumors
Republicans, Industrials, And Tax Rumors
While ARPA mainly consists of short-term cash relief – with pro-productivity investments to come in the reconciliation bill for FY2022 focused on infrastructure and renewables – nevertheless it is not wholly devoid of long-term investment. Each of the 50 states will receive $500 million in aid (more depending on their unemployment rate). Since state and local government revenues are not as dire as expected, some of this money will go into infrastructure, including soft infrastructure like the rural broadband buildout. States will be discouraged from cutting taxes, as mentioned.3 The most important takeaway is that the ARPA will reinforce the shift in public attitudes in favor of a larger government role in the economy. Democrats passed their “liberal wish list” and the result is that a range of constituencies – from those on food and housing programs to those working in the health and education systems – will receive a windfall of federal support. In this way a one-off and probably excessive relief bill will contribute to a sea change in American attitudes toward government. Conservatives and Republicans will still argue in favor of limited government but that is a relative concept and the goalposts just moved. Bottom Line: The ARPA secures the recovery, plugs the output gap, and likely reinforces the shift in public attitudes in favor of a larger role of government in society and the economy. The amount of stimulus is likely excessive, assuming the economy avoids any other bad shocks in the coming years. Hence the law marks a historic shift from reactive to proactive fiscal policy and sets the stage for an inflation overshoot in the long run if not the short run. Yellen Becomes Warren? Not Quite, But Expect Negative Tax Surprises The next budget reconciliation bill is expected to be a 10-year green infrastructure package that will be partially offset by tax hikes. Whether in the same bill, or prioritized above it, we expect Biden to push for his expansion of the Affordable Care Act (only a small part of his health agenda was included in the ARPA). The House will draft its version in April and Biden may sign the final bill into law as early as September or as late as December. We discussed the bill in our March 3 missive. Rumors about the tax proposals are starting to leak out of Washington. At present none of the rumors change the policy consensus, based on Biden’s campaign proposal shown in Table 1. However, they do tentatively support our view that tax hikes will deliver negative surprises to the equity market this year, given that investors have so far been unperturbed by the prospect of higher taxes. Table 1Taxman Cometh
Republicans, Industrials, And Tax Rumors
Republicans, Industrials, And Tax Rumors
Secretary of Treasury Janet Yellen raised some eyebrows when she indicated that a wealth tax is being considered by the Biden administration.4 Previously a tax on a person’s (or trust’s) net assets, as opposed to a tax on their income, was the domain of Biden’s progressive-left rivals such as Senators Bernie Sanders and Elizabeth Warren. Warren’s proposal would levy a 2% annual tax on those who possess more than $50 million in net wealth, rising to 3% on billionaires. During the Democratic primary election their proposals were estimated to raise anywhere from $1.4 trillion – if Warren’s proposal met with extreme tax avoidance – to $4.5 trillion, as estimated by Sanders.5 Yellen has also spoken to the finance ministers of France and Germany as part of a diplomatic initiative through the OECD to encourage global participation in a minimum corporate tax rate of around 12%. In exchange for enacting this tax floor, Yellen signaled to the Europeans that she would not insist on providing American Big Tech with a “safe harbor” from Europe’s planned digital tax.6 Whatever ends up happening internationally, the implication is that the Biden administration will push forward with its proposed 15% minimum tax on corporation’s book income. Yellen says that she expects tax hikes to be phased in the latter part of the 10-year budget window for FY2022 so as to make sure that the government’s interest burden is manageable over the long run. She is not concerned about excess deficits or debt in the short run, as they are related to the pandemic relief and economic recovery and interest rates are below the nominal growth rate of the economy. But she has endorsed passing tax hikes for later in the decade, as did both President Biden and Vice President Kamala Harris on the campaign trail. Several of the more ambitious tax proposals face limitations in Congress. Moderate senators like Joe Manchin of West Virginia have raised objections to a large tax hike during trying times. He might be joined by other moderates like John Tester of Montana and the four narrowly elected senators from Arizona and Georgia. However, while these moderates will keep the tax agenda in check, it is important to understand their position. None of these senators are against tax hikes in principle – that would be a Republican stance. They are against tax hikes that increase the burden on the middle class or jeopardize the economic recovery. From that point of view Biden’s proposals are fairly palatable: the highest individual income tax bracket would go back to where it stood in 2016, the corporate rate would go halfway (at most) to its pre-Trump level, and the estate tax would be restored. These proposals focus on big corporations and the wealthy and are likely to be watered down in negotiation, so we would not rule out moderate Democratic support. Investors should not rest easy about the tax agenda until more information is known. Negative surprises are likely. The consensus is that the Democrats will not pass a wealth tax, or a “Wall Street tax” on financial transactions, or other progressive proposals. But these taxes would be popular and politically defensible – some polls even show a majority of Republicans supporting a wealth tax. Therefore these taxes cannot be ruled out in advance.7 Bottom Line: The tax debate is underway and our expectation of negative surprises is looking more, not less, likely. How Will Republicans Respond To The Big Government Onslaught? Republicans have duly retreated to the political wilderness after their election loss and the January 6 Capitol Hill riot. The critical question is whether and how they will regroup to contest future elections – the deeper their divisions, the more certain Democratic policy becomes. At the center of this question is whether the Republican Party will adopt Trumpist policy and whether Trump himself will continue to be the flagbearer and presumptive nominee for the presidential election in 2024. Our answer is that the Republicans will adopt a Trumpist agenda of tough trade and immigration policies combined with fiscal largesse but they will struggle over Trump himself and how to broaden their base. Every election is unique. COVID-19 reinforces the point. There is a clear case to be made that Trump would have won the election if not for the pandemic and recession. We favor this view given how narrowly he lost in the midst of the crisis. But there is also a clear case to be made that he would have lost anyway.8 The problem for the Republicans going forward is that cyclical and structural trends work against them. Cyclically, the economy should be in full stride in 2022-24 and the Federal Reserve is highly likely to play a supportive role. This may or may not prevent the usual midterm opposition gains but it will make it very hard for an opposition presidential candidate to win. True, Democrats will not have a full incumbent advantage if President Biden passes the baton to Vice President Harris. Inflation and other problems will emerge. But given the timing of the pandemic, election, and vaccine, voters will probably be much better off in four years than they were last November, which is the most reliable prediction of whether the incumbent party will stay in power. Structurally, demographic change in America diminishes Trump’s base. A generational shift is transforming the American electorate, as the Silent Generation, which is the most reliably Republican, passes on (Chart 5). Millennials favored the Democratic Party by 6% in the 2020 election (10% in Georgia and 21% in Pennsylvania). Chart 5Generational Shift A Risk To Unreconstructed Republicans
Republicans, Industrials, And Tax Rumors
Republicans, Industrials, And Tax Rumors
Ethnic minorities also skew Democratic, generally speaking, and are taking a much larger share of the electorate, especially in critical swing states – as highlighted by Biden’s victories in Arizona and Georgia (Chart 6). Hispanics favored Biden by 33% (24% in Arizona). Chart 6US Demographics Drive Political Change
Republicans, Industrials, And Tax Rumors
Republicans, Industrials, And Tax Rumors
Demographic extrapolations by the Center for American Progress show that even if post-Millennial generations grow more conservative over time, the Electoral College will shift inexorably against the Republicans as long as current trends continue (Chart 7). Chart 7Electoral Math Frowns On Republicans Even Without Generational Shift
Republicans, Industrials, And Tax Rumors
Republicans, Industrials, And Tax Rumors
Demographics are not destiny: Trump would never have won in 2016 if projections based on age and race were so predictive. Yet Republicans cannot merely wait on cyclical or exogenous events to discredit the Democrats. The electoral math is devastating if they do not broaden their appeal. Their quandary is that generating enthusiasm among their base of white voters with less formal education may exclude the very groups to whom they need to appeal: suburban women, educated whites, and ethnic minorities. The immediate question is what to do about Trump, who has divided the party over the Capitol riot, culminating in seven Republican votes against him in his second impeachment. On the surface the Republican Party is a much older entity than any single member or leader and can therefore play a longer strategy. It could choose the correct electoral strategy of courting independents, women, and Hispanics even if it meant losing an election or two due to divisions with the Trumpists. The problem is that Trump’s personal following is uniquely threatening to the viability of the party. Trump alone could split the Republican Party and nullify its chances in 2022-24 and beyond. Trump has suggested starting his own party, the Patriot Party. Opinion polls show that 46% of Republicans would join it while only 27%would insist on sticking with the Republican Party (Chart 8). Even if a Trumpist party stole only 2-3% of Republican voters it would be enough to ensure a Democratic victory in any election given the very small margins of victory in swing states in recent decades. Trump would easily spoil the Republican bid, just as Ross Perot did in the 1990s, Robert La Follette did for the Democrats in the 1930s, and Theodore Roosevelt did in 1912 (Table 2). As Senator Lindsey Graham said of Trump and the Republican Party, after holding post-election negotiations with the former president: “He can make it bigger. He can make it stronger. He can make it more diverse. And he also could destroy it.”9 Chart 8Trump Could Start Third Party, Give Democrats A Decade-Plus Ascendancy
Republicans, Industrials, And Tax Rumors
Republicans, Industrials, And Tax Rumors
Table 2Major Third Party Breakaway Candidates Undercut Their Former Party
Republicans, Industrials, And Tax Rumors
Republicans, Industrials, And Tax Rumors
So What Will Republicans Do? We conducted an exercise using game theory to determine the likeliest strategy that Trump and the party will take. We used the famous “Prisoner’s Dilemma” as our template because both sides have a lot to gain if they cooperate and a lot to lose if not.10 But they do not trust each other. And each side will lose the most if it stays true while the other betrays it, worsening the distrust. Diagram 1 shows the outcome. Republicans could win eight years in the Oval Office if they adopted Trump’s agenda yet put forward a young new candidate with Trump’s personal endorsement; or they could win four years if they chose Trump himself (the constitutional limitation). By contrast, if they chose an establishment Republican agenda, they could win eight years (reduced to four in Diagram 1 because less likely) or zero years if Trump opposed. Trump, for his part, would win zero years if he bowed out to support the Republicans regardless of whether they adopted his agenda, but he would have a chance of winning four more years if he ran at the head of a Trumpist Republican Party. The outcome is that the Republicans will adopt Trumpism while Trump himself could easily run for president again, given his sway over the party. Diagram 1Game Theory Says Republicans Will Court Trump
Republicans, Industrials, And Tax Rumors
Republicans, Industrials, And Tax Rumors
The game works out the same way if we assign minimal positive payoffs (e.g. one point for a win, zero points for a loss), various other probability weighted payoffs (50% chance of winning), or negative payoffs for time spent out of power. In each variation a stable equilibrium emerges in which Republicans adopt Trump’s agenda and Trump runs again in 2024. Of course, if one changes the structure of the game or assigns subjective scores a different outcome can be produced. But the clearest and most logical games all produce the same outcome: Trump 2024. This view fits with the consensus in online betting markets. According to the bookies, Trump has between a 20% and 35% chance of running as the Republican nominee in 2024. The same markets give Republicans a 44%-50% chance of winning the White House that year. At this early stage we would take the “over” on Trump and the “under” on a GOP victory given the above points about the cyclical and structural factors weighing against Republicans (Chart 9). Our quantitative US election model, which produced the correct result for all states except Arizona, Georgia and Michigan in 2020, gives the Republicans a 44% chance of winning in 2024 but that number will fall sharply as the economy improves. Chart 9Trump's Odds Of Winning The Republic Nomination In 2024
Trump's Odds Of Winning The Republic Nomination In 2024
Trump's Odds Of Winning The Republic Nomination In 2024
What might change this outcome, according to game theory? Republicans could offer a powerful sweetener to convince Trump to bow out of the race and support the party’s candidate, such as letting one of his children or his son-in-law Jared Kushner run in his place. Alternately Democrats could increase the danger to Trump of their winning again, perhaps by threatening to throw him in jail. Otherwise Trump may not be sufficiently convinced of his party’s loyalty, or frightened of Democratic rule, to bow out of the race. We are never beholden to game theory and there are countless real-world ways in which the 2022-24 election outlook could change. But as things stand today, Republicans are highly likely to adopt Trump’s agenda. Trump may or may not do what is best for the party. He is unpredictable and at critical junctures over the past year he has not done so. He could start his own party just for the fun of it and in doing so break the party of Lincoln. This irrational factor creates an imbalance in the game that the Republican Party will be anxious to prevent, reinforcing its likely decision to adopt his agenda and let him seek the nomination freely. If the Republican Party does split, officially or unofficially, the Democrats will be guaranteed to expand their hold on Congress in 2022 and keep the White House in 2024. Note that Republicans would normally be heavily favored to retake the House of Representatives in 2022, though not the Senate, so such an outcome would be a political earthquake. A Democratic ascendancy could last for more than one election cycle: Republicans held the White House from 1980-92 and Democrats held it from 1932-52. Since we cannot reliably forecast Trump’s individual behavior, we cannot rule out a deep Republican rift. On the other hand, while the demographic trends point to Democratic rule out to 2036 and beyond, no Democratic ascendancy would last that long, given economic cycles, international threats, and the inevitable corruptions of single-party rule. But policy uncertainty would collapse over the 2022-24 cycle, pushing the timing of major policy change to 2026 or later. Investors would face a high probability that a sweeping Democratic agenda would be enacted, even assuming the persistence of checks and balances provided by moderate Democratic senators and the judicial branch. One clear implication is that financial markets may not evade the risk of negative regulatory and tax surprises over the long run even if they manage to do so in the FY2022 and FY2023 reconciliation bills – which we doubt. Bottom Line: Republicans cannot win the White House in 2024 without Trump’s popular base, even though they would prefer to have a fresh face capable of expanding that base. Trump cannot win without the Republican Party but he can unpredictably decide to do something other than win, i.e. endorse a Republican successor or start a third party. As a result a true Republican split cannot be ruled out. Meanwhile Republicans will have to court Trump rather than vice versa. Democratic policy is well ensconced for now, an underrated risk to the equity market. Investment Takeaways We know that Democrats are pushing forward on their legislative agenda and capable of passing one or two more budget reconciliation bills. We know that cyclical and especially structural factors will put Republicans at a disadvantage in the 2024 presidential race and possibly even the 2022 midterm. We also know that the Republican Party has a non-negligible risk of fracturing due to Trump’s personal following and unpredictability. These points suggest investors should not bet against the current policy setup. The macro backdrop favors cyclical sectors such as industrials, energy, materials, and financials. In our US Political Risk Matrix we have highlighted that the policy backdrop is especially beneficial to industrials (Appendix, Table A1). This is reinforced by ARPA and Biden’s forthcoming reconciliation bills on infrastructure and green projects, subsidies for domestic production, and simultaneous attempts to reduce trade tensions with US allies and partners – if not with China. Of course, industrials have rallied enthusiastically alongside a sharp rebound in core durable goods orders, a more gradual improvement in non-residential capital expenditures, and an environment in which capex intentions will respond to a general domestic and global upswing (Chart 10). A weak dollar, premised on a global recovery, excess liquidity, lower interest rates for longer, and large budget and trade deficits, also favors the industrial sector and reinforces the recovery in global trade and growth. Rising commodity prices are driven by supply constraints as much as global demand, as our Commodity & Energy Strategy has showed in depth, and help to restore pricing power to industrial firms (Chart 11). Chart 10Industrials Outperform On Recovery And Stimulus
Industrials Outperform On Recovery And Stimulus
Industrials Outperform On Recovery And Stimulus
Chart 11Commodity Boom Supports Industrials' Pricing Power
Commodity Boom Supports Industrials' Pricing Power
Commodity Boom Supports Industrials' Pricing Power
Hence the good news is largely priced into industrials, which are tactically overvalued according to our BCA valuation indicator. The sector looks more or less expensive on all valuation metrics other than price-to-sales (Chart 12). Therefore the best value must be sought on a relative basis, where industrials are outperforming communications services and just beginning to outperform the superstars, tech and health care. From a policy point of view, health care is one of the biggest losers of the Biden administration, which aims to expand health insurance coverage and reduce drug prices. This may be for the benefit of society but it comes at the expense of old cash cows. Investors should stay guarded against a near-term correction in industrials due to looming tax hikes but strategically favor them over health care and tech (Chart 13), which are even more vulnerable to higher taxes. We will execute this trade by going long against health care over a strategic time frame. Chart 12Industrials Overvalued On Most Measures
Industrials Overvalued On Most Measures
Industrials Overvalued On Most Measures
Chart 13Favor Industrials Over Health Care
Favor Industrials Over Health Care
Favor Industrials Over Health Care
Industrials also have a favorable profile against consumer discretionary stocks but we maintain a positive outlook on the US consumer in an era of government largesse. Our Geopolitical Strategy has also highlighted that Great Power struggle will prevent the Biden administration from cutting defense spending – another boon for industrials. Instead it will have to increase spending for defense as well as supply chain resilience and research and development in the midst of a cold war with China. Matt Gertken Vice President Geopolitical Strategy mattg@bcaresearch.com Appendix Table A1Political Risk Matrix
Republicans, Industrials, And Tax Rumors
Republicans, Industrials, And Tax Rumors
Table A2Political Capital Index
Republicans, Industrials, And Tax Rumors
Republicans, Industrials, And Tax Rumors
Table A3APolitical Capital: White House And Congress
Republicans, Industrials, And Tax Rumors
Republicans, Industrials, And Tax Rumors
Table A3BPolitical Capital: Household And Business Sentiment
Republicans, Industrials, And Tax Rumors
Republicans, Industrials, And Tax Rumors
Table A3CPolitical Capital: The Economy And Markets
Republicans, Industrials, And Tax Rumors
Republicans, Industrials, And Tax Rumors
Table A4Biden’s Cabinet Position Appointments
Republicans, Industrials, And Tax Rumors
Republicans, Industrials, And Tax Rumors
Footnotes 1 Garrett Watson and Erica York, “The American Rescue Plan Act Greatly Expands Benefits Through The Tax Code In 2021,” Tax Foundation, March 12, 2021, taxfoundation.org. 2 Committee for a Responsible Federal Budget, “American Rescue Plan Act Will Help Millions And Bolster The Economy,” March 15, 2021, cbpp.org. 3 See footnote 2 above. 4 Paul Kiernan and Catherine Lucey, “Yellen Says Biden Administration Undecided On Wealth Tax,” Wall Street Journal, wsj.com. 5 Kyle Pomerleau, “How Much Revenue Would A Wealth Tax Raise?” On The Margin, American Enterprise Institute, April 20, 2020, aei.org. 6 Jeff Stein, “Yellen pushes global minimum tax as White House eyes new spending plan,” Washington Post, March 15, 2021, washingtonpost.com. 7 Howard Schneider and Chris Kahn, “Majority of Americans favor wealth tax on very rich: Reuters/Ipsos poll,” Reuters, January 10, 2020, reuters.com; Matthew Sheffield, “New poll finds overwhelming support for an annual wealth tax,” The Hill, February 6, 2019, thehill.com. 8 A recession could have happened as a result of the cyclical slowdown from the trade war, which hurt the Midwestern swing states. The yield curve had inverted and the economy’s margin of safety was low. There would not have been any fiscal stimulus without the pandemic. 9 James Walker, “Lindsey Graham Warns Donald Trump Could ‘Destroy’ GOP After Combative CPAC Speech,” Newsweek, March 8, 2021, newsweek.com. 10 The Prisoner’s Dilemma involves two prisoners detained separately and pressured into confessing their crimes. If they both stay quiet, nothing can be proved and they only spend one year in jail. If they both confess, they are proven guilty and both spend five years in jail. If only one of them confesses while the other stays silent, the confessor goes scot free while the other spends 20 years in jail! The incentive is to confess. The equilibrium is for both to confess. The traditional game reveals the benefits of trust as well as the difficulty of maintaining it in isolation and doubt.
US Treasurys sold off on Wednesday morning, with the 10-year Treasury yield making a new intraday pandemic high and the 2/10 yield curve steepening ahead of the conclusion of the Fed meeting. The subsequent Fed message soothed the market and US equities…
Highlights The report from last week’s National People’s Congress (NPC) indicates a gradual pullback in policy support this year. Fiscal thrust will be neutral in 2021, whereas the rate of credit expansion will be slightly lower compared with last year. China’s economy should run on its own momentum in the first half, before slowing to a benign and managed rate. Nonetheless, the risk of policy overtightening is nontrivial and could threaten the cyclical outlook on China’s economy and corporate profits. The recent price correction in Chinese stocks has not yet run its course. Moreover, equity prices in both onshore and offshore markets are breaching their technical resistance. We are downgrading our tactical (0 to 3 months) and cyclical (6 to 12 months) positions on Chinese stocks to underweight relative to global benchmarks. Feature China’s budget and key economic initiatives unveiled at last week’s NPC indicate that policy tightening will be gradual this year. Overall, maintaining stability, both socially and economically, remains the focal point of Premier Li Keqiang’s work plan presented at the NPC’s annual plenary session in Beijing. However, investors have centered on the government’s plan to have a smaller policy push on growth in its budget compared with last year, fearing that economic and corporate profit rebound will disappoint. The Shanghai Composite Index dropped by 6% during the week when the NPC took place. In our view, the risks of a policy over-tightening in the next six months are high. As such, with this report we are downgrading our cyclical call on Chinese stocks to underweight within a global equity portfolio. Reading Policy Tea Leaves China's growth trajectory since the middle of 2020 has given the government comfort in staying the course on policy normalization. The question is how much Chinese policymakers are willing to pull back support for the economy this year. Overall, the central government plans a smaller policy push in this year's budget and intends to let the economy run on its own steam. Further policy reflation is not in the cards unless a relapse in the economy threatens job creation. The NPC outlined a growth target “above 6%” for 2021 and did not set a numerical goal for the 14th Five-Year Plan from 2021 to 2025. However, de-emphasizing growth does not mean China has abandoned its GDP targets (Table 1). Indeed, in most years in the past two decades, China’s expansion in GDP has overshot objectives set at the NPC (Chart 1). Our baseline estimate is that real GDP will increase by 8% in 2021. Table 12021 Economic And Policy Targets
National People’s Congress Sets Tone For 2021 Growth
National People’s Congress Sets Tone For 2021 Growth
Chart 1Actual Econ Growth Rates Have Overshot Targets In Most Years
Actual Econ Growth Rates Have Overshot Targets In Most Years
Actual Econ Growth Rates Have Overshot Targets In Most Years
We also maintain our view that the rate of credit expansion will be reduced by 2 to 3 percentage points this year to about 11% annually, which is in line with nominal GDP growth (Chart 2). On the fiscal front, the target for a budget deficit was cut by less than half percentage point compared with last year. When taking into account both the government’s budgetary and fund expenditures, the broad-measure fiscal deficit will probably be around 8% of GDP (about the same as last year), which implies there will not be any fresh fiscal thrust in 2021 (Chart 3) Chart 2Credit Growth Will Decelerate From Last Year
Credit Growth Will Decelerate From Last Year
Credit Growth Will Decelerate From Last Year
Chart 3Neutral Fiscal Thrust
Neutral Fiscal Thrust
Neutral Fiscal Thrust
The pullback in fiscal impulse is larger than in 2010, 2014, and 2017, following the previous three fiscal expansionary cycles. However, the government's eased budget deficit target this year does not mean government expenditure growth will slow. Government revenues climbed sharply by the end of 2020 and will continue to improve this year (Chart 4). Higher revenues will allow more government spending while keeping the fiscal deficit within its objectives. Chart 4Gov Revenue Is On The mend But Spending Has Yet To Pick Up
Gov Revenue Is On The mend But Spending Has Yet To Pick Up
Gov Revenue Is On The mend But Spending Has Yet To Pick Up
Chart 5A Small Reduction In ##br##LG Bond Quota
National People’s Congress Sets Tone For 2021 Growth
National People’s Congress Sets Tone For 2021 Growth
Furthermore, the quota for local government special purpose bonds was reduced by only 2% from last year. It should help to support a steady growth in China’s infrastructure investment (Chart 5). The data from January and February total social financing shows a noticeable improvement in corporate demand for bank loans, as well as the composition of bank loans. Corporate demand for medium- and long-term loans remains on a strong uptrend, which reflects an ongoing recovery in corporate profits and supports an optimistic view on capital investment in the months ahead (Chart 6). Chart 6More Demand For Longer-Term Loans Reflects Better Investment Propensity
More Demand For Longer-Term Loans Reflects Better Investment Propensity
More Demand For Longer-Term Loans Reflects Better Investment Propensity
Bottom Line: The growth and budget targets set at this year’s NPC suggest only a modest pullback in policy support. Downside Risks To The Economy Chart 7Econ Growth Usually Peaks Six To Nine Months After Credit Expansion Rate Slows
Econ Growth Usually Peaks Six To Nine Months After Credit Expansion Rate Slows
Econ Growth Usually Peaks Six To Nine Months After Credit Expansion Rate Slows
Despite a relatively dovish tone from the NPC, investors should not be complacent about the risk of a policy-tightening overshoot, which could lead to disappointing economic and profit growth this year. In most of the previous policy tightening cycles, China’s economic activities remained resilient in the first 6 to 9 months (Chart 7). One exception was 2014, when nominal GDP growth dropped sharply as soon as credit growth slowed. The reason is that Chinese authorities kept a very disciplined fiscal stance and aggressively tightened monetary policy, while allowing the RMB to soft peg to a rising USD. In other words, macroeconomic policies were too restrictive during the 2013/14 cycle. Although messages from the NPC do not suggest that Chinese authorities are on such an aggressive tightening path this year, investors should watch the following signs that could threaten China's cyclical economic health: Policymakers may keep monetary conditions too tight, by allowing the RMB to rise too fast while lifting bank lending and policy rates. Currently rates are maintained at historically low levels, much lower than in previous policy tightening cycles (Chart 8). However, the trade-weighted RMB has appreciated by 6% since its trough in July last year and has returned to its pre US-China trade war level (Chart 9). The Chairman of China’s Banking and Insurance Regulatory Commission recently signaled that bank lending rates would climb. Although we do not expect the rate to return to its 2014 or 2017 level, China is much more indebted than in previous cycles. Even a small bump in interest rates will place a burden on corporates and local governments’ debt servicing cost, dampening their propensity to invest (Chart 10). Chart 8Aggressive Rate Hikes Are ##br##Unlikely This Year
Aggressive Rate Hikes Are Unlikely This Year
Aggressive Rate Hikes Are Unlikely This Year
Chart 9Rising RMB Should Refrain Chinese Policymakers From Further Tightening Monetary Stance
Rising RMB Should Refrain Chinese Policymakers From Further Tightening Monetary Stance
Rising RMB Should Refrain Chinese Policymakers From Further Tightening Monetary Stance
Chart 10Chinese Private Sector Has Become Much More Sensitive To Rising Interest Rates
Chinese Private Sector Has Become Much More Sensitive To Rising Interest Rates
Chinese Private Sector Has Become Much More Sensitive To Rising Interest Rates
Chart 11Bank Lending To Property Sector Has Become Increasingly Restrictive
Bank Lending To Property Sector Has Become Increasingly Restrictive
Bank Lending To Property Sector Has Become Increasingly Restrictive
Policies could become too restrictive in key old-economy industries. Chinese authorities have reiterated their determination to contain price bubbles in the property sector. For the first time since 2017, bank lending to real estate developers grew at a pace far below overall bank loans and continued to trend downward in February this year (Chart 11). Moreover, household mortgage loans have reached their slowest expansion rate since 2013. At 22% of China’s total bank lending, a sharp setback in the property sector’s loan growth will be a significant drag on total credit and the economy. A worsened imbalance in supply and demand could lead to too much buildup in industrial inventory. Manufacturing inventories recovered sharply following last year’s massive stimulus and many sectors have surpassed their pre-pandemic levels (Chart 12). Strong external demand helped to boost China’s production and propensity to restock on raw materials. However, both China’s core CPI and producer prices for consumer goods remain in the doldrums, which indicates that domestic final demand has yet to fully recover (Chart 13). As discussed in last week’s report, reopening the world economy in 2H21 should benefit the service sector more than tradeable goods. China’s inventory buildup, particularly in the upstream industries, could turn excessive when export growth slows and domestic demand fails to pick up the slack. Chart 12How Far Can Chinas Inventory Restocking Cycle Go?
How Far Can Chinas Inventory Restocking Cycle Go?
How Far Can Chinas Inventory Restocking Cycle Go?
Chart 13Final Demand Remains ##br##Weak
Final Demand Remains Weak
Final Demand Remains Weak
The service sector could take longer than expected to recuperate, even though China’s domestic COVID-19 situation is under control. China’s services sector has flourished in recent years and accounted for 54% of the nation’s pre-pandemic economic output. However, about half of the service sector output is tied to real estate and financial services. Increasing pressures from tighter policy regulations targeting both the property and online financial service sectors could dampen their support to the economy more than policymakers anticipated. At the same time, wage and household income growth could remain tame by China’s standards (Chart 14). The NPC’s targeted 7% annual increase in spending for national research and development – far below the 12% annual average reached during the past five years – will not be enough to offset the slowdowns in real estate and financial services (Chart 15). Chart 14Household Income Growth Has Yet To Recover
Household Income Growth Has Yet To Recover
Household Income Growth Has Yet To Recover
Chart 15Chinas Pace Of R&D Investment Has Slowed Along With Econ Growth
Chinas Pace Of R&D Investment Has Slowed Along With Econ Growth
Chinas Pace Of R&D Investment Has Slowed Along With Econ Growth
Bottom Line: The downside risks to China’s cyclical growth trajectory are nontrivial. A tug-of-war between policy tightening and growth support will likely persist throughout this year. Investment Implications We recommend investors to underweight Chinese stocks within a global equity portfolio, in the next 0 to 9 months (Chart 16A and 16B). Chart 16AChinese Stocks Are At Their Technical Resistance
Chinese Stocks Are At Their Technical Resistance
Chinese Stocks Are At Their Technical Resistance
Chart 16BChinese Stocks Are At Their Technical Resistance
Chinese Stocks Are At Their Technical Resistance
Chinese Stocks Are At Their Technical Resistance
On January 13, we tactically downgraded Chinese stocks from overweight to neutral, anticipating that China’s equity markets are sensitive to rising expectations of policy tightening, due to higher corporate debt-servicing costs and lofty valuations. Chinese stock prices peaked in mid-February, but in our view the correction has not yet run its course. In terms of the economy, we maintain our baseline view that China's overall policy environment this year will be more accommodative than in 2017/18. The growth momentum carried over from last year's stimulus should prevent China's economy and corporate profits from slumping by too much this year. However, as policy supports are scaled back, investors will increasingly focus on the intensity of China’s domestic policy tightening and the uncertainties surrounding it. Downside risks are nontrivial and will continue to weigh on investors' sentiment. For investors that are mainly exposed to the Chinese domestic equity market, the near-term setbacks in the A-share market are taking some air out of Chinese equities' frothy valuations, and may pave the way for a more optimistic cyclical outlook beyond the next 9 to 12 months. We recommend domestic investors to stay on the sidelines for now, but will start recommending sector rotations in the next few months when opportunities arise. Jing Sima China Strategist jings@bcaresearch.com Cyclical Investment Stance Equity Sector Recommendations
BCA Research’s US Bond Strategy service concludes that the Fed will revise up its interest rate forecasts at Wednesday’s meeting; nonetheless, the new forecasts will remain more dovish than the current market pricing. The market’s fed funds rate…
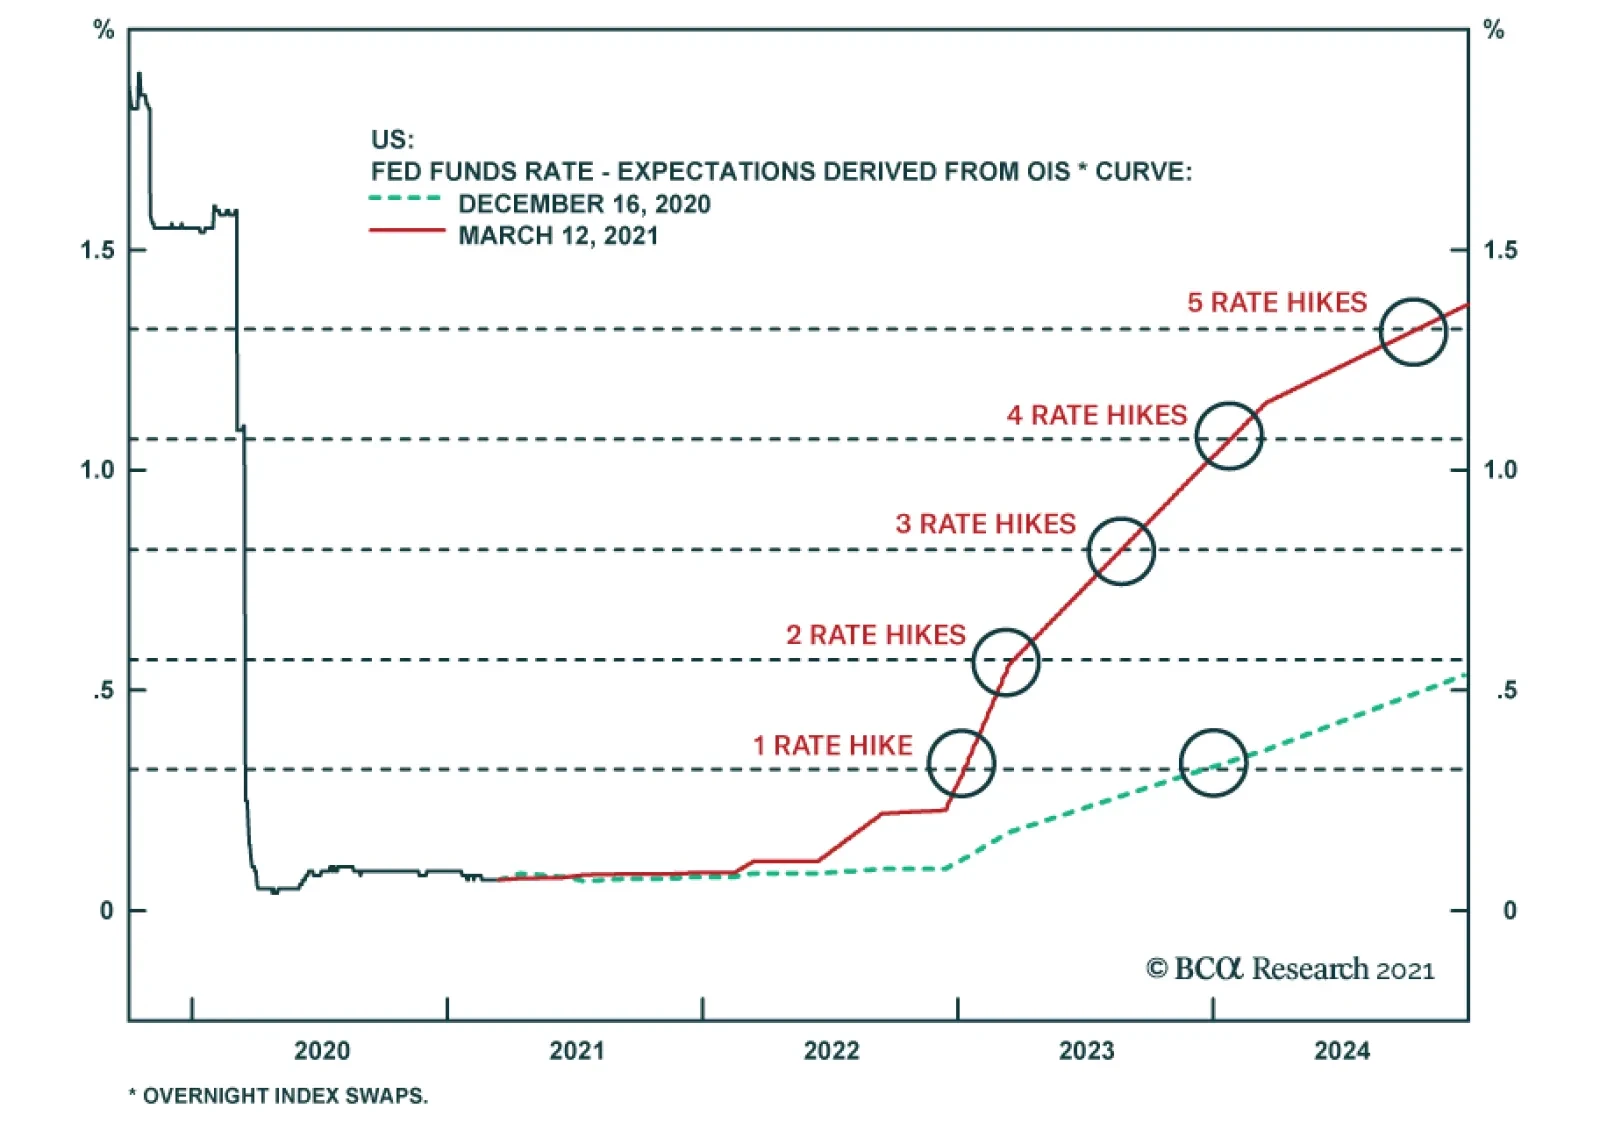
Highlights Duration: The Fed will revise up its interest rate forecasts at this week’s meeting, but the new forecasts will remain dovish compared to current market pricing. This could pressure bond yields down in the near-term. However, any downside in yields could prove temporary given that economic growth continues to beat expectations. Corporates: The macro environment of strong economic growth and accommodative monetary policy will persist for some time yet. In this environment, bond portfolio managers should minimize exposure to interest rate risk and maximize exposure to credit risk. In particular, a strategy of favoring high-yield corporate bonds over investment grade corporate bonds makes a lot of sense. Inflation & TIPS: Core inflation will be relatively strong during the remainder of 2021, with 12-month core PCE likely ending the year close to the Fed’s 2% target. Investors should remain overweight TIPS versus nominal Treasuries and continue to hold inflation curve flatteners and real yield curve steepeners. Expect Some Pushback From The Fed The continuing bond market selloff will be the top item on the agenda at this week’s FOMC meeting. Meeting participants will debate whether the sharp rise in long-maturity bond yields represents a threat to the economic recovery and Chair Powell will no doubt be peppered with questions on the topic at his post-meeting press conference, as he was when he sat down with a Wall Street Journal reporter two weeks ago.1 But for our part, we’ll be focused more on the front-end of the yield curve this week. Specifically, we’ll be looking to see whether the Fed revises up its funds rate forecasts by enough to justify current market pricing or whether it uses its forecasts to push back against the bond bears. The market’s fed funds rate expectations have moved a lot since the Fed last published its own forecasts in December (Chart 1on page 1). In December, the market was priced for fed funds liftoff in December 2023 and then only one more 25 basis point rate hike through the end of 2024. Now, the market is looking for liftoff in January 2023, followed by two more rate hikes before the end of that year. Chart 1Market Priced For 3 Rate Hikes Before The End Of 2023
Market Priced For 3 Rate Hikes Before The End Of 2023
Market Priced For 3 Rate Hikes Before The End Of 2023
As for the Fed, at last December’s meeting only 5 out of 17 FOMC participants anticipated raising rates before the end of 2023. It’s logical to expect the Fed to increase its rate expectations this week as the economic outlook is much brighter than it was at the time of the December FOMC meeting. Back in December, we still didn’t know whether the Democrats would win control of the Senate, enabling passage of President Biden’s $1.9 trillion stimulus bill. Doubts also remained about how quickly COVID vaccination would occur. Chart 2The Data Can't Disappoint
The Data Can't Disappoint
The Data Can't Disappoint
The Fed will probably respond to these pro-growth developments by revising up its interest rate expectations, but we doubt that these revisions will bridge all of the gap with the market. Employment and inflation both remain far from where the Fed would like them to be, and the Fed will want to send the message that its policy stance remains highly accommodative. We could see the Fed’s median fed funds rate forecast shifting to call for one rate hike by the end of 2023, but not the three currently priced into the yield curve. In this scenario, the Fed’s pushback could prompt some near-term downside in bond yields. The question is how long the Fed’s messaging will impact the market in the current environment of surging economic growth. The Economic Surprise Index shows that the economic data can’t even manage to disappoint expectations, a development that usually coincides with rising yields (Chart 2). Bottom Line: The Fed will revise up its interest rate forecasts at this week’s meeting, but the new forecasts will remain dovish compared to current market pricing. This could pressure bond yields down in the near-term. However, any downside in yields could prove temporary given that economic growth continues to surpass expectations. We maintain below-benchmark portfolio duration and we will continue to use our Checklist (see last week’s report)2 to determine an appropriate time to increase duration. The Spread Buffer In Corporate Credit Treasury yields troughed last August, and since then returns have been hard to come by in the US bond market. This is not too surprising. Fixed income is hardly the ideal asset class for a reflationary economic environment. However, there are steps a bond portfolio manager can take to maximize profits in an economic environment that is characterized by (i) rapid economic growth, (ii) rising inflation expectations and (iii) monetary policy that remains accommodative. Specifically, bond investors should minimize their exposure to interest rate risk (i.e. duration) and maximize exposure to credit risk. That is, shy away from long duration assets with little-to-no credit spread and favor shorter duration assets where the credit spread makes up a large proportion of the yield. This sort of strategy has worked well since the August trough in Treasury yields. The Investment Grade Corporate Bond Index – an index with relatively long duration and a small credit spread – is down 4.08% since August 4th (Chart 3). Notably the worst returns have come from the highest rated credit tiers where the credit spread makes up a smaller proportion of the yield. Notice that Aaa-rated Corporates have lost 9% while Baa-rated bonds are only down 2.52% (Table 1). In contrast, total returns from the High-Yield Index – an index with lower duration where the credit spread makes up a much larger proportion of the yield – have held up nicely. The overall index has returned 6.65% since August 4th with the lowest credit tiers once again performing best. Chart 3Move Down In ##br##Quality
Move Down In Quality
Move Down In Quality
Table 1Corporate Bond Returns Since The Aug. 4 2020 Trough In Treasury Yields
Limit Rate Risk, Load Up On Credit
Limit Rate Risk, Load Up On Credit
Performance for both the Investment Grade and High-Yield indexes improves if we look at excess returns relative to a duration-matched position in Treasury securities. That is, if we hedge out the interest rate risk and focus purely on spread movements. Though even here, we find that the lowest rated credits with the widest spreads deliver the best returns. If we assume that this reflationary economic environment persists for the next 12 months, can we expect the same low rate risk/high credit risk strategy to succeed? One way to investigate this question is to look at the 12-month breakeven yields and spreads for different segments of the corporate bond market (Table 2). The 12-month breakeven yield is the yield increase that the index can tolerate over the next 12 months before it delivers negative total returns. Similarly, the 12-month breakeven spread is the spread widening that an index can tolerate over the next 12 months before it delivers negative excess returns (where excess returns are measured versus a duration-matched position in Treasury securities). Table 2Corporate Bond 12-Month Breakeven Yields And Spreads
Limit Rate Risk, Load Up On Credit
Limit Rate Risk, Load Up On Credit
The overall Investment Grade Corporate Index, for example, has an average maturity of 12 years and a 12-month breakeven yield of 27 bps. This means that, if we assume that the investment grade corporate bond spread holds steady, then the odds of the index delivering negative total returns over the next 12 months are the same as the odds of a 12-year Treasury yield rising by more than 27 bps. An assumption of flat investment grade corporate bond spreads seems reasonable given that spreads are already historically tight (Chart 4). Moving down in quality within investment grade helps a bit, the Baa credit tier has a 12-month breakeven yield of 30 bps compared to a 12-month breakeven yield of 21 bps for the Aa credit tier. A similar benefit is observed if we look at the 12-month breakeven spread: 14 bps for Baa and only 6 bps for Aa. However, the real improvement comes when we move out of investment grade entirely and into high-yield. To calculate fair breakeven yields and spreads for high-yield bonds we need to incorporate default loss expectations. The current macro environment of strong growth and accommodative monetary policy should lead to relatively low default losses. That being the case, we assume a base case of a 2.5% default rate and 40% recovery rate for the next 12 months. Using this assumption, we calculate a 12-month breakeven yield of 75 bps for the High-Yield Index and a 12-month breakeven spread of 46 bps. This represents a significant extra buffer compared to what is offered by even the lowest investment grade credit tier. Not only that, but the 75 bps 12-month breakeven yield from the High-Yield Index looks even better when we consider that high-yield spreads are not as overvalued relative to history as investment grade spreads, and have more room to tighten as the economic recovery progresses (Chart 5). Chart 4Investment Grade Valuation
Investment Grade Valuation
Investment Grade Valuation
Chart 5High-Yield Valuation
High-Yield Valuation
High-Yield Valuation
Table 2 also presents two other default loss scenarios, and it shows that we need fairly pessimistic default loss expectations to make high-yield breakeven yields and spreads comparable to what is offered by investment grade bonds. Even if we assume a 4.5% default rate and 30% recovery rate for the next 12 months, we still get a 32 bps breakeven yield from the High-Yield Index, comparable to what we get from the Baa credit tier. Bottom Line: The macro environment of strong economic growth and accommodative monetary policy will persist for some time yet. In this environment, bond portfolio managers should minimize exposure to interest rate risk and maximize exposure to credit risk. In particular, a strategy of favoring high-yield corporate bonds over investment grade corporate bonds makes a lot of sense. Inflation & The Inverted TIPS Curve Chart 6Inflation Will Peak In April
Inflation Will Peak In April
Inflation Will Peak In April
February’s Consumer Price Index was released last week, and it showed that core CPI managed only a 0.1% increase on the month. This caught some off guard given that “rising inflation” has become a popular market narrative during the past few months. Our view is that core inflation will rise significantly between now and the end of the year, and that 12-month core PCE inflation will end the year close to the Fed’s 2% target. We arrive at this view for three reasons. First, base effects will lead to a large jump in 12-month inflation measures in March and April. Chart 6 illustrates the paths for both 12-month core PCE and core CPI assuming modest 0.15% monthly gains between now and the end of the year. Because the severely negative inflation prints from last March and April are about to fall out of the rolling 12-month sample, 12-month core inflation is on the cusp of rising to levels considerably above the Fed’s target. This means that after 12-month inflation peaks in April, the question will be how much it declines during the remainder of the year. One reason why we think it might not fall that dramatically is that bottlenecks are already emerging in both the goods and services sectors, and prices will come under upward pressure as the economy re-opens and consumers are encouraged to deploy some of the excess savings they’ve built up during the pandemic. Producer prices are currently surging, as are survey responses about price pressures from the NFIB Small Business Survey and the ISM Manufacturing and Non-Manufacturing Surveys (Chart 7). Finally, shelter is the largest component of core inflation (accounting for almost 40% of core CPI). It would be difficult for overall core inflation to rise significantly without at least some participation from shelter. With that in mind, we now see evidence that shelter inflation will soon put in a trough (Chart 8). Chart 7Price Pressures Are Building
Price Pressures Are Building
Price Pressures Are Building
Chart 8Shelter Inflation About To Bottom
Shelter Inflation About To Bottom
Shelter Inflation About To Bottom
The permanent unemployment rate and Apartment Market Tightness Index are both tightly correlated with shelter inflation. The permanent unemployment rate has stopped climbing and will move lower during the next few months as increased vaccination rates allow for more of the economy to re-open (Chart 8, panel 2). The Apartment Market Tightness Index is also well off its lows, and it will soon jump above the 50 line, joining the Sales Volume Index (Chart 8, panel 3). Consumers are also increasingly seeing signs of rental inflation. A question from the New York Fed’s Survey of Consumer Expectations showed a very sharp increase in expected rents in February (Chart 8, bottom panel). Chart 9Stay Long TIPS
Stay Long TIPS
Stay Long TIPS
As for TIPS strategy, we are hesitant to back away from our overweight TIPS/underweight nominal Treasuries position with inflation on the cusp of a such a significant move higher, especially with the 5-year/5-year forward TIPS breakeven inflation rate still below where the Fed would like it to be (Chart 9). We are also not yet willing to exit the inflation curve flattening and real yield curve steepening positions that we have been recommending since last April, even though the 5/10 TIPS breakeven inflation slope has become inverted (Chart 9, bottom panel).3 With the Fed targeting an overshoot of its 2% inflation target, an inverted inflation curve is more natural than a positively sloped one. This is because the Fed will be trying to hit its inflation target from above, rather than from below. Further, the short-end of the inflation curve is more sensitive to the actual inflation data than the long-end. This means that the curve could flatten even more as inflation rises in the coming months. Bottom Line: Core inflation will be relatively strong during the remainder of 2021, with 12-month core PCE likely ending the year close to the Fed’s 2% target. Investors should remain overweight TIPS versus nominal Treasuries and continue to hold inflation curve flatteners and real yield curve steepeners. Ryan Swift US Bond Strategist rswift@bcaresearch.com Footnotes 1 For more details on the implications of what Powell said in this interview please see US Bond Strategy Weekly Report, “No Panic From Powell”, dated March 9, 2021, available at usbs.bcaresearch.com 2 Please see US Bond Strategy Weekly Report, “No Panic From Powell”, dated March 9, 2021, available at usbs.bcaresearch.com 3 Please see US Bond Strategy Weekly Report, “Negative Oil, The Zero Lower Bound And The Fisher Equation”, dated April 28, 2020, available at usbs.bcaresearch.com Fixed Income Sector Performance Recommended Portfolio Specification
Highlights Global Duration: Markets are correctly interpreting the $1.9 trillion US fiscal stimulus package as a factor justifying higher global growth expectations and bond yields. Maintain a below-benchmark stance on overall global duration. Yield Betas & Country Allocation: Within government bond portfolios, overweighting the “lower-beta” countries that have bond yields less sensitive to changes in US yields (Germany, France, Japan) versus the higher-beta markets (Canada, Australia, UK) remains the appropriate strategy during the current bond bear market. Underweights should remain concentrated in the US, though, as it is highly unlikely that any central bank will begin to tighten policy before the Fed. UK Follow-Up: The conclusions from our UK Special Report published last week do not change after adjusting for the difference in the inflation indices used to calculate UK inflation-linked bond yields compared to those of other countries. UK real interest rates are the lowest in the developed economies, while inflation breakevens are the highest. NOTE: There will be no Global Fixed Income Strategy report published next week. Instead, BCA Chief Global Fixed Income Strategist Rob Robis will do a webcast discussing his latest thoughts on global bond markets. Yields Rising Around The World Chart of the WeekPolicy Mix Is Bond-Bearish
Policy Mix Is Bond-Bearish
Policy Mix Is Bond-Bearish
The path of least resistance for global bond yields remains biased upward. Optimism on future economic growth remains ebullient with consumer and business confidence indices surging in much of the developed world. The epicenter of the global bond bear market remains the US, where pandemic related economic restrictions are being unwound with 21.4% of the US population now having received at least one dose of a vaccine. Fiscal policy in the US is also supporting the positive vibes on future growth after the $1.9 trillion stimulus package was signed into law by President Biden last week. The 10-year US Treasury yield climbed back to the 2021 high of 1.63% on the back of that announcement. The US stimulus package changes the trajectory of the 2021 US fiscal impulse from a $0.8 trillion contraction to a $0.3 trillion expansion, according to estimates from the US Committee for a Responsible Federal Budget (Chart of the Week). This, combined with ongoing quantitative easing from global central banks eager to keep bond yields as low as possible until inflation expectations sustainably return to policymaker targets, is providing a bond-bearish lift to both inflation expectations and real yields – most notably in the US. Central bankers can try to fight back against the speed of the increase in bond yields by maintaining their commitment to current policy settings, as the European Central Bank (ECB) and Bank of Canada (BoC) did last week. The Fed, Bank of England (BoE) and Bank of Japan (BoJ) will all get the chance to do the same this at this week’s policy meetings. The likely message from all will be one of staying the course and not reflexively responding to higher bond yields, which have not triggered a broad-based selloff in global risk assets that would pre-emptively tighten financial conditions. The S&P 500 index hit an all-time high last week, while equity markets in Europe and Japan have returned to pre-pandemic levels (Chart 2). Global corporate credit spreads have remained calm, consistent with a positive growth backdrop that diminishes the potential for credit downgrades and defaults. The US dollar has gotten a lift from improving US growth expectations and relatively higher US Treasury yields, which has had some negative spillover effect into emerging market equities and currencies. The dollar rebound has been relatively modest to date, however, with the DXY index up only 3% from the early 2021 lows. A major reason why global equity and credit markets have absorbed higher bond yields so well is because the sheer scope of the new US fiscal stimulus will have a major impact on growth momentum both in the US and outside the US. This comes on top of the boost to optimism from the speed of the US and UK vaccine rollouts. In an update to its December 2020 economic outlook published last week, the OECD estimated that the $1.9 trillion US stimulus will boost US real GDP growth by 3.8 percentage points versus its original forecast over the next year (Chart 3). Other countries will also benefit from the implied surge in US demand spilling over from that stimulus package, with the OECD projecting a 1.1 percentage point increase to world real GDP growth. Chart 2Risk Assets Ignoring Rising Global Bond Yields
Risk Assets Ignoring Rising Global Bond Yields
Risk Assets Ignoring Rising Global Bond Yields
Chart 3Big Growth Spillovers From US Fiscal Stimulus
Harder, Better, Faster, Stronger
Harder, Better, Faster, Stronger
Countries that have the greater exposure to US demand, like Canada and Mexico, are expected to benefit a bit more than the rest of the world, but the expected boost to growth is consistent (around one half of a percentage point) from China to Europe to Japan to major emerging market countries like Brazil. That US-fueled pickup in global economic activity will help absorb some of the spare capacity that opened up during the COVID-19 pandemic. In Chart 4 and Chart 5, we show the estimates taken from the December 2020 OECD Economic Outlook for the output gaps in the US, euro area, UK, Japan, Canada and Australia for 2021 and 2022. We adjust those projections by the OECD’s estimate of the impact of the US fiscal stimulus in 2021, as well as by the additional upward revisions to the OECD growth projections in 2021 and 2022 that were published last week. Chart 4The $1.9 Trillion Stimulus Will Close The US Output Gap …
Harder, Better, Faster, Stronger
Harder, Better, Faster, Stronger
Chart 5… And Help Narrow Output Gaps Elsewhere
Harder, Better, Faster, Stronger
Harder, Better, Faster, Stronger
Chart 6Maintain Below-Benchmark Duration
Maintain Below-Benchmark Duration
Maintain Below-Benchmark Duration
The conclusion is that the US output gap will be eliminated in 2022, while output gaps will still be negative, but diminished, in the other countries after factoring in the impact of the latest US fiscal package. This suggests that the maximum upward pressure on global bond yields should still be centered in the US, where inflation pressures will be more evident and the Fed will likely begin signaling a shift to a less dovish stance sooner than other central banks (although not likely until much later in 2021). Our Global Duration Indicator continues to flag pressure for higher bond yields ahead for the major developed economies (Chart 6). The improving growth momentum means that rising real yields should increasingly become the more important driver of higher nominal bond yields. Persistent central bank dovishness in the face of that growth surge, however, means that it is still too soon to position for narrowing global inflation expectations or any bearish flattening of government bond yield curves - even in the US. Bottom Line: Markets are correctly interpreting the $1.9 trillion US fiscal stimulus package as a factor justifying higher global growth expectations and bond yields. Maintain a below-benchmark stance on overall global duration. Using Yield Betas For Bond Country Allocation, One More Time Over the past two months, we have published Special Reports that delved into the outlook for bond yields and currencies in Australia, Canada and the UK. We selected those three countries as they represented the most likely downgrade candidates within our recommended government bond country allocation given their status as “higher beta” bond markets that are more correlated to US Treasury yields. We estimate US Treasury yield betas from a rolling regression (over a three-year window) of changes in 10-year non-US government bond yields to changes in 10-year US Treasury yields (Chart 7). This allows us to assess which markets are more or less sensitive to the ups and downs of US bond yields. We have used this framework to help guide our country allocation strategy during the pandemic and, for the most part, it has been successful. Chart 7Government Bond Yield Sensitivities To USTs Are Shifting Fast
Government Bond Yield Sensitivities To USTs Are Shifting Fast
Government Bond Yield Sensitivities To USTs Are Shifting Fast
So far in 2021, the markets with higher US Treasury yield betas (Canada, Australia and New Zealand) have underperformed the lower beta markets (Germany, France and Japan). We show that in the top panel of Chart 8, which plots the yield betas at the start of the year versus the year-to-date relative return of each country’s government bond market to that of the overall Bloomberg Barclays Global Treasury index. The returns are adjusted to reflect any differences in the durations of each country versus that of the overall index, and are shown in USD-hedged terms to allow for a common currency comparison. The bottom panel of Chart 8 shows the same relationship for the all of 2020. This is a mirror image of what has occurred so far in 2021, with the countries with higher yield betas outperforming the lower beta markets. The obvious difference between the two years is the direction of Treasury yields, which fell in 2020 and have been rising this year. So far in 2020, the differences between the returns of the higher beta markets have been quite similar. New Zealand has had the biggest negative performance (-2.8% versus the global benchmark), but this has only been moderately worse than Australia (-2.6%) and Canada (-2.4%). These are all just slightly worse than the return of US Treasuries relative to the Global Treasury index (-2.3%). Our estimated yield betas have changed rapidly over the past few months. For example, the rolling three-year yield beta of Australia has shot up from 0.61 at the beginning of the year to 0.78, while Canada has seen a similar move (0.81 to 0.88). This reflects the rapid repricing of interest rate expectations in both countries as current growth momentum and growth expectations improve. While not a perfect relationship, yield betas do show some correlation to our Central Bank Monitors – designed to measure the pressure on central banks to tighten of ease monetary policy (Chart 9). The latest increases in the yield betas of Australia, New Zealand and Canada have occurred alongside a rising trend in our Central Bank Monitors for each nation. The implication is that the relative underperformance of government bonds in those countries is related to the cyclical pressure for the RBA, RBNZ and BoC to tighten monetary policy. Chart 8An Intuitive Link Between Yield Betas & Bond Market Performance
Harder, Better, Faster, Stronger
Harder, Better, Faster, Stronger
Chart 9Cyclical Pressures & Yield Betas Are Linked
Cyclical Pressures & Yield Betas Are Linked
Cyclical Pressures & Yield Betas Are Linked
At the same time, the yield betas of government bonds in Germany and the UK have remained low despite the cyclical upturn in our ECB and BoE Monitors. The lingering impact of COVID-19 lockdowns on economic growth and inflation in the euro area and UK is likely weighing on bond yields in both regions. This limits any challenge to the dovish forward guidance of the ECB and BoE, in contrast to the repricing of interest rate expectations seen in other countries. The market-implied path of policy interest rates extracted from OIS forward curves does show a much more aggressive expected path of policy rates in the higher beta markets versus the lower beta markets (Chart 10). Chart 10More Rate Hikes Expected In The Higher Yield Beta Countries
Harder, Better, Faster, Stronger
Harder, Better, Faster, Stronger
The “liftoff” date for each central bank shown, representing when the first full interest rate hike is priced into the OIS forwards, is shown in Table 1. We rank the countries in the table by the amount of time until the discounted liftoff date, from shortest to longest. The first rate hike is expected in New Zealand in June 2022, with the BoC expected to lift rates in Canada two months later. The market is not pricing a full rate hike by the Fed until January 2023, while liftoff in the UK and Australia are expected during the summer of 2023. Table 1The "Pecking Order" Of Global Liftoff
Harder, Better, Faster, Stronger
Harder, Better, Faster, Stronger
We treat the countries with perpetually low interest rates, the euro area and Japan, differently in Table 1, as both the ECB and BoJ would most likely move slowly if and when they ever decided to raise rates again. Thus, we define liftoff as only a 10bp increase in policy interest rates for those two regions, while for all the other central banks we assume the size of the first rate hike will be 25bps. On that reduced basis, the market is priced for “liftoff” by the ECB and BoJ in September 2023 and February 2025, respectively. In terms of that “order of liftoff” shown in Table 1, we generally agree with current market pricing except for New Zealand and Canada. We fully expect the Fed to be the first central bank to begin signaling the path towards monetary policy normalization, largely due to the impact of the fiscal stimulus, starting with a move to begin tapering the Fed’s asset purchases at the start of 2022. The Fed will also be the first to begin rate hikes after tapering. We do not anticipate the BoC or Reserve Bank of New Zealand (RBNZ) to make any hawkish moves (reduced asset purchases or rate hikes) before the Fed does the same, as this would put unwanted appreciation pressures on the New Zealand and Canadian dollars. We expect the BoC and RBNZ to move soon after the Fed begins to shift, followed by the BoE and RBA a bit later after that in line with the current liftoff ordering. The pace of rate hikes after liftoff also appears to be a bit too aggressively priced in the countries with higher yield betas. The cumulative amount of interest rate increases to the end of 2024 currently priced in OIS curves is larger in Canada (175bps) and Australia (156bps) than the US (139bps) and New Zealand (140bps). The relative differences are not huge, however, but we think the odds favor the Fed delivering the greater amount of rate hikes over the next three years. More generally, when looking at what is more important for each central bank in determining the timing of liftoff, we can boil it down to a couple of the most important measures for the higher beta countries (Chart 11): US: The Fed will continue to focus on both inflation expectations and broad measures of labor market utilization before signaling any policy shift. On that basis, there is still some way to go before TIPS breakevens return to the 2.3-2.5% level we believe to be consistent with the Fed sustainably hitting its 2% inflation goal on the PCE deflator. Also, there is still a lot of ground to cover before the US labor market fully returns to pre-pandemic health, as the employment/population ratio is four percentage points below the pre-COVID peak. New Zealand: The RBNZ is now under a lot more pressure to tighten policy after the New Zealand government changed the central bank’s remit to include stabilizing house prices, which have soured to unaffordable levels that have exacerbated income inequality. With house prices now rising at a 19% annual rate, the highest since 2004, the RBNZ will be under pressure to hike sooner, although any associated rise in the New Zealand dollar will likely be of equal concern. Canada: The BoC has been very candid that its current policy mix of aggressive asset purchases and 0% policy rates will be altered if the Canadian economy improves. We believe that the current trends of booming house price inflation, recovering business investment prospects and a rapidly recovering labor market will all make the BoC more willing to signal tighter monetary policy fairly soon after the Fed does the same. Australia: The RBA is likely to continue surprising bond markets with its dovishness in the face of a rapidly recovering economy, given underwhelming inflation. In a recent speech, RBA Governor Philip Lowe noted that Australian inflation will not return to the RBA’s 2-3% target band without wage growth rising from the current 1.4% pace up to 3%. The RBA does not expect the labor market to tighten enough to generate that kind of wage growth until at least 2024, suggesting no eagerness to begin normalizing monetary policy. Among the lower-beta markets, the most important things that will dictate future policy moves are the following (Chart 12): Chart 11What To Watch In The Higher Yield Beta Countries
What To Watch In The Higher Yield Beta Countries
What To Watch In The Higher Yield Beta Countries
Chart 12What To Watch In The Lower Yield Beta Countries
What To Watch In The Lower Yield Beta Countries
What To Watch In The Lower Yield Beta Countries
UK: The BoE’s current focus is on how fast the UK economy recovers from the pandemic shock, with inflation expectations remaining elevated (see the next section of this report). The degree of strength in business investment and consumer spending will thus dictate the timing of any BoE shift to a less accommodative policy stance. Euro Area: The latest set of ECB projections call for inflation to only reach 1.4% by 2023. As long as inflation (both realized and expected) stays well below the 2% ECB target, the central bank will focus more on supporting easy financial conditions (lower corporate bond yields, tighter Italy-Germany yield spreads and resisting euro currency strength). Japan: Inflation continues to underwhelm in Japan, and the BoJ is a long way from contemplating any tightening measures. Summing it all up, we still see value in using yield betas to dictate our recommended fixed income country allocations. Although these should be complemented with assessments of the relative likelihood of central banks moving before others to further refine country allocations. Bottom Line: Within government bond portfolios, overweighting the “lower-beta” countries that have bond yields less sensitive to changes in US yields (Germany, France, Japan) versus the higher-beta markets (Canada, Australia, UK) remains the appropriate strategy during the current bond bear market. Underweights should remain concentrated in the US, though, as it is highly unlikely that any central bank will begin to tighten policy before the Fed. A Brief Follow-Up To Our UK Special Report In our Special Report on the UK published last week, we noted that the UK had the lowest real bond yields and highest inflation expectations among the developed market countries with inflation-linked bonds.1 Some astute clients pointed out that we neglected to discuss how the UK inflation-linked bonds are priced off the UK Retail Price Index (RPI) which typically runs with a faster inflation rate than the UK Consumer Price Index (CPI). This creates a downward bias to UK real yields in comparison to other countries that use domestic CPI indices in inflation-linked bond pricing. We did not ignore the RPI-CPI differential in our report, we just did not think it to be relevant to the conclusions of our report. The UK still has the lowest real rates and highest inflation expectations even after adjusting both by the RPI-CPI gap (Chart 13). Furthermore, survey-based measures of UK inflation expectations are broadly in line with the RPI-based inflation breakevens, confirming the message from the RPI-based real yields and inflation expectations. Chart 13UK Real Yields Are Too Low, Using RPI Or CPI
UK Real Yields Are Too Low, Using RPI Or CPI
UK Real Yields Are Too Low, Using RPI Or CPI
Looking ahead, the RPI-CPI gap is likely to stay in a much narrower range compared to its longer run history. Chart 14A Less Active BoE Has Narrowed The RPI-CPI Gap
A Less Active BoE Has Narrowed The RPI-CPI Gap
A Less Active BoE Has Narrowed The RPI-CPI Gap
For example, between 2000 and 2007, the RPI-CPI gap averaged a full percentage point but with very large fluctuations (Chart 14). This is because mortgage interest costs are included in the RPI but are not part of the CPI. Thus, RPI inflation tends to be more volatile when the BoE is more active in adjusting interest rates. After the 2008 financial crisis, the BoE has kept policy rates at very low levels with very few changes. The RPI-CPI gap has narrowed as a result, averaging only one-half of a percentage point between 2009 to today. Thus, our conclusion on UK bond yields remains the same – Gilt yields are too low and are likely to rise further over the next 6-12 months. Robert Robis, CFA Chief Fixed Income Strategist rrobis@bcaresearch.com Footnotes 1 Please see BCA Research Global Fixed Income Strategy/Foreign Exchange Strategy Special Report, "Why Are UK Interest Rates Still So Low?",dated March 10, 2021, available at gfis.bcaresearch.com and fes.bcaresearch.com. Recommendations The GFIS Recommended Portfolio Vs. The Custom Benchmark Index
Harder, Better, Faster, Stronger
Harder, Better, Faster, Stronger
Duration Regional Allocation Spread Product Tactical Trades Yields & Returns Global Bond Yields Historical Returns
Highlights With the vaccination campaign in full gear and plenty of fiscal support in the pipeline, investors have swung from worrying that the US economy will grow too slowly to worrying that it will grow too fast. Thanks to the latest stimulus bill, US households will have $2 trillion in excess savings at their disposal by April. This money will seep into the economy as lockdown measures end. There is still scope for US interest rate expectations to rise beyond 2023. However, the Fed is unlikely to raise rates in the next two years even if the economy does begin to overheat. This should keep rate expectations at the short end of the curve well anchored near zero, allowing the curve to further steepen. Investors should continue to overweight equities on a 12-month horizon. Historically, stocks have been able to shrug off rising bond yields, provided borrowing costs did not rise so high as to tip the economy into recession. A faster start to the vaccination campaign in the US and accommodative fiscal policy should support the dollar over the next few months. Nevertheless, the greenback will still decline modestly over a 12-month horizon. Too Hot For Comfort? With the vaccination campaign in full gear and plenty of fiscal support in the pipeline, investors have swung from worrying that the US economy will grow too slowly to worrying that it will grow too fast. Chart 1 illustrates these concerns in a nutshell. Point A on the aggregate demand schedule corresponds to a situation where the economy is operating below capacity and interest rates are stuck at zero. An outward shift in the demand curve from AD1 to AD2 would eliminate the output gap without necessitating higher interest rates (Point B). Such an outcome would be good news for equity investors because it would lead to more output and increased corporate profits without any tightening in monetary policy. Chart 1Where Will Fiscal And Monetary Policy Take Us?
When Good News Becomes Bad News In One Chart
When Good News Becomes Bad News In One Chart
If the demand curve were to shift further out to AD3, however, the Fed might be forced to take away the punch bowl. The result would be higher interest rates rather than higher output (Point C). This would be bad news for equity investors. Two Questions Analyzing the current debate about where bond yields are going through the lens of this simple chart, two questions arise: How likely is the US economy to run out of excess capacity over the next few quarters? How would the Fed respond to evidence that the US economy is overheating? On the first question, the honest answer is that no one knows. According to the Congressional Budget Office, the output gap stood at 3% of GDP in the fourth quarter of 2020. The true number is probably closer to 5% of GDP since the CBO implausibly assumes that GDP was 1% above potential prior to the pandemic. As of February, payroll employment was down 5.3% from its pre-pandemic level, suggesting that there is still a fair amount of slack in the economy. Employment had fallen even more among low-income workers, women, and certain ethnic minority groups – an important consideration given the Fed’s heightened focus on “inclusive growth” (Chart 2). Chart 2Some Have Suffered More Job Losses Than Others
When Good News Becomes Bad News In One Chart
When Good News Becomes Bad News In One Chart
Slack Will Shrink Chart 3Lower Spending And Higher Income Led To Mounting Excess Savings
Lower Spending And Higher Income Led To Mounting Excess Savings
Lower Spending And Higher Income Led To Mounting Excess Savings
US households were sitting on around $1.7 trillion in excess savings as of the end of January. Households generated about two-thirds of those excess savings by cutting back on spending during the pandemic, with the remaining one-third stemming from increased transfer payments (Chart 3). We estimate that the stimulus bill that President Biden signed into law earlier today will boost household savings by an additional $300 billion, bringing the stock of excess savings to $2 trillion by April. As lockdown measures ease, it is reasonable to assume that households will spend a portion of this cash cushion. Unlike President Trump’s Tax Cuts and Jobs Act, Biden’s American Rescue Plan Act will raise the incomes of the poor much more than the rich (Chart 4). Since the poor tend to spend a greater share of each dollar of disposable income than the rich, aggregate demand could rise meaningfully. Chart 4Biden’s Package Will Boost The Income Of The Poor
When Good News Becomes Bad News In One Chart
When Good News Becomes Bad News In One Chart
Meanwhile, the supply side of the economy could face a temporary setback. Under the legislation, about 40% of jobless workers will receive more income from extended unemployment benefits than they did from working. While these additional benefits will expire in early September, they could temporarily curtail labor supply at a time when firms are trying to step up the pace of hiring. Putting it all together, there is a high probability that the US economy will heat up this summer, stoking fears of higher inflation. Door C, D, Or E? For investors, how the Fed reacts to any potential overheating will be critical. If the market prices in an earlier liftoff date for the fed funds rate, the economy will move towards Point C. However, there is another possibility: Rather than fretting about an overheated economy, the Fed could welcome it, stressing its commitment to maintain very easy monetary policy. In that case, the economy would find itself closer to Point D. In fact, Point D could turn out to be a waystation to Point E. An overheated economy could lift inflation. In the absence of any rate hikes, real interest rates would fall. Lower real rates would further stoke spending, causing the aggregate demand curve to shift to AD4. What point will the US end up reaching? As we discuss below, our guess is “eventually Point C,” but with a temporary detour towards Points D/E. The Long-Term Case For C Chart 5Real Yields Have Recovered But Are Still Low
Real Yields Have Recovered But Are Still Low
Real Yields Have Recovered But Are Still Low
The 5-year/5-year forward US TIPS yield currently stands at 0.18%. This is well above the trough of -0.84% reached last August, but still below the average of 0.7% that prevailed in 2017-19 (Chart 5). One can make a case that real bond yields will eventually rise above where they were before the pandemic. Even though the US budget deficit will decline next year due to the expiration of most stimulus measures, fiscal policy will remain looser than it was for most of the post-GFC period. Notably, BCA’s geopolitical strategists expect Congress to pass a $4 trillion 10-year infrastructure bill by this fall, only half of which will be financed through tax hikes. They also anticipate increased spending on health care and other social programs. Chronically easier fiscal policy will lift the neutral rate of interest. Recall that the neutral rate – also known as the “equilibrium rate” – is simply the interest rate that equalizes aggregate demand with aggregate supply. To the extent that looser fiscal policy raises aggregate demand, a higher interest rate will be necessary to bring aggregate demand back down so that it matches aggregate supply. Temporary Detour Towards D/E That journey to higher real bond yields is likely to be prolonged, however. As noted above, the Fed has no desire to validate market expectations of tighter monetary policy anytime soon. Chart 6 shows that yields rarely rise significantly when the Fed is on hold. Chart 6Treasurys Tend To Underperform When The Fed Delivers Hawkish Surprises
When Good News Becomes Bad News In One Chart
When Good News Becomes Bad News In One Chart
Currently, investors expect the Fed to start hiking rates in November 2022, with a second rate hike delivered in May 2023, and a third in November 2023 (Chart 7). This is considerably more hawkish than the Fed’s own forecast from December, which called for no rate hikes until at least 2024. Chart 7The Market Expects Liftoff In Late 2022
The Market Expects Liftoff in Late 2022
The Market Expects Liftoff in Late 2022
While the Fed is likely to bring forward its dots during this month’s FOMC meeting, our US bond strategists still expect the revised dots to signal a later liftoff than what the market is pricing in. On balance, we expect the 10-year Treasury yield to finish the year at about 1.7% – broadly in line with market expectations – but to rise more than expected over a longer-term horizon of 2-to-5 years. Is Inflation A Short-Term Or Long-Term Risk? A sizeable gap has opened up between US 5-year and 10-year inflation breakevens (Chart 8). Investors believe that inflation will accelerate over the next few years but then settle down to a lower level by the middle of the decade. We think the opposite is more likely to transpire. Economies can often operate above potential for a while before inflation expectations become unmoored. For example, in the 1960s, the unemployment rate spent over two years below NAIRU before inflation finally burst onto the scene. However, as the sixties also revealed, when inflation does rise, it can rise quickly. Core CPI inflation doubled within the span of nine months in 1966. Inflation continued rising all the way to 6% in 1969 (Chart 9). Chart 8Breakeven Curve Inversion
Breakeven Curve Inversion
Breakeven Curve Inversion
Chart 9Inflation Started Accelerating Quickly Only When Unemployment Reached Very Low Levels In The 1960s
When Good News Becomes Bad News In One Chart
When Good News Becomes Bad News In One Chart
As we discussed in February, there are numerous similarities between the present environment and the mid-1960s. This suggests that inflation could surprise significantly to the upside in the middle of the decade, even if it is slow to get off the ground over the next few years. Remain Overweight Stocks Over A 12-Month Horizon Stocks usually rise when growth is strong and monetary policy is accommodative (Chart 10). While bond yields in the US and most other economies will trend higher, they will remain below their equilibrium level for at least the next two years. Chart 10Stocks Do Well When The Economy Does Well
Stocks Do Well When The Economy Does Well
Stocks Do Well When The Economy Does Well
In fact, fiscal largesse may have boosted the US neutral rate of interest by more than bond yields have risen, implying that monetary policy has become more, not less, stimulative over the past few months. Historically, stocks have been able to shrug off rising bond yields, provided borrowing costs did not rise so high as to tip the economy into recession (Chart 11 and Table 1). Chart 11What Happens To Equities When Treasury Yields Rise?
What Happens To Equities When Treasury Yields Rise?
What Happens To Equities When Treasury Yields Rise?
Table 1As Long As Bond Yields Don't Rise Into Restrictive Territory, Stocks Will Recover
When Good News Becomes Bad News In One Chart
When Good News Becomes Bad News In One Chart
Mixed Picture For The US Dollar The OECD estimates that GDP in the rest of the world will receive a modest lift from US fiscal stimulus (Chart 12). Nevertheless, the US economy will be the primary beneficiary. This has important implications for the direction of the dollar. Chart 12The Benefits Of US Fiscal Stimulus Will Spill Over To Other Countries
When Good News Becomes Bad News In One Chart
When Good News Becomes Bad News In One Chart
The dollar is normally a countercyclical currency, meaning that it tends to move in the opposite direction of the global business cycle. One key reason for this is that the US economy, with its relatively small manufacturing base and large service sector, is less cyclical than most other economies. Thus, when global growth rises, the US often lags behind. The pattern has been different this year, however. Chart 13 shows that growth expectations have risen more in the US than abroad. This is partly because US fiscal policy has been more stimulative than elsewhere. In addition, the US has been faster out of the gate in vaccinating its population (Chart 14). Chart 13US Growth Outperformance Could Be A Near-Term Tailwind For The Dollar
US Growth Outperformance Could Be A Near-Term Tailwind For The Dollar
US Growth Outperformance Could Be A Near-Term Tailwind For The Dollar
US growth outperformance should support the greenback over the next few months. Nevertheless, we are not ready to abandon our bearish 12-month dollar view. For one thing, growth revisions should shift back in favor of other developed economies later this year as they catch up to the US in their vaccination campaigns. The prospect of negative fiscal thrust in 2022 due to the expiration of various stimulus measures will also weigh on the US growth outlook. Lastly, the Fed’s reticence to signal a tighter monetary stance will prevent US 2-year real yields – which are already quite low compared to other developed markets – from rising very much (Chart 15). We have found that shorter-dated yields help explain currency movements better than longer-dated yields. Chart 14US Is Among The Vaccination Leaders
US Is Among The Vaccination Leaders
US Is Among The Vaccination Leaders
Chart 15Real Rate Differentials Are A Headwind For The Dollar
Real Rate Differentials Are A Headwind For The Dollar
Real Rate Differentials Are A Headwind For The Dollar
A modestly softer dollar should, in turn, support cyclical equity sectors and value stocks over the next 12 months. Peter Berezin Chief Global Strategist pberezin@bcaresearch.com Global Investment Strategy View Matrix
When Good News Becomes Bad News In One Chart
When Good News Becomes Bad News In One Chart
Special Trade Recommendations
When Good News Becomes Bad News In One Chart
When Good News Becomes Bad News In One Chart
Current MacroQuant Model Scores
When Good News Becomes Bad News In One Chart
When Good News Becomes Bad News In One Chart
Highlights The Biden administration’s early actions suggest it will be hawkish on China as expected – and the giant Microsoft hack merely confirms the difficulty of reducing strategic tensions. US-China talks are set to resume and piecemeal engagement is possible. However, most of the areas of engagement touted in the media are overrated. Competition will prevail over cooperation. Cybersecurity stocks have corrected, creating an entry point for investors seeking exposure to a secular theme of Great Power conflict in the cyber realm and beyond. Global defense stocks are even more attractive than cyberstocks as a “back to work” trade in the geopolitical context. Continue to build up safe-haven hedges as geopolitical risk remains structurally elevated and underrated by financial markets. Feature The Biden administration passed its first major law, the $1.9 trillion American Rescue Plan, on March 10. This gargantuan infusion of fiscal stimulus accounts for about 2% of global GDP and 9% of US GDP, a tailwind for risky assets when taken with a receding pandemic and normalizing global economy. The US dollar has perked up so far this year on the back of this extraordinary pump-priming and the rapid rollout of COVID-19 vaccines, which have lifted relative growth expectations with the rest of the world. Hence the dollar is rising for fundamentally positive reasons that will benefit global growth rather than choke it off. Our Foreign Exchange Strategist Chester Ntonifor argues that the dollar has 2-3% of additional upside before relapsing under the weight of rising global growth, inflation expectations, commodity prices, and relative equity flows into international markets. We agree with the dollar bear market thesis. But there are two geopolitical risks that investors must monitor: Cyclically, China’s combined monetary and fiscal stimulus is peaking, growth will decelerate, and the central government runs a non-negligible risk of overtightening policy. However, China’s National People’s Congress so far confirms our view that Beijing will not overtighten. Structurally, the US-China cold war is continuing apace under President Biden, as expected. The two sides are engaging in normal diplomacy as appropriate to a new US administration but the Microsoft Exchange hack (see below) underscores the trend of confrontation over cooperation. Chart 1Long JPY / Short KRW As Geopolitical Risk Is Underrated
Long JPY / Short KRW As Geopolitical Risk Is Underrated
Long JPY / Short KRW As Geopolitical Risk Is Underrated
The second point reinforces the first since persistent US pressure on China will discourage it from excessive deleveraging at home. In a world where China is struggling to cap excessive leverage, the US is pursuing “extreme competition” with China (Biden’s words), and yet the US rule of law is intact, global investors will not abandon the US dollar in a general panic and loss of confidence. They will, however, continue to diversify away from the dollar on a cyclical basis given that global growth will accelerate while US policy will remain extremely accommodative. Reinforcing the point, geopolitical frictions are rising even outside the US-China conflict. A temporary drop in risk occurred in the New Year as a result of the rollout of vaccines, the defeat of President Trump, and the resolution of Brexit. But going forward, geopolitical risk will reaccelerate, with various implications that we highlight in this report. While we would not call an early end to the dollar bounce, we will keep in place our tactical long JPY-USD and long CHF-USD hedges. These currencies offer a good hedge in the context of a dollar bear market and structurally high geopolitical risk. If the dollar weakens anew on good news for global growth then the yen and franc will benefit on a relative basis as they are cheap, whereas if geopolitical risk explodes they will benefit as safe havens. We also recommend going long the Japanese yen relative to the South Korean won given the disparity in valuations highlighted by our Emerging Markets team, and the fact that geopolitical tensions center on the US and China (Chart 1). “Our Most Serious Competitor, China” Why are we so sure that geopolitical risk will remain structurally elevated and deliver negative surprises to ebullient equity markets? Our Geopolitical Power Index shows that China’s rise and Russia’s resurgence are disruptive to the US-led global order (Chart 2). If anything this process has accelerated over the COVID-19 crisis. China and Russia have authoritarian control over their societies and are implementing mercantilist and autarkic economic policies. They are carving out spheres of influence in their regions and using asymmetric warfare against the US and its allies. They have also created a de facto alliance in their shared interest in undermining the unity of the West. The US is meanwhile attempting to build an alliance of democracies against them, heightening their insecurities about America’s power and unpredictability (Chart 3). Chart 2Great Power Struggle Continues
Great Power Struggle Continues
Great Power Struggle Continues
Massive fiscal and monetary stimulus is positive for economic growth and corporate earnings but it reduces the barriers to geopolitical conflict. Nations can pursue foreign and trade policies in their self-interest with less concern about the blowback from rivals if they are fueled up with artificially stimulated domestic demand. Chart 3Biden: ‘Our Most Serious Competitor, China’
More Reasons To Buy Cybersecurity And Defense Stocks
More Reasons To Buy Cybersecurity And Defense Stocks
Total trade between the US and China, at 3.2% and 4.7% of GDP respectively in 2018, was not enough to prevent trade war from erupting. Today the cost of trade frictions is even lower. The US has passed 25.4% of GDP in fiscal stimulus so far since January 1, 2020. China’s total fiscal-and-credit impulse has risen by 8.4% of GDP over the same time period. The Biden administration is co-opting Trump’s hawkish foreign and trade policy toward China, judging by its initial statements and actions (Appendix Table 1). Specifically, Biden has issued an executive order on securing domestic supply chains that demonstrates his commitment to the Trumpian goal of diversifying away from China and on-shoring production, or at least offshoring to allied nations. The Democratic Party is also unveiling bipartisan legislation in Congress that attempts to reduce reliance on China.1 These executive decrees are partly spurred on by the global shortage of semiconductors. China, the US, and the US’s allies are all attempting to build alternative semiconductor supply chains that bypass Taiwan, a critical bottleneck in the production of the most advanced computer chips. The Taiwanese say they will coordinate with “like-minded economies” to alleviate shortages, by which they mean fellow democracies. But this exposes Taiwan to greater geopolitical risk insofar as it excludes mainland China from supplies, either due to rationing or American export controls. The surge in semiconductor sales and share prices of semi companies (especially materials and equipment makers) will continue as countries will need a constant supply of ever more advanced chips to feed into the new innovation and technology race, the renewable energy race, and the buildout of 5G networks and beyond (Chart 4). It takes huge investments of time and capital to build alternative fabrication plants and supply lines yet governments are only beginning to put their muscle into it via stimulus packages and industrial policy. Chart 4Semiconductor Supply Shortage
Semiconductor Supply Shortage
Semiconductor Supply Shortage
Supply shocks have geopolitical consequences. The oil shocks of the 1970s and early 1990s motivated the US to escalate its interventions and involvement in the Middle East. They also motivated the US to invest in stockpiles of critical goods and alternative sources of production so as to reduce dependency (Chart 5). Although semiconductors are not fungible like commodities, and the US has tremendous advantages in semiconductor design and production, nevertheless the bottleneck in Taiwan will take years to alleviate. Hence the US will become more active in supply security at home and more active in alliance-building in Asia Pacific to deter China from taking Taiwan by force or denying regional access to the US and its allies. China faces the same bottleneck, which threatens its technological advance, economic productivity, and ultimately its political stability and international defense. Chart 5ASupply Shortages Motivate Strategic Investments
Supply Shortages Motivate Strategic Investments
Supply Shortages Motivate Strategic Investments
Chart 5BSupply Shortages Motivate Strategic Investments
Supply Shortages Motivate Strategic Investments
Supply Shortages Motivate Strategic Investments
Semiconductor and semi equipment stock prices have gone vertical as highlighted above but one way to envision the surge in global growth and capex for chip makers is to compare these stocks relative to the shares of Big Tech companies in the communication service sector, i.e. those involved in social networking and entertainment, such as Twitter, Facebook, and Netflix. On a relative basis the semi stocks can outperform these interactive media firms which face a combination of negative shocks from rising interest rates, regulation, economic normalization, and ideologically fueled competition (Chart 6). Chart 6Long Chips Versus Big Tech
Long Chips Versus Big Tech
Long Chips Versus Big Tech
What about the potential for the US and China to enhance cooperation in areas of shared interest? Generally the opportunity for re-engagement is overrated. The Biden administration says there will be engagement where possible. The first high-level talks will occur in Alaska on March 18-19 between Secretary of State Antony Blinken, National Security Adviser Jake Sullivan, Central Foreign Affairs Commissioner Yang Jiechi, and Foreign Minister Wang Yi. Presidents Biden and Xi Jinping may hold a bilateral summit sometime soon and the old strategic and economic dialogue may resume, enabling cabinet-level officials to explore a range of areas for cooperation independently of high-stakes strategic negotiations. However, a close look at the policy areas targeted for engagement reveals important limitations: Health: There is little room for concrete cooperation on the COVID-19 pandemic given that the pandemic is already receding, the Chinese have not satisfied American demands for data transparency, Chinese officials have fanned theories that the virus originated in the US, and the US is taking measures to move pharmaceutical and health equipment supply chains out of China. Trade: Trade is an area of potential cooperation given that the two countries will continue trading while their economies rebound. The Phase One trade deal remains in place. However, China only made structural concessions on agriculture in this deal so any additional structural changes will have to be the subject of extensive negotiations. Secretary of Treasury Janet Yellen says the US will use the “full array of tools” to ensure compliance and will punish China for abuses of the global trade system. Cybersecurity: On cybersecurity, China greeted the Biden administration by hacking the Microsoft Exchange email system, an even larger event than Russia’s SolarWinds hack last year. Both hacks highlight how cyberspace is a major arena of modern Great Power struggle, making it unlikely that there will be effective cooperation. The hack suggests Beijing remains more concerned about accessing technology while it can than reducing tensions. The Americans will make demands of China at the Alaska meetings. Environment: As for the environment, the US is a net oil exporter while China imports 73% of its oil, 42% of its natural gas and 7.8% of its coal consumption, with 40% and 10% of its oil and gas coming from the Middle East. The US wants to be at the cutting edge of renewable energy technology but it has nowhere near the impetus of China (or Europe), which are diversifying away from fossil fuels for the sake of national security. Moreover China will want its own companies, not American, to meet its renewable needs. This is true even if there is success in reducing barriers for green trade, since the whole point of diversifying from Middle Eastern oil supplies is strategic self-sufficiency. The Americans would have to accept less energy self-sufficiency and greater renewable dependence on China. Nuclear Proliferation: Cooperation can occur here as the Biden administration will seek to return to a deal with the Iranians restraining their nuclear ambitions while maintaining a diplomatic limiting North Korea’s nuclear weapons stockpile and ballistic missile development. China and Russia will accept the US rejoining the 2015 Iranian nuclear deal but they will require significant concessions if they are to join the US in forcing anything more substantial on the Iranians. China may enforce sanctions on North Korea but then it will expect concessions on trade and technology that the Biden administration will not want to give merely for the sake of North Korea. Bottom Line: The Biden administration’s China strategy is taking shape and it is hawkish as expected. It is not ultra-hawkish, however, as the key characteristic is that it is a defensive posture in the wake of the perceived failures of Trump’s strategy of “attack, attack, attack.” This means largely maintaining the leverage that Trump built for the US while shifting the focus to actions that the US can take to improve its domestic production, supply chain resilience, and coordination with allied producers. Punitive measures are an option, however, and if relations deteriorate over time, as expected, they will be increasingly relied on. Buy The Dip In Cybersecurity Stocks A linchpin of the above analysis is the Microsoft Exchange hack, which some have called the largest hack in US history, since it confirms the view that the Biden administration will not be able to de-escalate strategic tensions with China much. China has been particularly frantic to acquire technology through hacking and cyber-espionage over the past decade as it attempts to achieve a Great Leap Forward in productivity in light of slowing potential growth that threatens single-party rule over the long run. The breakdown in ties between Presidents Barack Obama and Xi Jinping occurred not only because of Xi’s perceived violation of a personal pledge not to militarize the South China Sea but also because of the failure of a cybersecurity cooperation deal between the two. When the Trump administration arrived on the scene it sought to increase pressure on China and cybersecurity was immediately identified as an area where pushback was long overdue. Cyber conflict is highly likely to persist, not only with Russia but also with China. Cyber operations are a way for states to engage in Great Power struggle while still managing the level of tensions and avoiding a military conflict in the real world. The cyber realm is a realm of anarchy in which states are insecure about their capabilities and are constantly testing opponents’ defenses and their own offensive capabilities. They can also act to undermine each other with plausible deniability in the cyber realm, since multiple state and quasi-state actors and a vast criminal underworld make it difficult to identify culprits with confidence. Revisionist states like China, North Korea, Russia, and Iran have an advantage in asymmetric warfare, including cyber, since it enables them to undermine the US and West without putting their weaker conventional forces in jeopardy. Cybersecurity stocks have corrected but the general up-trend is well established and fully justified (Chart 7). It is not clear, however, that investors should favor cybersecurity stocks over the general NASDAQ index (Chart 8). The trend has been sideways in recent years and is trying to form a bottom. Cybersecurity stocks are volatile, as can be seen compared to tech stocks as a whole, and in both cases the general trend is for rising volatility as the macro backdrop shifts in favor of higher interest rates and inflation expectations (Chart 9). Chart 7Cyber Security Stocks Corrected
Cyber Security Stocks Corrected
Cyber Security Stocks Corrected
Chart 8Major Hacks Failed To Boost Cyber Vs NASDAQ
Major Hacks Failed To Boost Cyber Vs NASDAQ
Major Hacks Failed To Boost Cyber Vs NASDAQ
Chart 9Volatility Of Cyber & Tech Stocks Rising
Volatility Of Cyber & Tech Stocks Rising
Volatility Of Cyber & Tech Stocks Rising
Great Power struggle will not remain limited to the cyber realm. There is a fundamental problem of military insecurity plaguing the world’s major powers. Furthermore the global economic upturn and new energy and industrial innovation race will drive up commodity prices, which will in turn reactivate territorial and maritime disputes. Turf battles will re-escalate in the South and East China Seas, the Persian Gulf and Indian Ocean basin, the Mediterranean, and even the Baltic Sea and Arctic. One way to play this shift is as a geopolitical “back to work” trade – long defense stocks relative to cybersecurity stocks (Chart 10). The global defense sector saw a run-up in demand, capital expenditures, and profits late in the last business cycle. That all came crashing down with the pandemic, which supercharged cybersecurity as a necessary corollary to the swarm of online activity as households hunkered down to avoid the virus and obey government social restrictions. Cybersecurity stocks have higher EV/EBITDA ratios and lower profit margins and return on equity compared to defense stocks or the broad market. Chart 10Long Defense / Short Cyber Security: 'Back To Work' For Geopolitics
Long Defense / Short Cyber Security: 'Back To Work' For Geopolitics
Long Defense / Short Cyber Security: 'Back To Work' For Geopolitics
The trade does not mean cybersecurity stocks will fall in absolute terms – we maintain our bullish case for cybersecurity stocks – but merely that defense stocks will make relative gains as economic normalization continues in the context of Great Power struggle. Bottom Line: Structurally elevated geopolitical risks will continue to drive demand for cybersecurity in absolute terms. However, we would favor global defense stocks on a relative basis. The US Is Not As War-Weary As People Think America is consumed with domestic divisions and distractions. Since 2008 Washington has repeatedly demonstrated an unwillingness to confront foreign rivals over small territorial conquests. This risk aversion has created power vacuums, inviting ambitious regional powers like China, Russia, Iran, and Turkey to act assertively in their immediate neighborhoods. However, the US is not embracing isolationism. Public opinion polling shows Americans are still committed to an active role in global affairs (Chart 11). The 2020 election confirms that verdict. Nor are Americans demanding big cuts in defense spending. Only 31% of Americans think defense spending is “too much” and only 12% think the national defense is stronger than it needs to be (Chart 12). Chart 11No Isolationism Here
No Isolationism Here
No Isolationism Here
True, the Democratic Party is much more inclined to cut defense spending than the Republicans. About 43% of Democrats demand cuts, while 32% are complacent about the current level of spending (compared to 8% and 44% for Republicans). But it is primarily the progressive wing of the party that seeks outright cuts and the progressives are not the ones who took power. Chart 12Americans Against ‘Forever Wars’ But Not Truly Dovish
More Reasons To Buy Cybersecurity And Defense Stocks
More Reasons To Buy Cybersecurity And Defense Stocks
Biden and his cabinet represent the Washington establishment, including the military-industrial complex. Even if Vice President Kamala Harris should become president she would, if anything, need to prove her hawkish credentials. Defense spending cuts might be projected nominally in Biden’s presidential budgets but they will not muster majorities in the two narrowly divided chambers of Congress. Biden has co-opted Trump’s (and Obama’s) message of strategic withdrawal and military drawdown. He is targeting a date of withdrawal from Afghanistan on May 1, notwithstanding the leverage that a military presence there could yield in its priority negotiations with Iran. Yet he is not jeopardizing the American troop presence in Germany and South Korea, much more geopolitically consequential spheres of action in a long competition with Russia and China. While it is true (and widely known) that Americans have turned against “forever wars,” this really means Middle Eastern quagmires like Iraq and Afghanistan and does not mean that the American public or political establishment have truly become anti-war “doves.” The US public recognizes the need to counter China and Russia and Congress will continue appropriating funds for defense as well as for industrial policy. The Biden administration will increase awareness about the risks of a lack of deterrence and alliance-building. This is especially apparent given the military buildup in China. The annual legislative session has revealed an important increase in military focus in Beijing in the context of the US rivalry. Previously, in the thirteenth five-year plan and the nineteenth National Party Congress, the People’s Liberation Army aimed to achieve “informatization and mechanization” reforms by 2020 and total modernization by 2035. However, at the fifth plenum of the central committee in October, the central government introduced a new military goal for the PLA’s 100th anniversary in 2027 – a “military centennial goal” to match with the 2021 centennial of the Communist Party and the 2049 centennial goal of the founding of the People’s Republic. While details about this new military centenary are lacking, the obvious implication is that the Communist Party and PLA are continuing to shift the focus to “fighting and winning wars,” particularly in the context of the need to deter the United States. The official defense budget is supposed to grow 6.8% in 2021, only slightly higher than the 6.6% goal in 2020, but observers have long known that China’s military budget could be as much as twice as high as official statistics indicate. The point is that defense spending is going up, as one would expect, in the context of persistent US-China tensions. Bottom Line: Just as US-China cooperation will be hindered by mutual efforts to reduce supply chain dependency and support domestic demand, so too it will be hindered by mutual efforts to increase defense readiness and capability in the event of military conflict. The beneficiary of continued high levels of US defense spending and Chinese spending increases – in the context of a more general global arms buildup – will be global arms makers. Investment Takeaways Geopolitical risk remains structurally elevated despite the temporary drop in tensions in late 2020 and early 2021. The China-backed Microsoft Exchange hack reinforces the Biden administration’s initial foreign policy comments and actions suggesting that US policy will remain hawkish on China. While Biden will adopt a more defensive rather than offensive strategy relative to Trump, there is no chance that he will return to the status quo ante. The Obama administration itself grew more hawkish on China in 2015-16 in the face of cyber threats and strategic tensions in the South China Sea. Cybersecurity stocks will continue to benefit from secular demand in an era of Great Power competition where nations use cyberattacks as a form of asymmetric warfare and a means of minimizing the risks of conflict. The recent correction in cybersecurity stocks creates a good entry point. We closed our earlier trade in January for a gain of 31% but have remained thematically bullish and recommend going long in absolute terms. We would favor defense over cybersecurity stocks as a geopolitical version of the “back to work” trade in which conventional economic activity revives, including geopolitical competition for territory, resources, and strategic security. Defense stocks are undervalued and relative share prices are unlikely to fall to 2010-era lows given the structural increase in geopolitical risk (Chart 13). Chart 13Global Defense Stocks Oversold
Global Defense Stocks Oversold
Global Defense Stocks Oversold
Chart 14Global Defense Stocks Profitable, Less Indebted
Global Defense Stocks Profitable, Less Indebted
Global Defense Stocks Profitable, Less Indebted
Defense stocks have seen profit margins hold up and are not too heavily burdened by debt relative to the broad market (Chart 14). Defense stocks have a higher return on equity than the average for non-financial corporations and cash flow will improve as a new capex cycle begins in which nations seek to improve their security and gain access to territory and resources (Chart 15). Chart 15Defense Stocks: High RoE, Capex Will Revive
Defense Stocks: High RoE, Capex Will Revive
Defense Stocks: High RoE, Capex Will Revive
Chart 16Discount On Global Defense Stocks
Discount On Global Defense Stocks
Discount On Global Defense Stocks
Valuation metrics show that global defense stocks are trading at a discount (Chart 16). Matt Gertken Vice President Geopolitical Strategy mattg@bcaresearch.com Appendix Table 1 Appendix Table 1Biden Administration's First 100 Days: Key Statements And Actions On China
More Reasons To Buy Cybersecurity And Defense Stocks
More Reasons To Buy Cybersecurity And Defense Stocks
Footnotes 1 See Federal Register, "America’s Supply Chains", Mar. 1, 2021, federalregister.gov and Richard Cowan and Alexandra Alper, "Top U.S. Senate Democrat directs lawmakers to craft bill to counter China", Feb. 23, 2021, reuters.com.
Please note that we will be presenting a webcast on Thursday March 11 at 10:00 AM EST for the Americas and EMEA regions and on March 12 at 9:00 HKT/12:00 AEDT for APAC clients. We will be discussing macro themes and investment strategies. Highlights EMs (ex-China, Korea and Taiwan) are better positioned to handle higher US bond yields today than they were in 2013. Yet better does not mean they will be unscathed. The combination of rising US bond yields and a firming US currency will suffocate EM risk assets in the near-term. A neutral allocation is warranted in EM stocks and credit markets within global equity and credit portfolios, respectively. Feature Ever since the US elections concluded in January with a Blue Sweep, we have been warning that rising US bond yields could trigger a setback in global markets in general, and in EM markets in particular. EM equities, currencies and fixed-income markets have recently experienced a correction (Chart 1). The question now is: Is the market rout over? Or is there more to come? We are inclined to believe that the correction is not over. Rising US Treasury yields have been the culprit of the shakeout in global growth stocks, EM equities, as well as EM currencies. Therefore, taking a stance on US bond yields and on the US dollar is critical for assessing the outlook for EM financial markets. Odds are that the selloff in US long-term bonds and the rebound in the US dollar are not yet over because: Positioning and sentiment on US long-dated Treasuries is neutral, as illustrated in Chart 2. Chart 1Rising US Real Yields Have Caused A Shakeout In EM
Rising US Real Yields Have Caused A Shakeout In EM
Rising US Real Yields Have Caused A Shakeout In EM
Chart 2Investor Sentiment And Positioning In US Treasurys Are Neutral
Investor Sentiment And Positioning In US Treasurys Are Neutral
Investor Sentiment And Positioning In US Treasurys Are Neutral
Typically, US bond yields do not reverse their ascent until investor sentiment becomes downbeat and bond portfolios are of materially short duration. These conditions for a top in bond yields are not yet present. US government bond yields would have been much higher if it were not for the Federal Reserve and US commercial banks’ massive bond-buying spree. The Fed has bought $2.8 trillion and US commercial banks have purchased about $300 billion of Treasurys in the past 12 months (Chart 3). One of the main motives for commercial banks to buy US Treasurys has been the SLR relief initiative which commenced on April 1, 2020.1 This SLR relief is due to terminate on March 31, 2021. Unless it is extended, commercial banks will drastically curtail their net government bond purchases. This will exert upward pressure on Treasury yields. Regarding the greenback, investor sentiment remains quite bearish (Chart 4). From a contrarian perspective, this heralds further strength in the US dollar. Chart 3Surging Purchases Of US Treasurys By The Fed And Commercial Banks
Surging Purchases Of US Treasurys By The Fed And Commercial Banks
Surging Purchases Of US Treasurys By The Fed And Commercial Banks
Chart 4Investors Are Still Bearish On The US Dollar
Investors Are Still Bearish On The US Dollar
Investors Are Still Bearish On The US Dollar
From a cyclical perspective, US growth will be stronger relative to its potential, and vis-à-vis other DMs, EMs and China. Growth differentials moving in favor of the US foreshadows near-term strengthening of the dollar. Structurally, the bearish case for the US currency hinges on both the Federal Reserve falling behind the inflation curve and ballooning US twin deficits. In our view, this will ultimately be the case. Hence, the long-term outlook for the US dollar remains troublesome. That said, twin deficits alone are insufficient to produce a continuous currency depreciation. The twin deficits must also be accompanied with low/falling real interest rates – in order to generate sufficient conditions for currency depreciation. As long as US real rates continue rising, the dollar’s rebound will be extended. The USD/EUR exchange rate has been correlated with the 10-year real yield differential and this relationship will persist (Chart 5). Bottom Line: US government bonds will continue selling off. Rising bond yields (including rising real yields) will support the dollar in the near-term. The combination of rising US bond yields and a firming US currency will cause global macro volatility to rise (Chart 6). This will suffocate EM risk assets and EM currencies. Chart 5US Real Yields (TIPS) Will Continue Driving The US Dollar
US Real Yields (TIPS) Will Continue Driving The US Dollar
US Real Yields (TIPS) Will Continue Driving The US Dollar
Chart 6Aggregate Financial Market Volatility: Higher Lows
Aggregate Financial Market Volatility: Higher Lows
Aggregate Financial Market Volatility: Higher Lows
Impact On EM: 2013 Versus Now Are we entering another Taper Tantrum episode as in the spring of 2013 when many EMs were devastated? There are both similarities and differences between the current period of rising US bond yields and the 2013 episode. Similarities: Today, as in early 2013, investor sentiment on EM is very bullish and investors are long EM (Chart 7). Chart 7Investor Sentiment On EM Stocks Was At A Record High In January
Investor Sentiment On EM Stocks Was At A Record High In January
Investor Sentiment On EM Stocks Was At A Record High In January
In early 2013, as is the case today, EM local currency bond yields were very low and EM credit spreads were too tight. When US Treasury yields spiked in the spring of 2013, EM assets tanked. Many commentators blamed it on the Fed. We disagree with that interpretation. Remarkably, the rise in US TIPS yields in 2013 had little impact on equity indices such as the S&P 500 and Nasdaq, or on US corporate spreads (Chart 8). The correction in the US equity market lasted about a week. Yet, EM equities, fixed income markets and currencies experienced a prolonged slump, and in many cases, a bear market. There is no basis to believe that the Fed’s policy and US bond yields are more important to EM than they are to US credit and equity markets. The core rationale for the EM bear market in 2013 was poor domestic fundamentals. The Fed’s tapering was the trigger, not the cause. Differences: The key difference between the current episode and the 2013 Taper Tantrum is EM macro fundamentals. Specifically: EM economies (ex-China, Korea and Taiwan) entered 2013 with booming bank loans and strong domestic demand as well as high inflation (Chart 9). Chart 8US Markets Were Not Hit By The Taper Tantrum In 2013
US Markets Were Not Hit By The Taper Tantrum In 2013
US Markets Were Not Hit By The Taper Tantrum In 2013
Chart 9EM (ex-China, Korea And Taiwan): 2013 Vs Now
EM (ex-China, Korea and Taiwan): 2013 Vs Now
EM (ex-China, Korea and Taiwan): 2013 Vs Now
Chart 10EM (ex-China, Korea And Taiwan): 2013 Vs Now
EM (ex-China, Korea and Taiwan): 2013 Vs Now
EM (ex-China, Korea and Taiwan): 2013 Vs Now
Presently, EM bank credit is subdued, domestic demand is dismal, and inflation is tame. Besides, EMs (ex-China, Korea and Taiwan) had a very large trade deficits in 2013 and were financing them via foreign borrowing, which was roaring prior to 2013 (Chart 10). Presently, their trade balances are in surplus and foreign indebtedness has not increased in recent years. Bottom Line: In 2013, EM economies (ex-China, Korea and Taiwan) were overheating and were addicted to foreign funding. These were the reasons why EM currencies and fixed income markets teetered when US bond yields spiked in 2013. Presently, the majority of EM economies (ex-China, Korea and Taiwan) have different types of malaises: domestic bank loan origination is too timid, consumer spending and capital expenditures are moribund, inflation is low and fiscal policy is tight. Consequently, EMs (ex-China, Korea and Taiwan) are better positioned to handle higher US bond yields today than they were back in 2013. Yet better does not mean they will be unscathed. Investment Strategy Equities: The key variable to watch to assess the vulnerability of both US and EM equity markets is their respective corporate bond yields. Historically, rising corporate bond yields (shown inverted in both panels of Chart 11) heralds lower share prices. Chart 11Rising Corporate Bond Yields Are Bad For Share Prices
Rising Corporate Bond Yields Are Bad For Share Prices
Rising Corporate Bond Yields Are Bad For Share Prices
Given that both EM and US corporate credit spreads are too tight, they are unlikely to narrow further to offset rising US Treasury yields. Instead, EM and US corporate bond yields are likely to rise with US Treasury yields. This will trigger more weakness in share prices. Besides, rising EM local currency government bond yields also point towards more downside in EM equities (yields are shown inverted on the chart) (Chart 12). Chart 12Rising EM Local Currency Bond Yields Heralds Weaker Equity Prices
Rising EM Local Currency Bond Yields Heralds Weaker Equity Prices
Rising EM Local Currency Bond Yields Heralds Weaker Equity Prices
Concerning equity style, global growth stocks have peaked versus global value stocks. In the EM equity space, we have less conviction on growth versus value. As to regional allocation in a global equity portfolio, we continue recommending a neutral allocation to EM, underweighting US and overweighting Europe and Japan. Commodities: Investors’ net long positions in commodities are very elevated (Chart 13). As US bond yields rise and the US dollar continues rebounding, there will be a de-risking in the commodities space resulting in a pullback in commodities prices. Currencies: We continue shorting a basket of EM currencies – including BRL, CLP, ZAR, TRY and KRW versus the euro, CHF and JPY. Several EM currencies have failed to break above their technical resistance levels, suggesting that a pullback could be non-trivial (Chart 14). Chart 13Investors Are Record Long Commodities
Investors Are Record Long Commodities
Investors Are Record Long Commodities
Chart 14Asian Currencies Hit Technical Resistances
Asian Currencies Hit Technical Resistances
Asian Currencies Hit Technical Resistances
In central Europe, we are closing the long CZK/short USD trade with a 3.8% gain. Continue holding the long CZK/short PLN and HUF position. Local fixed income markets: EM local bond yields have risen in response to rising US treasury real yields and the setback in EM currencies. This might persist in the near-term, but we continue to recommend receiving 10-year swap rates in selected countries where inflation risks are low and monetary and fiscal policies are tight. These countries include Mexico, Colombia, Russia, China, India and Malaysia. A further rise in their swap rates would represent an overshoot and hence, should not be chased. EM currencies are more vulnerable to a selloff than local rates are. We continue to wait for a better entry point in currencies to recommend buying cash domestic bonds instead of receiving swap rates. EM Credit: A neutral allocation to EM sovereign and corporate bonds is warranted in a global credit portfolio. Our sovereign credit overweights are Mexico, Russia, Malaysia, Peru, Colombia, the Philippines and Indonesia, while our sovereign credit underweights are Brazil, South Africa and Turkey. Arthur Budaghyan Chief Emerging Markets Strategist arthurb@bcaresearch.com Footnotes 1 The Supplementary Leverage Ratio (SLR) is equivalent to Basel III Tier-1 leverage ratio and varies from 3-5% for US banks. Under the relief program last April, the Fed allowed US banks to exclude holdings of US Treasury Bonds and cash kept in reserves at the Fed from their assets when calculating this ratio. The SLR relief is planned to end March 31, 2021. Equities Recommendations Currencies, Credit And Fixed-Income Recommendations