Policy

Highlights Every year we review our best and worst calls – both in terms of geopolitics and markets. This year our geopolitical forecasting and strategic market recommendations performed well, given the COVID-19 shock, but our tactical trades often went awry. We correctly forecast the presidency, Senate, Democratic nomination, and impeachment outcome. We anticipated “stimulus hiccups” but expected them to be resolved by November 3. The Georgia runoff on January 5 presents a 30% risk to our Senate prediction. In the main, we were right on Chinese politics, EU politics, US-Iran tensions, and Russian politics. US-China tensions kept rising, as expected, but the market ignored it. We missed the Saudi-Russia cartel break-up in Q1. The jury is still out on Brexit. Strategically, we got the big market moves right, but we were too risk-averse during the summer and after the election. Stay long cyber-security stocks in general, but close the pair trade versus Big Tech. Close the 10-year Treasury hedge. Feature Chart 1The Black Swan
The Black Swan
The Black Swan
The COVID-19 pandemic took investors by surprise, defined the year 2020, and caused the shortest bear market in history, lasting 33 days (Chart 1). On the whole this year’s crisis illustrates how geopolitical analysis is not primarily concerned with “black swan” events, which are inherently unpredictable. Rather the wholly unexpected pandemic reinforced several of our pre-existing geopolitical themes and trends: de-globalization, American sociopolitical instability, European integration, and US-China conflict. This year our geopolitical forecasting and strategic market recommendations performed well, given the COVID-19 shock, but our tactical trades often went awry. Whether these and other trends will continue in 2021 will be the subject of our strategic outlook due next week. This week we offer our annual report card, which reviews our best and worst calls for the year with a desire to hold ourselves accountable to clients, learn investment lessons from mistakes, and hone our geopolitical method of analysis. Successful Strategy, Debatable Tactics Overall our performance this year was good. Specifically, our political forecasting was on target and our investment recommendations got the big moves correct. But our risk-averse tactical trades were less successful. In last year’s annual outlook, “2020 Key Views: The Anarchic Society,” our main investment recommendation was long gold – based on sky-high geopolitical risk and a shift toward reflationary policy by the Federal Reserve, China, and the European Union (Chart 2). We maintain this trade today, despite its losing some altitude recently, as we expect to see low real rates, reflationary global policy, and rising inflation expectations. Geopolitical risk will also remain elevated despite dropping off from recent peaks, and not only during President Trump’s “lame duck” final days in office. We sounded the alarm for clients in our January 24 report, “Market Hurdles: From Sanders To Iran,” warning that global equities and risk appetite would suffer “in the very near term” due to conventional political risks as well as the new coronavirus, which we feared would explode as a result of Chinese New Year. In retrospect we were not bearish enough even in these reports. In our March 27 report, “No Depression,” we advised that the extraordinary monetary and fiscal response to the crisis would reflate the global economy and thus went long Brent crude oil. From this point onward we gradually added risk to our strategic portfolio, including by going long global equities relative to bonds in June (Chart 3). Chart 2Gold Paid Off When Black Swan Arose
Gold Paid Off When Black Swan Arose
Gold Paid Off When Black Swan Arose
Of course, despite getting these big moves right, we abandoned several of our strategic recommendations during the crisis and some of our tactical trades went awry throughout the year. Chart 3When Crisis Hits, Buy Risk Assets!
When Crisis Hits, Buy Risk Assets!
When Crisis Hits, Buy Risk Assets!
Our Worst Calls Of 2020 We chose a very bad time, last December, to bet heavily on global equity rotation from growth to value and away from tech sector leadership. US equities and tech stocks surged ahead of global equities on the back of the pandemic. Our long energy / short tech trade proved disastrous. Only now, with a vaccine on the horizon, are these recommendations coming to fruition. On the other hand, we should have remained committed to our long EUR-USD position rather than cutting it short when the crisis erupted (Chart 4). Global stimulus and the Fed’s sharp reduction in interest rates and gigantic infusion of US dollar liquidity ensured that the dollar would plummet. Strategically, we got the big market moves right, but we were too risk-averse during the summer and after the election. In some cases our geopolitical forecast proved dead-on while our market recommendation faltered. One of biggest geopolitical forecasts, in September 2019, was that the US and China could well conclude a trade deal but that it would be extremely limited in scope and strategic tensions would continue to rise dangerously. This prediction has proved accurate, judging by US high-tech export controls and China’s suppression of Hong Kong this year. But we misjudged the market response, particularly after China contained the virus: the renminbi saw a tremendous rally this year while we remained short, suffering a 4.96% loss so far (Chart 5). Chart 4Stick With Your Guns...Even Amidst Crisis
Stick With Your Guns...Even Amidst Crisis
Stick With Your Guns...Even Amidst Crisis
Chart 5US-China Tensions Persisted, But The Market Didn't Care
US-China Tensions Persisted, But The Market Didn't Care
US-China Tensions Persisted, But The Market Didn't Care
Along these lines, President-elect Joe Biden’s statement that he will maintain President Trump’s tariffs is another confirmation of one of our most contrarian views over the past year.1 We would expect the People’s Bank to allow the yuan to slip both to deal with lingering deflationary pressures and to build up some poker chips for the coming negotiations with Biden. We also would expect the US dollar to witness a near-term tactical bounce. However, if we are wrong, our short CNY-USD trade will fall further and we will have to cut our losses. Chart 6You Can't Time The Market
You Can't Time The Market
You Can't Time The Market
Other mistakes occurred when solid economic and political views combined with bad market timing. Our long position in cyber-security stocks is well grounded – we remain invested – but once again we jumped the gun on the rotation away from Big Tech, which constituted the short end of two of our pair trades, now closed. Separately, we coupled our long gold bet with a long silver bet that came far too late into the rally – though we remain strategically optimistic on silver due to its industrial uses, which should revive in the post-pandemic context. Lamentably, we ran up against our stop-loss threshold on our structural position in US aerospace and defense stocks not long before the vaccine announcement would have begun the arduous process of recuperating losses (Chart 6). We have reinitiated the latter trade, albeit in global defense stocks rather than just American. The inverse also occurred, in which our political forecasting proved faulty but our market implications worked out quite well. One of our biggest political forecasting failures stemmed from an initial success. Beginning in May, we signaled that the US Congress would experience “stimulus hiccups” in trying to pass additional fiscal relief for the economy. This view proved prescient as negotiations fell through in July and a range of benefits expired. Real rates began to recuperate at this time. The problem is that we also predicted that the fiscal impasse was merely a hiccup, i.e. would be resolved prior to the election. It remains unresolved to this day. Fortunately, our market recommendation – to go long US municipal bonds relative to duration-matched treasuries – was rooted in the principle of “buy what the Fed is buying” and therefore continued to appreciate, along with our similarly justified position in investment grade bonds (Chart 7). Chart 7Stimulus Hiccup Occurred, But Was Not Resolved
Stimulus Hiccup Occurred, But Was Not Resolved
Stimulus Hiccup Occurred, But Was Not Resolved
Our biggest error of political forecasting was the collapse of OPEC 2.0 at the beginning of the year. We signaled to clients in January that Russia was growing internally unstable and that this would result in an external action that would prove market-negative. This was correct, but we failed to anticipate that the most important consequence would be a temporary Russian rejection of Saudi demands for oil production cuts. Still, we advised clients to stay the course, arguing that the Russians and Saudis were geopolitically constrained and would return to their cartel, which proved to be the case, thus hastening the restoration of balance to oil markets. This view supported our long spot oil recommendation in late March, though the idea that US producers might collaborate proved fanciful. Alternatively we suggested that clients go long oil relative to gold, which has performed well. Other mistakes stemmed from our tactical trades. Generally, we were insufficiently bullish both during the summer and after the US election. In both cases we overemphasized the absence of US fiscal stimulus as a risk to the rally. In reality the first stimulus was sufficient and the V-shaped recovery of the private economy reduced the need for additional support over the course of the year. Our long tactical positions in US treasuries, consumer staples, and JPY-EUR did not pan out. The takeaway going forward, given that the market is not pressuring politicians to act, is that the risk of another congressional fiscal failure prior to Christmas is underrated. Lastly, some minor emerging market trades went awry, such as our long positions in Thai and Malay equities and our shorting the South African rand. We wrongly predicted that Michelle Obama would be Joe Biden’s pick for vice president, when in fact that honor went to Senator Kamala Harris. Our Best Calls Of 2020 While we got the big market moves right in 2020, our best calls were political and geopolitical in nature: Joe Biden won the US election. He won through his ability to win back blue-collar workers and compete in the Sun Belt as well as the Rust Belt, which we outlined as a key geographic strength during his run in the Democratic primary election (Map 1). We downgraded Trump from 55% odds of re-election to 35% in March, when the lockdowns occurred, and we upgraded Trump only to 45% in October when he rallied. The thin margins in the swing states confirmed this higher-than-consensus probability of a Trump win. Map 1Joe Biden Won The Rust Belt And The Sun Belt
Geopolitical Report Card: 2020
Geopolitical Report Card: 2020
Republicans retained the Senate. Beginning in late September, we saw that President Trump was rallying and that this would increase the odds of a Republican Senate even if Trump himself fell short. On October 16 we signaled that the Senate was too close to call, and on October 30 we upgraded the GOP again and argued that a Democratic White House plus a Republican Senate was the most likely scenario (Chart 8). There is a lingering risk to this view: a double Democratic victory in the Georgia runoffs on January 5, 2021. But we put the odds of that at 30% at best. Chart 8Republicans Held The Senate (Pending Georgia Runoffs)
Geopolitical Report Card: 2020
Geopolitical Report Card: 2020
Chart 9Biden Won The Democratic Primary Nomination
Geopolitical Report Card: 2020
Geopolitical Report Card: 2020
Biden won the Democratic nomination, which we first highlighted in November 2018 and June 2019 and consistently thereafter, though we never underrated his challengers (Chart 9). Trump was acquitted of impeachment charges, which seems like ages ago. We said from the start that Democrats did not have the votes (Chart 10). China stimulated the economy massively and avoided massive domestic unrest. Investors doubted that Beijing would stimulate enough to lead to a global recovery, given the leadership’s preference to avoid systemic financial risk. We insisted that constraints would prevail over preferences and the stimulus would be gigantic. Our “China Play Index” skyrocketed, though it did not outperform global equities (Chart 11). We also argued that President Xi Jinping would not face significant domestic unrest after the crisis erupted, though we view domestic political risk as underrated for the coming years. Chart 10Impeachment Failed
Geopolitical Report Card: 2020
Geopolitical Report Card: 2020
Long Emerging markets and deep cyclicals recovered. The combination of Chinese stimulus and a US “return to normalcy” led us to go long emerging markets after the election. We articulated this trade by going long Trans-Pacific Partnership countries, on the expectation that Washington will remain hawkish toward China over trade (Chart 12). We also went long deep cyclicals and US infrastructure plays on the basis of Chinese stimulus and the Biden-Trump common denominator on building projects (Chart 13). Chart 11China Stimulated Massively
China Stimulated Massively
China Stimulated Massively
Chart 12Long Trans-Pacific Partnership Worked As EM Play
Long Trans-Pacific Partnership Worked As EM Play
Long Trans-Pacific Partnership Worked As EM Play
The Taiwan Strait was a bigger geopolitical risk than the Korean peninsula, which markets are at last recognizing (Chart 14). Unfortunately for investors Taiwan remains a serious geopolitical risk regardless of Trump’s exit. Hong Kong attracted investors’ attention more than Taiwan in 2020, whereas we have treated Hong Kong as a red herring. Chart 13Long Infrastructure And Cyclicals Paid Off
Long Infrastructure And Cyclicals Paid Off
Long Infrastructure And Cyclicals Paid Off
Chart 14Hong Kong Was A Red Herring, Korea Beat Taiwan
Hong Kong Was A Red Herring, Korea Beat Taiwan
Hong Kong Was A Red Herring, Korea Beat Taiwan
Brexit has been a red herring throughout 2020, as expected, though an end-of-year failure to agree to a UK-EU trade deal would upend our predictions (Chart 15). Chart 15Brexit Was A Sideshow
Brexit Was A Sideshow
Brexit Was A Sideshow
Germany’s shift to more dovish fiscal policy strengthened European solidarity, keeping peripheral bond yields and “break-up risk” contained (Chart 16). In August 2019 we argued that Germany was easing fiscal policy but would not surge spending until a crisis happened – which proved to be the case when the coronavirus prompted Olaf Scholz to wheel out the “bazooka” this year. We also argued that Europe would be willing to mutualize debt, which was officially confirmed when outgoing Chancellor Angela Merkel forged an agreement on an EU Recovery Fund with French President Emmanuel Macron (though not exactly a “Hamiltonian moment”). Chart 16European Solidarity Strengthened
European Solidarity Strengthened
European Solidarity Strengthened
Chart 17Peak Shinzo Abe' Theme Boosted The Yen
Peak Shinzo Abe' Theme Boosted The Yen
Peak Shinzo Abe' Theme Boosted The Yen
Japan saw “Peak Abenomics,” which was confirmed this year when he handed the helm over to his deputy, Yoshihide Suga, whose policies are continuous. Abe’s late-2019 tax hike was only one of many reasons we anticipated a rally in the yen, which was supercharged by this year’s crisis (Chart 17). Russia’s political risk premium spiked, as we expected, though we did not anticipate that the cause would be a temporary breakdown in OPEC 2.0 (Chart 18). We were more prepared for an event like the poisoning of Alexei Navalny and US sanctions against the Nordstream II pipeline. Our argument that Russia would lie low, for fear of domestic unrest, has so far borne out in the Belarus protests and the conflict in Nagorno-Karabakh. Whether it will continue to do so in the face of what will likely be a pro-democracy assault in eastern Europe from the US Democratic Party remains to be seen. Chart 18Russian Geopolitical Risk Spiked As Predicted
Russian Geopolitical Risk Spiked As Predicted
Russian Geopolitical Risk Spiked As Predicted
India-China tensions were a red herring. India benefited from the western world’s turn against China. Partnerships and alliances were already taking shape before the coronavirus spurred a move in the West to diminish reliance on China’s health care exports. Our long Indian pharmaceuticals trade was highly profitable, though our overweight in Indian bonds was less so (Chart 19). Chart 19India Benefited From West's Anti-China Turn
India Benefited From West's Anti-China Turn
India Benefited From West's Anti-China Turn
Brazilian political risk surged to the highest levels since the 2018 election, and President Jair Bolsonaro suffered a setback in municipal elections, as we expected, especially after witnessing his cavalier attitude toward the pandemic (Chart 20). However, his approval rating rose on the back of fiscal largesse, implying that debt dynamics will continue to trouble this market despite the bullish backdrop for emerging markets in 2021. Chart 20Brazil Remained A Muddle
Brazil Remained A Muddle
Brazil Remained A Muddle
Chart 21Turkish Populism Exacted A Toll
Turkish Populism Exacted A Toll
Turkish Populism Exacted A Toll
Chart 22A Bull Market In Iran Tensions
Bull Market In US-Iran Tensions
Bull Market In US-Iran Tensions
The Turkish lira collapsed, as Turkish President Recep Erdogan maintained reckless domestic economic policies and foreign adventurism (Chart 21). As we go to press, Erdogan appears to be backing down from his aggressive approach to maritime-territorial disputes in the Mediterranean, for fear of European sanctions, which would be a positive surprise, albeit temporary. The “bull market in Iran tensions” continued, with US-Israeli sabotage and assassinations of key Iranian figures bookending the year (Chart 22). With Trump still in office for another 45 days, we would not be surprised to see another move on Iran, where hardliners are ascendant in the unstable advance of the Supreme Leader Ali Khamenei’s eventual succession. So far, Trump has taken market-negative actions in his “lame duck” period on Iran, China, and Big Tech, as we argued, which means more is coming despite the market’s enthusiasm over the partly sunny outlook for 2021. Investment Takeaways Geopolitical analysis is about structural themes and trends – not unpredictable black swans, which may even further entrench structural trends. When a crisis triggers a massive selloff, buy risk assets, then reassess. The gargantuan, coordinated monetary and fiscal response to this year’s crisis presented a clear buy signal. Once the virus was revealed not to be as deadly as first suspected, the rally gained steam. Political and geopolitical forecasts may be dead-on and yet fail to drive the market. There is a constant need to refine the ability to articulate and implement trades that seek to generate alpha from policy insight. Tactical views and attempts at cleverness are a liability when one’s strategic views – geopolitical, macro-economic, financial – are firmly grounded. Matt Gertken Vice President Geopolitical Strategy mattg@bcaresearch.com Footnotes 1 Thomas L. Friedman, "Biden Made Sure ‘Trump Is Not Going To Be President For Four More Years,’" New York Times, December 2, 2020, nytimes.com.
The strength in China’s post-pandemic policy support likely peaked in October. Interbank rates have normalized to their pre-pandemic levels and bond yields have risen sharply since May. The renewed emphasis on financial de-risking is evident in China’s recent anti-trust regulations against domestic leading online retail and lending providers, rising corporate bond defaults and readouts from recent PBoC meetings. In the near term, US President-elect Joe Biden will focus on reviving the economy and this may restore some balance to the Sino-US trade relationship. Additionally, China’s economic recovery is on track. The odds are rising that next year the Chinese leadership will accelerate structural reforms and the de-risking campaign, which began in 2017 but was delayed due to the US-China trade war and the COVID pandemic. These policy actions will improve China’s productivity growth and industrial competitiveness in the medium to long term, but they will create short-term headwinds to the economic recovery and the stock market’s performance. The uptrend in China’s business cycle will likely be maintained for another two quarters, propelled by the momentum from this year's massive stimulus. Historically, turning points in China’s business activities lag credit cycles by six to nine months. Given that China’s policy support apexed in Q4 this year, a peak in the country’s business cycle will probably be reached by mid-2021. Qingyun Xu, CFA Senior Analyst qingyunx@bcaresearch.com Jing Sima China Strategist jings@bcaresearch.com Below is a set of market relevant charts along with our observations: Monetary policy has tightened, but fiscal spending by local governments should pick up in the next two quarters to support the ongoing business cycle expansion into H1 2021. Fiscal spending has been constrained due to shortfalls in revenues this year, despite record sales of special-purpose bonds.1 Government expenditures will gain strength as local governments’ tax revenues start to improve and the proceeds from bond sales are distributed. Chart 1Credit Impulse Has Peaked...
Credit Impulse Has Peaked...
Credit Impulse Has Peaked...
Chart 3Business Cycle Expansion To Continue In 1H21
Business Cycle Expansion To Continue In 1H21
Business Cycle Expansion To Continue In 1H21
Chart 2...But Fiscal Spending Should Pick Up
...But Fiscal Spending Should Pick Up
...But Fiscal Spending Should Pick Up
Part of the buildup in this year’s industrial inventory is due to the solid recovery in domestic demand and proactive restocking by manufacturers. However, the pace of inventory pileup this year has been the highest since 2014, while infrastructure investment and industrial output growth have barely recovered to pre-pandemic levels. The rapid expansion in industrial inventory may be the result of cheap credit and commodity prices and could lead to a period of destocking and slower imports of raw materials in Q1 2021. Chart 4Industrial Inventory Has Run Ahead Of Economic Recovery...
Industrial Inventory Has Run Ahead Of Economic Recovery...
Industrial Inventory Has Run Ahead Of Economic Recovery...
Chart 5...Propelled By Solid Recovery And Cheap Credit
...Propelled By Solid Recovery And Cheap Credit
...Propelled By Solid Recovery And Cheap Credit
Core CPI has reached its weakest level in more than a decade, while the PPI remains in negative territory. A delayed recovery in the household consumption and services sector has been disinflationary to core CPI along with the PPI’s consumer goods price subcomponent.2 Historically, when the growth rate in the PPI outpaces that in the CPI, industrial output and profits tend to improve even if the PPI is in contraction. However, a deflationary PPI is the result of depressed demand for both industrial products and household goods. Hence, neither the widening gap between the PPI and CPI nor the improvement in industrial profits can be sustained on the back of falling consumer prices. Credit impulse tends to lead an increase in both the PPI and CPI by six to nine months. Improving service sector activities and rebounding energy and commodity prices will also be reflationary to both the CPI and the PPI. Meanwhile, the peaking credit impulse coupled with tighter domestic monetary policy and a rapidly rising RMB will limit the upside in both the consumer and producer price indexes. Chart 6Rising Deflation Risks
Rising Deflation Risks
Rising Deflation Risks
Chart 7PPI Has Been Dragged Down By Its Consumer Goods Price Component
PPI Has Been Dragged Down By Its Consumer Goods Price Component
PPI Has Been Dragged Down By Its Consumer Goods Price Component
Chart 8Improvement In Industrial Profits Is Unsustainable In A Deflationary Environment
Improvement In Industrial Profits Is Unsustainable In A Deflationary Environment
Improvement In Industrial Profits Is Unsustainable In A Deflationary Environment
Chart 9While The Economic Recovery Should Support Prices...
While The Economic Recovery Should Support Prices...
While The Economic Recovery Should Support Prices...
Chart 10...A Rapidly Rising RMB Will Limit The Upside In Producer Prices Next Year
...A Rapidly Rising RMB Will Limit The Upside In Producer Prices Next Year
...A Rapidly Rising RMB Will Limit The Upside In Producer Prices Next Year
Retail sales growth further strengthened in October. However, despite a sharp rebound in auto sales, other consumption segments, such as catering, tourism and consumer durable goods, remain sluggish. Household disposable income and employment have improved from troughs earlier this year, but both continue to lag behind the recovery in the industrial sector. The sluggish household sector has prompted Chinese leaders to take actions. In a State Council executive meeting on November 18, Primer Li Keqiang pledged to promote the consumption of home appliances, catering, and automobiles.3 Stocks of consumer goods and automakers rallied following the pro-consumption stimulus announcement. We continue to favor consumer discretionary stocks in both onshore and offshore markets. Even though the valuations in both sectors are elevated compared with the broad market, their earnings outlook also shows a notable improvement. In the next 6 months, targeted pro-consumption stimulus policies should further boost investors’ sentiment as well as profits in these sectors. Chart 11The Ex-Auto Retail Sales Remain Sluggish
The Ex-Auto Retail Sales Remain Sluggish
The Ex-Auto Retail Sales Remain Sluggish
Chart 12Improving Household Income And Employment Will Support Consumption
Improving Household Income And Employment Will Support Consumption
Improving Household Income And Employment Will Support Consumption
Chart 13Policy Support Will Continue Boosting Auto Sales...
Policy Support Will Continue Boosting Auto Sales...
Policy Support Will Continue Boosting Auto Sales...
Chart 14...And Promote NEV Sales
...And Promote NEV Sales
...And Promote NEV Sales
Chart 15Auto Sector's Outperformance Should Continue
Auto Sector's Outperformance Should Continue
Auto Sector's Outperformance Should Continue
Chart 16Consumer Discretionary Sector Will Also Benefit From More Policy Support
Consumer Discretionary Sector Will Also Benefit From More Policy Support
Consumer Discretionary Sector Will Also Benefit From More Policy Support
Chart 17Housing Demand In Second- And Third-Tier Cities Has Already Rolled Over
Housing Demand In Second- And Third-Tier Cities Has Already Rolled Over
Housing Demand In Second- And Third-Tier Cities Has Already Rolled Over
In the past four weeks, the high-frequency data show that momentum in housing demand in second- and third-tier cities has quickly abated. Moreover, bank lending to property developers has rolled over, reflecting tighter financing regulations and pressure to deleverage in the property sector. Growth has flattened in medium- and long-term consumer loans while the propensity for home purchase has ticked up slightly. This divergence may be a sign that demand for real estate has not softened, but that home buyers are waiting for more discounts from property developers. As such, the rebound in floor space started in October should be short-lived as property developers’ profit margins continue to narrow and their financing remains constrained. We expect aggregate home sales growth to decelerate slightly in 1H21 from the past six months. However, real estate developers need to complete their existing projects, which will support construction activities into H1 next year. Chart 18Home Buyers May Be Expecting More Home Price Discounts Ahead
Home Buyers May Be Expecting More Home Price Discounts Ahead
Home Buyers May Be Expecting More Home Price Discounts Ahead
Chart 19Financing Constrains Will Limit Investments In New Building Projects
Financing Constrains Will Limit Investments In New Building Projects
Financing Constrains Will Limit Investments In New Building Projects
This year’s strong outperformance in China’s offshore equity prices has been driven by the TMT sector’s stocks (Information Technology, Media & Entertainment, and Internet & Direct Marketing Retail). Since October, however, Chinese stocks excluding the TMT sector have also started to outperform the global benchmarks. Moreover, domestic cyclicals, which do not feature some of China’s leading tech companies such as Alibaba and Tencent, have outpaced onshore defensive stocks. These developments indicate that as the upswing in China’s business cycle continues to strengthen, the outperformance in China’s ex-TMT stocks will likely be sustained into early 2021. Within cyclical sectors, we continue to favor the materials and consumer discretionary sectors aimed at policy dividends and a rebound in commodity prices. Chart 20China's Ex-TMT Stocks Starting To Outperform Global
China's Ex-TMT Stocks Starting To Outperform Global
China's Ex-TMT Stocks Starting To Outperform Global
Chart 21Domestic Cyclicals Are Now Breaking Out Relative To Defensives
Domestic Cyclicals Are Now Breaking Out Relative To Defensives
Domestic Cyclicals Are Now Breaking Out Relative To Defensives
Chart 22Accelerating Economic Recovery Will Continue To Support Chinese Cyclical Stocks
Accelerating Economic Recovery Will Continue To Support Chinese Cyclical Stocks
Accelerating Economic Recovery Will Continue To Support Chinese Cyclical Stocks
Chart 23Rebounding Commodity Prices Will Bode Well For Material Stocks
Rebounding Commodity Prices Will Bode Well For Material Stocks
Rebounding Commodity Prices Will Bode Well For Material Stocks
Recent bond payment defaults by several SOEs have led to a spike in onshore corporate bond yields. Nonetheless, the ripple effect on China’s financial markets has been limited outside of the corporate bond market; onshore stocks were little changed by news of the defaults. Moreover, the PBoC’s recent liquidity injections helped to stabilize the interbank rate. Historically, corporate bond defaults and rising bond yields have not had an imminent negative impact on China’s domestic stock market performance; none of the defaults in 2015, 2016 or 2019 led to selloffs in the equity market. However, during a business cycle upswing and following a large-scale stimulus, increasing corporate defaults typically mark the onset of tightening in financial regulations and the monetary cycle. We expect the upswing in the business cycle to begin losing momentum as the tightening policy cycle gains further traction in 2021. Prices in the forward-looking equity market will likely peak sooner on the expectation that the rate of economic and corporate earnings growth will slow in 2H21. Chart 24Stress In Chinese Onshore Corporate Bond Market
Stress In Chinese Onshore Corporate Bond Market
Stress In Chinese Onshore Corporate Bond Market
Chart 25Stress In Chinese Onshore Corporate Bond Market
Stress In Chinese Onshore Corporate Bond Market
Stress In Chinese Onshore Corporate Bond Market
Chart 26But So Far Negative Impacts On The Stock Market Are Limited
But So Far Negative Impacts On The Stock Market Are Limited
But So Far Negative Impacts On The Stock Market Are Limited
Table 1China Macro Data Summary
China Macro And Market Review
China Macro And Market Review
Table 2China Financial Market Performance Summary
China Macro And Market Review
China Macro And Market Review
Footnotes 1Please see China Investment Strategy Weekly Report "China Macro And Market Review," dated October 7, 2020, available at cis.bcaresearch.com 2Headline PPI is comprised of producer and consumer goods. The weights of producer and consumer goods are roughly 75% and 25%, respectively. As for producer goods by industry, the weight of the manufacturing sector is around 50%, followed by 20% for the raw material sector; the mining sector accounts for only around 5%. 3Pro-auto consumption plans include: providing subsidies to encourage urban car owners to replace older and higher-emission models with newer environmentally friendly ones; encouraging automobile sales and upgrades in rural areas; and promoting New Energy Vehicle (NEV) sales. The plan will also loosen some existing restrictions on auto sales and increase the permits for vehicle license plates. Cyclical Investment Stance Equity Sector Recommendations
Highlights Inflation Breakeven Trades: We are taking profits on our recommended inflation breakeven widening trades in Italy and Canada, as breakevens in both countries are no longer below the fair values implied by our models. We are initiating a new trade this week, going long French 10-year inflation-linked bonds versus French nominal OATs, as French breakevens remain below fair value. Yield Curve Butterfly Trades: We are closing three of our four outstanding government bond yield curve trade recommendations, taking profits in France and Italy and realizing a loss in the UK. We are maintaining our US 5/7/10 butterfly trade, which is the cheapest way to position for an expected steepening of the Treasury curve based on our valuation models. Cross-Country Spread Trades: We are cutting our losses in our New Zealand-UK government bond spread trade, with the odds of the RBNZ shifting to a negative interest rate policy severely curtailed by political pressure over surging New Zealand house prices. We are maintaining our US-Germany spread widening trade, as the spread is too narrow based on our fair value model and we see more scope for US Treasury yields to drift higher in the coming months. Feature Dear Client, Next week, we will be jointly publishing our semi-annual Central Bank Monitor Chartbook along with our colleagues at BCA Research Foreign Exchange Strategy. You will receive that report a few days later than usual on Friday, December 11. We will return to our regular publishing schedule on Tuesday, December 15 with our 2021 Key Views report outlining our main investment themes and ideas for the upcoming year. Best Regards, Rob Robis As we enter the final weeks of an incredibly eventful and (unfortunately) all too memorable 2020, our attention now turns to investment ideas for the coming New Year. This week, all BCA Research clients will receive the 2021 Outlook report, detailing the key themes and recommendations from all our strategists. We will follow that up with our own 2021 Global Fixed Income Strategy outlook report later this month. The waning days of the year also offer a good time to review our more short-term trade recommendations currently in our Tactical Overlay portfolio. In addition, the waning days of the year also offer a good time to review our more short-term trade recommendations currently in our Tactical Overlay portfolio (Table 1). Several of our suggested trades have generated a solid profit (like inflation breakeven wideners) but have now outlived their original rationale. Others, like some of our yield curve trades in Europe, have not gone as we expected and should therefore be closed out. Table 1Changes To Our Tactical Overlay Portfolio
A Year-End Review Of Our Tactical Overlay Trades
A Year-End Review Of Our Tactical Overlay Trades
As a reminder to our regular readers, our Tactical Overlay is a portfolio of individual trade ideas within the global fixed income space with an investment horizon of six months or less. These differ from our more typical strategic (6-12 month) recommendations that also populate our model bond portfolio. Ideas for our Tactical Overlay trades often stem from our fair value models, but can also be plays on events that we expect will be market relevant on a near-term basis, like central bank meetings. All recommended trades are implemented using specific securities, rather than generic Bloomberg tickers or bond indices. This allows for a more transparent process where clients can follow along with the performance of our trades. Evaluating Our Tactical Inflation-Linked Breakeven Trades We currently have two open tactical trade recommendations involving inflation-linked bonds: Long 10-year Italian inflation-linked bonds vs short 10-year Italian bond futures Long 10-year Canadian inflation-linked bonds vs short 10-year Canadian bond futures We initiated both of these trades back in June of this year, as well as an additional trade involving US TIPS, based on the output of our inflation breakeven fair value framework. In our models, we regress 10-year inflation breakevens on the annual rate of change of oil prices in local currency terms and a multi-year moving average of realized headline inflation.1 At the time of our mid-year report, inflation breakevens were too low on our models in the majority of developed market countries with inflation-linked bonds – a lingering after-effect of the COVID-19 shock to global growth in the second quarter of 2020 (Chart 1). Since then, 10-year inflation breakevens have caught up to fair value in the US, Germany, Italy and Canada, and have even moved above fair value in the UK and Australia. Chart 1A Big Shift In Inflation Breakeven Valuations
A Year-End Review Of Our Tactical Overlay Trades
A Year-End Review Of Our Tactical Overlay Trades
In June, we also entered into a US 10-year TIPS breakeven widening trade, but we took profits on the trade once US breakevens returned back to our model fair value estimate in September. We now see a similar situation in Canada (Chart 2) and Italy (Chart 3) where breakevens have converged to our model-implied fair value. Chart 2Canadian 10-Year Inflation Breakeven Model
Canadian 10-Year Inflation Breakeven Model
Canadian 10-Year Inflation Breakeven Model
A move above fair value is possible, but could be harder to achieve with the Canadian dollar and euro steadily trending higher which could weigh on the market’s view on future inflation in Canada and Italy. We are taking profits on our Canada and Italy 10-year breakeven trades, realizing profits of 4.7% and 5.6% respectively. Thus, we are taking profits on our Canada and Italy 10-year breakeven trades, realizing profits of 4.7% and 5.6% respectively. The Italian returns were boosted considerably by the long side of this trade, as we entered the position when the 10-year real yield was +1.05% and which has since collapsed to -0.05% on the back of the massive rally in Italian bonds. One place where breakevens still look attractively cheap, trading close to one standard deviation below our model fair value, is in France (Chart 4). This contrasts with the breakevens in Italy and Germany that have fully converged to fair value. Thus, we are entering a new trade this week, going long the on-the-run 10yr French inflation-linked bond (OATi) and shorting French bond futures (Euro-OATs). The hedge ratio used for this trade to keep both legs duration matched, given the much shorter duration of the OATi relative to nominal French bonds, is 0.49 (see the Tactical Overlay table on page 17 for specific details on the securities used in the trade). Chart 3Italian 10-Year Inflation Breakeven Model
Italian 10-Year Inflation Breakeven Model
Italian 10-Year Inflation Breakeven Model
Chart 4French 10-Year Inflation Breakeven Model
French 10-Year Inflation Breakeven Model
French 10-Year Inflation Breakeven Model
Bottom Line: We are taking profits on our recommended inflation breakeven widening trades in Italy and Canada, while initiating a new breakeven widening position in France, based on the output of our breakeven fair value models. Evaluating Our Yield Curve/Butterfly Spread Trades Back in July, we initiated a series of yield curve butterfly spread trades in the US, UK, Italy and France.2 Butterfly spreads compare the yield of a single bond (bullets) to that of a duration-neutral combination of bonds with shorter and longer maturities relative to the bullet (barbells). Our valuation models produce fair value estimates of various butterfly combinations based on the relation of the butterfly spreads to the slope of the yield curve. We then combine those valuations with our own macro views on the future slope of yield curves to come up with potential value-based curve trades.3 We now evaluate our four existing curve trades in turn. Long UK 3/20 Barbell vs. 10-Year Bullet Our original rationale for entering this trade was two-fold. Firstly, this position was the most attractive butterfly combination in terms of the standardized deviation of the spread from its model-implied fair value. Secondly, there was a relatively low correlation between nominal UK bond yields and inflation breakevens--meaning that we could see a rise in long-dated inflation expectations that did not also push up nominal bond yields by a proportional amount. This made the trade consistent with our overall macro view back in July that the Gilt curve would flatten (the same rationale applies to the other two long barbell versus short bullet trades, or “flatteners”, in France and Italy that we discuss below). Unfortunately, our rationale did not play out as expected (Chart 5). Instead of reverting to fair value, the butterfly spread was mostly flat while the bullet grew more expensive relative to the barbell, driven by a rise in the model fair value. This in turn was due to significant steepening in the underlying 3/20 curve, contrary to our expectations. We also saw a significant overall upward shift in the overall UK Gilt curve, which generated losses on our long barbell position (which has a higher interest rate convexity) that overwhelmed the profits on our short bullet position. Going forward, there are good technical and strategic reasons to exit this trade. The butterfly spread is not yet at levels where it tends to mean-revert (second panel). In addition, Joe Biden’s US election victory has also increased the odds of a Brexit deal, which would put bear-steepening pressure on the UK Gilt curve. With that in mind, we are closing our Long UK 3/20 Barbell vs. 10-Year Bullet for a loss of -0.17%. Long France 2/30 Barbell vs. 5-Year Bullet Our rationale for entering this flattener was the same as in the UK. However, we fared quite a bit better here. The underlying 2/30 curve did flatten, as we expected, however, the butterfly spread itself moved further away from fair value, with the bullet component becoming relatively more expensive (Chart 6). So, as with the UK, the returns on this trade can be largely explained by the relative outperformance of the barbell component due to its higher convexity. In France, however, the effect worked to our favor as the yield curve shifted downwards significantly. The positive returns on the long French 30-year OAT component, where yields have been nearly slashed in half since July, dominated the other parts of the trade - even with the 30-year bond only being a small piece (11%) of the duration-weighted barbell Chart 5UK 3/10/20 Spread Fair Value Model
UK 3/10/20 Spread Fair Value Model
UK 3/10/20 Spread Fair Value Model
Chart 6France 2/5/30 Spread Fair Value Model
France 2/5/30 Spread Fair Value Model
France 2/5/30 Spread Fair Value Model
Although we did make profits on the flattener, it turned into a convexity bet that was not our original intention. Seeing as our underlying logic did not work out as expected, we are not comfortable remaining in this position. Thus, we are closing our France butterfly trade for a profit of 0.56%. Long Italy 5/30 Barbell vs. 10-Year Bullet As with the UK and France, we entered this trade based on its attractive model-based valuation and the relatively low correlation between inflation breakevens and nominal yields in France. Our expectation of flattening in the underlying 5/30 curve did not bear out as it remained mostly flat (Chart 7). We did see some reversion in the butterfly spread towards our model-implied fair value, which helped us make profits on our trade. Again, we cannot ignore the effect of convexity when looking at the outperformance of the barbell component. Yields fell dramatically across the Italian curve in one of the clearest examples of the yield-chasing behavior we have been describing this year.4 As Italian yields continue their race to the bottom, supported by ECB asset purchases and perceptions of more fiscal co-operation between the countries of Europe, there is a chance that this trade will continue to perform by virtue of its exposure to the long end of the Italian curve. However, as our original bias towards curve flattening did not play out, we prefer to maintain our exposure to Italian government debt via an overweight allocation in our model bond portfolio instead. We therefore close our Long Italy 5/30 Barbell vs. 10-Year Bullet for a profit of 0.83% Long US 7-Year Bullet vs. 5/10 Barbell The US was the only region where we initiated a “steepener” trade, with a long bullet versus short barbell combination that does well when the yield curve steepens. We chose this particular 5/7/10 butterfly as it was the most attractive steepener available based on our model-implied valuation that also fit our fundamental macro bias back in July towards US Treasury curve steepening – a view that we still hold today. With signs pointing towards further bear steepening of the Treasury curve, we feel comfortable keeping this US 5/7/10 butterfly spread trade open. Our rationale for initiating the trade was borne out, with the underlying 5/10 Treasury curve steepening and the butterfly spread tightening towards fair value (Chart 8). Our trade was supported by a continued rebound in long-dated US inflation expectations as well as the US election result, the most bond-bearish event of the year. Chart 7Italy 5/10/30 Spread Fair Value Model
Italy 5/10/30 Spread Fair Value Model
Italy 5/10/30 Spread Fair Value Model
Chart 8US 5/7/10 Spread Fair Value Model
US 5/7/10 Spread Fair Value Model
US 5/7/10 Spread Fair Value Model
Going forward, we see good reasons to maintain this trade. The butterfly spread, after briefly reaching expensive levels, is back to being attractively valued. Even if the residual were to dip back below zero, it would still have room to become more expensive, shoring up our trade. This trade also remains the most attractive of all the steepener trades on a model-implied valuation basis, removing any incentive to rotate towards another part of the curve. The odds favor more reflationary Treasury curve steepening after the US election. President-elect Biden has a stated goal of more fiscal stimulus, while his selection of Janet Yellen as Treasury Secretary signaling increased cooperation between monetary and fiscal authorities. With signs pointing towards further bear steepening of the Treasury curve, we feel comfortable keeping this US 5/7/10 butterfly spread trade open. Bottom Line: We are closing three of our four outstanding government bond yield curve trade recommendations, taking profits in France and Italy and realizing a loss in the UK. We are maintaining our US 5/7/10 butterfly trade, which is the cheapest way to position for an expected steepening of the Treasury curve based on our valuation models. Evaluating Our Cross-Country Yield Spread Trades We currently have two recommended trades involving plays on the spread between government bonds: Long 5-year New Zealand government bonds versus short 5-year UK Gilts, currency-hedged into GBP We initiated this trade on August 25, and to date the trade is severely underwater with a total return of -1.8%.5 That loss comes from the long New Zealand leg of the trade, as the 5-year NZ bond yield has increased by 34bps from our entry level. Chart 9A Rapid Shift Upward In NZ Rate Expectations
A Rapid Shift Upward In NZ Rate Expectations
A Rapid Shift Upward In NZ Rate Expectations
The rationale for this trade was based on our assessment of the relative probability of the Bank of England (BoE) and Reserve Bank of New Zealand (RBNZ) moving to a negative interest rate policy. Both central banks hinted strongly at such a move throughout the summer months as part of their efforts to support pandemic-stricken economies. Our view back in late August was that it was more likely that the RBNZ would choose negative rates, as New Zealand had far lower inflation expectations than the UK and, unlike the British pound, the New Zealand dollar was not undervalued. This trade was initially profitable, but all that changed rapidly during the month of November. The RBNZ disappointed investor expectations on a move to negative rates at the November 11 monetary policy meeting. The central bank elected instead to increase the size of its existing quantitative easing program, while giving no hint that negative rates were coming soon. The response was a sharp move higher in both New Zealand bond yields and the New Zealand dollar (Chart 9). There was an even more violent adjustment in yields and the currency last week, after New Zealand Finance Minister Grant Robertson wrote a letter to RBNZ Governor Adrian Orr asking the central bank to change its policy remit to include controlling New Zealand house price inflation. Markets interpreted this blatant political pressure on the central bank as the end of any hopes of negative rates in New Zealand, with bond yields and the currency spiking higher once again. House prices have surged after the RBNZ aggressively cut interest rates earlier this year, with a rapidly rising share of new mortgages having higher loan-to-value ratios (Chart 10). House price inflation is now running at 19.8%, and Finance Minister Robertson did cite deteriorating housing affordability and inequality as the basis for his letter to the RBNZ. It is clear that a move to negative interest rates – which could further fuel the explosion in house prices – is now very difficult for the RBNZ to pull off without facing intense criticism. It is clear that a move to negative interest rates – which could further fuel the explosion in house prices – is now very difficult for the RBNZ to pull off without facing intense criticism. This shatters the underlying rationale for our long New Zealand/short UK yield spread trade (Chart 11). Chart 10RBNZ-Fueled Boom In House Prices
RBNZ-Fueled Boom In House Prices
RBNZ-Fueled Boom In House Prices
Thus, we are choosing to cut our losses and close out our recommended trade. Long 10-year German Bunds versus short 10-year US Treasuries Chart 11Time To Cut Our Losses On The NZ-UK Trade
Time To Cut Our Losses On The NZ-UK Trade
Time To Cut Our Losses On The NZ-UK Trade
We initiated this recommendation on October 27, and to date the trade is running a small loss of -0.17%.6 The rationale behind the trade was two-fold: Our valuation model for the 10-year UST-Bund yield spread showed that the spread was far below fair value; We turned more bearish on US Treasuries just before the US presidential election, downgrading our recommended allocation to underweight while also upgrading more defensive Germany – with its low yield-beta to US Treasuries - to overweight. The trade initially performed well, driven by faster growth and inflation in the US versus the euro area (Chart 12). The Treasury selloff has stalled of late, but we view this as more a consolidative pause than a near-term peak in yields. Chart 12Fundamentals Justify A Wider UST-Bund Spread
Fundamentals Justify A Wider UST-Bund Spread
Fundamentals Justify A Wider UST-Bund Spread
With our Treasury-Bund valuation model still showing that the spread is too tight, and with the spread not looking overly stretched versus its 200-day moving average (Chart 13), we are keeping our US versus Germany trade in our Tactical Overlay portfolio. Chart 13Valuation & Momentum Point To A Wider UST-Bund Spread
Valuation & Momentum Point To A Wider UST-Bund Spread
Valuation & Momentum Point To A Wider UST-Bund Spread
Bottom Line: We are cutting our losses in our New Zealand-UK government bond spread trade, with the odds of the RBNZ shifting to a negative interest rate policy severely curtailed by political pressure over surging New Zealand house prices. We are maintaining our US-Germany spread widening trade, as the spread is too narrow based on our fair value model and we see more scope for US Treasury yields to drift higher in the coming months Robert Robis, CFA Chief Fixed Income Strategist rrobis@bcaresearch.com Shakti Sharma Research Associate ShaktiS@bcaresearch.com Footnotes 1 Please see BCA Research Global Fixed Income Strategy Weekly Report, " How To Play The Revival Of Global Inflation Expectations", dated June 23, 2020, available at gfis.bcaresearch.com. 2 Please see BCA Research Global Fixed Income Strategy Weekly Report, "Global Yield Curve Trades: Netting Returns With Butterflies", dated July 7, 2020, available at gfis.bcaresearch.com. 3 Readers looking for more detailed background on butterfly trades and our yield curve modelling framework should refer to the July 7, 2020 Strategy Report where we initiated these trades. 4 Please see BCA Research Global Fixed Income Strategy Weekly Report, "We’re All Yield Chasers Now", dated August 11, 2020, available at gfis.bcaresearch.com. 5 Please see BCA Research Global Fixed Income Strategy Weekly Report, "Assessing The Leading Candidates To Join The Negative Rates Club", dated August 26, 2020, available at gfis.bcaresearch.com. 6 Please see BCA Research Global Fixed Income Strategy Weekly Report, "The Global Bond Implications Of Rising Treasury Yields", dated October 27, 2020 available at gfis.bcaresearch.com. Recommendations The GFIS Recommended Portfolio Vs. The Custom Benchmark Index
A Year-End Review Of Our Tactical Overlay Trades
A Year-End Review Of Our Tactical Overlay Trades
Duration Regional Allocation Spread Product Tactical Trades Yields & Returns Global Bond Yields Historical Returns
Dear Client, Instead of our regular report next week, we will be sending you BCA Research’s Annual Outlook, featuring long-time BCA client Mr. X, who visits towards the end of each year to discuss the economic and financial market outlook for the year ahead. We will be back the week after with the GIS quarterly Strategy Outlook, where we will explore the major investment themes and views we see playing out in 2021. Best regards, Peter Berezin, Chief Global Strategist Highlights While a vaccine, ironically, could dampen economic activity in the near term, it will pave the way for faster growth in the medium-to-long term. Inflation is unlikely to rise much over the next two-to-three years. However, it could gallop higher later this decade as unemployment falls below pre-pandemic levels and policymakers keep both monetary and fiscal policy accommodative. Many of the structural factors that have depressed inflation are going into reverse: Baby boomers are leaving the labor force, globalization is on the back foot, and social cohesion is fraying. The lackluster pace of productivity growth suggests that innovation is not occurring as fast as many people think. Rather, what seems to be happening is that the nature of innovation is changing in ways that are a lot more favorable to Wall Street than Main Street. Monopoly power has grown, especially in the tech sector. This has had a deflationary effect in the past but could take a more inflationary tone in the future. Investors should remain overweight stocks for the next 12 months, while shifting equity allocation away from growth companies towards value companies and away from the US towards the rest of the world. The Waiting Game This week brought some further good news on the pandemic front. The number of reported daily cases continues to trend lower in Europe. The 7-day average has now fallen by 30% from its November 8th peak (Chart 1). In the US, there are faint indications that the number of new cases is stabilizing, especially in the hard-hit Midwest (Chart 2). Chart 1Covid Cases In Europe: Past The Worst
Inflation, Innovation, And The Value/Growth Debate
Inflation, Innovation, And The Value/Growth Debate
Chart 2Covid Cases In The US: Approaching The Peak Of The Third Wave?
Inflation, Innovation, And The Value/Growth Debate
Inflation, Innovation, And The Value/Growth Debate
Nevertheless, it is too early to breathe a sigh of relief. As with other coronaviruses, SARS-CoV-2 spreads more easily in colder temperatures. Moreover, this week is Thanksgiving in the US, and with the holiday season approaching in the wider world, there will be more opportunities for the virus to propagate. Chart 3The US May Have To Follow Europe In Tightening Lockdown Measures
Inflation, Innovation, And The Value/Growth Debate
Inflation, Innovation, And The Value/Growth Debate
Despite the cresting in new cases, the absolute number of confirmed daily infections remains extremely high. The 7-day average currently stands at about 175,000 in the US. Adjusting for the typical three-week lag between new cases and deaths, the case-fatality rate is approximately 1.8%. The CDC estimates the “true” fatality rate is 0.7%.1 This implies that for every one person who tests positive for Covid-19, 1.5 people go undetected. Thus, around 450,000 Americans are catching Covid every day. That is 3.2 million per week or about 1% of the US population. Other estimates from the CDC suggest that the true number of new infections may now be even greater, perhaps as high as 11 million per week.2 Unlike in Europe, where governments have implemented a series of stringent lockdown measures, the US has taken a more relaxed approach (Chart 3). If the number of new infections fails to fall much from current levels, more US states will have to tighten social distancing rules. The availability of vaccines will pave the way for stronger growth in the medium-to-long term. Ironically however, as we pointed out two weeks ago, vaccine optimism could dampen economic activity in the near term. With the light clearly visible at the end of the tunnel, more people may choose to hunker down to avoid being infected. After all, how frustrating would it be to contract the virus just a few months before one can be vaccinated? It is like being the last guy shot on the battlefield in a war that is drawing to an end. The Outlook For Inflation Could inflation make a comeback once a vaccine is widely available? The pandemic put significant downward pressure on prices in a number of areas, particularly air transport, accommodation, apparel, and gasoline. While prices in some categories, such as used cars, meats and eggs, and certain toiletries did rise briskly, the net effect was still a substantial decline in overall inflation (Chart 4). Chart 4The Impact Of Covid On US Inflation
Inflation, Innovation, And The Value/Growth Debate
Inflation, Innovation, And The Value/Growth Debate
Core PCE inflation stood at 1.4% in October, well below the Fed’s target. As Chart 5 illustrates, core inflation is below central bank targets in most other economies as well. A bounce back in prices in the most pandemic-afflicted sectors should lift inflation over the next six months. Our US bond strategists expect core PCE inflation to peak at 2¼% in the second quarter of next year, before falling back below 2% by the end of 2021. Chart 5Core Inflation Below Central Bank Targets
Core Inflation Below Central Bank Targets
Core Inflation Below Central Bank Targets
Chart 6Unemployment Rate Is Projected To Decline Towards Pre-Covid Lows In The Coming Years
Inflation, Innovation, And The Value/Growth Debate
Inflation, Innovation, And The Value/Growth Debate
Ignoring the temporary oscillations in inflation due to base effects, a more sustained increase in inflation would require that labor market slack be fully absorbed. In its October 2020 World Economic Outlook, the IMF projected that the unemployment rate in the major economies would fall back to its full employment level by around 2025 (Chart 6). While a vaccine will expedite the healing of labor markets, it is probable that unemployment will remain too high to generate an overheated economy for the next three years. What about beyond then? The fact that long-term bond yields are so low today implies that most investors think that inflation will remain subdued for many years to come (Chart 7). This is confirmed by CPI swaps, which in some countries go out as far as 50 years. For the most part, they are all trading at levels below official central bank inflation targets (Chart 8). Chart 7Long-Term Bond Yields Are Depressed...
Long-Term Bond Yields Are Depressed...
Long-Term Bond Yields Are Depressed...
Chart 8… As Are Long-Term Inflation Expectations
Inflation, Innovation, And The Value/Growth Debate
Inflation, Innovation, And The Value/Growth Debate
Heading Towards The Kink Is inflation really dead, or is it just dormant? We think it is the latter. Contrary to the claim that the Phillips curve has become defunct, Chart 9 shows that the wage version of the Phillips curve – which compares wage growth with the unemployment rate – is very much alive and well. What is true is that rising wage growth has failed to translate into higher price inflation in most economies since the early 1980s. However, this may have simply been due to happenstance: Every time the global economy was starting to heat up to the point that a price-wage spiral could develop, something would happen to break it. In 2019, the unemployment rate in the G7 hit a 46-year low. Perhaps inflation would have accelerated this year had it not been for the pandemic? Likewise, inflation might have risen in 2008 had it not been for the financial crisis, and in 2001 had it not been for the dotcom bust. Chart 9Is The Phillips Curve Really Dead?
Is The Phillips Curve Really Dead?
Is The Phillips Curve Really Dead?
Chart 10Inflation Reached The ''Kink'' In 1966
Inflation, Innovation, And The Value/Growth Debate
Inflation, Innovation, And The Value/Growth Debate
Rather than being defunct, the price-version of the Phillips curve may turn out to be kinked at a very low level of the unemployment rate. Such was the case during the 1960s (Chart 10). US core inflation remained steady at around 1.5% in the first half of that decade, even as the unemployment rate drifted lower and lower. In 1966, with the unemployment rate nearly two percentage points below NAIRU, inflation blasted off, doubling to more than 3% within a span of six months. Core inflation would go on to increase to 6% by 1969, setting the stage for the stagflationary 1970s. A Less Deflationary Structural Backdrop Many pundits argue that the structural backdrop for inflation is vastly different today than it was during the 1960s, making any comparison with that decade next to worthless. They point out that unions had a lot more power back then, global supply chains were underdeveloped, and rapid population growth was creating more demand for goods and services than the economy could supply. We have addressed these arguments in the past and will not belabor the point this week other than to note that all three of these structural forces are now in retreat.3 Chart 11The Heyday Of Globalization Is Behind Us
The Heyday Of Globalization Is Behind Us
The Heyday Of Globalization Is Behind Us
Granted, unions are not as powerful as they were in the 1960s. However, public policy is still moving in a more worker-friendly direction. Witness the fact that Florida voters, despite handing the state to President Trump, voted 61%-to-39% to raise the state minimum wage in increments from $8.56 an hour to $15 by 2026. Joe Biden has also pledged to hike the federal minimum wage to $15 from its current level of $7.25. Meanwhile, globalization is on the back foot, with the ratio of trade-to-output moving sideways for more than a decade (Chart 11). At the same time, baby boomers are departing the labor force en masse. Rather than remaining net savers, these retiring workers will become dissavers. This means that the global savings glut, which has suppressed interest rates and inflation, could begin to dry up. Perhaps most ominously, social stability is at risk of breaking down. Homicides in the US have risen by nearly 30% so far this year compared to the same period a year ago.4 Historically, the institutionalization rate has tracked the homicide rate quite closely (Chart 12). As was the case in the 1960s, a lot of the well-meaning discussion about criminal justice reform today could turn out to be counterproductive. Perhaps it was just a coincidence, but it is worth remembering that inflation exploded in the 1960s at exactly the same time that the murder rate shot up (Chart 13). Chart 12Dramatic Drop In Institutionalization Rate During The 1960s Corresponded With A Sharp Increase In The Homicide Rate
Inflation, Innovation, And The Value/Growth Debate
Inflation, Innovation, And The Value/Growth Debate
Chart 13Social Unrest Can Fuel Inflation
Social Unrest Can Fuel Inflation
Social Unrest Can Fuel Inflation
The Role Of Innovation Technological innovation has been routinely cited as a driver of falling inflation. In many ways, this is rather odd. Economic theory states that faster innovation should lead to higher real income. It does not say whether the increase in real income should come via rising nominal income or falling inflation. Indeed, to the extent that faster innovation leads to higher potential GDP growth, it could fuel inflation. This is because stronger trend growth will tend to raise the neutral rate of interest, implying that monetary policy will become more stimulative for any given policy rate. Moreover, the fixation on technology as a deflationary force is a bit strange considering that measured productivity growth has been exceptionally weak in most advanced economies over the past 15 years – weaker, in fact, than it was in the 1970s (Chart 14). Chart 14US Productivity Has Been Exceptionally Weak Over The Past Ten Years
US Productivity Has Been Exceptionally Weak Over The Past Ten Years
US Productivity Has Been Exceptionally Weak Over The Past Ten Years
How, then, does one explain why tech stocks have fared so well? One often-heard answer is that productivity growth is mismeasured. We examined this argument carefully in our report entitled Weak Productivity Growth: Don't Blame The Statisticians, concluding that this does not appear to be the case. A more plausible answer is that while the pace of innovation has not sped up, the nature of innovation has changed dramatically in ways that have helped Wall Street a lot more than Main Street. The True Nature Of Corporate Profits Standard economics textbooks regard profit as a return on capital. This implies that if the price of capital goes down, firms should respond by increasing investment spending in order to further boost profits. In practice, that has not occurred. For example, the Trump Administration promised that corporate tax cuts would produce an investment boom. While business investment did rise in 2018, this was all due to a rebound in energy spending. Outside of the oil and mining sector, business investment grew more slowly between Q4 of 2016 and Q4 of 2019 than it did over the preceding three years (Chart 15). Likewise, neither falling interest rates nor rising stock prices – two factors that should produce a lower cost of capital – have done much to buoy investment spending in recent years. Chart 15Overall Capex In 2017-2019 Was Boosted By The Oil And Mining Sector
Inflation, Innovation, And The Value/Growth Debate
Inflation, Innovation, And The Value/Growth Debate
Chart 16A Winner-Takes-All Economy
Inflation, Innovation, And The Value/Growth Debate
Inflation, Innovation, And The Value/Growth Debate
Why did the standard economic relationship between investment and the cost of capital break down? The answer is that the traditional approach does not take into account what has become an increasingly important driver of corporate profits: monopoly power. A recent study by Grullon, Larkin, and Michaely found that market concentration has increased in 75% of all US industries since 1997.5 Furman and Orszag have shown that the dispersion in the rate of return on capital across firms has widened sharply since the early 1990s. In the last year of their analysis, firms at the 90th percentile of profitability had a rate of return on capital that was five times that of the median firm, a massive increase from the historic average of two times (Chart 16). The dispersion in performance has been particularly stark within the tech sector. According to BCA Research’s proprietary Equity Analyzer, the shares of “value tech” companies – that is, companies trading in the bottom quartile of price-to-earnings, price-to-operating cash flow, price-to-free cash flow, price-to-book, and price-to-sales – have not only lagged the shares of other tech companies, but they have also lagged the shares of similarly valued financial companies (Chart 17). This underscores the point that the outperformance of growth stocks over the past 12 years has not just been a story about technology. Rather, it has primarily been a story about some tech companies doing much better than other tech companies. Chart 17Value Tech Lagged Value Financials
Inflation, Innovation, And The Value/Growth Debate
Inflation, Innovation, And The Value/Growth Debate
The Winner-Take-All Economy What explains the bifurcation in performance within the tech sector? Two reasons come to mind. First, tech companies are particularly susceptible to network effects: The more people who use a particular tech platform, the more attractive it is for others to use it. Facebook is a classic example. Second, tech companies benefit significantly from scale economies. Once a piece of software has been written, creating additional copies costs almost nothing. Even in the hardware realm, the marginal cost of producing an additional chip is tiny compared to the fixed cost of designing it. All of this creates a winner take-all environment where success begets further success. The role played by winner-take-all markets explains how a handful of companies were able to become mega-cap tech titans. Chart 18 and Chart 19 show that increased monopoly power, as reflected in rising profit margins and higher relative P/E ratios, has played a greater role in driving tech share outperformance since the mid-1990s than faster revenue growth. Chart 18Decomposing Tech Outperformance (I)
Decomposing Tech Outperformance (I)
Decomposing Tech Outperformance (I)
Chart 19Decomposing Tech Outperformance (II)
Inflation, Innovation, And The Value/Growth Debate
Inflation, Innovation, And The Value/Growth Debate
Reaching Adulthood History suggests that monopolists tend to experience an initial rapid growth phase in which they capture ever-more market share, followed by a mature phase where they effectively function as utilities – cranking out stable cash flows to shareholders without experiencing much further growth. While it is impossible to say how far along most of today’s tech leaders are in this cycle, it does appear that the period of rapid growth for many of them may be drawing to a close. As it is, close to three-quarters of US households already have an Amazon Prime account. Slightly over half have a Netflix account. Nearly 70% have a Facebook account. Google commands 92% of the internet search market. The shift away from “growth status” towards “utility status” for some tech monopolists could prompt investors to trim the valuation premium they assign to these stocks. In addition, it could lead to increased regulation by governments to ensure that monopoly power is not abused. This could further depress valuations. Monopolies And Inflation What about the implications for inflation? Unlike firms in a perfectly competitive industry, monopolistic firms have to contend with the fact that higher output could depress selling prices, thus leading to lower profit margins. As my colleague Mathieu Savary has emphasized,6 this implies that rising market power could simultaneously increase profits while reducing investment in new capacity. At least initially, this could be deflationary in two ways: First, lower investment spending will reduce aggregate demand. Second, greater market power will shift income towards wealthy owners of capital, who tend to save more than regular workers. This helps explain why falling real interest rates and rising profits have failed to trigger an investment boom. Further down the road, the impact of monopoly power on inflation could turn on its head. Less investment spending will curb potential GDP growth, making it easier for economies to run up against capacity constraints. Low real interest rates could also induce governments to run larger budget deficits, boosting aggregate demand in the process. Finally, an economy where monopoly power runs unchecked will eventually spur a populist backlash, leading to reflationary policies that favor workers over business oligarchs. Investment Conclusions Equities have run up a lot since the start of November. Bullish sentiment has surged in the American Association of Individual Investors weekly bull-bear poll, while the put-to-call ratio has fallen to multi-year lows (Chart 20). Given the likelihood that economic growth could surprise on the downside in the near term, equities are vulnerable to a short-term correction. Nevertheless, rising odds of an effective vaccine and continued easy monetary policy keep us bullish on stocks over a 12-month horizon. Chart 20A Lot Of Bullishness
A Lot Of Bullishness
A Lot Of Bullishness
Chart 21European Banks: A Low Bar For Success
European Banks: A Low Bar For Success
European Banks: A Low Bar For Success
Equity investors should shift their allocation away from growth stocks towards value stocks and away from the US towards the rest of the world. We like European banks in particular. They currently trade at 0.6-times tangible book value and 7.2-times 2019 earnings. Earnings estimates for 2021 have been slashed but should rebound on the expectation of a vaccine-driven growth recovery later next year (Chart 21). Faster growth should produce a modest steepening in yield curves, boosting net interest margins in the process. Faster growth should also lead to stronger credit demand while reducing bad loans. Looking further out, this week’s report argues that inflation could accelerate meaningfully once unemployment returns to pre-pandemic levels in about two-to-three years. The departure of baby boomers from the labor market, sluggish productivity growth, fraying social cohesion, and a backlash against monopoly power could all push up inflation. These forces could also create a more challenging environment for stocks, particularly today’s mega-cap tech names. Peter Berezin Chief Global Strategist peterb@bcaresearch.com Footnotes 1 A recent systematic review of literature found that the Covid-19 infection fatality rate (IFR) stood at 0.7%. Similarly, in September, the Centers for Disease Control and Prevention (CDC) published age-specific IFRs in its Covid-19 Planning Scenarios. The population-weighted average of the CDC’s “best estimate” suggests a 0.7% IFR. Please see “COVID-19 Pandemic Planning Scenarios,” Centers for Disease Control and Prevention, updated September 10, 2020; and Gideon Meyerowitz-Katz, and Lea Merone, “A systematic review and meta-analysis of published research data on COVID-19 infection fatality rates,” International Journal of Infectious Diseases, September 29, 2020. 2 Please see “Covid live updates: CDC estimates only eighth of infections counted,” NBC News Live Blog, November 25, 2020; and “The Latest: South Korea has most daily cases in 8 months,” Associated Press, November 26, 2020. 3 Please see Global Investment Strategy Special Report, “Is The Entire World Heading For Negative Rates?” October 25, 2019; Special Reports “1970s-Style Inflation: Could It Happen Again? (Part 1),” and “1970s-Style Inflation: Could It Happen Again? (Part 2),”dated August 10 and 24, 2018; and Weekly Report, “Is The Phillips Curve Dead Or Dormant?” dated September 22, 2017. 4 Please see this Twitter thread on the latest data from the 100 largest US cities by Patrick Sharkey, Professor of Sociology and Public Affairs at Princeton University. 5 Gustavo Grullon, Yelena Larkin, and Roni Michaely, “Are US Industries Becoming More Concentrated?” Oxford Academic, Review of Finance (23:4), July 2019. 6 Please see The Bank Credit Analyst Special Report, “The Productivity Puzzle: Competition Is The Missing Ingredient,” dated June 27, 2019. Global Investment Strategy View Matrix
Inflation, Innovation, And The Value/Growth Debate
Inflation, Innovation, And The Value/Growth Debate
Current MacroQuant Model Scores
Inflation, Innovation, And The Value/Growth Debate
Inflation, Innovation, And The Value/Growth Debate
Highlights President Trump’s final actions and the US fiscal impasse pose non-trivial risks to the rally. Biden’s foreign policy cabinet picks have limited impact but are mildly positive for now. Biden’s multilateralism will eventually conflict with the need to get things done. Continuities with Trump foreign policy are underrated. The RCEP trade agreement is not a game changer but a pro-trade shift in the US would be. Europe is a clear winner of the US election but continental politics risk will pick up next year from today’s lows. Book profits on select risk-on trades, but go strategically long GBP-EUR. Feature Global financial markets are surging on a raft of good news. We are booking some gains as we expect the rally to be capped in the near term either by Trump’s final actions as president or by the US fiscal impasse. First, the good news. The US power transition is officially under way, reducing US policy uncertainty. The popular vote within the critical battleground states acted as a restraint on the Republican Party’s ability to dispute the results or appoint Republican electors to the Electoral College.1 Chart 1US And Global Policy Uncertainty Falling
US And Global Policy Uncertainty Falling
US And Global Policy Uncertainty Falling
President-Elect Joe Biden is preparing the US for a return to rule by experts. This will not prevent grand policy errors in the future but it will give confidence to the market today. Biden is nominating a slate of White House advisers and cabinet members who are traditional Democrats or left-leaning technocrats. For example, former Fed Chair Janet Yellen looks to serve as Treasury Secretary, longtime Biden and Barack Obama adviser Anthony Blinken as Secretary of State, and former Hillary Clinton and Obama staffer Jake Sullivan as national security adviser. Biden may nominate a few far-left officials (e.g. for the Labor Department) but the most important positions are quickly filling up with conventional faces, a boon for financial markets. Democrats are unlikely to win control of the Senate on January 5 but even if they do their single-vote majority will probably be too small to enable any radical cabinet picks – or radical legislation.2 The downside is that spending will be constrained and monetary and fiscal policy will remain uncoordinated, regardless of Yellen’s unique ability to work with Fed Chair Jay Powell. With Biden reportedly leaning on House Democrats to cut a COVID fiscal relief deal, there is a 50/50 chance that a $500-$750 billion bill passes in the “lame duck” session of Congress prior to Christmas. This would be a positive surprise. We are not counting on a deal until the first quarter next year. Hence US policy uncertainty will remain elevated. Meanwhile global policy uncertainty could spike again as long as President Trump remains in office and seeks to achieve policy objectives on the way out. Biden does not take office until January 20, but over a 12-month horizon we see a clear case for cyclical sectors and European stocks to outperform defensive sectors and American stocks as a result of Biden’s trade peace dividend, i.e. eschewing sweeping unilateral tariffs (Chart 1). Chart 2Vaccine On The Horizon
Keep The Rally At Arm's Length – (GeoRisk Update)
Keep The Rally At Arm's Length – (GeoRisk Update)
While COVID-19 spikes, consumer wariness, and partial lockdowns will weigh on fourth quarter economic activity, several vaccines are on the way. The latest wave of the outbreak is already rolling over in Europe, which bodes well for the United States (Chart 2). Again, the 12-month outlook is brighter than the near term. Over the long haul, investors also have reason to be optimistic about governance in the developed world. The takeaway from this year is that the US and UK, the two major developed markets that saw right-wing populist movements win big votes in 2016, and two governments whose handling of the pandemic was at best muddled, led the development of vaccines in record time to deal with an entirely novel coronavirus and global pandemic.3 The US constitutional system withstood a barrage of partisan assaults both from President Trump and his supporters and their opponents. The British constitutional system is handling Brexit. Most other developed markets also navigated the crisis reasonably well. Weaknesses were revealed, and there will be aftershocks, but the sky is not falling. Near term US policy uncertainty will remain elevated due to fiscal impasse. Bottom Line: The rise in global risk assets may overshoot on positive news, but the US fiscal impasse could undercut the rally, as could Trump’s parting actions over the next two months. Market Not Priced For Lame Duck Trump There is a fair chance of an American or Israeli surgical strike against Iran or its militant proxies to underscore the red line against nuclear weaponization. Financial markets are not prepared for a major incident of armed conflict. Neither Israeli nor UAE equities are priced for near-term risks to materialize. The same goes for UAE or Saudi credit default swaps (Chart 3). An even greater risk to financial markets comes from the Trump administration’s pending actions on China. Trump is highly likely to take punitive or disruptive actions against China. His major contribution to US foreign policy is the confrontation with China, which was also the origin of the coronavirus and hence his electoral defeat. Already since the election Trump has imposed sanctions on US investments in state-owned enterprises. China’s fiscal and quasi-fiscal stimulus is peaking at the moment. This provides some buffer for its economy and the global economy if Trump hikes tariffs or imposes sweeping sanctions. But there are signs of instability beneath the surface. Authorities have tightened interbank rates sharply and intervened to prevent asset bubbles. The country is seeing turmoil in the bond market as a result of these actions and ongoing economic restructuring (Chart 4). Chart 3Risk Of US Or Israeli Strike On Iran
Risk Of US Or Israeli Strike On Iran
Risk Of US Or Israeli Strike On Iran
Chart 4Chinese Stimulus And Bond Market Volatility
Chinese Stimulus And Bond Market Volatility
Chinese Stimulus And Bond Market Volatility
Once again the market is not prepared for another major shock in the US-China relationship. The People’s Bank has allowed the renminbi to appreciate drastically this year. This trend will reverse if President Trump punishes China. As China’s economic momentum wanes and a new US administration enters office, it would make sense to allow the currency to depreciate. After all, the Biden administration will expect the renminbi to appreciate just as all previous administrations have done, but the People’s Bank will not want the yuan to fall much below the ~6.2 level that prevailed just before the trade war started in early 2018 (Chart 5). Chart 5Renminbi Priced For Zero Trump Tariffs
Renminbi Priced For Zero Trump Tariffs
Renminbi Priced For Zero Trump Tariffs
Biden’s Foreign Policy: Continuities With Trump It is too soon to speak of the “Biden Doctrine.” Cabinet appointments will have limited impact relative to geopolitical fundamentals. Neither Biden nor Blinken have a consistent theme to their foreign policy decisions. Michèle Flournoy may or may not be nominated as Defense Secretary. What is clear is that Biden is in favor of establishment national security policymakers who want the US to work more closely with allies and international institutions. Starting in January, this shift will make US foreign policy somewhat more predictable. On Iran, Biden will seek to rejoin the 2015 nuclear deal prior to the June 18, 2021 Iranian presidential election, but he will also have reason to sustain the Arab-Israel rapprochement that the Trump administration initiated via the Abraham Accords. News reports indicate that Israeli Prime Minister Bibi Netanyahu met with Saudi crown prince Mohammad bin Salman along with US Secretary of State Mike Pompeo in a “secret” meeting on November 23. The Saudis could eventually normalize ties with Israel, but only once an Israeli-Palestinian settlement is reached. The Democrats have a long-running interest in negotiating such a settlement. Progress can be made as long as the Saudis and Israelis do not try utterly to sabotage Biden’s Iran deal. They would risk isolation from American support – an intolerable risk for both states. An American détente with Iran combined with normalized Arab-Israeli relations would create something resembling a balance in the region, which is what the Biden administration needs in order to maintain the “pivot to Asia” that will be its dominant foreign policy agenda. Biden’s pivot to Asia will start with a diplomatic “reset” with China so that strategic dialogue can resume and areas of cooperation can be identified. As Chart 5 above shows, the market is priced for Biden to reduce tariffs back to their September 2018 level (25% on $50 billion of imports and 10% on $200 billion). Anything is possible, since tariffs are an executive decision, but we would not bet on Biden sacrificing all of his leverage when the US-China strategic tensions are fundamentally rooted in the US’s loss of global standing and China’s rejection of the liberal world order. What is clear is an emerging contradiction that Biden will eventually have to resolve between multilateralism and getting things done. The Communist Party remains undeterred in its pursuit of economic self-sufficiency and state-backed technological and manufacturing dominance. This will fundamentally run afoul of US interests. If Biden relies on multilateral diplomacy to update and extend the Iranian nuclear deal, he will find it much more difficult to gain Russian and Chinese cooperation than Obama did. Russia’s interference in the 2016 election and Trump’s trade war have poisoned the well. If Biden does not give enough ground to get Russo-Chinese cooperation, then he will have to use unilateral American power (i.e. Trump’s maximum pressure policy) or just settle for rejoining the 2015 nuclear deal without any safeguards against ballistic missiles or militant proxies. The original deal expires in 2025. Chart 6Greater China Still Center Of Geopolitical Risk
Greater China Still Center Of Geopolitical Risk
Greater China Still Center Of Geopolitical Risk
The same goes for Biden’s handling of Trump’s China policy. Biden wants to revive the World Trade Organization. But if he adheres to the WTO then he will have to rescind all of Trump’s tariffs, since they have been declared illegal. This will reduce his leverage on unresolved structural disagreements. Biden wants to reach out to the allies on how to handle China. It is not clear how he will respond to the Trump administration’s outgoing scheme to create an alliance of liberal democracies that would arrange to purchase each other’s goods and possibly implement counter-tariffs in response to Chinese boycotts, such as the one placed on Australia today. Biden may not adopt the scheme. But the alternative would be to leave states to succumb to China’s political boycotts, thus failing to build an effective multilateral response to China’s aggressive foreign policy. China’s fourteenth five-year plan reveals that the Communist Party remains undeterred in its pursuit of economic self-sufficiency and state-backed technological and manufacturing dominance. This will fundamentally run afoul of US interests. Thus we expect the Biden administration to conduct a foreign policy that is tougher on China than the Obama administration, that retains most of the Trump tariffs and tech sanctions, and that more resolutely attempts to build a coalition to pressure China into adopting international liberal norms. This policy trajectory virtually ensures that Biden will have to adopt some of Trump’s policies. Chinese equities are not priced for this risk. The pronounced risk of a fourth Taiwan Strait crisis is just starting to be recognized (Chart 6). The risk to our view is a grand US-China re-engagement. This is possible, but we think the current trajectory of China will cause a new confrontation even if Biden is less hawkish than Trump. Bottom Line: Financial markets are underrating Chinese/Taiwanese political and geopolitical risks, both from Trump’s lame duck period and from Biden’s pivot to Asia. Did China Just Take Charge Of Global Trade? Several clients have written to ask us about the Regional Comprehensive Economic Partnership (RCEP), a large new free trade agreement (FTA) signed by China and its Asian trading partners. RCEP is not a game changer but it is marginally positive for the global economy. Moreover it has the potential to ignite a new round of trade agreements, for instance by provoking the US (and the UK) to join the Trans-Pacific Partnership. RCEP is a traditional free trade agreement that will cut tariffs by an average of 90% for its members. Membership includes China, Japan, South Korea, the Association of Southeast Asian Nations (ASEAN), Australia, and New Zealand. It has not been ratified and will take ten years to fully implement after ratification. Over the past 30 years, manufacturing-oriented East Asian nations have reflexively responded to global shocks and slowdowns by deepening their trade integration. RCEP shows that this trend remains intact. China is the only member of the pact that is seeing trade grow at the moment – the others are still seeing declines due to the global recession but are hoping to increase nominal growth by removing trade barriers (Chart 7). RCEP is also notable because it is China’s second multilateral trade deal (the first was the China-ASEAN FTA). Beijing normally prefers bilateral deals where its size gives it the advantage, but it is trying to demonstrate greater willingness to work multilaterally. President Xi Jinping has rhetorically positioned himself as an advocate of free trade and multilateralism on the global stage, despite his pursuit of import substitution and state industrial subsidies at home. As long as China continues expanding trade with others it will smooth the painful restructuring of its manufacturing sector and blunt some of the criticisms about mercantilism. Ironically it is Japan’s decision to join, rather than China’s, that makes RCEP distinct. Japan did not have an FTA with South Korea and it was the only member of RCEP that did not already have a free trade deal with China. (Japan also lacked a deal with New Zealand.) This decision is not new but reflects the paradigm shift in Japanese national policy that began after the global financial crisis of 2008. In 2011, Japan signed an FTA with India. Thereafter Abenomics supercharged international trade and investment policies as part of the “third arrow” of pro-growth structural reform, which Abe’s successor Yoshihide Suga is continuing. So why is RCEP not a game changer? Because all of these countries other than Japan already have FTAs with each other and their tariff rates are already quite low. Moreover there is nothing particularly advanced about RCEP. It is a traditional deal focused on trade in goods and does not really attempt anything groundbreaking with services, or to incorporate new industries, lay down standards for labor or environment, or remove non-tariff barriers. Contrast the Comprehensive and Progressive Trans-Pacific Partnership (CPTPP), the trade deal originated by the United States for Pacific Rim countries that attempts to do all these things, but was hobbled by the Trump administration’s decision to withdraw from it. The real significance of RCEP is that even as it shows continuity in Asian economic policy, with China at the center, it will also provoke new deal-making. Now that China, Japan, and South Korea are joining a single trade agreement, they will have a foundation on which to move forward with their long-delayed trilateral FTA. These developments will provoke the Biden administration into rejoining the CPTPP, which in turn would create a new higher standard type of trade bloc that has the potential to attract democracies into a high-standards bloc that excludes China. Biden will also revive the Transatlantic Trade and Investment Partnership (TTIP), the European counterpart to the Pacific deal. On the campaign trail, Biden said that he would “renegotiate” Trans-Pacific Partnership in order to rejoin it, a Trumpian formulation. This is feasible. After the US withdrawal, the various members of the Trans-Pacific Partnership modified the deal (dubbing it the CPTPP) to remove provisions that the US had insisted on and restore provisions that the US had demanded they remove. But they will gladly readmit the US now that Trump is gone, creating a trade bloc of comparable size to RCEP but with much more ambitious aims (Chart 8). The UK, South Korea, Thailand and others will be interested in joining. But China can only join if it embraces liberal reforms that are at odds with its new five-year plan, including reduced support for state-owned enterprises. Chart 7Weak Trade Prompts Asian Trade Deal
Weak Trade Prompts Asian Trade Deal
Weak Trade Prompts Asian Trade Deal
Chart 8Putting RCEP Into Perspective
Putting RCEP Into Perspective
Putting RCEP Into Perspective
The Republican Senate will be required to get approval for CPTPP, which is an obstacle, but Biden’s secret weapon is that the CPTPP has special appeal for Republicans precisely because it excludes China. Pro-trade moderates will find common cause with China hawks. As long as Trade Promotion Authority is renewed by the deadline on July 1, 2021, then the US can rejoin CPTPP on a simple majority vote. This is precisely how Republicans ratified Trump’s USMCA (the revised NAFTA). Trump also signed a trade deal with Japan, revealing that even under Trump’s leadership the US agreed to TPP-like deals with its biggest trading partners within the CPTPP (Canada, Mexico, Japan). More broadly, Trump’s experiment with protectionism has revealed that American attitudes toward global trade are not uniformly hostile. Polls show that Americans are generally pro-trade, and while they are skeptical that global trade creates jobs and higher wages, they are mostly skeptical of business-as-usual with China.4 Geopolitically, the US will not be able to stand idly by while China increases its sphere of influence in Asia. Therefore we should expect the Biden administration to pursue the CPTPP and other trade initiatives. The GOP Senate is the key constraint but it is not utterly prohibitive. Bottom Line: China and Asia continue to expand trade in the face of economic slowdown. The US Senate will be the key bellwether for US trade initiatives in 2021-22, but the geopolitical need to counter China will likely force the US to rejoin the CPTPP. Strategically we are long CPTPP equities – which includes some key RCEP members – as well as RCEP equities like South Korea. Chinese equities have already rallied a lot this year due to the country’s better handling of the pandemic and quicker economic recovery – they also face headwinds from US policy. Whereas emerging Asia equities ex-China, relative to all global equities, have plenty of catching up to do and will be beneficiaries of a global recovery in which both the US and China are courting them. Not Too Late To Go Long Pound Sterling The Brexit finale is approaching as the UK and EU enter the eleventh hour in their negotiation of a post-Brexit trade deal for the period after December 31, 2020. The market expects the UK, which is more dependent on EU trade than vice versa, to capitulate to an agreement that prevents a 3% tariff hike on all of its exports to the EU. This hike would occur if the UK-EU relationship reverted to WTO Most Favored Nation status. Boris Johnson promised in the Conservative Party manifesto to negotiate a trade deal and won a resounding single-party majority in December 2019. This gives him the room to marginalize hard Brexiteers and get a deal passed in parliament. The pound has rallied by 1.45% against the dollar since the beginning of the year and it is now rallying against the euro, moving off the “hard Brexit” lows (Chart 9), suggesting that the market is tentatively anticipating a trade deal. Chart 9UK-EU Trade Deal Expected, But GBP-EUR Offers Upside
UK-EU Trade Deal Expected, But GBP-EUR Offers Upside
UK-EU Trade Deal Expected, But GBP-EUR Offers Upside
Chart 9UK-EU Trade Deal Expected, But GBP-EUR Offers Upside
UK-EU Trade Deal Expected, But GBP-EUR Offers Upside
UK-EU Trade Deal Expected, But GBP-EUR Offers Upside
Failing to get a trade deal would require Johnson to break the EU withdrawal deal, since that deal requires a system of trade checks on the Irish Sea that introduces a barrier between Northern Ireland and the rest of the United Kingdom. Johnson has no incentive to stick to this deal if he does not have privileged access to the EU’s single market. But then a hard border of physical customs checks would arise on Northern Ireland’s border with the Republic of Ireland. This would not only aggravate relations with Ireland and the EU but would alienate the incoming American administration, which would view it as a violation of the US-brokered Good Friday Agreement (1998) and refuse to agree to a trade deal with the UK. Irish equities are not behaving as if a 3% tariff on all imports from the UK is about to take effect (Chart 10). Both GBP-USD and Irish equities have considerable downside if the deal falls through. The fact that the GBP-EUR appreciation is slight suggests less downside and more upside here. Subjectively we have argued there is a 35% chance that the UK will quit the EU “cold turkey” at the end of the year. The cost of more than $6 billion in foregone trade, which would grow each year, is not prohibitive. The economy is already subsisting on monetary and fiscal stimulus due to COVID-19. Boris Johnson does not face an election until 2024. The hardest limitation facing the UK is the relationship with Scotland. The hardest limitation facing the UK is the relationship with Scotland. Northern Ireland is not likely to leave anytime soon but 45% of Scots voted for independence in 2014. Support for independence meets resistance at 50% of the population (Chart 11), but an economic shock stemming from a failure to get a trade deal would push it above the limit (given that 62% of Scots never wanted to leave the EU in the first place). Chart 10Irish Equities Already Priced UK Trade Deal
Irish Equities Already Priced UK Trade Deal
Irish Equities Already Priced UK Trade Deal
Chart 11Scotland Drives UK Toward A Trade Deal
Scotland Drives UK Toward A Trade Deal
Scotland Drives UK Toward A Trade Deal
Johnson has the ability to conclude a deal, avoid an economic shock on top of COVID, keep the Scots in the union, and then set about overseeing his government’s mammoth economic recovery plan. His popularity is tenuous enough that the other pathway is not only more economically costly but also more likely to get him unseated and potentially to burden him with the legacy of being the last prime minister of a united kingdom. Bottom Line: It is not too late to go long GBP-EUR. A near-term global risk-off move would work against this trade but it is a strategic opportunity. Low EU Political Risk Will Pick Up In 2021 In our annual outlook for 2020 we highlighted how the EU was relatively politically stable while its geopolitical competitors – Russia, China, even the US – were far from stable. Today this is still the case – Europe’s political fundamentals are fine. But risks are rising due to partial COVID lockdowns, fiscal risks, and the approach of a series of important elections from now through 2022. A major problem for the global economy is the looming contraction in fiscal deficits in 2021 as economies step down from this year’s extraordinary fiscal stimulus measures. This downshift will be especially disruptive for the US, UK, and Italy due to the size of their stimulus packages, resulting in a fiscal drag of 5% of GDP if no additional measures are taken. But even Germany, France, and other EU members face at least a 2.5% of GDP contraction (Chart 12). Chart 12Europe's Fiscal Cliff Needs Attention
Europe's Fiscal Cliff Needs Attention
Europe's Fiscal Cliff Needs Attention
Chart 12Europe's Fiscal Cliff Needs Attention
Europe's Fiscal Cliff Needs Attention
Europe's Fiscal Cliff Needs Attention
Adding more fiscal support should be feasible in a world where the Fed and ECB are maintaining ultra-dovish monetary policy for the foreseeable future and the EU has agreed to allow mutualized debt issuances. Germany has embraced deficit spending in the wake of the austerity-laden 2010s, which brought significant populist challenges to the European political establishment. However, developed market economies are still highly indebted, a constraint on deficits, and those with political blockages could still have trouble passing large enough spending measures to remove the impending fiscal drag. The US faces gridlock in 2021 and therefore its fiscal cliff is a significant headwind to financial markets. One positive factor in providing fiscal support thus far is that, with the exception of Spain and the UK, European leaders and ruling coalitions have received a bounce in popular opinion this year (Chart 13). Chart 13EU Leaders’ Approval Bounced – Now What?
Keep The Rally At Arm's Length – (GeoRisk Update)
Keep The Rally At Arm's Length – (GeoRisk Update)
Mark Rutte and his People’s Party for Freedom and Democracy (VVD) have benefited more than other countries but the combined support for opposition parties is rising ahead of the March 17, 2021 general election (Chart 14, top panel). A leading anti-establishment candidate has dropped out of the race. Fiscal measures will depend on the election. Chart 14Will EU Elections Really Be A Cakewalk?
Will EU Elections Really Be A Cakewalk?
Will EU Elections Really Be A Cakewalk?
Chart 15European Risk To Rise On Looming Elections
European Risk To Rise On Looming Elections
European Risk To Rise On Looming Elections
The German and French governments have also seen a bounce in support but need to maintain it for a longer period, as they have elections due by October 24, 2021 and May 13, 2022 respectively. French President Emmanuel Macron can still summon majorities in the National Assembly, despite losing his single party majority, and has sidelined his structural reform agenda to boost the economy. Germany is also capable of passing new measures, and has time to do so before momentum wanes amid the contest to succeed Chancellor Angela Merkel. The leadership race in the ruling Christian Democratic Union will at least raise hawkish rhetoric (Chart 14, middle panels). But markets will be placated by the fact that popular opinion is not pro-austerity at present, and the alternative to the CDU is a fiscally profligate left-wing coalition consisting of the Greens, Social Democrats, and possibly the anti-establishment hard-left, Die Linke. Spain and Italy have the least stable governments, are the likeliest to see snap elections, and thus could surprise the market with fiscal risks. Both governments lack a strong mandate and rule over a divided political scene. Italy’s Prime Minister Giuseppe Conte has seen a swell of support but he is a fairly non-partisan character and his coalition has been flat in opinion polling. It is less popular than the combined right-wing opposition, which is striving for power ahead of the fairly consequential 2022 presidential election. In Spain, not only has popular approval dropped, but the Socialist Party and the left-wing Podemos run a minority government, meaning that there is potential for gridlock to increase fiscal risk (Chart 14, bottom panels). The market is pricing higher political risk for European countries amid the partial COVID lockdowns but this risk will likely remain elevated due to looming elections (Chart 15). The market is pricing higher political risk for European countries amid the partial COVID lockdowns but this risk will likely remain elevated due to looming elections. The silver lining is that Brussels, Berlin, and the wider political establishment have become fundamentally more accepting toward budget deficits during times of distress. The ECB and European Commission Recovery Fund provide a combined monetary and fiscal backstop. Negative interest rates on debt enable fiscal largesse with minimum implications for sustainability. And none of these elections raise systemic risks regarding EU and EMU membership, other than conceivably Italy. So while fiscal risk will become more relevant in 2021, it is not a problem while COVID is still raging, and there are better chances of maintaining a fiscally proactive policy than at any previous time over the past two decades. Bottom Line: European elections and a looming fiscal drag will keep EU political risk from collapsing after the latest round of lockdowns ease. Biden And Emerging Market Strongmen Most of the emerging market strongmen – Recep Erdogan, Vladimir Putin, Jair Bolsonaro – have increased their popular support this year, benefiting from national solidarity in the face of crisis. The exception is Narendra Modi, who is struggling (Chart 16). Still, Modi has a single-party majority and four years on the election clock, and is thus more stable than Bolsonaro, who fundamentally lacks a political base despite his bounce in polls, and Erdogan, whose increase in support will fade amid a host of domestic and international challenges ahead of the 2023 elections. The US election will have limited impact on these leaders. None of them have good relations with the Democratic Party and some were openly pro-Trump. But this is only marginally negative and may not have concrete ramifications. The key is that the Biden administration will be more conducive toward a global trade recovery, will relax restrictions on immigration, will favor US diversification away from China, and will put pressure on authoritarian regimes. Chart 16Strongman Popularity Boost Will Fade
Keep The Rally At Arm's Length – (GeoRisk Update)
Keep The Rally At Arm's Length – (GeoRisk Update)
Other things being equal, Biden is therefore positive for India, neutral for Brazil and Turkey, and negative for Russia. Our GeoRisk Indicators suggest that political risk has peaked for Brazil and Russia and equities could bounce back, but we think Russian political risk will surprise to the upside (Chart 17). Chart 17Political Risk Still High In Emerging Markets
Political Risk Still High In Emerging Markets
Political Risk Still High In Emerging Markets
In the case of Russia, the Biden administration will take a more confrontational approach than previous presidents, including Obama and Bush as well as Trump. However, it still needs to rejoin the Iran nuclear deal and extend the New START (Strategic Arms Reduction Treaty) with Russia through 2026, so the pro-democracy pressure campaign will have to be balanced with negotiations. Russia, for its part, is increasingly focused on the need for domestic stability, at least until Biden makes concrete steps with NATO that threaten Russian core interests. Bottom Line: Emerging market political risk is high, the vaccine will arrive more slowly, and the Biden administration will take a tougher approach toward authoritarian regimes. This creates an opportunity for India but a risk for Russia, and is neutral for Brazil and Turkey. Strategically we are constructive on EM equities but in the near 0-3 month time frame all bets are off. Investment Recommendations With clear near-term political and geopolitical risks, and extremely elevated equity prices and sentiment, we think it is a good time to book some profits. We are closing our long global equities relative to bonds trade for a gain of 27%. Chart 18Reinitiate Long Global Aerospace/Defense Stocks
Reinitiate Long Global Aerospace/Defense Stocks
Reinitiate Long Global Aerospace/Defense Stocks
We are closing our long investment grade corporate bonds relative to similarly dated Treasuries for a gain of 15%. We are closing our long China Play Index trade for a gain of 7% in recognition that China’s stimulus is nearing its peak while the Trump administration will take punitive measures in his final two months. We will also retain our long gold trade. Gridlock in the US government is not reflationary but gold is still attractive due to geopolitical risk. Strategically we recommend going long GBP-EUR. We also recommend reinitiating a strategic long position in defense stocks. Specifically, global aerospace and defense stocks relative to the broad market (Chart 18). We have been long defense stocks since 2016 but COVID decimated the trade. The coming vaccines promise to reboot the aerospace part of this trade while there was never any reason to doubt the strong basis for global defense spending amid geopolitical great power struggle. Matt Gertken Vice President Geopolitical Strategy mattg@bcaresearch.com We Read (And Liked) … Black Wave “What happened to us?” Black Wave seeks to answer the cardinal question facing both Middle Easterners and those looking into the Middle East from the outside.5 It takes us back four decades to events that shaped the region and walks us through time and space, politics, religion, history and culture, to where we stand – in the crosshairs of the very clash that started it all. Few are better equipped than author Kim Ghattas in doing so. A native of Beirut, she grew up amid the Lebanese civil war, living the events that created the post-1979 Middle Eastern reality. Later, she spent two decades covering the Middle East as a journalist for the BBC and Financial Times. A term first coined by Egyptian filmmaker Youssef Chahine, “black wave” characterizes the religious tide that swept Egypt in the 1990s from the Persian Gulf – one that Chahine saw as alien to Egyptians. Instead he argued that while Egyptians had always been very religious, they also had joie de vivre – enjoying art, music, talent, all taboos according to the Wahhabi interpretation of Islam. Iranians in the late 1970s were not much different from Egyptians in the 1990s. At the time, they were unified in their opposition to the Pahlavi dynasty for being too Western and corrupt. As an exile in the sacred Iraqi city of Najaf and later in the French village of Neauphle-le-Chateau, Ayatollah Ruhollah Khomeini’s speeches were capable of inspiring minds, galvanizing support, and gathering crowds. He was the right character, at the right time, but with the wrong ideas. Ideologically, Khomeini was an outsider in Najaf. The Iraqi clergy considered him too politically involved and his vision of wilayat al-faqih – a state based on Islamic jurisprudence – did not have widespread appeal. It was dismissed as outlandish by those around him who aimed to take advantage of his widespread appeal for their own gains, while hoping to limit Khomeini’s ideological influence on his audience. This proved to be a grave disregard for Iranians. 1979 was also a transformative year for Saudi Arabia. The young monarchy faced a national awakening as Juhayman al-Otaybi staged a siege on the Muslim world’s most sacred site, the Grand Mosque in Mecca. It was the first act of terrorism in opposition to Western influence – the birth of Saudi extremism – and was echoed in subsequent acts of violence in the kingdom, in 1995 and later in 2003. Fearing the spread of political Islam, the House of Saud responded by emphasizing Wahhabism, Riyadh’s homegrown Islamic movement, by empowering clerics and religious authorities. The quid pro quo was that the clerics supported the monarchy from both internal and external threats. The clash between the Iranian Revolution and Saudi Wahhabism in 1979 gave rise to the first sectarian killings. The 1987 Sunni-Shia clash in Pakistan marked the beginning of the modern day Sunni-Shia divide, spreading through Pakistan and eventually the Middle East to Lebanon, Iraq, and Syria. Today, as youth across the Middle East struggle in despair of the aftermath of these events, Ghattas sees hope. Protests ringing from Beirut to Baghdad call for a post sectarian political system. The Saudi monarchy is relaxing its puritanical grip, and a new generation brings newfound hope of rectifying past miscalculations. We ultimately agree with Ghattas’s optimism that these changes are hopeful indications that the people of the Middle East are ready to shift gears and move past the conflicts that have dominated the past four decades. However, there are other forces at play and the Saudi-Iranian rivalry is still a dominant feature of the region’s geopolitical landscape. True, Ghattas’s account not only highlights how deeply engrained the conflict is, but also that the early signs of tidal shifts can be easily missed. But we cannot ignore the specter of near-term risk facing the Middle East that continue to challenge its economic and political ascent. Thus, from an investment standpoint, we favor a more cautious approach and remain on the lookout for a better entry point once the near-term manifestation of these long-standing hurdles are overcome. Roukaya Ibrahim Editor/Strategist Geopolitical Strategy RoukayaI@bcaresearch.com Footnotes 1 The Supreme Court could still rule that Pennsylvania should have stuck with its November 3 deadline for ballots, but such a ruling would not change the outcome of the election. As with Florida following the disputed election in 2000, the various states’ electoral systems will likely be stronger as a result of this year’s polarized contest and narrow margins. 2 Biden could use the Vacancies Act or recess appointments to ram through his cabinet picks, but it would be controversial and at present he looks to be taking advantage of the Republican veto to nominate center-left figures that are more ideologically lined with his lane of the Democratic Party. 3 US-based Moderna developed one vaccine while US-based Pfizer and Germany-based BioNTech developed another. The Anglo-Swedish company AstraZeneca jointly developed its vaccine with Oxford University. Vaccine trials were administered across these countries and others, including South Africa, India, Brazil, and the entire global health care and pharmaceutical supply chain contributed. 4 See Pew Research. 5 Kim Ghattas, Black Wave: Saudi Arabia, Iran, and the Forty-Year Rivalry That Unraveled Culture, Religion, and Collective Memory in the Middle East (New York: Henry Holt, 2020), 377 pages. Section II: GeoRisk Indicators China
China: GeoRisk Indicator
China: GeoRisk Indicator
Russia
Russia: GeoRisk Indicator
Russia: GeoRisk Indicator
UK
UK: GeoRisk Indicator
UK: GeoRisk Indicator
Germany
Germany: GeoRisk Indicator
Germany: GeoRisk Indicator
France
France: GeoRisk Indicator
France: GeoRisk Indicator
Italy
Italy: GeoRisk Indicator
Italy: GeoRisk Indicator
Canada
Canada: GeoRisk Indicator
Canada: GeoRisk Indicator
Spain
Spain: GeoRisk Indicator
Spain: GeoRisk Indicator
Taiwan
Taiwan: GeoRisk Indicator
Taiwan: GeoRisk Indicator
Korea
Korea: GeoRisk Indicator
Korea: GeoRisk Indicator
Turkey
Turkey: GeoRisk Indicator
Turkey: GeoRisk Indicator
Brazil
Brazil: GeoRisk Indicator
Brazil: GeoRisk Indicator
Section III: Geopolitical Calendar
Highlights US Corporates: The decision by the US Treasury to let the Fed’s emergency lending programs expire does not sound the death knell for the bull market in US corporate debt. Credit markets are functioning normally and US economic growth remains resilient, even amid a surge in COVID-19 cases, with politically unpopular European-style lockdowns unlikely. Global Corporate Strategy: Remain moderately overweight developed market corporate debt, favoring the US over the euro area. Look to increase allocations to lower-rated US high-yield credit on any near-term spread widening, as there is more room for junk spread compression over the next 6-12 months as defaults peak. Feature When looking at the 2020 year-to-date total returns from global corporate credit, the performance at first blush has not been terrible. The Bloomberg Barclays Global Investment Grade Corporate index has returned 8.2% since the start of the year, while the benchmark global high-yield index has returned 3.6%. While the bulk of those returns have come from duration exposure as global bond yields have fallen sharply, a passive allocation to corporate bonds on January 1 has been a money-making investment in 2020. Chart of the WeekUS Credit Markets Need Less Policymaker Support
US Credit Markets Need Less Policymaker Support
US Credit Markets Need Less Policymaker Support
Of course, a lot has happened since the beginning of the year. A global pandemic, a historically severe global recession, a massive selloff of risk assets in February and March and an equally robust recovery of equity and credit markets on the back of huge monetary and fiscal stimulus. It should come as no surprise that the 2020 peak in US corporate bond spreads occurred on March 23 – the day that the Fed and US Treasury introduced asset purchase vehicles designed to support stricken US credit markets. This is why the announcement last week that outgoing US Treasury Secretary Steve Mnuchin has decided to let those emergency lending facilities expire on December 31, with the Fed returning the US Treasury’s capital invested in those programs, is potentially of major significance for credit investors. It is reasonable to think that credit markets could suffer without the Fed’s involvement. The growth and market liquidity backdrop, however, has improved substantially over the past several months. US corporate bonds can live, and likely thrive, without the Fed backstop. The US economy remains surprisingly resilient, with the November flash estimate for the Markit composite PMI index reaching the highest level since 2015. This occurred even in the midst of a huge surge of global COVID-19 cases that has weighed heavily on European economies (Chart of the Week). Add to that signs that corporate bond markets are functioning smoothly - investors are willing to commit capital to credit markets, and borrowers are having no problem placing large volumes of debt at low yields and spreads – and it is easy to conclude that Fed’s explicit support is no longer required. The growth and market liquidity backdrop, however, has improved substantially over the past several months. US corporate bonds can live, and likely thrive, without the Fed backstop. From the point of view of corporate bond investment strategy, we continue to recommend a moderate overweight stance on global corporate debt versus government bonds over the next 6-12 months, favoring US investment grade and high-yield over European equivalents, even with the Fed pulling away its bid. Steve Mnuchin May Have A Good Point Even though Fed Chair Jerome Powell publicly disagreed with Treasury Secretary Mnuchin’s decision, the Fed will shut down the Primary Market Corporate Credit Facility, the Secondary Market Corporate Credit Facility, the Term Asset-Backed Loan Facility, the Municipal Liquidity Facility and the Main Street Lending Program on December 31. Those facilities are part of the US government support programs under the Coronavirus Aid, Relief and Economic Security (CARES) Act. The US Treasury seeded the facilities with $195 billion in capital, which the Fed levered up to create as much as $2 trillion in buying power (Table 1). Yet the actual usage of that spending capacity has been quite low, with only $13.3 billion spent in the Fed’s secondary market facility. Not a single dollar was spent in the primary market facility, as companies had no problems issuing debt directly to markets rather than selling new bonds to the Fed. Table 1US CARES Act Programs: Little-Used, But Highly Successful
US Corporate Credit Can Walk Without Crutches
US Corporate Credit Can Walk Without Crutches
According to data from the Securities Industry and Financial Markets Association (SIFMA), the pace of monthly US corporate bond issuance and daily trading volumes are now following the typical seasonal pattern seen over the past two years (Chart 2). This occurred after a surge of issuance activity in Q2 as issuers took advantage of the vastly improved trading conditions in corporate bond markets after the initiation of the Fed’s liquidity backstop. Treasury Secretary Mnuchin noted these trends in his letter to Fed Chair Powell that was essentially an order to shut down the Fed’s emergency lending facilities.1 Chart 2US Credit Markets Are Functioning Normally
US Credit Markets Are Functioning Normally
US Credit Markets Are Functioning Normally
Chart 3No Stomach For Nation-Wide Lockdowns In The US
No Stomach For Nation-Wide Lockdowns In The US
No Stomach For Nation-Wide Lockdowns In The US
US credit markets are not only functioning well, so is the US economy. The Markit US services PMI rose in November to 57.7 (from 56.9 in October), while the same index fell to 41.3 (from 46.9) in the euro area and 45.8 (from 51.4) in the UK (Chart 3). As services industries like dining, travel and retail spending are most directly impacted by lockdowns related to COVID-19, it should not be a surprise that the data underperformed massively in Europe, where severe economic restrictions have been imposed to slow the spread of the virus. This compares to the US where the restrictions have been far more modest and varying across cities and regions. The pace of monthly US corporate bond issuance and daily trading volumes are now following the typical seasonal pattern seen over the past two years. Some slowing of US domestic economic activity should be expected over the next month or two, with more parts of the country putting greater restrictions on activities like indoor dining and in-person schooling. However, the political will to impose the sort of harsh nation-wide “shelter at home” type lockdowns currently in place in Europe is simply not there in the US after the shock of the Q2 lockdown-induced economic slump. US growth should thus continue to outperform – to the benefit of US corporate bond market performance relative to US Treasuries and European corporate equivalents. US corporate bond yields, both for investment grade and high-yield credit, have already declined massively in 2020, as have yields for European credit and even emerging market bonds (Chart 4). Given our view that US Treasury yields have bottomed and will likely drift higher over the next 6-12 months, it will be difficult to see further declines in corporate bond yields that are already near record lows. Chart 4Corporate Yields Falling To New Lows
Corporate Yields Falling To New Lows
Corporate Yields Falling To New Lows
Chart 5Corporate Spreads Approaching 2020 Lows
Corporate Spreads Approaching 2020 Lows
Corporate Spreads Approaching 2020 Lows
Corporate bond spreads, on the other hand, do have room to compress even just to levels seen before the February/March credit market rout – especially for US high-yield. The option-adjusted spread (OAS) for the Bloomberg Barclays US investment grade index is now 17bps away from the 2020 low, while the OAS for the euro area and UK are 7bps and 8bps away, respectively. For high-yield, the US index OAS is 107bps above the 2020 low, compared to 95bps for euro area high-yield and 81bps for UK high-yield (Chart 5). The near-term economic case for favoring US corporates over European corporates is a strong one, given the slightly larger spread cushions for US credit and the absence of large-scale US lockdowns. Given the severity of the lockdown-induced economic slump in the euro area and UK, which is likely to linger over the holiday season and into the early part of 2021, the near-term economic case for favoring US corporates over European corporates is a strong one, given the slightly larger spread cushions for US credit and the absence of large-scale US lockdowns. Bottom Line: The decision by the US Treasury to let the Fed’s emergency lending programs expire does not sound the death knell for the bull market in US corporate debt. Credit markets are functioning normally and US economic growth remains resilient, even amid a surge in COVID-19 cases, with politically unpopular European-style lockdowns unlikely. A Quick Look At Corporate Bond Spread Valuations In The US & Europe The tremendous rally in global corporate bond markets since late March has pushed credit spreads down to levels that raise concerns about valuations. Thus, it is now a good time to revisit some of our favorite spread valuation metrics. One simple way to evaluate the attractiveness of the level of spreads, and how much further they could fall, is to compare them to standard macro volatility gauges like the US VIX index. Credit spreads and equity volatility are highly correlated, as both are measures of investor uncertainty that rise during risk-off episodes and vice versa. The ratio of corporate credit spreads to equity volatility, therefore, can signal if spreads appear stretched relative to the broader risk backdrop. Chart 6US Corporate Spreads Look Tight Vs Equity Vol
US Corporate Spreads Look Tight Vs Equity Vol
US Corporate Spreads Look Tight Vs Equity Vol
Chart 7Euro Area Corporate Spreads Look Tight Vs Equity Vol
Euro Area Corporate Spreads Look Tight Vs Equity Vol
Euro Area Corporate Spreads Look Tight Vs Equity Vol
We show the ratio of the US investment grade and high-yield index OAS to the VIX index in Chart 6. For both higher-quality and lower-rated corporate credit, the spread-to-VIX ratio is now close to the lowest level seen since 2000 – both around 1.7 standard deviations below the long-run mean – suggesting that spreads are tight relative to overall macro volatility We show similar ratios for euro area corporates versus the VStoxx European equity volatility index in Chart 7, and UK corporates versus the IVI UK equity volatility index in Chart 8. The conclusions are similar to US credit, with spread-to-volatility ratios for both investment grade and high-yield now at low levels, one standard deviation below the mean since 2000. Chart 8UK Corporate Spreads Look Tight Vs Equity Vol
UK Corporate Spreads Look Tight Vs Equity Vol
UK Corporate Spreads Look Tight Vs Equity Vol
Chart 9Notable Duration Differences Between Corporates
Notable Duration Differences Between Corporates
Notable Duration Differences Between Corporates
It is difficult to draw any relative conclusions about credit valuations between the regions from the spread/volatility ratios, as they all point to spreads looking tight. Thus, we need to look at other valuation tools. Our more preferred metric to assess credit spreads is to look at the percentile rankings of 12-month breakeven spreads. The 12-month breakeven spread is the amount of credit spread widening that must occur for a credit product to have a return equal to a duration-matched, risk-free government bond over a one-year horizon. We look at the historical percentile ranking of the 12-month breakeven spreads to determine how current levels compare with the past. It is difficult to draw any relative conclusions about credit valuations between the regions from the spread/volatility ratios, as they all point to spreads looking tight. To calculate the 12-month breakeven spreads for corporate bonds, we take the ratio of the index OAS to the index duration for the specific bond market in question. This allows a comparison of breakeven spreads across different markets with varying risks, with duration being a main source of price risk (Chart 9). The 12-month breakeven spreads for the investment grade and high-yield corporate debt for the US, euro area and UK are shown in Charts 10, 11 and 12, respectively. For the US, the breakeven spread for investment grade corporates is currently in the bottom decile of its history, suggesting that the spread does not look particularly attractive on a risk-adjusted basis. Chart 10US Corporate Bond Breakeven Spread Percentile Rankings
US Corporate Bond Breakeven Spread Percentile Rankings
US Corporate Bond Breakeven Spread Percentile Rankings
Chart 11Euro Area Corporate Bond Breakeven Spread Percentile Rankings
Euro Area Corporate Bond Breakeven Spread Percentile Rankings
Euro Area Corporate Bond Breakeven Spread Percentile Rankings
Chart 12UK Corporate Bond Breakeven Spread Percentile Rankings
UK Corporate Bond Breakeven Spread Percentile Rankings
UK Corporate Bond Breakeven Spread Percentile Rankings
Euro area and UK investment grade breakeven spread percentile rankings are a bit higher than in the US, right on the cusp of the bottom quartile for both. Although for euro area corporates, the breakeven spread is boosted by the much lower duration of the euro area investment grade index and does not necessarily suggest that spreads there are currently more attractive than in the US and UK. Turning to junk bonds, the US high-yield 12-month breakeven spread is currently in the 67th percentile of its own history, suggesting that spreads are relatively attractive. The UK high-yield breakeven spread is also above average, with the latest reading in the 55th percentile. Euro area high-yield is the least attractive, with the latest 12-month breakeven spread in the 33rd percentile of its own history. Taking the 12-month breakeven spread as a measure of value (and, hence, a gauge of prospective future returns), we can compare it to a measure of spread volatility to evaluate the risk/return tradeoff for various credit markets. To measure spread risk, our preferred metric is duration times spread (DTS). We show a scatter chart of the latest 12-month breakeven percentile ranking for the overall US, UK and euro area corporate bond markets – for investment grade and high-yield, and including all the major credit rating tiers – in Chart 13. The most attractive trade-off of valuation versus spread risk is currently in the lower rated US junk bond tiers (B-rated and Caa-rated). Chart 13Comparing Value (Breakeven Spreads) With Risk (Duration Times Spread)
US Corporate Credit Can Walk Without Crutches
US Corporate Credit Can Walk Without Crutches
Chart 14A Lingering Positive Impact On Credit Markets From Global QE
A Lingering Positive Impact On Credit Markets From Global QE
A Lingering Positive Impact On Credit Markets From Global QE
What stands out in the chart is that the most attractive trade-off of valuation versus spread risk is currently in the lower rated US junk bond tiers (B-rated and Caa-rated). At the other end of the spectrum, US investment grade offers one of the least attractive risk/reward tradeoffs. This suggests a potential attractive opportunity to move down in quality within US corporate debt, particularly with ultra-accommodative global monetary policies providing a lingering tailwind for global corporate bond performance over the next 6-12 months (Chart 14). We prefer scaling into that trade on any bouts of US high-yield weakness, however. There are still near-term risks associated with the rapid spread of COVID-19 in the US and the lack of momentum on US fiscal stimulus negotiations during the transition period to the new Biden administration. Turning across the Atlantic, euro area high-yield looks far less attractive than US high-yield on a risk/reward basis. This fits with our current recommendation to underweight euro area junk bonds versus US equivalents (see our strategic recommendation tables on page 14). We also continue to recommend an overweight stance on UK investment grade corporates, which still offer a slightly more attractive risk/return tradeoff versus US equivalents. Bottom Line: Remain moderately overweight developed market corporate debt, favoring the US over the euro area. Look to increase allocations to lower-rated US high-yield credit on any near-term spread widening, as there is more room for junk spread compression over the next 6-12 months as defaults peak. Robert Robis, CFA Chief Fixed Income Strategist rrobis@bcaresearch.com Footnotes 1 Mnuchin’s letter to Powell can be found here: https://home.treasury.gov/system/files/136/letter11192020.pd Recommendations The GFIS Recommended Portfolio Vs. The Custom Benchmark Index
US Corporate Credit Can Walk Without Crutches
US Corporate Credit Can Walk Without Crutches
Duration Regional Allocation Spread Product Tactical Trades Yields & Returns Global Bond Yields Historical Returns
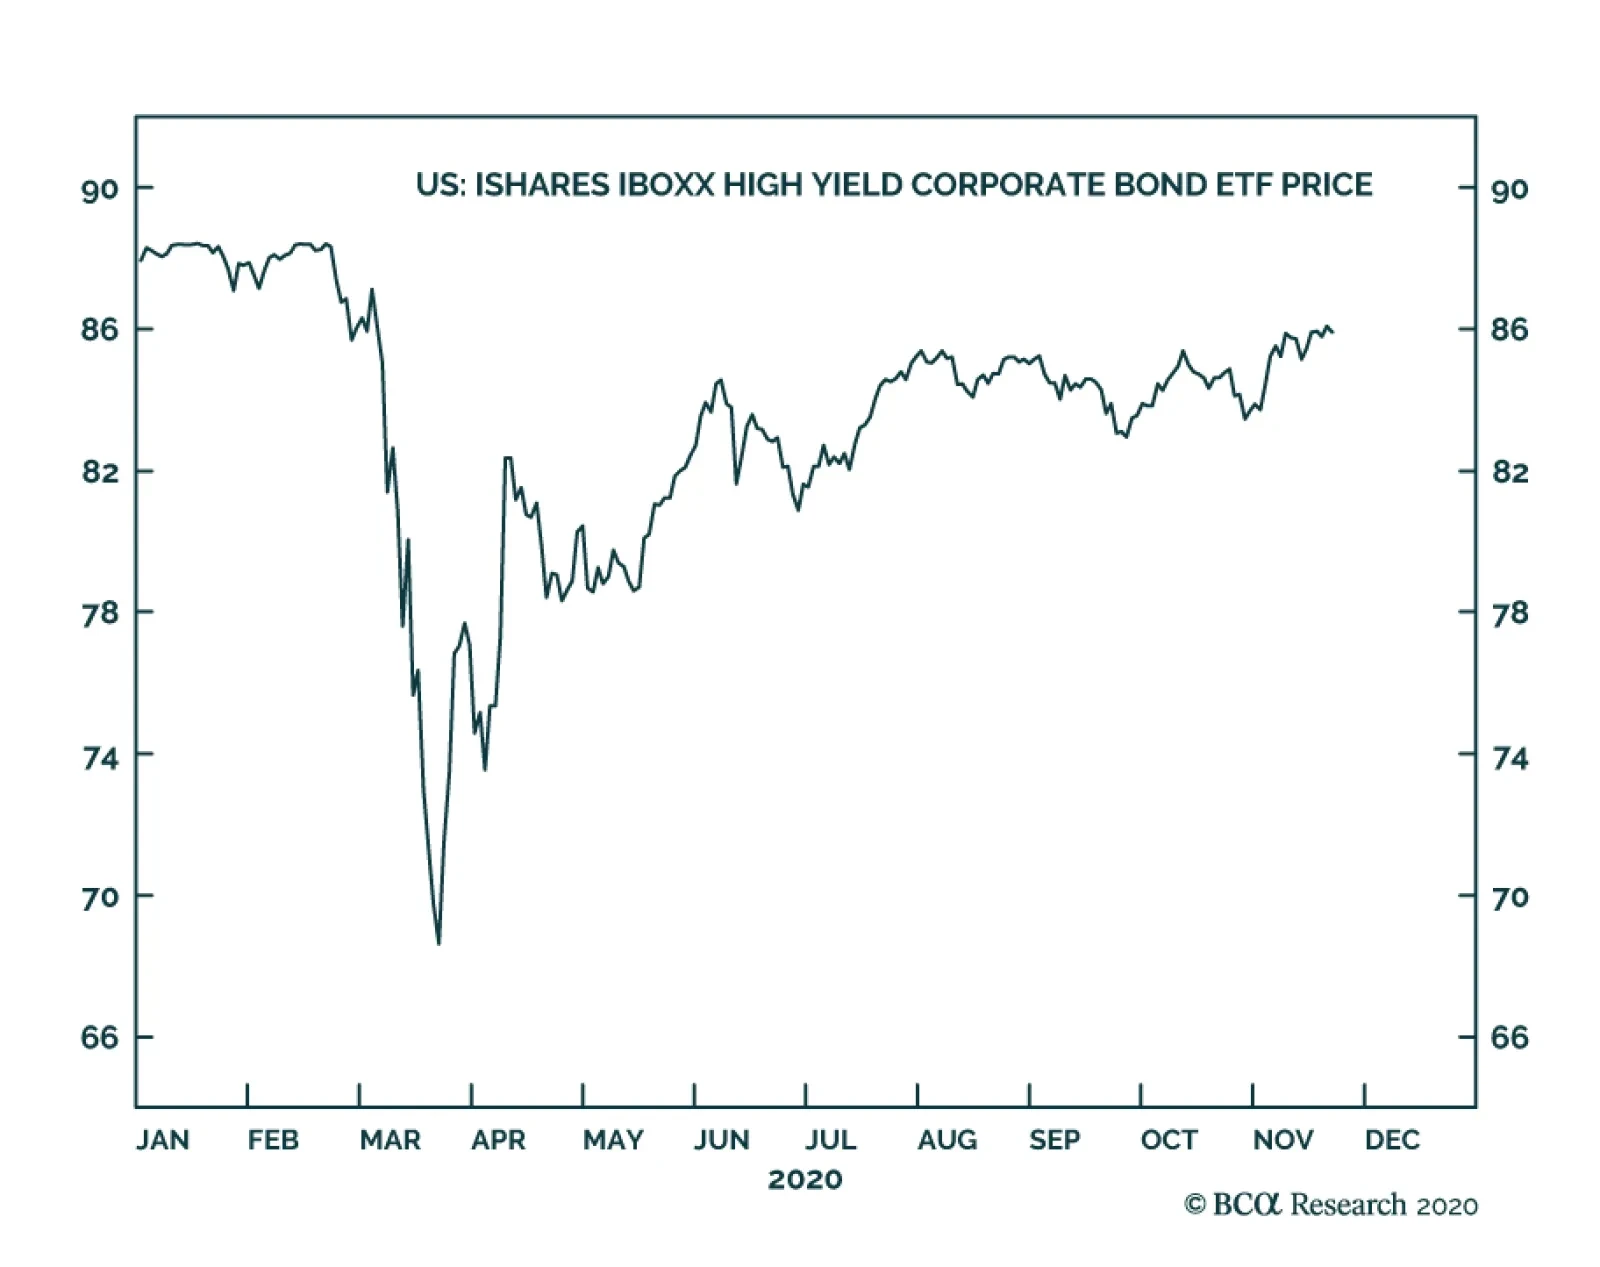
On Friday, Treasury Secretary Mnuchin requested that the Fed return unused funds from some select emergency facilities that were unveiled earlier this year, and is not seeking to renew them when they expire on December 31st 2020. These programs include the…
Highlights Iran is second only to China as a target for President Trump during his “lame duck” two months in office. There is plenty of spare capacity to absorb oil supply disruptions, however. President-Elect Biden will rejoin the 2015 Iranian nuclear deal, but the process will be rocky and we are far from a balance of power in the Middle East. The impact on oil supply is positive but the recovery of global demand will push oil prices up over time regardless. Now is not the right time to go long Middle Eastern equities as a reflation trade. We favor the Trans-Pacific Partnership countries. Israeli stocks can continue outperforming Middle East bourses as a whole, but the rotation from growth to value stocks will benefit other bourses. Prefer the UAE to Turkey, where a large political risk premium will persist. Feature Dear Client, With the US election largely complete, this week marks the return to our regular coverage of global market-relevant political risks. Over the past several months we have focused heavily on every aspect of the US election. The effort was worth it: our final forecast of Democratic White House and a Republican Senate came to pass and our trade recommendations generally performed as expected. Nevertheless it is time to refresh and expand our views on other markets and topics. Geopolitical Strategy has always been – necessarily – a global service offering global coverage. Recent events in China, Europe, Russia, Turkey, and the Middle East demand greater attention – and clients have told us as much. Moreover, with promising vaccine candidates on the horizon, major questions are emerging about what the post-pandemic world will bring. To this end we are returning to our roots with weekly offerings on the full range of global affairs. This week we give you a Special Report on the future of the Middle East by one of BCA’s up-and-coming strategists, Roukaya Ibrahim. We know you will find her post-Trump outlook on the region insightful. As always, we look forward to hearing from you about your research needs and what we can do to answer your geopolitical and investment questions in a timely and actionable manner. Sincerely, Matt Gertken Vice President Geopolitical Strategy The Middle East is about to become a major source of geopolitical risk again. First, President Trump remains in office for two months and is rushing to cement his legacy on the way out. Second, President-Elect Joe Biden will likely face gridlock at home and therefore concentrate the first two years of his presidency on foreign policy. Iran is a priority for both presidents. Biden will rejoin the Joint Comprehensive Plan of Action (JCPA), the 2015 nuclear deal with Iran, which Trump pulled out of in 2018. The purpose of the JCPA was to wind down the US war in Iraq and then “pivot” to Asia, where the US has a much greater interest at stake in managing China’s rise (Chart 1). Chart 1Biden To Restore Obama's 'Pivot To Asia'
Biden To Restore Obama's 'Pivot To Asia'
Biden To Restore Obama's 'Pivot To Asia'
Chart 2Squint To See Iran ... US Will Focus On China
Squint To See Iran ... US Will Focus On China
Squint To See Iran ... US Will Focus On China
China poses a major challenge to the US while Iran poses a minor challenge (Chart 2). Biden’s aim will be to restore President Obama’s legacy. Given that the US president has unilateral authority on foreign policy, and that the 2015 deal was an executive deal without Senate approval, Biden has a good chance of success. But conditions are much less propitious than in 2015. He will not improve on the terms of the 2015 deal. Any return to a nuclear agreement and deeper understanding with Iran should ultimately reduce tensions in the Middle East. But the pathway to a new regional power equilibrium is rocky. So geopolitical risk is frontloaded and will be a near-term negative factor for Middle Eastern equities, which otherwise stand to benefit from global economic recovery. Restoring Iranian oil exports will increase global oil supply but geopolitical conflict will occasionally reduce supply. As always Iraq, wedged between Iran and US allies, is the central battleground for the power struggle in the Middle East (Map 1). Over a six-to-twelve month time frame, the global economy should recover and oil prices should trend upward. Map 1The Persian Gulf Is Filled With Black Swan Risks
The Middle East After Trump And COVID-19
The Middle East After Trump And COVID-19
Biden Looks To Withdraw Like Obama And Trump Chart 3Biden May Regulate, But US Stays Energy-Independent
Biden May Regulate, But US Stays Energy-Independent
Biden May Regulate, But US Stays Energy-Independent
The US’s ascent toward energy self-sufficiency and its geopolitical decline vis-à-vis China have forced Washington to revise its foreign policy over the past decade, resulting in a strategic divestment from the Middle East (Chart 3). The “Pivot to Asia” is a strategic reality evident in the shift in US military commitments – and Trump has ordered new drawdowns on his way out of office. China’s increasing geopolitical pressure on Australia and rising saber-rattling in the Taiwan Strait highlights the need for the energy-independent US to attend to allies elsewhere. The American public’s view of the Middle East as a strategic quagmire is now producing its third presidency. Obama, Trump, and Biden have all pledged to end the country’s “forever wars” in various ways. The risk to this trend, ironically, was Trump’s aggressive policy on Iran. He revoked Obama’s signature diplomatic achievement and tried to squash Iran’s regional role through “maximum pressure” sanctions and occasional military strikes. He also reinforced US allies Israel and Saudi Arabia, rather than trying to rein them in as Obama had done. Biden’s victory implies that the US will once again favor diplomacy and détente with Iran. Although Iran may make a show of resistance to Biden’s overtures and raise its price so as not to appear to have capitulated to the US, it ultimately has little choice. Its economy is on its last legs, it faces widespread popular unrest, and its sphere of influence is crumbling. Hence constraints on both sides point to a restored nuclear deal. The first obstacle is immediate. President Trump’s “lame duck” period through January 20 is a window of opportunity for Israel or Saudi Arabia to make strategic gains while still enjoying full American support. We highlight the allies because they have much more to fear from Iranian power than the US, and more to lose if the Biden administration appeases Iran. The Trump administration has allegedly reviewed options to launch strikes against Iran since the election, but he has also allegedly ruled against them (as in June 2019). While Trump could still take some kind of action, he would likely face obstruction from the Department of Defense if he tried to do anything that would trigger a full-fledged war in his final two months. It falls to the allies then – or Iran – if conflict is to erupt in the near term. Obama, Trump, and Biden have all pledged to end the country’s "forever wars" in various ways. Cyber-attacks on Iranian nuclear sites this summer are a case in point (Table 1). Suspicious explosions, including at the preeminent Natanz nuclear site, were rumored to be the work of Israel and the United States and raised the specter of a military escalation. However, Iran stuck to its policy of “strategic patience,” hoping for a Biden win. Table 1US And Israel Suspected Of Sabotaging Iran This Year
The Middle East After Trump And COVID-19
The Middle East After Trump And COVID-19
It is possible that elements within the Iranian regime, such as the Iranian Revolutionary Guard Corps (IRGC), could launch attacks to deter further sabotage against their infrastructure and capabilities. The IRGC is focused on rigging the 2021 presidential election and ensuring its ascendancy within the Iranian state ahead of the 82 year-old Supreme Leader Ali Khamenei’s succession, so it cannot be assumed to be quiet. The legacy of the outgoing President Rouhani – a relative moderate in Iran’s political scene – hinges on the success of the 2015 agreement, which he pledged would bring economic prosperity to Iran. The deal’s near-collapse has blighted this legacy and triggered a resurgence of hardliners in Iranian politics. This is clear from the February legislative elections in which hardliners won by a landslide (Chart 4). The hardening of the regime will continue, as Khamenei and the IRGC are increasingly focused on solidifying the regime’s security and authority prior to the succession. The next president will almost certainly be a hardliner reminiscent of Mahmoud Ahmadinejad. Oil price volatility should be expected, but over time the vaccine will secure the global economic recovery and oil prices will rise. Still, we assign low odds to Iran instigating a war or pulling out of the JCPA. The past two years have raised the specter of regime collapse. Khamenei is more likely to keep his eye on the prize: a diplomatic agreement with Biden that eases sanctions and thus enables the regime to live to fight another day. This would be his crowning achievement. The change in US leadership offers Tehran an excuse to renegotiate the 2015 deal and blame Trump as an idiosyncratic deviation from an agreement that lay in Iran’s interest. As long as Khamenei retains control of the IRGC this is our base case. Israel is limited in its ability to wage war against Iran alone, but it is not incapable of surgical strikes to set back the clock on the nuclear program, especially if the Trump administration is there to provide assistance in an exigency. The risk is not negligible. Trump’s former National Security Adviser H. R. McMaster has already warned that Israel could act on the “Begin Doctrine” of preemptive strikes against would-be nuclear powers in its neighborhood. While the near-term risk of conflict would remove oil supply, there is a simultaneous risk that cartel behavior would increase supply. Iran’s regional rivals have an interest in preventing a US-Iran deal, but they could not do so in 2015 and ultimately cannot do so today. Therefore they will seek to shore up their political strength in Iraq while undermining the Iranian economy. Saudi Arabia and other oil-producing GCC states benefit from the maximum pressure sanctions that have wiped out Iranian crude exports. The collapse in oil markets is weighing heavily on these economies. An Iranian deal would bring an additional 1mm b/d – 1.5 mm b/d of crude to global markets in short order. Arab petro-states will not cut back on their own production to make room for Iranian crude. They may try to grab greater oil market share ahead of any surge in Iranian exports. In the current oil market environment, Iran has more to lose from the status quo than do its Arab rivals. While ongoing conflict would add to the multiple crises facing Arab oil producers, the risk to oil production is less relevant today than it was at the top of the business cycle. OPEC 2.0 production is ostensibly capped at 36.42 mm b/d but there is plenty of spare capacity to make up for conflict-induced losses (Chart 5). Chart 4Hardliners Roaring Back To Power In Iran
The Middle East After Trump And COVID-19
The Middle East After Trump And COVID-19
Chart 5Plenty Of Spare Oil Production Capacity
Plenty Of Spare Oil Production Capacity
Plenty Of Spare Oil Production Capacity
Bottom Line: Biden’s election ensures that he will try to revive the Iranian nuclear deal and pivot to Asia. While this is positive for Middle Eastern stability over the medium term, it comes with near-term risks. A “lame duck” President Trump or Israel could strike out against Iran. The Gulf Arabs will do what they can to undermine Iran as well. Oil price volatility should be expected, but over the long run the main tendency will be for the global economy to recover and hence for oil prices to rise. Iraq: A Persistent Source Of Instability Iraq is the fulcrum of the US-Iran conflict, as witnessed in January with the US assassination of Quds Force commander Qassem Suleimani. Torn between Tehran and Riyadh, Baghdad remains in political crisis and is the chief battleground in the regional power struggle. Prime Minister Mustafa al-Kadhimi is still struggling to bring Iraq’s various militias, many backed by Iran, under the control of the state. The US embassy, military bases, and other interests have been under attack throughout the summer, prompting Secretary of State Mike Pompeo to threaten to withdraw the US embassy from Baghdad (Table 2). As in the past any escalation between Iran and the US will likely occur in Iraq. Table 2Iran Adopting Deterrence Strategy In Iraq
The Middle East After Trump And COVID-19
The Middle East After Trump And COVID-19
Beyond Trump’s lame duck period, if Washington looks to normalize relations with Iran, then various Iraqi and Saudi forces will try to make sure that Iraq remains independent. Iraq is the critical strategic buffer zone for Saudi Arabia and it will use its leverage with Sunni forces inside Iraq to oppose Iranian domination and warn the US against giving too much to Iran. The problem for Iraq is that the US is divesting from the region and Biden will focus on the Iranian deal to the neglect of other issues. As a result the Saudis will escalate their influence campaign and Iraq will remain unstable. Bottom Line: Iraq is ground zero for the creation of a new regional power equilibrium. If the US manages to secure its allies, even while reviving the Iranian deal, then Iraq has a prospect of stabilization. But the insecurity of US allies will predominate so Iraq remains at risk of instability, militancy, and oil supply disruptions. A New Dawn? Unification to counter Iran is the chief motive behind the Abraham Peace Accords signed between Israel and the UAE, Bahrain, and Sudan with the Trump administration’s mediation (Table 3). Table 3The Abraham Accords Unify Iran’s Regional Rivals
The Middle East After Trump And COVID-19
The Middle East After Trump And COVID-19
Although Israel and the UAE had already been cooperating and sharing intelligence, the deal creates a formal diplomatic partnership against Iran that the countries will need even more as the US pivots to Asia. From Washington’s perspective, the deal enables it to reduce its direct management of the region and delegate authority to its ally and partners. While Saudi Arabia did not sign a deal with Israel, it has signaled a change in strategy. Bahrain is ultimately a Saudi proxy and would not have signed the agreement without Riyadh’s blessing. Moreover, the decision to open Saudi airspace to Israeli airplanes highlights closer cooperation. Additional motives that helped seal the deal: President Trump sought a foreign policy win ahead of the election. The deal reflects his promise to withdraw from the Middle East. Having won 48% of the popular vote, Trump’s approach will loom large over the Republican Party. Israeli Prime Minister Benjamin Netanyahu hoped the deal would secure him a political win amid unpopularity at home. Israel was not even forced to accede to the UAE’s demand to halt the annexation of the West Bank: Netanyahu merely announced that annexation was postponed. And on October 14, only a month after the accords were signed, Israel approved new settler homes in the occupied West Bank. For the UAE, the deal requires little effort but is economically and militarily beneficial. It improves its chances of purchasing long-sought F-35 fighter jets from the US. It is also consequential that the UAE was the first to sign the deal. Abu Dhabi is seeking to raise its stature as a regional power. It has engaged in various Middle Eastern conflicts including in Libya and Yemen and is the only Arab state to have committed troops to Afghanistan for security and humanitarian missions. The UAE has also expanded its influence by being the top source of capex investments in the region (Chart 6). It has emerged as a model Arab state and seeks to replicate that success in its geopolitical status (Chart 7). Chart 6UAE The Top Mideast Investor
The Middle East After Trump And COVID-19
The Middle East After Trump And COVID-19
Ultimately the Abraham Accords reflect a shift in Middle Eastern politics to address the US’s withdrawal and changing landscape. The deal’s signatories seek to improve ties not only to face Iran but also to face Turkey, Russia, and even China. Chart 7UAE Leads The Pack
The Middle East After Trump And COVID-19
The Middle East After Trump And COVID-19
Opinion polls suggest that young Arabs’ favorable perception of the US are linked to its involvement in the region. Their perception of the US as an ally, or somewhat of an ally, increased post-2018 when President Trump initiated his maximum pressure campaign on Iran (Chart 8). Chart 8US Image Has Bottomed Among Arab Youth
The Middle East After Trump And COVID-19
The Middle East After Trump And COVID-19
The Abraham Accords are also significant in that they mark a departure from the Arab Peace Initiative. The Initiative conditions normalization of Arab relations with Israel on Israeli withdrawal from the West Bank, Gaza Strip, Golan Heights, and Lebanon. Until recently, this initiative was a hallmark of regional diplomacy. Palestinians of course have rejected the Abraham Accords and expressed dismay at what they perceive to be disloyalty. Their sidelining could result in an increase in radicalism and militant activity in Israel, though Biden’s election will now blunt that effect and put new demands on Israel. Similarly, Turkey and Qatar oppose the agreement. The rift will widen between the authoritarian states (the GCC and Egypt) and those in favor of political Islam (Turkey and Qatar). Unlike Israel’s previous peace treaties with Egypt and Jordan, which did not result in any economic gains, bilateral economic cooperation is a cornerstone of the Abraham Accords (Table 4). Thus the agreement not only explicitly aligns geopolitical positions in the Middle East, it also weaves Israel into the region’s economies, generating gains for all sides and cementing the partnership. This is a positive example of Trump’s transactional approach to foreign policy. Table 4The Abraham Accords By Sector
The Middle East After Trump And COVID-19
The Middle East After Trump And COVID-19
Bottom Line: The Abraham Accords reflect long-developing structural changes in the Middle East. With the US reducing its direct management in the region, Israel and the Arab states are drawing together – particularly in opposition to Iran. If Biden restores the Iranian nuclear deal, there may be a semblance of balance in the region. But its durability will depend on the uncertain willingness of the US to keep the peace. Great Power Struggle Instability stemming from Washington’s shift away from the Middle East is being exacerbated by the competition by great powers and middle powers over filling the power vacuum. Russian and Turkish interference has had mixed results. Both are exerting their influence through greater military engagement in Syria and Libya, in which they have partially stabilized these countries. For instance, Moscow’s 2015 decision to send its air force and some ground troops to Syria reversed President Bashar al-Assad’s fate in Syria, giving him new life. Similarly, Ankara’s increased involvement in the Libyan crisis earlier this year helped the Tripoli-based government drive General Khalifa Haftar’s Libyan National Army back to its eastern enclave. Chart 9AChina Pivots To Middle East
China Pivots To Middle East
China Pivots To Middle East
Yet Russia’s commitment is deliberately limited and likely to become more limited due to increasing domestic political risks. Turkey’s ruling Justice and Development Party has been in power for two decades, is showing economic and political weakness, and is overreaching in international conflicts. Therefore these countries’ interventions do not have a high degree of staying power or predictability. A more durable trend is China’s growing influence in the region. China’s approach emphasizes soft power rather than hard power, but the latter will gradually come into play. China’s main motive is to secure oil supplies. It has emerged as the top oil importer, 46% of which are sourced from the Middle East (Charts 9A and 9B). Chinese interest in the region is evident in its “Comprehensive Strategic Partnerships” (the highest of China’s diplomatic levels) with several key regional actors (Table 5). Chart 9BChina’s Mideast Dependency Grows
The Middle East After Trump And COVID-19
The Middle East After Trump And COVID-19
Rather than interfering in regional politics, China has favored economic cooperation. It has emerged as a top foreign investor in the Arab region (Chart 10 and see Chart 16 below). Table 5China Cultivates Mideast Relations
The Middle East After Trump And COVID-19
The Middle East After Trump And COVID-19
Chart 10Awaiting Return Of Chinese Investment
The Middle East After Trump And COVID-19
The Middle East After Trump And COVID-19
This approach has been well received by the Arab population, at least the younger generations. The Arab youth see China the most favorably among all the competing foreign actors (Chart 11). Chart 11Arab Youth Have Positive Views Of China
The Middle East After Trump And COVID-19
The Middle East After Trump And COVID-19
However, China is also becoming more scrutinizing of its investments in the region. The Belt and Road Initiative is no longer just a blank check. Beijing’s investments are starting to pick up and will continue to revive as its economy recovers in the coming years, but Middle Eastern states will not be able to assume they have China’s unconditional support (Chart 12). Chart 12China's Investment Just Starting To Revive, At Best
China's Investment Just Starting To Revive, At Best
China's Investment Just Starting To Revive, At Best
While China has improved relations with Saudi Arabia and the GCC during the Trump administration’s conflict with Iran, Biden raises the possibility of China reviving its interest in Iran, which is a key linchpin of its Belt and Road Initiative and other strategies of deepening economic relations across Eurasia. Gradually China will take a more obtrusive role. It built its first overseas military base in Djibouti in 2017. Moreover, the strategic pact with Iran it is negotiating, which is likely to be very large even if lower than the official price tag of $400 billion over 25 years, also includes military cooperation. If US-China tensions persist at today’s high levels, China will try to improve its supply security in the Middle East, which will eventually become another front in the new cold war. Bottom Line: The power vacuum left by the US’s reduced commitment to the region has not been filled by any of the major or middle powers. Russian, Chinese, and Turkish actions are unclear and in some cases contradictory. China has the potential to fill in some of the vacuum, but at the moment Chinese strategic involvement is nascent. Détente between the US and Iran clears the way for China to revive relations with Iran, a linchpin of its global, regional, and Eurasian strategy. Economic Progress … Interrupted While these cyclical and structural geopolitical shifts play out, Middle Eastern states also find themselves in a weak economic situation. The double whammy of pandemic and the collapse in oil prices is weighing on household, corporate, and government budgets. It is exposing long-standing vulnerabilities, unwinding recent progress, and introducing new challenges. Arab petro-states face a funding gap in the midst of economic contraction. With oil prices significantly below those needed to balance their budgets, they are re-prioritizing their spending (Chart 13). Chart 13Fiscal Squeeze Hits Arab Petro-States
The Middle East After Trump And COVID-19
The Middle East After Trump And COVID-19
While this adjustment has come at the expense of strategic economic plans, in some cases it has also led to an acceleration of fiscal reforms. Oman and Saudi Arabia are cases in point. Oman has been implementing a 5% value-added tax (VAT) since April and plans to impose taxes on high-income earners beginning 2022. Similarly, Saudi Arabia tripled its VAT from 5% to 15%, eliminated a bonus cost-of-living allowance previously granted to public sector employees, and increased custom duties for several imported goods. The immediate aim of these measures is to offset some of the weakness in oil revenues (Chart 14). But over the long run they align with the strategic objective of transitioning from resource-dependent rentier states to economically diverse ones. While the economic shock has weighed on both household and government budgets, the GCC oil producers generally enjoy low debt-to-GDP ratios and comfortable government coffers. They are better positioned than their neighbors to survive the downturn without it morphing into a social, political, or economic crisis. Oil-importing Arab states, on the other hand, face limited fiscal space and have been forced to walk back recent structural reform progress while limiting their fiscal response to the recession (Chart 15). Egypt is highly dependent on tourism and remittances from Arab petro-states. The recession has reversed the improvement in its fiscal situation following austerity measures imposed as part of the three year IMF program. Chart 14Fiscal Reforms Underway
The Middle East After Trump And COVID-19
The Middle East After Trump And COVID-19
Chart 15More Stimulus Needed
The Middle East After Trump And COVID-19
The Middle East After Trump And COVID-19
That said, as long as nominal GDP outpaces interest on the debt, these countries will avoid a debt crisis. Although Egypt’s 10-year yield is 14.8%, its expected nominal GDP growth of 19.7% this year will ensure debt sustainability. By contrast, Tunisia is more at risk, as the yield on its 10-year government bond is near 10% yet nominal growth lags in the single digits. While policymakers across the region have implemented measures to ease burdens on households through various policies, Gulf Arab states have in some cases limited the benefits to nationals. For instance, the Qatari government announced on June 1 that it would reduce non-Qatari employee wage bills by 30%. While this protects the incomes of GCC nationals, it puts non-nationals at risk of income loss, raising the possibility that weakness among oil-producers will be transferred to non-oil producers. Chart 16Iran Teetering On Edge
Iran Teetering On Edge
Iran Teetering On Edge
This is not to say that GCC nationals are completely immune to income or employment loss. In fact, the unemployment rate among Saudi nationals, which was already higher than the overall unemployment rate, jumped 2.5 pp in the second quarter to 15.5%. The Shia Crescent remains the most vulnerable neighborhood in the Middle East. Syria collapsed over the past decade, Lebanon is in the process of collapse, and Iran and Iraq are teetering (Chart 16). The IMF estimates that Iran needs oil prices at $521.2/bbl to balance its fiscal account! Weakness in Iran has spread across its sphere of influence — i.e. other predominantly Shia states and non-state actors who depend on Tehran for informal funding. Mass protests against poor economic conditions and corruption afflicted Iraq and Lebanon in the fall of 2019, forcing both governments to resign late last year. The political and economic situations have only deteriorated since. The August 4 blast at the Port of Beirut was the final straw for Lebanon which is now facing financial meltdown. Meanwhile, Iraq’s stability continues to be tested. The collapse in oil markets has weighed on government revenues as well as on the current account, which is projected to record a deficit worth 12.6% of GDP this year, following surpluses in the previous years. The good news is that the discovery of a COVID-19 vaccine points to a rebound in global economic activity over the coming 12 months. The bad news is that the virus is breaking out again and the distribution of the vaccine will take time. Eventually the combination of vaccines and additional monetary and fiscal stimulus in the developed world will alleviate some of the Middle East’s deepest strains, but it will be a rocky road. Social and political problems will escalate for some time even after the economy bottoms. Regarding the outlook for oil markets, BCA’s Commodity & Energy Strategists see the confluence of steadily improving demand, a decline in US shale-oil production, and OPEC 2.0 production management pushing oil prices higher. They forecast Brent will average $63 per barrel next year, compared to $44 per barrel at current prices, and they make a good fundamental case for oil to average between $65 - $70 per barrel over the coming five years. The latest readings from global manufacturing PMIs send bullish signals, suggesting that Middle Eastern recovery is gradually underway (Chart 17). It is the near-term that is most treacherous. Chart 17Global Rebound Not A Moment Too Soon
Global Rebound Not A Moment Too Soon
Global Rebound Not A Moment Too Soon
Chart 18New Lockdowns Pose Near-Term Risks
The Middle East After Trump And COVID-19
The Middle East After Trump And COVID-19
On the demand-side, COVID-19 cases globally are trending upward with several European countries imposing partial lockdowns (Chart 18). While the lockdowns are unlikely to be as severe as earlier this year, they threaten to delay the recovery in oil markets. In response, the OPEC 2.0 coalition of producers, which was planning to reduce production cuts to 5.7 mm barrel per day in January (leading to higher output) may instead extend the current 7.7 mm barrel per day cuts when it meets again in December 2020. This means petro-states will need to contend with low prices and revenues for longer, while oil importers see shortfalls in remittances. Aside from risks to the oil market, the resurgence in COVID-19 cases adds further uncertainty to the expected recovery in global growth through knock-on effects on activity. Even though not all Middle Eastern countries are experiencing the second wave of the disease, governments have generally tightened stringency measures recently (Chart 19). Chart 19COVID-19 Restrictions Vary By Country
The Middle East After Trump And COVID-19
The Middle East After Trump And COVID-19
Bottom Line: Middle Eastern economies have been hit hard by the double whammy of pandemic and oil price collapse. Policy responses have been measured to limit deviation from long-term goals. This is a positive for the long-term outlook. We expect improvements in the global economy and the recovery in oil markets over the coming 12 months to alleviate some of the pressure. However, risks are skewed to the downside and a protracted downturn could put to waste recent structural improvements. Countries that lie in the so-called “Shia Crescent” – Iran, Iraq, and Lebanon – are in dire need of resuscitation. Oil importers face the risk that the cyclical downturn unwinds recent economic improvements and uncovers structural vulnerabilities, weighing on the strategic outlook. Arab petro-states enjoy the most comfortable coffers. But even their economies are at risk, especially in the high-risk scenario in which oil markets do not recover anytime soon. Saudi Arabia and Oman are at a disadvantage versus Qatar in this sense given their outsized dependence on oil and higher fiscal breakeven oil price. Investment Implications Middle Eastern equity market capitalization is growing over time relative to the rest of the world (Chart 20). The region remains a reflation play, with a heavy sectoral focus on materials and financials as well as energy. Thus it stands to benefit over the long run as the global recovery gets underway. Chart 20Investors Gaining Interest In Mideast Over Time
Investors Gaining Interest In Mideast Over Time
Investors Gaining Interest In Mideast Over Time
However, today is not an attractive entry point for the Middle East relative to other emerging markets. The rebalancing of oil markets, the current wave of COVID-19 before the vaccine rollout, and near-term geopolitical risks outlined above imply that the Middle East will face a period of heightened uncertainty and uninspiring equity performance. Protracted economic weakness will weigh on social stability. The oil-rich GCC is least vulnerable to popular unrest as it has the space to be generous to its citizens. But even these countries have had to cut some benefits. The pandemic will erode the social contract currently in place whereby monetary incentives are awarded to make up for the lack of political voice. The Shia Crescent is already in crisis as bouts of mass protests have been occurring in Iran, Iraq, and Lebanon for the past year. And the pandemic has derailed the economic recovery of various states that had only recently gotten back on track after the Arab Spring. Another bout of economic weakness will push people back into the streets, threatening to topple governments again (Chart 21). Chart 21Unrest Will Rise Even After Economic Bottom
The Middle East After Trump And COVID-19
The Middle East After Trump And COVID-19
A good entry point into Middle Eastern equities will emerge once the global economy gets onto a better footing as the US and Iran will likely achieve a precarious balance. Geopolitics and the recession are forcing Arab states to adopt greater pragmatism in their economic and foreign policies. Reform policies are creating more diverse economies, as in the case of the UAE (Chart 22), which, unlike Saudi Arabia, is decoupling its equity performance from oil prices. Chart 22UAE About Financials, Saudi About Oil
UAE About Financials, Saudi About Oil
UAE About Financials, Saudi About Oil
The risk to Israel, aside from politics, is that it is a tech-heavy bourse that could start to underperform neighbors like the UAE amid the likely global rotation into value stocks and cyclicals. Chart 23Israel Outperforms, But Beware Rotation To Value
Israel Outperforms, But Beware Rotation To Value
Israel Outperforms, But Beware Rotation To Value
Israel has been outperforming the broad Middle East basket, including the UAE, and that trend looks to continue. But it does not look attractive relative to emerging markets as a whole. The risk to Israel, aside from politics, is that it is a tech-heavy bourse that could start to underperform neighbors like the UAE amid the likely global rotation into value stocks and cyclicals. Israel equity performance relative to Turkey closely tracks global growth versus value stocks (Chart 23). However, we do not recommend playing this specific pair trade. For that we would also need to see an improvement in Turkish governance. Turkey may benefit from global macro developments but its country risk will remain extreme. The recent change of central bank leadership temporarily improved Turkey’s relative performance but does not mark a fundamentally positive turning point in policy, according to BCA’s Emerging Markets Strategist Arthur Budaghyan. President Recep Erdogan is unlikely to adopt orthodox monetary policy and austerity prior to the 2022 elections. The approach of the elections, and several simultaneous foreign adventures, will keep the Turkish political risk premium elevated. Therefore the UAE provides the better long end of a value play on the Middle East. Roukaya Ibrahim Editor/Strategist Geopolitical Strategy RoukayaI@bcaresearch.com
The chart above presents an estimate from Bruegel, a European think tank, of the immediate 2020 fiscal impulse as a % of GDP for the US and several European countries. Bruegel’s approach breaks down discretionary fiscal measures in response to the COVID-19…
Highlights COVID-19: Markets are trading off the longer-term positive news on COVID-19 vaccines, rather than the shorter-term negative news of surging numbers of new virus cases in Europe and North America. This will continue as long as the vaccine results stay promising, further boosting global equity and credit market performance, especially versus government bonds, as investors price in a return to “normalcy”. FX & Monetary Policy: An increasing number of central banks have raised concerns about unwanted currency appreciation. With interest rates stuck near-zero, asset purchases and balance sheet expansion will be the marginal policy tool used to limit currency moves, especially vs the US dollar. The greater impact will be on bond yield spreads versus US Treasuries with the Fed being less aggressive on QE. Stay underweight the US in global government bond portfolios. Feature Chart of the WeekMarkets Reacting Calmly To This COVID-19 Surge
Markets Reacting Calmly To This COVID-19 Surge
Markets Reacting Calmly To This COVID-19 Surge
With US election uncertainty now fading away on a stream of failed Trump legal challenges, investors have turned their attention back to COVID-19. On that front, there has been both good and bad news. New cases and hospitalizations have surged across the US and Europe, leading to renewed economic restrictions to slow the spread at a time when governments are dragging their heels on fresh fiscal stimulus measures. Yet markets are seeing past the near-term hit to growth, focusing on the positive news from both Pfizer and Moderna about their COVID-19 vaccine trials with +90% success rates. With markets looking ahead to a possible end to the pandemic, growth sensitive risk assets have taken off. The S&P 500 is now at an all-time high, with beaten-up cyclical sectors outperforming. Market volatility is calm, with the VIX index back down to the low-20s. The riskier parts of the corporate bond universe are rallying hard, with CCC-rated US junk bond spreads tightening back to levels last seen in May 2019. Even the US dollar, which tends to weaken alongside improving global growth perceptions, continues to trade with a soggy tone - the Fed’s trade-weighted dollar index has fallen to a 19-month low (Chart of the Week). Expect more non-US quantitative easing (QE) over the next 6-12 months, to the benefit of non-US government bond performance. The weakening trend of the US dollar has already become a monetary policy issue for some central banks that do not want to see their own currencies appreciate versus the greenback at a time of depressed inflation expectations. Expect more non-US quantitative easing (QE) over the next 6-12 months, to the benefit of non-US government bond performance. There Is Room For Optimism Amid More Lockdowns The latest wave of coronavirus spread has dwarfed anything seen since the start of the pandemic. The number of daily new cases in the US, scaled by population, has climbed to 430 per million people in the US, setting a sad new high for the pandemic. The numbers are even worse in Europe, led by France where the number of new cases reached a high of 757 per million people on November 8 (Chart 2A). COVID-19 related hospitalization rates have also surged in the US and Europe, straining the capacity of health care systems to care for the newly sickened. In Europe, governments have already imposed severe restrictions on activity to limit the spread of the virus. According the data from Oxford University, the so-called “Government Response Stringency Index”, designed to measure the depth and intensity of lockdown measures such as school closures and travel restrictions, has returned to levels last seen during the first lockdowns back in March and April (Chart 2B). Chart 2AA Huge Second Wave of COVID-19
A Huge Second Wave of COVID-19
A Huge Second Wave of COVID-19
Chart 2BEconomic Restrictions Weighing On European Growth Vs US
Economic Restrictions Weighing On European Growth Vs US
Economic Restrictions Weighing On European Growth Vs US
Oxford data on spending on sectors most impacted by lockdowns, like retail and recreation, also show declines in Europe and the UK similar in magnitude to those seen last spring. The data in the US, on the other hand, shows no nationwide pickup in lockdown stringency, or decline in spending. While economic restrictions are starting to be imposed in parts of the US, the hit to the overall domestic economy, so far, has been limited compared to what has taken place on the other side of the Atlantic. To be certain, the positive headlines on the vaccines will limit the ability of US local governments to impose unpopular restrictions anywhere near as severe as was seen earlier this year. Yet even if a vaccine ready for mass inoculation arrives relatively quickly, it will not be a smooth path to getting widespread public acceptance of the vaccine. According to a Pew Research survey conducted in late September, only 51% of Americans would take a COVID-19 vaccine as soon as it was available (Chart 3). This was down from 72% in a similar survey conducted in May during the panic of the first US wave of the virus. The declines in willingness to take the vaccine were consistent across groupings of age, race, education and political leanings. Of those who said they would not take a vaccine right away, 76% cited a concern about potential side effects as a major reason. Chart 3Most Americans Are Wary Of A COVID-19 Vaccine
Nobody Wants A Stronger Currency
Nobody Wants A Stronger Currency
So even with an effective vaccine now on the horizon, it may take some time to convince people that it is safe to take it. What is clear now, however, is that economic sentiment took a hit from the surge in COVID-19 cases before the vaccine news arrived. The latest ZEW survey of economic forecasters, published last week, showed a decline in growth expectations across the developed economies in the early days of November (Chart 4). The decline occurred for all countries, including the US, but was most severe for the UK, where there are not only new COVID-19 lockdowns but also the looming risk of a messy upcoming resolution to the Brexit saga. Yet the net balance of survey respondents was still positive for all countries in the survey, suggesting that underlying economic sentiment remains robust even in the face of more COVID-19 cases and increased lockdowns in Europe. The ZEW survey also asks questions on sentiment for other factors besides growth. Expectations for longer-term bond yields have moved moderately higher in recent months, as have inflation expectations, although both took a slight dip in the latest survey (Chart 5). No changes for short-term interest rates are expected, consistent with most central banks promising to keep policy rates near 0% for at least the next couple of years. Chart 4COVID-19 Surge Weighing On Global Growth Expectations
COVID-19 Surge Weighing On Global Growth Expectations
COVID-19 Surge Weighing On Global Growth Expectations
While global bond yield expectations have clearly bottomed, the ZEW survey shows that expectations for global equity and currency markets have also shifted in what appears to be pro-growth fashion. Chart 5Global Interest Rate Expectations Have Bottomed
Global Interest Rate Expectations Have Bottomed
Global Interest Rate Expectations Have Bottomed
Survey respondents expect both the US dollar and British pound to weaken versus the euro. At the same time, expectations for future equity market returns have improved, even for European bourses full of companies whose profitability would presumably suffer with a stronger euro (Chart 6). As the US dollar typically trades as an “anti-growth” currency, depreciating during global growth upturns and vice versa, greater bullishness on global equities and more bearishness on the US dollar are not inconsistent views – especially with bond yield and inflation expectations also rising. Greater bullishness on global equities and more bearishness on the US dollar are not inconsistent views – especially with bond yield and inflation expectations also rising. Chart 6Bullish Equity Sentiment, Bearish USD Sentiment
Bullish Equity Sentiment, Bearish USD Sentiment
Bullish Equity Sentiment, Bearish USD Sentiment
The big question that investors must now grapple with is if the near-term hit to growth from the latest COVID-19 surge will be large enough to offset the more medium-term improvement in economic sentiment with a vaccine now more likely to be widely distributed in 2021. Given the message from bullish equity and corporate credit markets, and with US Treasury yields drifting higher even with US COVID-19 cases surging, investors are clearly viewing the vaccine news as more significant for medium-term growth than increased near-term economic restrictions. We agree with that conclusion. We continue to recommend staying moderately below-benchmark on overall duration exposure, with an overweight tilt towards corporate credit versus government bonds, in global fixed income portfolios. A more comprehensive breakdown of the US dollar would be a signal that investors have grown even more comfortable with the economic outlook for 2021. Chart 7A New Leg Of USD Weakness On The Horizon?
A New Leg Of USD Weakness On The Horizon?
A New Leg Of USD Weakness On The Horizon?
A more comprehensive breakdown of the US dollar would be a signal that investors have grown even more comfortable with the economic outlook for 2021. The DXY index now sits at critical downside resistance levels, while a basket of commodity-sensitive currencies tracked by our foreign exchange strategists is approaching upside trendline resistance (Chart 7). While emerging market (EM) currencies have generally lagged the US dollar weakness story of the past several months, the Bloomberg EM Currency Index is also approaching a potentially important breakout point. The US dollar is very technically oversold now, so some consolidation of recent moves is likely needed before a new wave of weakness can unfold. Any such breakout of non-US currencies versus the US dollar will open up a whole new assortment of problems for policymakers outside the US, however – particularly those suffering from depressed inflation expectations. Bottom Line: Markets are trading off the longer-term positive news on COVID-19 vaccines, rather than the shorter-term negative news of surging numbers of new virus cases in Europe and North America. This will continue as long as the vaccine results stay promising, further boosting global equity and credit market performance, especially versus government bonds, as investor’s price in a return to “normalcy”. Currency Wars 2.0? On the surface, more US dollar weakness should be welcome by policymakers around the world. Much of the downward pressure on global traded goods prices over the past decade can be traced to the stubborn strength of the greenback. With the Fed’s trade-weighted dollar index now -1.9% lower on a year-over-year basis, global export prices and commodity indices like the CRB Raw Industrials are no longer deflating (Chart 8). While a weaker US dollar would help mitigate the downward pressure on global inflation rates from traded goods prices, such a move would hardly be welcomed everywhere. Within the developed world, some countries are currently suffering from more underwhelming inflation rates than others. The link between currency swings and headline inflation is particularly strong in the US, euro area and Australia (Chart 9). While a weaker dollar has helped lift headline US CPI inflation over the past few months, a stronger euro and Australian dollar have dampened euro area and Australian realized inflation. It should come as no surprise that both the European Central Bank (ECB) and Reserve Bank of Australia (RBA) have recently cited currency strength as a factor weighing on their latest dovish policy choices. Chart 8An Inflationary Impulse From A Weaker USD
An Inflationary Impulse From A Weaker USD
An Inflationary Impulse From A Weaker USD
There is not only a link between exchange rates and inflation for policymakers to worry about – currencies represent an important part of financial conditions, and therefore growth, in many countries. Chart 9Currency Impact On Inflation Greater In Some Countries
Currency Impact On Inflation Greater In Some Countries
Currency Impact On Inflation Greater In Some Countries
Chart 10Biggest Currency Impact On Financial Conditions Outside The US
Biggest Currency Impact On Financial Conditions Outside The US
Biggest Currency Impact On Financial Conditions Outside The US
Financial conditions indices, which combine financial variables like equity prices and corporate bond yields, typically place a big weighting on trade-weighted currencies in countries with large export sectors like the euro area, Japan, Canada and Australia (Chart 10). This makes sense, as a strengthening currency represents a meaningful drag on growth via worsening export competitiveness. In the US with its relatively more closed economy and greater reliance on market-based corporate finance, the dollar is a less important factor determining financial conditions. So what can central banks do to limit appreciation of their currencies? The choices are limited when policy rates are at 0% as is the case in most developed countries. Negative policy rates are a possible option to help weaken currencies, but seeing how negative rates have destroyed the profitability of Japanese and euro area banks, central bankers in other countries are reluctant to go down that road. It is noteworthy that the two central banks that have made the loudest public flirtation with negative rates in 2020, the Bank of England (BoE) and the Reserve Bank of New Zealand (RBNZ), have not yet pulled the trigger on that move. Both have chosen to go down a more “traditional” route doing more QE to ease monetary policy at a time of weak domestic inflation. The ECB is set to do the same thing next month, increasing its balance sheet via asset purchases and cheap bank funding in an attempt to stem the dramatic decline in euro area inflation expectations. Currencies represent an important part of financial conditions, and therefore growth, in many countries. Can more QE help weaken currency levels in any individual country? Like anything involving currencies, it must be considered on a relative basis to developments in other countries. In Chart 11, we plot the ratio of the Fed’s balance sheet to other developed economy central bank balance sheets versus the relevant US dollar currency pair. The thick dotted lines denote the projected balance sheet ratio based on current central bank plans for asset purchases.1 The visual evidence over the past few years suggests a weak correlation between balance sheet ratios and currency levels. At best, more QE can help mitigate currency appreciation that would otherwise have occurred – which might be all that the likes of the RBA and RBNZ can hope for now. There is a more robust correlation is between relative balance sheets and cross-country government bond spreads. Where there is a more robust correlation is between relative balance sheets and cross-country government bond spreads (Chart 12). This is reasonable since expanding QE purchases of government bonds can dampen the level of bond yields - either by signaling a desire to push rate hikes further into the future (forward guidance) or by literally creating a demand/supply balance for bonds that is more favorable for higher bond prices and lower yields. Chart 11Relative QE Matters Less For Currencies
Relative QE Matters Less For Currencies
Relative QE Matters Less For Currencies
Chart 12Relative QE Matters More For Bond Yield Spreads
Relative QE Matters More For Bond Yield Spreads
Relative QE Matters More For Bond Yield Spreads
This is the critical point to consider for investors: the more efficient way to play the relative QE game is through cross-country bond spread trades, not currency trades. On that basis, favoring government bonds of countries where central banks have turned more aggressive with expanding their QE programs – like the UK, Australia and Canada – relative to the debt of countries where the pace of QE has slowed – like the US, Japan and Germany – in global bond portfolios makes sense (Chart 13). Although in the case of Germany (and euro area debt, more generally), we see the ECB’s likely move to ramp up asset purchases at next month’s policy meeting moving euro area bonds into the “expanding QE” basket of countries. Chart 13More Non-US QE Will Support Non-US Bond Outperformance
More Non-US QE Will Support Non-US Bond Outperformance
More Non-US QE Will Support Non-US Bond Outperformance
Chart 14Central Banks Are Increasingly 'Funding' Government Spending
Central Banks Are Increasingly 'Funding' Government Spending
Central Banks Are Increasingly 'Funding' Government Spending
One final note: central banks that choose to expand their QE buying of government bonds may actually provide the biggest economic benefit by “funding” fiscal stimulus and limiting the damage to bond yields from rising budget deficits (Chart 14). This may be the most important factor to consider as governments contemplate more stimulus measures to offset any short-term hit to growth from the rising spread of COVID-19. Bottom Line: With interest rates stuck near-zero, asset purchases and balance sheet expansion will be the marginal policy tool used to limit currency moves, especially versus the US dollar. The greater impact will be on bond yield spreads versus US Treasuries with the Fed being less aggressive on QE. Stay underweight the US in global government bond portfolios. Robert Robis, CFA Chief Fixed Income Strategist rrobis@bcaresearch.com Footnotes 1 The projections incorporate the following: by June 2021, the Fed grows its balance sheet by US$840 billion, the ECB by €600 billion, the BoJ by ¥80 trillion, the BoE by £150 billion, the BoC by C$180 billion, and the RBA by A$100 billion. Recommendations The GFIS Recommended Portfolio Vs. The Custom Benchmark Index
Nobody Wants A Stronger Currency
Nobody Wants A Stronger Currency
Duration Regional Allocation Spread Product Tactical Trades Yields & Returns Global Bond Yields Historical Returns