Policy

Highlights The US Senate election is as important as the presidency for US politics and markets. Our quantitative Senate election model suggests Democrats will win control – as we have long argued – but there is a 49% chance that they do not, which is higher than consensus. A Republican Senate under a Biden presidency is positive for US stocks relative to global. Corporate taxes will stay put. However, fiscal reflation will have to be earned through tough budget battles, which will raise hurdles for markets. The Democratic sweep scenario is generating excessive enthusiasm in the media, as taxes will rise, but it is ultimately reflationary. It will benefit global stocks more than US stocks. Feature Chart 1Democratic Sweep Favors Global Stocks Versus US
Democratic Sweep Favors Global Stocks Versus US
Democratic Sweep Favors Global Stocks Versus US
Throughout the year we have argued that, as a base case for the US election, investors should expect that the pandemic, recession, and widespread social unrest in the United States would culminate in an anti-incumbent movement among voters. President Trump and the Republicans would lose the White House and Senate in a Democratic sweep. The implication for markets was that, after election volatility, global equities would rally in expectation of less hawkish US foreign and trade policy, while US equities would underperform on the expectation of higher taxes and regulation at home. This view has now become the market consensus (Chart 1). However, our quantitative US election model – which does not rely on head-to-head opinion polling – has recently given President Trump a 49% chance of winning in the latest reading. It is flagging a Biden victory but is essentially “too close to call” (Chart 2). The rapid snapback in the economy provides a basis for Trump to make an eleventh-hour comeback, contrary to optics. Chart 2Quant Model Shows Trump Loss, But 49% Odds Of Winning
Introducing Our Quantitative US Senate Election Model
Introducing Our Quantitative US Senate Election Model
In this report we present our quant model for the US Senate election, updated for the 2020 cycle. The Senate model is constructed with similar variables, though not exactly the same, and the result is that Democrats are favored to win control but only slightly. The implication is that Democrats are currently overrated by markets and that the election could still go either way. Uncertainty will go up for the remainder of the month. Ultimately we are sticking with our original forecast unless Trump and the Republicans regain momentum in opinion polling, but our models are flagging major risk. Investors should expect volatility to rise in the short term. We will maintain our tactical risk-off trades, since the risk of a contested election and/or a Trump re-election (and hence renewed global trade war) is rising. The Foundations Of Our Senate Model BCA Geopolitical Strategy developed a US Senate election model in September 2018 which quantified the margin of victory for the GOP among several Senate races during the 2018 mid-term election. The beta model focused on modeling individual Senate races, those deemed competitive by BCA’s Geopolitical Strategy at the time, by combining state and national level economic and political variables as well as the latest polling data applicable to each race.1 We are now re-introducing this model, but with a twist: this time we are adopting the same methodology as per our US presidential election model. The result is a state-by-state model that predicts the number of seats the incumbent party will win in the Senate election on November 3, 2020. Like our US election model, our Senate model is based off a probit model that produces a probability that each state will remain under the control of the incumbent party. The dependent variable (classified as “elected”) is stated as 1 = incumbent party wins the Senate election in each state; or 0 = incumbent party does not win the Senate election in each state. This method allows us to measure the probability that a state with certain characteristics will fall into one of these two categories. Therefore we can predict the probability of the incumbent party winning all the Senate seats in each of the 50 states (though, of course, this is only relevant to the one-third of the states that have a Senate seat up for election in 2020). Our model would have predicted the past five Senate election outcomes correctly on an in-sample basis and the past four Senate elections on an out-sample basis. Unlike our presidential election model, which sampled nine elections (1984 to 2016), our sample size for the Senate model is notably larger. That is, our sample consists of 18 Senate elections (1984 to 2018), across 50 states, amounting to 900 observations. While midterm Senate elections are different from those held during a presidential election year, we would not want to exclude the information they provide. The 2018 Senate race has a bearing on our 2020 prediction and this is appropriate. The Senate Model’s Variables Our Senate model includes six explanatory variables: 1. The Federal Reserve Bank of Philadelphia State Coincident Index. The coincident index for each state combines four of the state’s indicators to summarize current economic conditions in a single statistic. The four indicators are nonfarm payroll employment; average hours worked in manufacturing by production workers; the unemployment rate; and wage and salary disbursements plus proprietors' income deflated by the consumer price index (U.S. city average). Like in our US Presidential model, we applied several transformations to the data to obtain meaningful results in the modeling process. We found that using a three-month change of the state coincident index in our Senate model provided the most statistically significant result. Our Senate model suggests that Republican odds of winning are underrated by online betting markets, as with our presidential model. The three-month change of all the monthly state coincident indexes are given heavier weight as we approach the Senate election early in November. However, we only include the preceding year of a Senate election up until September of the election year (i.e. the last data release in October prior to the election itself). Senate elections occur every two years, and we excluded data that has been accounted for in previous elections. As we highlighted in the update of our US Election model we assume that prevailing economic conditions matter most to voters (as future expectations inevitably affect people’s assessment of their current situation), and this bolsters our rationale in using a 3-month change of the state coincident index. 2. The incumbent party’s margin of victory in previous Senate elections in each state Senate race. This is measured as the incumbent party’s share of the popular vote minus the non-incumbent party’s share. If the incumbent party failed to secure a solid win in each state in the previous Senate election, the probability of securing a solid win in the current election becomes smaller. Moreover, the larger the margin of victory in a previous Senate election race, the more likely that incumbent party will win re-election in said state. 3. Net average approval level of the incumbent president in a Senate election year. This is the difference between the incumbent president’s approval and disapproval levels in a Senate election year, from the start of the year up until the end of October of that year – taken as an average. 4. Generic congressional ballot (net support rate). The generic congressional ballot asks people which party they are likely to vote for in Congress. We take the average net support rate in a Senate election year (that being whichever party leads the other in congressional ballot polling). Democrats are usually favored in congressional generic ballot voting, so the net rate is more predictive than the gross rate 5. Dummy variable for congressional ballot. A dummy variable is assigned to variable number four. For example, dummy takes the value of 1 when Democrats have a positive net support rate in generic congressional ballot voting, and 0 when Republicans have a net positive support rate. We assign only one dummy variable to avoid a dummy variable trap.2 6. A “time for change” variable, a categorical variable indicating whether the incumbent party has controlled the Senate for three or more terms (six or more years). If the Senate has been controlled by the incumbent party for three or more terms, the model will “punish” the incumbent party, as we would expect to see a change in control of the Senate the longer one incumbent party controls it. Estimating The Model Since this is a probit model, the coefficients cannot be directly interpreted like in an ordinary regression.3 In Table 1, the sign of the coefficient corresponds to the direction of change in probability. An increase in the State Coincident Index, the incumbent’s margin of victory in previous Senate races, net approval of the incumbent president and generic congressional support ballot, all increase the probability of the incumbent winning a Senate election in a state. Table 1Senate Model Regression Coefficients
Introducing Our Quantitative US Senate Election Model
Introducing Our Quantitative US Senate Election Model
Meanwhile occupying the Senate for more than three terms serves as a “punishment” and would decrease the probability of winning a Senate election in a state. The output of our model is the probability of an incumbent win in each state. As in our US Presidential election model, there are two ways of aggregating these probabilities to produce a national-level outcome: Proportional: Allocate the number of Senate seats won by the incumbent proportionally to their probability of victory in each state, and then sum them up across all states. Winner Takes All: As we do in our US Presidential election model, assume a probability threshold of 50%: any state with an incumbent win that is at least 50% likely is fully assigned to the incumbent. The latter, winner takes all, is the aggregation method we base our Senate prediction on. Senate Election Model Prediction Table 2 shows our 2020 prediction. Overall, the Republican Party is expected to win 49 Senate seats, a decrease of four seats from its current 53-seat majority. This means that the Democrats are expected to control the Senate with 51 seats (this includes Independents that caucus with Democrats). Moreover, the model suggests that Republicans have a 49% chance of retaining Senate control. Table 2Predicted 2020 Senate Balance Of Power
Introducing Our Quantitative US Senate Election Model
Introducing Our Quantitative US Senate Election Model
This is substantially higher than consensus, which has put Republicans at 42% throughout the past month and currently has them at 37% (Chart 3). As with our presidential model, the rapid recovery in the state economic indicators is providing the Republicans with a last-minute boost that contradicts the gloomier picture painted by opinion polls. We do not think they will retain the Senate, but our conviction level is now lower. Chart 3Betting Market Overrates Democratic Odds Of Winning Senate
Introducing Our Quantitative US Senate Election Model
Introducing Our Quantitative US Senate Election Model
In terms of Senate seats, our model expects Republicans to lose Arizona, Colorado, Maine, Montana, and North Carolina. This is enough for Democrats to obtain 51 seats, a majority, assuming that they lose Alabama. The full list of states that have Senate races in 2020 and the probabilities of a Republican win according to the model are shown in Chart 4. Chart 4Quant Model Shows Democrats Win Senate, But GOP Odds 49%
Introducing Our Quantitative US Senate Election Model
Introducing Our Quantitative US Senate Election Model
Three Senate races are classified as toss-ups, which we define as having a probability between 45% and 55% according to the model. These states are Iowa (54%), Maine (48%) and North Carolina (49%). Montana is close to a toss-up, with a 44% chance of a Republican win. We expect Democrats to win control of the Senate with 51 votes. They need 50, plus the White House, to have a majority. Of these states, if Republicans retain any two, then they will retain their majority, so control of the Senate is on a knife’s edge. Chart 5 shows the odds for each of the 12 swing states in this election. Chart 5Our Senate Odds Compared With The Bookies
Introducing Our Quantitative US Senate Election Model
Introducing Our Quantitative US Senate Election Model
Bear in mind that only 50 seats are needed for the party that wins the White House, since the Vice President is also the President of the Senate and casts the tiebreaking vote. Senate Races Of Interest Our results show that the consensus is underestimating the Republicans, except in Michigan and Montana. The latter could affect overall control of the Senate. The same can be said for Maine, where the Republican challenger may be underrated (Chart 6). The trend of opinion polling in Chart 6 generally shows closer races than the betting markets expect. Our model supports the betting markets on the unlikelihood that Democrats will prevail in several deep red states. Chart 6US Senate Polling And The Betting Odds
Introducing Our Quantitative US Senate Election Model
Introducing Our Quantitative US Senate Election Model
The presidential race should be the decisive factor. If voters in swing states are sufficiently motivated to vote out the sitting president that they chose only four years ago, which is uncommon in modern US history, then they will likely repudiate the senators who carried that president’s water through a whirlwind of scandals and controversies. Yet with the races so precariously balanced, small or local factors could also decide the outcome. This is an important limitation on our macro method. For example, it is not at all clear that Democrats will win Maine. Our model gives Republicans a 48% chance, while online gamblers put it at 27%. Susan Collins is well-entrenched, having survived again and again since 1996. If Democrats do poach Maine, it is still not clear that they will carry Iowa and Montana, which are more conservative yet saw Democratic victories in 2018. Our model suggests Montana will go Democratic and Iowa will stay Republican. Democrats must win one of these two states (or North Carolina) or they will not take the Senate. A feather could tip the scales. A feather may already be doing that in North Carolina, the other key toss-up state. Democratic candidate Cal Cunningham’s sex scandal has roiled the race. It is not yet clear that voters will abandon Cunningham (see Chart 6, panel 1), but that is likely unless there is an unstoppable Democratic wave.4 If North Carolina stays Republican as a result, then, according to our model, the US Senate would tie at 50-50 and the winner of the White House would turn the balance. Some Democrats have argued that deeper red states may be in contention, such as Georgia, South Carolina, Alaska, Kansas, or Kentucky. Of these, Kansas is notable since no candidate has an incumbent advantage. However, our model rules these races out of play and we tend to agree. Bottom Line: Our model suggests that Democrats will narrowly win control of the Senate as things stand today. With several races extremely close, a trivial event in a single state could turn the balance of power in the US Senate and hence the policy consequences of the entire US election. However, the close contest implies that the party that wins the White House will also win the Senate. Back Testing Our Model Our Senate model performs at an acceptable level during in-sample and out-sample back testing. For in-sample testing, we test our model over our entire sample period (1984 – 2018) and find that 72% of Senate elections (control of the Senate) are correctly predicted, with the model predicting the outcome of the last five Senate elections correctly (Chart 7). Chart 7In-Sample Back Testing Results
Introducing Our Quantitative US Senate Election Model
Introducing Our Quantitative US Senate Election Model
During out-sample back testing, we look at a sample period of 2000 – 2018, comprising of ten Senate elections, where our model correctly predicts 69% of actual outcomes. The previous four Senate elections are predicted correctly (Chart 8). There is still a roughly 50/50 chance of divided US government in 2021-22. Chart 8Out-Sample Back Testing Results
Introducing Our Quantitative US Senate Election Model
Introducing Our Quantitative US Senate Election Model
Investment Takeaways Our US Senate model is based off a similar methodology as our US Presidential election model. There are however some minor differences. First, we use a weighted maximum likelihood estimate as opposed to a traditional maximum likelihood estimate. This is because of unbalanced binary outcomes in our dependent variable (see Appendix). Chart 9Fair Chance Of Divided Government Still
Introducing Our Quantitative US Senate Election Model
Introducing Our Quantitative US Senate Election Model
Secondly, not all our explanatory variables are the same. While we maintain using the State Coincident Index as our one and only economic variable, our suite of political variables has changed to be more geared towards predicting the Senate outcome. Our Senate model predicts Republicans will retain only 49 seats and lose control of the Senate. The Democrats will take control with 51 seats. And yet Republicans have a 49% chance of retaining Senate control. This is equivalent to saying that the race is “too close to call” – which is similar to our presidential model results. The reason is the rapid snapback in the economy. Subjectively, the risk is to the downside for Republicans given the President’s poor polling, particularly on his handling of the pandemic, and the high unemployment rate. The Senate outcome should be determined by the White House race, but obviously there is a fair chance that the winner of the White House still loses control of the Senate (Chart 9). Chart 10Wall Street Expects Divided Government
Wall Street Expects Divided Government
Wall Street Expects Divided Government
Chart 11Trump Protectionism Good For The Dollar
Trump Protectionism Good For The Dollar
Trump Protectionism Good For The Dollar
The stock market is behaving like it expects gridlock, rather than a Democratic sweep – the latter offering greater downside and lesser upside, at least judging by history (Chart 10). So let’s boil this all down to what we know with reasonable certainty: If Trump wins with a Republican Senate, he will still face opposition from House Democrats, so he will be driven to foreign and trade policy in his second term. Protectionism will affect not only China but also Europe and other economies. This is broadly positive for the dollar and US equities relative to global stocks and commodities (Chart 11). Government bond yields would be volatile due to the risk to the cyclical recovery from global trade war. If Biden wins in a Democratic sweep, economies other than China will benefit from lower trade risk and the US will benefit from higher odds of unfettered fiscal stimulus in 2021. But financial markets will simultaneously have to adjust for the negative shock to US corporate earnings from higher taxes and regulation. This outcome is broadly negative for the dollar and US equities relative to global equities and commodities. Government bond yields would rise on the generally reflationary agenda. If Biden wins without the Senate, the market has the most positive outcome of all: less trade war yet no new tax hikes. Both US and global equities would benefit. Bond prices and the dollar would trend downward over time, but not during the occasional fiscal battles that would ensue between the Democratic president and Republican senators. Guy Russell Research Analyst GuyR@bcaresearch.com Matt Gertken Vice President Geopolitical Strategy mattg@bcaresearch.com Statistical Appendix A notable property in our dependent variable data requires a brief discussion. Our dependent variable classified as “elected” takes the form of a binary outcome. This data, however, is what’s called “unbalanced,” since incumbent Senators are re-elected approximately 80% of the time. This means that most outcomes in our dependent variable are coded as “1,” with fewer “0’s” because of the strong incumbency effect in Senate races. There are many data sets that exhibit this type of property, such as events like wars, vetoes, cases of political activism, or epidemiological infections, where non-events occur rarely. To alleviate this statistical property in the data, we estimate our model using a weighted maximum likelihood estimate as opposed to the ordinary maximum likelihood estimate usually used in a probit regression.5 This method assigns more weighting to the unbalanced data, or what is known theoretically as “rare event” data, to aid the probit regression in assigning higher probabilities to “0” outcomes. Through this process, we effectively deal with our unbalanced dependent variable data. That said, in developing our quantitative US Senate Election Model, we estimated a suite of probit regressions with several other variables that were theoretically assumed to be relevant and subsequently tested empirically. In Appendix Table 1 below, we only include variables 1, 2, 3 and 6 from our listed variables (we excluded the generic congressional ballot and its corresponding dummy variable). This model suggests that Republicans will hold control of the Senate with 51 seats. Back testing this model revealed that 71% of past Senate elections were correctly predicted, while 67% were correctly predicted in out-sample testing. This is only slightly worse of a track record than our final model. If this model proves more accurate in the event, the implication is that the generic congressional ballot is an unreliable poll. Americans could be shy about stating their support for the Republican Party in the era of Trump. For this outcome, Republicans would only lose Arizona and Colorado. Critical swing states here are Montana (53%) and Arizona (45%). Appendix Table 1Alternative Senate Model Predictions
Introducing Our Quantitative US Senate Election Model
Introducing Our Quantitative US Senate Election Model
A re-work of the above model, but with a variable that punishes Republicans for holding the Senate for six years or more on average, suggests that Republicans will only win 47 seats in the Senate, giving up six seats (Appendix Table 2). Forecast accuracy is slightly worse off, giving just 68% and 67% predictive accuracy during in and out-sample forecasting of previous Senate elections, respectively. Compared to our primary model, Republicans would lose Arizona, Colorado, Iowa, Maine, Montana, North Carolina and Alabama. Alabama (45%) is the only critical swing state. Appendix Table 2Alternative Senate Model Predictions
Introducing Our Quantitative US Senate Election Model
Introducing Our Quantitative US Senate Election Model
Note: This report has been corrected since publication due to errors in charting. Charts 7 and 8 showed the correct majority party in historical Senate elections but mistakenly attributed to that party the minority party’s number of seats. The changes do not affect the text or the substance of the report: our quantitative model’s accuracy levels remain unchanged, as does the model’s performance relative to historical election results. Footnotes 1 The model was able to predict 14 out of 18 (77%) Senate races flagged as competitive by BCA’s Geopolitical Strategy. Florida, North Dakota, Indiana and Missouri were flagged as Democratic by our model but were won by Republican candidates. 2 A dummy variable trap is a scenario in which the independent variables are multicollinear — a scenario in which two or more variables are highly correlated; or, in simple terms, in which one variable can be predicted from the others. To avoid such a trap, we must exclude one of the categorical variables. Since there are two categorical variables that can be represented here (Republican or Democrat), we use k-1 (where k = the number of categorical variables). 3 The coefficients in a probit regression model measure the change in the Z-score associated to each independent variable for a one-unit change in that variable. 4 See Evie Fordham, "NC Democrat Cal Cunningham faces FEC complaint over California trip amid affair," Fox News, October 13, 2020, foxnews.com. 5 Weighted maximum likelihood estimation is a reasonable approach in dealing with dependent variables that show significant imbalance in their data set. See: King, G. and Zeng, L., 2001. Logistic regression in rare events data. Political analysis, 9(2), pp.137-163.
Highlights Our model suggests that more rate hikes are ahead in 2021; we project a less than 50bps increase in the PBoC policy rate from the current level. Chinese stock prices positively correlate with interest rates and bond yields. The relationship has strengthened since 2015. In the next six to nine months, Chinese stock prices will likely trend up alongside a rising policy rate and an accelerating economic growth. Feature China’s policy rate and bond yields have been rising sharply since May and are breaching their pre-COVID 19 levels. Meanwhile, Chinese stock prices have moved sideways since mid-July, despite a steady recovery in the domestic economy. While some commentators view higher interest rates as a harbinger of an impending equity market weakness, our research shows that the relationship between China’s stock prices and short-term rates has been positive since 2015. A rally in Chinese stocks and outperformance of cyclical stocks relative to defensives positively correlate with rising interest rates and bond yields (Chart 1A and 1B). Chart 1ARising Bond Yields Coincide With Ascending Chinese Stock Prices...
Rising Bond Yields Coincide With Ascending Chinese Stock Prices...
Rising Bond Yields Coincide With Ascending Chinese Stock Prices...
Chart 1B...And Offshore Cyclicals
...And Offshore Cyclicals
...And Offshore Cyclicals
Chart 2Massive Stimulus In 2020 Will Accelerate Economic Growth Into 1H21
Massive Stimulus In 2020 Will Accelerate Economic Growth Into 1H21
Massive Stimulus In 2020 Will Accelerate Economic Growth Into 1H21
China’s massive stimulus this year generated some self-sustaining momentum that will likely push the nation’s output higher in 1H21(Chart 2). The PBoC may raise the policy rate by as much as 50bps in 2021 from its current level, but strong domestic fundamentals should be able to drive up Chinese stock prices, in both absolute term and relative to global equities in the next six to nine months. PBoC Policy Hikes:Still More Ahead While the PBoC’s policy rate has rebounded sharply, it remains at its lowest level since the Global Financial Crisis. Looking forward, will the central bank bring the policy rate (e.g. 3-month SHIBOR) back to its pre-COVID 19 range of 3 – 3.5% or the pre-trade war level near 5%? The acceleration in China’s economic recovery is expected to continue and would boost China’s annual output growth in 1H21 to two to three percentage points above its trend. Based on these estimates, our interest rate model implies more than 200bps in rate increases in 2021 from the current level1 (Chart 3). Chart 3Rising Odds Of PBoC Rate Hikes In 2021
Rising Odds Of PBoC Rate Hikes In 2021
Rising Odds Of PBoC Rate Hikes In 2021
Historically, our model has successfully captured the major turning points in China's policy rate cycles. This time around, however, the pandemic and the subsequent economic recovery may have complicated the model's predictive power. The model suggests that, in 1H21 the policy rate will return to its pre-trade war range of 4-5%, but we think the rate increases will be capped within 50bps. The model follows a modified version of "Taylor's Rule," in which we assume that the PBoC will target its short-term interest rate based on the deviation between actual and desired inflation rates and the deviation between real GDP growth and China’s trend GDP growth rate. The latest data shows across-the-board strengthening in the economy; most indicators have surprised to the upside, confirming our optimistic assessment.2 However, Taylor's Rule is not able to account for sudden shocks in the economy, such as a pandemic-induced global recession. Thus, the model exaggerates the magnitude of interest rate bumps, based on an economic growth acceleration following a one-off economic shock. In a report earlier this year, we noted that the PBoC has been proactive in normalizing its monetary policy following short-term shocks.3 This is contrary to economic downturns when the PBoC has been a reactive central bank and its decisions often lagged a pickup in economic activity. As such, although interest rates have swiftly rebounded after the pandemic-induced growth contraction in Q1, we expect the pace of rate hikes to be slower in 2021. Chart 4Rapid RMB Appreciation Will Bring Headwinds To Chinese Industrial Profits
Rapid RMB Appreciation Will Bring Headwinds To Chinese Industrial Profits
Rapid RMB Appreciation Will Bring Headwinds To Chinese Industrial Profits
External factors are accounted for in the model, though they may be underestimated. The US Federal Reserve Bank has decisively shifted its monetary policy to broadly accommodative and will stay behind the inflation curve in the next few years. The collapse in interest rate differentials between the US and China has made RMB-denominated assets attractive, boosting strong inflows of foreign capital and rapidly pushing up the value of the RMB (Chart 4, top panel). While we think Chinese policymakers have pivoted to prefer a strong RMB, the recent countermeasures by the PBoC indicate that the central bank will not allow the RMB to climb too rapidly.4 China's drastic tightening in monetary conditions and the sharp rally in the trade-weighted RMB from 2011 to 2014 led to a prolonged economic downturn (Chart 4, bottom panel). Therefore, in the absence of synchronized policy tightening from other central banks, the magnitude of rate hikes by the PBoC will be measured. Bottom Line: The PBoC will continue to push up the policy rate in 2021, but our baseline view is that the magnitude will be capped below 50bps. Interest Rates And Chinese Stocks Chart 5Chinese Stocks/Bond Yields Correlation Became Much More Positive After 2015
Chinese Stocks/Bond Yields Correlation Became Much More Positive After 2015
Chinese Stocks/Bond Yields Correlation Became Much More Positive After 2015
Many investors might think that stock prices tend to react negatively to monetary policy tightening because interest rate upturns and mounting bond yields lead to higher costs of funding for corporations and lower profit growth. However, Chinese stock prices started moving in the same direction with policy rates and bond yields following the burst of the 2014/15 stock market bubble (Chart 5 and Chart 1A and 1B on Page 4 and 2). In general, when China’s economic and profit growth accelerates, share prices can rise with higher interest rates. Share prices can still climb with cuts in interest rates even when economic growth slows but profit growth rate remains in positive territory. However, when profit growth is expected to drop below zero, share prices will drop even if rates are falling (Chart 6A and 6B). In this vein, the most pertinent reason for Chinese stocks to move in tandem with bond yields is that Chinese stocks are increasingly driven by economic fundamentals, which are supported by the volume of total credit creation (measured by total social financing) rather than the price of money in China. Furthermore, the reverse relationship between the volume and price of money in China broke down after 2015; China’s credit creation has become less sensitive to changes in interest rates. Chart 6AWhen Interest Rates Rise...
When Interest Rates Rise...
When Interest Rates Rise...
Chart 6B...Economic Growth Holds The Key For Stock Performance
...Economic Growth Holds The Key For Stock Performance
...Economic Growth Holds The Key For Stock Performance
Since 2015, the PBOC shifted its policy to target interest rates instead of the quantity of money supply (Chart 7). In order to effectively manage the official interbank rates (the 7-day interbank repo rate), the central bank uses tools such as reserve requirement ratio cuts and liquidity injections in the interbank system (Chart 8). In other words, the central bank has forgone its control of the volume of money. Moreover, since late 2016, rather than direct interest rate hikes, the PBoC has been taking monetary policy tightening measures through changes in its macro-prudential assessment (MPA). The changes in the MPA are evident in the 3-month / 1-week repo spread.5 As such, an increase in the 3-month interbank repo rate (and SHIBOR) is often intended to curb shadow-banking activities rather than depress aggregate credit creation and business activities (Chart 9). Chart 7Monetary Policy Regime Shifted In 2015
Monetary Policy Regime Shifted In 2015
Monetary Policy Regime Shifted In 2015
Chart 8More Open Market Operations
Monetary Tightening ≠ Lower Stock Prices
Monetary Tightening ≠ Lower Stock Prices
Chart 9Most Monetary Tightening Has Been Carried Out Through MPA Since 2016
Most Monetary Tightening Has Been Carried Out Through MPA Since 2016
Most Monetary Tightening Has Been Carried Out Through MPA Since 2016
Another idiosyncrasy is China’s fiscal stimulus, which has become a more relevant driver of total social financing since the onset of the 2014/15 economic downcycle (Chart 10). The amount of government bond issuance is specified by the People’s Congress in March each year and is not affected by changes in interest rates or bond yields. Therefore, growth in total social financing can still accelerate despite a higher price of money (Chart 11). Chart 10Fiscal Lever Has Become More Prominent In Driving Business Cycles Since 2015
Fiscal Lever Has Become More Prominent In Driving Business Cycles Since 2015
Fiscal Lever Has Become More Prominent In Driving Business Cycles Since 2015
Chart 11Changes In Interest Rates Have Little Impact On Fiscal And Quasi-Fiscal Borrowing
Changes In Interest Rates Have Little Impact On Fiscal And Quasi-Fiscal Borrowing
Changes In Interest Rates Have Little Impact On Fiscal And Quasi-Fiscal Borrowing
By the same token, a rising 3-month SHIBOR can also be the result of rapid fiscal and quasi-fiscal expansions, as seen in Q3 this year. A flood of central and local government bond issuance drained liquidities from commercial banks, boosting the banks’ needs to borrow money from the interbank system. Nevertheless, the market’s appetite for risk assets increases because fiscal stimulus provides an imminent and powerful reflationary force in China’s business cycles. Chart 12Bank Lending Rates Can Still Trend Downwards Against A Rising Policy Rate
Bank Lending Rates Can Still Trend Downwards Against A Rising Policy Rate
Bank Lending Rates Can Still Trend Downwards Against A Rising Policy Rate
Rising policy rates typically push up corporate bond yields. However, bond yields in China play a relatively small role in driving corporate financing costs on an aggregate level, since commercial banks are still dominant in China’s debt market. Commercial banks' average lending rates closely track the PBoC’s policy rate on a cyclical basis, but Chinese authorities periodically use window guidance to target the Loan Prime Rate (LPR), a reformed bank lending rate. Hence, the direction in both the LPR and the average lending rate can temporarily diverge from the policy rate. These measures can boost bank loan growth even in a rising interest rate environment (Chart 12). Bottom Line: The key driver of Chinese stock performance is the country’s domestic credit, business, and corporate profit growth cycles. Since the 2014/15 cycle, the policy rate has not been the determinant of China’s economic or credit growth. Investment Conclusions We expect that this year’s massive monetary and fiscal stimulus to accelerate the country’s economic recovery into 1H21. Therefore, even if interest rates and bond yields advance, Chinese stock prices can still trend upward. Chinese cyclical stocks should also continue to outperform defensives, in both the onshore and offshore markets (Chart 13A and 13B). Chart 13AStay Invested In Chinese Stocks
Stay Invested In Chinese Stocks
Stay Invested In Chinese Stocks
Chart 13BCyclicals Still Have Upside Potentials
Cyclicals Still Have Upside Potentials
Cyclicals Still Have Upside Potentials
Rates will begin to climb and fiscal policy will also become more restrictive if China’s output moves above trend growth through 1H21. Government bond quotas and fiscal budget will be determined at the National People’s Congress in March. If the economy is strong, odds are that fiscal stimulus will be scaled back. At that point, investors should start to look for a peak in China’s business cycle linked to monetary and fiscal policy tightening. As growth expectations start to downshift in the equity market, yields on long-dated government bonds will start to decline while yields on the short end will not drop. Additionally, the small-cap ChiNext market has been considered as a speculative segment of the domestic financial market with higher multiples and greater volatility than large-cap A shares. The bourse's trailing price-to-earnings ratio and price-to-book ratio are extremely elevated at 79 and 8.6, respectively, much higher than for broader onshore and offshore Chinese stocks. As such, this market will remain the most vulnerable to domestic liquidity tightening. Jing Sima China Strategist jings@bcaresearch.com Footnotes 1 based on our estimates for 1h21: 7.5-8.0% GDP growth, 2.5-2.8% headline CPI, 6.5-6.7 USD/CNY, and the fed holding current fund rate unchanged. 2Please see China Investment Strategy Weekly Report "China Macro And Market Review," dated October 7, 2020, available at cis.bcaresearch.com 3Please see China Investment Strategy Weekly Report "Don’t Chase China’s Bond Yields Lower," dated February 19, 2020, available at cis.bcaresearch.com 4On October 12, the PBoC removed financial institutions’ Forex reserve ratio of 20%, making betting against the RMB cheaper. 5Please see China Investment Strategy Special Report "Seven Questions About Chinese Monetary Policy," dated February 22, 2018, available at cis.bcaresearch.com Cyclical Investment Stance Equity Sector Recommendations
Highlights Duration: Prospects for more pre-election fiscal stimulus are slim. But with the Democrats gaining ground in the polls, the bond market will stay focused on rising odds of a blue sweep election and greater fiscal stimulus in early 2021. Municipal Bonds: Municipal bonds offer exceptional value relative to both US Treasuries and corporate credit. Not only that, but rising odds of a blue sweep election make state & local government fiscal relief increasingly likely. Investors should overweight municipal bonds in US fixed income portfolios. Economy: The economic recovery continues to roll on, but it will be some time before the output gap is closed and inflation starts to rise. Slow consumer and corporate credit growth suggest that animal spirits have not yet taken hold. Meanwhile, the falling unemployment rate masks a persistent uptrend in the number of permanently unemployed. Feature Chart 1Breakout
Breakout
Breakout
After having been lulled to sleep by several months of stagnant yields, bond investors experienced a minor shockwave in early October. The 10-year Treasury yield and 2/10 slope both broke out of well-established trading ranges and implied interest rate volatility bounced off all-time lows to reach its highest level since June (Chart 1). We suspect this might turn out to be just the first small tremor in a tumultuous month leading up to the US election. Specifically, there are two main political risks that will be resolved within the next month. Both have major implications for the bond market. Bond-Bullish Risk: No More Stimulus Before The Election The first risk is the possibility that the current Congress will not deliver any more fiscal stimulus. This increasingly looks like less of a possibility and more of a likelihood, especially after the president tweeted that he is halting negotiations with House Democrats. While he partially walked those comments back the next day, the fact remains that there is very little time between now and November 3rd, and the two sides remain at loggerheads. We have argued that more household income support from Congress is necessary. Otherwise, consumer spending will massively disappoint during the next year.1 However, it could take a few more months before this becomes apparent in the consumer spending data. Real consumer spending still rose in August, though much less quickly than it did in June and July (Chart 2). Meanwhile, August disposable income remained above pre-COVID levels, as it continued to receive a boost from facilities related to the CARES act (Chart 2, bottom panel). This boost will fade as the CARES act’s money is doled out, pushing spending lower. That is, unless Congress enacts a follow-up bill. There are two main political risks that will be resolved within the next month and both have major implications for the bond market. It looks less and less likely that a bill will be passed this month but, depending on the election outcome, a follow-up stimulus bill could become more likely in January. If consumer spending can hang in for the next couple of months, then the bond market might look past Congress’ near-term failure. This appears to be what is happening so far. The stock market fell 1.4% last Tuesday after Trump tweeted about halting negotiations. The 10-year Treasury yield, however, dropped only 2 bps on the day. More generally, long-dated bond yields rose during the past month, even as stocks sold off and prospects for immediate fiscal relief dimmed (Chart 3). Chart 2September's Consumer Spending Report Is Critical
September's Consumer Spending Report Is Critical
September's Consumer Spending Report Is Critical
Chart 3Bonds Ignore Stock ##br##Market...
Bonds Ignore Stock Market...
Bonds Ignore Stock Market...
With all that in mind, we think September’s consumer spending data – the last month of data we will see before the election – are very important. If spending collapses, it might re-focus the market’s attention on Congress’ failure, sending bond yields down. However, we think the market would see through a modest drop in spending, especially if the election looks poised to bring us a larger bill in 2021. Bond-Bearish Risk: A Blue Sweep Election Chart 4...Take Cues From Election Odds
...Take Cues From Election Odds
...Take Cues From Election Odds
This brings us to the second big political risk that could influence bond yields during the next month: The possibility of a “blue sweep” election where the Democrats win control of the House, Senate and White House. This would clearly be a bearish outcome for bonds, as an unimpeded Democratic party would enact a large stimulus package – likely worth $2.5 to $3.5 trillion – shortly after inauguration. It appears that the bond market is already tentatively pricing-in this outcome. While the recent increase in bond yields is hard to square with weak equity prices and souring expectations for immediate stimulus, it is consistent with rising betting market odds of a blue sweep election (Chart 4). To underscore the bond bearishness of this potential election outcome, consider that not only would a unified Congress be able to quickly deliver another fiscal relief bill, but Joe Biden’s platform calls for even more spending on infrastructure, healthcare, education and other Democratic priorities. In total, Biden is proposing new spending of around 3% of GDP, only about half of which will be offset by tax increases (Table 1). Table 1ABiden Would Raise $4 Trillion In Revenue Over Ten Years
Political Risk Will Dominate In A Pivotal Month For The Bond Market
Political Risk Will Dominate In A Pivotal Month For The Bond Market
Table 1BBiden Would Spend $7 Trillion In Programs Over Ten Years
Political Risk Will Dominate In A Pivotal Month For The Bond Market
Political Risk Will Dominate In A Pivotal Month For The Bond Market
How likely is a “blue sweep” election? It is our Geopolitical Strategy service’s base case.2 Also, fivethirtyeight.com’s poll-based forecasting model sees a 68% chance that Democrats win the Senate, a 94% chance that they win the House and an 85% chance that Joe Biden wins the presidency. Investment Strategy These two political risks appear to put bond investors in a bit of a conundrum. On the one hand, if no stimulus bill is passed this month and September’s consumer spending data are weak, then bond yields could fall in the near-term. However, we are inclined to think that if all that occurs against the back-drop of rising odds of a blue sweep election outcome, the bond market will look beyond the near-term and yields will move higher on expectations of larger stimulus coming in January. As such, we retain our relatively pro-reflation investment stance. We recommend owning nominal and real yield curve steepeners, inflation curve flatteners and maintaining an overweight position in TIPS versus nominal Treasuries. All these positions are designed to profit from a rising yield environment.3 Municipal bonds look extremely cheap compared to other US fixed income sectors. We retain an “at benchmark” portfolio duration stance for now, for two reasons. First, while a blue sweep election outcome looks like the most likely scenario, it is not a guarantee. Second, even against the backdrop of greater government stimulus and continued economic recovery, the US economy will still be dealing with a large output gap next year that will temper inflationary pressures. This will keep the Fed on hold, limiting the upside in bond yields. That being said, the odds of another significant downleg in bond yields look increasingly slim. We will likely shift to a more aggressive “below-benchmark” duration stance this month, if our conviction in a blue sweep election outcome continues to rise. A Rare Buying Opportunity In Municipal Bonds No matter how you slice it, municipal bonds look extremely cheap compared to other US fixed income sectors. First, we can look at the spread between Aaa-rated munis and maturity-matched US Treasury yields (Chart 5). When we do this, we find that 2-year and 5-year municipal bonds trade at about the same yields as their Treasury counterparts. This is despite municipal debt’s tax-exempt status. Munis look even more attractive further out the curve, with 10-year and 30-year bonds trading at a before-tax premium relative to Treasuries. Chart 5Aaa Munis Versus ##br##Treasuries
Aaa Munis Versus Treasuries
Aaa Munis Versus Treasuries
Table 2Muni/Corporate Breakeven Effective Tax Rates (%)
Political Risk Will Dominate In A Pivotal Month For The Bond Market
Political Risk Will Dominate In A Pivotal Month For The Bond Market
Next, we can look at how municipal bonds stack up compared to corporates. We do this in a couple different ways. In Table 2, we start with the Bloomberg Barclays Investment Grade Corporate Index split by credit tier. We then find the General Obligation (GO) municipal bond that matches each corporate index’s credit rating and maturity and calculate the breakeven effective tax rate between the two yields. The breakeven effective tax rate is the effective tax rate that would make an investor indifferent between owning the municipal bond and the corporate bond. For example, if an investor faces an effective tax rate of 7%, they will observe the same after-tax yield in a 12-year A-rated GO municipal bond as they do in a 12-year A-rated corporate bond. If their effective tax rate is more than 7%, the muni offers an after-tax yield advantage. Alternatively, we can look at the relative value between munis and credit using the Bloomberg Barclays Municipal Indexes. In Chart 6A, we start with the average yield on the Bloomberg Barclays General Obligation indexes by maturity. We then find the US Credit index that matches the credit rating and duration of the municipal index and calculate the yield differential.4 We find that in all cases, for GO bonds ranging from 6 years to maturity and higher, the muni offers a before-tax yield advantage compared to the Credit Index. This is also true when we perform the same exercise using municipal revenue bonds instead of GOs (Chart 6B). Chart 6AGO Munis Versus Credit
GO Munis Versus Credit
GO Munis Versus Credit
Chart 6BRevenue Munis Versus Credit
Revenue Munis Versus Credit
Revenue Munis Versus Credit
You may notice that municipal bonds trade at a before-tax premium to credit in Charts 6A and 6B, but at a discount in Table 2. This is because we compare bonds by maturity in Table 2 and by duration in Charts 6A and 6B. Unlike investment grade corporates, municipal bonds often carry call options making them negatively convex and giving them a duration that is much shorter than their maturity. Cheap For A Reason, Or Just Plain Cheap? Chart 7State & Local Balance Sheets Will Weather The Storm
State & Local Balance Sheets Will Weather The Storm
State & Local Balance Sheets Will Weather The Storm
We have effectively demonstrated that municipal bonds offer value relative to both Treasuries and corporate credit. But attractive value is not enough to warrant an overweight allocation. Ideally, we would also like some degree of confidence that wide spreads won’t eventually be justified by a wave of downgrades and defaults. While state & local government balance sheets are certainly stressed, we see strong odds that the muni market will emerge from the COVID recession relatively unscathed. For starters, state & local governments were experiencing strong revenue growth prior to the pandemic (Chart 7, top panel). This allowed them to build rainy day funds up to all-time highs (Chart 7, panel 4). Second, income support for households from the CARES act helped prop up state & local income tax revenues in the second quarter (Chart 7, panel 2), though sales tax revenues took a significant hit (Chart 7, panel 3). Going forward, a blue sweep election scenario would not only provide more income support for households – helping income tax revenues – but a Democratic controlled Congress would also quickly deliver fiscal aid directly to state & local governments. In fact, it is this aid for state & local governments that is currently the key sticking point in fiscal negotiations. In the meantime, state & local governments will continue to clamp down on spending. This can already be seen in the massive drop in state & local government employment (Chart 7, bottom panel). This is obviously a drag on economic growth, but the combination of austerity measures and high rainy day fund balances will help municipal bonds avoid downgrades and defaults, at least until a fiscal relief bill is passed next year. While state & local government balance sheets are certainly stressed, we see strong odds that the muni market will emerge from the COVID recession relatively unscathed. Bottom Line: Municipal bonds offer exceptional value relative to both US Treasuries and corporate credit. Not only that, but rising odds of a blue sweep election make state & local government fiscal relief increasingly likely. Investors should overweight municipal bonds in US fixed income portfolios. Economy: Credit Growth & The Labor Market Credit Growth Slowing Chart 8No Animal Spirits
No Animal Spirits
No Animal Spirits
Of notable economic data releases during the past two weeks, we find it particularly interesting that both consumer credit and Commercial & Industrial (C&I) bank lending continue to slow (Chart 8). On the consumer side, massive income support from the CARES act and few spending opportunities caused households to pay down debt this spring. Then, after two months of modest gains, consumer credit fell again in August (Chart 8, top panel). This strongly suggests that, even as lockdown restrictions have eased, consumers aren’t yet ready to open up the spending taps. On the corporate side, firms received much less of a direct cash injection from Congress and were forced to take on massive amounts of debt to get through the spring and early summer months. But as of the second quarter, we recently observed that nonfinancial corporate retained earnings now exceed capital expenditures.5 This strongly suggests that firms have taken out enough new debt and that C&I bank lending will remain slow in the coming months. Cracks Showing In The Labor Market Chart 9Far From Full Employment
Far From Full Employment
Far From Full Employment
Finally, we should mention September’s employment report that was released two weeks ago (Chart 9). It is certainly positive that the unemployment rate continues to fall, but the main takeaway for bond investors should be that the US economy remains far from full employment, and therefore far away from generating meaningful inflationary pressure. While the unemployment rate fell for the fifth consecutive month, it is now dropping much less quickly than it did early in the summer (Chart 9, panel 2). Also, we continue to note that labor market gains are entirely concentrated in temporarily unemployed people returning to work. The number of permanently unemployed continues to rise (Chart 9, bottom panel). Bottom Line: The economic recovery continues to roll on, but it will be some time before the output gap is closed and inflation starts to rise. Slow consumer and corporate credit growth suggest that animal spirits have not yet taken hold. Meanwhile, the falling unemployment rate masks a persistent uptrend in the number of permanently unemployed. Appendix The Fed rolled out a number of aggressive lending facilities on March 23. These facilities focused on different specific sectors of the US bond market. The fact that the Fed has decided to support some parts of the market and not others has caused some traditional bond market correlations to break down. It has also led us to adopt of a strategy of “Buy What The Fed Is Buying”. That is, we favor those sectors that offer attractive spreads and that benefit from Fed support. The below Table tracks the performance of different bond sectors since the March 23 announcement. We will use this to monitor bond market correlations and evaluate our strategy’s success. Table 3Performance Since March 23 Announcement Of Emergency Fed Facilities
Political Risk Will Dominate In A Pivotal Month For The Bond Market
Political Risk Will Dominate In A Pivotal Month For The Bond Market
Ryan Swift US Bond Strategist rswift@bcaresearch.com Footnotes 1 Please see US Bond Strategy Weekly Report, “More Stimulus Needed”, dated September 15, 2020, available at usbs.bcaresearch.com 2 Please see Geopolitical Strategy Weekly Report, “It Ain’t Over Till It’s Over”, dated October 9, 2020, available at gps.bcaresearch.com 3 For more details on these recommended positions please see US Bond Strategy Weekly Report, “Positioning For Reflation And Avoiding Deflation”, dated August 11, 2020, available at usbs.bcaresearch.com 4 Note that we use the US Credit Index in Charts 6A and 6B. This index includes the entire US corporate bond index but also some non-corporate credit sectors like Sovereigns and Foreign Agency bonds. 5 Please see US Bond Strategy Weekly Report, “Out Of Bullets”, dated September 29, 2020, available at usbs.bcaresearch.com Fixed Income Sector Performance Recommended Portfolio Specification
Highlights Both public opinion polls and betting markets suggest that Joe Biden will become President, with the Democrats gaining control of the Senate and retaining the House of Representatives. Such a “blue wave” would have mixed effects on the value of the S&P 500. On the one hand, corporate taxes would rise under a Biden administration. On the other hand, trade relations with China would improve. The Democrats would also push for more fiscal stimulus, which the stock market would welcome. The odds of Republicans and Democrats agreeing on a major new stimulus deal before the November elections look increasingly slim. In a blue wave scenario, the Democrats will enact $2.5-to-$3.5 trillion in pandemic relief shortly after Inauguration Day. Joe Biden‘s platform also calls for around 3% of GDP in additional spending on infrastructure, health care, education, climate, housing, and other Democratic priorities. Unlike in late 2016, the Fed is in no mood to raise interest rates. Large-scale fiscal easing will push down the value of the US dollar, while giving bond yields a modest boost. Non-US stocks will outperform their US peers. Value stocks will outperform growth stocks. Looking further out, Republicans will move to the left on economic issues, leaving corporate America with no clear backer among the two major parties. As such, while we are constructive on equities over the next 12 months, we see grave dangers ahead later this decade. Look, Here's The Deal: Joe Biden Is In The Lead With four weeks remaining until the US presidential election, Joe Biden remains on course to become the 46th president of the United States. According to recent public opinion polls, the former vice president leads Donald Trump by 10 percentage points nationwide, and by 4 points in battleground states (Chart 1). Far fewer voters are undecided today compared to 2016. This suggests that there is less scope for President Trump to narrow his deficit in the polls. Betting markets give Biden a 68% chance of prevailing in the race for the White House (Chart 2). They also assign a 67% probability that the Democrats will take control of the Senate and 89% odds that they will retain their majority in the House of Representatives. Chart 1Opinion Polls Favor Biden ...
Market Implications Of A Blue Wave
Market Implications Of A Blue Wave
Chart 2.... As Do Betting Markets
Market Implications Of A Blue Wave
Market Implications Of A Blue Wave
Mixed Impact On The S&P 500 What would the market implications of a “blue wave” be? Our sense is that the overall impact on the value of the S&P 500 would be small, largely because some negative repercussions from a Democratic sweep would be offset by positive repercussions. On the negative side, Biden has pledged to raise the corporate income tax rate from 21% to 28%, bringing it halfway back to the 35% rate that prevailed in 2017. He has also promised to introduce a minimum of 15% tax on the income that companies report in their financial statements to shareholders, raise taxes on overseas profits, and lift payroll taxes on households with annual earnings in excess of $400,000. Together, these measures would reduce S&P 500 earnings-per-share by 9%-to-10%. On the positive side, while geopolitical tensions will persist, US trade relations with China would likely improve if Joe Biden were to become the president. Biden has roundly criticized Trump’s tariffs, saying that they are “crushing farmers” and “hitting a lot of American manufacturing… choking it to within an inch of its life.”1 He has pledged to honor multilateral agreements. The World Trade Organization concluded on September 15 that Trump’s tariffs violated international trade rules. This judgement and the desire to turn the page on the Trump era could give Biden the impetus to eventually roll back some of the tariffs. In contrast, having been stricken by what he has called the “China virus,” Trump could take things personally and retaliate with a flurry of new punitive measures. Fiscal policy would be further loosened in a blue wave scenario, an outcome that the stock market would welcome. Voters would also applaud more pandemic relief. Table 1 shows that 72% of Americans, including the majority of Republicans, support the broader contours of the $2 trillion stimulus package that President Trump has rejected. Table 1Voters Support A New $2 Trillion Coronavirus Stimulus Package By A Fairly Wide Margin
Market Implications Of A Blue Wave
Market Implications Of A Blue Wave
At this point, the odds of Republicans and Democrats agreeing on a major new stimulus deal before the November elections look increasingly slim. If Biden wins and the Republicans lose control of the senate, the Democrats would likely enact a stimulus package worth $2.5-to-$3.5 trillion shortly after Inauguration Day on January 20. In addition to pandemic-related stimulus, Joe Biden has called for around 3% of GDP in spending on infrastructure, health care, education, climate, housing, and other Democratic priorities. Only about half of those expenditures would be matched by higher taxes, implying substantial net stimulus for the economy. A Weaker Dollar And Modestly Higher Bond Yields The greenback jumped on Tuesday after President Trump said he is breaking off negotiations with the Democrats over a new stimulus bill. This suggests that the dollar will weaken if fiscal policy is loosened. If that were to happen, it would be different from what transpired following Trump’s victory in 2016 when the dollar strengthened. Why the disconnect between now and then? The answer has to do with the outlook for monetary policy. Back then, the Fed was primed to start raising rates again – it hiked rates eight times beginning in December 2016, ultimately bringing the fed funds rate to 2.5% by end-2018 (Chart 3). This time around, the Fed is firmly on hold, with the vast majority of FOMC members expecting policy rates to stay at rock-bottom levels until at least 2023. This suggests that nominal bond yields will rise less than they did in late 2016. Since inflation expectations will likely move up in response to more stimulative fiscal policy, real yields will rise even less than nominal yields. Over the past 18 months, US real rates have fallen a lot more in relation to rates abroad than what one would have expected based on the fairly modest depreciation in the US dollar (Chart 4). If US real rates remain entrenched deep in negative territory, while the US current account deficit widens further on the back of strong domestic demand, the dollar will continue to weaken. Chart 3Trump Victory Was Followed By Rising Interest Rates
Trump Victory Was Followed By Rising Interest Rates
Trump Victory Was Followed By Rising Interest Rates
Chart 4A Relatively Muted Decline In The Dollar Given The Move In Real Yield Differentials
A Relatively Muted Decline In The Dollar Given The Move In Real Yield Differentials
A Relatively Muted Decline In The Dollar Given The Move In Real Yield Differentials
Favor Non-US And Value Stocks Non-US stocks typically outperform their US peers when the dollar is weakening (Chart 5). This partly stems from the fact that cyclical stocks are overrepresented in stock markets outside of the United States. It also reflects the fact that cash flows denominated in say, euros or yen, are worth more in dollars if the value of the dollar declines. Chart 5A Weaker Dollar Tends To Benefit Cyclical And Non-US Stocks
A Weaker Dollar Tends To Benefit Cyclical And Non-US Stocks
A Weaker Dollar Tends To Benefit Cyclical And Non-US Stocks
Financial stocks are overrepresented outside the US (Table 2). They are also overrepresented in value indices (Table 3). While a Biden administration would subject the largest US banks to additional regulatory scrutiny, the impact on their bottom lines would likely be small. US banks have been living under the shadows of the Dodd-Frank Act for over a decade. Today, banks operate more as stable utilities than as cavalier casinos. Table 2Financials Are Overrepresented In Ex-US Indexes, While Tech Dominates The US Market
Market Implications Of A Blue Wave
Market Implications Of A Blue Wave
Table 3Financials Are Overrepresented In Value, While Tech Dominates Growth Indexes
Market Implications Of A Blue Wave
Market Implications Of A Blue Wave
Stronger stimulus-induced growth next year will allow many banks to release some of the hefty provisions against bad loans that they built up this year, while modestly steeper yields curves will boost net interest margins. Tech stocks are overrepresented in growth indices. Better trade relations would help US tech companies, as would a weaker dollar. That said, Joe Biden’s plan to increase taxes on overseas profits would hit tech companies disproportionately hard since the tech sector derives over half its revenue from outside the United States. Stepped up antitrust enforcement and more stringent privacy rules could also weigh on tech profits. On balance, while there are many moving parts, a Democratic sweep would favor non-US equities over US equities, and value stocks over growth stocks. Trumpism Transcends Trump Chart 6Trump Targeted Socially Conservative Voters
Market Implications Of A Blue Wave
Market Implications Of A Blue Wave
In 2016, we bucked the consensus view that Hillary Clinton would win the election. On September 30, 2016, we predicted that “Trump will win and the dollar will rally,” noting that “Trump has seen a huge (yuge?) increase in support among working-class whites. If the so-called “likely voters” backing Clinton are, in fact, less likely to turn out at the polls than those backing Trump, this could skew the final outcome in Trump's favor.”2 Right-wing populism was the $1 trillion bill lying on the sidewalk that no mainstream Republican politician seemed eager to pick up. According to the Voter Study Group, only 4% of the US electorate identified as socially liberal and fiscally conservative in 2016, compared to 29% who saw themselves as fiscally liberal and socially conservative (Chart 6). The latter group had no political home, at least until Donald Trump came along. Rather than waxing poetically about small government conservatism – as most establishment Republicans were wont to do – Trump railed against mass immigration, unfair trade deals, rising crime, never-ending wars, and what he described as out-of-control political correctness. While Trump was able to carry out parts of his protectionist agenda, most of his other actions fell well short of what he had promised. His only major legislative achievement was a massive tax cut for corporations and wealthy individuals – something that the vast majority of his base never asked for. The Rich Are Flocking To The Democratic Party How did corporations and wealthy Americans reward Trump for lowering their taxes? By shifting their allegiances towards the Democrats, that’s how. According to the Pew Research Center, households earning more than $150,000 favored Democrats by 20 percentage points during the 2018 Congressional elections, a 13-point jump from 2016. Households earning between $30,000 and $149,999 favored Democrats by only 6 points in 2018. The only other income group that strongly favored Democrats were those earning less than $30,000 per year (Table 4). Table 4Democratic Candidates Had Wide Advantages Among The Highest-And-Lowest Income Voters
Market Implications Of A Blue Wave
Market Implications Of A Blue Wave
Chart 7Democratic Districts Have Fared Better Over The Past Decade
Market Implications Of A Blue Wave
Market Implications Of A Blue Wave
Other data tell a similar story. Median household income in Democratic congressional districts rose by 13% between 2008 and 2017. It fell by 4% in Republican districts. Today, on average, Republican districts have a median income that is 13% below Democratic districts (Chart 7). Campaign donations have shifted towards the Democrats. The latest monthly fundraising data shows that the Biden campaign received three times more large-dollar contributions in total than the Trump campaign. The nation’s CEOs have not been immune from this transformation. Seventy-seven percent of the business leaders surveyed by the Yale School of Management on September 23 said they would be voting for Joe Biden.3 As elites desert the Republican Party, will the Democratic Party start championing lower taxes and less regulation? That seems unlikely. According to the Voter Study Group, higher-income Democrats are actually more likely to support raising taxes on families earning more than $200,000 per year than lower-income Democrats (83% versus 79%). Among Republicans, the opposite is true: 45% of lower-income Republicans are in favor of raising taxes, compared to only 23% of higher-income Republicans.4 There used to be a time when companies tried to steer clear of the political limelight. This is starting to change. As the relative purchasing power of Democratic voters has risen, many companies have become emboldened to adopt overtly political stances on a variety of hot-button social and cultural issues, even if those stances alienate many conservative customers. What does this imply for investors? If big business abandons conservative voters, conservative voters will abandon big business. Corporate America will be left with no clear backer among the two major parties. Over the long haul, this is likely to be bad news for equity investors. As such, while we are constructive on equities over the next 12 months, we see grave dangers ahead later this decade. Peter Berezin Chief Global Strategist peterb@bcaresearch.com Footnotes 1 “Biden Takes On ‘Trump’s Tariffs’,” The Wall Street Journal, June 12, 2019. 2 Please see Global Investment Strategy Special Report, “Three (New) Controversial Calls,” dated September 30, 2016. 3 “CEO Caucus Survey: Business Leaders Fault Trump Administration on COVID and China,” Yale School of Management, September 24, 2020. 4 Lee Drutman, Vanessa Williamson, Felicia Wong, “On the Money: How Americans’ Economic Views Define — and Defy — Party Lines,” votersstudygroup.org, June 2019. Global Investment Strategy View Matrix
Market Implications Of A Blue Wave
Market Implications Of A Blue Wave
Current MacroQuant Model Scores
Market Implications Of A Blue Wave
Market Implications Of A Blue Wave
Highlights President Trump is waffling on fiscal relief. Our constraints-based framework still points to a deal, but the odds have clearly fallen. US and global stocks have rallied despite the fiscal failure. Markets evidently believe stimulus is coming regardless, particularly if Democrats win a blue sweep – our base case election scenario. However, our quantitative election model has boosted Republican odds, flagging a major risk to the blue sweep scenario. Moreover a blue sweep will remove checks and balances on the new administration and thus bring negative surprises that the market is underrating. We maintain our tactical risk-off positioning on the expectation of another leg of election-related volatility. Over a 12-month time horizon we remain invested in reflation plays. Feature Financial markets came around to our “blue sweep” base case for the US election this week. Betting markets shifted sharply after the first presidential debate (Chart 1). Support for Biden surged in national opinion polls while Trump dropped off, albeit to a lesser extent in swing states. Worryingly for the White House, the few polls taken since Trump took ill with COVID-19 on October 2 do not show a sympathy bounce for the president (Chart 2). Chart 1Consensus Forms Around ‘Blue Sweep’ Base Case
It Ain’t Over Till It’s Over
It Ain’t Over Till It’s Over
Chart 2Trump Takes A Dive With Little Time On Clock
It Ain’t Over Till It’s Over
It Ain’t Over Till It’s Over
In a very dangerous turn for the president’s re-election chances, Trump discontinued negotiations with House Democrats over a fiscal relief bill, promising to pass a large new stimulus after the election. Partially walking back those comments, he said he would sign any targeted stimulus bills that Congress sends him in the meantime (such as a new round of $1,200 rebates for households). House Speaker Nancy Pelosi shot down the option of a skinny bill, as we have argued she would. Now they are going back and forth. While the S&P 500 rallied on the news, other reflation trades like US cyclicals, oil, and silver show the risk of premature fiscal tightening (Chart 3). Investors may have to wait until late January until getting a new infusion of government support. Chart 3Lack Of Stimulus Still A Risk To Reflation Trades
Lack Of Stimulus Still A Risk To Reflation Trades
Lack Of Stimulus Still A Risk To Reflation Trades
Chart 4Market Rally Not Based On Blue Sweep Odds
Market Rally Not Based On Blue Sweep Odds
Market Rally Not Based On Blue Sweep Odds
True, a fiscal deal could be passed in the lame duck session in November or December, but Republican Senators unwilling to pony up around $500 billion to bail out blue states – when they face a possible wipeout in a historic election – will be even less willing if they lose the election. They will be more hawkish since they will want to pin deficits on the Democrats in future. If Republicans retain control of the Senate despite the latest news – which is possible, especially given the Democratic candidate’s new vulnerability in the North Carolina race due to a sex scandal – then investors have two years of fiscal hawkishness to contend with. Diagram 1 highlights the market implications of this Senate risk. Diagram 1Scenarios For US Election Outcomes And Market Impacts
It Ain’t Over Till It’s Over
It Ain’t Over Till It’s Over
So we need to look elsewhere to explain why the market rallied when odds of a fiscal deal fell. The above reasoning leaves us with the following options: The economy is recovering so robustly that new fiscal stimulus is unnecessary. This is not the view of Federal Reserve Chairman Jay Powell, who all but pleaded for Congress to conclude a deal to secure the recovery, or of other mainstream economists. Stimulus is coming regardless of election outcome. Congress will be forced to support the country during a slump. Debt monetization is the relevant point, even if there is a month-or-two delay in stimulus. Financial markets are cheering the higher odds of a Democratic clean sweep of Congress and the White House since it implies fiscal largesse. The market may already have discounted some of the impending tax hikes over the past month. The second explanation is the best but the third is rapidly becoming the new consensus on Wall Street. Chart 4 suggests there is no connection between the S&P rally and the odds of a blue sweep. With the Fed pursuing “maximum employment” and average inflation targeting, it makes sense that the real mover in the macro landscape has become fiscal policy. Hence the outcome that produces the most proactive fiscal policy is positive for financial markets. A blue sweep is verification of the shift toward debt monetization, which is missing from option two above. The problem is that a blue sweep also brings downside risks. Domestic policy uncertainty will only fall temporarily after the election if there is a blue sweep. Checks and balances will vanish. Eventually Democrats will become overweening in their policy agenda, delivering negative surprises to financial markets. A “New Deal”-style policy agenda would weigh on the corporate earnings outlook. For example, Democrats have refused to forswear removing the filibuster or stacking the Supreme Court, both of which would lie in their power and either of which would enable them to pass an ambitious “New Deal”-style policy agenda that would bring unforeseen consequences – largely in the direction of wealth redistribution away from corporations. Table 1What EPS Hit To Expect?
It Ain’t Over Till It’s Over
It Ain’t Over Till It’s Over
Redistribution would start to correct US social and economic imbalances, improve middle class spending power, and boost consumption – but it would first weigh on the corporate earnings outlook. Net profit growth, which grew by 16% above what was otherwise expected due to the Trump tax cuts (Chart 5), could suffer more than the expected 11% one-off contraction (Table 1), as our US equity strategist Anastasios Avgeriou has shown. Chart 5Partial Repeal Of Trump Tax Cut Bad For Earnings
Partial Repeal Of Trump Tax Cut Bad For Earnings
Partial Repeal Of Trump Tax Cut Bad For Earnings
New proposals will also emerge that the market is not taking account of. To take just the latest example, former Fed Chair Janet Yellen recently stated that the US could adopt a $40 per ton tax on carbon emissions under a Biden administration.1This proposal is not part of Biden’s official plan, hence not priced by markets along with Biden’s expected tax hikes (Table 2). But control of the Senate would make it a real option given Biden’s ambitious climate goals. Table 2Biden Needs Senate To Raise Taxes
It Ain’t Over Till It’s Over
It Ain’t Over Till It’s Over
Consumer confidence in the US will suffer from political polarization. Recall that in 2016, the economy was in fine shape but Republicans did not believe it, weighing down the average until President Trump won the election. Today the economy is in a slump but Republicans may not recognize the bad news until President Trump loses. Democrats, for their part, will suddenly abandon their doom and gloom if Biden wins the election. Applying a comparable partisan shock to consumer confidence for 2021 would suggest that overall confidence will be lackluster (Chart 6). At least this is true until the passage of new stimulus and an advancing recovery outweigh the partisan effect. Chart 6Biden Will Not Recreate Trump Confidence Boost
It Ain’t Over Till It’s Over
It Ain’t Over Till It’s Over
A similar case can be made that small business sentiment will worsen in a blue sweep scenario. Fear of higher regulation and taxes will spike and weigh on animal spirits (Chart 7). Historically the first year after an election sees smaller equity upside and larger downside with unified government as opposed to divided government (Chart 8). If this time is different it is because of the sea change in the US to embrace debt monetization. But that sea change occurred under a Republican administration and is likely to persist due to the output gap. Chart 7SMEs Will Fear Blue Wave
SMEs Will Fear Blue Wave
SMEs Will Fear Blue Wave
Chart 8Stock Market Profile Fits Divided Government, Which Has More Upside
Stock Market Profile Fits Divided Government, Which Has More Upside
Stock Market Profile Fits Divided Government, Which Has More Upside
A Republican Senate under a Biden presidency would bring higher fiscal risk, but the truth is that neither trade war risks nor corporate taxes would go up, yet Republicans would eventually have to concede to spending bills (just as Democrats did under Trump). Hence divided government is not as negative as it is made out to be as it contains mostly known quantities, whereas a blue sweep would lead the US in a redistributionist direction that is initially disruptive. Relative to divided government, it would be positive for aggregate demand but negative for corporate earnings. Bottom Line: US and global equities will rise over the coming 12 months on the back of eventual US stimulus and ongoing global stimulus. A blue sweep is our base case election outcome but it brings mixed results. Global equities would benefit more than US equities which will face a spike in taxes and regulation. US equities will still rise but they face more upside under a divided government in which Republicans halt tax hikes. Supreme Court Confirmation Looms Of course, a blue sweep outcome is not guaranteed. Indeed the fact that it is now consensus makes us nervous, as there are still 26 days until the election. Our quantitative election model gives the Republicans a 49% chance of winning the White House on the back of the V-shaped recovery in the states, which delivers Florida to the Republican camp, leaving Trump with 259 Electoral College votes (Chart 9). This probability is well above our subjective 35% judgment and the new market consensus on Trump’s odds. Chart 9Quant Election Model Gives Trump 259 Electoral College Votes And 49% Odds Of Victory
It Ain’t Over Till It’s Over
It Ain’t Over Till It’s Over
Trump’s decision to break off the fiscal talks probably sealed his doom, but we would still maintain that a correct reading of the various political and economic constraints point toward a fiscal deal. Hence there is still some chance that a deal will be snatched from the jaws of defeat. At that point we would upgrade Trump’s chances to something closer to our election model. But it would not be bullish, as the market would need to price a higher risk of trade war. Subjectively Trump has a 35% chance of re-election, but our quant model flags a risk to this view. The market also must contend with COVID-19 risks (Charts 10A and 10B). Stimulus is necessary to prevent COVID-19 risks from hitting the market, as more distancing will be necessary in states where cases are rising. Chart 10ACOVID-19 Cases Rising
It Ain’t Over Till It’s Over
It Ain’t Over Till It’s Over
Chart 10BCOVID-19 Hits Swing States
It Ain’t Over Till It’s Over
It Ain’t Over Till It’s Over
The reason President Trump cut short the fiscal talks was to ensure that they would not interfere with the Senate’s ability to confirm his Supreme Court nominee Amy Coney Barrett. The confirmation hearings will go up for a floor vote in the Senate sometime around October 23, ensuring a massive constitutional brawl just ahead of the election. The dollar has more upside if Trump wins. Chart 11Risk: Trump Comeback Boosts The Greenback
Risk: Trump Comeback Boosts The Greenback
Risk: Trump Comeback Boosts The Greenback
We do not expect this showdown to change the game, since boosting turnout among Trump’s conservative base will be insufficient in an election fought in the face of major national shocks that affect the median voter (pandemic, recession, social unrest). This election is already going to be a high turnout election – preliminary information suggests it could be the highest since 1908 at 65% of eligible voters2 — which means that Republicans will suffer from the leftward tilt of the median voter. However, if Trump’s polling improves between now and then – and if mFarkets inexplicably rally all month despite the withdrawal of fiscal support – then we could be surprised. Our quantitative model provides a basis for believing that Republicans are now underrated. This implies that the dollar has more upside in the near term as the risk of a contested election and/or a Trump second term, and hence another shock to the US political system and global trading system, must still be guarded against (Chart 11). Investment Takeaways The market faces near-term downside risk and volatility until the US fiscal support is restored. This is particularly the case as long as COVID-19 cases are not subdued. The rising odds of a blue sweep, our base case, is not sufficient to dampen volatility over the coming month. Depending on the election results, volatility will subside in November or January at the latest. Not only is a contested election a non-negligible risk – based on our quant model’s reading – but also President Trump will remain in office till January 20 and could easily dish out some negative surprises, particularly on China relations. Hence we are maintaining our tactical risk-off and safe-haven trades: long US treasuries, Japanese yen, US health care equipment stocks (which will outperform the overall sector amid the Democratic regulatory threat), and EUR-GBP volatility. Over the 12-month time frame, we have little doubt that the US adoption of debt monetization, in keeping with Chinese and global stimulus, will push equities and risky assets higher. The reflation trade remains the core of our strategic portfolio. Global stocks should outperform under a Biden presidency. Biden will be positive for global trade ex-China, as both US electoral politics and grand strategy will drive any administration to take a hard line on China, though Biden will not wield tariffs like Trump. Matt Gertken Vice President Geopolitical Strategy mattg@bcaresearch.com Footnotes 1 See Matthew Green, "U.S. could adopt carbon tax under a Biden presidency, ex-Fed Chair Yellen says," Reuters, October 8, 2020, reuters.com; see also Group of Thirty, "Mainstreaming The Transition To A Net-Zero Economy," October 2020, group30.org. 2 See John Whitesides, "More than 4 million Americans have already voted, suggesting record turnout," Reuters, October 6, 2020, reuters.com.
Highlights US market risks stem from both the lack of fiscal stimulus before the new president assumes office in late January. Risk-off moves in US financial markets will weigh on EM. China’s stimulus has peaked and the country has begun a destocking phase in commodities inventories. These factors could add to investor worries reinforcing the pullback in commodities prices and EM currencies. The key risks to our strategy are that financial markets might look through the lack of US fiscal stimulus in the next several months and ignore the commodity destocking cycle in China. This will be the case if investors instead focus on the US and China’s benign growth outlook over the next nine months. In that regard, we are positive too. Hence, the difficulty is to navigate markets in the near-term. If EM risk assets and currencies prove resilient in the short term, we will upgrade our stance sooner than later. Feature Global risk assets are vulnerable as US Republicans and Democrats have failed to agree on a new round of fiscal stimulus. The odds of enacting significant stimulus legislation – including income support for the unemployed – before the new president assumes office in late January are low. Global risk assets will suffer due to their dependence on continuous government stimulus. The rally since late March has created an air pocket, somewhat disconnecting risk asset prices from their fundamentals. In particular, the gaps between share prices and corporate earnings and between corporate spreads and projected corporate default rates have widened dramatically (Chart I-1). We do not mean that corporate earnings will not recover. Our point is that share prices have risen too far, too fast. Absent a large fiscal stimulus package in the US, risk asset prices will likely experience a meaningful setback. These gaps have been sustained by hopes of continuous fiscal and monetary stimulus. However, absent a large fiscal stimulus package in the US, risk asset prices will likely experience a meaningful setback. We continue recommending EM investors maintain a defensive positioning for now. Asset allocators should remain neutral on EM equities and credit within their respective global portfolios. In the near term, EM currencies will depreciate against the US dollar. We continue shorting a basket of EM currencies versus the euro, CHF and JPY. These DM currencies are likely to experience some, but not substantial, downside versus the greenback. Elevated Expectations Economic growth expectations are rather elevated and investor sentiment is complacent: The Global ZEW expectations index – based on a survey of analysts from banks, insurance companies and finance departments from the corporate sector – is close to an all-time high (Chart I-2). This implies that investors’ and analysts’ growth expectations are substantially inflated. Chart I-1The Rally Has Been Too Fast, And Gone Too Far
The Rally Has Been Too Fast, And Gone Too Far
The Rally Has Been Too Fast, And Gone Too Far
Chart I-2Investor Expectations Are Very Elevated
Investor Expectations Are Very Elevated
Investor Expectations Are Very Elevated
The very low level of the SKEW for US stocks signifies investor complacency (Chart I-3). A low SKEW reading means investors are not pricing in tail risks. Further, the rally since March lows has been reinforced by the substantial speculative trading activities of retail investors. Finally, investors’ net long positions in copper are at their previous cyclical highs (Chart I-4). Chart I-3Low SKEW Signifies That Investors Are Not Ready For Tail Risks
Low SKEW Signifies That Investors Are Not Ready For Tail Risks
Low SKEW Signifies That Investors Are Not Ready For Tail Risks
Chart I-4Investors Are Very Long Copper
Investors Are Very Long Copper
Investors Are Very Long Copper
Peak Stimulus? China is approaching peak stimulus. Chart I-5 shows that the projected bond issuance by central and local governments will decline in the coming months. Besides, the loan approval index of the PBoC banking survey has rolled over decisively (Chart I-6). Chart I-5Peak Fiscal Stimulus In China?
Peak Fiscal Stimulus In China?
Peak Fiscal Stimulus In China?
Chart I-6Peak Credit Growth In China?
Peak Credit Growth In China?
Peak Credit Growth In China?
A combination of less government bond issuance and less loan origination by banks implies that the credit impulse will roll over in the coming months. This does not mean that the mainland economy will weaken in the coming months. The credit and fiscal spending as well as broad money impulses lead the economy by about nine months (Chart I-7). Therefore, even if the credit and fiscal spending impulse rolls over later this year, the economy will continue improving at least until next spring. Therefore, from a cyclical perspective, we remain positive on China’s business cycle. China’s peak stimulus and destocking phase in commodities could add to investor worries. That said, China-related financial markets have already rallied quite a bit and are likely to experience a pullback as US equity and credit markets sell off. Additionally, after having stockpiled commodities since spring, China has probably entered a commodity destocking cycle. Even though final demand in China will be firming, resource prices will likely relapse in the near term due to diminished mainland imports. In the US, the massive fiscal stimulus from the CARES Act has led to a surge in household income amidst the worst collapse in economic activity since the Great Depression and the massive layoffs that accompanied it. Government transfers during recessions are typically devised to moderate income decline but not lead to a boom in income as has occurred in the US this year (Chart I-8). Chart I-7China's Business Cycle Will Continue Improving
China's Business Cycle Will Continue Improving
China's Business Cycle Will Continue Improving
Chart I-8US Household Income Surged Amid Economic Collapse
US Household Income Surged Amid Economic Collapse
US Household Income Surged Amid Economic Collapse
Chart I-9Credit Standards At US Banks Are Tight
Credit Standards At US Banks Are Tight
Credit Standards At US Banks Are Tight
Without renewed fiscal transfers to households, personal income will erode and consumer spending will weaken. Further, state and local governments are retrenching as their revenue streams have evaporated. Finally, bank lending standards have tightened dramatically (Chart I-9). Crucially, the majority of investors are long risk assets because of expectations of recurring fiscal stimulus and the Federal Reserve’s implicit put on stocks and corporate credit. If one of these two pillars – in this case fiscal stimulus – fades away, some investors might throw in the towel. In EM excluding China, Korea and Taiwan, economic activity is rebounding post lockdowns. However, these economies are also approaching peak stimulus at a time when the level of economic activity in many countries remains very low. In addition, hit by a wave of defaults, banks in these economies are not in a position to originate new loans. Thereby, the transmission mechanism of monetary policy is partially broken. Their central banks’ stimulus have not been fully transmitted to the real economies. Bottom Line: Risks to the rally in US equities stem from both the lack of fiscal stimulus and political uncertainty following a possibly contested presidential election. Risk-off moves in US financial markets will weigh on EM. China’s peak stimulus and destocking phase in commodities could add to investor worries, reinforcing the pullback in commodities and EM risk assets. Indicator Review A number of indicators point to downside in EM risk assets and currencies. The advance-decline line for EM equities is below zero stocks (Chart I-10). This points to poor equity breadth in the EM universe. Chart I-10Poor Breadth In EM Equities
Poor Breadth In EM Equities
Poor Breadth In EM Equities
Chart I-11A Warning Signal For EM Stocks
A Warning Signal for EM Stocks
A Warning Signal for EM Stocks
The cross rate of the Swedish koruna versus the Swiss franc (de-trended) has been a good coincident indicator for EM share prices and it points to a selloff (Chart I-11). The implied volatility index for EM currencies is rising (shown inverted in the chart), pointing to a relapse in EM exchange rates versus the US dollar (Chart I-12, top panel). Chart I-12Red Flags For EM Equities And Currencies
Red Flags For EM Equities and Currencies
Red Flags For EM Equities and Currencies
Chart I-13Are Commodities In A Soft Spot?
Are Commodities In A Soft Spot?
Are Commodities In A Soft Spot?
Platinum prices are gapping down. This rings alarm bells for EM currencies as the two are strongly correlated (Chart I-12, bottom panel). Chinese steel rebar futures, global steel stocks and Glencore’s share price – a global bellwether for commodities – have all begun relapsing, even before Trump’s withdrawal from the fiscal stimulus talks (Chart I-13). Also, the latter has failed to break above its 200-day moving average. The same is true for oil prices. We read such a technical configuration as a telltale sign that these commodity plays have not entered a bull market and remain vulnerable. In emerging Asia, high-yield corporate credit’s relative performance versus investment-grade corporates has rolled over at its previous highs (Chart I-14). In the past several years, the failure to break above this technical resistance level was followed by a material selloff in EM credit and equity markets. Bottom Line: The majority of indicators for EM risk assets and currencies are presently flashing red. Investment Considerations The rally in share prices and drop in the US dollar yesterday following Trump’s cancellation of stimulus talks is puzzling. We expect the market to realize that the odds of considerable fiscal stimulus with meaningful income support for the unemployed is low until the new president assumes office in late January. We believe large and recurring US fiscal stimulus packages are very likely following the elections, favoring reflation and inflation strategies in the medium and long run, and weighing on the US dollar. That was the basis upon which we turned bearish on the US dollar on July 9 and upgraded EM stocks from underweight to neutral on July 30. However, in the near term, the lack of fiscal stimulus favors the deflation trade: a bet on lower growth and lower inflation. If EM risk assets and currencies prove resilient in the near term, we will upgrade our stance sooner than later. If the markets agree with our assessment that US growth will meaningfully disappoint without fiscal stimulus, not only will global share prices drop but also US inflation expectations will decline, US real rates will rise and the US dollar will rebound (Chart I-15). This would produce a bearish cocktail for EM currencies, credit markets and stocks in the near term. Chart I-14A Message From Emerging Asian Credit Markets
A Message From Emerging Asian Credit Markets
A Message From Emerging Asian Credit Markets
Chart I-15A Reset In US Inflation Expectations, Real Rates And US Dollar Is Overdue
A Reset In US Inflation Expectations, Real Rates And US Dollar Is Overdue
A Reset In US Inflation Expectations, Real Rates And US Dollar Is Overdue
The key risks to our strategy are that financial markets might look through the lack of US fiscal stimulus in the next several months and ignore the commodity destocking cycle in China. It will be the case if investors focus on the US and China’s benign growth outlook over the next nine months. In that regard, we are positive too. Hence, the difficulty is to navigate markets in the near-term. If EM risk assets and currencies prove resilient in the near term, we will upgrade our stance sooner than later. Stay tuned. Arthur Budaghyan Chief Emerging Markets Strategist arthurb@bcaresearch.com Strategy For Philippine Markets xChart II-1Philippine Equities: Relative & Absolute Performance
Philippine Equities: Relative & Absolute Performance
Philippine Equities: Relative & Absolute Performance
Our underweight stance on Philippine stocks has played out well as this bourse has massively underperformed the EM equity benchmark (Chart II-1, top panel). Notably, in absolute terms, Philippine share prices look disconcerting as they have stalled at their long-term moving average (Chart II-1, bottom panel). We continue to recommend an underweight position in this bourse for dedicated EM portfolios and a cautious stance for absolute-return investors. In terms of the currency market, our short position on the Philippine peso has not played out as the exchange rate has been very resilient. We are removing the PHP from our short EM currency basket by closing the short PHP/long the euro, CHF and JPY trade with a 1% loss. The key reason for the peso’s strength has been the rapidly improving current account balance (Chart II-2). The latter has moved into a surplus due to the collapse in domestic demand and imports as well as ballooning remittances. In brief, the balance of payment surplus has been so large that the currency appreciated against the US dollar even though the central bank accumulated large amounts of foreign exchange reserves. Such strong remittance inflows are probably due to returning expatriate Filipino workers from Gulf countries, bringing their entire savings with them. If so, such remittance inflow will not reoccur. Nevertheless, the trade and current account deficits are unlikely to widen rapidly because imports will stay subdued - due to weak domestic demand - and exports will be supported by electronics exports (Chart II-3). The latter make up 57% of total goods exports. Chart II-2Current Account Balance Is In Surplus
Current Account Balance Is In Surplus
Current Account Balance Is In Surplus
Chart II-3Philippine Exports Are Recovering
Philippine Exports Are Recovering
Philippine Exports Are Recovering
Commercial banks in the Philippines have tightened their lending standards meaningfully. On domestic demand, the post lockdown recovery will be moderate and slow and corporate profits will disappoint: Chart II-4Decelerating Bank Loan Growth
Decelerating Bank Loan Growth
Decelerating Bank Loan Growth
The country has not been handling the pandemic well. The health system is showing signs of stress and the authorities have been forced to continuously roll out new lockdowns and social distancing measures. This will prevent a strong revival in business activity in an economy where consumer spending represents 70% of GDP. The Philippine government has unleashed fiscal stimulus packages of about 4% of GDP to counter the pandemic-induced recession. With the fiscal year nearing its end, the cyclical growth outlook will depend on next year’s budget. Next year’s government spending will likely be 5% higher than the original 2020 budget, i.e., excluding extraordinary stimulus measures from both 2020 and 2021 budgets. Therefore, the 2021 budget is unlikely to be enough to support growth materially. Besides, even though the government is trying to roll out more stimulus for next year, its concerns about the size of budget deficit and its financing will limit stimulus. Crucially, bank loan growth is decelerating sharply (Chart II-4). Commercial banks will be reluctant to originate much new credit in this weak growth environment. In brief, the negative credit impulse will offset the fiscal stimulus. The Philippine central bank has been very aggressive in its measures. It has unleashed an unprecedented QE program – buying government bonds en masse – and has also injected liquidity into the banking system and cut its policy rate by 175 basis points (Chart II-5). Yet, the monetary transmission mechanism has been broken in the Philippines and the monetary easing has not benefited the real economy. In particular, commercial banks in the Philippines have tightened their lending standards meaningfully. In turn, banks’ lending rates have not dropped. As with many other EMs, this is occurring because Philippine banks want to protect or increase their net interest rate margins at a time when they are witnessing mounting non-performing loans, rising provisions, and tanking profits (Chart II-6). Chart II-5Philippine: Central Bank Is Doing QE
Philippine: Central Bank Is Doing QE
Philippine: Central Bank Is Doing QE
Chart II-6Banks Are Facing Mounting NPLs
Banks Are Facing Mounting NPLs
Banks Are Facing Mounting NPLs
Bottom Line: Continue underweighting Philippine stocks in an EM equity portfolio. Within this bourse, we are taking profit on the short position in property stocks. This recommendation has generated a 10% gain since its initiation on November 1, 2018. As to fixed-income markets, consistent with our view change on the currency we are upgrading Philippine sovereign credit from underweight to overweight and domestic bonds from underweight to neutral. Ayman Kawtharani Editor/Strategist ayman@bcaresearch.com Footnotes Equities Recommendations Currencies, Credit And Fixed-Income Recommendations
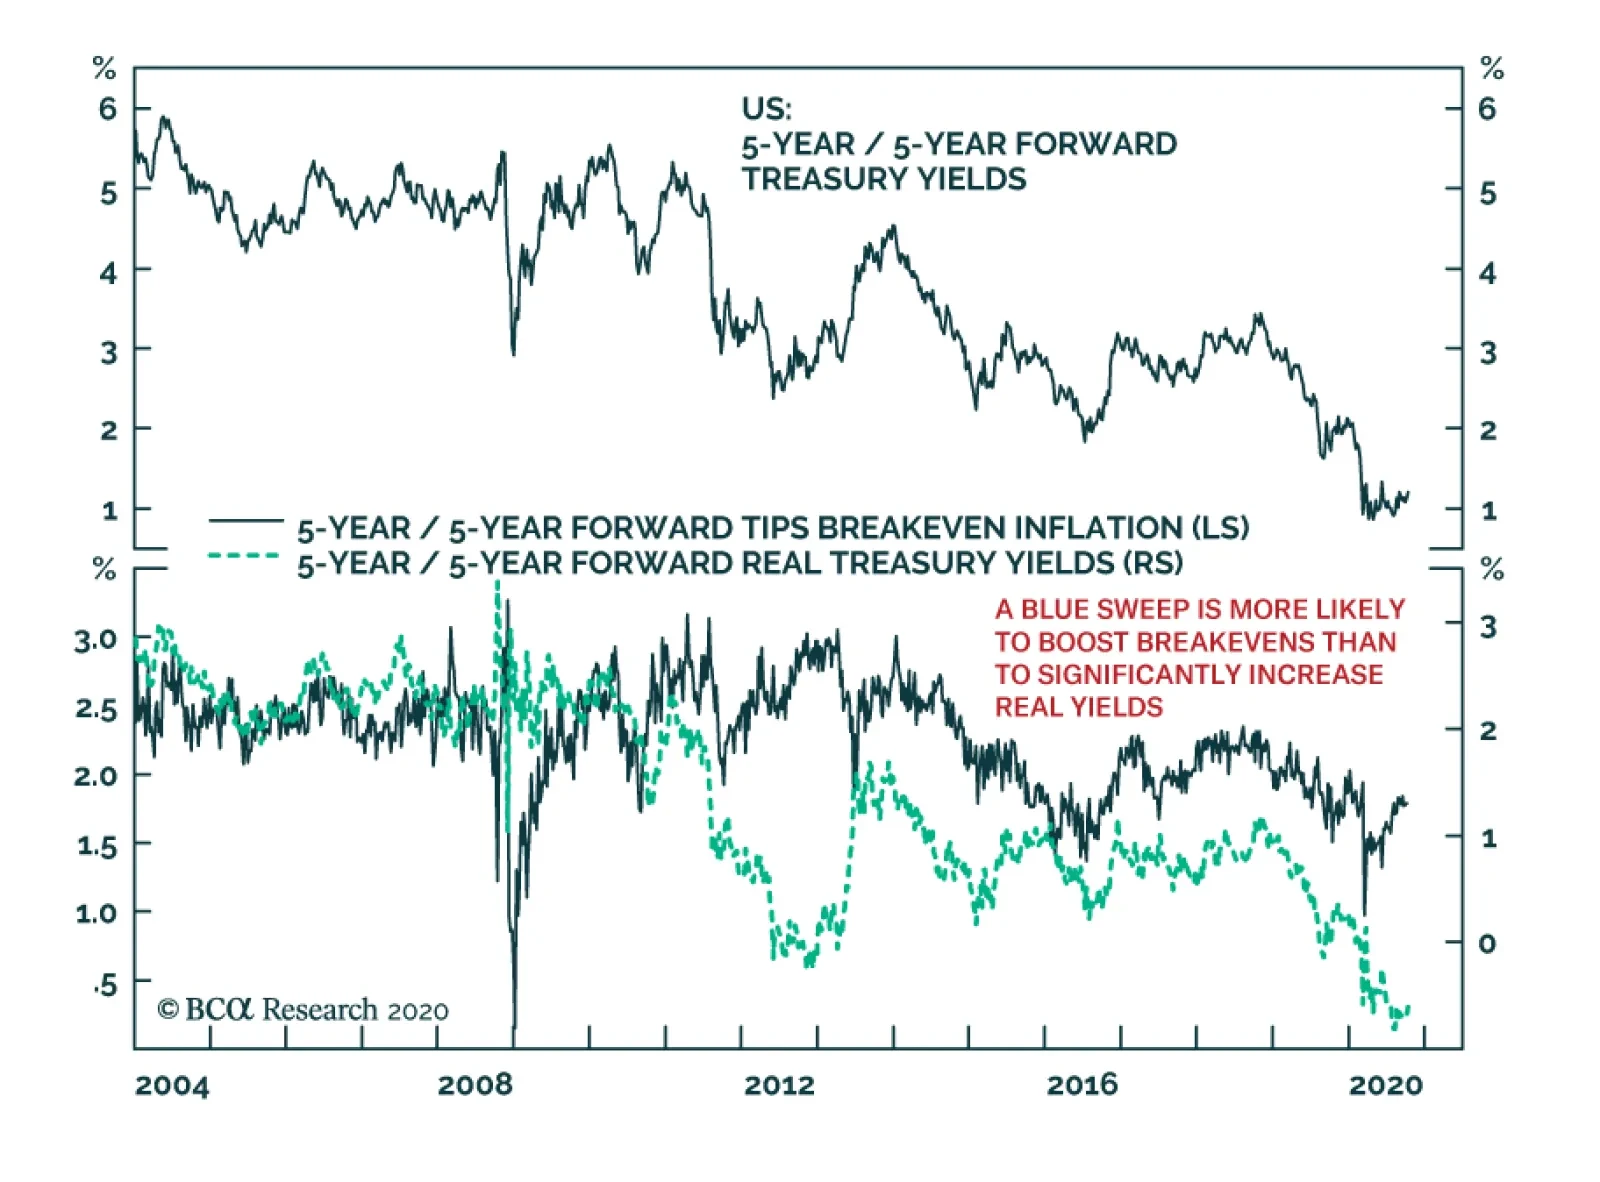
In the Tuesday morning session of our BCA Research Annual investment Conference, Professor Larry Summers mentioned that the disconnect between stock prices and economic activity was a consequence of Secular Stagnation. Secular Stagnation causes a rise in…
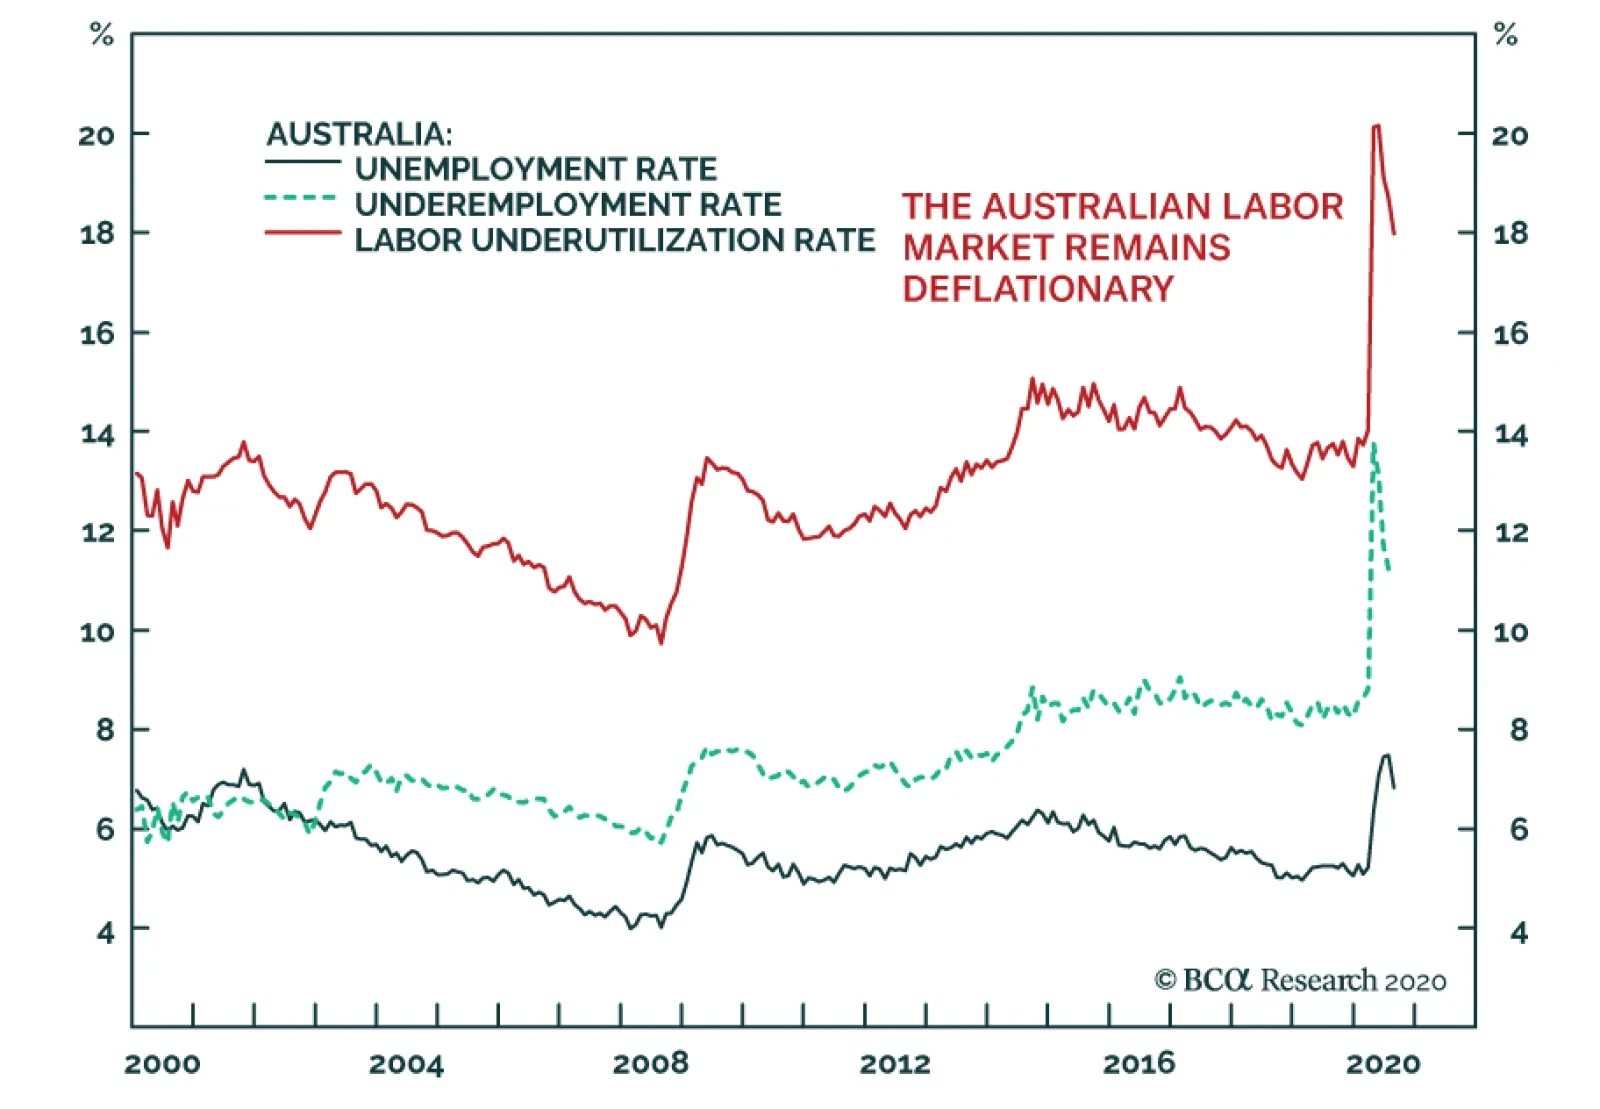
Yesterday was a big day for Australian policymakers, with announcements from both the fiscal and monetary authorities. In aggregate, they delivered a mixed bag. The Reserve Bank of Australia remains as committed as ever to policy easing. The latest policy…
Highlights The first presidential debate does not change our subjective judgment on Trump’s odds of victory (35%), but our quantitative election model is flagging a major risk to this view. The V-shaped economic recovery is greatly improving Trump’s odds in key swing states – including Michigan – according to our model. We will upgrade Trump’s chances if the Republicans agree to a fiscal bill that removes the risk of further financial turmoil in the final month of the campaign. A stock market selloff combined with rising COVID-19 cases is a deadly combination for a president whose re-election bid is on thin ice. The best outcome for financial markets is a stimulus deal now, a Biden victory, and a Republican Senate. The worst outcome is no stimulus and a Democratic sweep, but there would be a silver lining in the form of major fiscal expansion in 2021. Feature The shouting match, er, debate between President Trump and former Vice President Joe Biden probably did not change many voters’ minds. Trump started stronger, Biden finished stronger. The key takeaway is that Biden lived to fight another day. At 77 years old, Biden’s age has been a concern, but he did not appear incoherent like he did in the Democratic primary election.1 From a market perspective, the debate revealed the following: The Republican failure to pass a new fiscal relief bill is hurting their re-election bid, as Biden successfully criticized Trump for not providing new resources amid the national crisis. The next 24-48 hours are critical on our view that the Senate GOP will capitulate to a deal. Joe Biden will raise taxes regardless of the recession. There is speculation that Democrats might delay tax hikes to aid the recovery but Biden did not give reason for optimism. China faces pressure from both parties. Trump blames China for the pandemic and recession while Biden hammered Trump for being weak on China. Biden is trying to steal back the thunder on manufacturing and he emphasized on-shoring more than Trump. Decoupling from China will continue regardless of the election outcome. Table 1Recessions Weigh On Incumbent Win Rates
A Big Risk To A Democratic Sweep
A Big Risk To A Democratic Sweep
We have given Trump a 35% chance of winning since March, based on the historical odds of an incumbent party winning when a recession occurs in the year of the election. However, the economic recovery now poses a clear risk to this view. First, the historical odds rise to 50/50 if the recession ends before the election (Table 1). Second, our quantitative election model now gives Trump a 49% chance of victory, discussed below. Subjectively, we are keeping Trump at 35% because a failure to pass fiscal relief will cause a stock market selloff and remove the last leg of Trump’s re-election bid. But we will upgrade Trump if there is a relief bill and his polling gains momentum. Quant Model Upgrades Trump To 49% Odds Of Victory Our quantitative election model is upgrading Trump’s odds, having taken in the just-released Philly Fed’s coincident economic index for the month of August (Chart 1). The US economy continues to recover, and the more the data improve, the better Trump’s odds of winning the election. Chart 1Quant Model Signals Trump At 49% Odds, Michigan A Toss-Up
A Big Risk To A Democratic Sweep
A Big Risk To A Democratic Sweep
Our quant model consists of (1) state-by-state economic indexes (2) a “time for change” variable that rewards the incumbent party after a four-year term but penalizes it after an eight-year term in the White House (3) the president’s margins of victory in the previous election (3) the range of Trump’s approval rating (rather than the level, thus avoiding any concerns about polling understating Trump’s support). Our model now predicts that Trump will win 259 Electoral College votes, an increase of 29 votes from our August update by flipping Florida back into the Republican camp with a ~60% probability. Thus Trump’s probability of winning the election has risen by 4ppt to 49%. Remarkably Michigan has risen into the ranks of a toss-up state, with a 49.6% chance of a Republican win. The coincident indicators in this state have improved drastically over the past three months and our model uses a three-month rate of change (Chart 2). Our model also gives greater weight to these indicators the closer we get to the election. In discussions with many clients we have observed that the model seemed to be underrating the key upper Midwestern battlegrounds, but now that is changing. The odds that Trump could win New Hampshire and Nevada have also improved substantially, to 41% and 25% respectively. Chart 2State Economic Indicators Put MI, NH, NV Into Play?
A Big Risk To A Democratic Sweep
A Big Risk To A Democratic Sweep
Chart 3Swing State Wages Turning Up
Swing State Wages Turning Up
Swing State Wages Turning Up
Still, as it stands, Democrats are still expected to win Michigan, as well as Pennsylvania and Wisconsin, thus pulling off a narrow victory in the Electoral College. Chart 4Median Family Income Improved
Median Family Income Improved
Median Family Income Improved
However, the trend is in Trump’s favor. Barring very bad economic news in September, the model’s final reading on October 23 may even favor Trump for re-election. The state economic indicators are supported by additional factors: The V-shape recovery is pronounced in workers’ wages, including swing states that voted for Trump (Chart 3). Median family income is still growing – and slightly faster than when Trump took office (Chart 4). Thus it is clear that the economic recovery is a growing risk to our view that Biden will win in a Democratic clean sweep of US government. Trump Faces Imminent Risks From Pandemic And Recession In the debate, Trump successfully deflected criticisms of his handling of the economy and pinned the blame for the coronavirus on China. But a worsening of either of these factors would spell his doom in the final month of the campaign. Trump’s approval rating is still weak, though a sharp improvement would put him on the trajectory that won Presidents Bush and Obama re-election (Chart 5). Chart 5Trump Approval Rating Recovering
A Big Risk To A Democratic Sweep
A Big Risk To A Democratic Sweep
Chart 6Trump Looks Better In Swing State Polling
A Big Risk To A Democratic Sweep
A Big Risk To A Democratic Sweep
Biden’s lead in head-to-head polling in the swing states is stable over the course of the year so far, though Trump has recently improved and is close to or within the typical margin of error for these polls. Chart 7Trump Must Beware Whiplash From Pandemic And Recession
A Big Risk To A Democratic Sweep
A Big Risk To A Democratic Sweep
What should prove decisive in the final month is the trajectory of the pandemic and the economy. Trump’s approval on the economy is just barely above 50%, but his handling of COVID-19 has relapsed (Chart 7). The pandemic will bring bad news over the coming month, but it is not clear how bad. New daily cases of COVID-19 are rising in the US as a whole and in key swing states like Wisconsin, Arizona, and Pennsylvania. It makes sense to see cases springing up in states that are improving rapidly in economic terms, including these states and Nevada and New Hampshire (Charts 8A & 8B). As deaths increase, bad news will affect consumers’ behavior and sentiment. Chart 8ACOVID-19 Uptick A Major Risk To Trump
A Big Risk To A Democratic Sweep
A Big Risk To A Democratic Sweep
Chart 8BCOVID-19 Uptick A Major Risk To Trump
A Big Risk To A Democratic Sweep
A Big Risk To A Democratic Sweep
New fiscal relief would sustain the economy even if social distancing and government restrictions increase in October to fend off this third wave in infections. Meanwhile the absence of fiscal relief will weigh on Trump’s fragile approval on the economy. Voters have consistently punished both the president and the Congress for brinksmanship over fiscal deadlines (Charts 9A & 9B). Chart 9AVoters Give Thumbs Down For Fiscal Dysfunction
A Big Risk To A Democratic Sweep
A Big Risk To A Democratic Sweep
Chart 9BVoters Give Thumbs Down For Fiscal Dysfunction
A Big Risk To A Democratic Sweep
A Big Risk To A Democratic Sweep
Markets also sell off when policymakers threaten to take the US over a fiscal cliff (Charts 10A & 10B). So far this is also the case in September 2020, though the jury is out. Chart 10AMarkets Sell Off During Fiscal Cliffs
Markets Sell Off During Fiscal Cliffs
Markets Sell Off During Fiscal Cliffs
Chart 10BMarkets Sell Off During Fiscal Cliffs
A Big Risk To A Democratic Sweep
A Big Risk To A Democratic Sweep
Can President Trump Stimulate By Executive Order? The president has few unilateral alternatives to a congressional fiscal bill. Chart 11Unilateral Stimulus Will Not Save Markets
Unilateral Stimulus Will Not Save Markets
Unilateral Stimulus Will Not Save Markets
Several clients have asked about the Treasury’s general account, which currently holds over $1.5 trillion in cash (Chart 11). The Treasury issued lots of bonds and temporarily over-prepared for what is necessary to finance the US’s surging deficits, as the economic recovery has seen better-than-expected revenues. Our US bond strategist addressed this issue in a recent report entitled “The Case Against The Money Supply.” Could Trump unilaterally re-purpose these funds as economic stimulus if Congress fails to agree on a fiscal bill? We would not put it past the president to try – he is already stimulating by decree – but the courts would issue injunctions since the House has the constitutional power of the purse. In the meantime it would be difficult to implement the president’s orders, as with recent executive orders on extending unemployment insurance and deferring the payroll tax. Uncertainty over the US’s fiscal future would increase, not decrease, due to the legal dispute and the simultaneous risk that Republicans who had proved fiscally hawkish would retain the Senate after November 3. Therefore raiding the Treasury account is not a viable solution for markets in the absence of a real stimulus deal. And while voters might approve of the president’s actions in the face of a do-nothing Congress, the market’s negative response would damage sentiment and Trump’s approval on the economy. Investment Takeaways Our subjective reason not to upgrade Trump’s odds from 35% stems from the relationship of politics and financial markets. We have a high conviction view that the equity market will sell off if Republicans fail to conclude a fiscal deal. Financial turmoil in October will undermine recent improvements in the economy, economic sentiment, and opinion polls, as it will undermine Trump’s approval on handling the economy. The rise in COVID-19 cases reinforces the downside risk to markets, especially in the absence of stimulus. We will upgrade Trump’s odds of victory if this contradiction is resolved either through new fiscal relief or through something that improves sentiment on the pandemic, such as a credible vaccine announcement. It is hard to see Trump’s odds improving otherwise. An upgrade of Trump’s odds will increase the substantial risk of a contested election. Volatility will persist through November, with potential to expand into December and possibly even January. However we have a high conviction view that volatility will collapse by the end of January. Election scenarios would then look like this: If no fiscal relief passes, and markets sell prior to the election, then a Democratic clean sweep becomes more likely and will galvanize a move up for risk assets, as investors will look to major fiscal expansion in 2021 and beyond. But if Republicans retain the Senate in this scenario, then the need for a market riot for each future dose of stimulus will unnerve investors and the selloff will be prolonged. However, if fiscal stimulus passes prior to the election as we expect, then markets will view a Democratic sweep as an initial negative due to tax hikes and re-regulation. The prospect of fiscal expansion will only gradually become a positive factor. Thus the post-election adjustment will be short-lived. Global and cyclical equities will outperform. If stimulus passes pre-election, yet Republicans retain the Senate under a President Biden, fear of fiscal obstruction will be postponed, the prospect of tax hikes will collapse, and trade war risk will be at least somewhat reduced (Biden will be soft on global trade ex-China). This is the best outcome for risk assets, especially global equities and cyclical sectors. If stimulus passes, and Trump and the Republicans retain power, any relief rally will be short-lived as the prospect of a global trade war will loom. US equities will continue outperforming global. We are booking a small 5.7% profit on our long French energy / short US energy trade due to the risk of a Trump comeback, which would help the US energy sector. Dollar strength on near-term uncertainty will also be a headwind for this trade until the US election is resolved. Matt Gertken Vice President Geopolitical Strategy mattg@bcaresearch.com Guy Russell Research Analyst GuyR@bcaresearch.com Footnotes 1 Post-debate polling by CNN suggests that Biden beat expectations, performed better than Trump, and increased in voter favorability, while Trump underperformed Biden and expectations and shed favorability. However, post-debate polls tend to overrepresent Democratic-leaning voters and have not predicted past presidential election results. (Post-debate polls over the course of three debates would have predicted a Clinton win in 2016, a Romney win in 2012, and a Kerry win in 2004.)
Dear Client, We are sending you our Quarterly Strategy Outlook today, where we outline our thoughts on the macro landscape and the direction of financial markets for the rest of the year and beyond. We will also be hosting a webcast on Thursday, October 1st at 10:00 AM EDT (3:00 PM BST, 4:00 PM CEST, 10:00 PM HKT) where we will discuss the outlook. Best regards, Peter Berezin, Chief Global Strategist Highlights Macroeconomic outlook: Global growth faces near-term challenges from a resurgence in the pandemic and the failure of the US Congress to pass a stimulus deal. However, growth should revive next year as a vaccine becomes available and fiscal policy turns stimulative again. Global asset allocation: Favor equities over bonds on a 12-month horizon, while maintaining somewhat larger than normal cash positions in the short run that can be deployed if stocks resume their correction. Equities: Prepare to pivot from the “Pandemic trade” to the “Reopening trade.” Vaccine optimism should pave the way for cyclicals to outperform defensives, international stocks to outperform their US peers, and for value to outperform growth. Fixed income: Bond yields will rise modestly, suggesting that investors should maintain below average duration exposure. Favor inflation-protected securities over nominal bonds. Spread product will outperform safe government bonds. Currencies: The US dollar will weaken over the next 12 months. The collapse in interest rate differentials, stronger global growth, and a widening US trade deficit are all bearish for the greenback. Commodities: Rising demand and constrained supply will support oil prices, while Chinese stimulus will buoy industrial metals. Investors should buy gold and other real assets as a hedge against long-term inflation risk. I. Macroeconomic Outlook Policy And The Pandemic Will Continue To Drive Markets Going into the fourth quarter of 2020, we are tactically neutral on global equities but remain overweight stocks and other risk assets on a 12-month horizon. As has been the case for much of the year, both the virus and the policy response to the pandemic will continue to be key drivers of market returns. Coronavirus: Still Spreading Fast, But Less Deadly On the virus front, the global number of daily new cases continues to trend higher, with the 7-day average reaching a record high of nearly 300,000 this week (Chart 1). Chart 1Globally, The Number Of Daily New Cases Continues To Trend Higher
Fourth Quarter 2020 Strategy Outlook: A Post-Pandemic Regime Shift
Fourth Quarter 2020 Strategy Outlook: A Post-Pandemic Regime Shift
The number of daily new cases in the EU has risen above its April peak. Spain and France have been particularly hard hit. Canada is also seeing a pronounced rise in new cases. In the US, the number of new cases peaked in July. However, the 7-day average has been creeping up since early September, raising the risk of a third wave. On the positive side, mortality rates in most countries remain well below their spring levels. There is no clear consensus as to why the virus has become less lethal. Better medical treatments, including the use of low-cost steroids, have certainly helped. A shift in the incidence of cases towards younger, healthier people has also lowered the overall mortality rate. In addition, there is some evidence that the virus may be evolving to be more contagious but less deadly.1 It would not be surprising if that were the case. After all, a virus that kills its host will also kill itself. Lastly, pervasive mask wearing may be mitigating the severity of the disease by reducing the initial viral load that infected individuals receive.2 A smaller initial dose gives the immune system more time to launch an effective counterattack. It has even been speculated that the widespread use of masks may be acting as a form of “variolation.” Prior to the invention of vaccines, variolation was used to engender natural immunity. Perhaps most famously, upon taking command of the Continental Army in 1775, George Washington had all his troops exposed to small amounts of smallpox.3 The gamble worked. The US ended up winning the Revolutionary War, making Washington the first president of the new republic. Waiting For A Vaccine Despite the decline in mortality rates, there is still much that remains unknown about Covid-19, including the extent to which the disease will lead to long-term damage to the vascular and nervous systems. Thus, while governments are unlikely to impose the same sort of severe lockdown measures that they implemented in March, rising case counts will delay reopening plans, and in many cases, lead to the reintroduction of stricter social distancing rules. Chart 2Some States Have Started To Relax Lockdown Measures
Fourth Quarter 2020 Strategy Outlook: A Post-Pandemic Regime Shift
Fourth Quarter 2020 Strategy Outlook: A Post-Pandemic Regime Shift
This has already happened in a number of countries. The UK reinstated more stringent regulations over social gatherings last week, including ordering pubs and restaurants to close by 10pm. Spain has introduced tougher mobility restrictions in Madrid and surrounding municipalities. France ordered gyms and restaurants to close for two weeks. Canada has also tightened regulations, with the government of Quebec raising the alert level to maximum “red alert” in several regions of the province. In the US, the share of the population living in states that were in the process of relaxing lockdown measures has risen above 50% for the first time since July (Chart 2). A third wave would almost certainly forestall the recent reopening trend. Ultimately, a safe and effective vaccine will be necessary to defeat the virus. Fortunately, about half of experts polled by the Good Judgment Project expect a vaccine to become available by the first quarter of 2021. Only 2% expect there to be no vaccine available by April 2022, down from over 50% in May (Chart 3). Chart 3When Will A Vaccine Become Available?
Fourth Quarter 2020 Strategy Outlook: A Post-Pandemic Regime Shift
Fourth Quarter 2020 Strategy Outlook: A Post-Pandemic Regime Shift
Premature Fiscal Tightening And The Risk of Second-Round Effects Even if a vaccine becomes available early next year, there is a danger that the global economy will have suffered enough damage over the intervening months to forestall a rapid recovery. Whenever an economy suffers an adverse shock, a feedback loop can develop where rising joblessness leads to less spending, leading to even more joblessness. Fiscal stimulus can short-circuit this vicious circle by providing households with adequate income to maintain spending. Fiscal policy in the major economies turned expansionary within weeks of the onset of the pandemic (Chart 4). In the US, real personal income growth actually accelerated in the spring because transfers from the government more than offset the loss in wage and salary compensation (Chart 5). Chart 4Fiscal Policy Has Been Very Stimulative This Year
Fourth Quarter 2020 Strategy Outlook: A Post-Pandemic Regime Shift
Fourth Quarter 2020 Strategy Outlook: A Post-Pandemic Regime Shift
Chart 5Personal Income Accelerated Earlier This Year
Personal Income Accelerated Earlier This Year
Personal Income Accelerated Earlier This Year
Chart 6Drastic Drop In Weekly Unemployment Insurance Payments
Drastic Drop In Weekly Unemployment Insurance Payments
Drastic Drop In Weekly Unemployment Insurance Payments
Starting in August, US fiscal policy turned less accommodative. Chart 6 shows that regular weekly unemployment payments have fallen from around $25 billion to $8 billion since the end of July. At an annualized rate, this amounts to over 4% of GDP in fiscal tightening. While President Trump signed an executive order redirecting some of the money that had been earmarked for the Federal Emergency Management Agency (FEMA) to be given to unemployed workers, the available funding will run out within the next month or so. On top of that, the funds in the small business Paycheck Protection Program have been used up, while many state and local governments face a severe cash crunch. US households saved a lot going into the autumn, so a sudden stop in spending is unlikely. Nevertheless, fissures in the economy are widening. Core retail sales contracted in August for the first time since April. Consumer expectations of future income growth remain weak (Chart 7). Permanent job losses are rising faster than they did during the Great Recession (Chart 8). Both corporate bankruptcy and mortgage delinquency rates are moving up, while bank lending standards have tightened significantly (Chart 9). Chart 7Consumer Expectations Of Future Income Growth Remain Weak
Consumer Expectations Of Future Income Growth Remain Weak
Consumer Expectations Of Future Income Growth Remain Weak
Chart 8Permanent Job Losses Are Rising Faster Than They Did During The Great Recession
Fourth Quarter 2020 Strategy Outlook: A Post-Pandemic Regime Shift
Fourth Quarter 2020 Strategy Outlook: A Post-Pandemic Regime Shift
Chart 9Corporate Bankruptcy And Mortgage Delinquency Rates Are Moving Up … While Bank Lending Standards Have Tightened Significantly
Fourth Quarter 2020 Strategy Outlook: A Post-Pandemic Regime Shift
Fourth Quarter 2020 Strategy Outlook: A Post-Pandemic Regime Shift
Fiscal Stimulus Will Return We ultimately expect US fiscal policy to turn accommodative again. There is no appetite for fiscal austerity. Both political parties are moving in a more populist direction, which usually signals larger budget deficits. Even among Republicans, more registered voters support extending emergency federal unemployment insurance payments than oppose it (Chart 10). Chart 10There Is Much Public Support For Fiscal Stimulus
Fourth Quarter 2020 Strategy Outlook: A Post-Pandemic Regime Shift
Fourth Quarter 2020 Strategy Outlook: A Post-Pandemic Regime Shift
As long as interest rates stay low, there will be little market pressure to trim budget deficits. US real rates remain in negative territory. Despite a rising debt stock, the Congressional Budget Office expects net interest payments to decline towards 1% of GDP over the span of the next couple of years, thus reaching the lowest level in six decades (Chart 11). Outside the US, there has been little movement towards tightening fiscal policy. The UK government unveiled last week a fresh round of economic and fiscal measures to help ease the burden on both employees, by subsidizing part-time work for example, and firms, by extending government-guaranteed loan programs. At the beginning of the month, the Macron government announced a 100 billion euro stimulus plan in France. Meanwhile, European leaders are moving forward on a euro area-wide 750 billion euro stimulus package that was announced this summer. In Japan, the new Prime Minister Yoshihide Suga has indicated that he will pursue a third budget to fight the economic downturn, adding that “there is no limit to the amount of bonds the government can issue to support an economy battered by the coronavirus pandemic.” The Japanese government now earns more interest than it pays because two-thirds of all Japanese debt bears negative yields (Chart 12). At least for now, a big debt burden is actually good for the Japanese government’s finances! Chart 11Low Interest Payments Amid Skyrocketing Debt In The US
Low Interest Payments Amid Skyrocketing Debt In The US
Low Interest Payments Amid Skyrocketing Debt In The US
Chart 12Japan: Ballooning Debt And Declining Interest Payments
Japan: Ballooning Debt And Declining Interest Payments
Japan: Ballooning Debt And Declining Interest Payments
China also continues to stimulate its economy. Jing Sima, BCA’s chief China strategist, expects the broad-measure fiscal deficit to reach a record 8% of GDP this year and remain elevated into next year. The annual change in total social financing – a broad measure of Chinese credit formation – is expected to hit 35% of GDP, just shy of its GFC peak (Chart 13). Not surprisingly, the Chinese economy is responding well to all this stimulus. Sales of floor space rose 40% year-over-year in August, driven by a close to 60% jump in Tier-1 cities. Excavator sales, a leading indicator for construction spending, are up 51% over last year’s levels, while industrial profits have jumped 19%. A resurgent Chinese economy has historically been closely associated with rising global trade (Chart 14). Chart 13China Continues To Stimulate Its Economy
China Continues To Stimulate Its Economy
China Continues To Stimulate Its Economy
Chart 14Chinese Economic Rebound Has Historically Been Closely Associated With Rising Global Trade
Chinese Economic Rebound Has Historically Been Closely Associated With Rising Global Trade
Chinese Economic Rebound Has Historically Been Closely Associated With Rising Global Trade
Biden Or Trump: How Will Financial Markets React? Betting markets expect former Vice President Joe Biden to become president and for the Democrats to gain control of the Senate (Chart 15). A “blue wave” would produce more fiscal spending in the next few years. Recall that House Democrats passed a $3.5 trillion stimulus bill in May that was quickly rejected by Senate Republicans. More recently, Democratic leaders have suggested they would approve a stimulus deal in the range of $2-to-$2.5 trillion. Chart 15Betting Markets Putting Their Money On The Democrats
Fourth Quarter 2020 Strategy Outlook: A Post-Pandemic Regime Shift
Fourth Quarter 2020 Strategy Outlook: A Post-Pandemic Regime Shift
In addition to more pandemic-related stimulus, Joe Biden has also proposed a variety of longer-term spending initiatives. These include $2 trillion in infrastructure spending spread over four years, a $700 billion “Made in America” plan that would increase federal procurement of domestically produced goods and services, and new spending proposals worth about 1.7% of GDP per annum centered on health care, housing, education, and child and elder care. As president, Joe Biden would likely take a less confrontational stance towards relations with China. While rolling back tariffs would not be an immediate priority for a Biden administration, it could happen later in 2021. Less welcome for investors would be an increase in taxes. Joe Biden has proposed raising taxes by $4 trillion over ten years (about 1.5% of cumulative GDP). Slightly less than half of that consists of higher personal taxes on both regular income (for taxpayers earning more than $400,000 per year) and capital gains (for tax filers with over $1 million in income). The other half consists of increased business taxes, mainly in the form of a hike in the corporate tax rate from 21% to 28% and the introduction of a minimum 15% tax on the global book income of US-based companies. Netting it out, a blue sweep in November would probably be neutral-to-slightly negative for equities. What about government bonds? Our guess is that Treasury yields would rise modestly in response to a blue wave, particularly at the longer end of the yield curve. Additional fiscal support would boost aggregate demand, implying that it would take less time for the economy to reach full employment. That said, interest rate expectations are unlikely to rise as sharply as they did in late 2016 following Donald Trump‘s victory. Back then, the Fed was primed to raise rates – it hiked rates nine times starting in December 2015, ultimately bringing the fed funds rate to 2.5% by end-2018. This time around, the Fed is firmly on hold, with the vast majority of FOMC members expecting policy rates to stay at rock-bottom levels until at least 2023. The Fed’s New Tune In two important respects, the Fed’s new Monetary Policy Framework (MPF) represents a sharp break with the past. Chart 16The Mechanics Of Price-Level Targeting
Fourth Quarter 2020 Strategy Outlook: A Post-Pandemic Regime Shift
Fourth Quarter 2020 Strategy Outlook: A Post-Pandemic Regime Shift
First, the MPF abandons the Fed’s historic reliance on a Taylor Rule-style framework, which prescribes lifting rates whenever the unemployment rate declines towards its equilibrium level. Second, the MPF eschews the “let bygones be bygones” approach of past monetary policymaking. Going forward, the Fed will try to maintain an average level of inflation of 2% over the course of the business cycle. This means that if inflation falls below 2%, the Fed will try to engineer a temporary inflation overshoot in order to bring the price level back up to its 2%-per-year upward trend (Chart 16). Some aspects of the Fed’s new strategy are both timely and laudable. A Taylor rule approach makes sense when there is a clear relationship between inflation and the unemployment rate, as governed by the so-called Phillips curve. However, if inflation fails to rise in response to declining economic slack – as has been the case in recent years – central banks may find themselves at a loss in determining where the neutral rate of interest lies. In this case, it might be preferable to keep interest rates at very low levels until the economy begins to overheat. Such a strategy would avoid the risk of raising rates prematurely, only to discover that they are too high for what the economy can handle. Targeting an average rate of inflation also has significant merit. When investors purchase long-term bonds, they run the risk that the real value of those bonds will deviate significantly from initial expectations when the bonds mature. If inflation surprises on the upside, the bonds will end up being worth less to the lender as measured by the quantity of goods and services that they can be exchanged for. If inflation surprises on the downside, borrowers could find themselves facing a larger real debt burden than they had anticipated. An inflation targeting system that corrects for past inflation surprises could give both borrowers and lenders greater certainty about the future price level. This, in turn, could reduce the inflation risk premium embedded in long-term bond yields, leading to a more efficient allocation of economic resources. In addition, an average inflation targeting system could make the zero lower bound constraint less vexing by keeping long-term inflation expectations from slipping below the central bank’s target. This would give the central bank more traction over monetary policy. A Bias Towards Higher Inflation Despite the advantages of the Fed’s new approach, it faces a number of hurdles, some practical and some political. On the practical side, it may turn out that the Phillips curve, rather than being flat, is kinked at a fairly low level of unemployment. Theoretically, that would not be too surprising. If I have 100 apples for sale and you want to buy 60, I have no incentive to raise prices. Even if you wanted to buy 80 apples, I would have no incentive to raise prices. However, if you wanted to buy 105 apples, then I would have an incentive to raise my selling price. The point is that inflation could remain stubbornly dormant as slack slowly disappears, only to rocket higher once full employment has been reached. Since changes in monetary policy only affect the economy with a lag, the central bank could find itself woefully behind the curve, scrambling to contain rising inflation. This is precisely what happened during the 1960s (Chart 17). Chart 17Inflation Started Accelerating Quickly Only When Unemployment Reached Very Low Levels In The 1960s
Inflation Started Accelerating Quickly Only When Unemployment Reached Very Low Levels In The 1960s
Inflation Started Accelerating Quickly Only When Unemployment Reached Very Low Levels In The 1960s
Chart 18Something Has Always Happened To Preempt Overheating
Something Has Always Happened To Preempt Overheating
Something Has Always Happened To Preempt Overheating
Over the past three decades, something always happened that kept the US economy from overheating (Chart 18). The unemployment rate reached a 50-year low in 2019. Inflation may have moved higher this year had it not been for the fact that the global economy was clotheslined by the pandemic. In 2007, the economy was heating up only to be sandbagged by the housing bust. In 2000, the bursting of the dotcom bubble helped reverse incipient inflationary pressures. But just because the economy did not have a chance to overheat at any time over the past 30 years does not mean it cannot happen in the future. The Political Economy Of Higher Inflation On the political side, average inflation targeting assumes that central banks will be just as willing to tolerate inflation undershoots as overshoots. This could be a faulty assumption. Generating an inflation overshoot requires that interest rates be kept low enough to enable unemployment to fall below its full employment level. That is likely to be politically popular. Generating an inflation undershoot, in contrast, requires restrictive monetary policy and rising unemployment. More joblessness would not sit well with workers. High interest rates could also damage the stock market and depress home prices, while forcing debt-saddled governments to shift more spending from social programs to bondholders. None of that will be politically popular. If central banks are quick to allow inflation overshoots but slow to engineer inflation undershoots, the result could be structurally higher inflation. Markets are not pricing in such an outcome (Chart 19). Chart 19Markets Are Not Pricing In Structurally Higher Inflation
Fourth Quarter 2020 Strategy Outlook: A Post-Pandemic Regime Shift
Fourth Quarter 2020 Strategy Outlook: A Post-Pandemic Regime Shift
II. Financial Markets Global Asset Allocation: Despite Near-Term Dangers, Overweight Equities On A 12-Month Horizon An acceleration in the number of COVID-19 cases and the rising probability that the US Congress will fail to pass a stimulus bill before the November election could push equities and other risk assets lower in the near term. Investors should maintain somewhat larger than normal cash positions in the short run that can be deployed if stocks resume their correction. Chart 20The Decline In US Real Yields Since March Has Largely Offset The Rise In Stock Prices
The Decline In US Real Yields Since March Has Largely Offset The Rise In Stock Prices
The Decline In US Real Yields Since March Has Largely Offset The Rise In Stock Prices
Provided that progress continues to be made towards developing a vaccine and US fiscal policy eventually turns stimulative again, stocks will regain their footing, rising about 15% from current levels over a 12-month horizon. Negative real bond yields will continue to support stocks (Chart 20). The 30-year TIPS yield has fallen by over 90 basis points in 2020. Even if one assumes that it will take the rest of the decade for S&P 500 earnings to return to their pre-pandemic trend, the deep drop in the risk-free component of the discount rate has still raised the present value of future S&P 500 cash flows by nearly 20% since the start of the year (Chart 21). Chart 21The Present Value Of Earnings: A Scenario Analysis
Fourth Quarter 2020 Strategy Outlook: A Post-Pandemic Regime Shift
Fourth Quarter 2020 Strategy Outlook: A Post-Pandemic Regime Shift
Thanks to these exceptionally low real bond yields, equity risk premia remain elevated (Chart 22). The TINA mantra reverberates throughout the investment world: There Is No Alternative to stocks. To get a sense of just how powerful TINA is, consider the fact that the dividend yield on the S&P 500 currently stands at 1.67%. That may not sound like much, but it is still a full percentage point higher than the paltry 0.67% yield on the 10-year Treasury note (Chart 23). Chart 22Equity Risk Premia Remain Elevated
Equity Risk Premia Remain Elevated
Equity Risk Premia Remain Elevated
Chart 23S&P 500 Dividend Yield Is Above The Treasury Yield
S&P 500 Dividend Yield Is Above The Treasury Yield
S&P 500 Dividend Yield Is Above The Treasury Yield
Imagine having to decide whether to place your money either in an S&P 500 index fund or a 10-year Treasury note. Dividends-per-share paid by S&P 500 companies have almost always increased over time. However, even if we make the pessimistic assumption that dividends-per-share remain unchanged for the next ten years, the value of the S&P 500 would still have to fall by 10% over the next decade to equal the return on the 10-year note. Assuming that inflation averages around 1.9% over this period, the real value of the S&P 500 would need to drop by 25%. The picture is even more dramatic outside the US. In the euro area, the index would have to fall by over 30% in real terms for investors to make more money in bonds than stocks. In the UK, it would need to fall by over 50% (Chart 24). Chart 24 (I)Stocks Would Need To Fall A Lot For Equities To Underperform Bonds
Stocks Would Need To Fall A Lot For Equities To Underperform Bonds Stocks Would Need To Fall A Lot For Equities To Underperform Bonds
Stocks Would Need To Fall A Lot For Equities To Underperform Bonds Stocks Would Need To Fall A Lot For Equities To Underperform Bonds
Chart 24 (II)Stocks Would Need To Fall A Lot For Equities To Underperform Bonds
Stocks Would Need To Fall A Lot For Equities To Underperform Bonds
Stocks Would Need To Fall A Lot For Equities To Underperform Bonds
A Weaker US Dollar Favors International Stocks Outside the US, price-earnings ratios are lower, while equity risk premia are higher. Cheap valuations are usually not enough to justify a high-conviction investment call, however. One also needs a catalyst. Three potential catalysts could help propel international stocks higher over the next 12 months, while also giving value stocks and economically-sensitive equity sectors a boost: A weaker US dollar; the end of the pandemic; and a recovery in bank shares. Let’s start with the dollar. The US dollar faces a number of headwinds over the coming months. First, interest rate differentials have moved sharply against the greenback (Chart 25). Second, as a countercyclical currency, the dollar is likely to weaken as the global economy improves (Chart 26). Third, the current account deficit is rising again. It jumped over 50% from $112 billion in Q1 to $170 billion in Q2. According to the Atlanta Fed GDPNow model, the trade balance is set to widened further in Q3. This deterioration in the dollar’s fundamentals is occurring against a backdrop where the currency remains 11% overvalued based on purchasing power parity exchange rates (Chart 27). Chart 25Interest Rate Differentials Have Moved Sharply Against The Greenback
Interest Rate Differentials Have Moved Sharply Against The Greenback
Interest Rate Differentials Have Moved Sharply Against The Greenback
A weaker dollar is usually good for commodity prices and cyclical stocks (Chart 28). In general, commodity producers and cyclical stocks are overrepresented outside the US. Chart 26The Dollar Is Likely To Weaken As The Global Economy Improves
The Dollar Is Likely To Weaken As The Global Economy Improves
The Dollar Is Likely To Weaken As The Global Economy Improves
Chart 27USD Remains Overvalued
Fourth Quarter 2020 Strategy Outlook: A Post-Pandemic Regime Shift
Fourth Quarter 2020 Strategy Outlook: A Post-Pandemic Regime Shift
Chart 28A Weaker Dollar Is Usually Good For Commodity Prices And Cyclical Stocks
A Weaker Dollar Is Usually Good For Commodity Prices And Cyclical Stocks
A Weaker Dollar Is Usually Good For Commodity Prices And Cyclical Stocks
BCA’s chief energy strategist Bob Ryan expects Brent to average $65/bbl in 2021, $21/bbl above what the market is anticipating. Ongoing Chinese stimulus should also buoy metal prices. A falling greenback helps overseas borrowers – many of whom are in emerging markets – whose loans are denominated in dollars but whose revenues are denominated in the local currency. It is thus no surprise that non-US stocks tend to outperform their US peers when global growth is strengthening and the dollar is weakening (Chart 29). Chart 29Non-US Equities Tend To Outperform Their US Peers When Global Growth Is Improving And The Dollar Is Weakening
Non-US Equities Tend To Outperform Their US Peers When Global Growth Is Improving And The Dollar Is Weakening
Non-US Equities Tend To Outperform Their US Peers When Global Growth Is Improving And The Dollar Is Weakening
The outperformance of non-US stocks in soft dollar environments is particularly pronounced when returns are measured in common-currency terms. From the perspective of US-based investors, a weaker dollar raises the dollar value of overseas sales and profits, justifying higher valuations for international stocks. From the perspective of overseas investors, a weaker dollar reduces the local currency value of US sales and profits, implying a lower valuation for US stocks. This helps explain why European stocks tend to outperform their US counterparts when the euro is rising, even though a stronger euro hurts the European economy. It’s Value’s Turn To Shine Value stocks have often outperformed growth stocks when the US dollar has been weakening and global growth strengthening. Recall that value stocks did poorly during the late 1990s, a period of dollar strength and economic turbulence throughout the EM world. In contrast, value stocks did well between 2001 and 2007, a period during which the dollar was generally on the back foot. The relationship between value stocks, the dollar, and global growth broke down this summer. Growth stocks continued to pull ahead, even though global growth turned a corner and the dollar began to weaken. There are two reasons why this happened. First, investors were too slow to price in the windfall that growth stocks in the tech and health care sectors would end up receiving from the pandemic. Second, rather than rising in response to better economic growth data, real rates fell during the summer months. A falling discount rate benefits growth stocks more than value stocks because the former generate more of their earnings farther into the future. The tentative outperformance of value stocks in September suggests that the tables may have turned for the value/growth trade. Retail sales at physical stores are rebounding, while online sales growth is coming down from highly elevated levels (Chart 30). Bank of America estimates that US e-commerce penetration doubled in just a few short months earlier this year. Some “reversion to the trend” is likely, even if that trend does favor online stores over the long haul. Chart 30Are Brick-And Mortar Retailers Coming Back To Life?
Are Brick-And Mortar Retailers Coming Back To Life?
Are Brick-And Mortar Retailers Coming Back To Life?
Chart 31The Pandemic Has Caused Global Server And PC Shipments To Surge
The Pandemic Has Caused Global Server And PC Shipments To Surge
The Pandemic Has Caused Global Server And PC Shipments To Surge
Meanwhile, PC shipments soared during the pandemic as companies and workers rushed out to buy computer gear to allow them to work from home (Chart 31). To the extent that this caused some spending to be brought forward, it could create an air pocket in tech demand over the next few quarters. A third wave of the virus in the US and ongoing second waves elsewhere could give growth stocks a boost once more, but the benefits are likely to be short-lived. If a vaccine becomes available early next year, investors will pivot from the “pandemic trade” to the “reopening trade.” The “reopening trade” will support companies such as banks, hotels, and transports that were crushed by lockdown measures and which are overrepresented in value indices. From a valuation perspective, value stocks are cheaper now compared to growth stocks than at any point in history – even cheaper than at the height of the dotcom bubble (Chart 32). Chart 32Value Stocks Are Extremely Cheap Relative To Growth Stocks
Value Stocks Are Extremely Cheap Relative To Growth Stocks
Value Stocks Are Extremely Cheap Relative To Growth Stocks
The lofty valuations that growth stocks enjoy can be justified if the mega-cap tech companies that dominate the growth indices continue to increase earnings for many years to come. However, it is far from clear that this will happen. Close to three-quarters of US households already have an Amazon Prime account. Slightly over half have a Netflix account. Nearly 70% have a Facebook account. Google commands 92% of the internet search market. Together, sites owned by Google and Facebook generate about 60% of all online advertising revenue. While all of these companies dominate their markets, this could change. At one point during the dotcom bubble, Palm’s market capitalization was over six times greater than Apple’s. The Blackberry superseded the PalmPilot; the iPhone, in turn, superseded the Blackberry. History suggests that many of today’s technological leaders will end up as laggards. Investors looking to find the next tech leader can focus on smaller, fast growing companies. Unfortunately, picking winners in this space is easier said than done. History suggests that investors tend to overpay for growth, especially among small caps. Based on data compiled by Eugene Fama and Kenneth French, small cap growth stocks have lagged small cap value stocks by an average of 6.4% per year on a market-cap weighted basis, and by 10.4% on an equal-weighted basis, since 1970 (Table 1). Table 1Small Caps Vis-A-Vis Large Caps: Comparison of Total Returns
Fourth Quarter 2020 Strategy Outlook: A Post-Pandemic Regime Shift
Fourth Quarter 2020 Strategy Outlook: A Post-Pandemic Regime Shift
Bank On Banks Financial stocks are heavily overrepresented in value indices (Table 2). Banks have made significant provisions against bad loans this year. If global growth recovers in 2021 once a vaccine becomes available, some of these provisions will end up being released, boosting profits in the process. Table 2Breaking Down Growth And Value By Sector
Fourth Quarter 2020 Strategy Outlook: A Post-Pandemic Regime Shift
Fourth Quarter 2020 Strategy Outlook: A Post-Pandemic Regime Shift
Chart 33Modestly Higher Bond Yields Will Benefit Bank Shares
Modestly Higher Bond Yields Will Benefit Bank Shares
Modestly Higher Bond Yields Will Benefit Bank Shares
A stabilization in bond yields should also help bank shares. Chart 33 shows that a fall in bank stocks vis-à-vis the overall market has closely matched the decline in bond yields. While we do not think that central banks will tighten monetary policy in the next few years, nominal bond yields should still drift modestly higher as output gaps narrow. What about the outlook for bank earnings? A massive new credit boom is not in the cards in any major economy. Nevertheless, it should be noted that global bank EPS was able to return to its long-term trend in 2019, until being slammed again this year by the pandemic (Chart 34). Global bank book value-per-share was 30% higher in 2019 compared to GFC highs (even though price-per-share was 30% lower). Chart 34Global Bank EPS Was Able To Return To Its Pre-GFC Peak In 2019 Until The Pandemic Hit
Global Bank EPS Was Able To Return To Its Pre-GFC Peak In 2019 Until The Pandemic Hit
Global Bank EPS Was Able To Return To Its Pre-GFC Peak In 2019 Until The Pandemic Hit
Chart 35European Bank Earnings Estimates Have Lagged Credit Growth
European Bank Earnings Estimates Have Lagged Credit Growth
European Bank Earnings Estimates Have Lagged Credit Growth
Admittedly, the global numbers disguise a lot of regional variation. While US banks were able to bring EPS back to its prior peak, and Canadian banks were able to easily surpass it, European bank EPS was still 70% below its pre-GFC highs in 2019. The launch of the common currency in 1999 set off a massive credit boom across much of Europe, leaving European banks dangerously overleveraged. The GFC and the subsequent European sovereign debt crisis led to a spike in bad loans, necessitating numerous rounds of dilutive capital raises. At this point, however, European bank balance sheets are in much better shape. If EPS simply returns to its 2019 levels, European banks will trade at a generous earnings yield of close to 20%. That may not be such a hurdle to cross. Chart 35 shows that European bank earnings estimates have fallen far short of what would be expected from current credit growth. If, on top of all this, European banks are able to muster some sustained earnings growth thanks to somewhat steeper yield curves and further cost-cutting and consolidation, investors who buy banks today will be rewarded with outsized returns over the long haul. Fixed Income: What Is Least Ugly? As noted above, a rebound in global growth should push up both equity prices and bond yields. As such, we would underweight fixed income within a global asset allocation framework. Within the fixed income bracket, investors should favor inflation-protected securities over nominal bonds. They should underweight government bonds in favor of a modest overweight to spread product. Spreads are quite low but could sink further if economic activity revives faster than anticipated. The upper quality tranche of high-yield corporates, which are benefiting from central bank purchases, have an especially attractive risk-reward profile. EM debt should also fare well in a weaker dollar, stronger growth environment (Chart 36). Chart 36BB-Rated And EM Debt Offer Reasonable Risk-Reward Profiles
BB-Rated And EM Debt Offer Reasonable Risk-Reward Profiles
BB-Rated And EM Debt Offer Reasonable Risk-Reward Profiles
Given that some investors have no choice but to own developed economy government bonds, which countries or regions should they buy from within this category? Chart 37 shows the 3-year trailing yield betas for several major developed bond markets. In general, the highest-yielding currencies (US and Canada) also have the highest betas, implying that their yields rise the most when global bond yields are rising and vice versa. Chart 37High-Yielding Bond Markets Are The Most Cyclical
Fourth Quarter 2020 Strategy Outlook: A Post-Pandemic Regime Shift
Fourth Quarter 2020 Strategy Outlook: A Post-Pandemic Regime Shift
In economies such as Europe and Japan where the neutral rate of interest is stuck deep below the zero bound, better economic news is unlikely to lift policy rate expectations by very much. After all, the optimal policy rate would still be above its neutral level even if better economic data brought the neutral rate from say, -4% to -3%. In contrast, when the neutral rate is close to zero or even positive, better economic data can lift medium-to-long-term interest rate expectations more meaningfully. As such, we would underweight US Treasurys and Canadian bonds, while overweighting Japanese government bonds (JGBs) over a 12-month horizon. On a currency-hedged basis, which is what most bond investors focus on, 10-year JGBs yield only 20 basis points less than US Treasurys (Table 3). This lower yield is more than offset by the risk that Treasury yields will rise more than yields on JGBs. Table 3Bond Markets Across The Developed World
Fourth Quarter 2020 Strategy Outlook: A Post-Pandemic Regime Shift
Fourth Quarter 2020 Strategy Outlook: A Post-Pandemic Regime Shift
The End Game What will end the bull market in stocks? As is often the case, the answer is tighter monetary policy. The good news is tight money is not an imminent risk. The Fed will not hike rates at least until 2023, and it will take even longer than that for interest rates to rise elsewhere in the world. The bad news is that the day of reckoning will eventually arrive and when it does, bond yields will soar and stocks will tumble. Investors who want to hedge against this risk should consider owning more real assets. As was the case during the 1970s, farmland will do well from rising inflation. Suburban real estate will also benefit from more people working from home and, if recent trends persist, rising crime in urban areas. Gold should also do well. The yellow metal has come down from its August highs, but should benefit from a weaker dollar over the coming months, and ultimately, from a more stagflationary environment later this decade. Peter Berezin Chief Global Strategist peterb@bcaresearch.com Footnotes 1 “More infectious coronavirus mutation may be 'a good thing', says disease expert,” Reuters, August 17, 2020. 2 Nina Bai, ”One More Reason to Wear a Mask: You’ll Get Less Sick From COVID-19,” University of California San Francisco, July 31, 2020. 3 Dave Roos, “How Crude Smallpox Inoculations Helped George Washington Win the War,” History.com, May 18, 2020. Global Investment Strategy View Matrix
Fourth Quarter 2020 Strategy Outlook: A Post-Pandemic Regime Shift
Fourth Quarter 2020 Strategy Outlook: A Post-Pandemic Regime Shift
Current MacroQuant Model Scores
Fourth Quarter 2020 Strategy Outlook: A Post-Pandemic Regime Shift
Fourth Quarter 2020 Strategy Outlook: A Post-Pandemic Regime Shift