Policy

Highlights Consumers are the beating heart of the US economy, … : By showering cash on the newly unemployed, and issuing checks to more than half of all taxpayers, the CARES Act arrested April’s free fall in consumption and helped households meet their financial obligations. … and if they’re waylaid by the pandemic, only a forceful fiscal response stands in the way of reduced future growth: Bankruptcies and widespread displacement of workers would turn a nasty cyclical shock into lower trend growth. How big does the next round need to be?: Applying a framework developed by our US Bond Strategy colleagues, we estimate that consumption growth will get back to trend if Congress provides $800 billion of aid to households through the first half of next year. Is it likely something that size can get through Capitol Hill?: Assistance for reeling states is a potential sticking point, but we continue to believe that a major aid package will pass. If it doesn’t, the election outcome will loom large over the 2021 outlook. Feature Over BCA’s 70-plus years, our research teams have developed hundreds if not thousands of proprietary indicators to project where financial markets and the major economies are headed. They are central to our process and we are continuously engaged in trying to improve them. Sometimes, though, it helps to take a step back and look at the landscape from the broadest and simplest perspective. When we do, we remind ourselves of what we have come to think of as macroeconomics’ fundamental lesson: My spending is your income and your spending is my income. Consumption isn't just four times as large as each of the other two main components of US GDP, it also exerts a gravitational pull on them. The truth of this simple formulation is especially easy to see in the United States, where consumption accounts for two-thirds of GDP (investment and government spending each contribute one-sixth, ignoring net exports’ modest drag). The US economy would shrivel if household spending were to fall sharply, and the second-order effects on investment and government receipts would prolong the agony. The former is a function of consumption; businesses only invest once it’s clear that demand has overtaken existing capacity or will soon do so. Reduced consumption would pressure employment and profits, squeezing federal revenues that are almost entirely composed of individual income taxes, payroll taxes and corporate income taxes (Chart 1). Transfers from the federal government account for one-third of the states’ total revenues (Chart 2); since most of them are forbidden to run budget deficits, they would face immediate cutbacks if the flows from Washington were to slow. Chart 1Consumption Exerts An Outsized Impact On Federal ...
The Fundamental Theorem Of Macroeconomics
The Fundamental Theorem Of Macroeconomics
Chart 2... And State Government Revenues
The Fundamental Theorem Of Macroeconomics
The Fundamental Theorem Of Macroeconomics
Plugging The Gap Recognizing that a wobbling consumer has the potential to topple several economic dominos, Congress undertook extraordinary measures to keep a vicious short-term shock from impairing growth into the intermediate and long term.1 The CARES Act included provisions to support ailing industries and small businesses, but its efforts at shoring up vulnerable households have been the most effective by far. Direct payments of $1,200 to every adult and $500 to every child in households earning less than $99,000 ($198,000 for married filing jointly taxpayers) and weekly $600 supplemental unemployment benefits helped push personal income well above February’s pre-pandemic level (Chart 3). Chart 3The CARES Act Gave Lower-Income Households An Enormous Boost
The Fundamental Theorem Of Macroeconomics
The Fundamental Theorem Of Macroeconomics
With income rising, especially for those at the lower end of the income distribution, households were able to stay current on their rent (Table 1), their mortgage and all their other obligations (Table 2). They were even able to pay down their credit card balances, an unusual occurrence at the start of a recession (Chart 4). Residential landlords and personal lenders breathed a sigh of relief, along with the entities that have lent to them, though they must be wondering how their obligors will fare now that the CARES Act’s supplemental unemployment benefit has expired. Households built up $325 billion of savings from March through July, which helped tide them over in August and is presumably doing so in September, but we expect that cracks may be beginning to show and that they will emerge in force in October if another round of aid is not forthcoming. Emergency CARES Act fiscal transfers were so large that they more than offset the drag from declining compensation as employees were laid off or worked less than full time during the lockdowns. Table 1September Slowdown?
The Fundamental Theorem Of Macroeconomics
The Fundamental Theorem Of Macroeconomics
Table 2Credit Performance Across Personal Loan Categories Was Solid Through July
The Fundamental Theorem Of Macroeconomics
The Fundamental Theorem Of Macroeconomics
Chart 4Strapped Households Usually Run Up Their Credit Card Balances When Recessions Hit
Strapped Households Usually Run Up Their Credit Card Balances When Recessions Hit
Strapped Households Usually Run Up Their Credit Card Balances When Recessions Hit
How Much Will It Take? Deficit spending is a charged issue, especially among those at the upper end of the income distribution who will ultimately be taxed to repay the debt to fund today’s deficits. However, we agree with the mainstream economic consensus that issuing another two or three trillion dollars of debt at negative real yields is preferable to suffering the hysteresis effects of an uncontained surge of bankruptcies. From a short-term perspective, vigorous fiscal support is the only thing that can preserve the seeming dichotomy between the real economy’s struggles and the equity and credit markets’ bliss.2 The key practical question is how big the next round needs to be to allow policymakers to extend the bridge over the gap opened by the pandemic. Our US Bond Strategy colleagues addressed that question head on last week.3 They proceeded from the assumption that a certain minimum level of consumer spending growth is necessary to meet market participants’ generally sanguine recovery expectations. They then focused on how household income (what comes in) and the savings rate (how much is held back) might evolve under pessimistic and optimistic scenarios and a base-case scenario that splits the difference between the two. Their estimates of required support from a new round of fiscal transfers are simply the difference between the spending that would occur without the transfers and the minimum required spending. Looking at the 12-month moving average of consumer spending to smooth out single-month swings, and comparing it to its year-ago level (a 12-month-over-12-month basis), we map out three nominal growth targets for the August 2020 to July 2021 period: 3%, 4% and 5%, consistent with the range that prevailed once the economy found its footing after the global financial crisis (Chart 5). Instead of performing the analysis under all three of our colleagues’ scenarios, we simply use the split-the-difference base case that has household income ex-CARES Act transfers (Chart 6, top panel) and the savings rate (Chart 6, bottom panel) returning to their pre-pandemic level by September 2021. Chart 5Outside Of Recessions, Consumer Spending Growth Typically Occupies A Tight Range
Outside Of Recessions, Consumer Spending Growth Typically Occupies A Tight Range
Outside Of Recessions, Consumer Spending Growth Typically Occupies A Tight Range
Chart 6Recovery Scenarios For Consumption's Drivers
Recovery Scenarios For Consumption's Drivers
Recovery Scenarios For Consumption's Drivers
The results are shown in Table 3. The 4% nominal rate of consumption matches the economy’s trend growth since the GFC (2-to-2.25% real plus 1.75-to-2% inflation), 3% allows for a sluggish recovery in which the virus only slowly loosens its grip and 5% covers the possibility of a burst of above-trend growth that might follow a better-than-expected virus outcome. We project that households will require an average of $70-to-94 billion of monthly income support to grow 12-month-on-12-month consumption by 3-to-5%. A repeat round of stimulus checks would chip in $23 billion, leaving supplemental unemployment insurance benefits and the extension of benefits to workers that would not otherwise be covered by their state unemployment insurance program to pick up much of the rest of the $50-to-70 billion tab. Once those programs were fully up and running in May, June and July, they distributed an average of $92 billion per month ($77 billion supplemental benefits and $15 billion expanded eligibility). Those numbers suggest that unemployment-related transfers amounting to 55-to-75% of the CARES Act transfers would suffice, which is encouraging because the Senate and the White House now view its $600 weekly supplement as too generous. The unemployment rate has fallen since the spring, however, with fewer households in line to receive payments, so lawmakers will have to devise other ways to get money into the hands of consumers. Given that states and municipalities face an acute cash crunch and Democrats have insisted on addressing it, there is a good chance that states will receive a healthy allocation and some of the state funds will eventually find their way to households. Table 3Another Round, Please
The Fundamental Theorem Of Macroeconomics
The Fundamental Theorem Of Macroeconomics
The bottom line for investors assessing the adequacy of a stimulus bill is that we think it should allocate at least $800 billion to support household income. A bill in the mid-to-high $1 trillion range that would split the difference between Republican and Democratic proposals should suffice and it would leave ample room for desperately needed support for state and local governments. Public transit systems like the gasping New York city subway, which suffered ridership declines of as much as 80-90% at the height of the lockdown while incurring significant new cleaning costs, may otherwise have to impose draconian service cutbacks that undermine their local economies’ efforts to reopen. The Fundamental Theorem Of Microeconomics At the University of Chicago’s Booth School of Business, Introductory Microeconomics is called Price Theory to keep the central lesson of the course in every student’s mind: people respond to incentives. We have come to think of this as the fundamental rule of microeconomics. It is the foundation of public policy’s attempts to shape behavior: If you want more of something, subsidize it; if you want less of something, tax it. When mulling the prospects for the passage of a significant new aid bill, we begin and end with a consideration of the key players’ incentives. The Democrats want a bill to demonstrate that government can be the solution and to push back against the anti-government narrative that has taken root over the last 40 years. The administration should be doing its utmost to obtain a robust spending package since recessions have reliably sunk incumbent presidents’ re-election prospects. Republican senators, even those who are not up for election this year, should want a bill because control of the Senate is likely to go to the party that wins the White House and individual senators’ power and influence are magnified when they are in the majority. Despite months of posturing and foot-dragging, we second our geopolitical strategists’ view that an aid package aligning with all the major players’ interests will pass soon. Investment Implications Much of our constructive take on markets and the economy proceeds from our view that another significant round of fiscal aid is forthcoming. If it is not, we would revisit our bullish 12-month asset allocation recommendations and we would close out our overweight on the SIFI banks’ stocks. An assumption that humankind will find a way to tame COVID-19 on a timetable in line with market expectations is also embedded in our 12-month equity overweight. If a second wave of infections takes hold, the mortality rate moves significantly higher and treatment and/or vaccine progress unexpectedly reverses, our recommendations will get more cautious. If it is in the interests of all of Washington's key players to pass a bill, there's an awfully good chance that bill will get passed. Although those in the know have lately become more optimistic that the first installment(s) of an effective vaccine(s) will become available in the next two quarters (Chart 7), such an outcome is not assured. A client asked us last week what would ensue if a vaccine is not available until the third or fourth quarter of 2021. As we talked through it with her, we could not escape the idea that the election could be hugely consequential for markets if the lack of a vaccine coincides with a failure to pass a stimulus package before the election, or with a stimulus package that does not extend beyond the end of March. Chart 7Rising Odds Of A Vaccine Within The Next Six Months
The Fundamental Theorem Of Macroeconomics
The Fundamental Theorem Of Macroeconomics
If the next round of stimulus is not passed before the election, or if it is set to expire two or three quarters before an effective vaccine will be available in sufficient quantities to turn the public health tide, fiscal policy would become the single most important driver of the near-term market and economic outlook, given our view that the Fed has already done nearly all it can do. Congress would then take center stage, with the White House playing a secondary role based on its veto power and the influence of the bully pulpit. In that case, we would expect equity and credit markets to fare much better under a Blue Wave outcome in which the Democrats sweep the election than they would in any outcome that leaves Republicans in control of the Senate. Think of it like this: if the economy needed fiscal aid to counter six-to-twelve more months of pandemic disruptions two years before Congress again had to face voters, would you rather appeal to Pelosi, Schumer and Biden, champing at the bit to demonstrate how government can alleviate suffering, or Mitch McConnell, itching to teach profligate cities and states a lesson? Doug Peta, CFA Chief US Investment Strategist dougp@bcaresearch.com Footnotes 1 The Fed leaped into the breach as well, but we have already discussed its efforts in detail. This report focuses on fiscal policy. 2 Please see the September 18, 2020 BCA Research Special Report, "The US Economy vs. The Stock Market: Is There A Disconnect?" available at www.bcaresearch.com. 3 Please see the September 15, 2020 US Bond Strategy Weekly Report, "More Stimulus Needed," available at usb.bcaresearch.com.
Dear Client, We will be working on our Fourth Quarter Strategy Outlook next week, which will be published on Tuesday, September 29th. We will also be hosting a webcast on Thursday, October 1st at 10:00 AM EDT (3:00 PM BST, 4:00 PM CEST, 10:00 PM HKT) where we will discuss the outlook. Best regards, Peter Berezin, Chief Global Strategist Highlights Investors should favor global equities over bonds on a 12-month horizon. However, stocks remain technically overbought in the short term and vulnerable to a further correction. Investors are not fully appreciating the degree to which fiscal policy has already tightened in the US. While we ultimately expect a deal to be reached, it may take a stock market sell-off to force Republican leaders to accede to Democratic demands for more spending. US monetary policy will stay accommodative for at least the next two years, a view that this week’s FOMC meeting further validated. Investors should pivot into cheaper areas of the stock market – in particular, deep cyclicals and financials, non-US stocks, and value stocks. Value stocks are especially appealing, as they are now trading at the biggest discount on record relative to growth stocks. The “pandemic trade” will give way to the “reopening trade.” The latter will benefit value stocks. In addition, stronger global growth, ongoing Chinese stimulus, a weaker US dollar, and modestly steeper yield curves all favor value indices. Value investors who want to accentuate their returns should pay special attention to smaller value companies outside the US. Market Commentary Chart 1Drastic Drop In Weekly Unemployment Insurance Payments
Drastic Drop In Weekly Unemployment Insurance Payments
Drastic Drop In Weekly Unemployment Insurance Payments
We continue to favor global equities over bonds on a 12-month horizon. However, stocks remain technically overbought in the short term despite correcting modestly over the past few weeks. Tech stocks rallied hard into September. Aggressive buying of out-of-the-money call options helped fuel the rally. While some big institutional players such as Softbank have reportedly scaled back their positions, many retail investors remain unfazed. The triple leveraged long Nasdaq 100 ETF, TQQQ, experienced the largest weekly inflow on record in September. In addition to being technically stretched, equities face near-term risks from the impasse in the US Congress over a new stimulus bill. Investors are not fully appreciating the degree to which fiscal policy has already tightened in the US. Chart 1 shows that weekly unemployment payments have fallen by $15 billon since the end of July, representing a drop of more than 50%. At an annualized rate, this amounts to 3.7% of GDP in fiscal tightening. On top of that, the funds in the small business Paycheck Protection Program have run out, while many state and local governments face a severe cash crunch. BCA’s geopolitical strategists expect a fiscal deal to be reached over the next few weeks. The fact that Speaker Nancy Pelosi has said that Congress will stay in session until both sides agree on an aid package is good news in that regard. Nevertheless, given all the acrimony in Washington in the run up to the November election, there is still a non-negligible chance that a deal falls through. Why, then, are we still bullish on stocks on a 12-month horizon? Partly it is because voters want more stimulus, which means that fiscal policy is likely to be loosened again, even if this does come after the election. It is also because the pandemic seems to be receding. While the number of new cases is rising again in the EU and some other regions, fatality rates remain much lower than during the first wave. Progress also continues to be made on developing a viable vaccine. According to The Good Judgment Project, about 60% of “superforecasters” expect a mass-distributed vaccine to be available by Q1 of 2021, up from 45% just four weeks ago. Only 2% expect there to be no vaccine available by April 2022, down from over 50% in May (Chart 2). Chart 2High Odds Of A Vaccine Within 6-To-12 Months
Pivot To Value
Pivot To Value
Lastly, monetary policy remains exceptionally accommodative. The Fed this week formally incorporated its new flexible average inflation targeting strategy into its post-meeting statement. The FOMC promised to keep rates at rock-bottom levels until the economy has reached “maximum employment” and inflation “is on track to moderately exceed two percent for some time.” The dot plot indicated that the vast majority of FOMC members did not expect rates to rise until at least the end of 2023. As Chart 3 shows, the global equity risk premium remains quite elevated. This favors stocks over bonds. Not all stocks are equally attractive, however. Four weeks ago, in a report titled “The Return of Nasdog,” we made the case that investors should pivot away from growth stocks towards value stocks. The report generated quite a bit of interest from readers. Below, we review and elaborate on some of the issues raised in a Q&A format. Q: Being long value stocks relative to growth stocks has been a widowmaker trade for more than a decade. Why do you think we have reached an inflection point? A: Value stocks are cheaper now compared to growth stocks than at any point in history – even cheaper than at the height of the dotcom bubble (Chart 4). Chart 3Global Equity Risk Premium Remains Quite Elevated
chart 3
Global Equity Risk Premium Remains Quite Elevated
Global Equity Risk Premium Remains Quite Elevated
Chart 4Value Stocks Are Extremely Cheap Relative To Growth Stocks
Value Stocks Are Extremely Cheap Relative To Growth Stocks
Value Stocks Are Extremely Cheap Relative To Growth Stocks
Admittedly, valuations are not a good timing tool. One needs a catalyst to unlock those valuations. Good news on the virus front may end up being such a catalyst. The “pandemic trade” benefited tech stocks, which are overrepresented in growth indices. It also favored health care stocks, which are similarly overrepresented in growth indices, at least globally (Table 1). The “reopening trade” will support companies such as banks, hotels, and transports that were crushed by lockdown measures and which are overrepresented in value indices. Table 1Breaking Down Growth And Value By Sector
Pivot To Value
Pivot To Value
Chart 5 shows that retail sales at physical stores are rebounding, while online sales growth is coming down from highly elevated levels. Bank of America estimates that US e-commerce penetration doubled in just a few short months earlier this year. Some “reversion to the trend” is likely, even if that trend does favor online stores over the long haul. Meanwhile, PC shipments soared during the pandemic as companies and workers rushed out to buy computer gear to allow them to work from home (Chart 6). To the extent that this caused some spending to be brought forward, it could create an air pocket in tech demand over the next few quarters. Chart 5Are Brick-And-Mortar Retailers Coming Back To Life?
Are Brick-And-Mortar Retailers Coming Back To Life?
Are Brick-And-Mortar Retailers Coming Back To Life?
Chart 6The Pandemic Has Caused Global Server And PC Shipments To Surge
The Pandemic Has Caused Global Server And PC Shipments To Surge
The Pandemic Has Caused Global Server And PC Shipments To Surge
Q: How are investors positioned towards value versus growth? A: According to the September BofA Global Fund Manager Survey, tech and pharma were the two sectors with the largest reported overweights. Thus, there is significant scope for money to shift out of these sectors. Q: What about the overall macro environment underpinning growth and value? A: While the relationship is far from perfect, value stocks tend to outperform growth stocks when the US dollar is weakening (Chart 7). Recall that growth stocks did very well during the late 1990s, a period of dollar strength. In contrast, value stocks outperformed between 2001 and 2007, a period during which the dollar was generally on the back foot. As we have spelled out in past reports, we expect the dollar to weaken over the next 12 months, which should benefit value stocks. Value stocks also tend to do best when global growth is accelerating (Chart 8). Provided that governments maintain adequate levels of fiscal support and a vaccine becomes available by early next year, global GDP should bounce back swiftly. Chart 7Value Stocks Tend To Outperform Growth Stocks When The US Dollar Is Weakening
Value Stocks Tend To Outperform Growth Stocks When The US Dollar Is Weakening
Value Stocks Tend To Outperform Growth Stocks When The US Dollar Is Weakening
Chart 8Value Stocks Also Tend To Do Best When Global Growth Is Accelerating
Value Stocks Also Tend To Do Best When Global Growth Is Accelerating
Value Stocks Also Tend To Do Best When Global Growth Is Accelerating
Q: Won’t lower real bond yields favor growth stocks? A: By definition, growth companies generate more of their earnings further in the future than value companies. As such, a decline in real yields will tend to increase the present value of cash flows more for growth companies than for value companies. We do not expect real yields to rise significantly over the next two years. However, given that real yields are already deeply negative in almost all countries, they probably will not fall either. Q: You seem to be making the cyclical case for the outperformance of value stocks. But what about the secular case? It appears to me that the stronger earnings growth displayed by growth stocks will ultimately translate into higher long-term returns. A: Historically, that has not been the case. As Chart 9 and Table 2 illustrate, value stocks have outperformed growth stocks by a wide margin over the past century. In particular, small cap value has clobbered small cap growth. Chart 9Value Stocks Have Outperformed Growth Stocks By A Wide Margin Over The Past Century
Pivot To Value
Pivot To Value
Table 2Small Caps Vis-A-Vis Large Caps: Comparison of Total Returns
Pivot To Value
Pivot To Value
How did value stocks manage to triumph over growth stocks if, as you say, growth stocks usually experience faster earnings growth? The answer has to do with what is priced in and what is not. If everyone expects a company’s earnings to grow next year, this will already be reflected in its share price. It is only unanticipated earnings growth that should move share prices. For the most part, both analysts and investors have tended to overextrapolate near-term earnings growth. As we discussed in a special report titled “Quant-Based Approaches To Stock Selection And Market Timing,” while analysts are generally able to predict which companies will display superior earnings growth over the next one-to-two years, they systemically overestimate earnings growth on longer-term horizons (Chart 10). As a result, investors tend to overpay for growth, causing growth stocks to lag value stocks. Chart 10A Mug’s Game
Pivot To Value
Pivot To Value
Q: That may have been true historically, but it seems that more recently, investors have been guilty of underpaying for growth. A: Yes and no. If one looks at the period between 2007 and 2017, the superior performance of growth stocks was broadly matched by their superior earnings growth. As a result, relative P/E ratios did not change much. Since 2017, however, the P/E ratio for growth indices has soared relative to value indices (Chart 11). Chart 11AThe Outperformance Of Growth Stocks Over The Past Three Years Has Been Turbocharged By A Rapid P/E Multiple Expansion
The Outperformance Of Growth Stocks Over The Past Three Years Has Been Turbocharged By A Rapid P/E Multiple Expansion
The Outperformance Of Growth Stocks Over The Past Three Years Has Been Turbocharged By A Rapid P/E Multiple Expansion
Chart 11BThe Outperformance Of Growth Stocks Over The Past Three Years Has Been Turbocharged By A Rapid P/E Multiple Expansion
The Outperformance Of Growth Stocks Over The Past Three Years Has Been Turbocharged By A Rapid P/E Multiple Expansion
The Outperformance Of Growth Stocks Over The Past Three Years Has Been Turbocharged By A Rapid P/E Multiple Expansion
Q: What has happened since 2017 that has caused growth stocks to become so much more expensive? A: FANG, FAANG, FANGMAN, whatever acronym you want to use, it was mainly a story about investors becoming infatuated with mega cap tech stocks. After seeing these companies beat earnings estimates quarter after quarter, investors decided that they deserve to trade at much higher valuation multiples. Q: What about other tech companies? A: For the most part, they were left in the dust. Our proprietary Equity Analyzer system allows us to sort companies based on all types of fundamental and technical factors. Chart 12 shows that “value tech” companies trading in the bottom quartile of price-to-earnings, price-to-operating cash flow, price-to-free cash flow, price-to-book, and price-to-sales have gotten completely clobbered by “growth tech” companies trading in the top quartile of these valuation metrics. Chart 12Value Tech Versus Growth Tech
Pivot To Value
Pivot To Value
Interestingly, the opposite pattern was true among financials: “Value financials” – financials that trade cheaply based on the valuation measures listed above – have outperformed “growth financials.” The net result is a bit surprising: Since “value tech” underperformed the average tech stock, while “value financials” outperformed the average financial stock, the average “value tech” stock has delivered a return over the past decade that was almost identical to the average “value financial” stock. Chart 13There Was No Money To Be Made By Shifting Value Exposure From Financials To Tech In Recent Years
There Was No Money To Be Made By Shifting Value Exposure From Financials To Tech In Recent Years
There Was No Money To Be Made By Shifting Value Exposure From Financials To Tech In Recent Years
Q: This seems to suggest that value managers would not have made any money by shifting exposure from financials to tech? A: Correct. Consider the iShares MSCI USA Value Factor ETF (ticker: VLUE). It is structured to have the same sector weights as the overall US market. It currently has 27% of its assets in technology and 10% in financials. Compare that to the Vanguard Value Index Fund ETF Shares (ticker: VTV). It has 10% of its assets in technology and 19% in financials. As Chart 13shows, VTV has actually outperformed VLUE over the past five years. Year to date, VTV is down 10%, while VLUE is down 15%. Q: While value managers would not have made money by shifting capital from financials to tech, I presume the same thing could not be said for growth managers. A: You can say that again. “Growth tech” outperformed the average tech stock, while “growth financials” underperformed the average financial stock. Thus, shifting money from “growth financials” to “growth tech” would have supercharged returns. Q: This still leaves open the question of why mega cap stocks were able to grow earnings so rapidly? A: Two explanations come to mind. First, tech companies often gain from so-called network effects: The more people there are who use a particular tech platform, the more attractive it is for others to use it. Second, tech companies benefit from scale economies. Once a piece of software has been written, creating additional copies costs nothing. Even in the hardware realm, the marginal cost of producing an additional chip is tiny compared to the fixed cost of designing it. All of this creates a winner-take-all environment where success begets further success. Q: It seems this process could go on indefinitely? A: Not indefinitely. No company can control more than 100% of its market. There is also a limit to how big the overall market can get. Close to three-quarters of US households already have an Amazon Prime account. Slightly over half have a Netflix account. Nearly 70% have a Facebook account. Google commands 92% of the internet search market. Together, sites owned by Google and Facebook generate about 60% of all online advertising revenue. Q: These companies have plenty of cash. Can’t they try to enter new types of businesses if they want to keep growing? A: They can try, but there is no guarantee they will succeed. Kodak was one of the pioneers in digital photography. However, it could never really reinvent itself and ended up fading into oblivion. Moreover, while first-mover advantage is a powerful force, it is not invincible. At one point during the dotcom bubble, Palm’s market capitalization was over six times greater than Apple’s. The Blackberry superseded the PalmPilot; the iPhone, in turn, superseded the Blackberry. History suggests that many of today’s technological leaders will end up as laggards. Q: And I suppose government policy could also turn less friendly towards tech? A: That is a definite risk. Republicans have been cheap dates for tech companies. Republican politicians have showered tech companies with tax cuts and allowed them to exploit a variety of loopholes in the tax code. They also kept tech regulation to a minimum. All this happened despite the fact that many tech leaders have publicly panned conservative viewpoints, while tech company employees have rewarded Democratic politicians with the lion’s share of campaign donations (Chart 14). Chart 14Tech Company Employees Donate Heavily Towards Democrats
Pivot To Value
Pivot To Value
Going forward, Republicans are likely to sour on big tech. According to a recent Pew Research study, more than half of conservative Republicans favor increasing government regulation of tech companies (Chart 15). Tucker Carlson, a leading indicator for where the Republican party is heading, has frequently lambasted tech companies on his highly popular television show. Chart 15Conservatives Favor Increased Government Regulation Of Big Tech Companies
Pivot To Value
Pivot To Value
For their part, the Democrats are moving to the left. Alexandria Ocasio-Cortez, a leading indicator for the Democratic party, has voiced her support for Senator Elizabeth Warren’s calls to break up big tech. She has also accused Amazon of paying starvation wages, adding that "If Jeff Bezos wants to be a good person, he'd turn Amazon into a worker cooperative." Q: The political climate for tech companies may be souring. But couldn’t one say the same thing about banks and energy companies, which are overrepresented in value indices? A: One difference is that tech companies trade at premium valuations, while banks and energy companies trade near book value (Chart 16). Another difference is that banks have already felt the wrath of regulators. Thanks to Dodd-Frank and pending Basel III regulations, banks today function more like utilities than like the casinos of yesteryear. While private credit growth is unlikely to return to its pre-GFC pace, banks will still profit from a revival in global growth and increasing consolidation within their industry. Stronger global growth should also allow for modestly higher nominal bond yields and somewhat steeper yield curves. This will benefit bank shares (Chart 17). Chart 16Tech Firms Trade At Premium Valuations
Tech Firms Trade At Premium Valuations
Tech Firms Trade At Premium Valuations
Chart 17Modestly Higher Bond Yields Will Benefit Bank Shares
Modestly Higher Bond Yields Will Benefit Bank Shares
Modestly Higher Bond Yields Will Benefit Bank Shares
As far as energy stocks are concerned, again, we need to benchmark our views to what the market expects. Oil is not going back above $100 per barrel anytime soon, but it does not need to for energy stocks to go up. Bob Ryan, BCA’s chief commodity strategist, sees Brent averaging $65/bbl in 2021, $19 above what is currently priced in forward markets. Q: What about materials and industrial stocks? They are also overrepresented in value indices. A: Both materials and industrials tend to outperform the broader market when global growth accelerates (Chart 18). To the extent we expect global growth to rise, this is good news for these two sectors. They also trade at attractive valuations. Q: How does China figure into this value/growth debate? A: As we saw during the 2001-2007 period, strong Chinese demand for commodities and industrial goods benefits value indices. Even though trend Chinese GDP growth has decelerated over the past decade, the Chinese economy is five-times as large as it was back then. In absolute terms, Chinese consumption of most metals continues to increase (Chart 19). Chart 18Materials And Industrials Usually Outperform When Growth Accelerates
Materials And Industrials Usually Outperform When Growth Accelerates
Materials And Industrials Usually Outperform When Growth Accelerates
Chart 19Chinese Consumption Of Most Metals Continues To Rise
Chinese Consumption Of Most Metals Continues To Rise
Chinese Consumption Of Most Metals Continues To Rise
Chart 20 shows that Chinese GDP would need to grow by about 6% per year over the next decade to keep output-per-worker on track to converge with, say, South Korea by the middle of the century. Thus, Chinese demand for natural resources and machinery is unlikely to weaken anytime soon. Chart 20China Still Has Some Catching Up To Do
China Still Has Some Catching Up To Do
China Still Has Some Catching Up To Do
Q: Let’s wrap up. What final tips would you give investors who want to pivot towards value? A: There are a number of ETFs that track value indices. We expect them to outperform the broad indices over the coming years. For investors who want even higher returns, a selective approach would help. Distinguishing between value stocks and value traps is not easy. True value stocks have often congregated in the shadows of the market, where there is limited analyst coverage and thin institutional ownership. The small-cap sector offers more opportunities for finding such mispriced stocks. Hence, it is not surprising that historically, the value premium has been greater in the small cap realm. The same is true for emerging markets and smaller developed economies (Chart 21).1 Thus, investors who want to accentuate their returns should pay special attention to smaller value companies outside the US. Chart 21AHistorically, The Value Premium Has Been Greater In The Small Cap Realm In Emerging Markets And Smaller Developed Economies
Pivot To Value
Pivot To Value
Chart 21BHistorically, The Value Premium Has Been Greater In The Small Cap Realm In Emerging Markets And Smaller Developed Economies
Pivot To Value
Pivot To Value
Peter Berezin Chief Global Strategist peterb@bcaresearch.com Footnotes 1 Please see Global Asset Allocation Special Report, “Value? Growth? It Really Depends!” dated September 19, 2019. Global Investment Strategy View Matrix
Pivot To Value
Pivot To Value
Current MacroQuant Model Scores
Pivot To Value
Pivot To Value
While the Federal Reserve did not adjust policy on Wednesday, Fed Chair Powell set out to clarify the parameters surrounding policy tightening under the new average inflation framework announced at the Jackson Hole symposium. The Fed has chosen a…
The Bank of England met yesterday and left policy unchanged. However, the meeting’s minutes revealed that the MPC is actively exploring the implementation of a negative Bank rate. So serious is the idea, the BoE is in talks with Prudential Regulation…
This report contains an error in the section related to consumer spending and fiscal policy. That error somewhat changes the conclusions from the report, and it particularly impacts Chart 3, Table 2 and Table 3. The attached note explains the mistake and includes corrected versions of Chart 3, Table 2 and Table 3. Highlights Duration: A re-rating of Tech stock valuations is likely not a near-term catalyst for significantly lower bond yields. Congress’ continued failure to pass a follow-up to the CARES act is a greater near-term risk for bond bears. We continue to recommend an “at benchmark” portfolio duration stance alongside duration-neutral yield curve steepeners. Fiscal Policy: Without additional household income support from Congress, at least on the order of $500 - $800 billion, consumer spending will massively disappoint expectations during the next 6-12 months. Inflation: Inflation will continue its rapid ascent between now and the end of the year, but it is likely to level-off in 2021. We recommend staying long TIPS versus nominal Treasuries for the time being, but we will be looking to take profits on that position later this year. Feature Bond Implications Of A Tech Stock Sell-Off Risk-off sentiment reigned in equity and credit markets during the past two weeks. The S&P 500 fell 7% between September 2nd and 8th and the average junk spread widened from 471 bps to 499 bps. This represents the largest sell-off since June when the equity market saw a similar 7% decline and the junk spread widened from 536 bps to 620 bps (Chart 1). Chart 1Two Equity Sell-Offs, Two Different Bond Market Reactions
Two Equity Sell-Offs, Two Different Bond Market Reactions
Two Equity Sell-Offs, Two Different Bond Market Reactions
A comparison between the September and June episodes is particularly interesting for bond investors because Treasuries behaved very differently in each case. In June, bonds benefited from a flight to quality out of equities and the 10-year Treasury yield fell 22 bps. But this month, Treasuries actually delivered negative returns and the 10-year Treasury yield rose 3 bps (Chart 1, bottom panel). Table 1Selected Asset Class Performance During Last Two Equity Sell-Offs
More Stimulus Needed
More Stimulus Needed
Why would Treasuries perform so well in June but fail in their role as a diversifier of equity risk in September? The answer lies in the underlying drivers of the stock market’s decline, which are easily identified when we look at the performance of different equity sectors. Table 1 shows the performance of different equity sectors in both the June and September sell-offs. In June, it was the cyclical equity sectors – Industrials, Energy and Materials – that led the decline. These sectors tend to be the most sensitive to global economic growth. This month’s equity drawdown was led by Tech stocks, while cyclical and defensive sectors saw much smaller drops. Table 1 also shows that a broad measure of commodity prices – the CRB Raw Industrials index – rose by 0.79% during the September equity sell-off, significantly outpacing gains in the gold price. In June, the CRB index still rose but it lagged gold by a wide margin. The underlying drivers of the stock market’s decline explain why Treasuries performed well in June and underperformed in September. We bring up the performance of different equity sectors, commodity prices and gold because bond yields correlate most strongly with: The performance of cyclical equities over defensive equities (Chart 2, top panel). The ratio of CRB Raw Industrials over gold (Chart 2, bottom panel). Chart 2High-Frequency Bond Indicators
High-Frequency Bond Indicators
High-Frequency Bond Indicators
These correlations explain why bond yields fell a lot in June but not in September. June’s equity sell-off was more like a traditional risk-off event that saw investors questioning the sustainability of the global economic recovery. The cyclical equity sectors that are most exposed to the global economic cycle experienced the worst losses and demand for safe-haven gold far outpaced the demand for growth-sensitive industrial commodities. In contrast, this month’s sell-off was driven by a re-rating of Tech stock valuations, not so much expectations for a negative economic shock. Technology now makes up such a large portion of the equity index’s market cap that this sort of move can cause the entire stock market to fall, but the pass-through to bonds will be much smaller for any equity sell-off that isn’t prompted by a negative economic shock and led by cyclical equity sectors. Implications For Bond Investors Even after this month’s drop, there remains a legitimate concern about extreme Tech stock valuations. The fact that many of the larger Tech names, like Microsoft and Apple, have benefited from the pandemic only makes it more likely that their stock prices will suffer as the world slowly returns to normal. From a bond investor’s perspective, we doubt that even a large drop in Tech stock prices would lead to significantly lower bond yields, especially if that drop occurs in the context of an economy that continues to recover. Bond yields will only turn down if the market starts to question the sustainability of the economic recovery, an event that would be negative for cyclical equity sectors but much less so for the big Tech names. With that in mind, our base case outlook calls for continued economic recovery during the next 6-12 months, but we do see a significant risk that the failure to pass a follow-up to the CARES act will lead to just such a deflationary shock during the next couple of months. We therefore recommend keeping portfolio duration close to benchmark, while positioning for continued economic recovery via less risky duration-neutral yield curve steepeners. The Outlook For Consumer Spending And The Necessity Of Fiscal Stimulus After plunging during the lock-down months of March and April, consumer spending has rebounded strongly during the past few months. But can this strong rebound continue? Our view is that it cannot. That is, unless Congress delivers more income support to households. Even a large drop in Tech stock prices is unlikely to lead to significantly lower bond yields, especially if that drop occurs in the context of an economy that continues to recover. In this section we consider several different economic scenarios and estimate the amount of further income support that is necessary to sustain an adequate level of consumer spending. First off, to make forecasts for consumer spending we need to consider two main parameters: household income and the personal savings rate (Chart 3). More income leads to more spending in most cases. The only exception would be if cautious households decide to increase the amount they save relative to the amount they spend. Chart 3Consumer Spending Driven By Income & The Savings Rate
Consumer Spending Driven By Income & The Savings Rate
Consumer Spending Driven By Income & The Savings Rate
We’ve actually seen that exception play out somewhat during the past five months. The CARES act provided households with an income windfall, but the savings rate also shot higher. This suggests that households had enough income to spend even more during the past few months but have been much more cautious than usual. We cannot overstate the role the CARES act has played in supporting household incomes since March. Disposable income has grown 7.4% during the past five months compared to the five months prior to COVID, and the CARES act’s provisions pressured income 10.3% higher during that period (Chart 4). The CARES act’s one-time $1200 stimulus checks and expanded $600 weekly unemployment benefits were the two most important provisions in this regard. Together, they pushed disposable income higher by 7.5%. Chart 4Disposable Personal Income Growth And Its Drivers
More Stimulus Needed
More Stimulus Needed
This presents an obvious problem. The income support from the CARES act is now expired and Congress has yet to pass a follow-up stimulus bill. How vital is it that we get a new bill? And how large does it need to be? To answer these questions, we first need to set a target for adequate consumer spending growth. The second panel of Chart 3 shows 12-month over 12-month consumer spending growth. That is, it looks at total consumer spending during the last 12 months and shows how much it has increased (or decreased) compared to the previous 12 months. Notice that the worst 12-month period during the 2008 Great Financial Crisis (GFC) saw 12-month over 12-month consumer spending growth of -3%. During the economic recovery that followed, consumer spending growth fluctuated between +2% and +6%. Exercise 1: The March 2020 To February 2021 Period Chart 5Three Scenarios For Income And Savings
Three Scenarios For Income And Savings
Three Scenarios For Income And Savings
In our first exercise, we consider the 12-month period starting at the very beginning of the COVID recession in March 2020 and ending in February 2021. As a bare minimum, we target consumer spending growth of -3% for this 12-month period on the presumption that 12-month spending growth equal to the worst 12 months seen during the GFC is the bare minimum that markets might tolerate. We also consider somewhat rosier scenarios of 0% and 2% spending growth. In addition to consumer spending targets, we also make assumptions for household income and the savings rate. We consider income coming from all sources including automatic government stabilizers, but without assuming any additional fiscal support from the government. We consider three scenarios (Chart 5): A pessimistic scenario where both income and the savings rate hold steady at current levels. An optimistic scenario where both income and the savings rate return to pre-COVID levels by February 2021. A “split the difference” scenario where both income and the savings rate get halfway back to pre-COVID levels by next February. Table 2 shows how much additional income support from the government is needed between now and February to achieve each of our consumer spending growth targets in each of our three scenarios. For example, in the optimistic scenario the government will need to provide $434 billion of additional income support between now and February for consumer spending to hit our minimum -3% threshold. In the more realistic “split the difference” scenario, households will require another $777 billion of stimulus. Table 2 also shows that stimulus on a monthly basis and compares the monthly rate of stimulus to the rate provided by the CARES act. For example, an additional $777 billion of income doled out between August and February works out to $111 billion per month, 61% of the amount of monthly stimulus provided by the CARES act between April and July. Table 2Without More Stimulus COVID's Impact On Consumer Spending Will Be Worse Than The GFC
More Stimulus Needed
More Stimulus Needed
Two main conclusions jump out from this analysis. The first is that more income support from Congress is absolutely required. Otherwise, consumer spending will come in worse during the March 2020 to February 2021 period than it did during the worst 12 months of the GFC. Second, unless we assume a truly dire economic scenario, the follow-up stimulus does not need to be as large as the CARES act. In our most realistic “split the difference” scenario, that $777 billion of required stimulus is only 61% of what the CARES act doled out on a monthly basis. In that same scenario, a follow-up bill that delivered the same monthly stimulus as the CARES act would lead to positive 12-month consumer spending growth. Exercise 2: The August 2020 To July 2021 Period Chart 6One More Scenario
One More Scenario
One More Scenario
One potential problem with our last exercise is that our target was for total consumer spending between March 2020 and February 2021. This period includes five months for which we already have data and the exercise is therefore partially backward-looking. A more relevant analysis might target consumer spending on a purely forward-looking basis from August 2020 to July 2021. We therefore perform our calculations again for the August 2020 to July 2021 period. This time, we consider only one economic scenario where income and the savings rate both return to pre-COVID levels by July 2021 (Chart 6). This scenario works out to be slightly more optimistic than the “split the difference” scenario we considered earlier. Also, since our target 12-month spending growth period no longer contains the downtrodden months of March and April, we require a more ambitious target than -3% growth. A return to the post-GFC range of 2% to 6% represents a target that is likely more representative of market expectations. Table 3 shows the results of this second analysis. Once again, we see that some additional government stimulus is necessary to meet our spending targets. Even to achieve 0% spending growth over the next 12 months will require another $249 billion from the government, and that outcome would almost certainly disappoint markets. We calculate that an additional $534 billion is required to achieve 2% spending growth during the August 2020 to July 2021 timeframe. This result is consistent with the $777 billion we calculated in Table 2, though it has come down a bit because we have made slightly more optimistic economic assumptions. Table 3At Least Half A Trillion More Government Income Support Is Needed
More Stimulus Needed
More Stimulus Needed
Bottom Line: Our analysis suggests that further stimulus is needed to sustain the recovery in consumer spending. A new stimulus package doesn’t need to be as large as the CARES act on a monthly basis, but it should provide at least $500 - $800 billion of additional income support to households. With Congress still dithering on this issue, financial markets appear overly complacent in the near-term. While the economic constraints suggest that a deal should be reached soon, policymakers may need to see a spate of negative economic data and/or poor market performance before being spurred into action. In acknowledgement of this significant near-term risk to the economic outlook, bond investors should refrain from getting too bearish, and keep portfolio duration close to benchmark for the time being. Inflation’s Snapback Phase Chart 7Inflation Coming In Hot
Inflation Coming In Hot
Inflation Coming In Hot
The core Consumer Price Index rose 0.4% in August, the third large monthly increase in a row (Chart 7). We see inflation continuing to come in hot between now and the end of the year, before tapering off in 2021. As of now, we would describe inflation as being in a snapback phase. That is, back in March and April, when lock-down measures were widespread across the country, the sectors that were most affected by the shutdowns experienced massive price declines. However, notice that core inflation fell by much more than median or trimmed mean inflation during this period (Chart 7, panels 2 & 3). The median sector’s price didn’t fall that much, but the overall inflation number moved down because of deeply negative prints in a few sectors. Now that the economy is re-opening, many of the sectors that were most beaten down in March and April are coming back to life. As a result, those massive price declines are turning into massive price increases. Once again, the median and trimmed mean inflation figures have been much more stable. This “snapback” dynamic is illustrated very clearly in Chart 8 which shows the distribution of monthly price changes for 41 different sectors in April and in August. Notice that while the middle of the distribution hasn’t changed that much, April’s massive left tail has morphed into August’s massive right tail. Chart 8Distribution Of CPI Expenditure Categories
More Stimulus Needed
More Stimulus Needed
The continued wide divergence between core inflation and the median and trimmed mean measures suggests that this snapback phase has further to run. In other words, we will likely continue to see strong inflation prints for a few more months as the sectors that were most downbeat in March and April continue their rebounds. However, once core catches back up to the median and trimmed mean inflation measures, this snapback phase will come to an end and inflation’s uptrend will probably level-off. The continued wide divergence between core inflation and the median and trimmed mean measures suggests that this inflation’s snapback phase has further to run. We recommend that bond investors continue to favor TIPS over nominal Treasuries during this snapback phase, but we will be looking for an opportunity to go underweight TIPS versus nominal Treasuries later this year, once core inflation moves closer to the median and trimmed mean measures and the snapback phase ends. Appendix A: Buy What The Fed Is Buying The Fed rolled out a number of aggressive lending facilities on March 23. These facilities focused on different specific sectors of the US bond market. The fact that the Fed has decided to support some parts of the market and not others has caused some traditional bond market correlations to break down. It has also led us to adopt of a strategy of “Buy What The Fed Is Buying”. That is, we favor those sectors that offer attractive spreads and that benefit from Fed support. The below Table tracks the performance of different bond sectors since the March 23 announcement. We will use this to monitor bond market correlations and evaluate our strategy’s success. Table 4Performance Since March 23 Announcement Of Emergency Fed Facilities
More Stimulus Needed
More Stimulus Needed
Ryan Swift US Bond Strategist rswift@bcaresearch.com Fixed Income Sector Performance Recommended Portfolio Specification
Although the Republican skinny bill failed last week, BCA Research's Geopolitical Strategy service believes that additional stimulus would ultimately pass. The key constraints are the following: House Democrats face an election and want to deliver…
Feature Investors are increasingly concerned that the US presidential election this year will fail to produce a legitimate result, leading to an escalation in political instability and uncertainty. In this report we hold a Q&A session that we hope will serve as your concise and definitive guide to a contested US election – by which we mean an election that is not decided by the popular vote or Electoral College but requires the intervention of the US Congress or Supreme Court to determine the final outcome. As always, this report draws on the best academic work on the subject, but is not limited to academic conclusions. We apply our geopolitical method and macroeconomic perspective to determine the likeliest scenarios and financial market impacts. The takeaway? Most likely the election result will be decisive, as incumbent presidents tend to lose amid recessions. However, with President Trump staging a comeback, a contested election is possible and investors would be wise to prepare for volatility over the next two-to-four months at minimum. Chart 1Trump At Disadvantage In Popular Opinion
The Definitive Guide To Contested US Elections
The Definitive Guide To Contested US Elections
A good rule of thumb: Trump is at a disadvantage in raw popular opinion (Chart 1), so anything that directs the election decision away from the popular vote and toward constitutional procedures should be seen as a lifeline for Trump, and hence a recipe for a bigger trade war and prolonged US equity outperformance. How Is The US President Elected? The US elects presidents by means of electors, private citizens appointed by each of the 50 states to vote on their population’s behalf, i.e. the Electoral College. The popular vote, or canvass, has been the prevailing method of choosing each state’s electors since the 1840s. The vote is held and tallied by the election authorities of the states on the first Tuesday after the first Monday of November (e.g. November 3, 2020). Each state has different laws on how to hold elections and appoint a slate of electors loyal to the winning candidate in the state. The constitution grants state legislatures the power to appoint the electors. This could become a source of controversy in a contested election.1 Generally the state’s secretary of state approves the popular tally which then determines which slate of electors is appointed. The state governor certifies the names of the electors and the numbers of votes received, signs the letter and applies the state seal, and then sends multiple copies to various authorities for surety.2 If disputes arise over a state’s election results, the state will ideally resolve them by December 8 (Table 1), six days before the electors meet to fill out their ballots for the president and vice-president. Electors meet in the state capital on the first Monday after the second Wednesday of December (e.g. Monday, December 14, 2020) and cast their vote. They send certificates of their vote to the President of the United States Senate in Washington, DC, who is also the nation’s vice president, currently Mike Pence. Table 1Calendar Of US Election 2020
The Definitive Guide To Contested US Elections
The Definitive Guide To Contested US Elections
On January 6 of the New Year (2021), the President of the Senate presides over a special joint session of the new Congress, which itself convenes on January 3. He presents the states’ electoral votes to Congress alphabetically. The votes are counted, with Congress employing official tellers to record the sums.3 If any disputes are raised against any state’s electoral votes, the two houses of Congress must agree in order to disqualify those votes. If the two houses disagree, the votes will be counted. The Senate President, as the constitutional keeper of the electoral returns and presiding officer of the joint session, has some influence, which is another potential source of controversy. When the count is done, the tellers hand their results to the Senate President, who reads them off. Usually the leading candidate captures an absolute majority of the Electoral College (270/538 votes), so the next president is crystal clear and the whole ceremony is finished in half an hour. Alas, not always. What Electoral Results Can Be Ruled Out In 2020? Before getting into contested elections, it is important to address what is highly unlikely to occur in 2020. First, President Trump will not win the popular vote. Chart 2Trump Highly Unlikely To Win Popular Vote
The Definitive Guide To Contested US Elections
The Definitive Guide To Contested US Elections
Trump won 46% of the popular vote in 2016, trailing Hillary Clinton by 2.9 million votes. Since 2017, Trump’s national approval rating has never risen above 50% in the average of polls. His disapproval rating is almost always higher than his approval (Chart 2). Thus if Trump wins the election it will be through his Electoral College strategy, as in 2016 – or through a contested election. The US has split the popular and Electoral College vote on five occasions, yielding a historical probability of 9%. The fifth time was President Trump’s victory in 2016; he would be the first president to do so twice. This is possible because the regional and demographic factors behind Trump’s win four years ago are still largely intact. Currently our quantitative election model gives Trump a 45% chance of winning the election (Chart 3). This is in line with the consensus view, as online betting markets put Trump’s odds at 43%. However, online gamblers put the odds of the next president losing the popular vote in a range of 27%-31%, which implies that his odds are lower given his low popularity (Chart 4). Chart 3Our Quant Election Model Gives Trump 45% Chance Of Victory
The Definitive Guide To Contested US Elections
The Definitive Guide To Contested US Elections
Chart 4Trump Odds Weighed Down By Low Chance Of Popular Win
The Definitive Guide To Contested US Elections
The Definitive Guide To Contested US Elections
Subjectively, we are sticking with our 35% chance of Trump winning, which falls in the middle of this range. What is clear is that Trump has a much greater chance than the historical 9% probability of winning without the popular vote. There is nothing illegitimate about an Electoral College victory – far from it, it is the constitutional way in which the presidency is won. Nevertheless a victory without a popular mandate deprives the new administration of political capital. A second-term Trump is likely to be stymied at home and more inclined to act unilaterally abroad, a downside risk to global equity markets. Second, Republicans will not reclaim a majority of the House of Representatives. Chart 5Republicans Highly Unlikely To Win House Of Representatives
The Definitive Guide To Contested US Elections
The Definitive Guide To Contested US Elections
To do so, the GOP would have to retain all Republican-leaning seats (yielding 186) plus all “toss up” seats (totaling 214) and then four additional Democratic-leaning seats. Yet there are only two Democratic-leaning seats that do not benefit from the incumbent advantage (Chart 5).4 The re-election rate in the House and Senate is around 85-95%. Neither the state of the economy nor Trump’s approval rating suggest that Republicans are capable of such a big victory in the House (Chart 6). Chart 6Trump An Albatross For House Republicans
The Definitive Guide To Contested US Elections
The Definitive Guide To Contested US Elections
Third, Democrats are unlikely to win a majority of the state delegations in the House of Representatives. Currently, Republicans have a majority on 26 of the 50 delegations of lawmakers that the states send to the US House of Representatives. Democrats control 23 state delegations, while Pennsylvania is neutral. If the presidential election is close, then the balance of power among the state delegations will most likely stay the same. Republicans are likely to retain 25 state delegations, whereas Democrats would have to win all five toss-up delegations plus Florida merely to tie the Republicans with 25 delegations (Table 2). This is a tall order. Table 2Democrats Unlikely To Win Majority Of State Delegations In House Of Representatives
The Definitive Guide To Contested US Elections
The Definitive Guide To Contested US Elections
The Republicans’ state-by-state House majority would prove critical in a contested election, as we will see. Otherwise it doesn’t matter much. What Is A Contested Election? Chart 7Extreme Political Polarization Means Election Disputes Will Rage
The Definitive Guide To Contested US Elections
The Definitive Guide To Contested US Elections
The 2020 election will inevitably see legal challenges, vote recounts, and procedural problems. Partisanship is at extreme levels, meaning that the two parties will do anything to win (Chart 7). The unprecedented large-scale adoption of mail-in voting due to the COVID-19 pandemic also ensures that recounts and legal disputes will abound.5 Neither candidate is likely to concede defeat quickly or easily. While President Trump is explicit about his reluctance to concede, there is zero chance that Joe Biden will bow out quietly like Al Gore did in the 2000 dispute. However, investors should distinguish a contested election, in which the resolution of disputes will determine the final outcome, from a controversial election, in which the final outcome is known but the defeated candidate refuses to concede. Either could be market-relevant, but the first scenario is the primary concern as it yields the powers of the presidency. The rest is aftermath. The bedrock principle of US presidential succession is as follows: Constitutionally, if the Electoral College vote falls short of a clear majority (270 out of 538), the House of Representatives chooses the president on a majority vote, with each state receiving only one vote. Similarly, the Senate chooses the vice president.6 President Trump is favored to win in this scenario. As mentioned, Republicans may well hold 26 of the 50 state delegations in the House. A clear majority on either side removes any risk of indecision: the next president will be chosen on a party-line vote of the states. For Democrats to choose the president in the House, they need a landslide victory. This is possible, but then it would imply that President Trump has been soundly beaten in the presidential race. A contested election presupposes a close national race that is likely to result in the status quo balance of power among the states in Congress, and hence an advantage for Trump if the House chooses the president. Map 1 illustrates the fundamental shift in American political power if the House of Representatives votes on a state-by-state basis to resolve a contested election. It alters the geography of each state according to the voting age population, the Electoral College representation from 2016, and an equal weighting in which each state gets the same number of votes, as in the House’s contested election procedure. The Electoral College is not nearly as distortive of the popular will as is often made out. However, the red states greatly increase their prominence in an equal weighting (just as in the US Senate). Map 1Trump Disfavored In Popular Vote, But Favored If Contested Election Decided In House Of Representatives
The Definitive Guide To Contested US Elections
The Definitive Guide To Contested US Elections
The fundamental takeaway is that President Trump is disfavored when it comes to the popular vote in the states, but if the election is contested and shifts to the House of Representatives, he has a lifeline. Yet if Democrats win the Senate in the election, this lifeline will be cut off. Moreover, the Supreme Court is a wild card, as discussed below. What Can We Learn From Past Contested Elections? Chart 8US Contested Elections Often Coincide With Deflationary Economy
The Definitive Guide To Contested US Elections
The Definitive Guide To Contested US Elections
The US has witnessed four contested elections under our definition. Most of them occurred amid deflationary economic trends, which would fit with today’s environment (Chart 8). Each episode can be described as a “stolen election,” depending on one’s point of view. The key lessons for today are as follows: 1800 – “The Revolution” – Vice President Thomas Jefferson, as Senate President, chose to count the electoral votes from Georgia even though they lacked the governor’s signature and failed to meet federal requirements. This gave him a majority of the electoral votes, which ultimately led to his election.7 If he had rejected these votes, the outgoing House of Representatives would have chosen his rival candidate, John Adams, as president. Takeaway: The vice president has the constitutional authority to present the electoral votes for counting and to oversee the joint session of Congress. If Congress is divided, and the vice president has a decision as to whether to present a certain set of electoral votes, then the vice president could tip the election in his own party’s favor. Also noteworthy: the presence or absence of a governor’s signature on a state’s electoral votes is not definitive. 1824 – “The Corrupt Bargain” – Andrew Jackson lost the election despite winning both the popular vote and the Electoral College vote. With a hung vote in the college, the House of Representatives decided the election among the top three candidates. The Speaker of the House threw his weight behind John Quincy Adams, who then nominated the speaker as the secretary of state in his new administration. Takeaway: Washington insiders can determine the outcome arbitrarily if they control the House of Representatives. A hung Electoral College, or tie, throws the election to the House and thus favors Trump. 1876 – “The Stolen Election” – Democrat Samuel Tilden won the popular vote and the most electoral votes, at 184, while Republican Rutherford Hayes won 165 electoral votes. Tilden was one vote shy of an Electoral College majority (185), while Hayes fell 20 votes shy. Republican control of four states led to an alternative set of Republican electoral votes being sent to Washington. Congress then had to choose between the rival electoral slates. To resolve the dispute, Congress created a special bipartisan committee. The tiebreaking member of the committee was disqualified by a fluke, leading to a replacement who voted on party lines, awarding all 20 disputed electoral votes to Hayes, who thus won the presidency. Simultaneously lawmakers negotiated a grand compromise to ensure Congress would not filibuster the committee’s decision: Hayes would withdraw federal troops from the South, which had been occupied since the Civil War. Takeaway: A party can use control of states to send an alternate set of electoral returns to Washington, muddying the electoral counting process and throwing the election into Congress’s hands. Also, Congress is supreme and can create special mechanisms to resolve electoral disputes. Political solutions are essential when constitutional mechanisms fail. 2000 – Bush versus Gore – Contested election results in Florida led Democrat Al Gore to withdraw his concession to Republican George W. Bush. The Gore legal team convinced the Florida Supreme Court to allow several recounts, including a statewide recount. The Florida legislature, along with Florida Governor Jeb Bush, prepared to certify Jeb’s brother’s victory and send electoral votes to Washington. The US Supreme Court intervened, halting a statewide recount, on the basis of the equal protection clause of the fourteenth amendment and in rejection of the Florida court’s novel recount scheme. Takeaway: The Supreme Court can and will intervene in a state election dispute if it is becoming a legal morass. Previously the states settled disputes themselves, or the US Congress settled disputes in Washington. Though the Supreme Court claimed that its ruling did not set a precedent, the clear precedent is that the Supreme Court will intervene if there is a power vacuum. Each of these contested elections sparked extreme partisan controversy.8 In two of them, both the popular and electoral results were thrown out the window. The lesson is that the House of Representatives is definitive. Unless, of course, the Supreme Court preempts it. Since both the Constitution and statutory history point to Congress, not the Supreme Court, as the arbiter of presidential elections, it is unlikely that the Supreme Court would overrule the House if the House makes its decision first. But it is still possible, and this is a major source of uncertainty for 2020 or future elections. To fix the various problems that have arisen over the years, Washington has passed several laws, such as the twelfth amendment (1804) and the Electoral Count Act (1887). But fundamental disagreements can still emerge: namely over the constitutional power of the state legislatures to appoint electors, the value of the governor’s signature on his or her state’s electoral votes, and whether the President of the Senate has a substantive or merely ceremonial role. Any of these factors could result in confusion and controversy in 2020-21. How Will States Settle Disputes? On the state level, prior to the joint session of Congress to count the electoral votes on January 6, a range of shenanigans could occur, and the states may never actually settle their disputes. States are supposed to settle any internal recounts or disputes by December 8, 2020 for “safe harbor” status. This status urges, but does not require, the US Congress to accept the state’s final determination of its own electoral votes. If a state fails of this status, Congress may still count its votes, but it has a freer hand to do as it pleases. Thus each party will attempt through judicial or legislative actions to rush and achieve safe harbor status if it believes it won the popular vote count, and will attempt to delay and deprive the state of that status if not. If the legislature and governor agree, then this will be no problem. If they do not agree, the risk emerges that a state battle could escalate all the way to Washington. States with Republican governors, and a Republican or at least a divided legislature, could ensure that Republican electoral votes are sent to Washington in the event of a dispute. This is particularly important in the case of Arizona and Florida, but it also applies to Georgia, Iowa, Ohio, and Texas in 2020. The same goes for Democrats, although there are fewer swing states that fit this description (e.g. Minnesota), as Table 3 shows. Table 3Swing States: Balance Of Legislative And Executive Power
The Definitive Guide To Contested US Elections
The Definitive Guide To Contested US Elections
The reason for this is that the Electoral Count Act of 1887 instructs Congress to favor the electoral votes with the governor’s signature if there is any dispute about which results to accept when the US Congress holds the final count. If the governor is not opposed by his own legislature, then his certified results will be the ones that go to Congress. However, states with a unified legislature, either Republican or Democratic, could conceivably send electoral votes of their choice regardless of what the state governor does – and this is relevant for several of the most important swing states in 2020, specifically Republican legislatures under Democratic governors in Pennsylvania, Wisconsin, Michigan, and North Carolina, and Democratic legislatures under Republican governors, as in New Hampshire. The constitution endows state legislatures with the power to appoint electors, so legislatures could attempt to override their governors – or even their state supreme courts. Indeed, Florida’s legislature and governor were prepared to send Republican electoral votes to Washington regardless of the Florida high court’s actions in the year 2000. How Will Congress Count The Votes? Republicans will not have unified control of the federal legislature and executive, as noted above. Hence Republican congressmen and senators will not be able to pick and choose which electoral votes to accept at their discretion when the votes are counted on January 6, 2021. House Democrats would prevent them from rejecting any state’s electoral votes for arbitrary reasons. On the other hand, the Democrats are quite likely to pick up the Senate, and a united Democratic Congress would have the power to pick and choose electoral votes at its discretion. The Democrats could disqualify the electoral votes of a state that voted for Trump in the event of a dispute, tipping the scales in Biden’s favor, during the electoral counting process. For example, say President Trump wins 270 electoral votes and Biden wins 268 – a likely scenario if Trump wins all the 2016 states but loses Pennsylvania and Michigan. Ostensibly President Trump would be re-elected. But the Democratic House and Senate could disqualify the 10 electoral votes of Wisconsin due to any disputes in that state over its popular vote or electors. Trump’s votes would fall to 260 while Biden would retain his original 268. A unified Congress could simultaneously decide to disqualify Wisconsin’s electors from the 538 total of appointed electors, saying the electors were not legally appointed, bringing the total denominator of electors to 528, thus giving Biden a three-vote margin of victory (majority: 265/528). Biden would become the president. If Congress is divided then this kind of manipulation is not possible. Either a bipartisan agreement would determine whether to count a state’s votes – which would be credible and legitimate – or a bipartisan disagreement would lead to the disputed electoral votes being counted. Chart 9Democrats Likely To Win Senate, Hence Congress – Huge Perk In Electoral Count
The Definitive Guide To Contested US Elections
The Definitive Guide To Contested US Elections
Hence the makeup of the Senate on January 3, which may not be wholly complete at that time, is of great consequence. Democrats are structurally favored to win the Senate this year. They have 12 seats up for re-election versus 23 for Republicans, and only two of their seats are at risk whereas 10 are at risk for Republicans (Chart 9). We expect Democrats to take the Senate, but in a close presidential race the Senate could tie at 50-50. If Republicans retain the Senate, then Vice President Mike Pence could take on a substantive role in counting the Electoral College votes, rather than a merely ceremonial role of presenting the electoral returns to the joint session. If a state sends questionable electoral returns, or more than one set of returns, Pence could conceivably choose which results to present to Congress. A unified Congress could override him but a divided Congress might not. There is precedent for a vice president making a decision on electoral counting that affects the outcome in his own favor, as noted above. While modern scholars tend to highlight the conflict of interest here, the constitution could be read as giving the vice president this advantage so as to more speedily settle any disputes.9 The Electoral Count Act of 1887 says that when in doubt, Congress should accept the electoral votes certified by a state’s governor. But this position was controversial at the time and may not be constitutional. The vice president could assert his own authority to present the legitimate votes to Congress to be counted. It is not clear that a conservative-leaning Supreme Court would contradict him, since neither the constitution nor the Electoral Count Act envisions the court as arbitrating these kinds of disputes. Thus it is conceivable that a situation could arise in which a critical swing state sends two sets of returns and Vice President Pence chooses the electors in favor of himself and President Trump, with a Republican Senate preventing the Democratic House from doing anything about it. A strict constructionist Supreme Court would likely defer to whatever happens in Congress. However, the court could be activist, given that Chief Justice John Roberts is a well-known swing player. It could interpose in a way that precludes any actions deemed entirely arbitrary or lacking a plausible basis in the facts of the state’s election results and laws. As we saw, the court will be inclined to fill a power vacuum. The takeaway is that a unified Congress could count the electoral votes in such a way as to secure a Biden win, while a divided Congress could count the electoral votes in such a way as to give President Trump a lifeline in a disputed election. The Supreme Court is a wild card. What About An Electoral College Tie Or Faithless Electors? A contested election, using the narrow definition, would occur due to an Electoral College tie at 269-269 or any other anomalies that prevent either candidate from reaching a 270-vote majority. Again, the House of Representatives would decide on a state-by-state basis, likely favoring Trump. For example, some electoral votes could be disqualified, a third party candidate could split the vote, or “faithless electors” could vote contrary to their state’s popular choice.10 An electoral tie is not a negligible risk in 2020 – there are 68 possible combinations, and many of them are plausible.11 In 2016, 11 states had a margin of victory less than 5%. Take two equally realistic examples. If Trump lost Pennsylvania and Michigan (likely) as well as Nebraska’s second district (Omaha/suburbs, which President Obama won) then he would tie Biden at 269. Or, if Trump lost Pennsylvania, Michigan, and Arizona (which leaned Democratic in 2018), yet gained Minnesota (the epicenter of the crisis over race and law enforcement), a tie would occur. In a near-tie, a few wayward electors could deprive either candidate of a win. This is far more likely to happen to Trump than Biden. Table 4Range Of Electoral College Votes, 2020
The Definitive Guide To Contested US Elections
The Definitive Guide To Contested US Elections
The current combinations of truly competitive states suggest that the Democrats have a lock on 268-319 electoral votes while Republicans only have a lock on 169-219 electoral votes (Table 4). Trump is widely expected to lose both Pennsylvania and Michigan, which alone cut him down to 270 votes; the loss of a single vote from there would deprive him of a majority. By contrast, Biden would hit 278 votes at minimum by picking off a single Republican state in addition to Pennsylvania and Michigan. It is more likely that Trump would lose one or two faithless electors than that Biden would lose nine or ten. So it is more likely that faithless electors would deprive Trump of a win than Biden. But then the House of Representatives would have to resolve the impasse, and would likely favor Trump. What Is The Line Of Succession If The House Fails To Choose A President? What happens if a contested election goes to the House but the state delegations tie at 25-25? Then the House must continue voting over and over until one of the presidential candidates gets the majority. A single lawmaker in a critical state could swing the balance. That lawmaker could be swayed by conscience, bribes, or chance. In 1824, a critical lawmaker from New York changed his vote at the last minute because he found a ballot with John Q. Adams’s name on it and believed it was a sign from God. In 1876, the tiebreaking Supreme Court judge in the congressional commission delegated to work out a compromise solution was disqualified after it was found he had won a simultaneous race for a seat in the Senate.12 The House would eventually decide, but if the state delegations are evenly split, the voting could continue through January 20, Inauguration Day. The vice president would take over at that time. The vice president is chosen by a majority vote of the Senate. If Democrats take the Senate, they would choose California Senator Kamala Harris as the vice president, and she would act as president until the House made its choice. If the Senate vote also split at 50-50 on the new vice president, then the Speaker of the House, who is likely still to be California Representative Nancy Pelosi, would serve as acting president under the statutory line of presidential succession (Table 5). Table 5US Line Of Succession If Presidency Vacant
The Definitive Guide To Contested US Elections
The Definitive Guide To Contested US Elections
Obviously both the House and the Senate would be under immense pressure to make a decision, so the power vacuum would not last more than a couple of months at most. The US would not be without a leader. However, its leader would be an interim leader with limited ability to make major policy changes or act proactively at home or abroad. It might be a good time for China to stage a surprise attack on Taiwan, or for other revisionist powers like Russia, Iran, or Turkey to make aggressive moves, while the global policeman is asleep at the wheel.13 What Is The “Blue Shift” And Does It Matter? The scholar Edward Foley has called attention to the phenomenon of the “Blue Shift” as a possible pretext for President Trump to contest the election result. The blue shift is the emerging tendency for US election tallies to change significantly after election day as a result of absentee and mail-in ballots that arrive after in-person ballots are counted.14 In 2018, the Arizona senate election went from Republican, as of the tally on November 6 to Democratic as of November 12 as a result of the blue shift. This produced whiplash for Republican supporters who thought they had won (Table 6). Table 6“ Blue Shift” Means Vote Count Leans Democratic As Late Votes Arrive
The Definitive Guide To Contested US Elections
The Definitive Guide To Contested US Elections
Will COVID-19 exacerbate the blue shift in 2020? While Republicans are less fearful of the virus and Democrats more enthusiastic about mail-in voting, the pandemic’s effect will be for more people in general to vote by mail, which should reduce the Democratic skew relative to previous elections. Still, there will be some Democratic skew which opens the possibility that an election that looks like a Republican win in the wee hours of November 4 could later fall to the Democrats. Foley entertains a scenario in which President Trump disputes the election on the basis of this apparent, but not real, shift in the election results. However, a blue shift would not prevent state-level election boards from correctly tallying and certifying the result. Trump can always cry foul, but only a small group of Republican supporters will believe him if the results are duly and transparently verified by a bipartisan consensus among the branches of state government. This scenario is thus governed by the points made above regarding the role of state legislatures: if a swing state’s legislature genuinely disagrees with the state’s election board or governor, then it could send its own set of electoral votes to Washington. If Republicans control the Senate, then this alternate set of electoral votes could be accepted. What Happens After A Contested Election? The constitutional power to count the Electoral College votes, and to determine the election if the college is indecisive, lies with Congress (and/or the Supreme Court). The rest is just the wailing and gnashing of teeth. This wailing and gnashing could still prove market-relevant, however. If the defeated candidate has enough popular support, he would reduce the effectiveness of the new administration. If President Trump is re-elected on any of the technicalities above, he will face an unprecedented popular opposition and social unrest, likely fanned by Biden and a unified Democratic Party. Trump’s administration would be weak at home and would only have influence abroad, creating downside for global risk assets. Polarization is extreme – the two parties will do anything to win the White House. Chart 10Republicans Will Drop Trump Like Nixon If He Loses
The Definitive Guide To Contested US Elections
The Definitive Guide To Contested US Elections
By contrast, if President Trump loses and refuses to concede, then he will actually reduce policy uncertainty in the United States. Trump’s support among Republicans is premised on his ability to win and drive through their favored policies; his support will plummet if he loses, just as Richard Nixon’s plummeted after the Watergate tapes were revealed (Chart 10). Trump could create an alt-right social media empire and serve as a gadfly, or he could lead a “rump” of the Republican Party to break away. Either way, he would divide and weaken the Republicans relative to the now-ruling Democrats, which would eventually lead to greater policy certainty. Without steady opposition, Democrats would achieve more of their agenda. This would increase risks for certain equity sectors (health care, energy), but would actually reduce polarization as the Democratic majority would more easily cooperate with moderate Republicans. The latter scenario would be hugely important. Trump could hobble the Republicans for years. This would pave the way for a Democratic ascendancy. Such an ascendancy is already possible based on trends in age, demographics, and ideology, but a serious split in the Republican Party would ensure that it comes to pass. The negative side-effect is that the populist fringe would be more likely to become disaffected or radicalized. Implications For The Long Run The advanced democracies have seen a period of relative peace and prosperity since World War II that kept their electoral disputes limited. They have sought to use multilateral institutions to promote free and fair elections across the rest of the world. But globalization has disrupted their internal political balances, particularly in the United States, making them vulnerable to governance and electoral failures usually associated with emerging and frontier markets (Table 7). Table 7Worldwide Contested Elections Rarely End Peacefully
The Definitive Guide To Contested US Elections
The Definitive Guide To Contested US Elections
Even prior to COVID-19 the US had reached historic levels of political polarization. The downward spiral of partisanship began when the Soviet Union collapsed and the country no longer faced a common external enemy. The Democrats and Republicans rapidly descended into a fratricidal battle over what they thought would be world supremacy. Today polarization is exploding into open power struggle, with President Trump preemptively casting doubt on the legitimacy of the election and his challenger suggesting that the US military will have to remove him from office if he defies the election result (with prominent generals explicitly contemplating “collective action” to remove Trump).15 Social unrest is morphing into ideological and political violence in the streets. There is ample fuel for unrest and violence to intensify. The party that comes out on top of the 2020 election will have significant influence over the future, including taxing and spending, trade and foreign policy, Supreme Court picks, redistricting after the 2020 census, the fate of the Senate filibuster, and the debate over statehood for Washington, DC. If President Trump wins, it will either be narrowly, through the Electoral College, or through a contested election settled in the House of Representatives. It will prevent a new consensus forming on fiscal policy and the redistribution of wealth. The same goes for a Biden win with Republicans keeping the Senate. As such, polarization will increase for a few more years, before the next generation’s leftward political shift overtakes the Republicans. Nevertheless, while domestic policy will swing on the Senate, the next president will mostly be important in shaping US policy toward the rest of the world. In this respect, it is notable that Biden and Trump are both competing to see who is more mercantilist and protectionist. The US’s secular competition with China is likely to help cultivate national consensus on a range of policies in the coming decade. And if the Democrats win with a clean sweep – which we still see as the most likely outcome – the painful process of forming a new consensus on taxing and spending will begin in 2021. The US will have witnessed a sea change in fiscal policy as well as trade policy. Partisanship will remain high, but a strong Democratic majority on taxing and spending, combined with Democrats flagrantly coopting Trump’s stance on trade and China, looks to us like the seeds of a new national policy consensus that will reduce US political polarization over the long run. A Trump victory on a technicality will lead to a weak government and trade war. A Biden victory will have popular support and lead to higher taxes. Chart 11Stock Market Will Sell Off Amid Contested Election, As In Past
The Definitive Guide To Contested US Elections
The Definitive Guide To Contested US Elections
Unfortunately, this year and the next few years will still see polarization at extremes. It goes without saying that the US election cycle in 2020-21 will bring surprises and likely induce financial market volatility, beyond what has been seen. Judging by history, a full-fledged contested election will likely lead to a substantial equity pullback (Chart 11) – especially in a recessionary context, as in the case of the 1876 “Stolen Election.” Beyond that, Trump’s re-election would pose a major trade war risk for global assets, a boon for continued US equity outperformance relative to the world. Biden would reduce global risks, while hiking domestic risks due to higher taxes and regulation, thus encouraging the opposite effect. Matt Gertken Vice President Geopolitical Strategist mattg@bcaresearch.com Footnotes 1 See Article II, Section I of the US Constitution. 2 See “Electoral College Instructions To State Officials,” National Archives and Records Administration, Office of the Federal Register, available at archives.gov. 3 See Article II, i and Amendment XII of the Constitution. There is some disagreement about what the constitution says regarding who does the counting. But a miscounting of the results, if the results are clear, is not credible. The vice president cannot deliberately miscount the vote, nor could Congress. However, if the results are not clear, disagreements could emerge in which the vice president could have a decisive impact. See Stephen A. Siegel, “The Conscientious Congressman’s Guide To The Electoral Count Act of 1887,” Florida Law Review 56 (2004), floridalawreview.com. Throughout this report we are highly indebted to Siegel’s authoritative study. 4 See Cook Political Report, “2020 House Race Ratings,” August 21, 2020, cookpolitical.com. 5 See for example Anna Baringer et al, “Voting by Mail and Ballot Rejection: Lessons from Florida for Elections in the Age of the Coronavirus,” University of Florida Election Science Group, August 20, 2020, electionscience.clas.ufl.edu. 6 See Amendment XII of the Constitution. 7 See Siegel, “The Conscientious Congressman’s Guide.” For the historical details in this section, see Paul F. Boller, Jr., Presidential Campaigns: From George Washington To George W. Bush (Oxford: OUP, 1984 [2004]). The House had to vote between Jefferson and his vice presidential candidate, Aaron Burr, who had the same number of electoral votes. At that time the president and vice president were not treated separately. Jefferson ultimately won when a handful of state delegations in the House abstained after several rounds of voting. Subsequently the twelfth amendment to the constitution was passed so that presidents and vice presidents were chosen separately, avoiding an Electoral College tie between two members of the same party ticket. 8 In 1800, Thomas Jefferson warned of civil war. In 1824, Andrew Jackson fumed that the will of the people had been cheated and plotted revenge, which he got in 1828. In 1876, Washington sent federal troops to monitor state election boards and some southern states threatened to rise up again. In 2000, a debatable court intervention fueled a left-wing backlash and a vicious spiral of polarization that continues to this day. 9 Here and elsewhere in this report we are indebted to Edward B. Foley, “Preparing for a Disputed Presidential Election: An Exercise in Election Risk Assessment and Management,” Loyola University Chicago Law Journal 51:2 (2019), lawecommons.luc.edu. 10 Regarding “faithless electors,” the Supreme Court this year unanimously upheld the ability of states to punish electors who break their pledge. But faithless electors are still possible, and could conceivably deprive an Electoral College winner of his victory. The 2016 election saw seven electors deviate from their party (out of 10 who tried), abnormally high. The extreme political environment is likely to produce defectors. See “Supreme Court Clarifies Rules for Electoral College: States May Restrict Faithless Electors,” Congressional Research Service, July 10, 2020, crsreports.congress.gov. 11 See “Electoral College Tie Finder,” 270 To Win, www.270towin.com. 12 See Boller, Presidential Campaigns. 13 See Admiral James A. Winnefeld and Michael J. Morell, "The War That Never Was?" US Naval Institute Proceedings 146: 8 (August 2020), usni.org. 14 See Foley, “Preparing for a Disputed Presidential Election.” This trend began with electoral reforms that made absentee balloting easier in 2002, but it is also a broader trend. Republicans tend to vote in person; those who vote through mail skew Democratic. Therefore the initial results favor Republicans, while the final results bring in a rush of ballots favoring Democrats. 15 See Brittany Bernstein, “Mattis Told Then-DNI Coats They May Be Forced to Take ‘Collective Action’ against ‘Unfit’ Trump, According to New Woodward Book,” National Review Online, September 9, 2020, nationalreview.com.
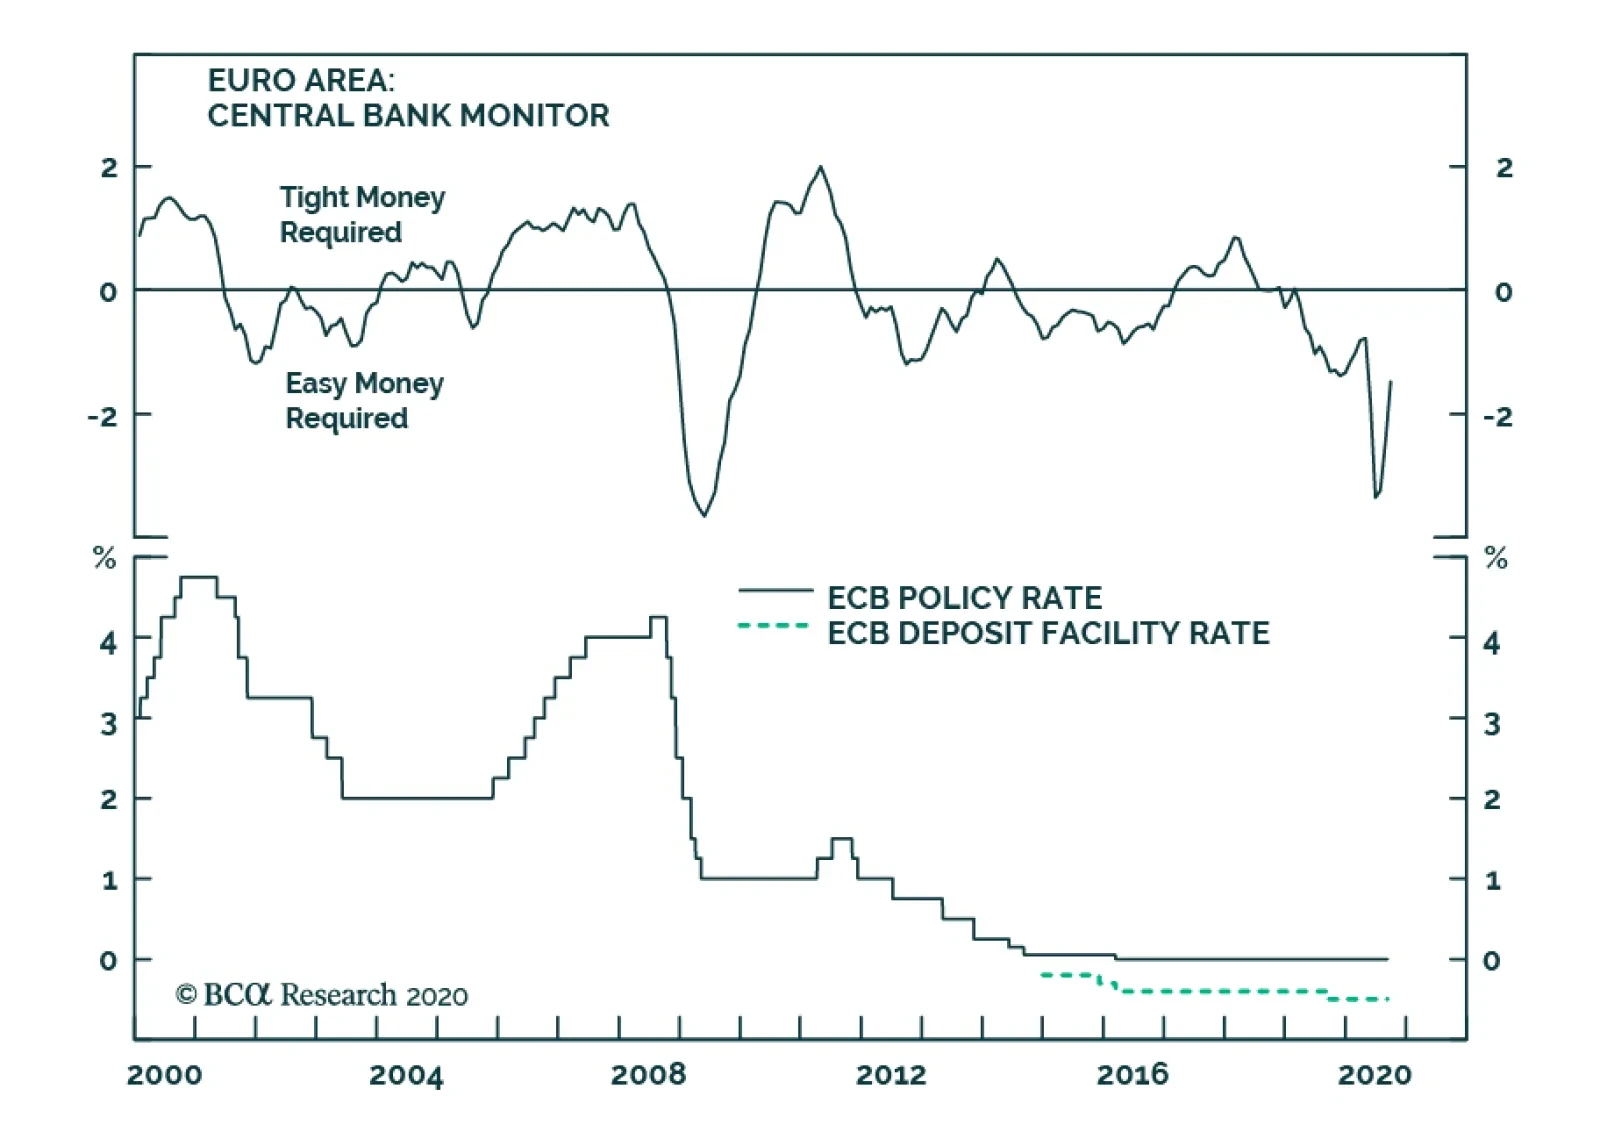
Yesterday, the European Central Bank left policy unchanged and the tone of the press conference that followed the meeting indicated that the ECB is comfortable with the evolution of the economic recovery in Europe. The upgrade of the staff forecasts confirms…
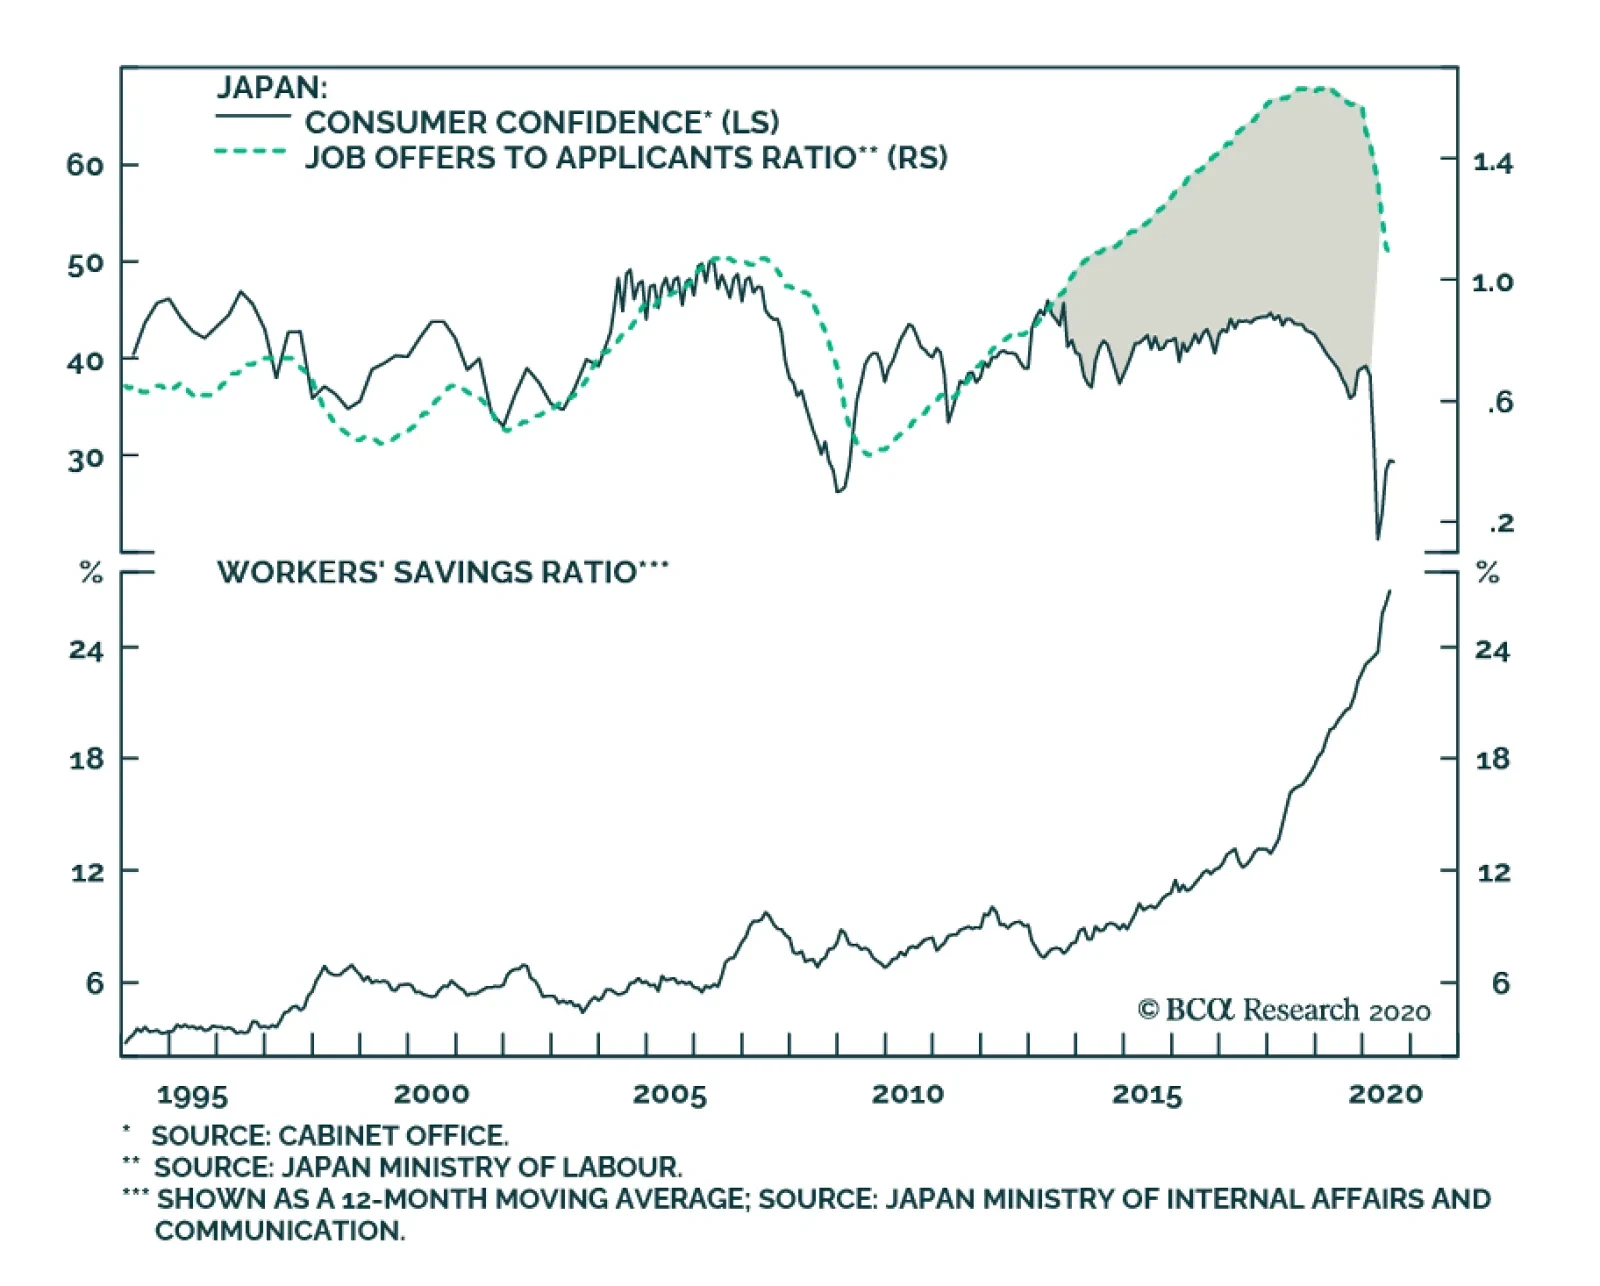
According to BCA Research's Foreign Exchange Strategy service, the yen remains an attractive portfolio hedge. This view rests on three pillars. First, Japan has one of the highest real rates in the G10, meaning outflows from Japanese fixed income investors…
To all clients, Next week, in lieu of publishing a regular report, I will be hosting a webcast on September 15th at 10 am EDT, discussing our latest views on global fixed income markets. Sign up details for the Webcast will arrive in your inboxes later this week. Best regards, Robert Robis, Chief Fixed Income Strategist Feature Much of the global rebound in economic activity, and recovery in equity and credit markets, seen since the COVID-19 shock earlier this year can be attributed to historic levels of monetary and fiscal stimulus. However, the effective transmission of various monetary policy measures such as liquidity injections and refinancing operations, and by extension a sustained global recovery, is dependent on the continued smooth flow of credit from lenders to borrowers. As such, the tightening in bank lending standards seen across developed markets in the second quarter of 2020 could imperil the recovery if banks remain cautious with borrowers (Chart 1). Chart 1Credit Standards Across Developed Markets
Introducing The GFIS Global Credit Conditions Chartbook
Introducing The GFIS Global Credit Conditions Chartbook
This week, we are introducing the BCA Research Global Fixed Income Strategy (GFIS) Global Credit Conditions Chartbook—a review of central bank surveys of bank lending standards and loan demand. We will be publishing this chartbook on an occasional basis going forward to help inform our fixed income investment recommendations. Where it is relevant to our analysis, we will also make special note of the one-off questions asked in some of these surveys that are germane to the economic situation at hand. Where To Find The Bank Lending Surveys A number of central banks publish regular surveys of bank lending conditions in their domestic economies. The surveys, and the details on how they are conducted, can be found on the websites of the central banks: US Federal Reserve: https://www.federalreserve.gov/data/sloos.htm European Central Bank: https://www.ecb.europa.eu/stats/ecb_surveys/bank_lending_survey/html/index.en.html Bank of England: https://www.bankofengland.co.uk/credit-conditions-survey/ Bank of Japan: https://www.boj.or.jp/en/statistics/dl/loan/loos/index.htm/ Bank of Canada: https://www.bankofcanada.ca/publications/slos/ Reserve Bank of New Zealand: https://www.rbnz.govt.nz/statistics/c60-credit-conditions-survey US Chart 2US Credit Conditions
US Credit Conditions
US Credit Conditions
Overall credit standards for US businesses, measured as an average of standards faced by small, medium and large firms, tightened dramatically in Q2/2020 (Chart 2). Unsurprisingly, gloomier economic outlooks, reduced risk tolerance, and worsening industry-specific problems were the top reasons cited by US banks for tightening standards. US banks reported that commercial and industrial (C&I) loan demand from all firms also weakened in Q2, owing to a decrease in customers’ inventory financing and fixed investment needs. This suggests that the surge in actual C&I loan growth data during the spring was fueled by companies drawing down credit lines to survive the lack of cash flow during the COVID-19 lockdowns and should soon peak. Standards for consumer loans tightened significantly in Q2, as well. A continuation of this trend would pose a major risk to the US economic recovery, given the still fragile state of US consumer confidence. Business lending standards typically lead US high-yield corporate bond default rates by about one year, suggesting that defaults will continue to climb over the next few quarters (Chart 2, top panel). Tightening US junk bond spreads have ignored the rising trend in defaults and now provide no compensation for the likely amount of future default losses, suggesting poor value in the overall US high-yield market (Chart 3). Turning to the real estate market, lending standards have tightened significantly for both commercial and residential mortgage loans (Chart 4). In a special question asked in the Q2 survey, US banks indicated that lending standards for both those categories are at the tighter end of the range that has prevailed since 2005. Business lending standards typically lead US high-yield corporate bond default rates by about one year, suggesting that defaults will continue to climb over the next few quarters. Chart 3US Junk Spreads Do Not Compensate For Default Risk
US Junk Spreads Do Not Compensate For Default Risk
US Junk Spreads Do Not Compensate For Default Risk
Chart 4The White Picket Fence Is Looking Out Of Reach
The White Picket Fence Is Looking Out Of Reach
The White Picket Fence Is Looking Out Of Reach
Euro Area Italy is seeing the greater benefit from ECB support, however, with loan growth now at a new cyclical high. Chart 5Euro Area Credit Conditions
Euro Area Credit Conditions
Euro Area Credit Conditions
In contrast to the US, credit standards actually eased slightly in the euro area in Q2/2020 (Chart 5). Banks reported increased perceptions of overall risk from a worsening economic outlook, but that was more than offset by the massive liquidity and loan guarantee programs that were part of the policy response to the COVID-19 recession. Going forward, banks expect lending standards to tighten as the maximum impact of those policies begins to fade. Credit demand from firms rose in Q2, driven by acute liquidity needs during the COVID-19 lockdowns. At the same time, demand for longer-term financing for capital expenditure was very depressed. Banks expect credit demand to normalize in Q3, as easing lockdown restrictions dampen the immediate need for liquidity. Credit demand from euro area households plummeted in Q2. Banks reported that plunging consumer confidence was the leading cause of decline in credit demand, followed closely by reduced spending on durable goods. Consumer confidence has already rebounded and banks expect demand to follow suit, as economies re-open and spending opportunities return. Chart 6HY Spreads In The Euro Area Are Unattractive
HY Spreads In The Euro Area Are Unattractive
HY Spreads In The Euro Area Are Unattractive
As with the US, we expect that tighter credit standards to firms will drive up euro area high-yield default rates. Current euro area high-yield spreads offer little compensation for the coming increase in default losses, suggesting a similar poor valuation backdrop to US junk bonds (Chart 6). Looking at the four major euro area economies, credit standards eased across the board in Q2, with the largest moves seen in Italy and Spain (Chart 7). The ECB’s liquidity operations have helped support lending in those countries, each with a take-up from long-term refinancing operations (LTROs) equal to around 14% of total bank lending (Chart 8). Italy is seeing the greater benefit from ECB support, however, with loan growth now at a new cyclical high and Spanish banks projecting a much sharper tightening of lending standards in Q3 relative to Italian banks. Chart 7Loan Growth Accelerating Across Most Of The Euro Area
Loan Growth Accelerating Across Most Of The Euro Area
Loan Growth Accelerating Across Most Of The Euro Area
Chart 8Italy & Spain Taking Full Advantage Of LTROs
Italy & Spain Taking Full Advantage Of LTROs
Italy & Spain Taking Full Advantage Of LTROs
UK For consumers, UK banks are projecting loan demand to improve in Q3, although that will require a sharper rebound in consumer confidence than has been seen to date. Chart 9UK Credit Conditions
UK Credit Conditions
UK Credit Conditions
In the UK, corporate credit standards eased significantly in Q2 2020 thanks to the massive liquidity support programs provided by the UK government (Chart 9). Lenders reported a larger proportion of loan application approvals from all business sizes, with the greatest improvements seen in small businesses and medium-sized private non-financial corporations (PNFCs). However, lenders indicated that average credit quality on new PNFC borrowing facilities had actually declined, with default rates increasing, for all sizes of borrowers. This divergence between increased lending and declining borrower creditworthiness attests to the impact of the UK’s substantial liquidity provisions in response to the COVID-19 shock. The credit demand side mirrors the supply story with a massive spike in Q2 2020. In contrast to euro area counterparts, UK businesses reportedly borrowed primarily to facilitate balance sheet restructuring. However, as with the euro area, the story for Q3 is much more bearish. Banks are projecting credit standards to turn more restrictive as stimulus programs run out and borrowers rein in credit demand. Going forward, decreasing risk appetite of UK banks will likely contribute to a tightening in lending standards. For consumers, UK banks are projecting loan demand to improve in Q3, although that will require a sharper rebound in consumer confidence than has been seen to date. UK banks surprisingly reported that the average credit quality of new consumer loans improved in Q2, suggesting that consumer loan demand could rebound strongly in Q3 as lockdown restrictions fade. Japan Perversely, the latest improvement in Japanese business optimism could translate to lower business loan demand going forward. Chart 10Japan Credit Conditions
Japan Credit Conditions
Japan Credit Conditions
Before the pandemic hit, credit standards in Japan were in a structural tightening trend for both firms and households (Chart 10). Fiscal authorities have taken a number of measures to ease conditions for businesses, including low interest rate loan programs and guarantees for large businesses as well as small and medium-sized enterprises, which has translated into the easiest credit standards for Japanese firms since 2005. The correlation between business loan demand and business conditions is not as clear-cut in Japan compared to other countries. Japanese firms tend to borrow more when the economic outlook is poor, indicating that loans are being used to meet emergency funding or restructuring needs rather than being put towards capital expenditure or inventory financing. Perversely, the latest improvement in Japanese business optimism could translate to lower business loan demand going forward. However, the consumer picture is a bit more conventional—consumer loan demand and confidence tend to track quite closely. While consumer confidence has yet to stage a convincing rebound, it has clearly bottomed. The more positive projections for consumer loan demand from the Japan bank lending survey seem to confirm this message. Canada And New Zealand In Canada, business lending standards tightened in Q2/2020 as loan growth slowed (Chart 11). Although loan growth is far from contracting on a year-on-year basis, further tightening in conditions could pose an obstacle to Canadian recovery. On the mortgage side, the Canadian government has been active in easing pressures for lenders by relaxing loan-to-value requirements for mortgage insurance, making it easier for them to collateralize and sell their assets to the Canadian Mortgage and Housing Corporation (CMHC). Although this has yet to translate to the standards faced by borrowers, residential mortgage growth remains buoyant. In New Zealand, credit standards for firms (including both corporates and SMEs) tightened significantly in Q2 (Chart 12). Many banks expect to apply tighter lending standards to borrowers in industries most impacted by the pandemic, such as tourism, accommodation, and construction. Demand for credit from firms was driven by working capital needs while capital expenditure funding demands fell drastically. Chart 11Canada Credit Conditions
Canada Credit Conditions
Canada Credit Conditions
Chart 12New Zealand Credit Conditions
New Zealand Credit Conditions
New Zealand Credit Conditions
On the consumer side, residential mortgage standards increased somewhat, and banks expect to perform more due diligence on income and job security. The hit to credit demand was broad-based across credit card, secured, and unsecured lending and coincided with a sharp fall in loan demand. Shakti Sharma Research Associate ShaktiS@bcaresearch.com Robert Robis, CFA Chief Fixed Income Strategist rrobis@bcaresearch.com Recommendations The GFIS Recommended Portfolio Vs. The Custom Benchmark Index
Introducing The GFIS Global Credit Conditions Chartbook
Introducing The GFIS Global Credit Conditions Chartbook
Duration Regional Allocation Spread Product Tactical Trades Yields & Returns Global Bond Yields Historical Returns