Policy

Highlights Chart 1Permanent Job Losses Still Rising
Permanent Job Losses Still Rising
Permanent Job Losses Still Rising
The biggest event in bond markets last month was the Fed’s shift toward a regime of average inflation targeting. Treasuries sold off in the days following the announcement and, overall, the Bloomberg Barclays Treasury index underperformed cash by 111 basis points in August (Chart 1). We view this market reaction as sensible, since it seems clear that the Fed’s new commitment to tolerate an overshoot of its 2% inflation target will be bearish for bonds in the long run. However, for this bond bear market to play out the US economy must first generate some inflation. This will take time. Despite the drop in the headline U3 unemployment rate, August’s employment report showed that permanent job losses continue to rise (bottom panel). This is a clear sign that the economic recovery is not yet on a solid footing. We advise bond investors to keep portfolio duration close to benchmark for the time being. We also recommend several yield curve trades across the nominal, real and inflation compensation curves (see pages 10 & 11). Feature Investment Grade: Overweight Chart 2Investment Grade Market Overview
Investment Grade Market Overview
Investment Grade Market Overview
Investment grade corporate bonds outperformed the duration-equivalent Treasury index by 5 basis points in August, bringing year-to-date excess returns up to -356 bps. Spreads on Baa-rated corporate bonds continued their tightening trend through August, even as spreads were roughly flat for bonds rated A and above. As a result, Baa-rated bonds outperformed duration-matched Treasuries by 30 bps on the month while higher-rated credits underperformed. Valuation remains more attractive for the Baa space than for higher-rated credits (Chart 2), but spreads for all credit tiers look cheaper than they did near the end of 2019. Given the Fed’s strong support for the market through both its emergency lending facilities, and now, its extraordinarily dovish forward rate guidance, we see further room for spread compression across all credit tiers. At the sector level, we continue to recommend a focus on high-quality Baa-rated issuers. That is, Baa-rated bonds that are unlikely to face a ratings downgrade during the next 12 months. Subordinate bank bonds are a prime example of debt that falls into this sweet spot.1 We also recommend overweight allocations to Healthcare and Energy bonds2 and underweight allocations to Technology3 and Pharmaceutical bonds.4 Table 3ACorporate Sector Relative Valuation And Recommended Allocation*
The Fed’s New Framework Is Bond Bearish … But Not Yet
The Fed’s New Framework Is Bond Bearish … But Not Yet
Table 3BCorporate Sector Risk Vs. Reward*
The Fed’s New Framework Is Bond Bearish … But Not Yet
The Fed’s New Framework Is Bond Bearish … But Not Yet
High-Yield: Neutral Chart 3High-Yield Market Overview
High-Yield Market Overview
High-Yield Market Overview
High-Yield outperformed the duration-equivalent Treasury index by 121 basis points in August, bringing year-to-date excess returns up to -351 bps. All junk credit tiers delivered strong returns in August, but the lowest-rated credits performed best. Caa-rated & below junk bonds outperformed Treasuries by 255 bps on the month compared to 98 bps of outperformance for Ba-rated bonds (Chart 3). The recent strong performance of low-rated junk bonds makes us question whether our focus on the Ba-rated credit tier is overly conservative. If the economy is indeed on a quick road to recovery, then we are leaving some return on the table by avoiding the B-rated and lower credit tiers. However, we aren’t yet confident enough in the economic recovery to move down in quality. Last week’s employment report showed that permanent job losses continue to rise and Congress has still not passed a much needed follow-up to the CARES act. What’s more, current junk spreads imply a very rapid decline in the corporate default rate during the next 12 months, from its current level of 8.4% all the way to 4.4% (panel 3).5 In this regard, August’s steep drop in layoff announcements is a positive development (bottom panel), though job cuts are still running well above pre-pandemic levels. At the sector level, we advise overweight allocations to high-yield Technology6 and Energy7 bonds. We are underweight the Healthcare and Pharmaceutical sectors.8 MBS: Underweight Chart 4MBS Market Overview
MBS Market Overview
MBS Market Overview
Mortgage-Backed Securities outperformed the duration-equivalent Treasury index by 9 basis points in August, bringing year-to-date excess returns up to -37 bps. The conventional 30-year MBS index option-adjusted spread (OAS) tightened 7 bps in August, but it still offers a small spread pick-up compared to other similarly risky sectors. The MBS OAS of 77 bps is greater than the 75 bps offered by Aa-rated corporate bonds, the 67 bps offered by Agency CMBS and the 35 bps offered by Aaa-rated consumer ABS. Despite the spread advantage, we are concerned that the elevated primary mortgage spread is a warning that refinancing risk could flare later this year (Chart 4). Even if Treasury yields are unchanged, a further 50 bps drop in the mortgage rate due to spread compression cannot be ruled out. Such a move would lead to a significant increase in prepayment losses. With that in mind, we are concerned about the low level of expected prepayment losses (option cost) priced into the MBS index (panel 3). A fourth quarter refi wave would undoubtedly send that option cost higher, eating into the returns implied by the OAS. The recent spike in the mortgage delinquency rate does not pose a near-term risk to spreads as it is being driven by households that have been granted forbearance from the federal government (panel 4). The risk for MBS holders only comes into play if many households are unable to resume their regular mortgage payments when the forbearance period expires early next year. But even in that case, further government action to either support household incomes or extend the forbearance period could mitigate the risk. Government-Related: Underweight Chart 5Government-Related Market Overview
Government-Related Market Overview
Government-Related Market Overview
The Government-Related index outperformed the duration-equivalent Treasury index by 31 basis points in August, bringing year-to-date excess returns up to -295 bps. Sovereign debt outperformed duration-equivalent Treasuries by 105 bps on the month, bringing year-to-date excess returns up to -468 bps. Foreign Agencies outperformed the Treasury benchmark by 13 bps in August, bringing year-to-date excess returns up to -694 bps. Local Authority debt outperformed Treasuries by 33 bps in August, bringing year-to-date excess returns up to -337 bps. Domestic Agency bonds outperformed by 8 bps, bringing year-to-date excess returns up to -54 bps. Supranationals outperformed by 5 bps, bringing year-to-date excess returns up to -9 bps. US dollar weakness is usually a boon for Sovereign and Foreign Agency returns. However, most of the dollar’s recent depreciation has occurred against other Developed Market currencies, not Emerging Markets (Chart 5). Added to that, dollar weakness against all trading partners helps US corporate sector profits, and Baa-rated corporate bonds continue to offer a spread pick-up versus EM sovereigns (panel 4). Within the Emerging Market Sovereign space: Turkey, South Africa, Mexico, Colombia and Russia all offer a spread pick-up relative to quality and duration-matched US corporate bonds. Of those attractively priced countries, Mexico stands out as particularly compelling on a risk/reward basis.9 Municipal Bonds: Overweight Chart 6Municipal Market Overview
Municipal Market Overview
Municipal Market Overview
Municipal bonds underperformed the duration-equivalent Treasury index by 19 basis points in August, dragging year-to-date excess returns down to -492 bps (before adjusting for the tax advantage). Municipal bond spreads versus Treasuries have widened during the past month, more so at the long-end than at the short-end, and the entire Aaa muni curve remains above the Treasury curve, despite municipal debt’s tax-exempt status (Chart 6). Municipal bonds also remain attractively priced relative to corporate bonds across the entire investment grade credit spectrum, as we demonstrated in a recent report.10 The Fed reduced the pricing on its Municipal Liquidity Facility (MLF) by 50 basis points last month. Most likely, it felt pressure to act as Congress has still not passed a state & local government aid package. However, the Fed’s move will not have much impact on municipal bond spreads. Even after the reduction, municipal yields continue to run well below the cost offered by the MLF (panel 3). Extremely attractive valuation causes us to stick with our municipal bond overweight, though spreads will widen in the near-term if much needed stimulus doesn’t arrive soon. In the long-run, we remain optimistic that elevated state rainy day funds will help cushion the fiscal blow and lessen the risk of ratings downgrades (bottom panel). Treasury Curve: Buy 5-Year Bullet Versus 2/10 Barbell Chart 7Treasury Yield Curve Overview
Treasury Yield Curve Overview
Treasury Yield Curve Overview
The Treasury curve bear-steepened in August. The 2/10 and 5/30 Treasury slopes steepened 14 bps and 22 bps, reaching 58 bps and 121 bps, respectively. One easy way to think about nominal Treasury yields is as the market’s expectation of future changes in the federal funds rate.11 With that in mind, the Fed’s recent shift toward a regime of average inflation targeting will likely lead to nominal yield curve steepening. That is, the Fed will keep a firm grip on the front-end of the curve, but long-maturity yields could rise as investors price-in the possibility that the Fed will have to eventually respond to high inflation by quickly tightening policy. For this reason, we retain a core position in nominal yield curve steepeners. Specifically, we recommend buying the 5-year bullet and shorting a duration-matched 2/10 barbell. This position is designed to profit from 2/10 Treasury curve steepening, which should play out over the next 6-12 months, assuming the economic recovery is sustained. Valuation is a concern with this recommended positioning. The 5-year yield is below the yield on the duration-matched 2/10 barbell (Chart 7), and the 5-year bullet looks expensive on our yield curve models (Appendix B). However, the 5-year bullet traded at much more expensive levels during the last zero-lower-bound period between 2010 and 2013 (bottom panel). With short rates once again pinned at zero, we expect the 5-year to once again hit extreme levels of overvaluation. TIPS: Overweight Chart 8TIPS Market Overview
TIPS Market Overview
TIPS Market Overview
TIPS outperformed the duration-equivalent nominal Treasury index by 240 basis points in August, bringing year-to-date excess returns up to -76 bps. The 10-year and 5-year/5-year forward TIPS breakeven inflation rates rose 25 bps and 22 bps on the month. They currently sit at 1.67% and 1.78%, respectively. TIPS breakeven inflation rates have moved up rapidly during the past couple months, a trend that was supercharged by the Fed’s Jackson Hole announcement. In fact, the 10-year TIPS breakeven inflation rate is now right around fair value according to our Adaptive Expectations Model (Chart 8).12 TIPS will soon turn expensive if current trends continue. That is, unless stronger CPI inflation sends our model’s fair value reading higher. We place strong odds on the latter occurring during the next few months, with trimmed mean inflation measures still running well above core (panel 3). However, we cautioned in a recent report that inflation is likely to moderate in 2021 after core inflation re-converges with the trimmed mean.13 In addition to our overweight stance on TIPS, we continue to recommend real yield curve steepeners and inflation curve flatteners. With the Fed now officially targeting an overshoot of its 2% inflation goal, we would expect the cost of 2-year inflation protection to rise above the cost of 10-year inflation protection (panel 4). With the Fed also keeping a firmer grip over short-dated nominal yields than over long-dated ones, this means that short-maturity real yields will come under downward pressure relative to the long end (bottom panel). ABS: Overweight Chart 9ABS Market Overview
ABS Market Overview
ABS Market Overview
Asset-Backed Securities outperformed the duration-equivalent Treasury index by 30 basis points in August, bringing year-to-date excess returns up to +53 bps. Aaa-rated ABS outperformed the Treasury benchmark by 24 bps on the month, bringing year-to-date excess returns up to +46 bps. Non-Aaa ABS outperformed by 73 bps, bringing year-to-date excess returns up to +95 bps. Aaa ABS are a high conviction overweight, given that spreads remain elevated compared to historical levels and that the sector benefits from Fed support through the Term Asset-Backed Loan Facility (TALF). However, spreads are even more attractive in non-Aaa ABS (Chart 9) and we recommend owning those securities as well. This is despite the fact that only Aaa-rated bonds are eligible for TALF. We explained our rationale for owning non-Aaa consumer ABS in a recent report.14 We noted that the stimulus received from the CARES act caused real disposable personal income to increase significantly between February and July and, faced with fewer spending opportunities, households used that windfall to pay down consumer debt (bottom panel). Granted, further income support from fiscal policymakers is needed now that the CARES act’s enhanced unemployment benefits have expired. But given the substantial boost to savings that has already occurred, we are confident that more stimulus will arrive in time to prevent a wave of consumer bankruptcies. Non-Agency CMBS: Neutral Chart 10CMBS Market Overview
CMBS Market Overview
CMBS Market Overview
Non-Agency Commercial Mortgage-Backed Securities outperformed the duration-equivalent Treasury index by 77 basis points in August, bringing year-to-date excess returns up to -320 bps. Aaa Non-Agency CMBS outperformed Treasuries by 57 bps on the month, bringing year-to-date excess returns up to -108 bps. Non-Aaa Non-Agency CMBS outperformed by 160 bps, bringing year-to-date excess returns up to -1008 bps (Chart 10). We continue to recommend an overweight allocation to Aaa non-agency CMBS and an underweight allocation to non-Aaa CMBS. Our reasoning is simple. Aaa CMBS are eligible for TALF, meaning that spreads can still tighten even as the hardship in commercial real estate continues. Without Fed support, non-Aaa CMBS will struggle to deal with a climbing delinquency rate (panel 3).15 Agency CMBS: Overweight Agency CMBS outperformed the duration-equivalent Treasury index by 38 basis points in August, bringing year-to-date excess returns up to -4 bps. The average index spread tightened 6 bps on the month to 66 bps, still well above typical historical levels (bottom panel). The Fed is supporting the Agency CMBS market by directly purchasing the securities as part of its Agency MBS purchase program. The combination of strong Fed support and elevated spreads makes the sector a high conviction overweight. Appendix A: Buy What The Fed Is Buying The Fed rolled out a number of aggressive lending facilities on March 23. These facilities focused on different specific sectors of the US bond market. The fact that the Fed has decided to support some parts of the market and not others has caused some traditional bond market correlations to break down. It has also led us to adopt of a strategy of “Buy What The Fed Is Buying”. That is, we favor those sectors that offer attractive spreads and that benefit from Fed support. The below Table tracks the performance of different bond sectors since the March 23 announcement. We will use this to monitor bond market correlations and evaluate our strategy’s success. TablePerformance Since March 23 Announcement Of Emergency Fed Facilities
The Fed’s New Framework Is Bond Bearish … But Not Yet
The Fed’s New Framework Is Bond Bearish … But Not Yet
Appendix B: Butterfly Strategy Valuations The following tables present the current read-outs from our butterfly spread models. We use these models to identify opportunities to take duration-neutral positions across the Treasury curve. The following two Special Reports explain the models in more detail: US Bond Strategy Special Report, “Bullets, Barbells And Butterflies”, dated July 25, 2017, available at usbs.bcaresearch.com US Bond Strategy Special Report, “More Bullets, Barbells And Butterflies”, dated May 15, 2018, available at usbs.bcaresearch.com Table 4 shows the raw residuals from each model. A positive value indicates that the bullet is cheap relative to the duration-matched barbell. A negative value indicates that the barbell is cheap relative to the bullet. Table 4Butterfly Strategy Valuation: Raw Residuals In Basis Points (As Of September 3, 2020)
The Fed’s New Framework Is Bond Bearish … But Not Yet
The Fed’s New Framework Is Bond Bearish … But Not Yet
Table 5 scales the raw residuals in Table 4 by their historical means and standard deviations. This facilitates comparison between the different butterfly spreads. Table 5Butterfly Strategy Valuation: Standardized Residuals (As Of September 3, 2020)
The Fed’s New Framework Is Bond Bearish … But Not Yet
The Fed’s New Framework Is Bond Bearish … But Not Yet
Table 6 flips the models on their heads. It shows the change in the slope between the two barbell maturities that must be realized during the next six months to make returns between the bullet and barbell equal. For example, a reading of 72 bps in the 5 over 2/10 cell means that we would only expect the 5-year to outperform the 2/10 if the 2/10 slope steepens by more than 72 bps during the next six months. Otherwise, we would expect the 2/10 barbell to outperform the 5-year bullet. Table 6Discounted Slope Change During Next 6 Months (BPs)
The Fed’s New Framework Is Bond Bearish … But Not Yet
The Fed’s New Framework Is Bond Bearish … But Not Yet
Appendix C: Excess Return Bond Map The Excess Return Bond Map is used to assess the relative risk/reward trade-off between different sectors of the US bond market. It is a purely computational exercise and does not impose any macroeconomic view. The Map’s vertical axis shows 12-month expected excess returns. These are proxied by each sector’s option-adjusted spread. Sectors plotting further toward the top of the Map have higher expected returns and vice-versa. Our novel risk measure called the “Risk Of Losing 100 bps” is shown on the Map’s horizontal axis. To calculate it, we first compute the spread widening required on a 12-month horizon for each sector to lose 100 bps or more relative to a duration-matched position in Treasury securities. Then, we divide that amount of spread widening by each sector’s historical spread volatility. The end result is the number of standard deviations of 12-month spread widening required for each sector to lose 100 bps or more versus a position in Treasuries. Lower risk sectors plot further to the right of the Map, and higher risk sectors plot further to the left. Chart 11Excess Return Bond Map (As Of September 3, 2020)
The Fed’s New Framework Is Bond Bearish … But Not Yet
The Fed’s New Framework Is Bond Bearish … But Not Yet
Ryan Swift US Bond Strategist rswift@bcaresearch.com Footnotes 1 Please see US Bond Strategy Weekly Report, “The Case Against The Money Supply”, dated June 30, 2020, available at usbs.bcaresearch.com 2 Please see US Bond Strategy Special Report, “The Outlook For Energy Bonds Part 1: A Model Of Energy Bond Excess Returns”, dated July 14, 2020 and US Bond Strategy Special Report, “The Outlook For Energy Bonds Part 2: Buy The Dip In High-Yield Energy”, dated July 21, 2020, available at usbs.bcaresearch.com 3 Please see US Bond Strategy Weekly Report, “Take A Look At High-Yield Technology Bonds”, dated June 23, 2020, available at usbs.bcaresearch.com 4 Please see US Bond Strategy Weekly Report, “Assessing Healthcare & Pharma Bonds In A Pandemic”, dated June 9, 2020, available at usbs.bcaresearch.com 5 We assume a 25% recovery rate and target a spread of 150 bps in excess of default losses. For more details on this calculation please see US Bond Strategy Weekly Report, “No Holding Back”, dated June 16, 2020, available at usbs.bcaresearch.com 6 Please see US Bond Strategy Weekly Report, “Take A Look At High-Yield Technology Bonds”, dated June 23, 2020, available at usbs.bcaresearch.com 7 Please see US Bond Strategy Special Report, “The Outlook For Energy Bonds Part 1: A Model Of Energy Bond Excess Returns”, dated July 14, 2020, and US Bond Strategy Special Report, “The Outlook For Energy Bonds Part 2: Buy The Dip In High-Yield Energy”, dated July 21, 2020, available at usbs.bcaresearch.com 8 Please see US Bond Strategy Weekly Report, “Assessing Healthcare & Pharma Bonds In A Pandemic”, dated June 9, 2020, available at usbs.bcaresearch.com 9 Please see US Bond Strategy Weekly Report, “The Treasury Market Amid Surging Supply”, dated May 12, 2020, available at usbs.bcaresearch.com 10 Please see US Bond Strategy Weekly Report, “Bonds Are Vulnerable As North America Re-Opens”, dated May 26, 2020, available at usbs.bcaresearch.com 11 For more details on this forecasting framework please see US Bond Strategy Weekly Report, “Positioning For Reflation And Avoiding Deflation”, dated August 11, 2020, available at usbs.bcaresearch.com 12 For more details on our model please see US Bond Strategy Weekly Report, “How Are Inflation Expectations Adapting?”, dated February 11, 2020, available at usbs.bcaresearch.com 13 Please see US Bond Strategy Weekly Report, “Positioning For Reflation And Avoiding Deflation”, dated August 11, 2020, available at usbs.bcaresearch.com 14 Please see US Bond Strategy Weekly Report, “No Holding Back”, dated June 16, 2020, available at usbs.bcaresearch.com 15 For a deeper dive into the outlook for US commercial real estate please see Global Investment Strategy Special Report, “Working From Home, Urban Flight, And Commercial Real Estate Loans: How Bad Can Things Get?”, dated August 28, 2020, available at gis.bcaresearch.com Fixed Income Sector Performance Recommended Portfolio Specification Corporate Sector Relative Valuation And Recommended Allocation
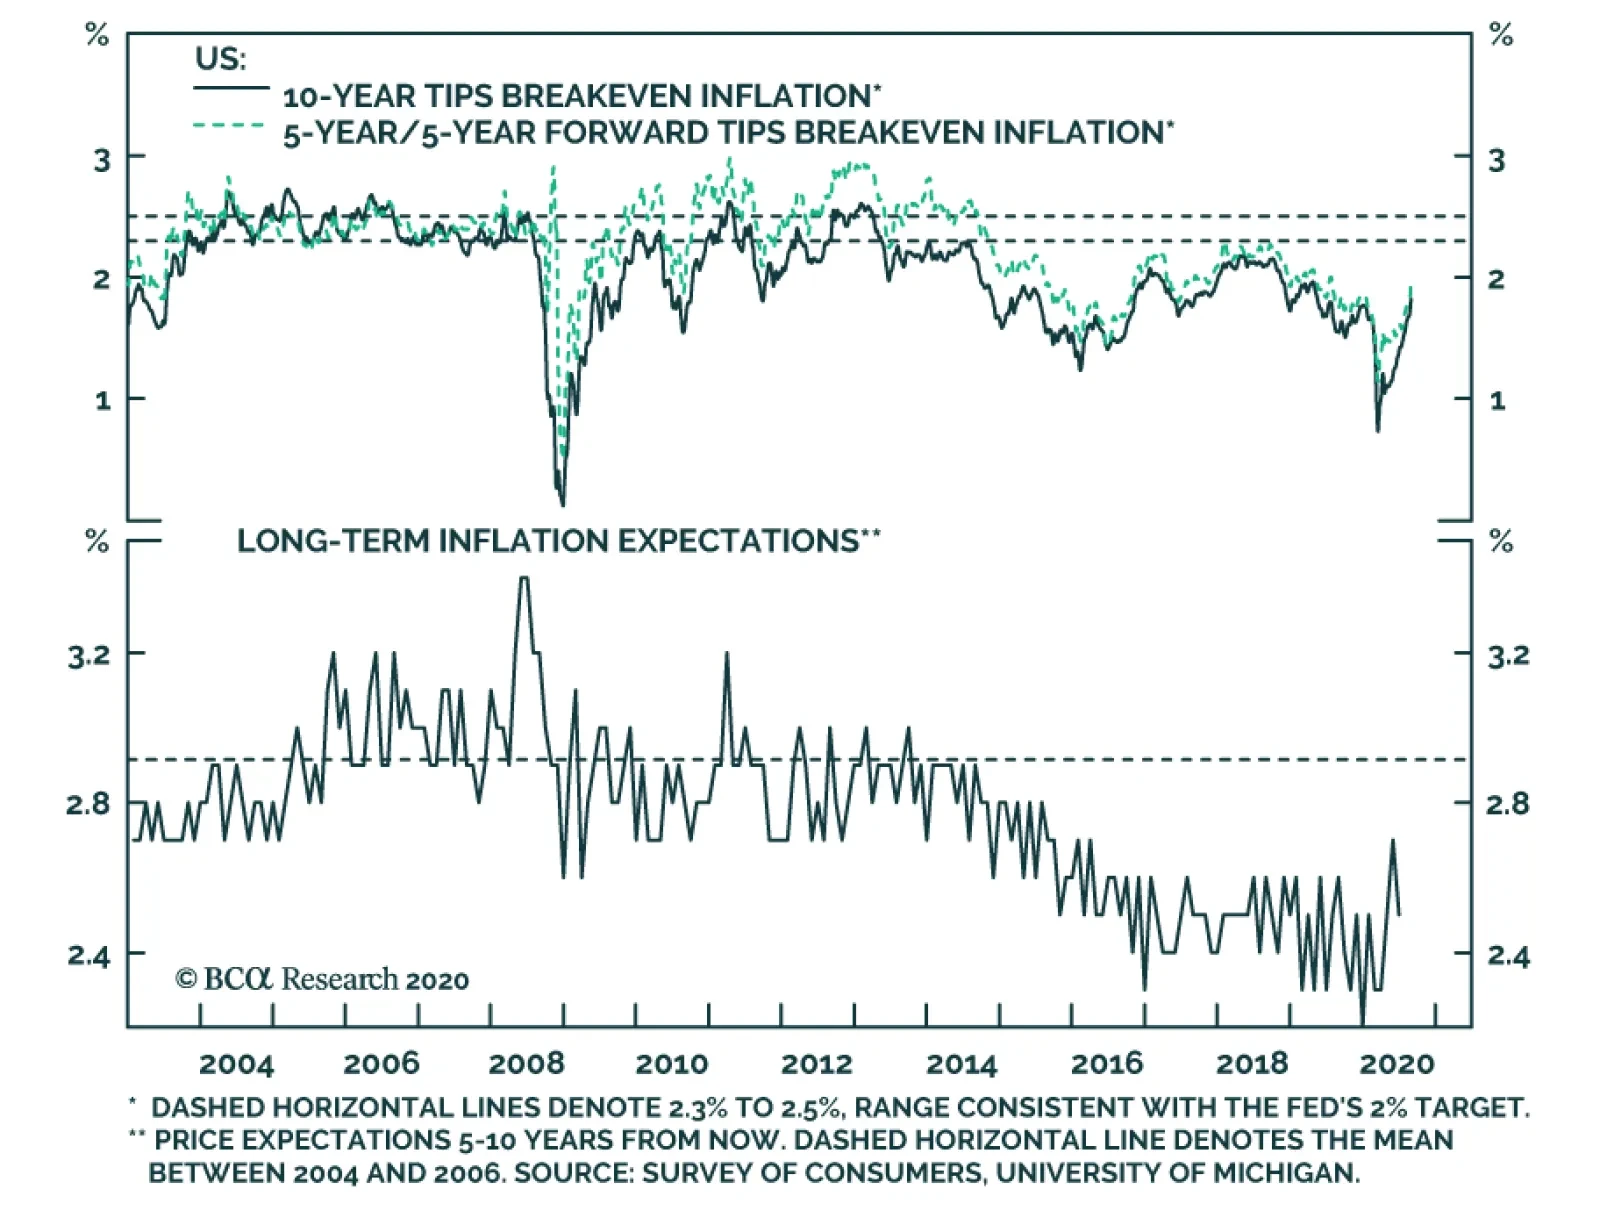
Highlights Bygones will no longer be bygones for the Fed when it comes to inflation, … : It has yet to define the parameters of its new approach, but the Fed is promising a sizable break with the past by adopting an average inflation target. … and it’s getting out of the business of pre-emptively tightening in response to a too-tight labor market: The Fed will still intervene to combat the effects of underemployment, but it’s done with trying to cool off a labor market that appears to be too strong. The dovish bias should be good for equities … : Over the last 60 years, large-cap US equities have performed considerably better when monetary policy is easy than they have when it is tight. … and it just might help workers: Tightening to prevent hot labor markets from getting too hot had the effect of making labor market strength self-limiting, circumscribing unions’ bargaining power. If the Fed follows its new plans, workers might benefit at bondholders’ expense. Feature At the Kansas City Fed’s annual Jackson Hole conference at the end of last month, Chair Powell took the opportunity to highlight the results of the Fed’s extended policy review. Though the announcement was short on details, the adjustments to the Fed’s longer-run aims should translate into a more accommodative monetary policy stance over the next several years. Promises made when inflation is moribund may be hard to keep when it begins to perk up, so it’s not written in stone that the Fed will stick to its guns when the backdrop changes, but the shifts in its approach could have meaningful impacts for investors and workers. For nearly five years, it's been the Fed's policy to lament past inflation shortfalls; ... From Inflation Targeting To Average Inflation Targeting1 The Fed may be approaching its 107th birthday, but it is still a relatively new institution practicing a relatively new discipline, and its policy goals and the ways it attempts to carry them out regularly shift. Congress gave the Fed its “dual mandate” in 1977 in a bill that spelled out three aims, “maximum employment, stable prices, and moderate long-term interest rates,” though the third has receded to the point of disappearing amidst a four-decade bond bull market. The dual mandate only entered common parlance in the mid-‘90s and the Federal Reserve Board did not explicitly mention “maximum employment” in its policy directives until 2010, after the FOMC first cited it in a post-meeting statement (itself a fairly new invention).2 ... going forward, it's pledging to do something to make up for them. The Fed only introduced an explicit inflation target in January 2012, a concept pioneered by the Reserve Bank of New Zealand in 1990. (It did so in its inaugural statement of longer-run goals and policy strategy, which it has since reviewed annually and adjusted as necessary.)3 When it first introduced an inflation target, the Fed said it was doing so to “help keep longer-term inflation expectations firmly anchored, thereby fostering price stability ... and enhancing [its] ability to promote maximum employment.” Long-run inflation expectations have fallen well below the bottom end of the 2.3-2.5% range consistent with the Fed’s 2% target (Chart 1). Describing its target as “symmetric,” which it began doing in January 2016 to make it clear that persistent shortfalls would be as unwelcome as persistent overshoots, has not helped. Inflation expectations ground higher for the first two symmetric years but ultimately backslid below their January 2016 level as measured inflation showed no signs of recovering. Chart 1Falling Short
Falling Short
Falling Short
The Fed is therefore upping the ante, going beyond expressing its concern about inflation shortfalls to pledging that they will be made up for in the future under a new strategy that condones corrective overshoots. It expressed its new intentions as follows: In order to anchor longer-term inflation expectations at [2 percent], the Committee seeks to achieve inflation that averages 2 percent over time, and therefore judges that, following periods when inflation has been running persistently below 2 percent, appropriate monetary policy will likely aim to achieve inflation moderately above 2 percent for some time.4 [Emphasis added] In other words, the Fed’s inflation target will no longer be fixed at 2%, and it will no longer be set in a purely forward-looking vacuum. Its target could now float above 2% for lengthy periods, depending on the recent history of realized inflation data. In meeting the price stability element of its mandate going forward, the Fed will be managing to something much more like a price level target than an annual inflation target. The upshot is that bygones will no longer be bygones when it comes to inflation undershoots; instead of forgetting past shortfalls, the Fed will actively seek to remediate them. The remediation aspect is a profound change, and it will presumably lead to greater policy accommodation over periods that have been preceded by inflation shortfalls. The Fed has apparently made this change to provoke a resetting of inflation expectations more in line with its aims, but long-run inflation expectations are principally a function of long-run trends in realized inflation. The 5-year/5-year forward CPI swap rate correlates much more closely with the 8-year rate of change in CPI inflation (Chart 2, top panel) than it does with the 1-year rate of change (Chart 2, bottom panel). Headline year-over-year inflation readings will therefore most likely have to exceed 2% for an extended stretch before long-term TIPS breakevens sustainably return to the target range our fixed income strategists judge to be compatible with an annualized 2% target. Chart 2Long-Run Inflation Expectations Are A Function Of Actual Long-Run Inflation
Long-Run Inflation Expectations Are A Function Of Actual Long-Run Inflation
Long-Run Inflation Expectations Are A Function Of Actual Long-Run Inflation
A New Take On The Full Employment Mandate The Fed also put some distance from the Phillips Curve framework that many investors had come to view with outright disdain.5 The Phillips Curve’s initial assertion that the unemployment rate and inflation were inversely related was debunked in the stagflationary ‘70s, but the view that too-low unemployment could presage inflation remains embedded in mainstream economic models. Chair Powell has repeatedly questioned that premise, as inflation remained persistently below target even after the unemployment rate had fallen a full percentage point below estimates of its natural rate. The Fed’s new statement formally swears off it, saying that policy will seek “to mitigate shortfalls of employment from [its] assessment of its maximum level,” where it previously aimed to mitigate all deviations from its estimated maximum level [Emphasis added]. The wording change suggests that the Fed has caught up to investors when it comes to being fed up with the Phillips Curve’s false signals. As our fixed income colleagues put it, the Fed had previously viewed a negative unemployment gap (unemployment below its estimate of NAIRU)6 as a signal that inflation was poised to accelerate. That view often led to premature tightening, contributing to the pattern of inflation target shortfalls. The Fed now says it will no longer overreact to signs of labor market overheating, waiting instead for potential wage pressure to show up in the actual inflation data before removing monetary accommodation. Its new one-sided employment reaction function (ease if the labor market is soft, stand pat if it seems to be tight) reinforces the idea that the Fed will have an accommodative bias well into the intermediate term. Equity Market Implications Monetary policy is hardly the only influence on equity prices, and it is not possible to assess its state precisely in real time. It would certainly appear to be easy now that the Fed returned to ZIRP in the blink of an eye after the pandemic spread to the US, but no one can always say with certainty in real time that policy is easy, tight or neutral because no one knows exactly what the neutral rate is at any moment. Using our own in-house estimate of the equilibrium rate (the fed funds rate that neither encourages nor discourages economic activity) to divide the monetary policy cycle into four phases based on the fed funds rate’s level and direction (Chart 3), however, the S&P 500 has exhibited a robust and enduring performance pattern. Chart 3The Fed Funds Rate Cycle
The Fed’s New Game Plan
The Fed’s New Game Plan
Over the 60 years covered by our equilibrium rate estimate, large-cap US equities have surged when policy was easy and run in place when it was tight (Table 1). Adjusted for inflation, they have posted juicy real returns when policy was easy but sapped investors’ wealth when policy was tight (Table 2). The significant return spread across easy and tight settings suggests that the state of monetary policy is an important contributor to equity returns and that our equilibrium estimate must be in the ballpark. Our practical takeaway is that investors should have a bias to overweight stocks in balanced portfolios when Fed policy is accommodative. That bias can be overridden by other factors, but we have found it to be a reliable starting point. The Fed's new one-sided employment reaction function (ease when employment falls below its estimated maximum level, but do nothing when it exceeds it) reinforces the accommodative leanings of average inflation targeting. Table 1A 9-Percentage-Point Nominal Return Gap ...
The Fed’s New Game Plan
The Fed’s New Game Plan
Table 2... And An 11-Percentage-Point Real Return Gap
The Fed’s New Game Plan
The Fed’s New Game Plan
Labor Market Implications To translate the natural-rate-of-unemployment concept into a graph-friendly format, let the unemployment gap equal the quantity (u – u*), where u is the reported unemployment rate and u* is NAIRU, as estimated by the Congressional Budget Office. When the unemployment gap is negative (u < u*), employment exceeds its maximum level and the labor market is tight. When the unemployment gap is positive (u > u*), employment falls short of its maximum level and the supply of labor exceeds the demand for it. An emphasis on promoting full employment over price stability favors labor over fixed income investors. The Phillips Curve’s shortcomings and the difficulty of accurately estimating the natural rate of unemployment in real time notwithstanding, wage growth is stronger when the labor market is tight and the unemployment gap is a good general proxy for the balance between labor supply and demand. Nominal and real earnings have grown faster when the unemployment rate has broken through NAIRU since the average hourly earnings series began to be compiled in 1964 (Chart 4). Broadly speaking, a negative unemployment gap is good for labor while a positive gap is bad for it. Chart 4Wages Rise More In Tight Labor Markets
Wages Rise More In Tight Labor Markets
Wages Rise More In Tight Labor Markets
From the perspective of the Fed’s dual mandate, then, labor benefits when the Fed places greater emphasis on promoting full employment and suffers it emphasizes price stability. Many factors have been cited as contributors to unions’ struggles over the last four decades,7 but monetary policy is not typically one of them. We would argue that it has played an underappreciated role, as unions’ golden years of the ‘50s, ‘60s and ‘70s coincided with the Fed’s hands-off approach to tight labor markets and their demise coincided with the Fed’s shift to leaning against them (Chart 5). From 1950 until Paul Volcker became Fed chair, the unemployment gap was negative in two out of every three quarters; since Volcker took over, it’s been negative in just one of three (Table 3). Chart 540 Years Of Removing The Punch Bowl Before Labor's Party Gets Going
40 Years Of Removing The Punch Bowl Before Labor's Party Gets Going
40 Years Of Removing The Punch Bowl Before Labor's Party Gets Going
Table 3The Volcker Divide
The Fed’s New Game Plan
The Fed’s New Game Plan
When it comes to a hot labor market, workers’ gains are bond owners’ losses. Prioritizing full employment over price stability works to the benefit of labor and debtors and to the detriment of capital and creditors. We can’t know the strength of the Fed’s new employment commitment until it’s tested by events, but if we take it at its word, four decades of policy that have favored bond owners are at risk of reversing. We reiterate our fixed income underweight over the tactical and cyclical timeframes. The equity impact is more nuanced. Compensation is far and away the largest component of corporate expenses and a policy to intervene only to mitigate employment shortfalls will compress profit margins. Tighter margins, however, should be offset by increased revenues as consumers have more money to spend. The shift in the Fed’s strategy is broadly labor-positive and capital-negative, but the ill effects for capital will be mostly borne by creditors and easy monetary policy has historically given equities a sizable boost. We reiterate our tactical equity equalweight and cyclical overweight. Doug Peta, CFA Chief US Investment Strategist dougp@bcaresearch.com Footnotes 1 The discussion of the Fed’s revised approach to achieving its price stability mandate, and the following section’s discussion of its full employment mandate, borrow heavily from our Global Fixed Income and US Bond Strategy colleagues’ joint September 1, 2020 Special Report, "A New Dawn For US Monetary Policy," available at usbs.bcaresearch.com. Those interested in a fuller discussion of the policy changes, and their implications for the bond market, are encouraged to review the original report. 2 Steelman, Aaron, "The Federal Reserve’s ‘Dual Mandate’: The Evolution of an Idea." Richmond Fed Economic Brief, December 2011, No. 11-12. Accessed September 1, 2020. 3 "Federal Reserve issues FOMC statement of longer-run goals and policy strategy," January 25, 2012. 4https://www.federalreserve.gov/monetarypolicy/guide-to-changes-in-statement-on-longer-run-goals-monetary-policy-strategy.htm 5 Please see the February 26, 2019 US Investment Strategy Special Report, "The Phillips Curve: Science Or Superstition?," available at usis.bcaresearch.com. 6 NAIRU stands for non-accelerating inflation rate of unemployment, also known as the natural rate of unemployment. 7 Our Labor Strikes Back series of Special Reports, January 13, 2020 "Labor Strikes Back, Part 1: An Investor’s Guide To US Labor History", January 20, 2020 "Labor Strikes Back, Part 2: Where Strikes Come From And Who Wins Them", and February 3, 2020 "Labor Strikes Back, Part 3: The Public-Approval Contest", discuss them in full. All available at usis.bcaresearch.com.
Highlights Stocks, particularly tech stocks, are technically overbought and highly vulnerable to a further correction. Nevertheless, investors should continue to overweight global equities relative to bonds on a 12-month horizon, while rotating equity allocations into cheaper sectors and regions. What should policymakers do if they wish to maximize growth and restore full employment? In the feature section of this report, we argue that the optimal course of action for most countries is to loosen fiscal policy until labor slack has been eliminated and the central bank’s inflation target has been met. Once this has been achieved, governments should trim the budget deficit to keep inflation from accelerating too much. What will policymakers actually do? While today’s budget deficits are smaller than what most economies need, they will ultimately prove to be too big once private sector demand recovers. The upshot is that inflation will increase by the middle of the decade, first in the US and then everywhere else. The secular bull market in equities will end only when central banks are forced to scramble to contain inflation. Fortunately, that day of reckoning is at least a few years away. Feature Apparently, Stocks Don’t Always Go Up After a relentless rally, stocks buckled under the pressure on Thursday. The MSCI All-Country World index lost 3%, the S&P 500 shed 3.5%, and the tech-heavy Nasdaq Composite plunged 5%. Two weeks ago, in a report titled “The Return Of Nasdog,” we argued that the leadership role was set to pivot away from tech and health care, as pandemic angst subsided and investors began to price in a recovery in the sectors of the stock market that had been crushed by lockdown measures. Chart 1A Weaker Dollar Is Generally Associated With Non-US Equity Outperformance, But Not Since The Covid Crash
A Weaker Dollar Is Generally Associated With Non-US Equity Outperformance, But Not Since The Covid Crash
A Weaker Dollar Is Generally Associated With Non-US Equity Outperformance, But Not Since The Covid Crash
Historically, non-US equities have outperformed their US peers when the dollar has weakened (Chart 1). This relationship broke down this year because of the outsized weight that tech and health care command in US indices. If the relative performance of tech and health care stocks peaks over the coming weeks, this should translate into a clear outperformance for non-US stock markets. Value stocks should also start outperforming growth stocks. Stock market leadership changes often occur within the context of broad-based equity corrections. Our near-term view on stocks, as illustrated in the view matrix at the end of this report, is more cautious than our 12-month view. Thus, we would not be surprised if the major indices sell off over the coming weeks, with tech stocks leading the way down. The same sort of technical factors that amplified the move up in stocks over the past few weeks could exacerbate the move down. Most notably, so-called delta hedge option strategies, in which an investor sells calls and hedges the risk by purchasing the underlying stock, can create a self-reinforcing feedback loop where rising call prices force investors to buy more shares, leading to even higher call prices. Once the stock market starts falling, the process goes into reverse. Nevertheless, we do not expect tech stocks to suffer the sort of crash they experienced in 2000. Tech valuations are not as stretched as they were back then, earnings growth is stronger, and balance sheets are much healthier. Moreover, unlike in 2000, when the Fed lifted rates to as high as 6.5% in May, monetary policy is at no risk of turning hawkish. All this suggests that tech stocks are more likely to go sideways than down over a 12-month horizon (albeit in a fairly volatile manner). Investors should continue to overweight global equities relative to bonds on a 12-month horizon, while tilting equity allocations towards cheaper sectors and regions. Feature: Should Versus Will Investors want to know what the future will bring. As such, our primary interest at BCA Research is in predicting what policymakers will do rather than what they should do. Sometimes, however, it is useful to ask the “should” question since the answer may shape one’s view on the “will” question. This is especially the case when a particular set of goals is aligned with both the incentives and constraints that policymakers face. With that in mind, let us ask what the optimal mix of monetary and fiscal policy should be, assuming that policymakers have the goal of maximizing growth and moving the economy towards full employment. As we argue below, this is a relevant question to ask not because we necessarily share this goal – our personal value judgments are besides the point here – but because most policymakers think this is the correct goal. Propping Up Demand Chart 2Labor Markets In Developed Economies Have Rarely Overheated Over The Past Few Decades
Labor Markets In Developed Economies Have Rarely Overheated Over The Past Few Decades
Labor Markets In Developed Economies Have Rarely Overheated Over The Past Few Decades
Maintaining full employment requires that spending match the economy’s productive capacity. In theory, this should not be a difficult objective to achieve. After all, people like to spend. Increasing demand should be easy. The hard part should be raising supply. In practice, it has not worked out that way. Even before the pandemic, unemployment rates rarely fell below their full employment level across the G7 economies (Chart 2). High Unemployment: Cyclical Or Structural? Some will argue that surplus unemployment is necessary to shift workers from sectors of the economy where they are not needed to sectors where they are. The failure to facilitate such resource reallocation could, it is alleged, stymie long-term growth. This is largely a spurious claim. As Chart 3 shows, there is always a huge amount of churn in the labor market. In 2019, a year in which total employment rose by 2.1 million, a total of 70 million people were hired in the US compared to 64 million who quit or lost their jobs. In fact, labor market churn tends to decrease during recessions as workers become reluctant to quit their jobs. Chart 3Labor Market Turnover Tends To Increase During Expansions
Labor Market Turnover Tends To Increase During Expansions
Labor Market Turnover Tends To Increase During Expansions
Chart 4Residential Construction Accounted For Less Than 20% Of The Job Losses During The Great Recession
The Outlook For Monetary And Fiscal Policy: What Should Be Done Vs. What Will Be Done
The Outlook For Monetary And Fiscal Policy: What Should Be Done Vs. What Will Be Done
Far from reflecting structural factors, the vast majority of the rise in joblessness during economic downturns is gratuitous in nature. For example, more than 80% of the jobs lost during the Great Recession were outside the residential real estate sector (Chart 4). Moreover, employment growth is highly correlated with investment spending (Chart 5). The easiest way to induce firms to boost capex – and, in the process, augment the economy’s productive capacity – is to adopt policies that raise overall employment. A stronger labor market will generate more demand for goods and services. It will also make labor more expensive in relation to capital, thereby incentivizing labor-saving capital investment. Chart 5Employment Growth And Investment Spending Go Hand-In-Hand
Employment Growth And Investment Spending Go Hand-In-Hand
Employment Growth And Investment Spending Go Hand-In-Hand
Today, unemployment is elevated once again. As was the case during prior recessions, some workers will need to transition from sectors of the economy that will be slow to recover (retail, travel, and hospitality, for example) to sectors where jobs will be more plentiful. The risk is that there will not be enough job vacancies in the latter sectors to compensate for job losses in the former. The fact that permanent job losses have been creeping higher in the US over the past few months, even as temporary layoffs have come down, is evidence that such an outcome is a clear and present danger (Chart 6). Chart 6Many Are Returning To Work, But The Number Of Permanent Layoffs Is Slowly Increasing As Well
Many Are Returning To Work, But The Number Of Permanent Layoffs Is Slowly Increasing As Well
Many Are Returning To Work, But The Number Of Permanent Layoffs Is Slowly Increasing As Well
Central Banks Can’t Do It All One does not need to refill a leaky bucket through the same hole the water escaped. As long as there is enough demand throughout the economy, workers who lose their jobs in declining sectors will eventually find new jobs in other sectors. So why has the bucket seemed chronically short of water in recent years? The answer is that monetary policy has been tasked to do more than it is realistically capable of achieving. Monetary policy operates with “long and variable lags.” When unemployment rises, the best that central banks can do is cut interest rates and hope that the more interest-rate sensitive parts of the economy eventually perk up. If the interest-rate sensitive sectors of the economy are tapped out, just as housing was following the financial crisis, or policy rates are near their lower bound, as they are now, monetary policy will be even less potent than usual. The Role Of Fiscal Policy This is where fiscal policy ought to fill the void. Even if monetary policy is exhausted, governments can cut taxes, raise transfers to households and businesses, or increase direct spending on goods and services. The extent to which fiscal policy is loosened should not be preordained. Rather, it should simply reflect the state of the economy. There is no limit to how much money governments can transfer to the public. In fact, one can easily imagine a system where governments cut taxes and increase transfer payments whenever unemployment moves up. Such a powerful system of automatic stabilizers would go a long way towards keeping the economy on an even keel. Why have governments been reluctant to embrace such a system? One key reason is that such a system would produce open-ended budget deficits. That would not be much of a problem if the red ink lasted just a few years, but what if the need for large budget deficits did not go away? The Japanese Example Consider the case of Japan. Starting in the early 1990s, Japan’s private sector became a chronic net saver, as demand for credit evaporated amid savage deleveraging (Chart 7). In order to keep the economy from falling into a full-blown depression, the government started to run continual budget deficits. Effectively, the government had to soak up persistent private savings with its own dissavings. As a result, the debt-to-GDP ratio ballooned from 64% in 1991 to 237% by 2019 and is set to rise further this year. Many people predicted a debt crisis would engulf Japan. Takeshi Fujimaki, a former banker turned politician, has been forecasting a debt crisis for more than two decades.In 2010, financial pundit John Mauldin described Japan as a “bug in search of a windshield.” He reckoned that the country would “implode within the next two-to-three years,” with the yen falling to 300 against the dollar. Kyle Bass has made similarly dire predictions.1 How was Japan able to escape what seemed like certain doom? The answer is that the same factor that necessitated persistent budget deficits, namely excess private-sector savings, also allowed interest rates to fall. Despite a rising debt-to-GDP ratio, government interest payments have been trending lower over time (Chart 8). Today, the government actually earns more interest than it pays because two-thirds of all Japanese debt bears negative yields. Chart 7The Japanese Government Runs Persistent Budget Deficits Amid The Private Sector's Desire To Save
The Japanese Government Runs Persistent Budget Deficits Amid The Private Sector's Desire To Save
The Japanese Government Runs Persistent Budget Deficits Amid The Private Sector's Desire To Save
Chart 8Japan: Ballooning Debt And Declining Interest Payments
Japan: Ballooning Debt And Declining Interest Payments
Japan: Ballooning Debt And Declining Interest Payments
If anything, Japan erred in not easing fiscal policy by enough. Had Japan run even larger budget deficits, deflationary pressures would have been less acute, and as a result, real interest rates would have fallen even more than they actually did (Chart 9). Chart 9Japanese Real Yields Are Higher Than In Many Other Major Economies
Japanese Real Yields Are Higher Than In Many Other Major Economies
Japanese Real Yields Are Higher Than In Many Other Major Economies
A Fiscal Free Lunch? The standard equation for public debt sustainability says that as long as the government’s borrowing rate is below the growth rate of the economy, the debt-to-GDP ratio will converge to a stable level no matter how large the fiscal deficit happens to be (See Box 1 for details). The caveat is that this “stable” debt-to-GDP ratio could turn out to be quite high. For example, if the government wants to run a primary budget deficit of 10% of GDP indefinitely, and GDP growth exceeds the real interest rate by two percentage points, the debt-to-GDP ratio will eventually converge to 500%. If interest rates were guaranteed to stay at zero forever, even a debt-to-GDP ratio of 500% would be no cause for alarm. But, of course, there is no such guarantee. For a country such as Italy, letting debt levels soar into the stratosphere would be highly risky. Countries that do not possess a central bank capable of acting as a lender of last resort could find themselves in a vicious spiral where rising bond yields raise the probability of default, leading to even higher bond yields (Chart 10). Chart 10Multiple Equilibria In The Debt Market Are Possible Without A Lender Of Last Resort
The Outlook For Monetary And Fiscal Policy: What Should Be Done Vs. What Will Be Done
The Outlook For Monetary And Fiscal Policy: What Should Be Done Vs. What Will Be Done
For countries that do issue debt in their own currencies, default risk is less of a problem since their central banks can set short-term rates at any level they want and, if necessary, target long-term rates with yield curve control strategies. Nevertheless, even these countries would face difficult choices if the excess savings that permitted interest rates to stay low disappeared. A decline in national savings would raise the neutral rate of interest (the rate which equalizes aggregate demand with aggregate supply). If policy rates remained unchanged, the neutral rate of interest would end up being higher than policy rates, which would eventually cause the economy to overheat. At that point, policymakers would have two options: First, they could simply let the economy overheat such that inflation rises. If inflation is very low to begin with, modestly higher inflation would be welcome, as it would make the zero lower bound constraint less of a problem.2 Higher inflation would also speed up the pace of nominal income growth, leading to a lower debt-to-GDP ratio. That said, if inflation were to rise too much, it could have destabilizing effects on the economy. Second, they could tighten fiscal policy. A smaller budget deficit would add to national savings, while giving the government more resources to pay back debt. Tighter fiscal policy would also subtract from aggregate demand, thus reducing the neutral rate of interest. This would diminish the need for central banks to raise rates in the first place. Putting it all together, the optimal course of action, at least for countries that can issue debt in their own currencies, is to loosen fiscal policy until full employment has been restored and the central bank’s inflation target has been met. Once this has been achieved, the government should trim the budget deficit to keep inflation from getting out of hand. What Will Be Done Okay, so much for the idealized strategy. What will actually happen? As was the case following the Great Recession, there is a risk that some countries will tighten fiscal policy prematurely, causing the economic recovery from the pandemic to be slower than it would otherwise be. In the US, this is already happening. Federal emergency unemployment benefits under the CARES Act expired at the end of July; funding for the small business paycheck protection program has run out; and state and local governments are facing a severe cash crunch. BCA Research’s Geopolitical Strategy team, led by Matt Gertken, expects the logjam in Washington to be resolved in September. Most voters, including the majority of Republicans, want emergency unemployment benefits to be restored (Table 1). Additional fiscal stimulus would cushion the economy in the lead up to the November election, which would arguably benefit President Trump and the Republican party. Hence, there is a good chance that Congressional Republicans will accede to a fairly generous fiscal package. Table 1The Majority Continues To Support Expanded Unemployment Insurance
The Outlook For Monetary And Fiscal Policy: What Should Be Done Vs. What Will Be Done
The Outlook For Monetary And Fiscal Policy: What Should Be Done Vs. What Will Be Done
Globally, the prevalence of negative real rates (and in some cases, negative nominal rates) should incentivize governments to run larger budget deficits than they have in the past. Increasing political populism will amplify this trend. Thus, despite some near-term hiccups, fiscal policy will remain highly stimulative. The Inflation End Game Chart 11The Ratio Of Workers-To-Consumers Is Now Falling
The Ratio Of Workers-To-Consumers Is Now Falling
The Ratio Of Workers-To-Consumers Is Now Falling
What will happen when unemployment rates return to their pre-pandemic level in three or four years? Will governments tighten fiscal policy to prevent overheating or will they let inflation run loose? Our guess is that they will let inflation rise. National savings can shrink either because the private sector is spending more or because the private sector is earning less. Looking out beyond the next few years, the latter is more likely than the former. This is because the ratio of workers-to-consumers globally will decline sharply over the coming decade as more baby boomers exit the labor force (Chart 11). Spending will decelerate, but output and income will decelerate even more by virtue of this demographic reality. It is difficult to boost tax revenue in an environment of slowing real income growth. If output falls in relation to spending, inflation will rise. At least initially, central banks will welcome the burst of inflation. They have been trying to push up inflation for years. Past inflation undershoots will be used to justify future inflation overshoots, a doctrine the Fed officially blessed at the virtual Jackson Hole symposium last week. Other central banks will be loath to raise rates if the Fed stands pat for fear that their own currencies will surge against the US dollar. The end result is that inflation will increase, first in the US and then everywhere else. A quick glance at long-term inflation expectations suggests that markets do not discount this risk at all (Chart 12). What does all this mean for investors? For the next few years, the combination of ample fiscal stimulus and easy monetary policy will foster a supportive backdrop for global equities. Despite the rally in stocks since March, the global equity risk premium remains quite elevated, especially outside the US (Chart 13). Investors should remain overweight global stocks versus bonds on a 12-month horizon. Chart 12Investors Believe Inflation Will Stay Muted In The Long Term
Investors Believe Inflation Will Stay Muted In The Long Term
Investors Believe Inflation Will Stay Muted In The Long Term
Chart 13Non-US Stocks Look Cheaper Than Their US Peers In Both Absolute Terms And In Relation To Bond Yields
Non-US Stocks Look Cheaper Than Their US Peers In Both Absolute Terms And In Relation To Bond Yields
Non-US Stocks Look Cheaper Than Their US Peers In Both Absolute Terms And In Relation To Bond Yields
Looking further out, the secular bull market in equities will end only when central banks are forced to scramble to contain inflation. Fortunately, that day of reckoning is at least a few years away. Peter Berezin Chief Global Strategist peterb@bcaresearch.com Footnotes 1 Ben McLannahan, “Japanese Bonds Defy the Debt Doomsters,” Financial Times, dated August 8, 2012; Mariko Ishikawa, Kenneth Kohn and Yumi Ikeda, “Soros Adviser Turned Lawmaker Sees Crisis by 2020,” Bloomberg News, dated September 27, 2013; and Dan McCrum, “Kyle Bass bets on full-blown Japan crisis,” Financial Times, May 21, 2013. 2 For example, if inflation is 3%, a central bank could produce a real rate of -3% by bringing policy rates down to zero. In contrast, if inflation is only 1%, the lowest that real rates could fall is -1%, which may not be stimulative enough for the economy. Box 1The Arithmetic Of Debt Sustainability
The Outlook For Monetary And Fiscal Policy: What Should Be Done Vs. What Will Be Done
The Outlook For Monetary And Fiscal Policy: What Should Be Done Vs. What Will Be Done
Global Investment Strategy View Matrix
The Outlook For Monetary And Fiscal Policy: What Should Be Done Vs. What Will Be Done
The Outlook For Monetary And Fiscal Policy: What Should Be Done Vs. What Will Be Done
Current MacroQuant Model Scores
The Outlook For Monetary And Fiscal Policy: What Should Be Done Vs. What Will Be Done
The Outlook For Monetary And Fiscal Policy: What Should Be Done Vs. What Will Be Done
BCA Research’s Global Fixed Income Strategy & US Bond Strategy service highlights that the official shift to an average inflation targeting regime represents a massive structural break relative to how the Fed conducted monetary policy in the past. The…
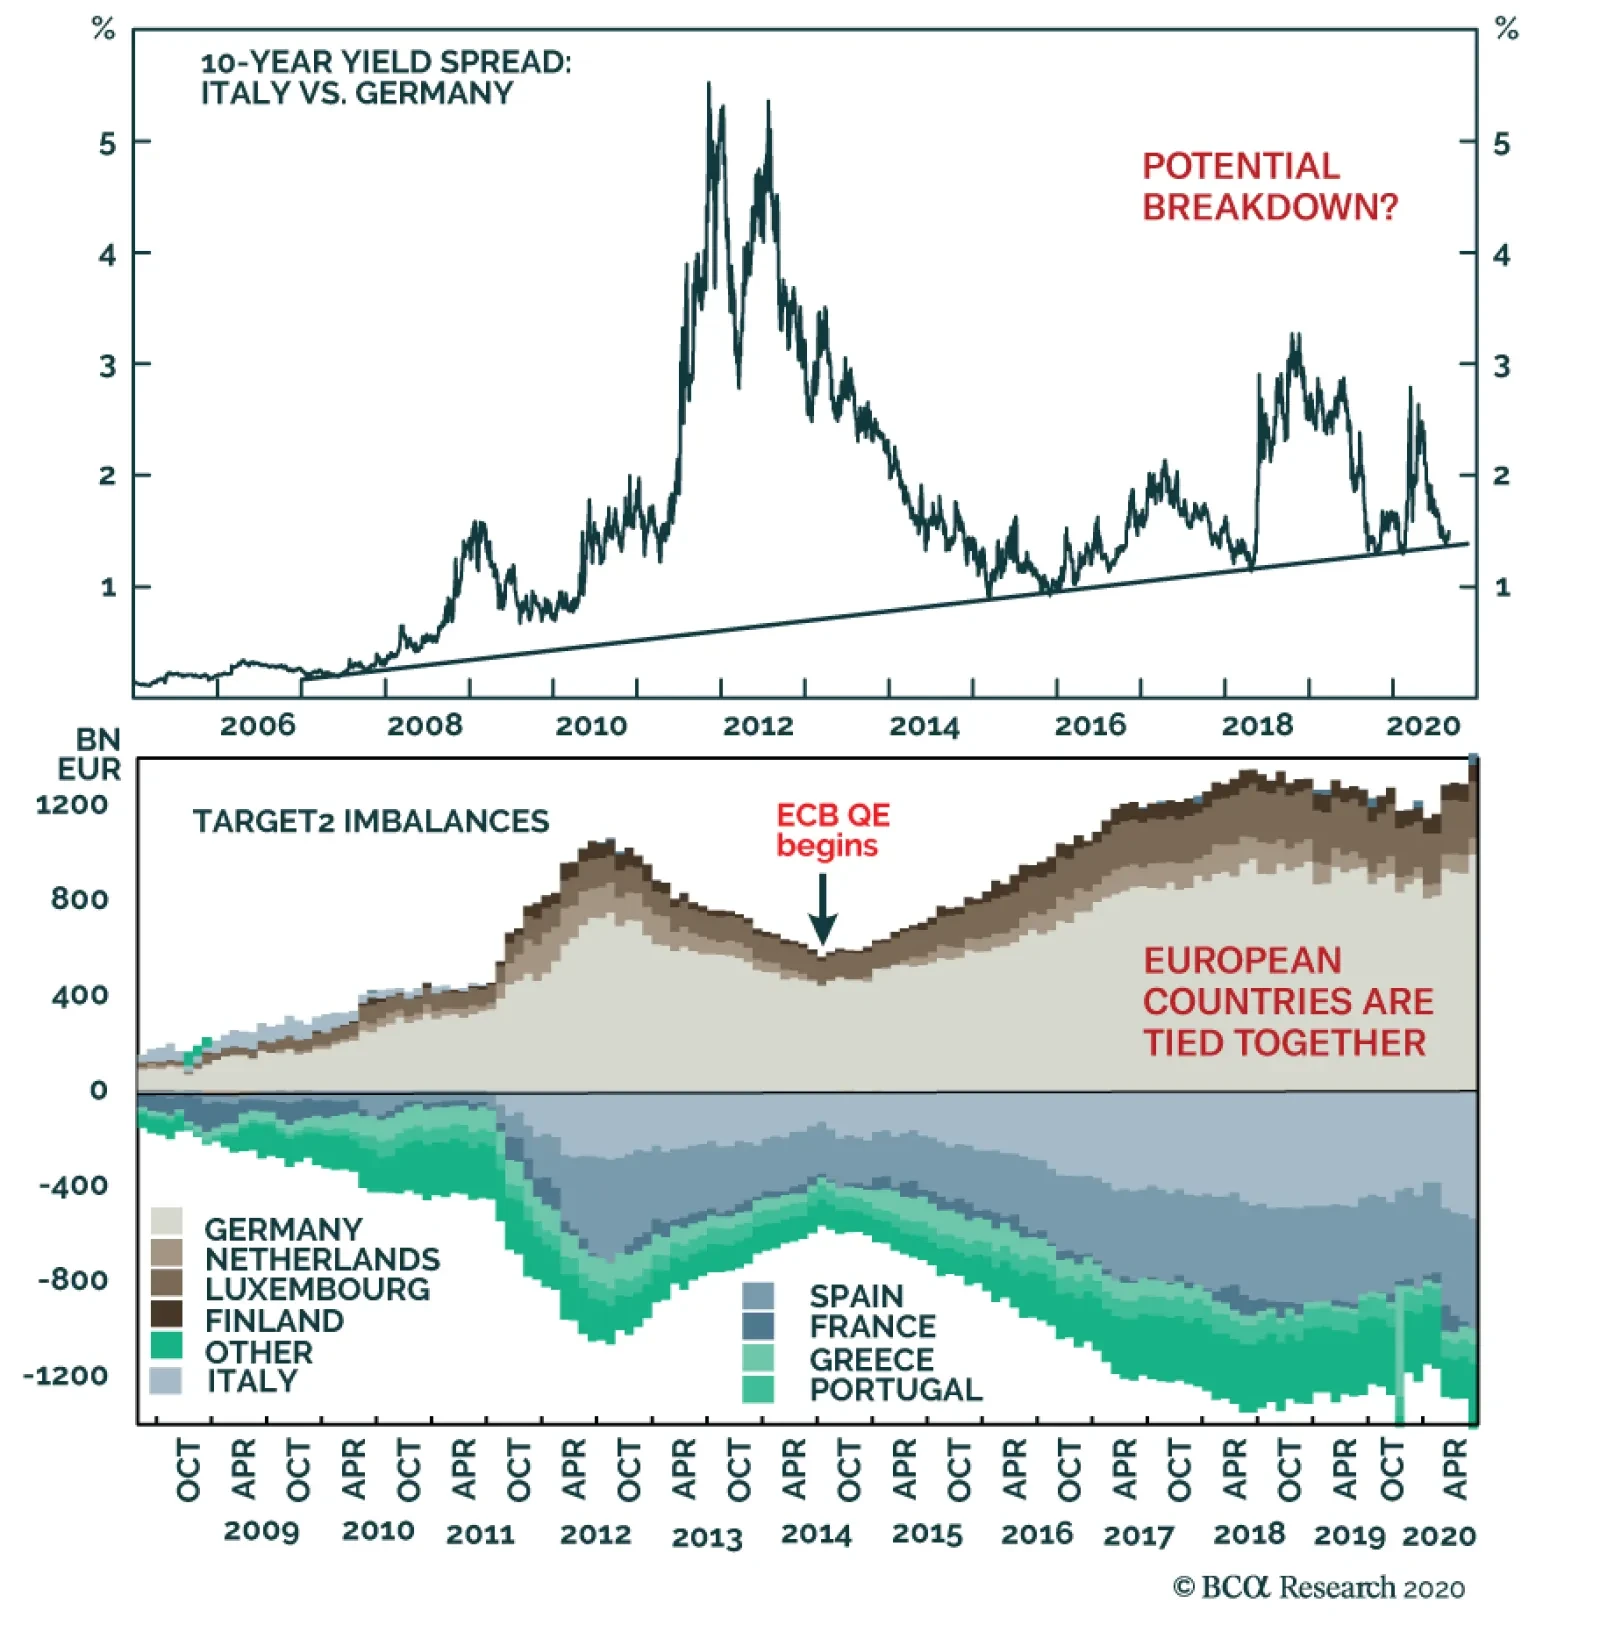
The European Central Bank has little scope to push German, French or Dutch yields much lower from current levels, especially as markets are already convinced that the ECB will not be able to raise interest rates for many years. However, this does not mean…
Recommended Allocation
Monthly Portfolio Update: Can Monetary Policy Alone Propel The Market?
Monthly Portfolio Update: Can Monetary Policy Alone Propel The Market?
Chart 1Only Internet Stocks Have Kept On Rising
Only Internet Stocks Have Kept On Rising
Only Internet Stocks Have Kept On Rising
It has been a very strange bull market. Although global equities are up 52% since their bottom on March 23rd, the rally has been limited largely to internet-related stocks. Excluding the three sectors (IT, Consumer Discretionary, and Communications) which house the internet names, equities have moved only sideways since May (Chart 1). Moreover, the rally comes amid sporadic serious new outbreaks of COVID-19 cases, most recently in Europe (Chart 2). Fears of the pandemic and much-reduced business activity in leisure-related industries have caused consumer confidence to diverge from the stock market in an unprecedented way (Chart 3). Chart 2New Outbreaks Of COVID-19 In Europe
New Outbreaks Of COVID-19 In Europe
New Outbreaks Of COVID-19 In Europe
Chart 3Why Are Stocks Rising When Consumers Are So Wary?
Why Are Stocks Rising When Consumers Are So Wary?
Why Are Stocks Rising When Consumers Are So Wary?
The only explanation for these phenomena is the unprecedented amount of monetary stimulus, which is causing excess liquidity to flow into risk assets. Since March, the balance-sheets of major central banks have increased by $7 trillion (Chart 4), and M2 money supply growth has soared (Chart 5). Chart 4Central Banks Have Grown Their Balance-Sheets...
Central Banks Have Grown Their Balance-Sheets...
Central Banks Have Grown Their Balance-Sheets...
Chart 5...Leading To A Big Rise in Money Growth
...Leading To A Big Rise in Money Growth
...Leading To A Big Rise in Money Growth
Moreover, the Fed’s new strategic framework announced in late August represents a commitment to keep monetary policy loose even when the economy begins to overheat. The Fed will (1) target 2% inflation on average over time which means that, after a period of low inflation, it will “aim to achieve inflation moderately above 2 percent for some time”; and (2) treat its employment mandate as asymmetrical, so that when employment is below potential the Fed will be accommodative, but that a rise in employment above its “maximum level” will not necessarily trigger tightening. Historically the Fed has raised rates when unemployment approached its natural rate (Chart 6). The new policy implies it will no longer do so. The aim of the policy is to raise inflation expectations which have become unanchored, with headline PCE inflation above the Fed’s 2% target for only 14 out of 102 months since the target was introduced in February 2012 (Chart 6, panel 3). Chart 6The Fed's Behavior Will Be Different In Future
The Fed's Behavior Will Be Different In Future
The Fed's Behavior Will Be Different In Future
Chart 7More Permanent Job Losses To Come
More Permanent Job Losses To Come
More Permanent Job Losses To Come
This commitment to easier monetary policy for longer will certainly help risk assets. But will it be enough? The global economic environment remains weak. Permanent job losses continue to increase, as workers initially put on furlough or dismissed temporarily, are fired (Chart 7). A second wave of COVID-19 cases in the Northern Hemisphere winter would worsen the situation. While central banks everywhere remain committed to aggressive policy, fiscal policy decision-makers are getting cold feet, with the UK’s wage-replacement scheme due to end in October, and government support in the US set to decline absent a big new fiscal package agreed by Congress (Chart 8). Credit risks are beginning to emerge, with bankruptcies surging (Chart 9), and mortgage delinquencies starting to rise (Chart 10). As a result, banks are becoming significantly more reluctant to lend (Chart 11). Chart 8Fiscal Support Is Starting To Slide
Fiscal Support Is Starting To Slide
Fiscal Support Is Starting To Slide
Chart 9Bankruptcies Are Surging…
Monthly Portfolio Update: Can Monetary Policy Alone Propel The Market?
Monthly Portfolio Update: Can Monetary Policy Alone Propel The Market?
Chart 10...Along With Mortgage Delinquencies
...Along With Mortgage Delinquencies
...Along With Mortgage Delinquencies
Chart 11Banks Turning Increasingly Cautious
Banks Turning Increasingly Cautious
Banks Turning Increasingly Cautious
To those concerns, we should add political risk ahead of the US presidential election. President Trump is probably not as far behind as the 7-percentage point gap in opinion polls suggests: After the Republican National Convention, online betting sites give him a 46% probability of being reelected (Chart 12). Over the next two months, he could be aggressive in foreign policy, particularly towards China. A disputed election is not unlikely. Investors might be wise to hedge against that possibility: BCA Research’s Geopolitical service recommends buying December VIX futures, which are still cheaply priced, and selling January VIX futures (Chart 13). 1 Chart 12Trump Could Still Pull It Off
Trump Could Still Pull It Off
Trump Could Still Pull It Off
Chart 13Hedge Against A Disputed Election Result
Monthly Portfolio Update: Can Monetary Policy Alone Propel The Market?
Monthly Portfolio Update: Can Monetary Policy Alone Propel The Market?
Given the power of monetary stimulus, we are reluctant to bet against equities – not least since the yield on fixed-incomes assets is so low. Nonetheless, we see the risk of a sharp correction over the coming six months, driven by a second pandemic wave, a renewed downturn in the global economy, or political events. We continue to recommend, therefore, only a neutral position on global equities. We would hold a large overweight in cash, to keep powder dry for when a better buying opportunity for risk assets arises. But a warning: The long-run return from all asset classes will be poor. The global bond index is unlikely to produce a nominal return much above zero over the coming decade. While equities look more attractive, our valuation indicator points to a nominal annual return of only around 3% (Chart 14). For the US, valuation suggests a return of zero. Investors will need to become more realistic about their return assumptions. The 7% annual return still assumed by the average US pension fund might have made sense when the yield on BBB-rated corporate bonds was 8%, but it no longer does when it has fallen to 2.3% (Chart 15). Chart 14Long-Term Equity Returns Will Be Poor
Long-Term Equity Returns Will Be Poor
Long-Term Equity Returns Will Be Poor
Chart 15Investors' Return Assumptions Are Unrealistic
Investors' Return Assumptions Are Unrealistic
Investors' Return Assumptions Are Unrealistic
Chart 16Value Sectors' Profits Have Been Terrible
Value Sectors' Profits Have Been Terrible
Value Sectors' Profits Have Been Terrible
Equities: The most vigorous debate among BCA Research strategists currently is over whether growth stocks will continue to outperform, or whether value will take over leadership. The Global Asset Allocation service is on the side of growth. The poor performance of value stocks (concentrated in Financials, Energy, and Materials) is explained by the structural decline in their profits for the past 12 years (Chart 16). With the yield curve unlikely to steepen and non-performing loans set to rise, we do not see Financials’ earnings recovering. China’s economic shifts represent a long-term headwind for Materials. Internet stocks are expensively valued, but we do not see them underperforming until (1) their earnings’ growth slows sharply, (2) regulation on them is significantly tightened, or (3) long-term bond yields rise, lowering the NPV of their future earnings. This view drives our Overweight on US equities versus Europe and Japan. US stocks have continued to outperform even in the risk-on rally since March (Chart 17). We are a little more enthusiastic (with a Neutral recommendation) about Emerging Market stocks, which are very cheaply valued (Chart 18). Chart 17US Stocks Have Outperformed Even In A Risk-On Market
US Stocks Have Outperformed Even In A Risk-On Market
US Stocks Have Outperformed Even In A Risk-On Market
Chart 18EM Stocks Are Cheap
EM Stocks Are Cheap
EM Stocks Are Cheap
Chart 19Short USD Is Now A Consensus Trade
Monthly Portfolio Update: Can Monetary Policy Alone Propel The Market?
Monthly Portfolio Update: Can Monetary Policy Alone Propel The Market?
Currencies: The US dollar has depreciated by 10% since mid-March. Over the next 12 months, the trend for the USD is likely to continue to be down. The new Fed policy emphasizes that real rates will stay low, and US inflation will probably be higher than in other developed economies. Nonetheless, short-USD/long-euro positions have become consensus (Chart 19) and, given the safe-haven nature of the dollar, a period of risk-off could push the dollar back up temporarily. Chart 20IG Spreads Are No Longer Attractive
Investment Grade Breakeven Spreads IG Spreads Are No Longer Attractive
Investment Grade Breakeven Spreads IG Spreads Are No Longer Attractive
Fixed Income: We don’t expect to see a sustained rise in nominal US Treasury yields, despite the Fed’s new monetary policy framework. The Fed has an implicit yield curve control policy, and would react if yields showed signs of rising significantly. TIPS breakevens should eventually rise further to reflect the likelihood of higher inflation in the longer term, though the recent sharp rise in inflation (core CPI rose by 0.6% month-on-month in July, the largest increase since 1991) will likely subside and so the upside for breakeven yields might be limited over the next six months. We are becoming a little more cautious on credit. Investment-grade spreads are now close to historic lows and so returns are likely to be limited (Chart 20). We lower our recommendation to Neutral. Ba-rated bonds still offer attractive yields and are supported by Fed purchases. But we would not go further down the credit curve, and so stay Neutral on high yield. This by definition means that we must also be Neutral within fixed income on government bonds, which is compatible with our view that rates will not rise much. Note, though, that we remain Underweight the fixed-income asset class overall, but no longer have a preference for spread product within it. One exception is EM dollar-denominated debt, both sovereign and corporate, which offers spreads that are attractive in a world of low returns from fixed income. Chart 21Crude Prices Can Rise Further As Demand Recovers
Crude Prices Can Rise Further As Demand Recovers
Crude Prices Can Rise Further As Demand Recovers
Commodities: Industrial metals prices have further to run up, as China continues its credit stimulus, which should lead to a rise in infrastructure investment and increased imports of commodities. The outlook for crude oil will be dominated by the demand side: OPEC forecasts demand destruction this year of 9 million barrels per day (compared to consensus expectations of 8 million) and so will be cautious about loosening its supply constraints. Demand should be boosted by increased driving, as people avoid using public transport for commuting and airlines for vacations. Based on a robust demand forecast (Chart 21), BCA Research’s energy strategists see Brent crude stable at around current levels through to the end of 2020 but averaging $65 a barrel next year. Garry Evans, Senior Vice President Global Asset Allocation garry@bcaresearch.com Footnotes 1 Please see Geopolitical Strategy Special Report, “What Is The Risk Of A Contested US Election?” dated July 27, 2020. GAA Asset Allocation
Highlights Fed Policy Changes: The official shift to an average inflation targeting regime represents a massive structural break relative to how the Fed conducted monetary policy in the past. The main takeaway for investors should be that inflation expectations will carry more weight than ever in the Fed’s thinking, with far less emphasis on estimated measures like the output gap. Investment Implications: The Fed’s new policy framework supports our current US fixed income recommendations: a neutral duration stance; overweighting TIPS versus nominal US Treasuries; positioning for real yield curve steepeners; and overweighting US spread product most directly supported by the Fed’s balance sheet (i.e. investment grade corporates and Ba-rated high-yield). Feature The pandemic forced the Federal Reserve to move its annual Jackson Hole Economic Policy Symposium online this year. That change deprived policymakers of a late-August vacation in the mountains of Wyoming, but offered the public a rare glimpse at the full proceedings live on YouTube.1 Federal Reserve Chairman Jerome Powell took advantage of that larger audience to announce significant changes to the Fed’s Statement on Longer-Run Goals and Monetary Policy Strategy. Though many of the basic elements of the new strategy were well telegraphed in advance, the adjustments are hugely significant and will shape the conduct of US – and, potentially, global - monetary policy for years to come. This Special Report presents the most important takeaways – and fixed income investment implications - from the Fed’s new approach to setting monetary policy. Say Hello To Average Inflation Targeting The most significant change has to do with how the Fed defines its price stability mandate. In its old Statement, the Fed defined its 2% inflation target as “symmetrical”, meaning that the Fed would be equally concerned if inflation were running persistently above or below the target. In the Fed’s words, communicating this symmetry was enough to “keep longer-term inflation expectations firmly anchored.” The Fed now believes that a more aggressive approach is required to keep inflation expectations anchored. The new Statement reads: In order to anchor longer-term inflation expectations at [2 percent], the Committee seeks to achieve inflation that averages 2 percent over time, and therefore judges that, following periods when inflation has been running persistently below 2 percent, appropriate monetary policy will likely aim to achieve inflation moderately above 2 percent for some time.2 In other words, the Fed’s 2% inflation target is no longer purely forward-looking. It is now dependent on the history of realized US inflation, and thus is now much more like a price level target than an inflation target. We will know that the Fed has seen enough inflation overshooting when long-term expectations are anchored at levels consistent with its 2% inflation target. For example, Chart 1 shows how the headline PCE price index would have evolved since the end of 2007 had it averaged 2% growth per year, exactly equal to the Fed’s target. Starting from today, PCE inflation would need to average 3% for the next seven years, or 2.5% for the next fourteen years, for the index to converge with this target. In other words, if the Fed seeks to achieve average 2% inflation since 2007, we are in for a prolonged period of overshooting the old 2% target. Chart 1An Illustration Of Average Inflation Targeting
An Illustration Of Average Inflation Targeting
An Illustration Of Average Inflation Targeting
Notice that we had to make several assumptions in our above example. First, we had to assume that the Fed will seek to achieve average 2% inflation since the end of 2007. The Fed could just as easily choose a different start date for calculating the 2% average. We also assumed that the year-over-year PCE inflation rate never breaks above 3% during the overshooting phase. As of now, we have no sense of whether the Fed would act to make sure that inflation only overshoots 2% by a small amount (say, between 0.5 and 1 percentage point) or whether it would tolerate a larger overshoot. A larger overshoot would potentially be more de-stabilizing, but it would allow the Fed to catch up to its price level target more quickly. We will probably get some more information about these missing details when the Fed translates its new framework into more explicit forward rate guidance (see section titled "Are There Any Additional Changes Coming?" below), but the Fed will still want to retain some flexibility. That is, we shouldn’t expect the Fed to tie its hands with a strict policy rule. This means that the question of how much inflation would prompt any future Fed tightening could linger for some time. Faced with this ambiguity, investors are advised to focus more keenly than ever on inflation expectations (Chart 2). Note that in the above excerpt from the revised Statement on Longer-Run Goals and Monetary Policy Strategy, the explicit goal of average inflation targeting is to “anchor long-term inflation expectations at [2 percent]”. This means that we will know that the Fed has seen enough inflation overshooting when long-term expectations are anchored at levels consistent with its 2% inflation target. We view this “well anchored” level as a range between 2.3% and 2.5% for long-dated TIPS breakeven inflation rates (top two panels). When TIPS breakevens reach those levels, we should expect the Fed to shift toward a more restrictive policy stance. Chart 2The Fed Wants Higher Inflation Expectations
The Fed Wants Higher Inflation Expectations
The Fed Wants Higher Inflation Expectations
How long will it take for TIPS breakevens to reach our target range? We expect it will take quite some time because Fed communications alone cannot drive long-term TIPS breakevens back to target. Rather, inflation expectations tend to follow trends in the actual inflation data, so expectations will only return to well-anchored levels once inflation has risen significantly. Further, long-dated inflation expectations tend to adapt slowly to changes in the actual inflation data. Notice in Chart 3 that the 5-year/5-year forward CPI swap rate correlates much more strongly with the 8-year rate of change in CPI inflation than it does with the 1-year rate of change. This suggests that, most likely, 12-month inflation will have to run above 2% for some time before long-term TIPS breakevens sustainably return to our target range. One way to understand the link between actual inflation and inflation expectations is to look at the distribution of individual inflation forecasts. Chart 4 shows the distribution of 10-year headline CPI inflation forecasts from the Survey of Professional Forecasters from 2004 – a year when inflation expectations were well anchored around 2% – and from August 2020. Notice that a similar proportion of respondents at both points in time expect inflation to be near the Fed’s target, in a range of 2% to 2.5%. The difference is that, in 2004, a large minority of respondents anticipated a significant overshoot of the inflation target. Today, hardly anyone anticipates a significant overshoot, and many expect a significant undershoot. Chart 3Inflation Expectations Adapt Slowly To The Actual Data
Inflation Expectations Adapt Slowly To The Actual Data
Inflation Expectations Adapt Slowly To The Actual Data
Chart 4Distribution Of Inflation Forecasts ##br##(2004 & Today)
A New Dawn For US Monetary Policy
A New Dawn For US Monetary Policy
Since market prices can be thought of as a weighted average of the entire distribution of inflation forecasts, it follows that to drive TIPS breakevens higher we need to see investors shift their forecasts from the left tail of the distribution to the right tail. This will only happen if actual inflation rises, and probably only if it stays durably above 2% for a prolonged period. Chart 5shows that the percentage of respondents that expect inflation to average above 3% for the next ten years tends to follow both the long-run inflation rate and the median inflation forecast. Chart 5Few Expect Inflation To Be Above 3%
Few Expect Inflation To Be Above 3%
Few Expect Inflation To Be Above 3%
Bottom Line: The official shift to an average inflation targeting regime represents a massive structural break relative to how the Fed conducted monetary policy in the past. The main takeaway for investors should be that inflation expectations carry more weight than ever in the Fed’s thinking. In particular, we should expect the Fed to move to a more restrictive policy stance only when long-maturity TIPS breakeven inflation rates return to a well-anchored range of 2.3% to 2.5%. Some Key Questions Following The Fed’s Big Shift Does The Phillips Curve Still Matter? The second big change that the Fed made to its official Statement on Longer-Run Goals and Monetary Policy Strategy is in how it views the unemployment rate relative to its “natural” level. Specifically, the change has to do with making estimates of the natural rate of unemployment (NAIRU) less important in the Fed’s reaction function. In its old Statement, the Fed talked about minimizing “deviations of employment from the Committee’s assessments of its maximum level”. The revised Statement talks about mitigating “shortfalls of employment from the Committee’s assessment of its maximum level.” This one word change says a lot about the Fed’s faith in the Phillips curve. In the past, the Fed viewed an unemployment rate below its estimate of NAIRU as a signal that inflation was poised to accelerate. This often led to premature tightening, and over time, a pattern of missing the inflation target to the downside. Now, the Fed is explicitly saying that it only cares about shortfalls of employment from its estimated maximum level. If the labor market appears overheated, the Fed will not take this as a sign that inflation is about to accelerate. Rather, it will wait for the evidence to show up in the actual inflation data. The percentage of respondents that expect inflation to average above 3% for the next ten years tends to follow both the long run inflation rate and the median inflation forecast. This change sends a very clear signal that the Fed will put much less emphasis on expected “Phillips curve effects” in the future than it has in the past. In addition to long-term implications, this change will likely also impact the type of forward rate guidance the Fed provides this year. What’s Missing? It is also interesting to touch on the things that Powell did not mention in his Jackson Hole speech. First, as noted above, Powell provided few details on the length of time over which the Fed will seek to hit average 2% inflation and did not specify any upper limit to the amount of inflation the Fed would tolerate during the overshooting phase. Perhaps more importantly, Powell also did not say much about how the Fed will seek to drive inflation higher, and whether there are additional tools at his disposal that have not yet been rolled out. We think there is good reason for this. In effect, we think the Fed is more or less tapped out in terms of the amount of additional monetary easing it can provide. Negative interest rates have already been ruled out. A Yield Curve Control policy of capping intermediate-maturity bond yields has been discussed, but this policy doesn’t accomplish much beyond what the Fed is already doing with its forward rate guidance. For example, a policy of capping the 2-year Treasury yield at the current level of 0.13% has essentially the same impact on bond prices as convincing the market that the fed funds rate will stay in a range between 0% and 0.25% for the next two years or more. The notion that the Fed is “out of bullets” was hammered home during the final Jackson Hole panel on Friday. The speakers for the panel titled “Post-Pandemic Monetary Policy and the Effective Lower Bound” shifted much of the onus for boosting growth, with policy interest rates at the effective lower bound, toward fiscal policymakers. Given the limitations on the amount of additional easing that the Fed can deliver, the potent impact of the changes announced last week will not really be felt until the economic recovery is further underway. Only once inflation starts to rise will we get a test of the Fed’s resolve to stay on the sidelines. Now that the changes have been enshrined in an official Fed document, we have no doubt that they will follow through. What About The Role Of QE? Chart 6The Future Of QE: Go Big & Go Fast
The Future Of QE: Go Big & Go Fast
The Future Of QE: Go Big & Go Fast
Not every speaker at Jackson Hole, however, felt that central banks had run out of policy options. Bank of England (BoE) Governor Andrew Bailey gave a speech on Day Two of the conference that focused on the use of central bank balance sheets as a more regular part of policymakers’ toolkits over the next decade with policy rates at the effective lower bound. Bailey noted that the use of quantitative easing (QE) in the future would be less about signaling future central bank intentions on interest rates, or forcing changes to the composition of assets held by the private sector, and would be more about “going big and going fast” to calm financial markets during periods of instability.3 Some past examples of such use of QE include the 2008 Global Financial Crisis, the 2011/12 European Debt Crisis and the 2016 UK Brexit shock (Chart 6). In Bailey’s view, QE will now have to be “state contingent”, based on the nature of the financial market shock and where liquidity (cash) needs are greatest at that time. In 2008, it was the banking system that needed liquidity, so central banks expanded their balance sheets in ways that got cash directly to the banks – like repos and government bond purchases. In 2020, the demand for liquidity from the COVID-19 shock came more from non-bank entities, like investment funds or the corporate sector itself. Therefore, central bank balance sheets had to be used to support loans to the private sector or even buying private assets like corporate debt, on top of the usual QE buying of sovereign debt to help drive down risk-free bond yields. What does that mean for the new policy regime of the Fed? It means that the type of market intervention we saw earlier this year – with the Fed announcing a variety of measures to support liquidity like corporate bond purchases when markets were not functioning – will become more commonplace during periods of severe market stress. This is because there cannot be any “emergency” Fed rate cuts to calm markets if the Fed is keeping rates at very low levels to try and make up for past undershoots of its inflation target. Chart 7The Fed Has Room To Do More QE In The Future
The Fed Has Room To Do More QE In The Future
The Fed Has Room To Do More QE In The Future
This also means that the balance sheets of the Fed, and other major global central banks, will likely continue to get larger over time. Tapering of balance sheets, as the Fed engineered during 2014-19, will become very rare events before inflation expectations are stabilized at policymaker targets. That does raise issues of capacity constraints for QE programs, as Bailey mentioned in his speech, where the central bank footprint in financial markets becomes so large as to impair market functionality. That is the case today where the Bank of Japan now owns nearly 50% of all outstanding Japanese government bonds (JGB) and the day-to-day liquidity in the JGB market is extremely challenging for market participants that need to buy and trade JGBs, like Japanese banks and investment funds. Bailey noted that there was still ample capacity for the BoE to ramp up its buying of UK Gilts (and even UK corporate debt) before the sheer size of its presence became a BoJ-like problem for the UK bond market (Chart 7). The same can be argued in the US, where the Fed only owns a little over 20% of outstanding US Treasuries – the supply of which is growing rapidly thanks to large US budget deficits. Are There Any Additional Changes Coming? As we outlined in a recent US Bond Strategy Webcast, after revising the Statement on Longer-Run Goals and Monetary Policy Strategy, the Fed’s next step will be to provide more explicit guidance about the economic conditions that will have to be in place before it considers lifting the fed funds rate.4 We speculate that this next announcement will occur before the end of the year, possibly at this month’s FOMC meeting, and that the guidance will be similar to the Evans Rule employed in 2012. The Evans Rule was a promise that the Fed would not lift rates at least until the unemployment rate was below 6.5% or inflation was above 2.5%. For the 2020 version of the Evans Rule, policymakers had been debating whether to specify both an unemployment target and an inflation target, as was done in 2012, or whether to specify only an inflation target. With the Fed’s new Statement putting much less emphasis on Phillips curve effects and estimates of NAIRU, it now appears much more likely that the 2020 version of the Evans Rule will have only an inflation trigger, or perhaps an inflation trigger and an inflation expectations trigger. Bottom Line: There are still many lingering unanswered questions about the new Fed strategy, but what we do know is that the Fed will focus more on inflation, rather than forecasts of inflation, when making future interest rate decisions. The Fed will also likely use its balance sheet more as a market stability tool during times of crisis. Investment Implications Chart 8Financial Conditions
Financial Conditions
Financial Conditions
The first implication of the Fed’s big shift has to do with the long-run outlook for risk asset prices (corporate bonds, equities and other fixed income spread product). With the Fed committing to give the economic recovery more runway before choking it off, risk asset valuations have been provided with a massive tailwind. In fact, the longer it takes for inflation to move up, the longer the Fed will stay on hold and the more expensive risk asset valuations will become. It is even possible that, if inflation remains subdued for a few more years, risk asset valuations will become so stretched that the Fed might have to exercise its financial stability “out clause”. That is, if the Fed viewed a growing asset bubble as a threat to the economic recovery and/or financial system, it could abandon its inflation target and lift interest rates to deflate that bubble. This out clause is specifically enshrined in the Fed’s Statement on Longer-Run Goals and Monetary Policy Strategy: Moreover, sustainably achieving maximum employment and price stability depends on a stable financial system. Therefore, the Committee’s policy decisions reflect its longer-run goals, its medium-term outlook, and its assessments of the balance of risks, including risks to the financial system that could impede the attainment of the Committee’s goals. We should stress that US financial asset valuations are currently nowhere near expensive enough to prompt this sort of move (Chart 8). However, that picture could change after a few more years of low inflation and zero interest rates. We have been saying since March 2019 that the two most important indicators to watch for gauging the eventual pace of Fed tightening are inflation expectations and financial conditions.5 Last week’s announcement serves to reinforce that view. The Fed could abandon its inflation target and lift interest rates to combat a growing asset bubble. A second investment implication of the Fed’s announcement is that TIPS will continue to outperform nominal US Treasuries until there is an eventual re-anchoring of long-run TIPS breakeven inflation rates in a range between 2.3% and 2.5%. As noted above, this structural investment position could take some time to pan out, and we may even get an opportunity to tactically position for periods of TIPS underperformance if breakevens start to look too high compared to the actual inflation data.6 For now, our models suggest that TIPS breakevens are fairly valued relative to the actual inflation data, and we recommend staying overweight TIPS versus nominal Treasuries as a core allocation in fixed income portfolios. We would also advise investors to enter flatteners along the inflation protection curve (TIPS breakevens or CPI swaps). This recommendation flows directly from the Fed’s announcement. If the Fed is eventually successful at achieving a temporary overshoot of its 2% inflation target, then the cost of short-maturity inflation protection should rise above the cost of long-maturity inflation protection. That is, the inflation protection curve should invert (Chart 9). This would be a stark dislocation compared to the past, but it is a logical one if the Fed is to be attacking its inflation target from above instead of from below. As for nominal Treasury yields, our baseline view is that yields will be flat-to-higher over the next 12 months, with the amount of upside dictated by the pace of economic recovery. The Fed’s extraordinarily dovish monetary policy will keep some downward pressure on nominal yields, but expectations of Fed tightening will eventually infiltrate the long end of the curve. Given that the Fed’s grip is much firmer at the short end of the curve than at the long end, we prefer to play the nominal Treasury curve through yield curve steepeners rather than through outright duration bets (Chart 10). Chart 9Position For Inflation Curve Inversion
Position For Inflation Curve Inversion
Position For Inflation Curve Inversion
Chart 10Enter Nominal Curve Steepeners
Enter Nominal Curve Steepeners
Enter Nominal Curve Steepeners
Finally, the level of real yields is perhaps the trickiest to get right in the current environment. The Fed’s dovish policies are clearly meant to push real yields down, but now that those policies have been announced, it may signal that we are near the trough. In fact, real yields actually rose somewhat on Thursday after the Fed’s announcement. As with nominal yields, we prefer to play the real Treasury (TIPS) curve via steepeners (Chart 11). Whether or not the Fed is able to apply further downward pressure on real yields, as long as its policies are viewed as reflationary and the economic recovery is maintained, then the real yield curve has ample room to steepen. Chart 11Enter Real Curve Steepeners
Enter Real Curve Steepeners
Enter Real Curve Steepeners
Bottom Line: The Fed’s new policy framework supports our current US fixed income recommendations: a neutral duration stance; overweighting TIPS versus nominal US Treasuries; positioning for real yield curve (TIPS) steepeners; and overweighting US spread product most directly supported by the Fed’s balance sheet (i.e. investment grade corporates and Ba-rated high-yield). Ryan Swift US Bond Strategist rswift@bcaresearch.com Robert Robis, CFA Chief Fixed Income Strategist rrobis@bcaresearch.com Footnotes 1 https://www.youtube.com/user/KansasCityFed 2 https://www.federalreserve.gov/monetarypolicy/guide-to-changes-in-statement-on-longer-run-goals-monetary-policy-strategy.htm 3 The full text of BoE Governor Bailey’s speech can be found here: https://www.bankofengland.co.uk/speech/2020/andrew-bailey-federal-reserve-bank-of-kansas-citys-economic-policy-symposium-2020 4 https://www.bcaresearch.com/webcasts/detail/338 5 Please see US Bond Strategy Weekly Report, “The New Battleground For Monetary Policy”, dated March 26, 2019, available at usbs.bcaresearch.com 6 This possibility is discussed in US Bond Strategy Weekly Report, “Positioning For Reflation And Avoiding Deflation”, dated August 11, 2020, available at usbs.bcaresearch.com
Highlights President Trump is making a comeback in our quantitative election model. An upgrade from our 35% odds of a Trump win is on the horizon, pending a fiscal relief bill. The Fed’s pursuit of “maximum employment,” the necessities of the pandemic response, fiscal largesse, a US shift toward protectionism, and the strategic need to counter China will pervade either candidate’s presidency. A Democratic “clean sweep” would add insult to injury for value stocks, but these stocks don’t have much more downside relative to growth stocks. Trump’s tariffs, or Biden’s taxes, will hit the outperformance of Big Tech, as will the recovery of inflation expectations. Feature More than at any time in recent US history, voters believe that the 2020 election is definitive in charting two distinct courses for the country (Chart 1). No doubt 2020 is an epic election with far-reaching implications. However, from an investment point of view, a Trump and a Biden administration have more in common than consensus holds. Chart 1An Epic Choice About The US’s Future
Trump Versus Biden: Tariffs Versus Taxes
Trump Versus Biden: Tariffs Versus Taxes
The US political parties have finalized their policy platforms, giving investors greater clarity about what policies the parties will try to implement over the next four years.1 While the presidential pick is critical for American foreign and trade policy, the Senate is just as important as the president for US equity sectors. The only dramatic changes would come if the Democrats achieved a clean sweep of government – yet this result is likely as things stand today (Chart 2). Investors should prepare. It would prolong the suffering of value stocks relative to growth stocks by hitting the US health care and energy sectors hard. Chart 2“Blue Wave” Still The Likeliest Scenario
Trump Versus Biden: Tariffs Versus Taxes
Trump Versus Biden: Tariffs Versus Taxes
The State Of Play A “Blue Wave” is still the likeliest outcome – and that’s where the stark policy differences emerge. The race is tightening. Our quantitative election model looks at state leading indicators, margins of victory in 2016, the range of the president’s approval rating, and a “time for change” variable that gives the incumbent party an advantage if it has not been in the White House for eight years. The model now shows Florida as a toss-up state with a 50% chance of flipping back into the Republican fold (Chart 3). Chart 3Florida Now 50/50 In Our Election Quant Model – 45% Chance Of Trump Win
Trump Versus Biden: Tariffs Versus Taxes
Trump Versus Biden: Tariffs Versus Taxes
As long as the economy continues recovering between now and November 3, Florida should flip and Trump should go from 230 Electoral College votes to 259. One other state – plus one of the stray electoral votes from either Nebraska or Maine, which Trump is like to get – would deliver him the Oval Office again. The model says that Trump has a 45% chance of victory, up from 42% last month. Subjectively, we are more pessimistic than the model. Pandemic, recession, and social unrest have taken a toll on voters and unemployment is nearly three times as high as when Trump’s approval rating peaked in March. Consumer confidence is weak, albeit making an effort to trough. Voters take their cue from the jobs market more than the stock market, although the stock rally is certainly helpful for the incumbent. We await the completion of a new fiscal relief bill in Congress before upgrading Trump to closer to our model’s odds and the market consensus of 45%. Another Social Lockdown? COVID-19 subsiding in the US a boon for Trump in final two months of campaign. The first concern for the next president is COVID-19. On the surface Trump and Biden are diametrically opposed. President Trump is obviously disinclined to impose a new round of lockdowns and the Republican platform calls for normalizing the economy in 2021. By contrast, the Democrats claim they will contain the virus even at a high economic cost. Biden says he will be willing to shut down the entire US economy again if scientists deem it necessary.2 There is apparently political will for new draconian lockdowns – but it is not likely to be sustained after the election unless the next wave of the virus is overwhelming (Chart 4). Biden will need to be cognizant of the economy if he is to succeed. Chart 4Biden Has Some Support For Another Lockdown
Trump Versus Biden: Tariffs Versus Taxes
Trump Versus Biden: Tariffs Versus Taxes
However, it is doubtful that Trump would refuse to lock down the economy in his second term if his advisers told him it was necessary. After all, it is Trump, not Biden, who implemented the lockdowns this year. Arguably he reopened the economy too soon with the election in mind. But if that is true, then it isn’t an issue for his second term, since he can’t run for president a third time. This is a theme we often come back to: reelection removes a critical impediment to Trump’s policies in a second term as opposed to his first. Bottom Line: The coronavirus outbreak and the country’s top experts will decide if new lockdowns are warranted, regardless of president, but the bar for a complete shutdown is high. COVID-19 is subsiding in both the US and in countries like Sweden that never imposed draconian lockdowns (Chart 5). Still, given that the equity market has recovered to pre-COVID highs, investors would be wise to hedge against a bad outcome this winter. Chart 5Pandemic Subsiding In US And ‘Laissez-Faire’ Sweden
Trump Versus Biden: Tariffs Versus Taxes
Trump Versus Biden: Tariffs Versus Taxes
Maximum Employment The monetary policy backdrop will be ultra-dovish regardless of the presidency. The Fed is now pursuing average inflation targeting and “maximum employment,” according to Fed Chairman Jay Powell, speaking virtually on August 27 at the Kansas City Fed’s annual Jackson Hole summit. This means that if Trump wins, he will not have to fight running battles with Powell over rate hikes. The monetary backdrop for either president will be more reminiscent of that faced by President Obama from 2009-12 – extremely accommodative. It is possible that Trump’s “growth at all costs” attitude could lead to speculative bubbles that the Fed would need to prick. Already the NASDAQ 100 is off the charts. Elements of froth reminiscent of the dotcom bubble era are mushrooming (Chart 6). Nobody has any idea yet how the Fed will square its maximum employment mission with the need to prevent financial instability, but it will err on the side of low rates. Chart 6Frothy NDX
Frothy NDX
Frothy NDX
Chart 7The Mother Of All V-Shapes
The Mother Of All V-Shapes
The Mother Of All V-Shapes
Biden will be more likely to tamp down financial excesses through executive orders – or to deter excesses through taxes if he controls the Senate. But there is no reason the executive branch would be more vigilant than the Fed itself. Higher inflation will push real rates down and weaken the dollar almost regardless of who wins the presidency. Trump’s trade wars – and any major conflict with China – would tend to prop up the greenback relative to Biden’s less hawkish, more multilateral, approach. But either way the combination of debt monetization, twin deficits, and global economic recovery spells downside for the dollar. This in turn spells upside for the S&P500 and inflation-friendly (or deflation-unfriendly) equity sectors in the longer run (Chart 7). Fiscal Largesse The next president will struggle with a massive fiscal hangover resembling late 1940s. The Fed’s new strategy ensures that fiscal policy will prove the driving factor in the US macro outlook. Regardless of who wins the election, the budget deficit will fall from its extreme heights amid the COVID-19 crisis over the next four years (Chart 8). If government spending falls faster than private activity recovers, overall demand will shrink and the economy will be foisted back into recession. Chart 8Budget Deficit Will Decrease As Economy Normalizes
Budget Deficit Will Decrease As Economy Normalizes
Budget Deficit Will Decrease As Economy Normalizes
The deep 1948-49 recession occurred because of the government’s climbing down from wartime levels of spending (Chart 9). Premature fiscal tightening would jeopardize the 2021 recovery. Yet neither candidate is a fiscal hawk. Trump is a big spender; Biden is a Democrat. The House Democrats will control the purse strings. Republican senators, the only hawkish actors left, are not all that hawkish in practice. They agreed with Trump and the Democrats in passing bipartisan spending blowouts from 2017-20. They will likely conclude another such deal just before the election. Chart 9Sharp Deficit Correction Would Jeopardize Recovery
Sharp Deficit Correction Would Jeopardize Recovery
Sharp Deficit Correction Would Jeopardize Recovery
So Trump would maintain high levels of spending without raising taxes; Biden would spend even more, albeit with higher taxes. Table 1Biden Would Raise $4 Trillion In Revenue Over Ten Years
Trump Versus Biden: Tariffs Versus Taxes
Trump Versus Biden: Tariffs Versus Taxes
On paper, Biden would add a net ~$2 trillion to the US budget deficit over ten years, as shown in Tables 1 and 2. But these are loose costings. Nobody knows anything until actual legislation is produced. The risk to spending levels lies to the upside until the employment-to-population ratio improves (Chart 10). Trump’s net effect on the deficit is even harder to estimate because the Republican Party platform is so vague. What we know is that Trump couldn’t care less about deficits. Back of the envelope, if Congress permanently cut the employee side of the payroll tax for workers who earn less than $8,000 per month, as Trump has suggested, the deficit would increase by roughly $4.8 trillion over ten years.3 Table 2Biden Would Spend $6 Trillion In Programs Over Ten Years
Trump Versus Biden: Tariffs Versus Taxes
Trump Versus Biden: Tariffs Versus Taxes
Chart 10Massive Labor Slack Will Encourage Government Spending
Massive Labor Slack Will Encourage Government Spending
Massive Labor Slack Will Encourage Government Spending
House Democrats will hardly agree to any major new tax cuts – and certainly not gigantic ones that would “raid Social Security.” This accusation will be popular and Trump will want to avoid it during the campaign as well – his 2020 platform does not explicitly mention the payroll tax. Many of Trump’s other proposals would focus on extending the Tax Cut and Jobs Act. For example, it is possible that Trump could extend the full expensing of companies’ depreciation costs for capital purchases, set to expire in 2022 and 2026, to the tune of $419 billion over ten years.4 Thus the overall contribution of government spending to GDP growth will be higher than in the recent past. This trend was established prior to COVID (Chart 11). The rise of populism supports this prediction, as Trump has always insisted he will never cut mandatory (entitlement) spending – a major change to Republican orthodoxy now enshrined in its policy platform. Chart 11Government Role To Increase In America
Government Role To Increase In America
Government Role To Increase In America
Chart 12No Cuts To Defense Likely Either
No Cuts To Defense Likely Either
No Cuts To Defense Likely Either
Meanwhile Biden is not only rejecting spending cuts but also coopting the profligate spending agenda of the left wing of his party. Practically speaking, social spending cannot be cut by Trump – and yet Biden cannot cut defense spending much either, since competition with Russia and China is growing (Chart 12). The common thread in both party platforms is fiscal largesse at a time of monetary dovishness, i.e. reflation. Other Common Denominators Market is overrating Biden’s China friendliness. Both Trump and Biden promise to build infrastructure, energize domestic manufacturing, and lower pharmaceutical prices. The two candidates are competing vociferously over who will bring more American manufacturing jobs home. President Trump won the Republican nomination in 2016 partly because he stole the Democrats’ thunder on “fair trade” over “free trade.” Biden’s agenda is effusive on these Trump (and Bernie Sanders) themes – his party sees an existential risk in the Rust Belt if it cannot steal that thunder back. The manufacturing agenda centers on China-bashing. China runs the largest trade surplus with the US, it has a negative image in the public eye, and it has alarmed the military-industrial complex by rising to the status of a peer strategic competitor over the technologies of tomorrow. Where Trump once spoke of a “border adjustment tax,” or a Reciprocal Trade Act, Biden speaks openly of a carbon border tax: “the Biden Administration will impose carbon adjustment fees or quotas on carbon-intensive goods from countries that are failing to meet their climate and environmental obligations.”5 China’s coal-guzzling economy would obviously be the prime target. It is true that Biden will seek to engage China and reset the relationship. He will probably maintain Trump’s tariff levels or even slap a token new tariff, but he will then settle down for a two-track policy of dialogue with China and coalition-building with the democracies. The result may be a reprieve from strategic tensions for a year or so. Investors are exaggerating Biden’s positive impact on China relations, judging by the correlation of China-exposed US equities with the Democrats’ odds of winning. The truth is that Biden will maintain the Obama administration’s “Pivot to Asia,” which was about countering China. The secular power struggle will persist and China-exposed stocks, especially tech, will be the victims (Chart 13). Chart 13Market Over-Optimistic About Biden Vis-à-Vis China
Market Over-Optimistic About Biden Vis-à-Vis China
Market Over-Optimistic About Biden Vis-à-Vis China
Senate election will likely tip with White House – but checks and balances are best for equities. Control of the Senate will determine whether the big differences between the two candidates materialize. Biden can’t raise taxes without the Senate; Trump can’t wage trade wars of choice as Congress is supreme over commerce and could take his magic tariff wand away from him. Trump can use executive orders to pare back immigration, but he cannot force the House Democrats to approve a southern border wall. In fact, he dropped “the Wall” from his agenda this time around. (It didn’t help that former Trump adviser Steve Bannon has been arrested for allegedly scamming people out of their money to pay for a wall.) Biden will be far looser on immigration than Trump and the reviving economy will attract foreign workers. But the Obama administration showed that during times of high unemployment, even Democrats have a limit to the influx they will allow (Chart 14). Meanwhile Biden can use executive orders to impose aspects of his version of the Green New Deal, but he cannot pass carbon pricing laws or other sweeping climate policy if Republican Senators are there to stop him. For this reason, a divided government is likely to produce three cheers from the markets. The single most market-positive scenario is Biden plus a Republican Senate, which suggests a moderation of the trade war and yet no new taxes. Second best would be Trump with a Democratic Congress that would clip his wings on tariffs, but enable him to veto any anti-market laws. The stock market’s performance to date is more reminiscent of a “gridlock” election outcome, in which the two parties split the executive and legislative branches of government in some way, as opposed to a unified single-party government (Chart 15). Chart 14Immigration Faces Limits Even Under Democrats
Trump Versus Biden: Tariffs Versus Taxes
Trump Versus Biden: Tariffs Versus Taxes
Chart 15Stock Market Expects Gridlock?
Stock Market Expects Gridlock?
Stock Market Expects Gridlock?
Investors should not be complacent, however, because the political polling so far suggests that the Senate race is on a knife’s edge. The balance of power will tilt whichever way the heavily nationalized, heavily polarized White House race tilts (Chart 16). A “blue sweep” is still a fairly high probability. Indeed a Biden win will most likely produce a Democratic sweep while a Trump win will produce the status quo. Chart 16Tight Senate Races Will Turn On White House Race
Trump Versus Biden: Tariffs Versus Taxes
Trump Versus Biden: Tariffs Versus Taxes
Biden’s Agenda After A Blue Sweep Democrats would remove the filibuster – another big difference in outcomes. Biden is more likely to benefit from Democratic control of Congress if he wins. He is also more likely to rely on his top advisers and the party apparatus. Hence the Democratic platform matters more than the Republican platform in this cycle. Investors should set as their base case that a new president will largely succeed in passing his top one or two priorities. Less conviction is warranted after the initial rush of policymaking, as political capital will fall and the economic context will change. But in the honeymoon period, a president can get a lot done, especially if his party controls Congress. Investors would have been wrong to bet against George W. Bush’s Economic Growth and Tax Relief Act (2001), Barack Obama’s Affordable Care Act (2009), or Trump’s Tax Cut and Jobs Act (2017). Yet they could never have known that COVID-19 would strike in Trump’s fourth year and overturn the very best macroeconomic forecasts. Critically, if Democrats take the Senate, our base case is that they will remove the filibuster, i.e. the use of debate to block legislation. Biden has suggested that he would look at doing so. President Obama recently linked it to racist Jim Crow laws of the late nineteenth and early twentieth centuries, making it hard for party members to defend keeping the filibuster. Senate minority leader Charles Schumer (D, NY) has signaled a willingness to change the Senate rules if he becomes majority leader. Removing the filibuster would change the game of US lawmaking, enabling the Senate to pass laws with a simple majority of 51 votes – i.e. 50 plus a Democratic vice president. This is entirely within reach. While a handful of moderate Democratic senators may oppose such a dramatic move at first, the Democratic Party leadership will corral its members once it faces the reality of the 60-vote requirement blocking its agenda. The party will remember the last time it took power after a national crisis, in 2009, and the frustrations that the filibuster caused despite having at that time a much stronger Senate majority than it can possibly have in 2021. Populism is rife in the US and it is all about shattering norms. Moreover, the filibuster has already been eroding over the past two administrations (vide judicial appointments). Revoking it would enable Democrats to pass a lot more ambitious legislation, and many more laws, than in previous administrations. This is important because Biden’s agenda is more left-wing than some investors realize given his history as a traditional Democrat. In order to solidify the increasingly powerful progressive faction of his party, symbolized by Vermont Senator Bernie Sanders, Biden created task forces to merge his agenda with that of Sanders. Sanders and his fellow progressive Senator Elizabeth Warren of Massachusetts have much more influence in the party than their 35% share of the Democratic primary vote implies. The youth wing of the party shares their enthusiasm for Big Government. Here are the key structural changes that matter to investors: Offering public health insurance – A public health option will benefit from government subsidies and thus outcompete private options, reducing their pricing power. The lowest income earners will be enrolled in the program automatically, rapidly boosting its size (Chart 17). Enabling Medicare to negotiate drug prices – Medicare’s drug spending is equivalent to almost 45% of Big Pharma’s total sales. Enabling this government program to bargain with companies over prices will push down prices substantially. However, the sector’s performance is not really tied to election dynamics because President Trump is also pledging to cap drug prices – it is an effect of populism (Chart 18). Doubling the federal minimum wage – The wage will rise from $7.25 to $15 per hour, hitting low margin franchises and small businesses alike. Chart 17Health Care Gives Back Gains After Biden Nomination
Health Care Gives Back Gains After Biden Nomination
Health Care Gives Back Gains After Biden Nomination
Chart 18Big Pharma Faces Onslaught From Both Parties
Big Pharma Faces Onslaught From Both Parties
Big Pharma Faces Onslaught From Both Parties
Eliminating carbon emissions from power generation by 2035 – Countries are already rapidly shifting from coal to natural gas, but the Biden agenda would attempt to move rapidly away from fossil fuels completely (Chart 19). If legislation passes it will revolutionize the energy sector. Prohibiting “right to work” laws – This is only one example of a sweeping pro-labor agenda that would involve an extensive regulatory push and possibly new laws. New laws would prevent states from passing “right to work” laws that give workers more freedoms to eschew labor unions. The removal of the filibuster makes this possible. Moreover Biden will be aggressive in using executive orders to implement a pro-labor agenda, going further than Bill Clinton or Barack Obama attempted to do in recognition of the party’s shift to the left of the political spectrum. Chart 19Blue Sweep Would Bring Climate Policy Onslaught
Trump Versus Biden: Tariffs Versus Taxes
Trump Versus Biden: Tariffs Versus Taxes
Subsidizing college tuition and low-income housing. US housing subsidies currently make up 25% of domestic private investment in housing and Biden’s government would roll out a significant expansion of these programs. Granting Washington, DC statehood – This is unlikely to happen as two-thirds of Americans are against it. But without the filibuster, Democrats could conceivably railroad it through. Trump’s Agenda Trump’s signature is tariffs – and globally exposed stocks know it. If Trump wins, his domestic legislative agenda will be stymied, other than laws directly aimed at fighting the pandemic and reviving the economy. As mentioned, Trump is unlikely to pass a law building a wall on the southern border. It is conceivable that Trump could pass a comprehensive immigration reform bill with House Democrats, but that is not a priority on the platform and Trump would have to pivot toward compromise. That would depend on Democrats winning the Senate or forcing him to negotiate with the House. Hence a Trump second term will mostly focus on foreign and trade policy. The Republican platform is aggressive on economic decoupling from China, which is ranked third behind tax cuts and pandemic stockpiles.6 Trump, vindicated on protectionism, would likely go after other trade surplus nations. The Chinese could offer some concessions, producing a Phase Two deal early in his second term to avoid sweeping tariffs and encourage him to wage trade war against Europe (Chart 20). Chart 20Trump = Global Trade War
Trump = Global Trade War
Trump = Global Trade War
Trump’s foreign policy would consist of reducing US commitments abroad. Withdrawing from Afghanistan and other scattered conflicts is hardly a game changer. Shifting some forces back from Germany and especially South Korea is far more consequential. It will create power vacuums. But the US is not likely to abandon the allies wholesale. Chart 21Defense Stocks Will Get Wind In Sails
Defense Stocks Will Get Wind In Sails
Defense Stocks Will Get Wind In Sails
Trump has moderated his positions on NATO and other defense priorities over his first term. It is possible he could revert back to his original preferences in a second term, however, so global power vacuums and geopolitical multipolarity will remain a major source of risk for global investors. He will probably also succeed in maintaining large defense spending, despite a Democratic House, given the reality of great power struggle with China and Russia. Geopolitical multipolarity means that defense stocks will continue to enjoy a tailwind from demand both at home and abroad (Chart 21). Investment Takeaways Energy sector struggles most under Democrats. Biden and Trump are both offering reflationary agendas. Where the two agendas diverge most notably, the impacts are largely market-negative – Trump via tariffs, Biden via taxes. The current signals from the market suggest that growth stocks benefit more from a Democratic clean sweep than value stocks (bottom panel, Chart 22). However, the general collapse in value stocks versus growth suggests that there is not much more downside even if the Democrats win (top panel, Chart 22), especially if the 10-year yield rises, as we have been writing in recent research: a selloff in the bond market is the last QE5 puzzle-piece to fall into place. Fed policy, fiscal largess, and the dollar’s decline will support a global cyclical recovery and downtrodden value stocks regardless of the president. The difference is that Biden would slow their relative recovery by piling regulatory burdens on energy as well as health care, which in the US context are a value play. As a reminder, and contrary to popular belief, health care stocks are the largest constituent of the S&P value index with a market cap weight of 21%.7 Trump’s populist “growth at any cost” and deregulatory agenda would persist in a second term and clearly favor value. Yet, if his trade wars get out of hand, they would also weigh on the recovery of these stocks. The difference is that tech stocks are not priced for a Phase Two trade war. If Trump wins it will be a rude awakening. Not to mention that Trump and populist Republicans will seek to target the tech sector for what is increasingly flagrant favoritism in political and cultural debates. Democrats are much more clearly aligned with tech. While they have ambitions of reining in the tech giants as part of the progressive drive against corporate power writ large, Joe Biden will struggle to take on Big O&G, Big Pharma, Big Insurance, and Big Tech at the same time in a single four-year term. The logical conclusion is that he will spare Silicon Valley, which maintained a powerful alliance with the Obama administration. He cannot afford to betray his progressive base when it comes to climate policy, so the Obama alliance with domestic O&G producers will suffer. Tech will face regulatory risks but they will not be existential. Chart 22Not Much Downside Left For Value Stocks
Not Much Downside Left For Value Stocks
Not Much Downside Left For Value Stocks
The fact that the final version of the Democratic Party platform did not contain a section on removing federal subsidies for fossil fuels is merely rhetorical.8 The one clear market reaction from this election cycle is the energy sector’s abhorrence of Democratic policies (Chart 23). The difference is that energy is priced for it whereas tech is priced for perfection. Chart 23Energy Sector Loses From Blue Sweep
Energy Sector Loses From Blue Sweep
Energy Sector Loses From Blue Sweep
Matt Gertken Geopolitical Strategist mattg@bcaresearch.com Anastasios Avgeriou US Equity Strategist anastasios@bcaresearch.com Footnotes 1 In this report we work from the latest policy platforms available. See “Trump Campaign Announces President Trump’s 2nd Term Agenda: Fighting For You!” Trump Campaign, donaldjtrump.com ; and the draft “2020 Democratic Party Platform” Democratic National Committee, demconvention.com. 2 Bill Barrow, “Biden Says he’d shut down economy if scientists recommended,” Associated Press, August 23, 2020, abcnews.go.com. 3 See Seth Hanlon and Christian E. Weller, “Trump’s Plan To Defund Social Security,” Center for American Progress, August 12, 2020, americanprogress.org; “The 2020 Annual Report Of The Board Of Trustrees Of The Federal Old-Age And Survivors Insurance And Federal Disability Insurance Trust Funds,” Social Security Administration, April 22, 2020, ssa.gov. 4 Erica York, “Details And Analysis Of The CREATE JOBS Act,” Tax Foundation, July 30, 2020, taxfoundation.org. 5 See “The Biden Plan For A Clean Energy Revolution And Environmental Justice,” Biden Campaign, joebiden.com. 6 A Democratic Congress could take back the constitutional power over commerce that it delegated to the president back in the 1960s-70s, limiting Trump’s ability to wage trade war. If Republicans hold the Senate, they still might restrain Trump’s protectionism, as they did with his threatened Mexico tariffs in early 2019, but they would not do so until he has already taken a major disruptive action. 7 See “S&P 500 Value,” S&P Dow Jones Indices, spglobal.com. 8 Andrew Prokop, “The Democratic Platform, Explained,” Vox, August 18, 2020, vox.com.
Highlights US-China relations in 2020 consist of a gentleman’s agreement to keep the Phase One trade deal in place and aggressive maneuvering in every other policy area. Stimulus is unlikely to be curtailed in the US or China yet, which means brinkmanship will eventually lead to a negative surprise for markets. But it is just as unlikely to come after the election as before. Joe Biden would only initially benefit Chinese equities – trade and tech conflict is a secular trend. North Korea is not a red herring, but South Korea is still a geopolitical investment opportunity more than a risk, especially relative to Taiwan. Feature Chart 1US Power Struggle Raises Risk To Rally
US Power Struggle Raises Risk To Rally
US Power Struggle Raises Risk To Rally
The “everything is awesome” rally continues, with US tech stocks unfazed by rising domestic and international risks. However, according to The Lego Movie 2, everything is not that awesome. The Treasury market smells trouble and long-dated yields remain subdued, despite a substantial new dose of monetary policy dovishness (Chart 1, top panel). In the near term we agree with the bears and remain tactically long 10-year Treasuries. Global policy uncertainty remains extremely elevated despite dropping off a bit from the heights of the pandemic lockdowns. US uncertainty, which is now rising relative to global, will climb through November and possibly all the way through Inauguration Day on January 20 (Chart 1, bottom panels). A contested election is not a low-probability event now that President Trump is making a comeback in the election race. President Trump’s comeback could generate a counter-trend bounce in the US dollar (Chart 2A). His comeback is not based in online betting odds but in battleground opinion polls (Chart 2B). Former Vice President Joe Biden is currently polling the same against Trump as Hillary Clinton did in 2016. Chart 2ATrump Staging A Comeback, But US Consumers Flagging
Trump Staging A Comeback, But US Consumers Flagging
Trump Staging A Comeback, But US Consumers Flagging
Chart 2BTrump Staging A Comeback, But US Consumers Flagging
The Trump-Xi Gentleman’s Agreement - GeoRisk Update
The Trump-Xi Gentleman’s Agreement - GeoRisk Update
Why should Trump be less negative for the greenback than Biden? First, Trump is a protectionist who would turn to aggressive foreign and trade policy when it became clear that most of his other legislative priorities would not make it past the Democratic House of Representatives. Unilateral, sweeping tariffs against China, and possibly the EU and various other nations, would weigh on global trade and economic recovery and hence support the dollar. Second, Trump’s populism means he would pursue growth at all costs, which means that US growth would increase relative to that of the rest of the world. Democrats, by contrast, would raise taxes and regulations that would have to be offset by new spending, weighing on growth at least at first. Thus Trump would inject animal spirits into the US economy while dampening those spirits abroad; Biden would do the opposite. The dollar may not rally sustainably, but it would be flat or fall less rapidly than if Biden and the Democrats reduced trade risks abroad while deterring domestic private investment. It is not yet clear that Trump’s comeback will have legs. The nation is still in thrall to the pandemic, recession, and social unrest, which undermine a sitting president. US consumer confidence has fallen, as anticipated (Chart 2, bottom panel). Trump should still be seen as an underdog despite his incumbent status. A Trump comeback could precipitate a counter-trend bounce in the US dollar. Nevertheless, our quantitative election model gives Trump a 45% chance of victory, up from 42% last month. Florida has shifted back into the Republican column – albeit as a “toss up” state with a roughly even chance of going either way (Chart 3). The shift reflects improvement in state leading economic indexes as a result of the V-shaped recovery in the economy thus far. Chart 3Trump Nearly Regains Florida In Our Quantitative Election Model, Odds Of Victory 45%
The Trump-Xi Gentleman’s Agreement - GeoRisk Update
The Trump-Xi Gentleman’s Agreement - GeoRisk Update
Assuming Trump signs a new relief bill in September, which is working its way through Congress as we speak, we will upgrade our subjective odds from 35% to something closer to our quantitative model (and the market consensus). While Trump is less negative for the dollar than Biden, the dollar may fall anyway, at least beyond any near-term bounce. First, monetary policy is ultra-dovish. As we go to press, Fed Chairman Jerome Powell has given a sneak preview of the Fed’s strategic review of monetary policy at the Kansas City Fed’s annual Jackson Hole summit (this time hosted in cyberspace instead of Wyoming). Powell met expectations that the Fed will adopt average inflation targeting. Inflation will be allowed to overshoot the 2% inflation target to compensate for periods of undershooting. Maximum employment will be the goal rather than an attempt to prevent excessive deviation from the Fed’s estimates of neutral unemployment. This means US growth and inflation will push real rates lower and weaken the dollar. Moreover, as mentioned, Trump’s big spending would eventually drive investors away from the dollar, especially in the context of global economic recovery. Trump, like Biden, would refuse to impose fiscal austerity amid high unemployment. The one area where he would be able to compromise with House Democrats would be spending bills, as in his first term. The US budget deficit and trade deficit would remain very large, showering the world with dollar liquidity. Risk-on currencies will attract buyers in a new global business cycle. Republicans and Democrats have released their policy platforms following their national conventions. We will revisit these platforms in detail in a future report. The Democratic platform is the one that matters most because the Democrats are more likely to win full control of Congress and thus be capable of enacting their preferred policies. Their platform is reflationary, but in seeking to rebalance the economy to reduce financial and social disparities through more progressive tax policy it would offset some of the fiscal spending. Biden would also moderate foreign policy and trade policy, launching a new dialogue with China to manage tensions. The dollar would fall faster in this environment. Bottom Line: President Trump is staging a comeback in the election campaign. If the comeback receives a boost from fiscal stimulus, Trump could pull off a Harry Truman-style surprise victory. This would precipitate a bounce in the US dollar in the near term. Over the medium term, the dollar should continue falling due to US debt monetization and global recovery. The Trump-Xi Gentleman’s Agreement Has Two Months Left Financial markets have largely ignored US-China strategic tensions this year because the two countries are puffing themselves up with monetary and fiscal stimulus. Going forward, either the stimulus will falter, or the US-China conflict will escalate to the point of triggering a negative surprise for markets. Chart 4US-China: Embracing While Struggling
US-China: Embracing While Struggling
US-China: Embracing While Struggling
China is unlikely to pull back on stimulus measures. It cannot do so when unemployment has spiked and the economy is experiencing the weakest growth in over 40 years. Authorities said as much during the annual July Politburo meeting on the economy (a meeting that has often marked turning points in policy), when they pledged to maintain accommodative policy and to speed up local government issuance of special bonds. Money supply is growing briskly. The market is validating the signal from China’s easy monetary policies and robust credit expansion. Our China Play Index – which consists of the Australian dollar, iron ore prices, Brazilian equities, and Swedish equities – continues to rally smartly, breaking above its 2019 peaks (Chart 4, top panel). The risk to this view is that the People’s Bank of China may not provide additional monetary easing in the near term, as the Politburo signaled that monetary policy would be more flexible and targeted in the second half of the year. The three-month Shanghai interbank rate has been rising since April. Politically, Chinese authorities would benefit from releasing negative news or statements that would undermine President Trump’s reelection campaign. However, Beijing would not make consequential moves merely to spite Trump. Its primary interest lies in its own stability. Credit growth will continue growing at its current clip through most of the rest of the year and fiscal spending will expand, particularly to support infrastructure projects. The US Congress is also likely to add more stimulus before the election, as noted above. Thus with both countries stimulating, the risk is that they escalate their strategic confrontation to the point that it causes a negative surprise in financial markets. Will this occur? The US-China relationship in 2020 has been characterized by (1) a gentleman’s agreement to adhere to the Phase One trade deal, which was reaffirmed by top negotiators this week; (2) an aggressive pursuit of national interest in every other policy area. Beijing accelerated its power grab in Hong Kong; the US accelerated up its ban on Chinese tech. Chinese imports of US commodities are naturally much weaker than projected due to economic reality but neither side has an interest in exiting the deal. The renminbi continues to appreciate against the dollar on the back of Chinese and global recovery (Chart 4, second and third panels). Nevertheless a new burst of stimulus will lower the hurdle to President Trump taking additional punitive measures against China. The administration could have paused after its major decision to finalize its ban on business with Huawei and other tech firms, which ostensibly even extends to foreign firms that use US-designed parts in sales to China. It did not. Trump is maintaining the pressure with new sanctions over China’s militarization of the South China Sea. Washington is also likely to kick Chinese companies off US stock exchanges if they fail to meet transparency and accounting standards. Trump is not only burnishing his “tough on China” credentials against Democratic candidate Joe Biden – the US’s recent measures are unlikely to be repealed under either president in the coming years. Chart 5China Faces Internal And External Political Pressures
China Faces Internal And External Political Pressures
China Faces Internal And External Political Pressures
Therefore stimulus will enable US actions and Chinese reactions that will eventually trigger a pullback in financial markets. Chinese tech equities are reflecting this headwind. Equities ex-tech are likely to outperform (Chart 5, top panel). A Biden victory does not prevent Trump from taking punitive measures against China on his way out of office, to solidify his legacy as the Man Who Confronted China, so Chinese tech will remain at risk. Biden would be more favorable for emerging market equities because his administration would speed the dollar’s decline. A change of government in the US would temporarily disrupt the US’s overall policy assault against China. Biden’s foreign and trade policies would be more predictable and orthodox than Trump’s. Over a twelve month period, after a shot across the bow to warn that he is not a lightweight, Biden would probably attempt a diplomatic reset with China – a new round of engagement and dialogue that would support the Chinese equity rally. Eventually this reset would fail, however, and Biden would all the while be working up a coalition of democracies to pressure China to change its behavior – not only on trade but also on unions, carbon emissions, and human rights. Externally focused Chinese companies will remain exposed to the harmful secular trend of US-China power struggle regardless of the US election outcome. Coming out of the secretive leaders’ conclave at the Beidaihe resort in August, it is clear once again that Chinese domestic politics is not conducive to smooth US-China relations. Chinese political risk remains underrated. Our GeoRisk indicator is gradually picking up on this trend, and so are other quantitative political risk indicators such as that provided by GeoQuant (Chart 5, second panel). President Xi Jinping has been dubbed the “Chairman of Everything” due to his tendency to promote a neo-Maoist personality cult and thus shift Chinese governance from consensus-rule to personal rule. He is once again reportedly considering taking on the title of “Chairman” of the Communist Party, a position that only Mao Zedong has held.1 More importantly he is re-energizing his domestic anti-corruption campaign, i.e. political purge, this time against law enforcement. Xi had already seized control of China’s domestic security forces but controlling the police is even more critical in a period of high unemployment, slow growth, and social unrest (Chart 5, third panel). Xi’s attempt to re-consolidate power ahead of the Communist Party centennial in 2021 and especially the twentieth national party congress in 2022 is already under way. China’s domestic and international political environment is a risk for the renminbi, which we noted is rallying forcefully on the global rebound. We will not join this rally until the US election is decided at minimum. With the US posing a long-term threat, Beijing is speeding up its attempts to diversify away from the US dollar, both in trade settlements and foreign exchange reserves. Reliance on the dollar leaves Chinese banks and companies vulnerable to US financial sanctions, which have harmed US rivals like Russia and Iran. Over the long run there is a lot of upside for the yuan given its very low level of global penetration (about 2% of both SWIFT transactions and global foreign exchange reserves) and yet China’s very high share of global trade (about 15%). Cross-border settlements in RMB are recovering gradually after the steep drop-off following 2016. Beijing is also allowing foreign investors greater access to onshore financial markets where they will hold more and more RMB-denominated assets. However, the yuan will not become a reserve currency anytime soon given China’s state-controlled economy and closed capital account. We favor the euro, yen, and other G7 currencies as alternatives to the dollar. Hong Kong equities have suffered from the combination of Xi Jinping’s centralization of power and the US-China strategic conflict. The above analysis suggests that while they may get a temporary reprieve, the secular outlook is uninspiring. However, the Hong Kong monetary authorities are capable of managing the dollar peg. They have been able to manage dollar strength over the past decade, including the COVID-19 dollar run-up, and foreign exchange reserves are more than ample. By contrast, a sharp drop in the dollar can be handled even more easily by printing additional HKD. Eventually shifting to a trade basket, or a renminbi peg, is to be expected. The US election may support the Chinese equity rally if Biden wins, but tech equities should continue to underperform the rest of the bourse due to US grand strategy. Bottom Line: We prefer to play China’s growth recovery via outside countries that export into China, such as Sweden, Australia, and Brazil. The US election may support the Chinese equity rally if Biden wins, but tech equities should continue to underperform the rest of the bourse due to US grand strategy which will remain focused on constraining China’s tech ambitions. North Korea Is Not A Red Herring – But Taiwan Is Entirely Underrated The Taiwan Strait remains the chief geopolitical risk. Xi Jinping’s reassertion of Beijing’s supremacy within China’s sphere of influence has led to a backlash in Taiwanese politics and a confrontational posture across the Strait that is being expressed in saber-rattling and low-level economic sanctions that could easily escalate. Chart 6Taiwan Remains #1 Geopolitical Risk
Taiwan Remains #1 Geopolitical Risk
Taiwan Remains #1 Geopolitical Risk
Military exercises and jingoistic rhetoric are also heating up, not only directly relating to Taiwan but also in the neighboring South China Sea, which is critical to national security for all geopolitical actors in Northeast Asia. On August 26 Beijing testing two anti-ship ballistic missiles known as “aircraft carrier killers” in the South China Sea (the DF-21D and the DF-26B). We have long argued that the lack of clarity over whether the US would uphold its defense obligations to Taiwan makes the situation ripe for misunderstandings. The US Naval Institute has recently confirmed the validity of fears about a full-scale conflict in the near term.2 Neither Beijing nor Taipei nor Washington has crossed a red line. But China’s imposition of legislative dependency on Hong Kong highlights the incompatibility of the Communist Party’s governing model with western liberalism. The “one country, two systems” formulation has become unacceptable to the Taiwanese people, who want to preserve their autonomy indefinitely. The US ban on doing business with Huawei extends to foreign companies that use US parts or designs, squeezing Taiwanese companies (Chart 6, top panel). War is possible, but our base case still holds that the mainland will first use economic means. In particular it will impose economic sanctions, either precipitating or in response to a Fourth Taiwan Strait Crisis. The market continues to underrate the enormous risk to the Taiwanese dollar, as captured by the low level of our risk indicators (Chart 6, second panel). We continue to recommend shorting Taiwan relative to emerging markets. Taiwan is a short relative to South Korea, in particular, which stands to benefit from any negative turn of events in cross-strait relations. Korean equities are finally perking up, though the US tech war with China is weighing on the South Korean tech sector (Chart 7, top panel). We see this as a geopolitical opportunity given that both China and the US will need South Korean companies as they divorce each other. Korean political risk, however, may also be shifting from adequately priced to underrated. The risk premium has trended upward since President Trump’s diplomatic overture to leader Kim Jong Un stopped making progress (Chart 7, second and third panels). We have largely dismissed concerns about North Korea since the reduction of tensions in late 2017 due to our assessment that diplomacy would remain on track throughout Trump’s first term. This has proved to be the case, but it is still possible that North Korea could prove globally relevant before the US election. Chart 7North Korea A Non-Negligible Risk
North Korea A Non-Negligible Risk
North Korea A Non-Negligible Risk
The reason stems from rumors of Kim Jong Un’s health problems earlier this year. We noted at the time that it was suspicious that preparations for Kim’s sister, Kim Yo Jong, to take on greater responsibilities within the Politburo of the Worker’s Party seemed to predate reports of Kim Jong Un’s illness. For the North Korean state to continue to promote her implies that something may indeed be amiss. In fact, she has missed two Politburo meetings after her aggressive public relations campaign against South Korea was called off this summer. It is possible she got too much attention as the Number Two person in the regime. The South Korean National Intelligence Service is debating her status with the Defense Ministry and Unification Ministry. What is clear is that Kim Jong Un is preparing a new five-year economic plan, to be launched in January 2021, and that he is eager to share any blame for disastrous internal conditions in the country amid the global pandemic and recession. The market is typically correct not to hyperventilate over North Korean risks, but after 2016 North Korea is no longer a “red herring.” First, any domestic power struggle would occur at an immensely inconvenient time given the breakdown in US-China trust. Second, as the North manages any internal problems through its opaque and untested political process, it could be pressed into making a show of force that would either embarrass and antagonize President Trump, or provoke a forceful response from a future President Biden, given that North Korea in theory has the raw capability to deliver a crude nuclear weapon to the continental United States. If any US president makes a show of force, it will antagonize China and could lead to a major standoff. This would upset the markets at least temporarily. We are long Korean equities and would also look favorably on Korean tech. A geopolitical risk premium could temporarily undercut these stocks if North Korean diplomacy fails around the US election. But the risk is globally relevant only if Pyongyang somehow sparks a standoff between the US and China. Otherwise a major Korean peninsula crisis is far less of a concern than that of a crisis in the Taiwan Strait. Matt Gertken Vice President Geopolitical Strategy mattg@bcaresearch.com Footnotes 1Financial Times. 2 See Admiral James A. Winnefeld and Michael J. Morell, "The War That Never Was?" US Naval Institute Proceedings 146: 8 (August 2020), usni.org. Section II: GeoRisk Indicator China
China: GeoRisk Indicator
China: GeoRisk Indicator
Russia
Russia: GeoRisk Indicator
Russia: GeoRisk Indicator
UK
UK: GeoRisk Indicator
UK: GeoRisk Indicator
Germany
Germany: GeoRisk Indicator
Germany: GeoRisk Indicator
France
France: GeoRisk Indicator
France: GeoRisk Indicator
Italy
Italy: GeoRisk Indicator
Italy: GeoRisk Indicator
Canada
Canada: GeoRisk Indicator
Canada: GeoRisk Indicator
Spain
Spain: GeoRisk Indicator
Spain: GeoRisk Indicator
Taiwan
Taiwan: GeoRisk Indicator
Taiwan: GeoRisk Indicator
Korea
Korea: GeoRisk Indicator
Korea: GeoRisk Indicator
Turkey
Turkey: GeoRisk Indicator
Turkey: GeoRisk Indicator
Brazil
Brazil: GeoRisk Indicator
Brazil: GeoRisk Indicator
Section III: Geopolitical Calendar
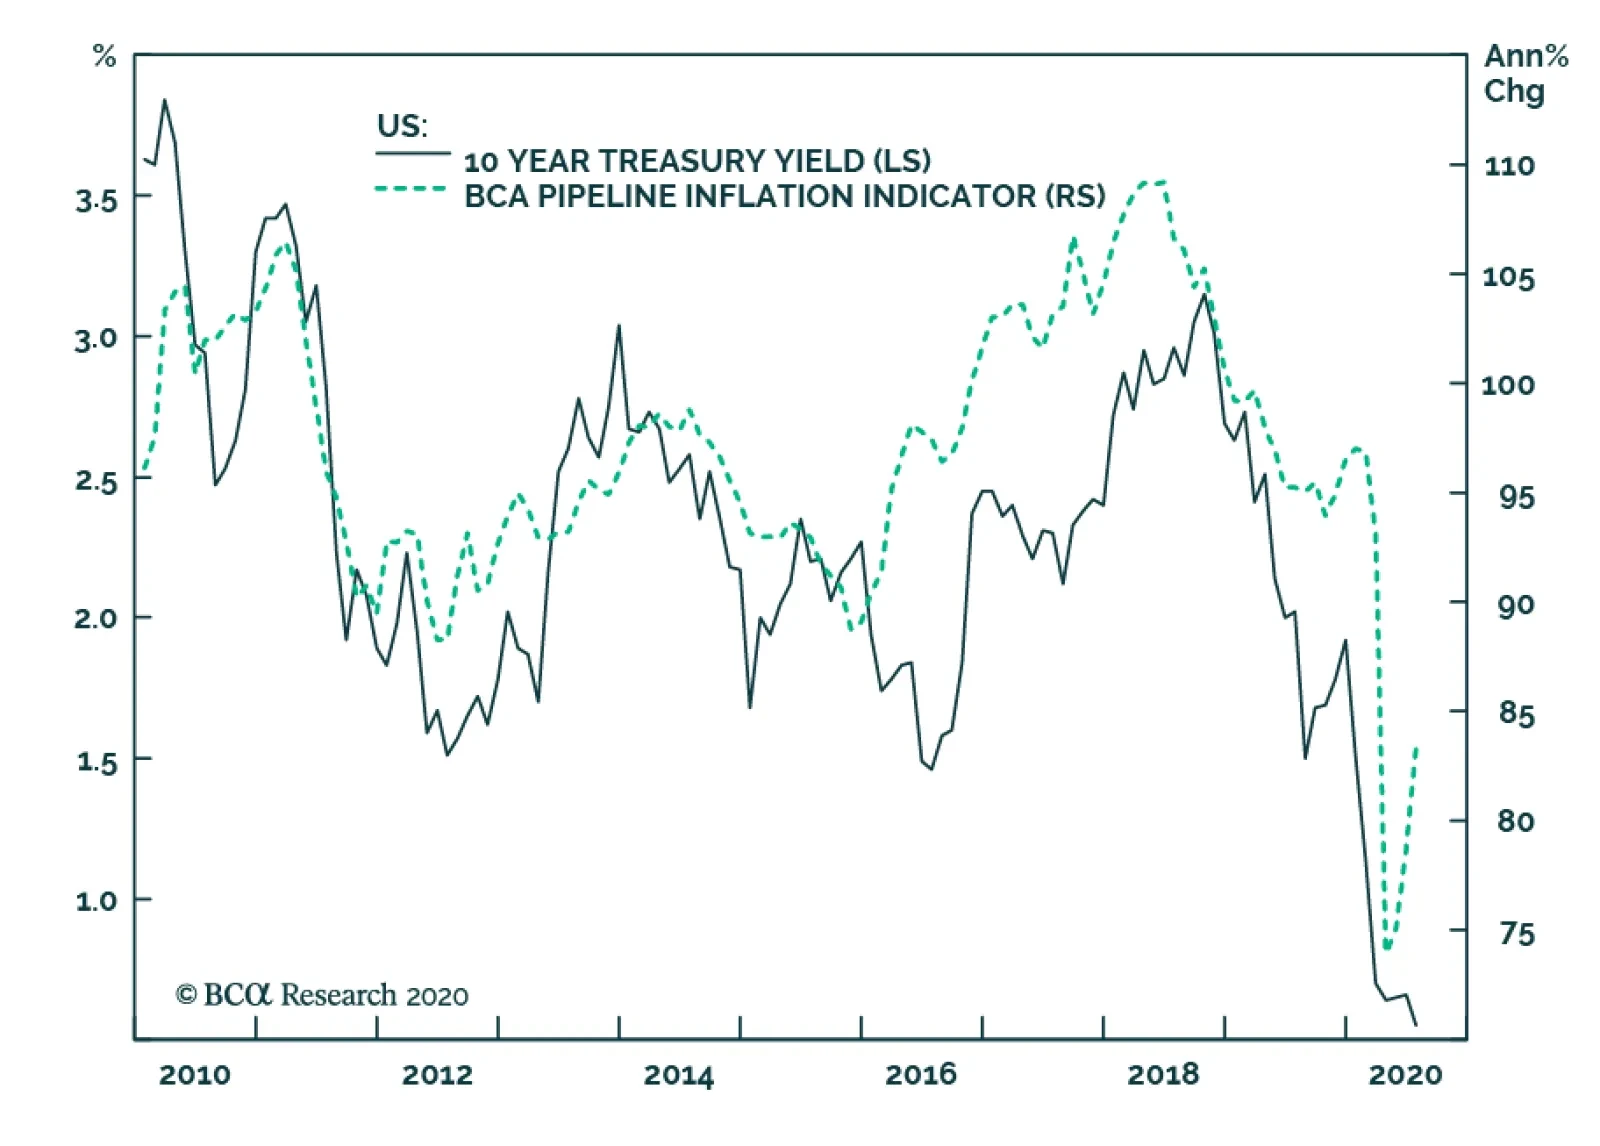
Federal Reserve Chair Jerome Powell’s long-awaited policy speech outlining the Fed’s goal of reviving US labor markets and targeting an average inflation rate of 2% over the long term was cheered on by US equity markets, which promptly moved higher in a…