Policy

Highlights Historically, soft-budget constraints have typically been followed by periods of poor equity market performance. Soft-budget constraints could produce two distinct economic scenarios: malinvestment or inflation. Both are negative for equity investors. Odds are that the US will continue to pursue easy money policies, sowing the seeds of US equity underperformance in the years ahead. In contrast to the US, EM (ex-China, Korea and Taiwan) are presently facing hard-budget constraints, which will weigh on their growth in the near term. However, forced restructuring could boost efficiency and productivity leading to their equity and currency outperformance in the coming years. Unlike other developing economies, China is not currently facing hard-budget constraints. However, the structural overhang from the past 10 years of soft-budget constraints is lingering on and in some cases is increasing. The Thesis The consensus in the investment industry is that cheap money and ample stimulus are good for share prices. We do not disagree with this thesis when it is applied to the near and medium-term equity strategy. However, excessive stimulus and easy money policies — we refer to these as soft-budget constraints — bode ill for share prices in the long run. The investment relevance of this thesis is as follows. Since March, the US has implemented the largest fiscal and central bank stimulus in the world and will likely continue doing so in the coming years (Chart I-1). Such soft-budget constraints will likely support the US economy for now. Nevertheless, they will also sow seeds of future US equity underperformance and currency depreciation. Conversely, many emerging economies (excluding China) have failed to provide sufficient fiscal and credit support to their economies (Chart I-2). The resulting hard-budget constraints will foreshadow their economic underperformance vis-à-vis the US in the coming months. Chart I-1Soft-Budget Policies Will Likely Become Structural In The US
Soft-Budget Policies Will Likely Become Structural In The US
Soft-Budget Policies Will Likely Become Structural In The US
Chart I-2EM Ex-China, Korea And Taiwan Are Facing Hard-Budget Constraints
EM Ex-China, Korea And Taiwan Are Facing Hard-Budget Constraints
EM Ex-China, Korea And Taiwan Are Facing Hard-Budget Constraints
That said, hard-budget constraints will force companies in these EM economies into deleveraging, restructuring and improving efficiency. Ultimately, such hard-budget constraints will benefit EM shareholders in the long run. This thesis has been a key rationale behind our decision to close the short EM / long S&P 500 strategy on July 30, and to turn negative on the US dollar on July 9. In the months ahead, we will be looking for an opportunity to upgrade EM equities to overweight versus the S&P500. BOX 1 Gauging Budget Constraints In our opinion, the best way to gauge budget constraints for the real economy is by monitoring changes in the money supply. This is due to the following reasons: First, net changes in the money supply account for all net loan origination. Second, the money supply also reflects the monetization of public and private debt by the central bank and commercial banks. When a central bank and commercial banks acquire a security from or lend to a non-bank entity, they create new money “out of thin air”. No one needs to save for the central bank and commercial banks to lend to or purchase a security from a non-bank. In short, savings versus spending decisions by economic agents (non-banks) do not change the stock of money supply. We have deliberated on these topics at length in past reports. Securities transactions among non-banks do not create new or destroy existing deposits, i.e., they have no impact on the money supply. Rather, these constitute an exchange of securities and existing deposits between sellers and buyers. Provided these types of transactions do not expand the money supply, they do not, according to our framework, alter budget constraints. Finally, the broad money supply, not central bank assets, is the ultimate liquidity available to economic agents to purchase goods and services as well as invest in both real and financial assets. Commercial banks’ excess reserves at the central bank – a large item on the central bank balance sheet - do not constitute a part of the broad money supply. Empirical Evidence The following are examples of soft-budget constraints that were followed by periods of weakening productivity growth, diminishing return on capital and poor equity market performance: 1. China’s soft budget constraints in 2009-10 Due to the post-Lehman crisis stimulus, the change in broad money exploded above 40% of GDP (Chart I-3, top panel). The economy boomed from early 2009 until early 2011 as cheap and abundant money super-charged investment and consumption. Chart I-3China: Easy Money Presaged Falling Return On Assets And Equity Underperformance
China: Easy Money Presaged Falling Return On Assets And Equity Underperformance
China: Easy Money Presaged Falling Return On Assets And Equity Underperformance
However, Chinese share prices — the MSCI China Investable equity index excluding technology, media and telecom (TMT) — peaked in H1 2011 in absolute terms (Chart I-3, second panel). Relative to the global equity index excluding TMT, the Chinese investable stocks index began underperforming in late 2010 (Chart I-3, third panel). The basis for this equity underperformance was falling return on assets for non-financial companies due to capital misallocation, breeding inefficiencies and diminishing productivity gains (Chart I-3, bottom two panels). In China, the excessive stimulus of 2009 and 2010 and ensuing recurring rounds of soft-budget constraints put a floor under the economy but have destroyed shareholder value. 2. Money overflow in EM ex-China in 2009-10. China’s boom in 2009-10 produced a bonanza for other emerging economies. Not only Chinese imports from developing economies boosted the latter’s balance of payments and income but also international investors rushed into EM equity and fixed income. EM companies and banks took advantage of easy financing and their international borrowing skyrocketed. Finally, EM policy makers stimulated and domestic bank credit boomed. This period of soft-budget constraints led to complacency, lower productivity, falling return on capital and/or inflation in the following years (Chart I-4). Their financial markets performance in the 10 years that followed the soft-budget constraints in 2009-10 has been dismal. The share price index of EM ex-China, Korea and Taiwan as well as the total return on their currencies (including the carry) versus the US dollar have been in a bear market (Chart I-4, bottom two panels). 3. The credit and equity bubbles in Japan, Korea and Taiwan of the late 1980s Money and credit bubbles proliferated in Japan, Korea and Taiwan in the late 1980s (Chart I-5, Chart I-6 and Chart I-7). Chart I-4EM Ex-China, Korea And Taiwan: Easy Money In 2009-10 Sowed Seeds Of Bear Market
EM Ex-China, Korea And Taiwan: Easy Money In 2009-10 Sowed Seeds Of Bear Market
EM Ex-China, Korea And Taiwan: Easy Money In 2009-10 Sowed Seeds Of Bear Market
Chart I-5Japan: Easy Money Produced Equity Bubble And Lower Productivity Growth
Japan: Easy Money Produced Equity Bubble And Lower Productivity Growth
Japan: Easy Money Produced Equity Bubble And Lower Productivity Growth
Chart I-6Korea: Easy Money Produced Equity Bubble And Lower Productivity Growth
Korea: Easy Money Produced Equity Bubble And Lower Productivity Growth
Korea: Easy Money Produced Equity Bubble And Lower Productivity Growth
Chart I-7Taiwan: Easy Money Produced Equity Bubble And Lower Productivity Growth
Taiwan: Easy Money Produced Equity Bubble And Lower Productivity Growth
Taiwan: Easy Money Produced Equity Bubble And Lower Productivity Growth
Their productivity growth rolled over in the late 1980s amid easy money policies. Share prices deflated in Japan, Korea and Taiwan in the 1990s (please refer to the middle and bottom panels of Charts I-5, I-6 and I-7). Chart I-8ASEAN In 1990s: Soft-Budget Constraints Heralded Productivity Demise
ASEAN In 1990s: Soft-Budget Constraints Heralded Productivity Demise
ASEAN In 1990s: Soft-Budget Constraints Heralded Productivity Demise
4. The boom-bust cycle in emerging Asia ex-China in the 1990s Soft-budget constraints prevailed in many emerging Asian economies in the first half of the 1990s. Foreign money inflows and domestic bank credit produced an economic boom. The consequences of such soft-budget constraints were debt-financed malinvestment, falling return on assets and massive current account deficits (Chart I-8). All of these culminated in epic currency and banking crises. 5. The credit bubbles in the US and Europe leading to the 2008 crash Lax credit standards propelled credit and property booms in the US and Southern Europe in the period of 2002-2007. Broad money ballooned in the euro area and swelled in the US (please refer to Chart I-1 on page 2). These property bubbles unraveled in 2007-08. These are well known, and we will not delve into the details. Soft-Budget Constraints Lead To Malinvestment Or Inflation Soft-budget constraints could produce two distinctive economic scenarios – malinvestment or inflation. Both are negative for equity investors. The malinvestment scenario occurs when easy money propels undisciplined capital spending. Easy and abundant money boosts medium-term growth and, thereby, creates the illusion of an economic miracle. The latter renders companies, creditors, investors and government officials complacent. Creditors lend a lot and do so based on optimistic assumptions while companies expand hastily and invest carelessly. The result is capital misallocation, i.e., companies pour money into projects that do not ultimately produce sufficient cash flow. Equity investors project high growth expectations into the future and bid up share prices. Government officials preside over an unsustainable growth trajectory overlooking lurking systemic risks and deteriorating economic fundamentals. Easy money and unlimited financing typically bode ill for efficiency and productivity— this is simply due to human nature. Companies neglect efficiency considerations and, as a result, productivity stagnates. Consequently, cost overruns and unprofitable investments suffocate corporate profits. Declining corporate earnings at a time of expanded capital base culminate in a collapse of return on capital. This is the crucial reason why share prices drop. As profits and return on capital decline, companies retrench by cutting costs and halting investment spending. Defaults mushroom, leading creditors to cut new financing. The inflation scenario transpires when easy money boosts consumption more than investment. Easy money and unlimited financing lift household income and consumption. This can arise from a large fiscal stimulus or private sector's borrowing and spending. On the one hand, robust household income growth inevitably leads to higher wage growth expectations. On the other hand, limited investment brings about productivity stagnation. Mounting wages and languishing productivity growth lead to rising unit labor costs and, ultimately, result in a corporate profit margin squeeze. Faced with corporate profit margin shrinkage, companies either raise prices, i.e., pass through higher costs, or retrench by shedding labor and shrinking capital spending even further. The latter produces a widespread economic downturn, and stifles business profits and share prices. A symptom of higher inflation is a wider current account deficit. With an economy’s productive capacity lagging behind demand, the gap between the two can be filled in by imports. In addition, escalating domestic costs make a country less competitive, which inhibits exports and bloats imports. When a central bank is unwilling to tighten monetary policy meaningfully amid high and rising inflation and/or a widening current account deficit, it falls behind the inflation curve. This constitutes a very bearish backdrop for the exchange rate. Currency depreciation erodes the country’s equity returns in common currency terms versus other bourses. Can an economy with soft-budget constraints, i.e., booming money growth, avoid both malinvestment and inflation? Yes, it can if it is able to boost productivity growth so that it avoids systemic capital misallocation (i.e., investments produce reasonable returns to pay off to creditors and shareholders) and escapes higher inflation by expanding output faster to meet growing demand. However, achieving higher productivity growth amid soft-budget constraints is easier said than done. Bottom Line: The scenario of malinvestment has been playing out in China since 2009. Capital misallocation also occurred in the US and parts of Europe during the 2002-2007 credit boom, and took place in Japan, Korea and Taiwan in the late 1980s. Malinvestment, with some elements of inflation, occurred in emerging Asian countries prior the 1997-98 crises as well as in many EM economies like India, Indonesia and Brazil in 2009-2012. Investment Implications It is fair to say that the unprecedented economic downturn in the US warranted an exceptionally large stimulus. The question for the next several months and years is whether US authorities will: overstay easy policies and make soft-budget constraints a permanent feature of the US economy, or tighten policy earlier than warranted, or navigate policy perfectly so that the economy is neither too hot nor too cold. Our sense is that US authorities will overstay their easy money policies. If the US continues to pursue macro policies in the form of soft-budget constraints, will the nation experience malinvestment or inflation? Our sense is that the US will likely experience asset bubbles and inflation. As the Federal Reserve stays behind the inflation curve in the coming years, the US dollar will be in a multi-year downtrend. Hence, the strategy should be selling the greenback into rebounds. We switched our short positions in select EM currencies— such as BRL, CLP, ZAR, TRY, KRW, IDR and PHP —away from the US dollar to an equal-weighted basket of the euro, CHF and JPY on July 9. For now, EM currencies will lag DM currencies. US equity outperformance versus the rest of the world is in the late innings (Chart I-9). The pillars of US equity underperformance in common currency terms will be excessive US equity valuations, a potential new era of US return on capital underperforming the rest of the world and greenback depreciation. Chart I-9US Equity Outperformance Is In Very Late Stages
US Equity Outperformance Is In Very Late Stages
US Equity Outperformance Is In Very Late Stages
The top panel of Chart I-10 illustrates that the difference between US investors owning international stocks and non-US investors holdings of US equities is at a record low. This reveals that both US and foreign investors currently "over-own" US stocks versus non-US equities. Perfect timing of a structural trend reversal is impossible, but we believe US equity outperformance will discontinue before year-end. That was the rationale behind terminating our short EM / long S&P 500 strategy and upgrading EM equity allocation from underweight to neutral. In contrast to the US, EM (ex-China, Korea and Taiwan) are presently facing hard-budget constraints which will weigh on their economic performance in the near term. This is why we are not rushing to upgrade EM stocks and currencies to overweight. However, the lack of cheap money will force these EM countries and their companies to do the right things: deleverage households and companies, clean up and recapitalize their banking systems and undertake corporate restructuring. Ultimately, hard-budget constraints will likely sow the seeds of high productivity and, with it, equity and currency outperformance in the years to come. China is a tricky case. On a positive note, it has not stimulated as much during the pandemic as it did in 2009. Besides, policymakers are now aware of the ills that come with soft-budget constraints and have been working hard to address these. Critically, the Chinese population, businesses and the authorities are all united in the nation’s confrontation with the US. Complacency in this context is not a major risk and the focus on efficiency and productivity will be razor sharp. On the negative side, the credit, money and property bubbles that had not been dealt with before the pandemic are now increasing with the stimulus. Continued malinvestment and falling return on capital in China’s old economy sectors is signified by the very poor performance of China’s cyclical “old economy” stocks (Chart I-11, top panel). In turn, bank share prices are making new cyclical lows underscoring their worsening structural outlook (Chart I-11, bottom panel). Chart I-10Global Equity Investors Over-Own US Stocks Versus International Ones
Global Equity Investors Over-Own US Stocks Versus International Ones
Global Equity Investors Over-Own US Stocks Versus International Ones
Chart I-11Chinese Equities: "Old Economy" Cyclicals And Banks Are Dismayed By Structural Malaises
Chinese Equities: "Old Economy" Cyclicals And Banks Are Dismayed By Structural Malaises
Chinese Equities: "Old Economy" Cyclicals And Banks Are Dismayed By Structural Malaises
Weighing the pros and cons, we infer that the cyclical recovery in China has further to run. This will support China’s growth and equity outperformance for now. That is why we continue to recommend overweighting China within an EM equity portfolio. However, as the credit and fiscal impulses fade starting in H1 next year, structural malaises will resurface posing risks to China’s equity outperformance. Arthur Budaghyan Chief Emerging Markets Strategist arthurb@bcaresearch.com Footnotes Equities Recommendations Currencies, Credit And Fixed-Income Recommendations
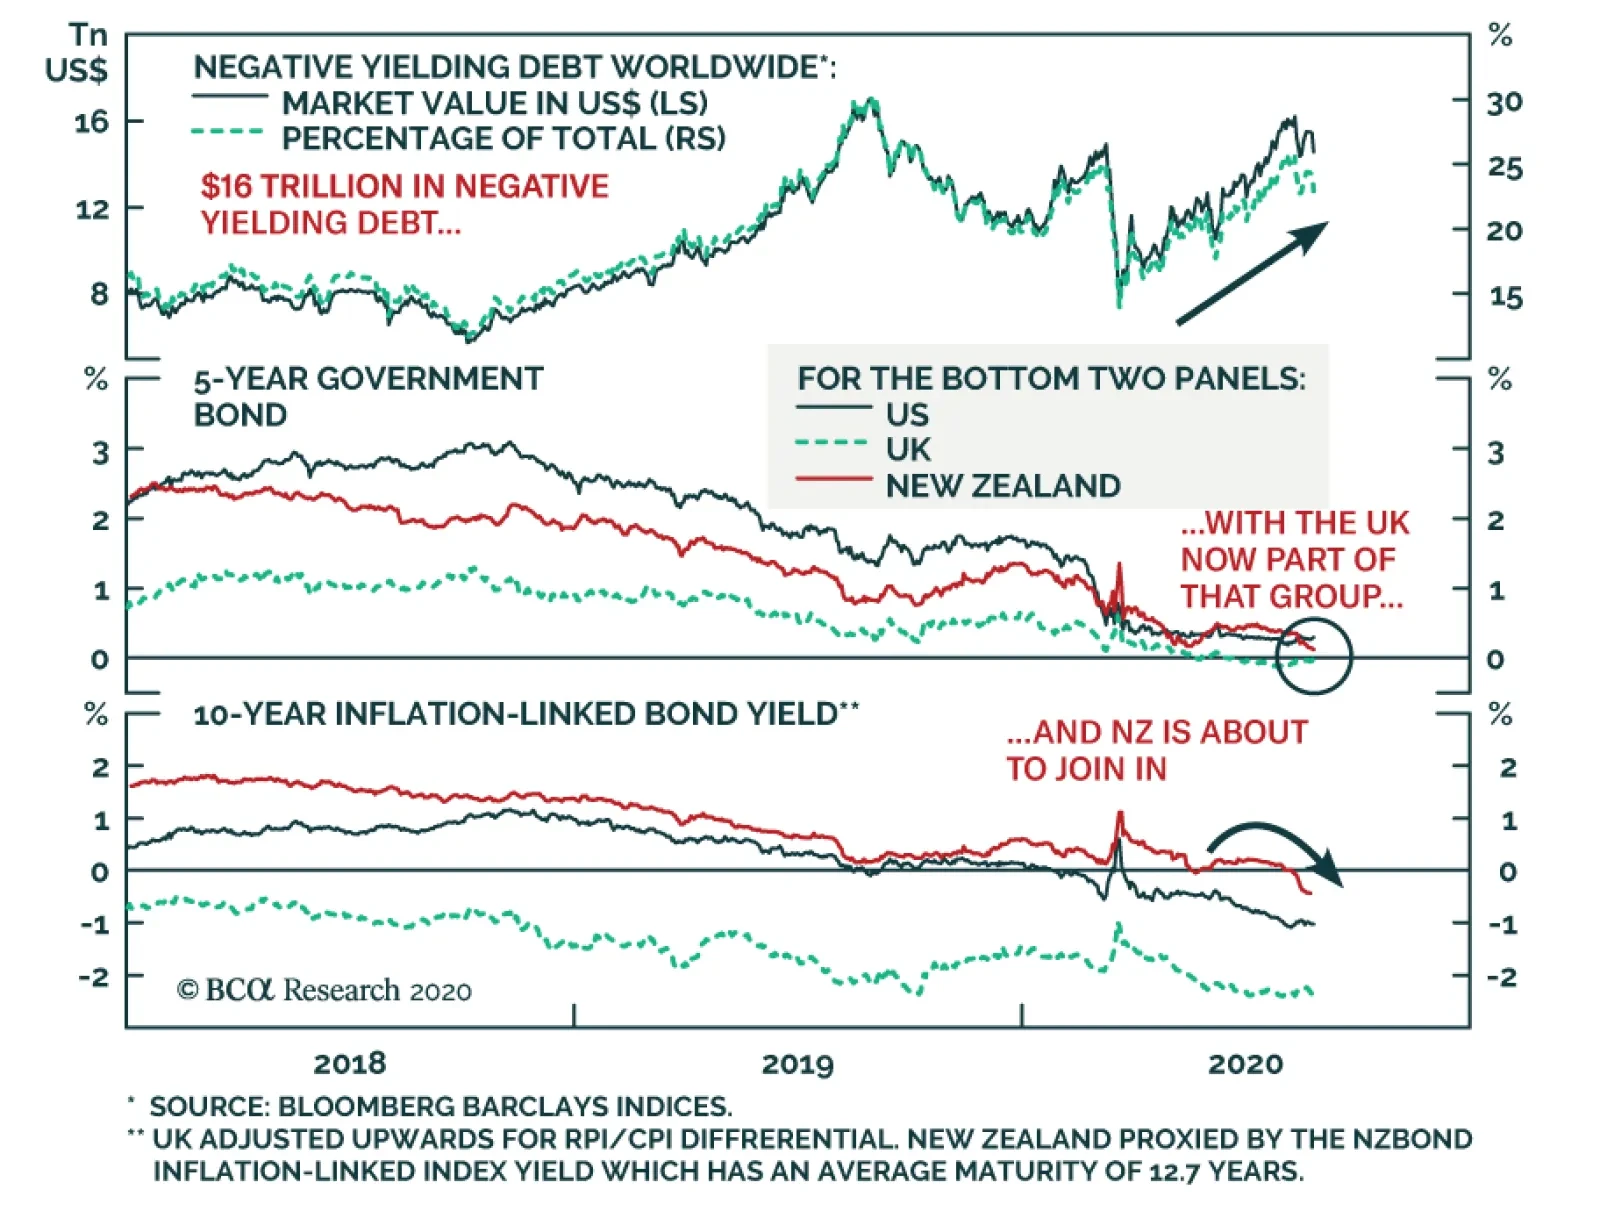
Highlights Negative Rates: The persistence of the COVID-19 pandemic is intensifying pressure on policymakers in many countries to provide more stimulus. The odds that a new central bank will join the negative policy interest rate club are increasing. UK vs. New Zealand: Recent comments from Bank of England and Reserve Bank of New Zealand officials have hinted at the possibility of a shift to negative policy rates, should conditions warrant. The odds are greater for such a move in New Zealand. Go long 10-year New Zealand government bonds versus 10-year UK Gilts (currency-hedged into GBP) on tactical (0-6 months) basis. Feature Policymakers around the world are, once again, under increasing pressure to contemplate new responses to the COVID-19 pandemic, which continues to rage through much of the US and emerging world and is flaring up again across Europe. Additional fiscal policy measures will likely be necessary, but it is increasingly politically difficult in many countries to ramp up government support measures – or even extend existing programs - after the massive increase in deficits and debt undertaken this past spring. Chart of the WeekA Bull Market In Negative-Yielding Debt
A Bull Market In Negative-Yielding Debt
A Bull Market In Negative-Yielding Debt
An inadequate fiscal response will put even more pressure on monetary policy to give a boost to virus-stricken economies. Yet fresh options there are even more limited. Policy rates are already near 0% in all developed nations, with central banks promising to keep them there for at least the next couple of years. Central banks are also rapidly expanding their balance sheets to buy up assets via quantitative easing programs. A move to sub-0% policy rates may be the next option for central banks not already there like the ECB and the Bank of Japan. Although it remains questionable how much more stimulus monetary policy could hope to deliver. Government bond yields are at or near historic lows in most countries, while equity and credit markets continue to enjoy a spectacular recovery from the rout in February and March. The stock of global negative-yielding debt has risen to $16 trillion, according to Bloomberg, which remains close to the highs seen over the past few years (Chart of the Week). So who will be the next central bank to cross that bridge into negative rate territory? US Federal Reserve Chairman Jerome Powell, Bank of Canada Governor Tiff Macklem and Reserve Bank of Australia Governor Philip Lowe have all publicly dismissed the need for negative rates in their economies. Recent comments from Bank of England (BoE) Governor Andrew Bailey and Reserve Bank of New Zealand (RBNZ) Governor Adrian Orr, however, have suggested that negative rates could be a future policy choice, if needed. New Zealand looks like the more likely candidate to go to negative rates sometime in the next 3-6 months. Markets are increasingly discounting those outcomes. The UK Gilt yield curve is trading below 0% out to the 6-year maturity, while New Zealand nominal government bond yields are trading at or below a mere 0.3% out to 7-years (and where real yields on inflation-linked bonds have recently turned negative). Of the two, New Zealand looks like the more likely candidate to go to negative rates sometime in the next 3-6 months. A Negative Rates Checklist For The UK & New Zealand In a Special Report we published back in May, we looked back at the decisions that drove the move to negative policy rates by the ECB, Bank of Japan, Swiss National Bank and the Riksbank, with a goal of determining if such an outcome could happen elsewhere.1 We were motivated by the growing market chatter suggesting that the Fed would eventually be forced to cut the fed funds rate to sub-0% territory to fight the deep COVID-19 recession. Chart 2The Fundamental Case For Negative Rates
The Fundamental Case For Negative Rates
The Fundamental Case For Negative Rates
We concluded in that report that such a move was unlikely, but could occur if there was a contraction in US credit growth and/or a spike in the US dollar to new cyclical highs, both outcomes that would result in a major drop in US inflation expectations. Such moves preceded the shift to negative rates in those other countries during 2014-16, as a way to lower borrowing costs and weaken currencies. Since that May report, the US dollar has depreciated and US credit growth has continued to expand amid very stimulative financial conditions, thus the odds of the Fed having to cut the funds rate below 0% are very low. The Fed is far more likely to dovishly alter its forward guidance, or even institute yield curve control to cap US Treasury yields, to deliver additional monetary easing, if necessary. (NOTE: next week, we will be discussing the Fed’s next possible policy moves, and the potential impact on financial markets, in a Special Report jointly published with our colleagues at BCA Research US Bond Strategy). The pressure to consider negative interest rates in the non-negative rate developed market countries remains strong, however, after the major increase in unemployment rates and sharp falls in inflation seen earlier this year (Chart 2). Putting current levels of both into a simple Taylor Rule formula suggests that the “appropriate” level of nominal policy rates is currently negative in the US and Canada, mainly because of the double-digit unemployment rates in those countries. Taylor Rules for the UK and New Zealand remain slightly positive, however, at 0.2% and 0.9%, respectively. Yet the forecasts for inflation and unemployment from the BoE and RBNZ suggest a diverging dynamic between the two over the next couple of years. The BoE is forecasting a very sharp recovery from the 2020 recession, with the UK unemployment rate projected to fall back to 4.7% by 2022 from the surge to 7.5% this year. At the same time, the RBNZ’s forecasts are more cautious, with the New Zealand unemployment rate expected to fall to only 6.1% in 2022 from the projected 8.1% peak at the end of this year. Thus, the implied Taylor Rules using those forecasts suggest a need for negative rates in New Zealand, but a rising path for UK policy rates over the next two years (Chart 3). Clearly, markets are taking the RBNZ’s open talk about negative interest rates to heart, while remaining skeptical that the BoE’s optimistic path for the post-virus UK economy will come to fruition. Despite the diverging trajectory in policy rates implied by the two central banks’ forecasts, markets are pricing in a more similar path for rates. Forward overnight index swap (OIS) rates are discounting slightly negative rates in the UK and New Zealand to the end of 2022 (Chart 4). Clearly, markets are taking the RBNZ’s open talk about negative interest rates to heart, while remaining skeptical that the BoE’s optimistic path for the post-virus UK economy will come to fruition. Chart 3Mapping Central Bank Projections Into The Taylor Rule
Mapping Central Bank Projections Into The Taylor Rule
Mapping Central Bank Projections Into The Taylor Rule
Chart 4Markets Pricing Slightly Negative Rates In The UK & NZ
Markets Pricing Slightly Negative Rates In The UK & NZ
Markets Pricing Slightly Negative Rates In The UK & NZ
The individual cases of the UK and New Zealand as current candidates for negative interest rates can help derive a list of factors to monitor to determine if negative rates would be a more likely policy outcome for any central bank. Based on our read of recent comments from BoE and RBNZ officials, combined with our assessment of what took place in other countries that moved to negative rates in the past, we would include the following in any Negative Rates Checklist: Policymaker perceptions on the effective lower bound (ELB) on policy rates For central bankers, the ELB (or “reversal rate”) is defined as the policy rate below which additional rate cuts are deemed counterproductive to stimulating the economy. For example, cutting rates too low could limit the ability of the banking system to earn interest income, thus hindering banks’ appetite to make new loans. Chart 5Could The Effective Lower Bound Be Negative In the UK & NZ?
Could The Effective Lower Bound Be Negative In the UK & NZ?
Could The Effective Lower Bound Be Negative In the UK & NZ?
For most central banks, the belief is that the ELB is at or just above 0%. It is possible that because of a structural shift, a central bank could deem the ELB to be negative in that particular economy. That could be because of a sharp deterioration in trend economic growth or a rapid rise in debt or a belief that the banking system was strong enough to handle the income shock of negative rates. Currently, potential GDP growth rate estimates have been marked down in both the UK and New Zealand because of the 2020 COVID-19 recession (Chart 5). In New Zealand, taking the average of the RBNZ’s real GDP growth forecasts for the next three years as a proxy for trend growth suggests that trend growth is now around 1.2%, similar to the reduced estimates of UK potential GDP growth. In terms of debt levels, the ratio of total public and private non-financial debt to GDP is close to 400% in the UK, which is far greater than the 126% level of that same ratio in New Zealand. In terms of banking system health, banks in both countries are well capitalized. The Tier 1 capital ratio of the major UK banks is 14.5%, while the similar figure in New Zealand is 13.5%; both figures are provided by the BoE and RBNZ, respectively. Stress tests run by the central banks in recent months indicate that capital levels will remain adequate even after the likely hit from loan losses due to the severity of the 2020 economic downturn. Our assessment is that both the BoE and RBNZ can claim that the ELB is in fact below zero, based on the slow pace of trend economic growth in both. In the case of the UK, high debt levels also suggest that policy rates may have to go below 0% to generate any stimulus to growth via new borrowing activity. In both countries, the central banks can claim that the banking system can handle a period of negative rates, if policymakers go down that road to boost economic growth. Economic confidence is depressed An extended period of weak economic activity and depressed confidence can trigger a need to move to negative policy rates if rates were already at 0%. Currently, UK economic confidence is in tatters after the -20% decline in real GDP seen in the second quarter of 2020. The GfK consumer confidence index remains at recessionary low levels, while the BoE Agents’ survey of UK firms shows a collapse in plans for investment and hiring over the next year (Chart 6). Chart 6A Severe Hit To UK Growth & Confidence
A Severe Hit To UK Growth & Confidence
A Severe Hit To UK Growth & Confidence
New Zealand, the economy contracted -1.6% in the first quarter of the year with consensus forecasts calling for a -20% collapse in the second quarter. Yet economic confidence is surprisingly resilient. The Westpac survey of consumer confidence is falling, but the July reading was still above typical recessionary lows (Chart 7). The ANZ survey of business investing and hiring intentions has been surprisingly upbeat of late, rebounding from the April trough but still below pre-virus levels. Our assessment here is that the BoE has a stronger case for moving to negative rates, based on the deeper collapse in confidence in the UK compared to New Zealand. Inflation expectations are too low If inflation expectations remain too low once rates have hit 0%, then inflation-targeting central banks must consider more extraordinary options to revive inflation expectations. That could take the form of extended forward guidance on future interest rate moves, expanding the size and scope of quantitative easing programs, or cutting policy rates into negative territory. Currently, inflation expectations remain elevated in the UK. 5-year CPI swaps, 5-years forward, are now at 3.6%, while the Citigroup/YouGov survey of household inflation expectations 5-10 years out sits at 3.3% (Chart 8). In New Zealand, the RBNZ inflation survey shows inflation expectations have fallen into the bottom half of the central bank’s 1-3% target band. Chart 7Only A Very Modest Downturn In NZ
Only A Very Modest Downturn In NZ
Only A Very Modest Downturn In NZ
Chart 8Inflation Expectations Are Much Lower In NZ
Inflation Expectations Are Much Lower In NZ
Inflation Expectations Are Much Lower In NZ
Our assessment here is that only the RBNZ can argue for a move to negative rates because of weak inflation expectations. Our assessment here is that only the RBNZ can argue for a move to negative rates because of weak inflation expectations. Financial conditions turning more restrictive Chart 9The News Is Mixed On UK & NZ Financial Conditions
The News Is Mixed On UK & NZ Financial Conditions
The News Is Mixed On UK & NZ Financial Conditions
Another reason why a central bank could try negative rates is if asset prices were trading at depressed levels even after policy rates were at 0%. The current signals on financial conditions in the UK and New Zealand are generally stimulative, but more so in the latter. Currently, the MSCI equity index for New Zealand is nearing the all-time high reached in 1987, while the equivalent UK equity index is languishing near the lows of the past decade (Chart 9). The New Zealand dollar and British pound have both bounced off the cyclical lows seen earlier this year (more on that later). The annual growth rates of nominal house prices have started to pick up in both countries, but with a faster pace in New Zealand. Finally, corporate credit spreads have narrowed sharply since the end of the first quarter in both countries, with New Zealand spreads actually falling below the pre-virus levels seen this year. Our assessment here is that financial conditions in both countries remain generally stimulative, but more so in New Zealand. Neither central bank can point to restrictive financial conditions as a reason to move to negative rates. Signs of impairment of the transmission of policy interest rates to actual borrowing costs If bank lending growth was weakening and/or borrowing rates remained high relative to policy rates, this could be a sign that negative policy rates are necessary to induce greater loan demand by lowering borrowing costs. Chart 10NZ Lenders Are Not Passing On RBNZ Rate Cuts
NZ Lenders Are Not Passing On RBNZ Rate Cuts
NZ Lenders Are Not Passing On RBNZ Rate Cuts
Currently, the annual growth rate of bank lending is slowing in New Zealand, but remains positive at 4.5% (Chart 10). Loan growth in the UK is now a much more robust 7.4%, but some of that growth is due to UK companies drawing down lines of credit with their banks to survive during the COVID-19 lockdowns. A bigger issue is the lack of the full pass-through of the RBNZ’s recent cuts into borrowing rates, especially for home loans. The spread between 5-year fixed mortgage rates and the RBNZ cash rate is now an elevated 387bps, while the equivalent spread in the UK is much lower at 160bps. Our assessment here is that only the RBNZ can argue that an impaired transmission of policy rate cuts to actual borrowing rates could justify a move to negative rates. Scope For Currency Depreciation For any central bank, a benefit of a negative interest rate policy is that it can trigger more stimulus via a weaker currency. This can help boost economic growth by making exports more competitive, while also helping lift inflation by raising the cost of imports. On the growth side, a weaker currency would be somewhat more helpful for New Zealand where exports are 19% of GDP, compared to 16% in the UK. (Chart 11). That is an important distinction, as there is greater scope for the New Zealand dollar (NZD) to depreciate if the RBNZ went to negative rates than for the British pound (GBP) to weaken if the BoE did the same. Chart 11A New Experiment? Negative Rates With A Current Account Deficit
A New Experiment? Negative Rates With A Current Account Deficit
A New Experiment? Negative Rates With A Current Account Deficit
Chart 12BoE Does Not Need To Go Negative To Weaken The Pound
BoE Does Not Need To Go Negative To Weaken The Pound
BoE Does Not Need To Go Negative To Weaken The Pound
Perhaps the most interesting feature of this entire negative rates discussion is that, for the first time in the “negative rates era”, central banks of countries with current account deficits are considering pushing policy rates below 0%. For the first time in the “negative rates era”, central banks of countries with current account deficits are considering pushing policy rates below 0%. The UK and New Zealand both have similarly sized current account deficits, equal to -3.3% and -2.7% of GDP, respectively (middle panel). At the same time, both countries have net foreign direct investment surpluses roughly equal to those current account deficits, leaving their basic balances around 0 (bottom panel). In other words, both countries currently attract enough long-term foreign direct investment inflows to “fund” their current account deficits. Foreign investors may be less willing to continue buying as many New Zealand or UK financial assets if either country went to a negative interest rate to intentionally weaken the currency, as the RBNZ has publicly stated would be a desired outcome of such a move. Chart 13RBNZ Could Go Negative To Weaken The Kiwi
RBNZ Could Go Negative To Weaken The Kiwi
RBNZ Could Go Negative To Weaken The Kiwi
Our colleagues at BCA Foreign Exchange Strategy estimate that, on purchasing power parity (PPP) basis, the GBP/USD exchange rate is now -20% below its long-run fair value (Chart 12). The level of the currency is also broadly in line with the current level of interest rate differentials between the UK and the US (bottom panel). In other words, the GBP is already cheap and additional rate cuts would have limited impact in driving the currency lower. It is a different story for NZD/USD, which is fairly valued on a PPP basis but remains elevated relative to New Zealand-US interest rate differentials (Chart 13). Therefore, our assessment is that only the RBNZ can credibly generate meaningful currency weakness from a move to negative rates. Summing it all up Based on the elements of our Negative Rates Checklist, we deem it more likely for the RBNZ to go negative than the BoE. In the UK, there is less evidence pointing to a significantly impaired credit channel that could be remedied by negative rates, inflation expectations are elevated, and the pound is already at undervalued levels. In New Zealand, previous RBNZ rate cuts have not fully flowed through into bank lending rates, inflation expectations are low, and the New Zealand dollar is at fair value (and, therefore, has room to become cheaper via negative rates). Based on the elements of our Negative Rates Checklist, we deem it more likely for the RBNZ to go negative than the BoE. Bottom Line: The persistence of the COVID-19 pandemic is intensifying pressure on policymakers in many countries to provide more stimulus. The odds that a new central bank will join the negative policy interest rate club are increasing. Recent comments from Bank of England and Reserve Bank of New Zealand officials have hinted at the possibility of a shift to negative policy rates, should conditions warrant. The odds are greater for such a move in New Zealand. A Negative Rates Trade Idea: Go Long New Zealand Government Bonds Vs. UK Gilts Chart 14Go Long 10yr NZ Govt. Bonds Vs 10yr UK Gilts
Go Long 10yr NZ Govt. Bonds Vs 10yr UK Gilts
Go Long 10yr NZ Govt. Bonds Vs 10yr UK Gilts
Based on our analysis above, we are adding a new cross-country spread trade to our Tactical Overlay Trades list on page 18: going long 10-year New Zealand government bonds versus 10-year UK Gilts on a currency-hedged basis (i.e. hedging the NZD exposure into GBP). The trade is to be implemented using on-the-run cash bonds. The current unhedged NZ-UK 10-year yield spread is +36bps, but even on a hedged basis (using 3-month currency forwards) the yield differential is still positive at +23bps (Chart 14). We are targeting zero for the unhedged spread, to be realized sometime within the six months. We like this trade because it can win not only from a decline in New Zealand bond yields if the RBNZ goes to negative rates (as we think is increasingly likely), but also from a potential rise in Gilt yields if the BoE defies market pricing and does not go to negative rates. If both countries keep rates on hold, then the trade will earn a small positive spread over the current meagre level of Gilt yields. Robert Robis, CFA Chief Fixed Income Strategist rrobis@bcaresearch.com Footnotes 1 Please see BCA Research Special Report, "Negative Rates: Coming Soon To A Bond Market Near You?", dated May 20, 2020, available at gfis.bcaresearch.com. Recommendations The GFIS Recommended Portfolio Vs. The Custom Benchmark Index
Assessing The Leading Candidates To Join The Negative Rate Club
Assessing The Leading Candidates To Join The Negative Rate Club
Duration Regional Allocation Spread Product Tactical Trades Yields & Returns Global Bond Yields Historical Returns
Dear clients, China Investment Strategy will take a summer break next week. We will resume our publication on September 9th. Best regards, Jing Sima, China Strategist Highlights The threat of US sanctions has sparked fears of disconnecting Chinese financial institutions from US dollar access, driving urgency to accelerate the RMB internationalization process. China’s RMB internationalization process suffered from a sizable setback in 2016, but the trend has reversed in 2018. Since then China has shifted the strategy to broaden and enhance the RMB’s market demand and functions, as well as to establish systems to facilitate the strategy. In the foreseeable future, the RMB’s role in the global economy is far from challenging the US dollar as the world's dominant reserve currency; China's near-term goal to promote the use of the RMB beyond its borders is to minimize disruptions to China’s trade and investment activities threatened by US financial sanctions. Feature Since 2018 and in the wake of intensifying confrontations between the US and China, the Chinese government has shifted its strategy in promoting the internationalization of the RMB. Authorities have moved from a symbolic international recognition of the RMB to a more pragmatic approach of creating real market demand for the currency. Chart 1China Has Been Shedding USD Assets
China Has Been Shedding USD Assets
China Has Been Shedding USD Assets
It is not our baseline view that the US will take extreme measures and entirely cut off Chinese banks’ access to the US Clearing House Interbank Payments System (CHIPS) and the Society for Worldwide Interbank Financial Telecommunication (SWIFT). However, Beijing’s decoupling from the US dollar (USD) has been in process, diversifying its forex reserves away from the US dollar (USD) and increasing the use of the RMB in cross-border trade and investment (Chart 1). In the foreseeable future, it is neither possible nor is Chinese policymakers’ intention for the RMB to challenge the USD as the world's dominant reserve currency. Rather, we think that under the threat of US sanctions, the near-term goal is to minimize disruptions to China’s trade and investment activities. At the same time, the approach will make China “too big, too connected to fail” in the medium-to-long run and, therefore, minimize the potential for future threats of financial sanctions. China’s new approach to internationalize the RMB involves enhancing the currency’s three functions in the global market, and establishing and strengthening domestic systems to facilitate the enhancements: The RMB as an international settlement currency; The RMB as a commodity pricing currency; and The RMB as an international reserve currency. Most of these strategies still have a long way to go before having significant global market implications. However, these developments bear structural importance and investors should closely monitor them. RMB - An International Settlement Currency Chart 2Cross-Border RMB Settlement Is Picking Up
Cross-Border RMB Settlement Is Picking Up
Cross-Border RMB Settlement Is Picking Up
The RMB’s role in cross-border trade settlement suffered a major setback in 2016 when investor confidence plummeted following a rapid devaluation in China’s currency and equities. The trend has reversed since 2018, partially due to the vigorous promotion of China’s domestic cross-border interbank settlement system (CIPS) (Chart 2). China established CIPS in 2015 after the US proposed to disconnect Russia from the SWIFT payment system.1 As of July 2020, the CIPS system had a total of 33 direct participants and 951 indirect participants, a 35% increase from 2018 with more than half of the participants outside China.2 According to the recently released PBoC RMB internationalization report, the CIPS system processed a total of 34 trillion yuan worth of cross-border RMB transactions in 2019, a 28% improvement from 2018 (Chart 3). Chart 3CIPS Has Been Steadily Expanding
The RMB Internationalization Scorecard
The RMB Internationalization Scorecard
Nevertheless, the RMB’s share of international payments remains far behind the USD, euro and yen, and the RMB's role in cross-border settlement is well below its 2016 peak (Chart 4A and 4B). The dollar's dominant status is not only supported by the US’ strong and open economy, but also by its deep, liquid and highly efficient financial markets, which are impossible for any currencies or payment systems to replicate in the near future. However, establishing domestic financial payment and information exchange systems will likely be a main countermeasure countries will rush to take, if the US launches sanctions to cut off large economies like Russia and China from the USD and/or global financial system. Chart 4AThe RMB’s Share Of International Payments Has Been Disproportional Compared To Its Share In Global Trade…
The RMB Internationalization Scorecard
The RMB Internationalization Scorecard
Chart 4B...And Well Below Its 2016 Peak
...And Well Below Its 2016 Peak
...And Well Below Its 2016 Peak
Chart 5Russia Has Largely Replaced USD Treasury Holdings With Gold
Russia Has Largely Replaced USD Treasury Holdings With Gold
Russia Has Largely Replaced USD Treasury Holdings With Gold
Russia is by far the largest and most globally integrated country that came close to being cut off from SWIFT, and Beijing has clearly learned from Russia’s experience and countermeasure strategies. The proposal to disconnect Russia from SWIFT following the 2014 Crimea crisis never materialized, but in light of the threats and US financial sanctions, Russia established the SPFS, a domestic financial information exchange system to facilitate bank payments. The SPFS is far from the complete emancipation of SWIFT and payments through the SPFS are mostly intra-Russian settlements. However, this active counter-sanction measure, coupled with the Russian central bank’s aggressive reduction of USD-denominated assets in its forex reserves, seems to have achieved positive results (Chart 5). Three years after the establishment of SPFS, the US and Europe no longer target Russian bank payment functions in their further financial sanctions against Russia.3 In response to a US threat to impose economic sanctions against companies and banks dealing with Iran, Europe created a special financial settlement platform called Instrument in Support of Trade Exchanges (INSTEX) in 2019. Although none of the alternative systems can challenge the role of the US CHIPS or SWIFT systems, the trend of establishing and accelerating alternatives will incrementally diminish the effectiveness of such harsh financial actions by the US. RMB - An International Commodity Pricing Currency Table 1China Dominates Global Demand For Many Commodities
The RMB Internationalization Scorecard
The RMB Internationalization Scorecard
We believe that the most important breakthrough in the RMB internationalization process in the past five years has been the strategic shift to promote the RMB’s pricing function. China is the largest trading partner of a growing number of countries with tightly linked supply chains. This generates a natural demand for RMB settlement in bilateral trade. More importantly, China’s dominance in global demand for bulk commodities gives the country an advantage in pricing power (Table 1). In March 2018, China established a RMB-denominated crude oil futures market in Shanghai, which has grown into the third-largest oil exchange market after WTI and Brent. Its cumulative turnover in two years reached nearly 30 trillion yuan with overseas customers in 19 countries and regions.4 Given the success of the Shanghai crude oil futures market, the Chinese government has been vigorously promoting the expansion of the RMB pricing function from crude oil to natural gas, iron ore, soybeans, corn and other bulk commodities. Going forward, we expect the RMB internationalization process to continue to develop through pricing and trading bulk commodities in Chinese currency. This will lead to a higher correlation between the RMB and the currencies of some of China's Asian neighbors and commodity trade partners, and thus expand and strengthen the "RMB currency bloc" (Chart 6A and 6B). Chart 6AThe RMB Currency Bloc May Expand From Manufacturing Ecosystem...
The RMB Currency Bloc May Expand From Manufacturing Ecosystem...
The RMB Currency Bloc May Expand From Manufacturing Ecosystem...
Chart 6B...To Commodity Supply Chain
...To Commodity Supply Chain
...To Commodity Supply Chain
RMB - An International Reserve Currency The role of the RMB among official reserve managers, although still dismal compared to the USD and Euro, has accelerated since 2018. Its global share has doubled from Q4 2016 when the IMF began to include holdings of RMB in its currency composition of official foreign exchange reserves (COFER) (Chart 7). Shares of the USD- and Euro-denominated reserves have remained unchanged or declined during the same period. Among private investors, foreign investment in RMB-denominated assets has been the main source of China’s financial account surplus (Chart 8). China has hastened the opening of its onshore financial market to foreign institutional investors. In the past two years, major global stock and bond indexers –including MSCI, the S&P Dow Jones Indices, the FTSE Russell, and the Bloomberg Barclays Global Aggregate Index – have added A-shares and onshore bonds to their flagship benchmarks. This means that foreign institutional investors have significantly boosted their allocation of RMB-denominated stocks and bonds (Chart 8, bottom panel). Financial assets, such as domestic RMB stocks, bonds, and loans and deposits held by foreign entities, climbed by 26.7% in 2019 over 2018. At the same time, China's domestic financial markets have gradually liberalized and even removed investment quotas for overseas institutional investors. Foreign investors currently account for 5.5% and 2.6% of the market value in Chinese equities and bonds, up from 3% and 2% in 2018, respectively. Chart 7The RMB Share In Global Reserves Remains Dismal, But Has Nearly Doubled Since 2016
The RMB Internationalization Scorecard
The RMB Internationalization Scorecard
Chart 8China Has Been Rapidly Expanding The Scope Of Foreign Participants In Its Onshore Financial Markets
China Has Been Rapidly Expanding The Scope Of Foreign Participants In Its Onshore Financial Markets
China Has Been Rapidly Expanding The Scope Of Foreign Participants In Its Onshore Financial Markets
Bottom Line: The internationalization of the RMB will likely continue to accelerate in the face of decoupling from the US. It is a long process, but China will take advantage of its dominance in global demand to foster the RMB's role in both pricing and settlement in cross-border commodity trade. At the same time, China is rapidly expanding the scope of foreign participants in the country's onshore financial markets, by allowing more foreign banks and financial institutions to enter the market, and broadening the channels for the RMB’s international circulation. Jing Sima China Strategist jings@bcaresearch.com Footnotes 1SWIFT is a system that provides information on international payments and calculations. The system unites more than 11,000 banking and financial institutions in 210 countries and the bank card payment function supported by the SWIFT system reflects a country's financial security. 2China Cross-Border Interbank Payment System release, July 31st, 2020. 3Xu Wenhong, The SWIFT System: A Focus on the U.S.–Russia Financial Confrontation, Russian International Affairs Council, February 3, 2020. 4Based on data from Shanghai International Energy Exchange. Cyclical Investment Stance Equity Sector Recommendations
BCA Research's Global Fixed Income Strategy service argues that the persistence of the COVID-19 pandemic intensifies pressure on policymakers around the world to provide more economic stimulus. The odds that more central banks will join the negative policy…
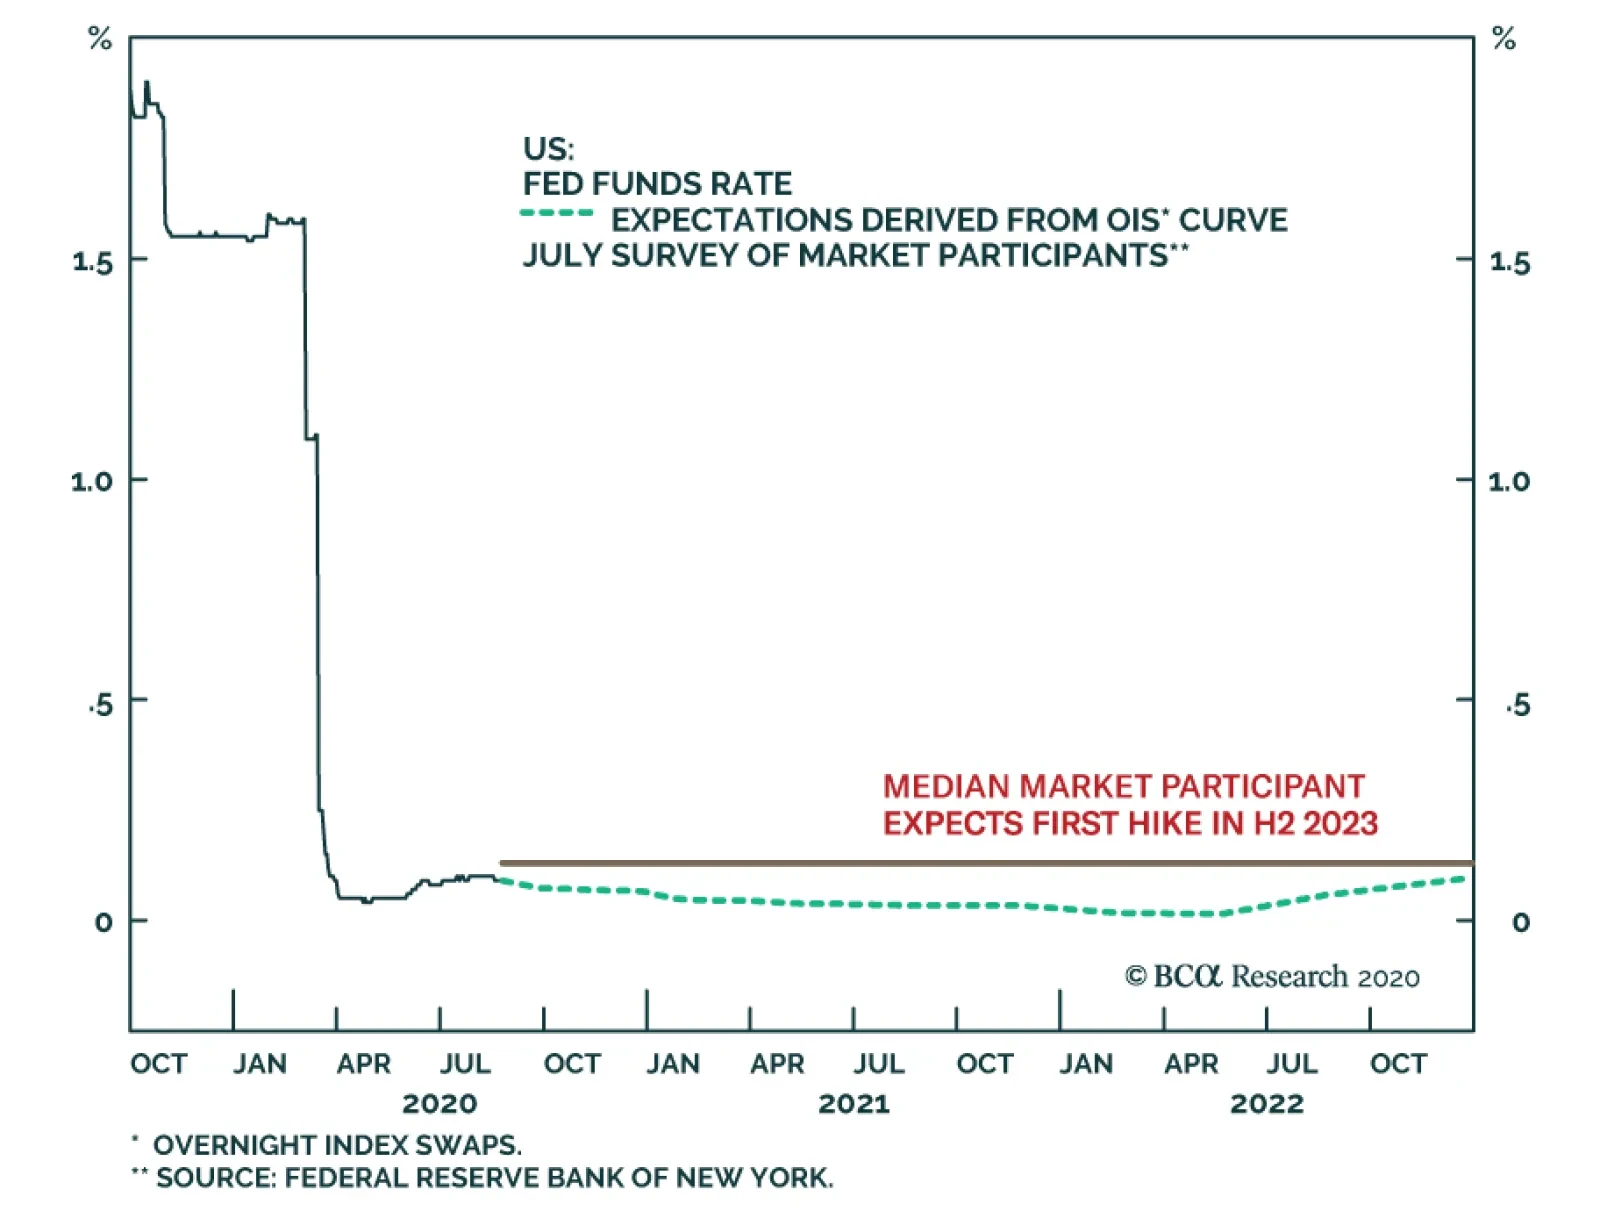
The bar for Fed Chairman Jerome Powell to deliver an incrementally dovish surprise in his remarks later today is high, given that markets already expect the Fed funds rate to stay pinned at zero until late 2023, the end of the Fed’s official forecast horizon.…
Highlights Portfolio Strategy Softening operating metrics, the falling US dollar, the reopening of the economy, all suggest that investors should avoid hypermarket stocks. A firming macro backdrop, the USD’s recent drop, along with the bearish signals from financial variables, all concur that investors should start a program of modestly shedding consumer staples exposure. Recent Changes Downgrade the S&P hypermarkets index to underweight, today. This move also pushes our S&P consumer staples sector to a modest below benchmark allocation. Table 1
Lessons From The 1940s
Lessons From The 1940s
Feature In our March 23 Weekly Report, when we identified 20 reasons to start buying equities, we published a cycle-on-cycle profile (Chart 1, top panel) of how the SPX performs following a greater than 20% drawdown. History suggested that, on average, new all-time highs would emerge sometime in early 2022! Unfortunately, this assessment proved offside as the S&P 500 made fresh all-time closing highs last week, less than five months from the March 23 trough. Chart 1Overstretched
Overstretched
Overstretched
Nevertheless, comparing the current unprecedented SPX rebound with the historical recessionary profile remains instructive as it highlights how excessively stretched equities currently appear. The bottom panel of Chart 1 warns that the SPX is vulnerable to a snapback, were the SPX to return to the historical mean or median recovery profile. Likely rising (geo)political risks could serve as a near-term catalyst for a healthy pullback. Importantly, all of the SPX’s return since the March lows is due to the multiple expansion and then some, as forward EPS have taken a beating (not shown). Equities are long duration assets and given the drubbing in the discount rate, the forward P/E multiple has done all the heavy lifting. Chart 2 puts some historical context to the S&P 500 forward P/E going back to 1979 using I/B/E/S data. Empirical data supports finance theory and shows that the 40-year bull market in bond prices has caused a structural upshift to the SPX forward P/E. Chart 2Moving In Opposite Directions
Moving In Opposite Directions
Moving In Opposite Directions
While low rates explain the near all-time highs in the SPX forward P/E, looking ahead we doubt that the SPX multiple can expand much further if we assume that the easy assist from ZIRP is behind us and will not repeat; i.e. the Fed will refrain from wrecking the US banking system by exploring NIRP. In contrast, our analysis suggests that a selloff in the bond market is the missing ingredient that will ignite a massive rotation out of growth stocks and into value and propel deep cyclicals versus defensives to uncharted territory. More specifically, the rallies in copper prices, crude oil and the CRB Raw Industrials index need confirmation from the bond market that they are demand, rather than supply driven. This backdrop will also shift equity returns within deep cyclicals away from a handful of tech stocks and toward other beaten down high operating leverage sectors (i.e. energy, industrials and materials) as we posited in our recent August 3 Special Report “Top 10 Reasons To Start Nibbling On Cyclicals At The Expense Of Defensives”. Zooming out and observing how investors have moved capital from one asset class to the next in the aftermath of QE5 is in order (Chart 3). First, the SPX enjoyed a V-shaped recovery from the March 23 lows. Then in early-May, as we first posited in our May 11 Weekly Report, the big EURUSD up-move was set in motion and investors started piling into short USD positions taking cue from the Fed’s QE5 that was directly targeting the US dollar with liquidity swaps. The debasing of the dollar served as a global reflator. Now the final piece of the QE5 puzzle is the bond market. Chart 3 highlights that in order for QE to work, counterintuitively a selloff in the bond market would confirm that the economy is healing and is ready to start standing on its own two feet. The jury is still out. With regard to the Fed’s remaining bullets, yield curve control (YCC) is one unorthodox tool that the FOMC could choose to deploy in the coming years. On that front, turning back in time and drawing parallels with the 1940s is instructive. In 1942 the Fed, at the behest of the Treasury, pegged long-term interest rates at 2.5% and ballooned its balance sheet in order to finance the government’s expenditures during WWII. The Fed surrendered its independence, and this YCC unwarrantedly stayed in place until 1951 when in the midst of the Korean War, the Treasury-Federal Reserve Accord finally ended the peg of government long-dated bond interest rates.1 Chart 3Bonds Yields Are Left To Rally
Bonds Yields Are Left To Rally
Bonds Yields Are Left To Rally
Chart 4WWII-Like Starting Point
WWII-Like Starting Point
WWII-Like Starting Point
Chart 4 shows the ebbs and flows of the US government’s total debt-to-GDP ratio and fiscal deficit as a percentage of output since 1940. While the debt-to-GDP profile fell from 1945 onward owing partially to a tight fiscal ship that the US subsequently ran, it troughed when the US floated the greenback. Since then, the US has been fiscally irresponsible running large budget deficits and the debt-to-GDP ratio has never looked back and very recently went parabolic (top panel, Chart 4). Charts 5 & 6 take a closer look at some macro variables in the 1940s and Charts 7 & 8 compare them to today. Chart 5The…
The…
The…
Chart 6…1940s…
…1940s…
…1940s…
First, YCC did not prevent the late-1948 recession (Chart 5, shaded areas). Crudely put, monetary stimulus is not a panacea for boom/bust cycles. Second, M2 growth was climbing at a 30%/annum rate, the money multiplier was on a secular advance and money velocity was surging especially in the first half of the 1940s (Chart 6). As a result and as expected, YCC caused three significant inflationary jumps (bottom panel, Chart 6) that aided the US government in bringing down the massive debt-to-GDP ratio (i.e. inflating its way out of a debt trap) that it had accumulated via large deficits in the front half of the 1940s (top panel, Chart 5). Third, interest rates were a coiled spring and once the Treasury-Fed Accord was signed, they exploded higher (fourth panel, Chart 5). Finally, equities fared well during the first three years of YCC until the end of WWII, but then suffered an outsized setback until mid-1949, before recovering and taking out the 1945 highs in 1951 (bottom panel, Chart 5). Chart 7...Compared With…
...Compared With…
...Compared With…
Chart 8…Today
…Today
…Today
Were the Fed to embark on YCC in the near-future in order to monetize the US government’s deficits, there are a few parallels to draw with the 1940s especially given that the starting point of debt-to-GDP is similar to the WWII figure (top panel, Chart 4). The Fed would likely lose its independence. This would be a paradigm shift. The Fed would crowd out fixed income investors, and flood the market with US dollars. M2 money stock would continue to surge. Few investors will be chasing US dollar assets including equities. The path of least resistance would be significantly lower for the US dollar as foreign investors would flee. This debt monetization along with a depreciating currency and swelling money supply would result in inflation rearing its ugly head, especially given that import prices would soar. What is difficult to envision is how the economy would perform during an inflationary impulse. Our sense is that the risk of stagflation would rise significantly, especially given the current inverse correlation between M2 growth and the velocity of money.2 In the stagflationary 1970s, any liquidity injections via higher M2 growth failed to translate into rising money velocity. Importantly, the “Nixon shock” effectively ended the Bretton Woods system and floated the US dollar causing a 40% devaluation from peak-to-trough (Chart 9). Tack on the oil related supply shock and stagflation reigned supreme in the 1970s, owing to cost-push inflation. Chart 9Dollar The Reflator
Dollar The Reflator
Dollar The Reflator
In contrast during the 1940s, demand-pull inflation hit the economy rather hard, as the US was retooling its industrial base to win WWII alongside its allies. Also the US dollar was linked to gold since the Gold Reserve Act of 1934 and ten years later the Bretton Woods international monetary agreement ushered in the era of fixed exchange rates, which is a big difference from the 1970s.3 As a reminder, from a political perspective venturing down the inflation avenue is the least painful way of dealing with a debt burden, rather than pursuing tight fiscal policy which is synonymous with political suicide. From an equity perspective, owning commodity-levered sectors and other hard asset-linked equities including REITs would make sense as we highlighted in our recent inflation Special Report. Health care stocks would also shine in case of an inflationary spurt according to empirical evidence that we highlighted in the same Special Report. On the flip side, our inflation Special Report also revealed that shedding telecom services and utilities would be wise and most importantly avoiding technology stocks. Tech stocks are disinflationary beneficiaries as they are mired in constant deflation and have built business models not only to withstand, but also to thrive in deflation. Inflation is a tech killer as these growth stocks suffer when the discount rate spikes and causes valuations to move from a premium to a discount. Nevertheless, deflation/disinflation is more likely in the coming 12-to-18 months, whereas inflation is at least two-to-three years away as we mentioned in our recent inflation Special Report. This week we continue to augment our cyclicals versus defensives portfolio bent and take our defensive exposure down a notch by downgrading consumer staples to a modest below benchmark allocation via a downgrade in the S&P hypermarkets index. Downgrade Hypermarkets To Underweight… Last summer we upgraded the S&P hypermarkets index to overweight as we were preparing the portfolio to withstand a recessionary shock given that the yield curve had inverted. Fast forward to the March carnage in the equity markets and this defensive move served our portfolio well. However, we did not want to overstay our welcome and set a stop in order to exit this position that was triggered in late-March netting our portfolio 26% in relative gains. More recently, we have been adding cyclical exposure to the portfolio and lightening up on defensives and as a continuation of this shift we are now compelled to downgrade the S&P hypermarkets to underweight. The economy is reopening and thus it no longer pays to seek refuge in safe haven hypermarket equities. In fact most of the macro indicators we track suggest the recession is over that will sustain severe downward pressure on relative share prices. Chart 10 shows that the ISM manufacturing new orders subcomponent has slingshot from below 30 to north of 60, junk spreads are probing all-time lows, consumer confidence has troughed and small and medium enterprises hiring intentions are on the mend. Moreover, the extraordinary fiscal expansion has brought spending forward and PCE is all but certain to skyrocket when the Q3 GDP figures get released in late-October, signaling that the easy money has been made in Big Box retailers (top panel, Chart 11). Similarly, discretionary spending should pick up the slack from staple-related purchases, further dampening the need to own hypermarket shares (middle & bottom panels, Chart 11). Chart 10Rebounding Macro
Rebounding Macro
Rebounding Macro
Chart 11Returning to Normality
Returning to Normality
Returning to Normality
On the operating front, while WMT is making strides in its online presence and offering mix, non-store retail sales are on a tear dominated by King AMZN (as a reminder we are overweight the S&P internet retail index). This is a secular trend and should continue unabated and in a relative sense continue to weigh on hypermarket profitability (bottom panel, Chart 12). Finally, a significant tailwind is turning into a severe headwind for this industry: import price inflation. The US dollar has reversed course and it is in a freefall. Historically, the greenback has been an excellent leading indicator of import price inflation and the current message is grim for hypermarket razor thin profit margins (import prices shown inverted, Chart 13). Chart 12Amazonification Is On Track
Amazonification Is On Track
Amazonification Is On Track
Chart 13Currency Headwinds
Currency Headwinds
Currency Headwinds
Adding it all up, softening operating metrics, the falling US dollar, the reopening of the economy, all suggest that investors should avoid hypermarket stocks. Bottom Line: Trim the S&P hypermarkets index to underweight. The ticker symbols for the stocks in this index are: BLBG S5HYPC – WMT, COST. …Which Pushes Consumer Staples To A Below Benchmark Allocation The downgrade in the S&P hypermarkets index tilts our S&P consumer staples sector to a modest below benchmark allocation. Countercyclical consumer staples stocks served their purpose and provided the support to our portfolio in the front half of the year when we needed them most. Now that the economic reopening is gaining steam and the government, the health care system and society are all ready to effectively deal with a flare up in the pandemic, the allure of defensive positioning has diminished. In other words, COVID-19 is currently a known known risk versus an unknown unknown risk early in the year, and defending against it now is more successful. Moreover, according to our mid-April research on what sectors investors should avoid during recessionary recoveries, consumer staples stocks trail the SPX on average by 660bps one year following the SPX trough. The current macro backdrop corroborates this analysis and underscores that the path of least resistance is lower for relative share prices. Not only is the ISM manufacturing survey on fire, but also consumer confidence is making an effort to trough (ISM manufacturing and consumer confidence shown inverted, Chart 14). Meanwhile, financial market variables emit a similarly bearish signal for safe haven staples stocks. Following a brief spike in the bond-to-stock ratio (BSR), the BSR has recently resumed its downdraft (top panel, Chart 15). Volatility has all but collapsed since soaring to over 80 in March, as the Fed has orchestrated a quashing of all asset class volatilities (middle panel, Chart 15). Lastly, the pairwise correlation between stocks in the S&P 500 has also nosedived bringing some semblance of normality back into equity markets (bottom panel, Chart 15). All three of these financial market variables will continue to exert downward pressure on relative share prices. Chart 14V-shaped Recovery…
V-shaped Recovery…
V-shaped Recovery…
Chart 15...Across The Board
...Across The Board
...Across The Board
On the US dollar front, while consumer goods manufacturers get a P&L translation gain from a depreciating currency, their export exposure is on par with the SPX and does not provide a relative advantage. In marked contrast, empirical evidence shows that relative profitability moves in tandem with the greenback and the USD recent weakness will undercut consumer staples profitability (bottom panel, Chart 16), especially via climbing input cost inflation. In sum, a firming macro backdrop, the US dollar’s recent drop, along with the bearish signals from financial variables, all concur that investors should start a program of modestly shedding consumer staples exposure. Bottom Line: Downgrade the S&P consumer staples index to underweight. Chart 16Mind the Gap
Mind the Gap
Mind the Gap
Anastasios Avgeriou US Equity Strategist anastasios@bcaresearch.com Footnotes 1 https://www.richmondfed.org/publications/research/special_reports/treasury_fed_accord/background 2 The velocity of money “is the number of times one dollar is spent to buy goods and services per unit of time. If the velocity of money is increasing, then more transactions are occurring between individuals in an economy.” Source: Federal Reserve Bank of St. Louis. 3 Our colleagues from The Bank Credit Analyst recently illustrated how a strong dollar is good for the US economy on a medium term basis. Current Recommendations Current Trades Strategic (10-Year) Trade Recommendations
Drilling Deeper Into Earnings
Drilling Deeper Into Earnings
Size And Style Views July 27, 2020 Overweight cyclicals over defensives April 28, 2020 Stay neutral large over small caps June 11, 2018 Long the BCA Millennial basket The ticker symbols are: (AAPL, AMZN, UBER, HD, LEN, MSFT, NFLX, SPOT, TSLA, V). January 22, 2018 Favor value over growth
Dear Client, I will be on vacation next week. Instead of our regular report, we will be sending you a Special Report from my colleague Jonathan LaBerge. Jonathan will explore the risks posed to commercial real estate and the banking system from work-from-home policies and the potential for urban flight towards less populated and more affordable areas. I hope you find his report insightful. Best regards, Peter Berezin, Chief Global Strategist Highlights The Nasdaq 100 index is up 31% since the start of the year. The “Awesome 8” stocks (Amazon, Apple, Facebook, Google, Microsoft, Netflix, Nvidia, and Tesla) have gained a staggering 59%. Will tech outperformance continue? There are five reasons to think it will not: 1) The dismantling of pandemic lockdown measures, hopefully facilitated by a vaccine later this year, could shift some spending from the online realm back to brick-and-mortar stores; 2) Interest rates are unlikely to fall much further, which will remove one of the tailwinds propelling tech outperformance; 3) Tech valuations are now quite stretched; 4) Many marquee tech companies have become so big that further gains in market share may be difficult to achieve; 5) Regulatory and tax policy changes could negatively impact a number of prominent tech names. A pivot in market leadership from tech to non-tech is likely to foster the outperformance of value over growth and non-US over US stocks. Are The Awesome 8 At Risk Of Becoming The Awful 8? After plunging alongside the rest of the stock market in March, tech stocks have roared back. The tech-heavy Nasdaq 100 is up 31% since the start of the year. The “Awesome 8” stocks (Amazon, Apple, Facebook, Google, Microsoft, Netflix, Nvidia, and Tesla) have gained a staggering 59% on a market cap-weighted basis. Meanwhile, the median US stock has lost 14% this year (Chart 1). Will tech outperformance continue? There are five reasons to think it will not: Reason #1: The dismantling of pandemic lockdown measures could shift some spending from the online realm back to brick-and-mortar stores The pandemic has led to a major reallocation of spending from brick-and-mortar stores to online retailers. Sales at US online stores increased by 25% year-over-year in July versus -1% at physical stores (Chart 2). According to Bank of America, after rising steadily from about 5% in 2009 to 16% in 2019, the US e-commerce penetration rate has jumped to 33%, representing more than ten years of growth in only a few months. Chart 1Awesome 8 Propelling Tech Stocks To New Highs
Awesome 8 Propelling Tech Stocks To New Highs
Awesome 8 Propelling Tech Stocks To New Highs
Chart 2Will The Dismantling Of Lockdown Measures Bring Brick-And-Mortar Retailers Back To Life?
Will The Dismantling Of Lockdown Measures Bring Brick-And-Mortar Retailers Back To Life?
Will The Dismantling Of Lockdown Measures Bring Brick-And-Mortar Retailers Back To Life?
There is little doubt that we are still in the midst of a secular transition towards e-commerce. However, it is likely that the dismantling of lockdown measures – hopefully facilitated by the release of a vaccine later this year – will bring back some spending to brick-and-mortar stores. This could produce a temporary air pocket in sales for online sellers, a risk that does not seem to be fully discounted (Chart 3). Chart 3Online Retail Spending Could Slow, At Least Temporarily, As Shopping Malls Reopen
The Return Of Nasdog
The Return Of Nasdog
Chart 4The Pandemic Has Caused Global Server And PC Shipments To Surge
The Pandemic Has Caused Global Server And PC Shipments To Surge
The Pandemic Has Caused Global Server And PC Shipments To Surge
Meanwhile, other tech companies that have benefited from the pandemic could face headwinds. Netflix saw its global subscriber count jump 27% in the second quarter relative to a year earlier. If someone did not bother to purchase a Netflix subscription in March or April, how likely is it that they will subscribe for the first time in September? Along the same lines, global PC and server shipments surged to multi-year highs earlier this year as millions of people were forced to work from home (Chart 4). This likely brought demand for computers and peripheral equipment forward, which could produce a spending vacuum over the next few quarters. Reason #2: Interest rates are unlikely to fall much further, which will remove one of the tailwinds propelling tech outperformance Technology companies are used to cutting prices on older models as newer, more innovative versions come to market. In this sense, deflation is built into their business models. Many tech companies also trade on long-term growth prospects, which means that changes in discount rates have a disproportionately greater impact on the present value of their cash flows than for slower growing companies. All this means that tech stocks tend to outperform in environments where inflation and interest rates are falling. Chart 5Higher Bond Yields Will Benefit Financials
Higher Bond Yields Will Benefit Financials
Higher Bond Yields Will Benefit Financials
We do not expect inflation to surge over the next two years. Nevertheless, the deflationary impulse from the pandemic is likely to abate as spare capacity is absorbed and overall demand recovers. Likewise, bond yields are likely to rise modestly over the next 12 months. Higher bond yields will benefit bank shares (Chart 5). Reason #3: Tech valuations have gotten increasingly stretched Based on full-year estimates, the Nasdaq 100 trades at 32-times 2020 earnings and 27-times 2021 earnings. The Awesome 8 stocks are even more pricey, trading at 43-time and 34-times this year’s and next year’s earnings, respectively (Table 1). Table 1Equity Valuations: Tech Versus Non-Tech
The Return Of Nasdog
The Return Of Nasdog
Outside the IT sector, the S&P 500 trades at 26-times 2020 earnings and 20-times 2021 earnings. It should be noted that these numbers overstate how expensive the non-tech part of the S&P 500 index really is because Amazon resides in the consumer discretionary sector while Facebook, Google, and Netflix sit in the communication sector. In fact, only three of the Awesome 8 are in the S&P 500 IT sector (Tesla has yet to be admitted into the S&P 500, despite having a market cap that would now make it the 10th most valuable company in the index, right ahead of P&G). While the PE ratio on tech stocks is still well below the nosebleed levels reached during the dot-com bubble, other valuation measures are approaching their prior peaks. The S&P 500 IT sector now trades at 6.2-times sales, not far below the peak price-to-sales of 7.8 reached in 2000. Tech stocks trade at 9.6-times book value, the highest level since early 2001, and more than double their peak valuation level in 2007 (Chart 6). Reason #4: Many marquee tech companies have become so big that further gains in market share may be difficult to achieve The Nasdaq’s lofty valuation presumes that earnings will continue to rise at a rapid pace for many years to come. That has certainly been true for the past decade. The Nasdaq 100 enjoyed annualized earnings per share growth of 16% since 2010, 2.5-times the pace of the S&P 500 index and 3.2-times faster than the non-IT constituents of the S&P 500. Indeed, most of the outperformance of tech stocks can be chalked up to their faster earnings growth (Chart 7). Chart 6Tech Stocks: Some Valuation Measures Are Quite Stretched
Tech Stocks: Some Valuation Measures Are Quite Stretched
Tech Stocks: Some Valuation Measures Are Quite Stretched
Chart 7Most Of The Outperformance Of Tech Stocks Can Be Attributed To Faster Earnings Growth
Most Of The Outperformance Of Tech Stocks Can Be Attributed To Faster Earnings Growth
Most Of The Outperformance Of Tech Stocks Can Be Attributed To Faster Earnings Growth
But will such earnings growth continue? That is far from certain. Bottom-up estimates foresee earnings per share among Nasdaq 100 members rising by 20% in 2021. This is actually below the projected earnings growth of 27% for the S&P 500. One sees a similar pattern within S&P 500 sectors: The IT sector is expected to see earnings growth of 15% in 2021 compared with 31% for non-IT sectors (Table 2). Table 2Earnings Growth Projections
The Return Of Nasdog
The Return Of Nasdog
Admittedly, the faster projected earnings growth of non-tech companies in 2021 will constitute a reversal of this year’s pandemic-induced earnings collapse, from which tech was largely insulated. Thus, there is a base effect at work. Nevertheless, if most investors focus mainly on annual growth rates, they could become enamoured with non-tech stocks, at least temporarily. Looking further out, the rapid growth in tech earnings could decelerate as many of today’s marquee tech companies struggle to expand market share. Close to three-quarters of US households already have an Amazon Prime account. Slightly over half have a Netflix account. Nearly 70% have a Facebook account. Google commands 92% of the internet search market. Together, sites owned by Google and Facebook generate about 60% of all online advertising revenue. New opportunities for growth will undoubtedly arise, but there is no guarantee that today’s leaders will be able to take advantage of them. History is littered with tech companies that failed to keep up with a changing world: RCA, Kodak, Polaroid, Atari, Commodore, Novell, Digital, Sinclair, Wang, Iomega, Corel, Netscape, Altavista, AOL, Compaq, Sun, Lucent, 3Com, Nokia, and RIM were all major players in their respective industries, only to fade into oblivion. Stock market investors were very lucky that companies such as Microsoft, Cisco, Nvidia, Qualcomm, Oracle, Amazon, and Netflix issued shares to the public at an early stage in their development (Table 3). All seven had market caps below $1 billion when they went public. Such hidden gems are becoming less common: The number of publicly listed companies in the US is still well below what it was two decades ago (Chart 8). The median age of tech companies at the time of their IPO has risen from around 7 years in the 1990s to 11 years in 2019 (Chart 9). Table 3Big Gains From Once Small Companies
The Return Of Nasdog
The Return Of Nasdog
Chart 8The Number Of US Publicly Listed Companies Is Not What It Once Was
The Number Of US Publicly Listed Companies Is Not What It Once Was
The Number Of US Publicly Listed Companies Is Not What It Once Was
Chart 9Tech Companies Entering The Public Arena Are Now More Mature
The Return Of Nasdog
The Return Of Nasdog
Reason #5: Regulatory and tax policies could negatively impact a number of prominent tech names Historically, the US government has taken a laissez-faire approach towards the tech sector. As an avowedly pro-business party, the Republicans were happy to espouse deregulation and low corporate taxes, while lauding Silicon Valley’s dynamism and global dominance. The Democrats also had a cozy relationship with the tech sector. As Chart 10 shows, political donations from tech company employees are heavily skewed towards Democratic candidates. Chart 10Tech Company Employees Donate Heavily Towards Democrats
The Return Of Nasdog
The Return Of Nasdog
Things may not be as easy for the tech sector going forward, however. Conservatives have accused social media companies of stifling their voices. According to a recent Pew Research study, 53% of conservative Republicans favor increasing government regulation of big tech companies, up from 42% in 2018 (Chart 11). For their part, Democrats have expressed concerns about the growing monopoly power of tech companies and their perceived insouciant attitude towards consumer privacy. Chart 11Conservatives Favor Increased Government Regulation Of Big Tech Companies
The Return Of Nasdog
The Return Of Nasdog
A Biden administration would not be as tough on tech companies as say, an Elizabeth Warren administration. Nevertheless, Biden has said that breaking up big tech companies is "something we should take a really hard look at."1 He has also argued that online platforms should not be granted legal immunity for user-generated content. On the tax side, Biden has vowed to reverse half of Trump’s corporate tax cuts, while introducing a minimum 15% corporate tax. The latter could disproportionately affect a number of prominent tech companies that have taken full advantage of the current tax code to minimize their tax liabilities. Meanwhile, tech companies are increasingly finding themselves in the crossfire between China and the US. While Joe Biden would not be as quick to impose unilateral tariffs on China as Donald Trump, BCA Research’s geopolitical strategists warn that the rivalry between the two nations will intensify over the coming decade as they reduce their economic interdependency and vie for military advantage in Asia.2 This could have adverse implications for tech firms’ ability to maximize global market share, never mind optimizing global supply chains. Pivot Towards Value And International Stocks Tech stocks are overrepresented in growth indices, while financials dominate value indices (Table 4). Thus, it is not surprising that the relative performance of tech versus financial stocks has closely mirrored the relative performance of growth versus value stocks (Chart 12). If tech stocks shift from being leaders to laggards, value stocks will shift from being laggards to leaders. Table 4Breaking Down Growth And Value By Sector
The Return Of Nasdog
The Return Of Nasdog
Chart 12The Relative Performance Of Tech Stocks Has Closely Mirrored The Relative Performance Of Growth Versus Value
The Relative Performance Of Tech Stocks Has Closely Mirrored The Relative Performance Of Growth Versus Value
The Relative Performance Of Tech Stocks Has Closely Mirrored The Relative Performance Of Growth Versus Value
Chart 13The Valuation Gap Between Value And Growth Is Larger Today Than At The Height Of The Dot-Com Bubble
The Valuation Gap Between Value And Growth Is Larger Today Than At The Height Of The Dot-Com Bubble
The Valuation Gap Between Value And Growth Is Larger Today Than At The Height Of The Dot-Com Bubble
Value stocks usually appear “cheap” in relation to growth stocks, but the valuation gap is much larger today than in the past – larger, in fact, than at the height of the dot-com bubble (Chart 13). Despite their name, growth stocks usually underperform value stocks when global growth is on the upswing (Chart 14). Provided that progress is made towards developing a vaccine, global growth should remain above trend over the next 12 months, giving value stocks a lift. Chart 14Growth Stocks Usually Underperform Value Stocks When Global Growth Is On The Upswing
Growth Stocks Usually Underperform Value Stocks When Global Growth Is On The Upswing
Growth Stocks Usually Underperform Value Stocks When Global Growth Is On The Upswing
Value stocks also generally do better when the US dollar is weakening. Recall that tech stocks did phenomenally well in the late 1990s when the dollar was rising, but faltered during the period of dollar weakness from 2001 to 2008 (Chart 15). As we discussed last week, the dollar is likely to depreciate further in the months ahead. Chart 15Value Stocks Generally Do Better When The US Dollar Is Weakening
Value Stocks Generally Do Better When The US Dollar Is Weakening
Value Stocks Generally Do Better When The US Dollar Is Weakening
Chart 16Stronger Global Growth And A Weaker US Dollar Tend To Be Good News For Non-US Stocks
Stronger Global Growth And A Weaker US Dollar Tend To Be Good News For Non-US Stocks
Stronger Global Growth And A Weaker US Dollar Tend To Be Good News For Non-US Stocks
Stronger global growth and a weaker US dollar tend be good news for non-US stocks (Chart 16). As US tech stocks enter a holding pattern, stock markets outside the US will assume the upper hand. Investors should reallocate equity capital towards value stocks and overseas stock markets. Peter Berezin Chief Global Strategist peterb@bcaresearch.com Footnotes 1 Hunter Woodall, “2020 hopeful Biden says he’s open to breaking up Facebook,” The Associated Press, May 13, 2019. 2 Please see Geopolitical Strategy Weekly Report, “A Tech Bubble Amid A Tech War,” dated July 31, 2020. Global Investment Strategy View Matrix
The Return Of Nasdog
The Return Of Nasdog
Current MacroQuant Model Scores
The Return Of Nasdog
The Return Of Nasdog
Highlights The stock market can apparently ignore the intensifying US-China conflict as long as massive monetary and fiscal stimulus continues. Hence the ongoing “stimulus hiccup” is a big problem. Ultimately a stimulus bill will pass, but risks are rising that it will come too late or fall short in size. The longer the negotiations drag on, the more likely that the absence of fiscal support, the spiraling US-China conflict, US political instability, and other risks will take center stage and upset the equity rally. Assuming a new stimulus package will ultimately pass, it will fuel Trump’s tentative comeback in opinion polls, increasing the risk that the revolution in the global trading system gets a new lease on life. Thus volatility is likely to rise from here until the US succession is settled. Stay long JPY-USD and health stocks in the near term and bullion in the long term. Feature Two of the key views we have hammered since May are coming to fruition: Stimulus Hiccup: The White House and Congress are struggling to get a new relief bill passed. We have argued that the next round of fiscal stimulus would face execution risks that would cause equity volatility to rise again, which is now occurring (Chart 1). Ultimately we expect the Republican Senate to capitulate to a major new stimulus bill. But the very near term is murky and the negotiations pose a clear and present danger to an equity market that has now surpassed its pre-COVID-19 highs (Chart 2). Chart 1Volatility Is Bottoming, Will Rise Ahead Of US Election
Volatility Is Bottoming, Will Rise Ahead Of US Election
Volatility Is Bottoming, Will Rise Ahead Of US Election
Chart 2Markets Recovered, Near-Term Risk To Downside
Markets Recovered, Near-Term Risk To Downside
Markets Recovered, Near-Term Risk To Downside
US-China Conflict: The White House has revoked Chinese tech giant Huawei’s general license, leaving the company in thrall to periodic Commerce Department allowances that will impede business. It has also expanded punitive measures to a slew of subsidiaries and Chinese software companies like TikTok (ByteDance) and WeChat (Tencent). We have argued that President Trump’s electoral vulnerability and economic stimulus in both countries lowered the bar to conflict and decoupling. Both countries have an interest in reducing their interdependency and the COVID-19 crisis has given them an opportunity to make structural changes that were previously more difficult. Neither the US tech sector, nor China-exposed US stocks, nor Taiwanese equities are pricing this monumental geopolitical risk at present (Chart 3). Combining these two views results in a dangerous outlook for global risk assets in the near term. The reason we argued that US-China tensions would escalate to the point of disrupting markets this year was that we viewed domestic stimulus as lowering the economic and financial bar that prevented conflict. Hence US and Chinese confrontational steps could go farther than the market expected and eventually something would snap (Chart 4). Chart 3Market Ignores US-China Escalation
Market Ignores US-China Escalation
Market Ignores US-China Escalation
Chart 4US And Global Stimulus Enable US-China Fight
Trade War Sans Stimulus Is Unsustainable
Trade War Sans Stimulus Is Unsustainable
Yet today tensions are escalating despite the failure to arrange a new jolt of domestic stimulus. This is true on both sides, as China is also seeing a deceleration in stimulus provision, mainly on the monetary side, that we also expect to be temporary but nevertheless has negative implications in the near term. The longer fresh stimulus is delayed, the more likely that markets will respond to the historic breakdown in US-China relations, US political instability, and other risks to corporate earnings and the economic recovery. Constraints On Politicians Support Cyclical Recovery To be sure, there is evidence that politicians are aware of their limits and already heading back to the negotiating table. Even with talks ongoing, the risks of delayed stimulus or Chinese retaliation are substantial. First, the White House, House Democrats, and Senate Republicans are continuing to negotiate despite being on recess while hosting national party conventions this week and next. House members are rushing back to Washington to vote on measures to boost the US postal service amid a controversy over how to handle mail-in voting for the election amid the pandemic. This has opened a pathway for stimulus talks to get back on track. It could result in a “skinny” stimulus bill quickly, or otherwise new developments could lead to the roughly $2.5 trillion blowout that we expect based on the two sides splitting the difference on most issues (Table 1). Table 1Stimulus Bill Will Hit $2.5 Trillion If Democrats And Republicans Split The Difference
Trade War Sans Stimulus Is Unsustainable
Trade War Sans Stimulus Is Unsustainable
Chart 5Trump’s Reelection Bid Stands On The Economy
Trade War Sans Stimulus Is Unsustainable
Trade War Sans Stimulus Is Unsustainable
Second, the US and China are arranging to keep talking. Ostensibly they are checking up on the status of the Phase One trade deal. The Trump administration cannot easily walk away from this deal– unless Trump irredeemably becomes a lame duck making a desperate bid to turn the tables on the Democrats. To do so would hurt Trump’s credibility on renegotiating US trade deals and likely trigger a selloff in the stock market that could set back the economic recovery and remove the last leg that his reelection bid stands on (Chart 5). The Chinese, for their part, have stuck with the deal despite US punitive measures because they do not want to provoke Trump, lest he attempt to inflict maximum damage on their economy in his final months or in a second presidential term. The renminbi is not depreciating relative to the dollar, suggesting that the tenuous truce is intact for now (Chart 6). Chart 6Renminbi Signals Phase One Trade Deal Intact ... For Now
Renminbi Signals Phase One Trade Deal Intact ... For Now
Renminbi Signals Phase One Trade Deal Intact ... For Now
Yet The Market May Sell Before Politicians Soften Their Line Nevertheless in the very near term investors have very low visibility on what happens next. Congress could still fumble and cause greater doubts. It could easily fail to reach a new stimulus deal until after September 8 when the Senate returns or September 14 when the House returns. President Trump’s executive orders, and negotiating gestures from Republicans, are a tenuous bridge for markets as they fall far short of even the Republicans’ $1 trillion asking price. The stock market will plunge if the talks collapse, but it will also drop if the stimulus falls short. The market may have to sell off to force politicians to provide stimulus and temper strategic competition. Trump’s complicated attempt to extend relief via executive orders, and/or a skinny deal that does not include direct rebates to households and funding for state and local governments, would be inadequate for the needs of the economy (Chart 7). It is imperative for Senate Republicans to capitulate and come closer to the Democrats $2.4 trillion standing offer (down from $3.4 trillion) – but it is possible they could miscalculate and fail to compromise. Democrats will not cave because they ultimately benefit at the ballot box if stimulus flops and financial turmoil returns. Chart 7US Economy Needs Extended Period Of Fiscal Support
US Economy Needs Extended Period Of Fiscal Support
US Economy Needs Extended Period Of Fiscal Support
On the China front, it is not guaranteed that China will refrain from retaliation against tech companies like Apple that depend on China for their operations. The market is betting that a rally entirely based on the tech sector can be sustained even in the face of an expanding tech war between the world’s biggest economies (Chart 8). Yet China suffers an economic and strategic blow from the US imposition of a technological cordon and Xi Jinping could decide to retaliate immediately. He could come to believe that the risk of not retaliating – which would entail continuing economic recovery and possibly Trump’s reelection on an anti-China platform – is greater than the risk of retaliation and financial turmoil. He has the ability to stimulate the domestic economy and benefits if he sets a precedent that American presidents lose if they attack China. China may not turn to Taiwan immediately, but since 2016 we have highlighted that Taiwan, not Hong Kong, is the major geopolitical risk stemming from the US-China crisis. Saber-rattling, cyber-rattling, and punitive economic measures are picking up in the Taiwan Strait and could lead to a global geopolitical crisis at any time. Here, too, the base case is that China will remain in a holding pattern until after the US election. It also should use economic sanctions long before it resorts to the final military option (Chart 9). But there is a large risk of miscalculation as the US seeks to cut off Taiwan semiconductor trade with China while Taiwan reduces its economic dependency on the mainland and tightens its defense relations with the United States. The Trump administration presents a window of opportunity so the risks are elevated in the lead up to and aftermath of the US election. Chart 8Tech Bubble Amid Tech War An Obvious Danger
Tech Bubble Amid Tech War An Obvious Danger
Tech Bubble Amid Tech War An Obvious Danger
Chart 9China's Economic Card May Be Only Thing Preventing War
China's Economic Card May Be Only Thing Preventing War
China's Economic Card May Be Only Thing Preventing War
We do not view Chinese economic sanctions on Taiwan as a tail risk but rather as our base case. Of course, we eschew conspiracy theories and usually seek to curb enthusiasm over war risks, as with Sino-Indian saber-rattling. But Taiwan is the epicenter of the political, military, and technological struggle between Washington and Beijing. War is a tail-risk, but even minor clashes would have a major impact on global financial markets. Other Risks Come To Forefront Amid Stimulus Hiccup Chart 10Trump’s Comeback Substantial If Stimulus Passes, Pandemic Subsides
Trade War Sans Stimulus Is Unsustainable
Trade War Sans Stimulus Is Unsustainable
The longer stimulus is delayed, the more likely that other risks will rise to the forefront and trouble the equity market. The US election does not offer much upside for markets at this point. Other risks stem from Iran and Russia. In the US election, President Trump is beginning to make a comeback in the opinion polling (Chart 10). Trump’s approval rating benefits from signing off on deals, so a final stimulus bill from Congress is essential. But a stimulus bill, a continued rollover in new cases of COVID-19, and a revival of support among his base would improve his odds of winning. Former Vice President Joe Biden is not polling much better against Trump than former Secretary of State Hillary Clinton did back in 2016 (Chart 11). Biden’s momentum in national opinion polling has been arrested, especially in battleground states, and the lower end of the “band of uncertainty” around the polling also suggests that Trump is within striking distance (Chart 12). Chart 11Biden Polling About Same As Hillary Versus Trump
Trade War Sans Stimulus Is Unsustainable
Trade War Sans Stimulus Is Unsustainable
Chart 12Trump Still Within Striking Distance Of Biden
Trade War Sans Stimulus Is Unsustainable
Trade War Sans Stimulus Is Unsustainable
Our election model suggests that Trump has a 42% chance of winning, which is higher than our subjective 35% (Chart 13). We will upgrade if a stimulus bill is agreed. A Trump comeback may be received well by US equity markets – as it prevents tax hikes, re-regulation, higher minimum wages, and a federal push to revive labor unions, all promoted by Biden and the Democrats. But then again, Biden’s agenda is more reflationary, whereas Trump faces obstacles in a still-Democratic House, leaving global trade as the path of least resistance – which is market-negative. The dollar may bounce on the prospect of a Trump second term (Chart 14). Tech stocks, Chinese currency, and other cyclicals, such as the euro and European stocks, will suffer a setback if Trump is reelected. Chart 13We Give Trump 35% Odds, Quant Model Shows Upside At 42%
Trade War Sans Stimulus Is Unsustainable
Trade War Sans Stimulus Is Unsustainable
Lesser risks, still notable, include Iran and Russia. Chart 14Trump Could Trigger Near-Term Dollar Bounce
Trump Could Trigger Near-Term Dollar Bounce
Trump Could Trigger Near-Term Dollar Bounce
We have maintained that the US and Iran are in a bull market of geopolitical tensions and that this could result in crisis around the election. The US’s decision on August 20 unilaterally to maintain the expiring international conventional arms embargo on Iran is a clear trigger for a military incident. The macro and market implications are different and less dire than with a US-China crisis. But oil price volatility would rise due to regional instability, President Trump’s reelection bid could benefit, and that would carry the implication of expanding trade war with China. Meanwhile our expectation of sharply rising Russian geopolitical risk is materializing both within Russia and in relations with Europe, which is preparing sanctions over the suppression of dissent within both Russia and its satellite state Belarus. Russia is capable of interfering in the US election while a Democratic victory would likely lead to a US policy offensive against Russia. Investors must look beyond the short term. If stimulus is passed, the stock market will go up, but the US and China will be further enabled and ultimately their strategic showdown will cap the gains by harming the tech sector. Meanwhile, if the stimulus fails, then the market will plunge. Investment Takeaways At present the stock market seems prepared for Trump to remain in the White House – or for Republicans to retain the Senate. The market’s YTD profile matches that of past elections that result in gridlock, as opposed to the Democratic “clean sweep” scenario that we have flagged as the likeliest outcome (Chart 15). However, this profile will change, the market will correct, if Trump does not sign a new relief act. Assuming stimulus ultimately passes, markets will cheer and Trump’s comeback in the polls will get a boost. He could still lose the election, given fundamental political and economic weaknesses captured in our state-by-state quantitative model above. But the election itself would be more closely fought – with a contested outcome more likely to occur and roil markets. Finally a Trump victory would give a new mandate to the US-China breakdown and the revolution in the global trading system, which is ultimately negative for risk assets and the cyclical recovery. Hence our confidence that the next few months will be marked by volatility. Ultimately geopolitical and macro fundamentals are negative for the dollar even if Trump provides the occasion for a last gasp in the past decade’s dollar bull market. The US is monetizing its debt and flooding the world with dollar liquidity. Meanwhile China and other powers are diversifying away from the dollar and into gold, the euro, the yen, and other reserve currencies over the long run (Chart 16). Chart 15Dollar Outlook Bearish In Medium Term
Dollar Outlook Bearish In Medium Term
Dollar Outlook Bearish In Medium Term
Chart 16Stock Market Preparing For Trump Win And More Gridlock?
Stock Market Preparing For Trump Win And More Gridlock?
Stock Market Preparing For Trump Win And More Gridlock?
The great US fiscal debate is over, regardless of Trump or Biden, as populism has made austerity impracticable and massive twin deficits will ensue. Thus we remain long gold and the Japanese yen. We have refrained from re-initiating our long EUR-USD trade given our expectation of stimulus hiccups and US-China tensions, but will reconsider if and when these hurdles are cleared. Our strategic portfolio continues to expect a global recovery over the next twelve months and beyond but tactically we are positioned against downside risks. Matt Gertken Vice President Geopolitical Strategy mattg@bcaresearch.com
Dear clients, The Foreign Exchange Strategy will take a summer break next week. We will resume our publication on September 4th. Best regards, Chester Ntonifor, Vice President Foreign Exchange Strategy Feature The economy of Hong Kong SAR1 has been held under siege by two tectonic forces. With the highest share of exports-to-GDP in the world, and at very close proximity to China, the epicenter of the pandemic shock, economic growth has been knocked down hard. The second shock to Hong Kong’s economy has been political instability. The extradition bill that was proposed in February 2019, followed by the enactment of the national security law this past June, has been accompanied by cascading street-wide protests and social unrest. The spirit of the bill is that crimes committed in Hong Kong can be trialed in China. The US has moved to impose sanctions on Hong Kong, as it no longer sees the city-state as autonomous, the latest of which is revoking its extradition treaty with the former colony. Some commentators have defined this as the end of the one country, two systems socio-economic model that has been in place since the handover from British rule in 1997. From a currency perspective, these shocks put in question the sustainability of the Hong Kong dollar (HKD) peg. Historically, currency pegs more often than not fail, especially in the midst of both geopolitical and economic turmoil. This was the story of the Asian Financial crisis in the late 1990s, and the Mexican peso crisis earlier that decade. Is the Hong Kong dollar destined for the same fate? If so, what are the potential adjustments in the exchange rate? Finally, what indicators can investors look to as a guide for any pending adjustment? A Historical Perspective Chart 137 Years Of Stability
37 Years Of Stability
37 Years Of Stability
The HKD is no stranger to shifting exchange-rate regimes. Over the last 170 years, it has been linked to the Chinese yuan, backed by silver, pegged to the British pound, free-floating, and, since 1983, tied to the US dollar. Therefore, a bet on the unsustainability of the peg is historically justified. That said, the stability of the peg to the US dollar has survived 37 years of economic volatility, suggesting the Hong Kong Monetary Authority (HKMA) has been able to successfully navigate a post-Bretton Woods currency era (Chart 1). Beginning as a bi-metallic monetary regime in the early 19th century, the HKD was initially linked to gold and silver prices, akin to the commodity–monetary standard that dominated that era. When Britain colonized Hong Kong in 1841, and as new trade alliances developed, the drawbacks of the bi-metallic monetary standard became apparent. As bilateral trade boomed, adjustments to imbalances (surpluses or deficits) could not occur through the exchange rate since it was fixed. Therefore, they had to occur through the real economy. This led to very volatile and destabilizing domestic prices. The stability of the peg to the US dollar has survived 37 years of economic volatility. Most Anglo-Saxon countries finally converted from bi-metallic exchange rates to the gold standard in the late 1800s, and strong ties to China dictated that Hong Kong naturally adopted the silver dollar in 1863. However, the silver system had the same drawbacks as the bi-metallic standard. Specifically, when your money supply is fixed, any increase in output leads to “few dollars chasing many goods.” This is synonymous with falling prices, just as “many dollars chasing few goods” is synonymous with rising inflation. The petri dish for this phenomenon was the post-World War I construction boom. A fixed money supply under the gold (and silver) standard meant rapidly falling prices globally. By the late 1920s, most countries had overvalued exchange rates relative to gold (and silver), that exerted powerful deflationary forces on their domestic economies. This forced most Western governments to debase fiat money vis-à-vis gold to stop price deflation. Correspondingly, China had to abandon the silver standard in November 1935, with Hong Kong shortly following suit. At the time of debasement, the United Kingdom was the leading economic power. As a colony, it made sense for the Hong Kong government to link the HKD to the British pound. The established rate was GBP/HKD 16, giving birth to the currency board system (Chart 2). Meanwhile, as a trading hub, a peg with an international currency made sense. The problems there were two-fold. First, the pound was still gold-linked. And second, Britain’s subsequent decline in economic power was accompanied by a series of sudden and dramatic devaluations in the pound, which was hugely disruptive to Hong Kong’s financial system. By 1972, the British government decided to float the pound, which effectively ended the GBP/HKD peg. Chart 2A History Of The HKD Peg
A History Of The HKD Peg
A History Of The HKD Peg
In July 1972, the authorities made the decision to peg the Hong Kong dollar to the US dollar at USD/HKD 5.65, which was another policy mistake. The switch made sense given the rising economic power of the US, as well as rising trade links (Chart 3). However, the dollar was also under a crisis of confidence following the Nixon devaluation in 1971. In February 1973, the HKD was freely floated. Chart 3The Peg Is Usually Against The Dominant Economic Power
The Peg Is Usually Against The Dominant Economic Power
The Peg Is Usually Against The Dominant Economic Power
Counter-intuitively, the free-floating era for HKD was arguably the most volatile for its domestic economy. For one, discipline in monetary policy was gone. Money and credit growth exploded, inflation hit double-digits, home prices soared and the trade balance massively deteriorated. Political instability was also rife, given the uncertainty surrounding the end of British claims on the island. As the dialogue included China’s reclaim of political control over Hong Kong, there was uncertainty over the rule of law. This cocktail of political and economic uncertainty led to a 33% depreciation in the HKD between mid-1980 and October 1983. Panicked policymakers returned to the US dollar peg. Paul Volcker, then Federal Reserve chairperson, was establishing himself as the world’s most credible central banker, having dropped US inflation from almost 15% in 1980 to below 3% by 1983. Economic and financial links with the US also justified a peg. In August of 1983, the authorities announced a USD/HKD fixed rate of 7.80, which has remained in place since. The Current Peg: Advantages And Disadvantages Chart 4Fiscal Prudence In Hong Kong
Fiscal Prudence In Hong Kong
Fiscal Prudence In Hong Kong
The advantage of the HKD peg is that the choice of the nominal anchor, the US dollar, renders it credible. First, the US dollar is an international reserve currency dominating international trade, which helps to facilitate settlements while instilling confidence among transacting participants. As a financial hub, this is crucial for Hong Kong. Meanwhile, such an anchor imposes fiscal discipline, since government deficits cannot be monetized by money printing. In the case where the government tries to be profligate, the rise in inflation will lower real rates and lead to capital outflows. This will force the HKMA to sell US dollars and absorb local currency. In the extreme case, the central bank can run out of reserves, causing the peg to collapse. Indeed, over the past several years, government debt in Hong Kong has been close to nil (Chart 4). The drawback of a fixed exchange rate regime is that a country or a region relinquishes control over independent monetary policy. In the case of Hong Kong, this means that interest rates are determined by the actions of the US Fed. Such a marriage was justified when the business cycles between the two economies were in sync, but in times of economic divergences, the fixed exchange rate leads to economic volatility. Chart 5Currency Peg And Internal Devaluation
Currency Peg And Internal Devaluation
Currency Peg And Internal Devaluation
Chart 6Hong Kong Interest Rates In The Late 90's
Hong Kong Interest Rates In The Late 90's
Hong Kong Interest Rates In The Late 90's
This divergence was clearly evident in the 1990s, as falling interest rates in the US supercharged a housing and stock market bubble in Hong Kong. When the Asian crisis finally came around in 1997, the lack of exchange-rate flexibility led to a vicious internal devaluation (Chart 5). A prolonged period of high unemployment and stagnant wages was needed for Hong Kong to finally improve its competitiveness. Most importantly, in 1998, in the depths of the Asian financial crisis, the peg attracted a concerted attack from speculators who believed a devaluation of the Hong Kong dollar alongside other regional currencies was inevitable. Their assault inflicted considerable pain, driving short-term HKD interest rates (Chart 6) and wiping out over a quarter of the local stock market in a matter of weeks. At the time, the Hong Kong government was successful in fending off the speculative attacks by intervening massively in both the foreign exchange and equity markets. Is An Adjustment Pending? If So, When? Chart 7USD/HKD And Interest Rate Spreads
USD/HKD And Interest Rate Spreads
USD/HKD And Interest Rate Spreads
As the above narrative suggests, the HKD is no stranger to socio-economic shocks and speculative attacks, and it has, more recently, weathered them pretty well. The more immediate question is whether the shift in the political landscape could be potent enough to crack the peg this time around. While plausible, it is unlikely for a few reasons. First, the HKD continues to trade on the stronger side of the peg as US interest rates have collapsed, wiping off any positive carry that would have catalyzed outflows. Fluctuations in the USD/HKD within the 7.75-7.85-band track the Libor-Hibor spread pretty closely (Chart 7). A currency board has unlimited ability to defend the strong side of the peg, since it can print currency and absorb foreign reserves (print HKDs and use these to buy USDs in this case). On the weak side, these foreign exchange reserves are drawn down. Therefore, any threat to the peg should be preceded by consistent trading on the weaker side, questioning the HKMA’s ability to keep selling FX reserves to defend the peg. Fluctuations in the USD/HKD within the 7.75-7.85-band track the Libor-Hibor spread pretty closely. Second, the Hong Kong peg remains extremely credible, since the entire monetary base is backed over two times by FX reserves (Chart 8). Even as a percentage of broad money supply, Hong Kong reserves are ample and very high by historical standards (Chart 8, bottom panel). Meanwhile, since 1983, the currency board system has undergone a number of reforms and modifications, allowing it to adapt to the changing macro environment. This represents a powerful insurance policy for the HKMA’s ability to defend the currency peg, significantly enhancing the system’s credibility. Chart 8Ample Foreign Exchange Reserves
Ample Foreign Exchange Reserves
Ample Foreign Exchange Reserves
Chart 9Hong Kong Runs Recurring Surpluses
Hong Kong Runs Recurring Surpluses
Hong Kong Runs Recurring Surpluses
Third, ever since the peg was instituted, Hong Kong has mostly run budget surpluses. As a result, government debt in Hong Kong is almost non-existent, as we illustrate above. This has removed any incentive to monetize spending, which remains an open argument in the US, Japan or even the euro area. One of our favored metrics on the health of a currency is the basic balance, and on this basis, Hong Kong scores much more favorably than the US. While Hong Kong has transitioned from being a goods exporter to that of services, it remains extremely competitive, with a healthy current account surplus of 5% of GDP (Chart 9). These recurring surpluses have propelled Hong Kong to one of the biggest creditors in the world, with a net international investment position that is a whopping 430% of GDP and rising (Chart 10). Chart 10Hong Kong Is A Net Creditor To The World
The Hong Kong Dollar Peg And Socio-Economic Debate
The Hong Kong Dollar Peg And Socio-Economic Debate
Fourth, over the past few years, productivity in Hong Kong has outpaced that of the US and most of its trading partners (Chart 11). This has lifted the fair value of the currency tremendously. This means it is more like that when the peg adjusts, the outcome will be HKD appreciation. On a real effective exchange rate basis, the HKD is not that overvalued compared to the US dollar, after accounting for the massive increase in relative productivity (Chart 12). It is notable that during the Asian financial crisis, currencies like the Thai bhat were massively overvalued, which is why the adjustment was back down toward fair value. Chart 11Hong Kong Is Highly Productive
Hong Kong Is Highly Productive
Hong Kong Is Highly Productive
Chart 12Trade-Weighted HKD Is Slightly Expensive
Trade-Weighted HKD Is Slightly Expensive
Trade-Weighted HKD Is Slightly Expensive
Fifth, there is a strong incentive for both Beijing and Hong Kong to defend the peg, because the relevance of Hong Kong is no longer as a shipping port, but as a financial center. The peg reduces volatility, as transactions are essentially dollarized. The relevance of Hong Kong in Asia can be seen by looking at the market capitalization of the Hang Seng index compared to that of the Topix index in Tokyo or the Shanghai Composite index. Any escalation in the US-China trade war, especially in the technology sphere, will only lead to more listings on the Hong Kong stock exchange. Equity flows through the HK-Shanghai and HK-Shenzhen stock connect program are rising, suggesting the market still considers Hong Kong an important intermediary in doing business with China (Chart 13). On the political front, the most potent risk is that the US Treasury moves to unilaterally limit access to US dollars by Hong Kong banks. While this was discussed by President Trump’s top advisers, it was also dismissed as unwise due to the potential shock to the global financial system. Meanwhile, with massive swap lines with the Fed, Hong Kong’s international banks can always draw on US liquidity. Tariffs on Hong Kong goods are another option, but this again will not really deal a severe blow to the peg, since Hong Kong mainly re-exports, with very little in the way of domestic goods exports (Chart 14). Chart 13Hong Kong Is An Important Financial Center
Hong Kong Is An Important Financial Center
Hong Kong Is An Important Financial Center
Chart 14Hong Kong Is Partially Insulated From Tariffs
Hong Kong Is Partially Insulated From Tariffs
Hong Kong Is Partially Insulated From Tariffs
Property Market Blues The property market is the one area in Hong Kong where a sanguine view is difficult to paint. Hong Kong is one of the most unaffordable cities on the planet, and high income inequality has been a reason behind resident angst. The gini coefficient, a measure of inequality in a society, is more elevated in Hong Kong compared to Singapore, China or even South Africa. After years of loose monetary policy, property prices in Hong Kong have completely decoupled from fundamentals. Housing is even more unaffordable now than it was back in 1997, and domestic leverage is very high. With such a high debt stock, even a gradual uptick in interest rates will have a significant impact on the debt service burden (Chart 15). Stocks and real estate prices are positively correlated, suggesting deleveraging pressures will likely be quite high if both unravel (Chart 16). Chart 15High Debt Service Burden##br## In Hong Kong
High Debt Service Burden In Hong Kong
High Debt Service Burden In Hong Kong
Chart 16Hong Kong Stocks Are Tied To The Property Market
Hong Kong Stocks Are Tied To The Property Market
Hong Kong Stocks Are Tied To The Property Market
However, there are offsetting factors. First, it is unlikely that interest rates in Hong Kong (or anywhere in the developed world for that matter) will rise anytime soon. COVID-19 has provided “carte blanche” in terms of global stimulus. More importantly, the US is at the forefront of this campaign, meaning interest rates in Hong Kong will remain low for a while. Second, in recent history, Hong Kong has proven that it has the resilience to handle volatility in the property markets. During the Asian crisis, property prices fell by 60%, yet no bank went bust. Share prices also collapsed but are much higher today, suggesting the drop was a buying opportunity. And with such a low government debt burden, any systemic threat to banks will nudge the authorities to bail out important companies and sectors. In terms of asset markets, the performance of the Hang Seng index relative to the S&P 500 is purely a function of interest rates. The US stock market is dominated by technology and healthcare that do well when interest rates fall, while banks and real estate dominate the Hong Kong market. So rising rates hurt the US stock market much more than Hong Kong (Chart 17). Meanwhile, the recent turmoil has made Hong Kong assets very cheap relative to its sister-city, Singapore (Chart 18). This suggests that a lot of the potential equity outflows have already occurred, based on today’s situation. Chart 17Interest Rates And The Hong Kong Stock Market
Interest Rates And The Hong Kong Stock Market
Interest Rates And The Hong Kong Stock Market
Chart 18Hong Kong Has Cheapened Relative To Singapore
Hong Kong Has Cheapened Relative To Singapore
Hong Kong Has Cheapened Relative To Singapore
The Future Of The Peg A peg to the Chinese RMB makes sense. The Hong Kong economy is now heavily tied to the Chinese economy, with over 50% of exports going to China (previously mentioned Chart 3). However, that will sound the death knell for Hong Kong’s status as a financial center, since the US dollar remains very much a reserve currency. There is also a risk that if Beijing uses RMB depreciation as a weapon in a blown-out confrontation with the US in the coming years, it will threaten the sustainability of the HKD peg, since it could inflate asset bubbles. What is more likely is that the option of re-pegging to the RMB comes many years down the road, when the yuan has become a fully convertible currency. The recent turmoil has made Hong Kong assets very cheap relative to its sister-city, Singapore. There is the option to assume another currency board akin to Singapore. This option makes sense, since this would give the HKMA scope to link to cheaper currencies, such as the yen and euro. Such an overhaul will require significant technical expertise and political will from both Beijing and Hong Kong. It is not very clear what the cost/benefit outcome would be of this initiative, but it is worth considering since the RMB itself is managed against other currencies. Finally, there is always the option to fully float the peg, but this is likely to increase volatility. As well, for policymakers, it makes sense to continue pegging the exchange rate to the US dollar as it depreciates against major currencies, since it ends up easing financial conditions for Hong Kong concerns. Chester Ntonifor Foreign Exchange Strategist chestern@bcaresearch.com Footnotes 1 Special Administrative Region of the People's Republic of China Trades & Forecasts Forecast Summary Core Portfolio Tactical Trades Limit Orders Closed Trades
Highlights The US dollar is likely to weaken over the next 12 months as global growth accelerates and the narrowing in real interest rate differentials continues to thwart the greenback. Theoretically, the relationship between exchange rates and budget deficits is indeterminate. Whether or not a larger budget deficit leads to a weaker currency ultimately depends on how the central bank responds and what other countries are doing. Today, the Fed is effectively capping nominal yields through unlimited bond purchases and aggressive forward guidance. As such, the passage of a new US fiscal stimulus package should mitigate deflationary fears, reduce real rates, and put modest downward pressure on the dollar. While a disorderly dollar selloff cannot be ruled out, it is a low-probability scenario at the moment. A major dollar decline would require that realized inflation increases dramatically, which is unlikely at a time when unemployment is still so elevated. Moreover, to the extent that the US economy is operating below its potential, increased fiscal stimulus will lead to higher private-sector savings. Higher private-sector savings, in turn, will limit any deterioration in the current account balance. Investors should remain overweight global equities over a 12-month horizon, favoring cheaper non-US stocks and cyclical sectors. Beep Beep In the classic Road Runner cartoon, Wile E. Coyote has a habit of inadvertently running off a cliff, stopping for a moment in mid-air to look down, only to realize that there is nothing beneath him. Like the coyote, the US economy has gone over the fiscal cliff. The extra $600 a week in emergency federal unemployment benefits have lapsed. The small business Paycheck Protection Program has stopped accepting new applications, while state and local governments face a massive cash crunch. President Trump’s executive orders, if implemented, will mitigate some of the fiscal tightening. However, it is probable that they will be challenged in court. And even if the states are able to get the new unemployment benefit program up and running quickly – which seems doubtful – the $44 billion in federal funding for the program, which was taken from the Department of Homeland Security’s Disaster Relief Fund, will run out in six weeks. The stimulative effect of the adjustment to payroll taxes is also likely to be limited, given that the President’s order only defers tax liabilities until next year, rather than forgiving them altogether. So why hasn’t the stock market reacted negatively to the withdrawal of large-scale fiscal stimulus? The answer is that investors are assuming that Congress will manage to cobble together a deal over the coming days that resolves the shortcomings in Trump’s executive orders. Given that voters favor more stimulus, some sort of a deal is more likely than not (Table 1). However, with the stock market near record highs, the impetus for Trump to seek a compromise with Congress is not yet at hand. Risk assets may need to suffer a setback to catalyze an agreement. Table 1Majority Continues To Support Expanded Unemployment Insurance
The Dollar And The Budget Deficit: From Theory To Practice
The Dollar And The Budget Deficit: From Theory To Practice
Still Sticking With Our Overweight 12-Month View On Stocks Despite our near-term concerns, we continue to recommend that investors overweight equities on a 12-month horizon. While stocks are not particularly cheap, they are not expensive either. The MSCI All-Country World index is trading at 18-times calendar 2021 earnings. The forward PE ratio based on projected 2021 earnings is 21 in the US and 15 outside the US. Even if one allows for the likelihood that earnings estimates are overly optimistic – as they usually are – the earnings yield on stocks is about six percentage points above the real yield on bonds. This suggests that the equity risk premium is still quite high, compensating investors for earnings risk (Chart 1). Meanwhile, sentiment towards stocks remains downbeat. Bears outnumbered bulls by 12 percentage points in this week’s American Association of Individual Investors sentiment poll (Chart 2). On average, bulls have exceeded bears by 8 percentage points in the 33-year history of this survey. Stocks are more likely to go up than down when sentiment is bearish. Chart 1Favor Equities Over Bonds Over A 12-Month Horizon
The Dollar And The Budget Deficit: From Theory To Practice
The Dollar And The Budget Deficit: From Theory To Practice
Chart 2Many Investors Are Bearish On Stocks
The Dollar And The Budget Deficit: From Theory To Practice
The Dollar And The Budget Deficit: From Theory To Practice
Dollar: Stick With The Herd Chart 3The Dollar Has Started Breaking Down
The Dollar And The Budget Deficit: From Theory To Practice
The Dollar And The Budget Deficit: From Theory To Practice
Bears also outnumber bulls in surveys of sentiment towards the dollar (Chart 3). Does that mean that one should position for a stronger greenback? No. The dollar is a high momentum currency (Chart 4). Unlike in the case of equities, being a contrarian has been a losing strategy for trading the dollar. The dollar is more likely to weaken when sentiment is bearish and the currency is trading below its moving averages, as is currently the case (Chart 5). Chart 4The Dollar Is A High Momentum Currency
The Dollar And The Budget Deficit: From Theory To Practice
The Dollar And The Budget Deficit: From Theory To Practice
Chart 5Trading The Dollar: The Trend Is Your Friend
The Dollar And The Budget Deficit: From Theory To Practice
The Dollar And The Budget Deficit: From Theory To Practice
The US Dollar Is Normally A Risk-Off Currency Chart 6The US Economy Is Less Cyclical Than Those Of Its Trading Partners
The Dollar And The Budget Deficit: From Theory To Practice
The Dollar And The Budget Deficit: From Theory To Practice
What are the implications of a weaker dollar for risk assets? Just like bond yields can either fall for risk-on reasons (i.e., when monetary policy turns dovish) or fall for risk-off reasons (i.e., when deflationary pressures set in), a weakening in the US dollar can either be a risk-on or a risk-off event. Historically, the dollar has traded as a risk-off currency. This is partly because the US Treasury market is one of the most liquid and safest in the world. When investors panic, they flock to Treasuries, which raises the demand for dollars. In contrast, when investors feel emboldened to take on more risk, they tend to sell dollars. The US economy is less cyclical than those of its trading partners (Chart 6). While the US benefits from stronger global growth, the rest of the world benefits even more. Thus, when global growth accelerates, capital tends to flow from the US to other economies, hurting the dollar in the process. Moreover, changes in interest-rate differentials can affect the value of the dollar. For example, at the start of 2019, euro area 2-year real rates were 221 basis points below comparable US rates. Today, they are 19 basis points above US rates, representing a net swing of 240 basis points. If anything, the dollar has fallen less than one would have anticipated based on changes in interest rate differentials (Chart 7). Chart 7AInterest Rate Differentials Do Not Favor The Dollar
The Dollar And The Budget Deficit: From Theory To Practice
The Dollar And The Budget Deficit: From Theory To Practice
Chart 7BInterest Rate Differentials Do Not Favor The Dollar
The Dollar And The Budget Deficit: From Theory To Practice
The Dollar And The Budget Deficit: From Theory To Practice
Will Bloated Fiscal Deficits Undermine The Dollar? To the extent that the recent dollar selloff has been driven by stronger global growth and a more dovish Fed, it is not surprising that risk assets have rallied. However, an increasing number of commentators have begun to wonder whether the next leg of the dollar bear market could be less benign than the one that preceded it. The US dollar will weaken over the next 12 months. This weakness will mainly stem from “risk-on” forces, namely stronger global growth and a very dovish Fed. Stephen Roach has argued that soaring budget deficits will push the US current account further into deficit, while America’s disengagement from the rest of the world will undermine the dollar’s reserve status. He reckons that the dollar could plunge by 35% “sooner rather than later.” I agree with Stephen that the dollar faces a variety of long-term challenges. However, I do not think these challenges will be the primary drivers of the dollar over the next 12 months or so. A Simple Framework For Thinking About Currencies To understand why, let me describe a simple two-country framework that I have found to be very useful for thinking about currencies’ sensitivity to various macroeconomic forces. This framework, which draws on the seminal work of Rudi Dornbusch in the 1970s,1 relies on two “equilibrium conditions”: A long-run equilibrium condition that says that the price of a comparable basket of goods and services should be the same across countries. This implies, for example, that if the price level in Country A rises relative to Country B by say 10%, then Country A’s currency should eventually depreciate by 10% relative to Country B’s. A short-run equilibrium condition that says that the expected risk-adjusted return on investment assets should be the same across countries. This implies that all excess returns are arbitraged away. Suppose that interest rates and inflation are initially the same in Country A and B, but that A suddenly and unexpectedly decides to run a larger budget deficit for the next ten years. What will happen to the value of A’s currency? The answer depends on how Country A’s central bank reacts; specifically, on whether real interest rates end up going up or down in response to the bigger budget deficit. First, let us consider an extreme situation where investors believe that Country A’s central bank will not hike interest rates at all in response to the larger budget deficit, but that annualized inflation will nevertheless rise by 2% over the following decade due to the additional aggregate demand from easier fiscal policy. In that case, the price level in Country A will end up being 20% higher than previously expected after a decade, implying that A’s currency would have to fall immediately by 20% (Chart 8 – left-hand side column). Chart 8Short- And Long-Run Moves In Currencies Under Various Inflation And Interest Rate Scenarios
The Dollar And The Budget Deficit: From Theory To Practice
The Dollar And The Budget Deficit: From Theory To Practice
The reason Country A’s currency has to fall by 20% at once, rather than grinding lower by 2% per year for ten years, is that we are assuming that interest rates in the two countries remain equal. If Country A’s currency were to fall slowly, Country B’s bonds would earn a higher return in common-currency terms during the entire period when Country A’s exchange rate was trending lower. This would violate the second equilibrium condition. Thus, this framework implies that only unanticipated changes to policy can lead to discrete (i.e., step function) changes in exchange rates. Let us now consider a different scenario where the central bank in Country A, rather than accommodating easier fiscal policy, immediately moves to neutralize the stimulative impact of a larger budget deficit by hiking interest rates by two full percentage points. Since there is no net impact on aggregate demand, inflation expectations in Country A do not change.2 Country A’s exchange rate does change, however: it immediately appreciates by 20% (Chart 8 – middle column). This appreciation is necessary to engender the expectation of a subsequent two percentage point per year depreciation in A’s exchange rate. The ensuing slow depreciation in A’s currency offsets the additional two percentage points in interest that A’s bonds pay over B’s bonds. One can easily imagine intermediate cases. For example, suppose Country A’s central bank raises interest rates by only one percentage point, which results in A’s price level rising by 5% over the subsequent decade relative to B’s price level. As the right-hand side column of Chart 8 shows, A’s exchange rate would initially appreciate by 5%, but then depreciate by one percent every year for a decade, ultimately finishing 5% below where it started. An Added Wrinkle: Portfolio Balance Effects Before we apply this framework to the outlook for the US dollar, we need to discuss something that is central to Stephen Roach’s thesis, which is the role of portfolio balance effects. In the discussion above we said nothing about current account deficits, US indebtedness to the rest of the world, or the dollar’s reserve currency status. This is because we assumed that investors would be indifferent between holding Country A's and B’s bonds as long as they offered the same expected returns after accounting for projected exchange rate movements. In reality, financial assets are not perfectly substitutable. Changes in “portfolio balance” – the quantity and composition of assets available to the public – is likely to have an effect on returns. Thus, if Country A’s government issues more debt in order to finance a wider budget deficit, investors may demand a higher return to induce them to hold that additional debt. This extra return is likely to be larger if there is more uncertainty about the path of inflation. In the context of the first example discussed above, Country A’s exchange rate may have to fall by more than 20%. A weakening of Country A’s exchange rate would allow investors in B to purchase the same number of Country A bonds but at a lower cost when measured in B’s currency. Moreover, by undershooting its long-term fair value – and thus creating expectations of an appreciation in its currency – Country A can increase the appeal of its bonds. The expected appreciation of A’s exchange rate following a big depreciation effectively compensates investors with a risk premium for owning A’s bonds. This is why we phrased our second equilibrium condition in terms of “risk-adjusted” returns rather than simply expected returns. What All This Means For The Dollar Chart 9Rising Budget Deficits Do Not Automatically Translate Into A Weaker Dollar
The Dollar And The Budget Deficit: From Theory To Practice
The Dollar And The Budget Deficit: From Theory To Practice
The key insight from our analysis is that the relationship between budget deficits and exchange rates is indeterminate. If the Fed adopts a hawkish stance in order to keep inflation from accelerating, like Paul Volcker’s Fed did in the early 1980s, the dollar could rise (Chart 9). In contrast, if the Fed keeps rates on hold in the face of rising budget deficits, the dollar is more likely to weaken. Arguably, this is what happened in the early 2000s following the Bush tax cuts. The downward pressure on the dollar would intensify if, as per our discussion of portfolio balance effects, investors started demanding a higher risk premium to hold US assets. Today, the Fed is effectively capping nominal bond yields through unlimited bond purchases and aggressive forward guidance committing to easy policy for years. Jay Powell has gone as far as to say that “we’re not even thinking about thinking about raising rates.” As such, the passage of a new US fiscal stimulus package would mitigate deflationary fears, reduce real rates, and put modest downward pressure on the dollar. Chart 10Labor Market Slack Will Keep Inflation In Check
The Dollar And The Budget Deficit: From Theory To Practice
The Dollar And The Budget Deficit: From Theory To Practice
Chart 11Inflation Expectations Tend To Track Realized Inflation
The Dollar And The Budget Deficit: From Theory To Practice
The Dollar And The Budget Deficit: From Theory To Practice
Could further dollar weakness morph into a disorderly dollar selloff which hurts, rather than helps, global equities and other risk assets? While such an outcome cannot be ruled out, it is a low-probability scenario for the moment. For one thing, the US output gap – the difference between what the economy can potentially produce and what it is producing now – is very large. Inflation is unlikely to rise significantly if there is still a fair amount of labor market slack (Chart 10). Historically, inflation expectations have tended to track actual inflation (Chart 11). If the latter remains contained for the next few years, so will the former. What about the possibility that bigger budget deficits will produce much larger current account deficits? It is certainly true that if private-sector savings did not change, a bigger budget deficit would reduce national savings, leading to a larger current account deficit. It is also true that US external liabilities now far exceed foreign assets, reflecting the fact that the US has run a current account deficit every year since 1982 (Chart 12). Chart 12Many Decades Of Current Account Deficits Have Led To A Negative Net International Investment Position For The US
The Dollar And The Budget Deficit: From Theory To Practice
The Dollar And The Budget Deficit: From Theory To Practice
Fortunately, things are not quite as bleak for the dollar as they seem, at least for now. Despite a net international investment position of negative 56% of GDP, the US still generates substantially more income from its overseas assets than it pays to service its liabilities (Chart 13). This reflects the fact that US foreign liabilities are mainly comprised of low-yielding government bonds, while its assets largely consist of higher-yielding equities and foreign direct investment (Chart 14). Chart 13The US Generates More Income From Its Overseas Assets Than It Pays On Its Liabilities
The Dollar And The Budget Deficit: From Theory To Practice
The Dollar And The Budget Deficit: From Theory To Practice
Chart 14A Breakdown Of US Assets And Liabilities
The Dollar And The Budget Deficit: From Theory To Practice
The Dollar And The Budget Deficit: From Theory To Practice
Chart 15Government Transfers Primarily Boosted Personal Savings This Year With Little External Spillovers So Far
The Dollar And The Budget Deficit: From Theory To Practice
The Dollar And The Budget Deficit: From Theory To Practice
Moreover, to the extent that the US economy is operating below its potential, fiscal stimulus will lead to higher private-sector savings. Higher private-sector savings, in turn, will reduce the need for the US to source capital from abroad. If the government transfers money to households and they save it, private-sector savings will rise by the same amount that government savings fall. If households spend the money, GDP and national income will rise. The resulting increase in income will boost savings.3 This is precisely what has happened this year: The fiscal deficit has soared, private-sector savings have exploded, and the trade balance has basically gone sideways (Chart 15). Granted, to the extent that some of the spending will be directed towards imports, the current account deficit will widen over the coming months. However, stronger growth will also increase corporate profitability. This could attenuate any capital outflows from the US, thus preventing the dollar from falling as much as it otherwise would have. Investment Conclusions Chart 16Global Equities Tend To Outperform Bonds When Global Growth Is Strengthening And The Dollar Is Weakening
The Dollar And The Budget Deficit: From Theory To Practice
The Dollar And The Budget Deficit: From Theory To Practice
The US dollar will weaken over the next 12 months. This weakness will mainly stem from “risk-on” forces, namely stronger global growth and a very dovish Fed. Global equities have generally outperformed bonds when global growth is strengthening, and the dollar is weakening (Chart 16). Non-US stocks, cyclical stocks, value stocks, and small caps all tend to fare best in a weaker dollar environment (Chart 17). These stocks are also quite cheap compared to their counterparts: US stocks, defensive stocks, growth stocks, and large caps (Chart 18). Chart 17ANon-US Stocks, Cyclical Stocks, Value Stocks, And Small Caps Perform Better When The Dollar Is Falling…
The Dollar And The Budget Deficit: From Theory To Practice
The Dollar And The Budget Deficit: From Theory To Practice
Chart 17BNon-US Stocks, Cyclical Stocks, Value Stocks, And Small Caps Perform Better When The Dollar Is Falling…
The Dollar And The Budget Deficit: From Theory To Practice
The Dollar And The Budget Deficit: From Theory To Practice
Chart 18… And They Are Cheap To Boot
The Dollar And The Budget Deficit: From Theory To Practice
The Dollar And The Budget Deficit: From Theory To Practice
Looking further out, the outlook for equities is less rosy. Stagflationary pressures could emerge in 2023 or thereabouts as unemployment falls to pre-pandemic levels and supply-side constraints begin to bite. If that were to happen, profit margins would come under pressure, sending equities lower. It is not clear how the US dollar would perform in that environment. On the one hand, a risk-off environment would tend to favor the greenback. On the other hand, if the Fed is perceived as being too slow to tame inflation, the dollar could sink. Of course, much depends on what is happening in other economies. Exchange rates are relative prices. If inflation rises everywhere, the big winners from higher inflation would not be other fiat currencies, but hard currencies such as gold. That is why we continue to recommend that investors stay long the yellow metal. Peter Berezin Chief Global Strategist peterb@bcaresearch.com Global Investment Strategy View Matrix
The Dollar And The Budget Deficit: From Theory To Practice
The Dollar And The Budget Deficit: From Theory To Practice
Current MacroQuant Model Scores
The Dollar And The Budget Deficit: From Theory To Practice
The Dollar And The Budget Deficit: From Theory To Practice
Footnotes 1 Rudiger Dornbusch, “Expectations And Exchange Rate Dynamics,” The Journal of Political Economy, (84:6), December 1976. return to text 2 We are assuming that the central bank in Country A takes into account the impact that a stronger currency will have on aggregate demand when choosing the appropriate level of interest rates that neutralizes the effect of easier fiscal policy. return to text 3 For example, suppose households spend 75 cents of every dollar the government transfers to them exclusively on domestically-produced goods and services. If a government transfers $100 to households, $25 will be saved while the remaining $75 will be spent, thereby generating an additional $75 in GDP and income for the economy. Of the additional $75 in income, 25% ($18.75) will be saved while 75% ($56.25) will be spent. It is straightforward to show that if this process continues indefinitely, a total of 75+0.75*75+0.75^2*75+0.75^3*75+…=75/(1-0.75)=$300 in GDP and income will be generated. This means that private-sector savings will increase by 25+0.25*300=$100, which is exactly equal to the decline in government savings. Private-sector savings would rise by less than $100 if a portion of the spending was directed to imports. For instance, if households spent 15 cents of every dollar of income on imports, GDP would rise by 60+0.60*60+0.60^2*60+0.60^3*60+…=60/(1/1-0.60)=$150, while private savings would rise by 25+0.25*150=$62.50. return to text