Policy
BCA Research's Geopolitical Strategy service maintains its high conviction call that a new spending bill will be passed, likely by August 10. Fresh fiscal stimulus is more positive for the cyclical outlook than the tactical outlook. Stimulus “hiccups”…

Dear Client, In lieu of our regular report next week, we will be sending you a Special Report from my colleague Garry Evans, Chief Global Asset Allocation Strategist. Garry will be discussing the social and industrial changes that will remain in place even after the COVID-19 pandemic is over, and how investors should tilt their portfolios to take advantage of them. I hope you find his report insightful. Best regards, Peter Berezin, Chief Global Strategist Highlights The number of coronavirus cases in the US appears to have peaked. Negotiations to avert a fiscal cliff continue in Washington. While we expect a deal to be reached, markets could tread nervously until this happens. The US dollar will weaken further over the next 12 months. Narrowing interest rate differentials, a revival in global growth, deteriorating momentum, and pricey valuations all bode poorly for the greenback. Global equities in general, and non-US stocks in particular, tend to fare well in a weak dollar environment. Small cap and value stocks usually outperform when the dollar weakens. Bank shares should start to do better as yield curves steepen and faster economic growth reduces concerns over non-performing loans. US Virus Wave Cresting, But Fiscal Risks Intensifying Chart 1US: Number Of New Cases Seems To Be Peaking
The Stock Market Implications Of A Weaker Dollar
The Stock Market Implications Of A Weaker Dollar
Last week, we argued that the two biggest near-term threats to stocks and other risky assets were the rising number of coronavirus cases in parts of the US and the looming fiscal cliff.1 Since then, the news on the virus has been broadly positive, while developments on the fiscal front have been mixed. Chart 1 shows that the number of new cases seems to have peaked in the US. In Texas, Florida, California, and Arizona, the share of doctor visits linked to suspected Covid infections is trending lower. This metric leads diagnoses by about one-to-two weeks (Chart 2). Chart 2Doctor Visits, Which Lead Diagnoses, Are Trending Lower
The Stock Market Implications Of A Weaker Dollar
The Stock Market Implications Of A Weaker Dollar
Over half the US population lives in states that have either suspended or reversed reopening plans (Chart 3). Assuming the number of infections keeps falling and fiscal policy is not unduly tightened, household spending and employment growth – which appear to have stalled out in the second half of July – should begin to pick up. Chart 3Not So Fast
The Stock Market Implications Of A Weaker Dollar
The Stock Market Implications Of A Weaker Dollar
Unfortunately, the assumption that fiscal policy will remain stimulative looks somewhat shaky. Expanded unemployment benefits for 30 million Americans, consisting mainly of an additional $600 per week for unemployed workers, are set to expire at the end of July. Congressional Republicans have suggested trimming benefits to $200 per week. However, even that would represent a fiscal tightening of nearly 3% of GDP. A Question Of Incentives The Republican position is understandable, given that two-thirds of unemployed workers are currently receiving more in unemployment benefits than they earned while working. Thus, some scaling back of benefits is not only inevitable, but desirable. The question is one of timing. While job openings have risen from their lows, they are still 23% below where they were at the start of the year. According to the NFIB survey, the share of small businesses reporting difficulty in finding qualified workers has also fallen from year-ago levels. When the binding constraint on employment is a shortage of jobs rather than a shortage of workers, higher unemployment benefits will likely boost hiring. This is because increased benefits will increase spending on goods and services across the economy, thus augmenting the demand for labor. Debt, Gold, And The Dollar Chart 4Gold Prices Have Risen On The Back Of Falling Real Yields
Gold Prices Have Risen On The Back Of Falling Real Yields
Gold Prices Have Risen On The Back Of Falling Real Yields
Does the inevitable increase in government debt due to ongoing fiscal stimulus portend disaster down the road? According to many commentators, the recent drop in the dollar and the surge in gold prices is surely telling us that it does. While it is a compelling story, it is mainly false. The yield on the 30-year Treasury bond currently stands at 1.20%, down from 1.5% in mid-June and 2.33% at the start of the year. Bondholders may be many things, but masochistic is not one of them. If they really thought a fiscal crisis was around the corner, yields would be a lot higher. So why is the dollar falling and gold rallying? The answer is inflation expectations have risen off very low levels, which has pushed down real yields. Gold prices are almost perfectly correlated with real interest rates (Chart 4). The Real Reason The Dollar Has Fallen Going into this year, US real yields had a lot more room to decline than rates abroad. For example, at the start of 2019, US real 2-year yields were 221 bps above comparable euro area yields. Today, US real rates are 35 bps lower – a swing of 256 bps. Yield differentials have narrowed against other economies as well, which has pushed down the value of the dollar (Chart 5). In addition, relative growth dynamics have hurt the greenback. The US economy tends to be less cyclical than most of its trading partners. While the US benefits from faster global growth, the rest of the world benefits even more. This causes capital to flow from the US to other countries, leading to a weaker dollar (Chart 6). Chart 5The Greenback Has Been Losing Interest Rate Support
The Greenback Has Been Losing Interest Rate Support
The Greenback Has Been Losing Interest Rate Support
Chart 6The Dollar Usually Weakens When Global Growth Accelerates
The Dollar Usually Weakens When Global Growth Accelerates
The Dollar Usually Weakens When Global Growth Accelerates
Chart 7The Dollar And Cycles
The Stock Market Implications Of A Weaker Dollar
The Stock Market Implications Of A Weaker Dollar
BCA Research’s Foreign Exchange Strategist, Chester Ntonifor, has stressed that the dollar typically fares worst in the initial stages of business cycle recoveries (Chart 7). That is the stage we are in today. Indeed, the gap in growth between the US and the rest of the world is likely to be larger than usual over the next few quarters because the pandemic has hit the US harder than most other developed economies. Momentum is also working against the dollar. Being a contrarian is usually a smart investment strategy. That is not the case when it comes to trading the dollar. With the dollar, you want to follow the herd. This is because the dollar is a high momentum currency (Chart 8). A simple trading rule that buys the dollar when it is trading above its 50-day or 200-day moving average, and sells the dollar when it is trading below its respective moving averages, has historically made a lot of money. Likewise, the dollar performs best prospectively when sentiment is bullish and improving (Chart 9). Currently, the dollar is trading below its various moving averages. Sentiment is also poor and deteriorating (Chart 10). Chart 8USD Is A High Momentum Currency
The Stock Market Implications Of A Weaker Dollar
The Stock Market Implications Of A Weaker Dollar
Chart 9Trading The Dollar: The Trend Is Your Friend
The Stock Market Implications Of A Weaker Dollar
The Stock Market Implications Of A Weaker Dollar
Chart 10The Dollar Has Started Breaking Down
The Dollar Has Started Breaking Down
The Dollar Has Started Breaking Down
Chart 11The Dollar Is Still Fairly Expensive
The Stock Market Implications Of A Weaker Dollar
The Stock Market Implications Of A Weaker Dollar
If the dollar were cheap, all the factors discussed above could be overlooked. But the dollar is not cheap. It is still pricey based on purchasing power parity measures which compare the common-currency cost of identical consumption bundles from one country to the next (Chart 11). A Weaker Dollar is Bullish For Stocks, Especially Non-US Stocks Global equities in general, and non-US stocks in particular, tend to perform well when the dollar is weakening (Chart 12). Chart 12A Weaker Dollar Should Help Global Equities
A Weaker Dollar Should Help Global Equities
A Weaker Dollar Should Help Global Equities
Chart 13Cyclicals Tend To Outperform Defensives In A Falling Dollar Environment
Cyclicals Tend To Outperform Defensives In A Falling Dollar Environment
Cyclicals Tend To Outperform Defensives In A Falling Dollar Environment
Cyclical sectors such as industrials, energy, and materials normally outperform defensives in a weak dollar environment (Chart 13). Relative profit growth in these sectors tends to rise when the dollar depreciates (Chart 14). To the extent that cyclicals are overrepresented in stock market indices outside the US, this gives non-US equities a leg up. Chart 14Relative Profit Growth In Cyclical Sectors Tend To Rise When The USD Depreciates
Relative Profit Growth In Cyclical Sectors Tend To Rise When The USD Depreciates
Relative Profit Growth In Cyclical Sectors Tend To Rise When The USD Depreciates
EM Is The Big Winner From Dollar Weakness A weaker dollar is particularly beneficial to emerging markets. Commodity prices usually rise when the dollar drops (Chart 15). Rising resource prices are good news for many emerging markets. EM debt dynamics also tend to improve when the dollar weakens. EM external debt has grown in recent years (Chart 16). About 80% of EM foreign currency denominated debt is in dollars. A falling dollar reduces the local-currency value of US dollar-denominated liabilities, thus strengthening the balance sheets of many EM companies and governments. Emerging markets with large current account deficits and significant dollar liabilities such as Brazil, Indonesia, Turkey, and Mexico will outperform EMs that generally run current account surpluses and have little in the way of foreign-currency debt. Chart 15Commodity Prices Usually Rise When The Dollar Falls
Commodity Prices Usually Rise When The Dollar Falls
Commodity Prices Usually Rise When The Dollar Falls
Chart 16EM External Debt Has Grown In Recent Years
EM External Debt Has Grown In Recent Years
EM External Debt Has Grown In Recent Years
The Federal Reserve today is trying to engineer an easing in US financial conditions. A weaker dollar is facilitating that goal. Historically, EM stocks have been almost perfectly inversely correlated with US financial conditions (Chart 17). Chart 17EM Equities Benefit From Easier US Financial Conditions
EM Equities Benefit From Easier US Financial Conditions
EM Equities Benefit From Easier US Financial Conditions
What About DM? The impact of a weaker dollar on the stock markets of developed economies is more nuanced. Consider the euro area, for example. On the one hand, a stronger euro hurts the euro area economy, which can ultimately push down domestic profits. A stronger EUR/USD also reduces the profits of European companies with operations in the US when those profits are converted back into euros. That can also hurt European stocks. On the other hand, the overall reflationary effect of a weaker dollar on global growth tends to push up profits. In practice, the latter effect usually dominates the former. Thus, euro area stocks, just like stocks in most other markets, generally outperform the US when the dollar is weakening (Chart 18). Chart 18ANon-US Stock Markets Do Well Vis-À-Vis The US When The Dollar Is Weakening
Non-US Stock Markets Do Well Vis-À-Vis The US When The Dollar Is Weakening
Non-US Stock Markets Do Well Vis-À-Vis The US When The Dollar Is Weakening
Chart 18BNon-US Stock Markets Do Well Vis-À-Vis The US When The Dollar Is Weakening
Non-US Stock Markets Do Well Vis-À-Vis The US When The Dollar Is Weakening
Non-US Stock Markets Do Well Vis-À-Vis The US When The Dollar Is Weakening
Small Caps And Value Stocks Tend To Outperform When The Dollar Weakens Even though companies in the small cap Russell 2000 index generate less of their sales from abroad than those in the S&P 500, small caps still tend to outperform large caps in weak dollar environments (Chart 19). This is partly because smaller companies are more cyclical in nature. It is also because the US dollar performs best in a risk-off setting when investors are pouring money into the safe-haven Treasury markets. In contrast, small caps excel in a risk-on environment. Value stocks tend to outperform growth stocks in a weaker dollar environment (Chart 20). Like small caps, cyclical equity sectors are overrepresented in value indices. Financials also tend to punch above their weight in value indices. Chart 19Small Caps Tend To Outperform Large Caps During Weak Dollar Environments...
Small Caps Tend To Outperform Large Caps During Weak Dollar Environments...
Small Caps Tend To Outperform Large Caps During Weak Dollar Environments...
Chart 20...The Same Goes For Value Stocks
...The Same Goes For Value Stocks
...The Same Goes For Value Stocks
Small caps and value stocks outperformed between 2000 and 2008, a time when the US dollar was generally weakening. That period saw both a commodity boom and a wave of debt-fueled housing booms. The former lifted commodity prices, while the latter buoyed financials. Commodity prices should rise over the next 12 months thanks to a rebound in global growth and copious Chinese stimulus. Chart 21 shows that the Chinese credit impulse is on track to reach the highest levels since the Global Financial Crisis, while the fiscal deficit will probably hit a record 8% of GDP. The Outlook For Financial Stocks Gauging the outlook for financials is trickier. Credit growth has slowed sharply since the Global Financial Crisis, which has weighed on bank profits. The structural decline in bond yields has also been toxic for bank shares (Chart 22). Lower bond yields tend to translate into flatter yield curves, which can depress net interest margins. Chart 21China Has Opened The Spigots
China Has Opened The Spigots
China Has Opened The Spigots
Chart 22The Structural Decline In Bond Yields Has Been Negative For Bank And Value Stocks
The Structural Decline In Bond Yields Has Been Negative For Bank And Value Stocks
The Structural Decline In Bond Yields Has Been Negative For Bank And Value Stocks
A falling dollar has historically been associated with higher bond yields (Chart 23). As global growth recovers over the next 12 months, bond yields will edge higher. That said, central bank bond purchases, coupled with aggressive forward guidance, will keep bond yields from rising as much as they normally would. And even if nominal yields do rise, inflation expectations will rise even more, implying that real yields will fall further. Falling real yields tend to benefit growth stocks more than they benefit value stocks. Chart 23Bond Yields Tend To Rise When The Dollar Weakens
Bond Yields Tend To Rise When The Dollar Weakens
Bond Yields Tend To Rise When The Dollar Weakens
Still, even a modest steepening of the yield curve will be good for bank earnings. A recovery in economic activity should also dampen concerns about a spike in bad loans. Credit spreads normally fall when economic growth is improving and the dollar is weakening (Chart 24). Banks have significantly increased provisions since the start of the year, which has depressed reported earnings. If some of those provisions are reversed, profits will jump. Chart 24Credit Spreads Tend To Fall When Growth Is Improving And The Dollar Is Weakening
Credit Spreads Tend To Fall When Growth Is Improving And The Dollar Is Weakening Credit Spreads Tend To Fall When Growth Is Improving And The Dollar Is Weakening
Credit Spreads Tend To Fall When Growth Is Improving And The Dollar Is Weakening Credit Spreads Tend To Fall When Growth Is Improving And The Dollar Is Weakening
Chart 25Bank And Value Stocks Are Quite Cheap
The Stock Market Implications Of A Weaker Dollar
The Stock Market Implications Of A Weaker Dollar
Moreover, bank stocks in particular, and value stocks in general, are extremely cheap by historic standards (Chart 25). Thus, while the case for favoring value over growth is not as clear-cut as it could be, it is strong enough that long term-oriented investors should consider moving capital from high-flying tech stocks to unloved value stocks. Peter Berezin Chief Global Strategist peterb@bcaresearch.com Footnotes 1 Please see Global Investment Strategy Weekly Report, “Will Bond Yields Ever Go Up?” dated July 24, 2020. Global Investment Strategy View Matrix
The Stock Market Implications Of A Weaker Dollar
The Stock Market Implications Of A Weaker Dollar
Current MacroQuant Model Scores
The Stock Market Implications Of A Weaker Dollar
The Stock Market Implications Of A Weaker Dollar
Highlights The tech sector faces mounting domestic political and geopolitical risks. We fully expected stimulus hiccups but believe they will give way to large new fiscal support, given that COVID-19 is weighing on consumer confidence. Europe’s relative political stability is a good basis for the euro rally but any comeback in opinion polling by President Trump could give dollar bulls new life. DXY is approaching a critical threshold below which it would break down further. The US could take aggressive actions on Russia and Iran, but China and the Taiwan Strait remain the biggest geopolitical risk. Feature Near-term risks continue to mount against the equity rally, even as governments’ combined monetary and fiscal policies continue to support a cyclical economic rebound. Chart 1Tech Bubble Amid Tech War
Tech Bubble Amid Tech War
Tech Bubble Amid Tech War
Testimony by the chief executives of Facebook, Apple, Amazon, and Alphabet to the US House of Representatives highlighted the major political risks facing the market leaders. There are three reasons not to dismiss these risks despite the theatrical nature of the hearings. First, the tech companies’ concentration of wealth would be conspicuous during any economic bust, but this bust has left pandemic-stricken consumers more reliant on their services. Second, acrimony is bipartisan – conservatives are enraged by the tendency of the tech companies to side with the Democratic Party in policing the range of acceptable political discourse, and they increasingly agree with liberals that the companies have excessive corporate power warranting anti-trust probes. Executive action is the immediate risk, but in the coming one-to-two years congressional majorities will also be mustered to tighten regulation. Third, technology is the root of the great power struggle between the US and China – a struggle that will not go away if Biden wins the election. Indeed Biden was part of the administration that launched the US’s “Pivot to Asia” and will have better success in galvanizing US diplomatic allies behind western alternatives to Chinese state-backed and military-linked tech companies. US tech companies struggle to outperform Chinese tech companies except during episodes of US tariffs, given the latter firms’ state-backed turn toward innovation and privileged capture of the Chinese domestic market (Chart 1). The US government cannot afford to break up these companies without weighing the strategic consequences for America’s international competitiveness. The attempt to coordinate a western pressure campaign against Huawei and other leading Chinese firms will continue over the long run as they are accused of stealing technology, circumventing UN sanctions, violating human rights, and compromising the national security of the democracies. China, for its part, will be forced to take counter-measures. US tech companies will be caught in the middle. Like the threat of executive regulation in the domestic sphere, the threat of state action in the international sphere is difficult to time. It could happen immediately, especially given that the US is having some success in galvanizing an alliance even under President Trump (see the UK decision to bar Huawei) and that President Trump’s falling election prospects remove the chief constraint on tough action against China (the administration will likely revoke Huawei’s general license on August 13 or closer to the election). Massive domestic economic stimulus empowers the US to impose a technological cordon and China to retaliate. Combining this headline risk to the tech sector with other indications that the equity rally is extended – the surge in gold prices, the fall in the 30-year/5-year Treasury slope – tells us that investors should be cautious about deploying fresh capital in the near term. Republicans Will Capitulate To New Stimulus Just as President Trump has ignored bad news on the coronavirus, financial markets have ignored bad news on the economy. Dismal Q2 GDP releases were fully expected – Germany shrank by 10.1% while the US shrank by 9.5% on a quarterly basis, 32.9% annualized. But the resurgence of the virus is threatening new government restrictions on economic activity. US initial unemployment claims have edged up over the past three weeks. US consumer confidence regarding future expectations plummeted from 106.1 in June to 91.5 in July, according to the Conference Board’s index. Chart 2Global Instability Will Follow Recession
A Tech Bubble Amid A Tech War (GeoRisk Update)
A Tech Bubble Amid A Tech War (GeoRisk Update)
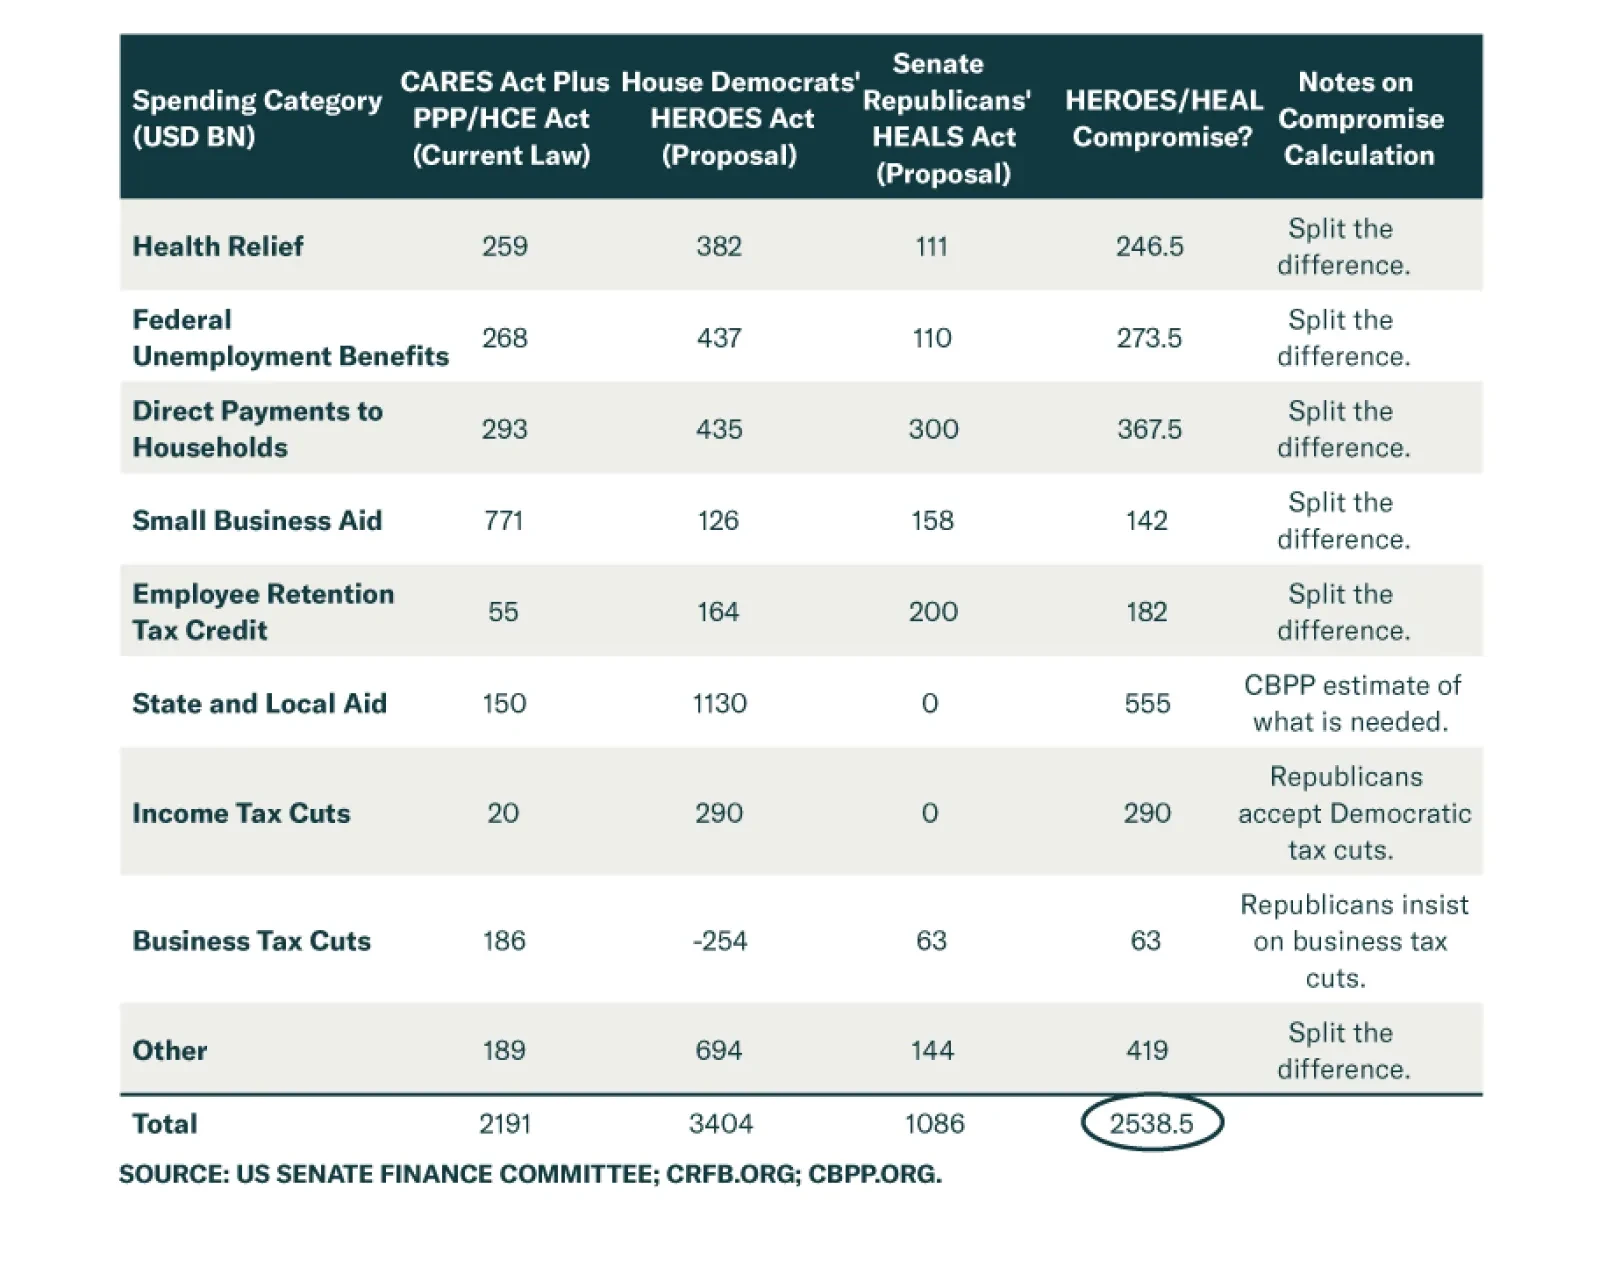
Setbacks in combating the virus will hurt consumers even assuming that governments lack the political will to enforce new lockdowns. The share of countries in recession has surged to levels not seen in 60 years (Chart 2). Financial markets can look past recessions, but the pandemic-driven recession will result in negative surprises and second-order effects that are unforeseen. Yes, fresh fiscal stimulus is coming, but this is more positive for the cyclical outlook than the tactical outlook. Stimulus “hiccups” could precipitate a near-term pullback – such a pullback may be necessary to force politicians to resolve disputes over the size and composition of new stimulus. This risk is immediate in the United States, where House Democrats, Senate Republicans, and the White House have hit an all-too-predictable impasse over the fifth round of stimulus. The bill under negotiation is likely to be President Trump’s last chance to score a legislative victory before the election and the last significant legislative economic relief until early 2021. The Senate Republicans have proposed a $1.1 trillion HEALS Act in response to the House Democrats’ $3.4 trillion HEROES Act, passed in mid-May. As we go to press, the federal unemployment insurance top-up of $600 per week is expiring, with a potential cost of 3% of GDP in fiscal tightening, as well as the moratorium on home evictions. Congress will have to rush through a stop-gap measure to extend these benefits if it cannot resolve the debate on the larger stimulus package. If Democrats and Republicans split the difference then we will get $2.5 trillion in stimulus, likely by August 10. Compromise on the larger package is easy in principle, as Table 1 shows. If the two sides split the difference between their proposals in a commonsense way, as shown in the fourth and fifth columns of Table 1, then the result will be a $2.5 trillion stimulus. This estimate fits with what we have published in the past and likely meets market expectations for the time being. Table 1Outline Of Fifth US COVID Stimulus Package (Estimate)
A Tech Bubble Amid A Tech War (GeoRisk Update)
A Tech Bubble Amid A Tech War (GeoRisk Update)
Whether it is enough for the economy depends on how the virus develops and how governments respond once flu season picks up and combines with the coronavirus to pressure the health system this fall. A back-of-the-envelope estimate of the amount of spending necessary to keep the budget deficit from shrinking in the second half of the year comes much closer to the House Democrats’ $3.4 trillion bill (Table 2), which suggests that what appears to be a massive stimulus today could appear insufficient tomorrow. Nevertheless, $2.5 trillion is not exactly small. It would bring the US total to $5 trillion year-to-date, or 24% of GDP! Table 2Reducing The Budget Deficit On A Quarterly Basis Will Slow Economy
A Tech Bubble Amid A Tech War (GeoRisk Update)
A Tech Bubble Amid A Tech War (GeoRisk Update)
While a compromise bill should come quickly, the Republican Party is more divided over this round of stimulus than earlier this year. Chart 3US Personal Income Looks Good Compared To 2008-09
US Personal Income Looks Good Compared To 2008-09
US Personal Income Looks Good Compared To 2008-09
First, there is some complacency due to the fact that the economy is recovering, not collapsing as was the case back in March. Our US bond strategist, Ryan Swift, has shown that US personal income is much better off, thus far, than it was in the months following the 2008 financial crisis, even though the initial pre-transfer hit to incomes is larger (Chart 3). Second, the Republican Party is reacting to growing unease within its ranks over the yawning budget deficit, now the largest since World War II (Chart 4). Chart 4If Republicans React To Deficit Concerns They Cook Their Own Goose
If Republicans React To Deficit Concerns They Cook Their Own Goose
If Republicans React To Deficit Concerns They Cook Their Own Goose
Chart 5Consumer Confidence Sends Warning Signal To Republicans
A Tech Bubble Amid A Tech War (GeoRisk Update)
A Tech Bubble Amid A Tech War (GeoRisk Update)
If Republicans are guided by complacency and fiscal hawks, they will cook their own goose. A failure to provide government support will cause a financial market selloff, will hurt consumer confidence, and will put the final nail in the coffin of their own chance of re-election as well as President Trump’s. Consumer confidence tracks fairly well with presidential approval rating and election outcomes. A further dip could disqualify Trump, whereas a last-minute boost due to stimulus and an economic surge could line him up for a comeback in the last lap (Chart 5). These constraints are obvious so we maintain our high conviction call that a bill will be passed, likely by August 10. But at these levels on the equity market, we simply have no confidence in the market gyrations leading up to or following the passage of the bill. Our conviction level is on the cyclical, 12-month horizon, in which case we expect US and global stimulus to operate and equities to rise. Bottom Line: Political and economic constraints will force Republicans to join Democrats and pass a new stimulus bill of about $2.5 trillion by around August 10. This is cyclically positive, but hiccups in getting it passed, negative surprises, and other risks tied to US politics discourage us from taking an overtly bullish stance over the next three months. Yes, US-China Tensions Are Still Relevant Chart 6Chinese Politburo"s Bark Worse Than Bite On Stimulus
Chinese Politburo"s Bark Worse Than Bite On Stimulus
Chinese Politburo"s Bark Worse Than Bite On Stimulus
Financial markets have shrugged off US-China tensions this year for understandable reasons. The pandemic, recession, and stimulus have overweighed the ongoing US-China conflict. As we have argued, China is undertaking a sweeping fiscal and quasi-fiscal stimulus – despite lingering hawkish rhetoric – and the size is sufficient to assist in global economic recovery as well as domestic Chinese recovery. What the financial market overlooks is that China’s households and firms are still reluctant to spend (Chart 6). China’s Politburo's late July meetings on the economy are frequently important. Initial reports of this year’s meet-up reinforce the stimulus narrative. Hints of hawkishness here and there serve a political purpose in curbing market exuberance, both at home and in the US election context, but China will ultimately remain accommodative because it has already bumped up against its chief constraint of domestic stability. Note that this assessment also leaves space for market jitters in the near-term. The phase one trade deal remains intact as President Trump is counting on it to make the case for re-election while China is looking to avoid antagonizing a loose cannon president who still has a chance of re-election. As long as broad-based tariff rates do not rise, in keeping with Trump’s deal, financial markets can ignore the small fry. We maintain a 40% risk that Trump levels sweeping punitive measures; our base case is that he goes to the election arguing that he gets results through his deal-making while carrying a big stick. At the same time, our view that domestic stimulus removes the economic constraints on conflict, enabling the two countries to escalate tensions, has been vindicated in recent weeks. Chinese political risk continues on a general uptrend, based on market indicators. The market is also starting to price in the immense geopolitical risks embedded in Taiwan’s situation, which we have highlighted consistently since 2016. While North Korea remains on a diplomatic track, refraining from major military provocations, South Korean political risk is still elevated both for domestic and regional reasons (Chart 7). Chart 7China Political Risk Still Trending Upward
China Political Risk Still Trending Upward
China Political Risk Still Trending Upward
The market is gradually pricing in a higher risk premium in the renminbi, Taiwanese dollar, and Korean won, and this pricing accords with our longstanding political assessment. The closure of the US and Chinese consulates in Houston and Chengdu is only the latest example of this escalating dynamic. While the US’s initial sanctions on China over Hong Kong were limited in economic impact, the longer term negative consequences continue to build. Hong Kong was the symbol of the Chinese Communist Party’s compatibility with western liberalism; the removal of Hong Kong’s autonomy strikes a permanent blow against this compatibility. China’s decision to go forward with the imposition of a national security law in Hong Kong – and now to bar pro-democratic candidates from the September 6 Legislative Council elections, which will probably be postponed anyway – has accelerated coalition-building among the western democracies. The UK is now clashing with China more openly, especially after blocking Huawei from its 5G system and welcoming Hong Kong political refugees. Australia and China have fought a miniature trade war of their own over China’s lack of transparency regarding COVID-19, and Canada is implicated in the Huawei affair. Even the EU has taken a more “realist” approach to China. Across the Taiwan Strait, political leaders are assisting fleeing Hong Kongers, crying out against Beijing’s expansion of control in its periphery, rallying support from informal allies in the US and West, and doubling down on their “Silicon Shield” (prowess in semiconductor production) as a source of protection. Intel Corporation’s decision to increase its dependency on TSMC for advanced microchips only heightens the centrality of this island and this company in the power struggle between the US and China. China cannot fulfill its global ambitions if the US succeeds in creating a technological cordon. Taiwan is the key to China’s breaking through that cordon. Therefore Taiwan is at heightened risk of economic or even military conflict. The base case is that Beijing will impose economic sanctions first, to undermine Taiwanese leadership. The uncertainty over the US’s willingness to defend Taiwan is still elevated, even if the US is gradually signaling a higher level of commitment. This uncertainty makes strategic miscalculations more likely than otherwise. But Taiwan’s extreme economic dependence on the mainland gives Beijing a lever to pursue its interests and at present that is the most important factor in keeping war risk contained. By the same token, Taiwanese economic and political diversification increases that risk. A “fourth Taiwan Strait crisis” that involves trade war and sanctions is our base case, but war cannot be ruled out, and any war would be a major war. Thus investors can safely ignore Tik-Tok, Hong Kong LegCo elections, and accusations of human rights violations in Xinjiang. But they cannot ignore concrete deterioration in the Taiwan Strait. Or, for that matter, the South and East China Seas, which are not about fishing and offshore drilling but about China’s strategic depth and positioning around Taiwan. Taiwan is at heightened risk of economic or military conflict. The latest developments have seen the CNY-USD exchange rate roll over after a period of appreciation associated with bilateral deal-keeping (Chart 8). Depreciation makes it more likely that President Trump will take punitive actions, but these will still be consistent with maintaining the phase one deal unless his re-election bid completely collapses, rendering him a lame duck and removing his constraints on more economically significant confrontation. We are perilously close to such an outcome, which is why Trump’s approval rating and head-to-head polling against Joe Biden must be monitored closely. If his budding rebound is dashed, then all bets are off with regard to China and Asian power politics. Chart 8A Warning Of Further US-China Escalation
A Warning Of Further US-China Escalation
A Warning Of Further US-China Escalation
Bottom Line: China’s stimulus, like the US stimulus, is a reason for cyclical optimism regarding risk assets. The phase one trade deal with President Trump is less certain – there is a 40% chance it collapses as stimulus and/or Trump’s political woes remove constraints on conflict. Hong Kong is a red herring except with regard to coalition-building between the US and Europe; the Taiwan Strait is the real geopolitical risk. Maritime conflicts relate to Taiwan and are also market-relevant. Europe, Russia, And Oil Risks Europe has proved a geopolitical opportunity rather than a risk, as we have contended. The passage of joint debt issuance in keeping with the seven-year budget reinforces the point. The Dutch, facing an election early next year, held up the negotiations, but ultimately relented as expected. Emmanuel Macron, who convinced German Chancellor Angela Merkel to embrace this major compromise for European solidarity, is seeing his support bounce in opinion polls at home. He is being rewarded for taking a leadership position in favor of European integration as well as for overseeing a domestic economic rebound. His setback in local elections is overstated as a political risk given that the parties that benefited do not pose a risk to European integration, and will ally with him in 2022 against any populist or anti-establishment challenger. We still refrain from reinitiating our long EUR-USD trade, however, given the immediate risks from the US election cycle (Chart 9). We will reevaluate if Trump’s odds of victory fall further. A Biden victory is very favorable for the euro in our view. Chart 9EUR-USD Gets Boost From EU Solidarity
EUR-USD Gets Boost From EU Solidarity
EUR-USD Gets Boost From EU Solidarity
We are bullish on pound sterling because even a delay or otherwise sub-optimal outcome to trade talks is mostly priced in at current levels (Charts 10A and 10B). Prime Minister Boris Johnson has the raw ability to walk away without a deal, in the context of strong domestic stimulus, but the long-term economic consequences could condemn him to a single term in office. Compromise is better and in both parties’ interests. Chart 10APound Sterling A Buy Over Long Run
Pound Sterling A Buy Over Long Run
Pound Sterling A Buy Over Long Run
Chart 10BPound Sterling A Buy Over Long Run
Pound Sterling A Buy Over Long Run
Pound Sterling A Buy Over Long Run
Two other risks are worth a mention in this month’s GeoRisk Update: Chart 11Russia: GeoRisk Indicator Russian Bonds May Face Sanctions
Russia: GeoRisk Indicator Russian Bonds May Face Sanctions
Russia: GeoRisk Indicator Russian Bonds May Face Sanctions
Russia: In recent reports we have maintained that Russian geopolitical risk is understated by markets. Domestic unrest is rising, the Trump administration could impose penalties over Nordstream 2 or other issues to head off criticism on the campaign trail, and a Biden administration would be outright confrontational toward Putin’s regime. Moscow may intervene in the US elections or conduct larger cyber attacks. US sanctions could ultimately target trading of local currency Russian government bonds, which so far have been spared (Chart 11). Iran: The jury is still out on whether the recent series of mysterious explosions affecting critical infrastructure in Iran are evidence of a clandestine campaign of sabotage (Table 3). The nature of the incidents leaves some room for accident and coincidence.1 But the inclusion of military and nuclear sites in the list leads us to believe that some degree of “wag the dog” is going on. The prime suspect would be Israel and/or the United States during the window of opportunity afforded by the Trump administration, which looks to be closing over the next six months. Trump likely has a high tolerance for conflict with Iran ahead of the election. Even though Americans are war-weary, they will rally to the president’s defense if Iran is seen as the instigator, as opinion polls showed they did in September 2019 and January of this year. Iran is avoiding goading Trump so far but if it suffers too great of damage from sabotage then it may be forced to react. The dynamic is unstable and hence an oil price spike cannot be ruled out. Table 3Wag The Dog Scenario Playing Out In Iran
A Tech Bubble Amid A Tech War (GeoRisk Update)
A Tech Bubble Amid A Tech War (GeoRisk Update)
Chart 12Oil Supply Risks Stem From Iran/Iraq, But COVID Threat To Demand Persists
Oil Supply Risks Stem From Iran/Iraq, But COVID Threat To Demand Persists
Oil Supply Risks Stem From Iran/Iraq, But COVID Threat To Demand Persists
Oil markets have the capacity and the large inventories necessary to absorb supply disruptions caused by a single Iranian incident (Chart 12). Only a chain reaction or major conflict would add to upward pressure. This would also require global demand to stay firm. The threat from COVID-19 suggests that volatility is the only thing one can count on in the near-term. Over the long run we remain bullish crude oil due to the unfettered commitment by world governments to reflation. Bottom Line: The euro rally is fundamentally supported but faces exogenous risks in the short run. We would steer clear of Russian currency and local currency bonds over the US election campaign and aftermath, particularly if Trump’s polling upturn becomes a dead cat bounce. Iran is a “gray swan” geopolitical risk, hiding in plain sight, but its impact on oil markets will be limited unless a major war occurs. Investment Implications The US dollar is at a critical juncture. Our Foreign Exchange Strategist Chester Ntonifor argues that if the DXY index breaks beneath the 93-94 then the greenback has entered a structural bear market. The most recent close was 93.45 and it has hovered below 94 since Monday. Failure to pass US stimulus quickly could result in a dollar bounce along with other safe havens. Over the short run, investors should be prepared for this and other negative surprises relating to the US election and significant geopolitical risks, especially involving China, the tech war, and the Taiwan Strait. Over the long run, investors should position for more fiscal support to combine with ultra-easy monetary policy for as far as the eye can see. The Federal Reserve is not even “thinking about thinking about raising rates.” This combination ultimately entails rising commodity prices, a weakening dollar, and international equity outperformance relative to both US equities and government bonds. Matt Gertken Vice President Geopolitical Strategy mattg@bcaresearch.com Footnotes 1 See Raz Zimmt, "When it comes to Iran, not everything that goes boom in the night is sabotage," Atlantic Council, July 30, 2020. Section II: Appendix : GeoRisk Indicator China
China: GeoRisk Indicator
China: GeoRisk Indicator
Russia
Russia: GeoRisk Indicator
Russia: GeoRisk Indicator
UK
UK: GeoRisk Indicator
UK: GeoRisk Indicator
Germany
Germany: GeoRisk Indicator
Germany: GeoRisk Indicator
France
France: GeoRisk Indicator
France: GeoRisk Indicator
Italy
Italy: GeoRisk Indicator
Italy: GeoRisk Indicator
Canada
Canada: GeoRisk Indicator
Canada: GeoRisk Indicator
Spain
Spain: GeoRisk Indicator
Spain: GeoRisk Indicator
Taiwan
Taiwan: GeoRisk Indicator
Taiwan: GeoRisk Indicator
Korea
Korea: GeoRisk Indicator
Korea: GeoRisk Indicator
Turkey
Turkey: GeoRisk Indicator
Turkey: GeoRisk Indicator
Brazil
Brazil: GeoRisk Indicator
Brazil: GeoRisk Indicator
Section III: Geopolitical Calendar
Highlights The decade-long US equity market outperformance versus the rest of the world could be nearing its end. We are upgrading EM stocks from underweight to neutral within a global equity portfolio. We reiterate the change in our US dollar outlook from bullish to bearish. The concentration risk in EM (specifically in North Asia) mega-cap stocks, poor fundamentals in EM outside North Asia, and a potential flare-up in US-China tensions are the reasons why we are reluctant to be overweight EM stocks. Feature We recommended the short EM equities / long S&P 500 position in late 2010,1 and have reiterated this strategy consistently over the past decade. Since its inception, this trade has produced a 193% gain with extremely low volatility (Chart 1). We recommend taking profits on this position for the reasons elaborated in this report. Chart 1Book Profits On Our Short EM Stocks / Long S&P 500 Strategy
Book Profits On Our Short EM Stocks / Long S&P 500 Strategy
Book Profits On Our Short EM Stocks / Long S&P 500 Strategy
Chart 2Equity Strategy Of the Decade: The Risk-Reward Is No Longer Attractive
Equity Strategy Of the Decade: The Risk-Reward Is No Longer Attractive
Equity Strategy Of the Decade: The Risk-Reward Is No Longer Attractive
Consistently, we are upgrading EM stocks from underweight to neutral within a global equity portfolio. Our decade-long equity sector theme – introduced in our June 8, 2010 report2 – has been to underweight resources and overweight technology and healthcare (Chart 2). This sector strategy has been one of the reasons for underweighting EM and favoring the US market in a global equity portfolio over the past decade. Going forward, the risk-reward of this sector strategy is no longer attractive. Regarding EM absolute performance, we recommend that absolute-return investors remain on standby for a correction before going long the EM equity benchmark. The End Of US Equity Outperformance The decade-long US equity market outperformance versus the rest of the world could be nearing its end.It is widely known that this decade’s US equity outperformance was largely due to FAANGM stocks (Facebook, Amazon, Apple, Netflix, Google and Microsoft). The FAANGM rally meets many of the criteria for a bubble, as we elaborated in our July 16 report. Our FAANGM equity index – an equal-weighted average of the six stocks – has increased almost 20-fold in real (inflation-adjusted) terms since January 2010 (Chart 3). Chart 3Each Decade = One Mania
Take Profits On The Short EM / Long S&P 500 Position
Take Profits On The Short EM / Long S&P 500 Position
Its rise is on par with the magnitude of the bull market in the Nasdaq 100 index through the 1990s, or of Walt Disney. through the 1960s, and it well exceeds other bubbles, as illustrated on Chart 3. All price indexes are shown in real (inflation-adjusted) terms. FAANGM stocks have greatly benefited from the recent “work from home” and other societal shifts and have been outperforming through the March financial carnage. It has made them unassailable in the eyes of investors. Yet, even great companies have a fair price, and considerable price overshoots will not be sustainable in the long term. We sense that a growing number of investors deem the US FAANGM and EM mega-cap stocks to be invincible. When some stocks are regarded as unbeatable, their top is not far. Therefore, it is highly unlikely that the FAANGM will outperform in the next selloff. Rather, the odds are that they will underperform because these stocks are extremely expensive, overbought, over-hyped and over-owned. The decade-long US equity market outperformance versus the rest of the world could be nearing its end. Apart from technology and FAANGM, US equities are facing a mediocre profit outlook. As long as the pandemic is not contained, America’s consumer and business confidence will remain lackluster, and, as a result, a recovery in their spending will be subdued. Chart 4US Stocks Are Not Cheap After Removing Market-Cap Bias
US Stocks Are Not Cheap After Removing Market-Cap Bias
US Stocks Are Not Cheap After Removing Market-Cap Bias
Notably, the broad US equity market is also expensive. The equal-weighted US equity index is trading at a 12-month forward P/E ratio of 21 (Chart 4, top panel). The risks associated with domestic politics are rising in the US. Social, political and economic divisions have been magnified by both the pandemic and the economic downtrend. Social and political tensions will likely flare up around the November elections. Our colleagues from the Geopolitical team argue that a contested election is possible and could lead to a crisis of presidential legitimacy in the US. Finally, the US equity market cap has reached 58% of the global market cap, the highest on record. Gravity forces are likely to kick in sooner than later, capping US equity outperformance. Bottom Line: The tailwinds supporting the US equity outperformance are fading. We are booking gains on the short EM stocks / long S&P 500 strategy. Consistently, we are also closing the short EM banks / long US banks and short Chinese banks / long US banks positions. They have produced a 75% gain and an 11% loss, respectively. Downgrading The US Dollar Outlook = Upgrading The EM View We had been bullish on the US dollar and bearish on EM currencies since early 2011 (Chart 5, top panel), but on July 9 made a major change in our currency strategy: we switched our shorts in EM currencies away from the US dollar to against an equal-weighted basket of the euro, Swiss franc and the yen. Since then, the EM ex-China equal-weighted currency index has rebounded versus the US dollar, but has depreciated against the basket of the euro, CHF and JPY (Chart 5, bottom panel). Chart 5EM Currencies Have Bottomed Versus The US Dollar But Not Against Other Safe-Heavens
EM Currencies Have Bottomed Versus The US Dollar But Not Against Other Safe-Heavens
EM Currencies Have Bottomed Versus The US Dollar But Not Against Other Safe-Heavens
While the US dollar could rebound in the short term, especially versus EM currencies, any rebound will likely prove to be short-lived. From now on, the strategy for the greenback should be selling into strength. Here is why: As US inflation rises in the coming years and the Fed refuses to raise interest rates, US real rates will drop further and, as a result, the US dollar will depreciate. A central bank that is behind the inflation curve is bearish for a nation’s currency. The main reason for turning negative on the US dollar structurally is the rising determination by the Federal Reserve to stay behind the inflation curve in the years to come. This strategy will instigate an inflation outbreak. Falling real interest rates have caused a plunge in the US dollar, as well as a surge in precious metal prices, in recent weeks. In fact, risk-on currencies have lately underperformed safe-haven currencies, such as the CHF and JPY (Chart 6). This market move confirms that the dollar’s recent plunge is due to fears of its debasement, not to robust growth in the world economy and in EM/China. As US inflation rises in the coming years and the Fed refuses to raise interest rates, US real rates will drop further and, as a result, the US dollar will depreciate. Colossal debt monetization. The Fed is undertaking an immense monetization of public and private debt. The current situation, involving the Fed’s purchases of securities, is different from the one following the Lehman crisis. Back in 2008-2014, the Fed’s QE program did not produce an exponential rise in money supply. The US broad money supply (M2) was rising at a single-digit rate between 2009 and 2014 (Chart 7). Presently, US M2 growth has exploded to 24% from a year ago. Chart 6Risk-On Currencies Are Underperforming Safe-Heaven Ones
Risk-On Currencies Are Underperforming Safe-Heaven Ones
Risk-On Currencies Are Underperforming Safe-Heaven Ones
Chart 7Helicopter' Money in the US
Helicopter' Money in the US
Helicopter' Money in the US
The pace of US broad money growth is much higher than that of many advanced and developing economies. Chart 8 shows new money creation as a share of GDP across various economies. It demonstrates that Japan and the US are now experiencing the quickest rate of new money creation in the world. In short, even though debt monetization is occurring in many advanced and EM economies, the US is doing it on an unprecedented scale. Chart 8Money Creation As % Of GDP In 2Q2020
Take Profits On The Short EM / Long S&P 500 Position
Take Profits On The Short EM / Long S&P 500 Position
“Helicopter” money will eventually lift inflation. The latest surge in the US money supply has only partially offset the collapse in its velocity. Consequently, America’s nominal GDP has plunged. This stems from the following identity: Nominal GDP = Price Level x Output Volume = Velocity of Money x Money Supply Solving the above equation for inflation, we get: Price Level = (Velocity of Money x Money Supply) / (Output Volume) Going forward, the velocity of US money will likely recover, for it is closely associated with consumers’ and businesses’ willingness to spend. At that point, rising velocity of money and greater money supply will work together to exert upward pressure on nominal GDP. Meantime, the pandemic will probably reduce potential output. The outcome of higher nominal spending and reduced potential productive capacity will be higher inflation. In sum, US inflation will rise well above 2% in the coming years. Yet, the Fed will stay put amid rising inflation. The upshot will be a structural downtrend in the US dollar. Whilst there are many arguments against rising inflation, we are leaning toward the view that US inflation will begin rising as of next year. We will elaborate on this inflation outlook in our future reports. Rising political and social uncertainty in the US will weigh on the greenback. The failure by the US authorities to contain the spread of the pandemic will continue fueling political and social upheavals. This could culminate in a harshly contested presidential election and a reduction in the US dollar’s allure for foreign investors. Portfolio inflows into the US will turn into outflows. The stellar performance of US equities attracted portfolio inflows into the US over the last 10 years. These capital inflows, in turn, boosted the greenback. But these dynamics are about to be reversed. Chart 9The US's Net International Investment Position Is At A Record Low
The US's Net International Investment Position Is At A Record Low
The US's Net International Investment Position Is At A Record Low
The top panel of Chart 9 shows that the US’s net international investment position in equities is at its lowest point since 1986. This means that foreign ownership of US stocks exceeds US resident ownership of foreign equities by a record amount. This reflects the fact that investors have by a large margin favored the US versus other bourses. As American share prices outperformed their international peers, both domestic and foreign investors have poured more capital into US equities. As the US relative equity performance reverses, equity capital will flow out of the US, thus dragging down the US dollar. Chart 10 shows that the trade-weighted dollar tracks the relative performance of the S&P500 versus the global equity benchmark in local currency terms. Regarding debt securities, the US’s net international investment position has widened to - US$8.5 trillion (Chart 9, bottom panel). Not all fixed-income investors hedge currency risk. As the dollar slides, there will be growing pressure on foreign fixed-income investors to hedge their dollar exposure or sell US and buy non-US debt securities. Chart 10A Top In The US$ = The End Of The US Equity Outperformance?
A Top In The US$ = The End Of The US Equity Outperformance?
A Top In The US$ = The End Of The US Equity Outperformance?
Bottom Line: Immense public debt monetization leading to higher inflation down the road and the Fed falling behind the curve, will produce a lasting and considerable downtrend in the US dollar in the coming years. Why Not Overweight EM Stocks? There are a number of reasons why – for now – we are only upgrading EM equities to neutral, rather than to overweight within a global equity portfolio, and why we are still reluctant to recommend buying EM stocks for absolute-return investors: Concentration risk in EM mega-cap stocks. As US FAANGM share prices come under selling pressure, contagion will spill over to EM mega-cap stocks. The latter have been responsible for a large share of gains in the EM equity index and, conversely, their pullback will considerably impact the EM benchmark’s performance. The top six companies combined account for about 24% of the MSCI EM equity market cap. To compare, US FAANGM (Facebook, Apple, Amazon, Netflix, Google and Microsoft) also account for 24% of the S&P 500 market cap. Hence, the concentration risk in EM equity space is as high as in the US. Geopolitical risk. A potential flare up in in geopolitical tensions will weigh on Chinese, South Korean and Taiwanese stocks. Given that they make up about 65% of the MSCI EM index equity market cap, the EM benchmark will suffer in absolute terms and be unlikely to outperform the global equity index. Faced with decreased approval in regard to his handling of the pandemic, and to a lesser extent, the economy and other social issues, President Trump could well resort to geopolitics to “rally Americans behind the flag.” He may, for example, ramp up tensions with China in an attempt to make geopolitics and China the focal points of the forthcoming presidential election. China will certainly retaliate. The South China Sea, Taiwan, technology transfers, treatment of multinational companies in both China and the US, as well as North Korea, could be focal points of a confrontation. This will weigh on business confidence in Asia and on capital spending. In our opinion, markets are vulnerable to such geopolitical risks. Poor domestic fundamentals in EM outside China, Korea and Taiwan. Fundamental backdrops remain inferior in many EM economies outside the North Asian ones. The number of new infections continues to rise in India, Indonesia, The Philippines, Brazil, Mexico, Colombia and Peru. Many EM economies will only slowly return to normalcy. In certain countries, banking systems were already in poor health, and things have gotten much worse after the crash in economic activity. As to the positives for EM, they are as follows: Rising Chinese demand will boost EM exports to China and help revive their growth. EM equity valuations are very appealing versus the S&P 500 (Chart 11). The bottom panel of Chart 11 shows that EM’s cyclically-adjusted P/E ratio relative to that in the US is over one standard deviation below its mean. Based on the 12-month forward P/E ratio for an equal-weighted index, EM stocks are cheaper than US ones (please refer to Chart 4 on page 4). EM currencies are also cheap (Chart 12). While they might experience a short-term setback, as a global risk-off phase takes place, EM exchange rates have probably seen their lows versus the US dollar. Chart 11EM Stocks Offer Value Versus The S&P 500
EM Stocks Offer Value Versus The S&P 500
EM Stocks Offer Value Versus The S&P 500
Chart 12EM Currencies Are Cheap
EM Currencies Are Cheap
EM Currencies Are Cheap
The US dollar’s weakness will mitigate risks for EM issuers of US dollar bonds and, thereby, induce more flows into EM sovereign and corporate credit markets. In short, EM local currency bonds will assuredly benefit from the US dollar’s slide. We have been neutral on both EM local currency bonds and EM sovereign and corporate credit, and are waiting for a correction before upgrading to overweight. In nutshell, little or no stress in EM fixed-income markets bodes well for EM share prices. Bottom Line: Risks to EM equity relative performance are presently balanced. A neutral allocation is warranted for now. EM relative equity performance versus DM is only slightly above its recent low (Chart 13, top panel). It is, therefore, a good juncture to move the EM equity allocation from underweight to neutral. In addition, both the EM equal-weighted and small-cap equity indexes are not yet signaling a broad-based and sustainable outperformance (Chart 13, middle and bottom panels). Chart 13EM Relative Equity Performance Is In A Bottom-Out Phase
EM Relative Equity Performance Is In A Bottom-Out Phase
EM Relative Equity Performance Is In A Bottom-Out Phase
Some FAQs Question: Wouldn’t the US dollar rally if global stocks sell off? The greenback will likely attempt to rebound from current oversold levels when and as a global risk-off phase sets in. EM high-beta currencies could experience a non-trivial setback but will remain above their March lows. Yet, any rebound in the US dollar versus European currencies and the Japanese yen will be fleeting and moderate. On July 9, in anticipation of US dollar weakness, we booked profits on the short EM currencies/long US dollar strategy and recommended shorting several EM currencies versus an equal-weighted basket of the euro, CHF and JPY. This strategy remains intact for now. Our short list of EM currencies includes: BRL, CLP, ZAR, TRY, IDR, PHP and KRW. Odds are that EM stocks will likely be broadly flattish relative to those in DM amid the next sell off. Chart 14EM Stocks Have Been Low Beta
EM Stocks Have Been Low Beta
EM Stocks Have Been Low Beta
Question: Aren’t EM stocks high-beta and won’t they underperform if, and as, global stocks sell off? The EM equity index has had a beta lower than one since 2013 (Chart 14). Odds are that EM stocks will likely be broadly flattish relative to those in DM amid the next sell off. Within the DM equity space, the US will likely underperform both Europe and Japan in common currency terms. Question: Which equity markets do you favor within the EM space? Our current overweights are China, Thailand, Russia, Peru, Pakistan and Mexico. Our underweights are Indonesia, India, Hong Kong, the Philippines, Turkey, South Africa, Chile and Brazil. Question: Which currencies and local currency bond markets do you recommend overweighting for dedicated EM managers? We recommended going long the Czech koruna versus the US dollar last week. Other currencies that we favor within the EM space are SGD, TWD, THB, MXN and RUB. As for local currency bonds or swap rates, our top picks are Mexico, Russia, Korea, India, China, Malaysia, Thailand, Peru, Ukraine and Pakistan. As always, the list of country recommendations for equities, fixed-income and currencies is available at the end of our reports (please refer to pages 14-15) or on the website. Arthur Budaghyan Chief Emerging Markets Strategist arthurb@bcaresearch.com Footnotes 1Please see Emerging Markets Strategy Weekly Reports "Inflation, Overheating And The Stampede Into Bonds," dated November 30, 2010, and "Emerging Markets In 2011: Not The Best Play In Town," dated December 14, 2010. 2Please see Emerging Markets Strategy Special Report "How To Play Emerging Market Growth In The Coming Decade," dated June 8, 2010 Equities Recommendations Currencies, Credit And Fixed-Income Recommendations
At the press conference following the FOMC decision, Fed Chair Powell reinforced the extremely dovish forward guidance of the Fed by asserting once again that the committee “is not thinking about thinking about raising rates”. He also highlighted that…
Highlights The Fed’s emergency lending facilities have successfully stabilized markets … : Credit spreads have tightened dramatically since March and liquidity has been restored to the US Treasury market. … at very little cost to the central bank: Just the announcement of Fed lending facilities has been enough to push spreads lower in most cases. The facilities themselves have seen very little actual uptake. The only cost borne by the Fed has been a dramatic expansion of its balance sheet due to purchases of Treasury securities. We still want to “buy what the Fed is buying”: In US fixed income, we want to favor those sectors that are eligible for Fed support. This includes corporate bonds rated Ba and higher, municipal bonds and Aaa-rated securitizations. Keep portfolio duration at neutral: The Fed will be much more cautious about raising interest rates than in the past, and could wait until inflation is above its target before lifting off zero. Feature Back in April, we published a detailed explainer of the extraordinary actions taken by the Federal Reserve to combat the pandemic-induced recession.1 This week, we re-visit that Special Report to assess what the Fed has accomplished during the past three months and to speculate about what lies ahead. Overall, the Fed’s response has been highly effective. Stability was restored to financial markets almost immediately after the most dramatic policy interventions were announced, and it turns out that the announcements themselves did most of the work. The ultimate usage of the Fed’s Section 13(3) emergency lending facilities has been extremely low relative to their stated maximum capacities (Table 1). If you are the Fed, it is apparently enough to marshal overwhelming force and announce your willingness to deploy it. Like the ECB demonstrated in the fraught Eurozone summer of 2012, a bazooka can restore order without being fired.2 Table 1Usage Of The 2020 Federal Reserve Emergency Lending Facilities
Alphabet Soup, Part 2: Shocked And Awed
Alphabet Soup, Part 2: Shocked And Awed
The only possible cost borne by the Fed has been an explosion in the size of its balance sheet, mostly attributable to purchases of Treasury securities. The ultimate usage of the Fed’s facilities has been extremely low relative to their stated maximum capacities. This report looks at how the Fed’s actions have influenced (and will influence) interest rates, Treasury market liquidity, the corporate bond market and other fixed income spread products. It also considers the potential impact of the size of the Fed’s balance sheet on the economy and financial markets. Interest Rates The Fed dropped the funds rate to a range of 0% to 0.25% on March 15, and since then it has aggressively signaled that rates will stay pinned at the zero-lower-bound for a long time. Investors quickly took this message on board (Chart 1). The median estimate from the New York Fed’s Survey of Market Participants has the funds rate holding steady at least through the end of 2022. Meanwhile, the overnight index swap curve isn’t pricing-in a rate hike until 2024. Chart 1The Fed And Market Agree: No Hikes Through 2022
The Fed And Market Agree: No Hikes Through 2022
The Fed And Market Agree: No Hikes Through 2022
Chart 2Better Signaling From The Fed
Better Signaling From The Fed
Better Signaling From The Fed
The market adjusted much more quickly to the Fed’s zero interest rate policy this year than it did during the last zero-lower-bound episode (Chart 2). The MOVE index of Treasury yield volatility has already plunged to below 50. It took several years for it to reach those levels after the Fed cut rates to zero at the end of 2008. Similarly, the yield curve is much flatter today than it was during the last zero-lower-bound episode. This partly reflects the market’s expectation that rates will stay at zero for longer and partly the downward revisions to estimates of the long-run neutral fed funds rate that have occurred during the past few years. The bottom line is that the Fed has successfully achieved its goal on interest rate policy. The funds rate is at its effective lower bound and the entire term structure is priced for it to stay there for a very long time. There are two main reasons for this success. First, the Fed’s forward guidance has been more dovish this year than at any point during the last zero-lower-bound episode, with many FOMC participants calling for the Fed to target a temporary overshoot of the 2% inflation target. Second, the market is more skeptical about inflation ever returning to that target, as evidenced by much lower long-dated inflation expectations (Chart 2, bottom panel). What’s Next? The Fed has already made it clear that it won’t pursue negative interest rates. With those off the table, the next step will be for the Fed to make its forward rate guidance more explicit. In all likelihood this will involve the return of some form of the Evans Rule that was in place between 2012 and 2014. The Evans Rule was a commitment to not lift rates at least until the unemployment rate moved below 6.5% or inflation moved above 2.5%.3 The new version of the Evans Rule will be much more dovish. In a recent speech, Governor Lael Brainard favorably cited research suggesting that the Fed should refrain from liftoff until inflation reaches the 2% target.4 That may very well be the rule that ends up becoming official Fed guidance. If the Fed wants to strengthen its commitment to low rates even more, it could follow the Reserve Bank of Australia’s lead and implement a Yield Curve Control policy. This policy would involve setting caps for Treasury yields out to a 2-year or 3-year maturity. The Fed would pledge to buy as many securities as necessary to enforce the caps and would only lift the caps when the criteria of its new Evans Rule are met. While spreads have tightened across all credit tiers, investment grade corporates have become much more expensive than high-yield. For the time being, there is no rush for the Fed to deliver more explicit forward guidance and/or Yield Curve Control. As we noted above, bond yields are already pricing-in an extremely lengthy period of zero rates. But these policies will become more important as the economic recovery progresses and market participants start to speculate about an eventual exit from the zero bound. Explicit forward guidance and/or Yield Curve Control would then prevent a premature rise in bond yields and tightening of financial conditions. With all that in mind, we would not be surprised to see more explicit (Evans Rule-style) forward guidance rolled out at some point this year, but unless bonds sell off significantly beforehand, it probably won’t have an immediate impact on yields. The same is true for Yield Curve Control, though the odds of that being announced this year are lower as it is a tool with which the Fed is less comfortable. Treasury Market Liquidity Chart 3When Treasury Market Liquidity Evaporated
When Treasury Market Liquidity Evaporated
When Treasury Market Liquidity Evaporated
As the COVID-19 crisis flared in March, there were several tense days when liquidity in the US Treasury market evaporated. Bond yields jumped even as the equity market plunged (Chart 3). Meanwhile, liquidity markers showed that it had become much more difficult to transact in US Treasuries. Treasury Bid/Ask spreads widened dramatically and the iShares 20+ Year Treasury ETF (TLT) traded at a huge discount to its net asset value (Chart 3, panel 3). During the past four months, researchers have identified hedge fund selling of Treasuries to meet margin calls and foreign bank selling of Treasuries to meet demands for US dollar funding as the proximate causes of March’s Treasury rout. However, it is clearly a failure of market structure that the Treasury market was unable to accommodate that selling pressure without liquidity disappearing. In a recent paper from The Brookings Institution, Darrell Duffie explains why the Treasury market was unable to maintain its liquidity during this tumultuous period.5 Essentially, he argues that it is the combination of rising Treasury supply and post-2008 regulations imposed on dealer banks that has led to an environment where there is a large and growing amount of Treasury supply, but where dealers have less balance sheet capacity to intermediate trading. To illustrate, Chart 4 shows the ratio between the outstanding supply of Treasury securities and the quantity of Treasury inventories for which primary dealers obtained financing. Quite obviously, the dealers’ intermediation activities have not kept pace with the expanding size of the market. Chart 4Primary Dealers Have Not Kept Up With Treasury Issuance
Primary Dealers Have Not Kept Up With Treasury Issuance
Primary Dealers Have Not Kept Up With Treasury Issuance
What’s Next? Without changes to Treasury market structure or bank capital requirements (Duffie recommends abandoning the system of competing dealer banks altogether and moving all Treasury trades through one central clearinghouse), we are likely to see more episodes like March where a spate of Treasury selling leads to an evaporation of market liquidity. When that happens, the Fed will be forced to step in and buy Treasuries, as it did in March (Chart 3, bottom panel). The goal of that intervention is simply to remove enough supply from the market so that the remaining trading volume can be handled by the dealers. As this pattern repeats itself over time, it will cause the Fed’s presence in the Treasury market to grow. Bottom Line: Unless structural changes are made to the Treasury market or bank capital regulations are rolled back, we should expect more episodes of Treasury market illiquidity like we saw in March. We should also expect the Fed to respond to those episodes with aggressive Treasury purchases, and for the Fed’s presence in the Treasury market to grow over time. Corporate Bonds The Fed’s intervention in the corporate bond market consists of three lending facilities: The Secondary Market Corporate Credit Facility (SMCCF) where the Fed purchases investment grade corporate bonds and recent Ba-rated fallen angels in the secondary market. This facility also purchases investment grade and high-yield ETFs. The Primary Market Corporate Credit Facility (PMCCF) where the Fed buys new issuance from investment grade-rated issuers (and recent fallen angels) in the primary market. The Main Street Lending Facility (MSLF) where the Fed purchases loans off of bank balance sheets. The loans must be made to small or medium-sized firms with Debt-to-EBITDA ratios below 6.0. Chart 5Corporate Issuance Surged Following The Fed's Announcements
Corporate Issuance Surged Following The Fed's Announcements
Corporate Issuance Surged Following The Fed's Announcements
As mentioned above, these facilities have barely been tapped. As of July 1, the Fed had purchased $1.5 billion of corporate bonds and just under $8 billion of ETFs through the SMCCF, while the PMCCF had not been used at all. However, the impact of the Fed’s promise to back-stop such a large portion of the corporate debt market has been immense. Corporate bond issuance surged following the announcement of the Fed’s facilities, and set monthly post-2008 records in March, April and May (Chart 5). The effect on corporate bond spreads has been just as dramatic. Spreads peaked on March 23, the day that the SMCCF and PMCCF were announced, and have tightened significantly since then. Further underscoring the importance of the SMCCF, PMCCF and MSLF announcements is that those segments of the corporate bond market most likely to have access to the Fed’s lending facilities have seen the most spread compression. Recall that investment grade issuers and recent fallen angels have access to the SMCCF and PMCCF, while the MSLF will benefit most issuers rated Ba or higher. Some B-rated issuers are able to tap the MSLF, but not the majority. Issuers rated Caa or below are much less likely to benefit from any of the Fed’s programs. Table 2 shows how the impact of the Fed’s facilities has played out across the different corporate credit tiers. It shows each credit tier’s option-adjusted spread and 12-month breakeven spread as of March 23 and today. It also shows the percentile rank of those spreads since 2010 (100% indicating the widest spread since 2010 and 0% indicating the tightest). While spreads have tightened across all credit tiers, investment grade corporates have become much more expensive than high-yield. The B-rated and below credit tiers are particularly cheap, with 12-month breakeven spreads all above their 80th percentiles since 2010. Table 2The Fed's Impact On Corporate Spreads
Alphabet Soup, Part 2: Shocked And Awed
Alphabet Soup, Part 2: Shocked And Awed
Chart 6Spread Curve Back To Normal
Spread Curve Back To Normal
Spread Curve Back To Normal
The market impact of the Fed’s corporate lending facilities is also apparent across the corporate bond term structure. In March, the investment grade corporate bond spread slope inverted, as 1-5 year maturity corporate bond spreads widened relative to spreads of securities with more than 5 years to maturity (Chart 6).6 The Fed concentrated its lending facilities on securities with less than 5 years to maturity, and it has successfully re-steepened the corporate spread curve. But the Fed’s corporate lending facilities are not all powerful. As Chair Powell likes to say: “the Fed has lending powers, not spending powers”. So while the promise of Fed lending is a big help, it still means that troubled firms will have to increase their debt loads to survive the economic downturn. Those firms that take on debt may still see their credit ratings downgraded as their balance sheet health deteriorates. Indeed, this is exactly what has happened. Ratings downgrades have jumped during the past few months, as have defaults (Chart 7). There has also been a spike in the number of fallen angels – firms downgraded out of investment grade – but not as big a jump as was seen during the last recession (Chart 7, panel 2). The Fed’s emergency lending facilities have likely prevented some downgrades, but not all. Chart 7Fed Can't Prevent Downgrades
Fed Can't Prevent Downgrades
Fed Can't Prevent Downgrades
What’s Next? The Fed’s lending facilities are responsible for a huge portion of the spread compression we’ve seen since late March. That said, it is a potential problem for corporate bonds that those facilities are scheduled to expire at the end of September. Our sense is that the expiry date will be extended, and that the facilities will only be wound down after a significant period of time where they see zero usage. At that point, the Fed should be able to halt the facilities without unduly impacting markets. In terms of investment implications, we think that the Fed’s back-stop will continue to be the most important driver of corporate bond spreads during the next few months. This means we would avoid chasing the attractive valuations in bonds rated B & below, and would continue to focus our corporate bond exposure on bonds rated Ba and above. We make an exception to our “buy what the Fed is buying” rule when it comes to positioning across the corporate bond term structure. Here, we are inclined to grab the extra spread offered by longer-maturity securities even though Fed secondary market purchases are concentrated at the front-end. Our rationale is that the Fed’s secondary market purchases are already low and will likely decline as time goes on. Meanwhile, if firms with long-maturity debt outstanding need help they can still access the PMCCF if needed. Other Fed Lending Facilities & Fixed Income Sectors Outside of the three programs geared toward the corporate bond market, the Fed also rolled out emergency lending facilities meant to back-stop: money market mutual funds (MMLF), the commercial paper market (CPFF), the asset-backed securities market (TALF), the municipal bond market (MLF) and the federal government’s new Paycheck Protection Program (PPPLF). Once again, the announcement effect did most of the work for all of these facilities and the Fed managed to quickly restore stability to each targeted market without doing much actual lending. For starters, the MMLF successfully halted a flight out of prime money market funds with a relatively modest $53 billion in loans (Chart 8). The CPFF caused the commercial paper/T-bill spread to normalize with only $4 billion of lending, and the LIBOR/OIS spread also tightened soon after the Fed rolled out its facilities (Chart 8, bottom panel). The Fed has dramatically expanded the size of its balance sheet through purchases of Treasury securities and agency MBS. In the asset-backed securities market, the Fed decided that only Aaa-rated securitizations are eligible for TALF. With that in mind, Aaa-rated consumer ABS and CMBS spreads have tightened considerably since TALF’s announcement (Chart 9). Non-Aaa consumer ABS spreads have tightened modestly despite the lack of Fed support. This is because fiscal stimulus has, so far, kept households flush with cash and prevented a wave of consumer bankruptcies. Non-Aaa CMBS, on the other hand, have struggled due to lack of Fed support and a sharp increase in commercial real estate delinquencies. Chart 8Stability Restored
Stability Restored
Stability Restored
Chart 9Consumer ABS & CMBS Spreads Tightened Considerably...
Consumer ABS & CMBS Spreads Tightened Considerably...
Consumer ABS & CMBS Spreads Tightened Considerably...
The announcement of the MLF also successfully led to compression in municipal bond spreads (Chart 10), though the Aaa muni curve still trades cheap relative to Treasuries. Like the other facilities, the MLF has seen very low take-up. In this instance, low MLF usage results from its expensive pricing. Municipal governments can access loans through the MLF for a period of up to three years at a cost of 3-year OIS plus a fixed spread that varies depending on the municipality’s credit rating. However, current market pricing is well below the MLF rate for all credit tiers (Chart 10, bottom 2 panels). This means that the MLF provides a nice back-stop in case muni spreads widen again, but it is not currently an effective means of getting cash to struggling state & local governments. Chart 10...As Have Municipal Bond Spreads
...As Have Municipal Bond Spreads
...As Have Municipal Bond Spreads
Finally, the PPPLF is a facility that purchases loans made through the Paycheck Protection Program (PPP) off of bank balance sheets. Essentially, it is an insurance policy designed to make sure that banks have the necessary balance sheet capacity to deliver all of the PPP loans authorized by Congress. It has achieved this goal with relatively little usage. Banks have doled out more than $500 billon of PPP loans and the Fed has purchased only $68 billion. What’s Next? As with the corporate lending facilities discussed above, there is a risk surrounding the scheduled expiry of these other lending facilities at the end of September. Once again, we see the Fed being very cautious in this regard. All facilities will be extended until they have seen long periods of no usage. In the near-term, we think it’s possible that the Fed will make MLF loans cheaper. They will likely feel intense pressure to do so if Congress fails to pass sufficient stimulus to state & local governments in the next bailout package. In terms of investment strategy, we want to stick with what has worked so far. We are overweight Aaa consumer ABS and Aaa CMBS due to the TALF back-stop. We are also overweight municipal bonds, especially in the Aaa-rated space where yields are attractive versus Treasuries and the risk of default is low. We would also advise taking some extra risk in non-Aaa consumer ABS. These securities have no TALF back-stop, but we expect Congress to deliver enough government stimulus to keep the underlying borrowers solvent. The Size Of The Fed’s Balance Sheet As this report has made clear, the Fed’s emergency lending facilities have accomplished a lot during the past four months with the Fed taking very little actual risk onto its balance sheet. But while its usage of the emergency lending facilities has been low, the Fed has dramatically expanded the size of its balance sheet through purchases of Treasury securities and agency MBS. To restore stability to the Treasury and MBS markets, the Fed avidly bought Treasuries and agency MBS from mid-March to mid-April, ballooning the size of its balance sheet by $2 trillion in just five weeks. Tacked onto the QE programs undertaken to battle the GFC, the Fed’s balance sheet expansion has been massive, and it is roughly six times larger as a share of GDP than it was in the three decades preceding the subprime crisis (Chart 11). Chart 11Massive Expansion Of The Fed's Balance Sheet
chart 11
Massive Expansion Of The Fed's Balance Sheet
Massive Expansion Of The Fed's Balance Sheet
Investors and citizens may ask what that balance sheet expansion has achieved so far, and what it’s likely to achieve going forward. Are there unintended consequences that haven’t yet made their presence felt? What constitutes a normalized Fed balance sheet, and when will the Fed be able to get back to it? The immediate consequence many investors attribute to the balance sheet expansion is higher stock prices (Chart 12). Fans of the balance sheet/equities link are undeterred by the decoupling after 2015, arguing that standing pat/tapering the balance sheet by 15% helped precipitate its vicious sell-off in the fourth quarter of 2018. It probably has not escaped their notice that the spectacular bounce from March’s lows has occurred alongside a 70% balance sheet expansion. The money supply boost may prove short-lived, though, as it appears that businesses are borrowing to ensure their continued liquidity, rather than to spend or invest. We don’t think there is much to the observed relationship, however. Correlation is not causation and we have a hard time seeing how the Fed’s purchases of Treasuries, agencies and agency MBS flowed into the equity market. While the Fed’s pre-pandemic QE purchases turbo-charged the size of the monetary base, it only gently expanded the money supply, because the banks that sold securities to the Fed largely handed the proceeds right back to it as deposits (Chart 13). The net effect mainly filled the Fed’s vaults with the new money it had conjured up via its open-market operations. Chart 12Fed Balance Sheet & Stock Prices: Correlation Is Not Causation
Fed Balance Sheet & Stock Prices: Correlation Is Not Causation
Fed Balance Sheet & Stock Prices: Correlation Is Not Causation
Chart 13Only A Modest Expansion Of Money Supply
Only A Modest Expansion Of Money Supply
Only A Modest Expansion Of Money Supply
Banks were not the only counterparties to the Fed’s QE purchases, of course. Fixed income mutual funds, insurance companies and pension funds must also have trimmed their holdings to accommodate the Fed. They were likely obligated by prospectus mandates or regulatory oversight to redeploy the proceeds into other bonds. Surely some unconstrained investors turned QE cash into new equity investments, but the larger QE effect on financial markets was likely to narrow credit spreads as dedicated fixed income investors redeployed their proceeds further out the risk curve. Tighter spreads helped reduce corporations’ cost of servicing newly issued debt, boosting corporate profits at the margin, but we think it’s a stretch to say QE drove the equity rally. What’s Next? Chart 14Wave Of Bank Deposits
Wave Of Bank Deposits
Wave Of Bank Deposits
The picture is slightly different today, with the money supply popping amidst frenzied corporate borrowing. The money supply boost may prove short-lived, though, as it appears that businesses are borrowing to ensure their continued liquidity, rather than to spend or invest. The largest banks were inundated with deposits in the second quarter (Chart 14), possibly driven by corporations stashing their issuance proceeds in cash just as banks previously stashed their QE proceeds in excess reserves. With households actively paying down their debt and businesses having already pre-funded two or three years of cash needs, the deposits may not be lent out, hemming in the money multiplier and limiting the self-reinforcing magic of fractional-reserve banking. Liquidity that is being hoarded is not available to drive up equity multiples, so we don’t expect the Fed’s new balance sheet expansion will directly boost stock prices any more than we think it did post-crisis. Indirectly, we think it does contribute to economic growth and risk asset appreciation because we view QE and other extraordinary easing measures as a signal that zero interest rate policy will remain in place for a long time. The importance of that signal, and the possibility that nineteen months of tapering at the start of Jay Powell’s term as Fed chair did promote volatility and increased equities’ vulnerability to a sharp downdraft, may well keep the Fed from attempting to normalize the balance sheet any time soon. An outsized Fed balance sheet may well be the new normal, and it may well breed unintended consequences, but we don’t think that kiting stock prices will be one of them. Ryan Swift US Bond Strategist rswift@bcaresearch.com Doug Peta, CFA Chief US Investment Strategist dougp@bcaresearch.com Jennifer Lacombe Associate Editor JenniferL@bcaresearch.com Jeremie Peloso Senior Analyst jeremiep@bcaresearch.com Footnotes 1 Please see US Investment Strategy / US Bond Strategy Special Report, “Alphabet Soup: A Summary Of The Fed’s Anti-Virus Measures”, dated April 14, 2020, available at usis.bcaresearch.com and usbs.bcaresearch.com 2 The Outright Monetary Transactions facility at the heart of ECB President Mario Draghi’s “whatever it takes” pledge was never actually used. The ECB did eventually purchase government securities through a separate facility. But this didn’t occur until 2015, after sovereign bond yields had already fallen. 3 This explicit forward guidance was the brainchild of Chicago Fed President Charles Evans. It was official Fed forward guidance between December 2012 and March 2014. 4 https://www.federalreserve.gov/newsevents/speech/brainard20200714a.htm 5 https://www.brookings.edu/wp-content/uploads/2020/05/WP62_Duffie_v2.pdf 6 This inversion of the corporate spread curve is typical during default cycles. For more details on this dynamic please see US Bond Strategy Special Report, “On The Term Structure Of Credit Spreads”, dated July 10, 2013, available at usbs.bcaresearch.com
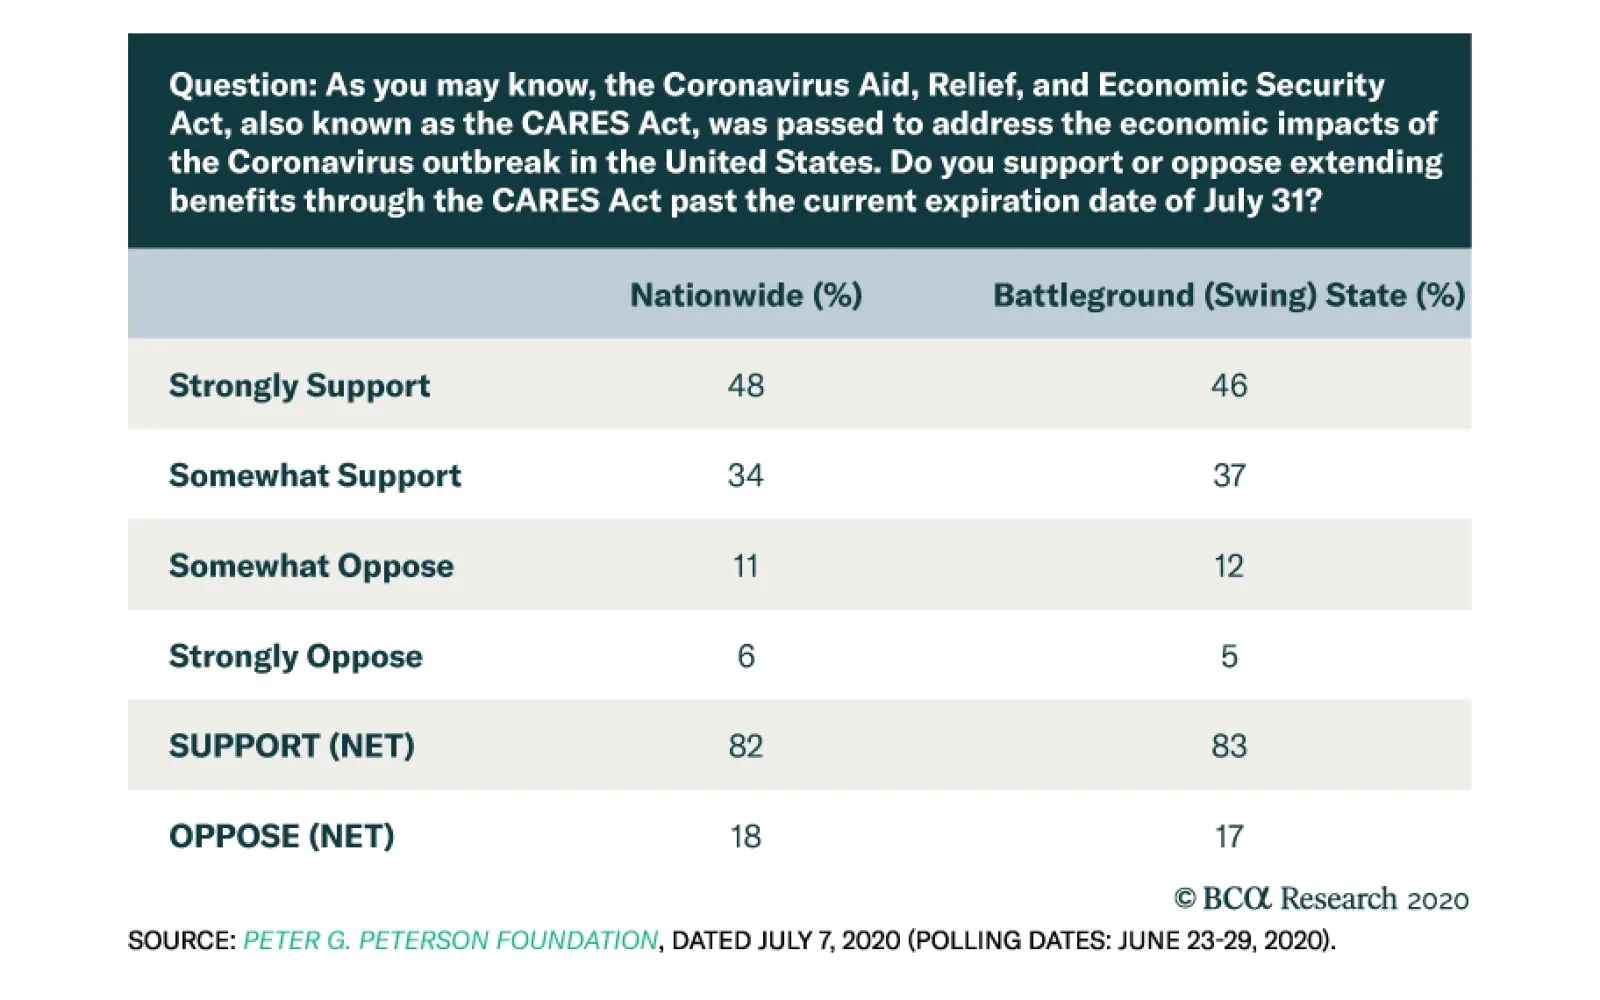
BCA Research's Global Investment Strategy service believes that the ample public support for fiscal stimulus will force the hand of Senate Republicans. Investors have to grapple with uncertainty over whether fiscal policy will remain sufficiently…
Highlights Equities and other risk assets face near-term headwinds from the surge in Covid cases in the US Sun Belt and the looming fiscal cliff. We think these problems will be resolved, but the next few weeks could be rough sledding for markets. Government bond yields have moved sideways-to-down since late March even though inflation expectations have rebounded. The resulting decline in real yields has been an important, if rather overlooked, driver of higher equity prices. The failure of government bond yields to rise in line with higher inflation expectations can be attributed to the ongoing dovish shift in monetary policy. Nominal yields are likely to increase modestly over the next two years as growth recovers. However, inflation expectations should rise even more. Hence, real yields may fall further, justifying an overweight position in TIPS and a generally positive medium-term view on equities. As long as there is spare capacity in the economy, fiscal stimulus will not push up real yields. This is because bigger budget deficits tend to raise overall savings, thus creating the resources with which to finance the deficits. Once economies return to full employment in about three years, the fiscal free lunch will end. At that point, the combination of easy monetary and fiscal policies could cause inflation to accelerate. Central banks will welcome higher inflation initially. However, they will eventually be forced to hike rates aggressively if inflation continues to march upwards. When this happens, bond yields will rise sharply, while stocks will tumble. A Curious Divergence Government bond yields have moved sideways-to-down in most developed economies since stocks bottomed in late March (Chart 1). In contrast, inflation expectations have risen. As a result, real yields have declined. In the US, TIPS yields have fallen into negative territory across all maturities (Chart 2). Chart 1Nominal Yields Have Moved Sideways-To-Down, Inflation Expectations Have Risen, And Real Yields Have Declined
Nominal Yields Have Moved Sideways-To-Down, Inflation Expectations Have Risen, And Real Yields Have Declined
Nominal Yields Have Moved Sideways-To-Down, Inflation Expectations Have Risen, And Real Yields Have Declined
Chart 2TIPS Yields Have Fallen Into Negative Territory Across The Board
TIPS Yields Have Fallen Into Negative Territory Across The Board
TIPS Yields Have Fallen Into Negative Territory Across The Board
The decline in real yields has been one of the unsung drivers of higher equity prices this year. The forward P/E ratios of the major US indices have moved closely in line with real yields (Chart 3). Gold prices have also risen, as they are often wont to do when real yields go down (Chart 4). Chart 3Lower Real Yields Have Lifted Stock Multiple
Lower Real Yields Have Lifted Stock Multiple
Lower Real Yields Have Lifted Stock Multiple
Chart 4Gold Prices Have Risen On The Back Of Falling Real Yields
Gold Prices Have Risen On The Back Of Falling Real Yields
Gold Prices Have Risen On The Back Of Falling Real Yields
It is fairly uncommon for inflation expectations to rise without a commensurate increase in nominal bond yields (Chart 5). As a rule of thumb, when the economic data surprise to the upside, as has occurred over the past few months, bond yields go up (Chart 6). Chart 5It Is Unusual For Inflation Expectations To Rise Without A Corresponding Increase In Nominal Bond Yields
It Is Unusual For Inflation Expectations To Rise Without A Corresponding Increase In Nominal Bond Yields
It Is Unusual For Inflation Expectations To Rise Without A Corresponding Increase In Nominal Bond Yields
Chart 6Bond Yields Usually Rise When Economic Data Surprise To The Upside
Bond Yields Usually Rise When Economic Data Surprise To The Upside
Bond Yields Usually Rise When Economic Data Surprise To The Upside
An important exception to this rule occurs when monetary policy is becoming more expansionary. Bond yields tend to follow the path of expected policy rates (Chart 7). When central banks guide rate expectations lower, bond yields can fall, even as the reflationary impulse from lower yields delivers an upward kick to inflation projections. Chart 7ABond Yields Tend To Follow The Path Of Expected Policy Rates
Bond Yields Tend To Follow The Path Of Expected Policy Rates
Bond Yields Tend To Follow The Path Of Expected Policy Rates
Chart 7BBond Yields Tend To Follow The Path Of Expected Policy Rates
Bond Yields Tend To Follow The Path Of Expected Policy Rates
Bond Yields Tend To Follow The Path Of Expected Policy Rates
The last time such a divergence between yields and inflation expectations occurred was in early 2019. The stock market crash in late 2018 forced the Fed to abandon its plans to hike rates. Jay Powell’s dovish pivot occurred just three months after he said that rates were “a long way” from neutral. The Fed would go on to cut rates by 75 bps over the course of 2019. Real Yields Could Fall Further Chart 8Inflation Expectations Are Still Quite Depressed In Most Countries
Will Bond Yields Ever Go Up?
Will Bond Yields Ever Go Up?
The key question for investors is how much longer the pattern of rising inflation expectations and stable bond yields can persist. Our sense is that nominal bond yields will rise modestly over the next few years as growth recovers. However, inflation expectations are likely to rise even more, justifying an overweight position in TIPS relative to nominal bonds. Inflation expectations are still quite depressed in most countries (Chart 8). If global growth rebounds, both actual and expected inflation should edge higher. Chart 9 shows that the US ISM manufacturing index leads core inflation by about 12-to-18 months. Higher oil prices should also lift inflation expectations (Chart 10). Will global growth recover? The answer is “yes” if we are talking about a horizon of 12 months or so. That said, as we discuss below, there are some near-term risks to growth. This implies that equities and other risk assets could trade nervously over the next few weeks. Chart 9Global Growth Recovery Will Lead To Higher Inflation Down The Line
Global Growth Recovery Will Lead To Higher Inflation Down The Line
Global Growth Recovery Will Lead To Higher Inflation Down The Line
Chart 10Inflation Expectations And Oil Prices Move In Lockstep
Inflation Expectations And Oil Prices Move In Lockstep
Inflation Expectations And Oil Prices Move In Lockstep
Near-Term Risks To Global Growth The two biggest threats to global growth over the coming months are the Covid outbreaks in a number of countries and the possibility that fiscal stimulus will be rolled back, especially in the US, where a “fiscal cliff” is looming. Despite progress in suppressing the virus in Europe, Japan, and most of East Asia, the number of reported daily infections continues to rise globally (Chart 11). In the developed world, the US remains a major hotspot. Although the number of cases appears to have peaked in Arizona, it is still rising in the other Sun Belt states (Chart 12). Among emerging markets, the epicenter has moved from Brazil and Russia to India (Chart 13). Chart 11Despite Progress In Europe, Japan, And Most Of East Asia, The Number Of Covid Infections Continues To Rise Globally
Will Bond Yields Ever Go Up?
Will Bond Yields Ever Go Up?
Chart 12A Second Wave Is A Key Macro Risk
Will Bond Yields Ever Go Up?
Will Bond Yields Ever Go Up?
Chart 13BRICs: Covid Leaving No Stone Unturned
Will Bond Yields Ever Go Up?
Will Bond Yields Ever Go Up?
While efforts to contain the virus will boost growth in the long run, they will weigh on economic activity in the near term. Over half of the US population lives in states that have either reversed or suspended reopening plans (Chart 14). Chart 14Not So Fast
Will Bond Yields Ever Go Up?
Will Bond Yields Ever Go Up?
Google data on visits to shopping malls, recreation centers, public transport facilities, and office destinations have dipped in recent weeks. The decline in visits has occurred alongside a decrease in the New York Fed’s high-frequency economic activity indicator (Chart 15). Initial unemployment claims also rose this week. At this point, it looks likely that the recovery in US consumer spending will stall in July and August. Chart 15Covid Outbreak Is Weighing On Spending
Will Bond Yields Ever Go Up?
Will Bond Yields Ever Go Up?
While it is difficult to know what will happen starting in September, our guess is that the pandemic will ebb in the southern states, just like it did in the northeast. This is partly because mask-wearing is becoming more widespread. Back in early March, when most mainstream news sources were tweeting out misinformation such as “Oh, and face masks? You can pass on them,” we noted that both logic and evidence suggest that masks are an effective tool against the virus. Increased testing should also help identify asymptomatic people before they have had the chance to spread the virus to many others. Meanwhile, improved medical care should also help reduce the mortality and morbidity rates from the disease. Just this week, scientists presented the results of a double-blind clinical trial showing that the inhalation of interferon beta, a cytokine used to treat multiple sclerosis, reduced the risk of developing severe Covid symptoms by nearly 80%. Fiscal Cliff Ahead? In addition to the pandemic, investors have to grapple with uncertainty over whether fiscal policy will remain sufficiently accommodative to reflate the economy. Unlike the EU, which managed to cobble together a framework for creating a 750 billion euro pandemic relief fund earlier this week, the US Congress remains deadlocked on the size and complexion of a new stimulus bill. Under current law, US households will stop receiving expanded unemployment benefits at the end of July. These benefits were legislated as part of the original CARES Act and currently total over 4% of GDP. The Paycheck Protection Program for small businesses is also nearly drained, while state and local governments are facing a major cash crunch due to evaporating tax revenues and higher pandemic-related spending needs. We estimate that about $2-to-$2.5 trillion in new stimulus will be necessary to keep fiscal policy from turning unduly restrictive. Senate Majority Leader Mitch McConnell has been floating a number of $1.3 trillion. If McConnell gets his way, risk assets will likely sell off. Our guess is that he will not prevail, however. President Trump favors a larger stimulus bill, as do the Democrats. Critically, more than four out of five voters, both nationwide and in swing states, support extending benefits (Table 1). Thus, there is a high probability that Senate Republicans will agree on a much larger package than what they are currently proposing. Table 1There Is Much Public Support For Fiscal Stimulus
Will Bond Yields Ever Go Up?
Will Bond Yields Ever Go Up?
Fiscal Stimulus And Bond Yields Could continued fiscal stimulus deplete national savings, leading to significantly higher real yields? For the next few years, the answer is no. National savings depend not just on how much people spend, but on how much they earn. To the extent that fiscal stimulus raises GDP, it also raises national income. For the global economy as a whole, savings must equal investment. If fiscal stimulus in the major economies prompts firms to undertake more investment spending than they would have otherwise, overall savings will rise. How can that be? The answer is that fiscal stimulus raises private savings by more than it reduces government savings when an economy is operating below its full capacity. From the perspective of the bond market, this means that currently, large budget deficits are self-financing. Bigger budget deficits will produce an even bigger pool of private income, allowing the private sector to buy more government bonds. Indeed, a premature pullback in fiscal support would almost certainly raise real rates by depressing inflation expectations. If that sounds far-fetched, recall that this is precisely what happened in March. Full Employment And Beyond Chart 16Government Debt Levels Have Surged In The Wake Of The Pandemic
Government Debt Levels Have Surged In The Wake Of The Pandemic
Government Debt Levels Have Surged In The Wake Of The Pandemic
The fiscal free lunch will end only when economies return to full employment. At that point, bigger budget deficits will no longer be able to raise output since everyone who wants to work will already have found a job. Rather, increased government borrowing will crowd out private-sector investment. National savings will decline. If monetary and fiscal policy stay accommodative, inflation could accelerate. Central banks will probably welcome the initial burst of inflation, since they have been lamenting below-target inflation for many years now. However, if inflation continues to march higher, central banks may get spooked and start talking up the prospect of rate hikes. Higher rates would create a lot of problems for debt-saddled governments (Chart 16). It would not be at all surprising if politicians leaned on central banks to keep rates low. Governments could also end up forcing central banks to buy more debt in order to keep long-term yields from rising. In the extreme case, governments could even force central banks to cap yields. While such measures would prevent bond prices from tumbling, this would be cold comfort for bondholders. If central banks were to keep bond yields below their equilibrium level, inflation would rise even further, thus eroding the purchasing power of the bonds. In the end, central banks would still have to raise rates, probably more than they would have had they acted more swiftly to quell inflation. Investment Conclusions To answer the question posed in the title of this report, yes, bond yields will eventually go up. However, they are not likely to rise very much until inflation reaches intolerably high levels. That point is at least three years away. Despite the near-term risks posed by the pandemic and the looming fiscal cliff, investors should remain overweight equities over a 12-month horizon. Given the run-up in some of the large cap US tech names, we suggest shifting equity exposure to other parts of the stock market. The cyclically-adjusted price-earnings ratio is significantly lower outside the US, implying that international stocks are well placed to outperform their US peers over the coming decade (Chart 17). A weaker dollar should also help non-US stocks as well as the more cyclical equity sectors (Chart 18). Chart 17Non-US Stocks: The Place To Be Over The Coming Decade
Non-US Stocks: The Place To Be Over The Coming Decade
Non-US Stocks: The Place To Be Over The Coming Decade
Chart 18A Weaker Dollar Should Boost Non-US Stocks Along With The More Cyclical Equity Sectors
A Weaker Dollar Should Boost Non-US Stocks Along With The More Cyclical Equity Sectors
A Weaker Dollar Should Boost Non-US Stocks Along With The More Cyclical Equity Sectors
Peter Berezin Chief Global Strategist peterb@bcaresearch.com Global Investment Strategy View Matrix
Will Bond Yields Ever Go Up?
Will Bond Yields Ever Go Up?
Current MacroQuant Model Scores
Will Bond Yields Ever Go Up?
Will Bond Yields Ever Go Up?
Highlights Monetary Policy: Central bankers worldwide are promising to keeping policy rates near 0% for at least the next two years, even if inflation begins to rise again. This is an obvious form of forward guidance designed to keep borrowing costs as low as possible until the COVID-19 pandemic ends. It may also be the start of a true shift in policymaker strategy, tolerating a rise in inflation just as many of the secular forces that have dampened global inflation are fading. Bond Strategy: The recent divergence of inflation expectations and real bond yields can persist if central banks commit to their dovish forward guidance. Stay overweight inflation-linked bonds versus nominal government debt, particularly in the US, Canada and Italy. Feature “We’re not thinking about raising rates. We’re not even thinking about thinking about raising rates.” – Fed Chairman Jerome Powell Central bankers have emptied their bags of tricks in recent months, providing extreme monetary policy accommodation to fight the deflationary impacts of the COVID-19 recession. 0% policy interest rates, large-scale asset purchases and liquidity support programs have all been implemented in some form by the major developed market central banks. Even more extreme options like yield curve control have been contemplated in the US and implemented in Australia. Perhaps the most important tool used by policymakers, however, is the most simple of all – dovish forward guidance on future interest rate moves. The Fed, European Central Bank (ECB), Bank of Japan (BoJ) and others are now committing to keep rates at current levels for at least the next two years. Additional “state-based” guidance, tying future rate hikes only to a sustainable return of inflation back to policymaker targets, is the likely next step, with the Bank of Canada already making that connection at last week’s policy meeting. Given how difficult it has been for central banks to reach those targets, policy rates can now potentially stay lower for much longer. Interest rate markets have already discounted such an outcome, with overnight index swap (OIS) curves pricing in no change in policy rates in the US, Europe, UK, Japan, Canada or Australia until at least mid-2022 and only very mild increases afterward (Chart of the Week). It remains to be seen if policymakers will actually follow through on their promises to sit on their hands and do nothing for that long, even as global growth and inflation continue what will likely be an extended and choppy recovery from the deep COVID-19 recession. Chart of the WeekAggressive Forward Guidance Is Working
Can Central Bankers Credibly Be Not Credible?
Can Central Bankers Credibly Be Not Credible?
However, if central bankers are truly serious about keeping interest rates low even if inflation picks up, in an attempt to “catch up” from previous undershoots of inflation targets, that has major implications for global bond investors – in particular, raising the value of maintaining core holdings of inflation-linked bonds in fixed-income portfolios. The First Step To Higher Inflation: Stop Talking About Rate Hikes Central bankers are increasingly using the same arguments, and even the same language, to justify their current hyper-accommodative policy stance. Here are some examples, taken from speeches and policy meetings that took place last week: ECB President Christine Lagarde: “We expect interest rates to remain at their present or lower levels until we have seen the inflation outlook robustly converge to a level sufficiently close to, but below, 2% within our projection horizon and such convergence has been consistently reflected in underlying inflation dynamics.” Federal Reserve Governor Lael Brainard: “Looking ahead, it likely will be appropriate to shift the focus of monetary policy from stabilization to accommodation by supporting a full recovery in employment and a sustained return of inflation to its 2 percent objective […] policy should not preemptively withdraw support based on a historically steeper Phillips curve that is not currently in evidence.” Bank of Canada Governor Tiff Macklem: "As the economy moves from reopening to recuperation, it will continue to require extraordinary monetary policy support. The Governing Council will hold the policy interest rate at the effective lower bound until economic slack is absorbed so that the 2 percent inflation target is sustainably achieved.” Chart 2Global Growth Expectations Have Rebounded
Global Growth Expectations Have Rebounded
Global Growth Expectations Have Rebounded
We could have switched the names on those three quotes and the message would be the same. Policy rates will stay at current levels until inflation has sustainably returned to the 2% target. Raising rates on the back of a forecast of higher inflation, driven by an expectation of lower unemployment, will not be enough this time for policymakers that have been repeatedly burned by their belief in the Phillips Curve. Bond investors have taken note of the central bankers’ message and now expect both stable policy rates and higher inflation expectations. The latest data from the ZEW survey of economic and financial market sentiment, that was published last week and covers the period to mid-July, shows this shift in expectations. On the economy, the current conditions indices for the euro area, US, UK and Japan have stopped falling, while the expectations data have all soared to the highest levels seen since 2015 (Chart 2). The ZEW also poses questions on expectations for interest rates and inflation, and there the answers are more interesting for bond investors. The net balances on expectations for long-term interest rates have bottomed out for the US, euro area and UK, as have expectations for inflation over the next twelve months (Chart 3). At the same time, expectations for short-term interest rates have lagged the moves seen in the other two series, with the net balances hovering around zero for all four countries. One possible interpretation of this data is that a greater number of the financial professionals who take part in the ZEW survey are starting to “get the hint” about central bankers’ dovish messages, expecting higher inflation and bond yields but with no change in short-term policy rates. Bond investors have taken note of the central bankers’ message and now expect both stable policy rates and higher inflation expectations. We see similar pricing in inflation-linked bond markets. While nominal bond yields have stayed stable, the mix between inflation expectations and real bond yields has shifted. Breakevens on 10-year bonds have been slowly climbing across the major developed markets since the end of March, while real yields have fallen roughly the same amount as breakevens have widened (Chart 4). Chart 3Global Inflation Expectations Are Drifting Higher
Global Inflation Expectations Are Drifting Higher
Global Inflation Expectations Are Drifting Higher
Chart 4Inflation Breakevens & Real Yields: Mirror Images
Inflation Breakevens & Real Yields: Mirror Images
Inflation Breakevens & Real Yields: Mirror Images
This is a relatively unusual development in the global inflation-linked bond universe. More often, breakevens and real yields move in the same direction. Inflation expectations tend to rise when economic growth is improving, which also puts upward pressure on real bond yields – often in tandem with markets pricing in higher policy rates at the short end of yield curves. That is not the case today. The latest fall in real bond yields may simply be markets pricing in slower potential economic growth, and lower equilibrium real interest rates, in a world where the COVID-19 pandemic is likely to leave lasting scars. That would be consistent with Bloomberg growth and inflation forecasts for the major developed economies, which expect unemployment rates to remain above pre-COVID levels in 2022, with inflation rates struggling to reach 2% (Chart 5). Chart 5The Consensus Expects A Slow Global Recovery
Can Central Bankers Credibly Be Not Credible?
Can Central Bankers Credibly Be Not Credible?
In a recent report, we presented some basic Taylor Rule estimates of the “appropriate” level of policy rates for the US, euro area, UK, Japan, Canada and Australia after the collapse in growth seen in response to the COVID-19 lockdowns. We used the most basic formulation of the Taylor Rule that put equal weight on deviations of headline inflation from central bank target levels, and deviations of unemployment from full-employment NAIRU measures. Chart 6Taylor Rules Suggest Rates Will Need To Head Higher
Can Central Bankers Credibly Be Not Credible?
Can Central Bankers Credibly Be Not Credible?
Given the surge in unemployment and collapse in inflation due to the COVID-19 recession, Taylor Rule estimates were calling for negative nominal interest rates across the developed economies (Chart 6). The estimates were most severe in the US, where a fed funds rate of -3.8% is deemed “appropriate” with an unemployment rate of 11% and headline CPI inflation at 0.6%. When the Bloomberg consensus forecasts for the next two years are put into the Taylor Rule, a rising path for interest rates is projected but with rates remaining below pre-COVID levels. However, if policymakers stick to their current pledge to keep rates on hold for longer to ensure that inflation not only returns to 2%, but also stays there without the help from very easy monetary policy, then the implication is that a “below-appropriate” interest rate will be maintained for an extended period. Interest rate markets have already come to that conclusion. 5-year OIS rates, 5-years forward are trading between 0% and 1% across the developed economies – levels that are below the neutral interest rate estimates we are using in our Taylor Rule forecasts (Chart 7). Chart 7Markets Priced For An Extended Period Of Below-Neutral Rates
Markets Priced For An Extended Period Of Below-Neutral Rates
Markets Priced For An Extended Period Of Below-Neutral Rates
With interest rates already at or near the zero bound, any rise in inflation from current levels also near 0% will result in real policy rates turning negative if central banks do nothing. This would be consistent with the messages sent by the ZEW survey, and global inflation linked bond markets where real yields are falling deeper into negative territory. That would be a major shift of global policymaker behavior, designed as a planned erosion of inflation-fighting credibility. This is especially true for the likes of the Fed, which has a well-established history of turning hawkish at the first sign of rising inflation pressures. The Fed has already hinted that it is considering shifting its policy strategy to allow overshoots of inflation after periods of undershooting the 2% target. Other central banks, like the ECB, have announced similar reviews of their inflation targets and strategy. Such a move to tolerate higher levels of inflation is a logical response to a global pandemic and deep global recession, coming on the heels of several years of low inflation. The timing may actually be ideal to run more dovish policies to boost inflation, with many of the structural factors that have helped restrain global inflation starting to turn in a more inflationary direction. That would be a major shift of global policymaker behavior, designed as a planned erosion of inflation-fighting credibility. Bottom Line: Central bankers worldwide are promising to keep policy rates near 0% for at least the next two years, even if inflation begins to rise again. This is an obvious form of forward guidance designed to keep borrowing costs as low as possible until the COVID-19 pandemic ends. It may also be the start of a true shift in policymaker strategy, becoming more tolerant of faster inflation. Potential Reasons Why Inflation Could Return Central bankers are talking a good game right now, pledging not to turn too hawkish, too soon and allowing inflation to move back above policy targets. It remains to be seen if they would actually follow through and do nothing if realized inflation rates were to start climbing back to 2% or even higher. It is unlikely that policymakers will be facing that choice anytime soon. The COVID-19 pandemic is showing no signs of slowing in the US and large emerging market countries, global growth remains fragile and heavily reliant on monetary and fiscal policy support, and inflation rates worldwide are currently closer to 0% than 2%. Yet at the same time, there are structural disinflationary forces now changing in a way that may create a more inflationary world after the threat of the pandemic has faded. Demographics Chart 8Demographics Have Turned Less Disinflationary
Demographics Have Turned Less Disinflationary
Demographics Have Turned Less Disinflationary
BCA Research Global Investment Strategy has noted that the global demographic trends that helped restrain inflation in recent decades are shifting.1 The ratio of the number of global workers to the number of global consumers – the global support ratio - peaked back in 2013 and is now steadily falling (Chart 8). There are structural disinflationary forces now changing in a way that may create a more inflationary world after the threat of the pandemic has faded. A rising support ratio implies there are more people producing through work than consuming which, on the margin, is disinflationary. Now, with baby boomers leaving the labor force in droves and becoming consumers in retirement (especially consuming services like health care), the support ratio is falling and becoming a potentially more inflationary force. Globalization Chart 9Globalization Has Turned Less Disinflationary
Globalization Has Turned Less Disinflationary
Globalization Has Turned Less Disinflationary
One of the biggest disinflationary forces of the past quarter-century has been the rapid increase in global trade. As trade barriers fell and global supply chains expanded, companies were able to lower their costs of production. This allowed companies to widen profit margins without resorting to large price increases, helping to dampen overall inflation rates. Now, with global populism and protectionism on the rise, trade as a share of global GDP is declining (Chart 9). The COVID-19 pandemic will likely exacerbate this trend as more companies bring production closer to home, reversing the disinflationary impact of global supply chains, on the margin. A Strong US Dollar The relentless rise of the US dollar in recent years has exerted a major disinflationary headwind to the world economy, with a large share of global traded goods and commodities priced in dollars. Now, with the greenback finally showing signs of rolling over on a more sustainable basis (Chart 10), fueled by less favorable interest rate differentials and signs of improving global growth, the dollar is slowly becoming a more inflationary force. Chart 10USD Weakness Would Be Inflationary
USD Weakness Would Be Inflationary
USD Weakness Would Be Inflationary
Chart 11Structural Reasons Why Policy Rates Need To Stay Low
Structural Reasons Why Policy Rates Need To Stay Low
Structural Reasons Why Policy Rates Need To Stay Low
Of course, these factors are slow moving and will not necessarily result in an immediate increase in global inflation. Yet the trends now in place are more inflationary, on the margin, than has been the case for many years. Coming at a time when global productivity growth is anemic, the potential for an inflationary spark from overly easy monetary policies should not be ignored. Especially given the very high levels of private and public debt in the developed world, which puts more pressure on policymakers to choose inflation as a way to reduce debt burdens (Chart 11). Investment Implication – Stay Overweight Inflation-Linked Bonds Central bankers are now signaling a desire to keep interest rates lower for longer, both to provide stimulus for virus-stricken economies and to boost weak inflation. Coming at a time when secular disinflationary forces are losing potency, this raises the risk of a protracted period of negative real policy rates as inflation rises and policymakers do little to stop it pre-emptively. Against this shifting backdrop, the value of owning global inflation-linked bonds as core holdings in fixed income portfolios is compelling. Chart 12Maintain A Core Overweight In Inflation-Linked Bonds
Maintain A Core Overweight In Inflation-Linked Bonds
Maintain A Core Overweight In Inflation-Linked Bonds
Against this shifting backdrop, the value of owning global inflation-linked bonds as core holdings in fixed income portfolios is compelling. Inflation breakevens are more likely to creep upward than soar higher in the near term given the lingering economic threat from the COVID-19 pandemic. Yet inflation-linked bonds are likely to outperform nominal government debt over the next few years – if central bankers stay true to their word and keep rates unchanged while welcoming a pickup in inflation. The experience of the years following the 2008 financial crisis, when global policy rates were kept near 0% and central banks expanded balance sheets through quantitative easing, may be a template to follow. Global inflation linked bonds, as an asset class, steadily outperformed nominal government bonds from 2012-2016, shown in Chart 12 on a rolling 3-year annualized basis using benchmark indices from Bloomberg Barclays. A similar extended period of outperformance is not out of the question over the next few years, with central banks ramping up asset purchases once again and promising to keep policy easy until inflation returns. Bottom Line: The recent divergence of inflation expectations and real bond yields can persist if central banks commit to their dovish forward guidance. Stay overweight inflation-linked bonds versus nominal government debt, particularly in the US, Canada and Italy where our models show that breakevens are most undervalued. Robert Robis, CFA Chief Fixed Income Strategist rrobis@bcaresearch.com Footnotes 1 Please see BCA Research Global Investment Strategy "Third Quarter 2020 Strategy Outlook, Navigating The Second Wave", dated June 30, 2020, available at gis.bcaresearch.com. Recommendations The GFIS Recommended Portfolio Vs. The Custom Benchmark Index
Can Central Bankers Credibly Be Not Credible?
Can Central Bankers Credibly Be Not Credible?
Duration Regional Allocation Spread Product Tactical Trades Yields & Returns Global Bond Yields Historical Returns
Highlights US consumer spending will stall this summer in response to the rising number of Covid cases. Worries about the looming fiscal cliff could also dampen sentiment. Markets are likely to trade nervously over the coming days, but ultimately, stocks will resume their uptrend. The number of new cases already seems to be peaking in some southern US states, and there is no political will to rescind fiscal stimulus. Many institutional investors missed out on the equity rally and will be keen to “buy the dip” on any opportunity. The drop in government bond yields since the start of the year has more than offset the decline in earnings expectations. As odd as it sounds, the pandemic may have raised the fair value of equities. If one wants to challenge this conclusion, one needs to demonstrate that: 1) earnings estimates have not fallen enough; 2) government bond yields have been artificially suppressed; or 3) the post-pandemic world justifies a higher equity risk premium. While there is some truth to all three arguments, they are unlikely to hold much sway over the next 12 months, provided that global growth rebounds and governments and central banks maintain ultra-accommodative fiscal and monetary policies. Investors should remain overweight global equities, while tilting their exposure to beaten-down cyclically-geared stocks and non-US markets. The equity bull market will only end when central banks get panicky about rising inflation, which is unlikely to happen for the next three years. From ROMO To FOMO People often talk about FOMO (the Fear of Missing Out). But for many institutional investors, the past four months has been more about ROMO – the Reality of Missing Out. Chart 1Many Investors Are Bearish On Stocks
Many Investors Are Bearish On Stocks
Many Investors Are Bearish On Stocks
Many investment professionals missed the rally that began in March, and not much has changed since then. The July BofA Merrill Lynch Survey of Fund managers revealed that fund managers are almost one standard deviation overweight cash and nearly one standard deviation underweight equities. In fact, cash allocations increased further since June. The latest sentiment survey conducted by the American Association of Individual Investors (AAII) tells a similar story. Bears exceeded bulls by 15 points in this week’s tally, one of the highest spreads on record (Chart 1). This is not what market tops look like. Near-Term Worries Granted, risks abound. The Google Mobility Index has hooked lower, reflecting the worsening Covid outbreak in the sunbelt states and parts of the Midwest. This real time index tends to track economic activity quite well (Chart 2). At this point, it is reasonable to expect the recovery in US consumer spending to stall this summer. Chart 2Covid Outbreak Is Weighing On Spending
Global Equities Can Still Go Higher
Global Equities Can Still Go Higher
Worries about the fiscal cliff could also dampen sentiment. Unemployment benefits for the average American worker are set to fall by more than 60% at the end of July. The funds in the Paycheck Protection Program for small businesses are also running out. To make matters worse, many state and local governments, which began their fiscal year in July, are facing a severe cash crunch due to evaporating tax revenues and rising social spending obligations. Meanwhile, the US elections are only four months away. If the Democrats win the White House and take control of the Senate, the Trump tax cuts will be in jeopardy. Joe Biden has pledged to lift corporate tax rates halfway back to their original levels. This would reduce S&P 500 EPS by about 6%. Risks In Perspective While the discussion above suggests that stocks could trade nervously over the coming days, we should keep things in perspective. The number of new Covid cases has been trending lower in Arizona over the past week and may be close to peaking in the other southern states (Chart 3). Positive news on the vaccine front could also buoy sentiment. Chart 3A Snapshot Of The Number Of New Cases In The Most Afflicted US States
Global Equities Can Still Go Higher
Global Equities Can Still Go Higher
With respect to the fiscal cliff, there is a very high probability that Congress will reach a deal on a new aid package worth around $2.5 trillion. Table 1 shows stimulus remains politically popular nationwide and, more importantly, in the swing states. Table 1There Is Much Public Support For Fiscal Stimulus
Global Equities Can Still Go Higher
Global Equities Can Still Go Higher
If Democrats prevail in November and raise corporate taxes, most of the revenue gained will be plowed back into the economy. Given that empirical estimates suggest that the spending multiplier from the corporate tax cuts was quite small, the net effect will probably be stimulative.1 The risk of an all-out trade war with China would also decline under a Biden administration, which is something the stock market would welcome. Some might contend that stocks are already pricing in a very rosy outlook. However, as we argue below, it is far from clear that this is the case. Has All The Good News Been Priced In? An NPV Analysis The fair value of the stock market can be represented as the expected stream of cash flows that shareholders will receive, deflated by an appropriate discount rate. The discount rate, in turn, can be expressed as a risk-free rate plus an equity risk premium (ERP). The ERP compensates investors for holding riskier stocks compared to safer government bonds. At the start of the year, Wall Street analysts expected S&P 500 earnings to increase by 9% in 2020 and by 11% in both 2021 and 2022. Today, analysts expect earnings to shrink by 23% in 2020, but then rebound by 29% in 2021. This would essentially take earnings back to last year’s levels. Looking further out, analysts expect earning to recover a further 17% in 2022, which would put them on track to reach their pre-pandemic trend by 2024. In contrast, market participants see little scope for a recovery in bond yields (Chart 4). According to the forward curve, the US 10-year is poised to rise from 0.62% at present to just 1.3% in five years’ time. At the start of 2020, investors thought the 10-year yield would be 2.5% in 2025. Along the same vein, the 30-year bond yield is down 106 bps since the start of the year. The 30-year TIPS yield has fallen by 82 bps. Since stocks are a long duration asset, the TIPS yield is a good proxy for the inflation-adjusted, risk-free component of the discount rate. Chart 4After Nosediving, Bond Yields Aren’t Expected To Rise By Much
After Nosediving, Bond Yields Aren't Expected To Rise By Much
After Nosediving, Bond Yields Aren't Expected To Rise By Much
Chart 5 shows that if we combine the change in analyst earnings expectations with the drop in the TIPS yield, the net present value (NPV) of S&P 500 earnings has risen by a staggering 16.2% since the start of the year. Chart 5The Present Value Of Earnings: A Scenario Analysis
Global Equities Can Still Go Higher
Global Equities Can Still Go Higher
Really? It might seem preposterous to conclude that the fair value of the S&P 500 may have increased at a time when the US and the rest of the world have plunged into the deepest recession since the 1930s. Yet, it naturally flows from the premise that the hit to earnings from the pandemic will be temporary, while the decline in bond yields will be much longer lasting. If one wants to challenge this conclusion, one needs to demonstrate that: 1) earnings estimates have not fallen enough; 2) government bond yields have been artificially suppressed; or 3) the post-pandemic world justifies a much higher equity risk premium. Let us examine all three arguments in turn. Are Earnings Estimates Too Optimistic? The short answer is yes. However, this does not say very much. As Chart 6 shows, analysts are usually too optimistic. They typically start every year with overinflated estimates, and subsequently have to scale them down. This happens even during economic expansions. Thus, if estimates end up being trimmed over the coming months, this will not necessarily prevent stocks from moving higher. Chart 6Earnings Estimates Tend To Be Revised Down Even In The Best Of Times
Are Earnings Estimates Too Optimistic? Earnings Estimates Tend To Be Revised Down Even In The Best Of Times
Are Earnings Estimates Too Optimistic? Earnings Estimates Tend To Be Revised Down Even In The Best Of Times
Of course, magnitudes matter a lot. If analysts end up having to revise estimates down more than usual, this could hurt stocks. But will they? That is far from a foregone conclusion. Earnings usually follow the path of nominal GDP. The Congressional Budget Office (CBO) expects the level of nominal GDP to be just half a percentage point lower in 2021 than it was in 2019. In this light, the notion that earnings next year will be on par with last year’s levels does not seem that farfetched. Moreover, one should also note that health care and technology are highly overrepresented on Wall Street compared to Main Street. Together, they account for 42% of S&P 500 market capitalization. Outside these two sectors, S&P 500 earnings are expected to be 9% lower in 2021 relative to 2019. In any case, the conclusion that the pandemic has increased the fair value of equities would not change much if we were to assume that earnings recover more slowly than anticipated. The red colored bar in Chart 5 shows the impact on the NPV in a scenario where earnings only return to their pre-pandemic trend by 2030: the NPV still rises by 13.5%. Even if we assume that earnings permanently remain 5% below their pre-pandemic forecast, the NPV would still increase by 9.2% (blue colored bar). In order to push down the NPV by a considerable amount, one would need to assume that the pandemic will not only reduce the level of corporate earnings, but it will reduce the growth rate of earnings as well. For example, if the pandemic reduces earnings growth by one percentage point, this would cause the NPV to fall by 7.5% (gray colored bar). Is this a sensible assumption, however? We don’t think so. While the pandemic will reduce capital spending temporarily, it is unlikely to damage the long-term growth rate of either productivity or the labor force, the two key drivers of potential output. Chart 7 shows that even after the Great Depression, per capita income eventually returned to its long-term trend. Chart 7No Clear Evidence That The Great Depression Lowered Long-Term Trend Growth
No Clear Evidence That The Great Depression Lowered Long-Term Trend Growth
No Clear Evidence That The Great Depression Lowered Long-Term Trend Growth
Are Bond Yields Distorted To The Downside? The notion that the pandemic may have increased the fair value of the stock market hinges critically on the view that the discount rate has fallen substantially this year. We will get to the question of what the appropriate level of the equity risk premium should be in a moment, but let us first examine the risk-free component of the discount rate. Many pundits argue that central bank bond purchases have pushed down yields below where they ought to be. That may be true, but it is not clear why that matters. If one is making present value calculations, one should look at the actual bond yield, not the yield that accords with one’s preconception of what is appropriate. Granted, if bond yields were to rise sharply in the future, the present value of future earnings would probably end up falling. However, this is unlikely to occur anytime soon. It will take a while for unemployment to return to pre-pandemic levels, during which time inflation will remain dormant. And even once inflation starts rising, central banks will likely refrain from hiking rates because they have been concerned about excessively low inflation for nearly two decades. Central banks could also face pressure from governments to keep rates low in order to suppress interest costs. As a result, real rates could fall initially, which would be supportive of stocks. The bull market in equities will only end when inflation reaches a level that makes markets nervous that central banks will have to raise rates. This is unlikely to happen for the next three years. The Equity Risk Premium Is More Likely To Fall Than Rise Chart 8Non-US Stocks Look Cheaper Than Their US Peers In Both Absolute Terms And In Relation To Bond Yields
Non-US Stocks Look Cheaper Than Their US Peers In Both Absolute Terms And In Relation To Bond Yields
Non-US Stocks Look Cheaper Than Their US Peers In Both Absolute Terms And In Relation To Bond Yields
As noted above, there are many risks confronting investors. The key question is whether the stock market’s perception of these risks will subside or intensify. If it is the former, the equity risk premium will probably shrink, pushing stocks higher. If it is the latter, stocks will fall. Our bet is on the former. We have already learned a lot about the virus. We will learn even more over the coming months. This should reduce the cone of uncertainty investors are facing. On the economic side, central bank asset purchases, combined with large-scale fiscal stimulus, have reduced the tail risk of another market meltdown. If policy stays supportive for the next few years, as we expect, the equity risk premium will shrink. Starting points matter, too. Globally, the equity risk premium, which we calculate by subtracting the real bond yield from the cyclically-adjusted earnings yield, was quite high at the start of the year and is even higher now (Chart 8). This suggests that investors should favor stocks over bonds. A Weaker Dollar Will Give Non-US Stocks An Edge The ERP is particularly elevated outside the US. Thus, valuations tend to favor non-US stocks. Of course, it helps to have factors other than valuations on your side when making investment decisions. In the case of regional and sector allocation, the outlook for the US dollar is critical. Chart 9 shows that cyclical stocks tend to outperform defensives when the dollar is weakening, while non-US stocks tend to do better than their US peers. There are five reasons to expect the US dollar to depreciate over the next 12 months. First, as a countercyclical currency, a revival in global growth should hurt the dollar (Chart 10). Second, the US has been harder hit by the virus over the past few months than most other economies. Thus, the spread between overseas growth and US growth is likely to widen more than usual (Chart 11). Chart 9Cyclical Sectors Should Outperform Defensives As Global Growth Recovers... And A Weaker Dollar Should Also Help Non-US Stocks
Cyclical Sectors Should Outperform Defensives As Global Growth Recovers... And A Weaker Dollar Should Also Help Non-US Stocks
Cyclical Sectors Should Outperform Defensives As Global Growth Recovers... And A Weaker Dollar Should Also Help Non-US Stocks
Chart 10A Revival In Global Growth Should Hurt The Dollar
A Revival In Global Growth Should Hurt The Dollar
A Revival In Global Growth Should Hurt The Dollar
Chart 11The Dollar Will Also Weaken On The Widening Gap Between Overseas Growth And US Growth
The Dollar Will Also Weaken On The Widening Gap Between Overseas Growth And US Growth
The Dollar Will Also Weaken On The Widening Gap Between Overseas Growth And US Growth
Chart 12Interest Rate Differentials No Longer Favor The Dollar
Interest Rate Differentials No Longer Favor The Dollar
Interest Rate Differentials No Longer Favor The Dollar
Third, interest rate differentials no longer favor the dollar, now that the Fed has brought rates down to zero (Chart 12). Fourth, momentum is not on the greenback’s side anymore (Chart 13). Fifth, the dollar is expensive based on measures such as purchasing power parity exchange rates (Chart 14). Chart 13Momentum Is Not On The Greenback’s Side
Global Equities Can Still Go Higher
Global Equities Can Still Go Higher
The right trade over the past few years was to be long the dollar and overweight US stocks. It is time to flip this trade and do the opposite. Peter Berezin Chief Global Strategist peterb@bcaresearch.com Chart 14USD Is Not Cheap
USD Is Not Cheap
USD Is Not Cheap
Footnotes 1 An IMF analysis of the use of funds of listed companies found that only about one fifth of the increase in corporate cash since the adoption of the Tax Cuts and Jobs Act (TCJA) was used for capex and R&D. The rest was utilized for share buybacks, dividend payouts, and other activities. The same study also noted that actual GDP and business investment growth in 2018 fell short of the predicted impact of the TCJA based on empirical studies of postwar US tax changes. Please see Emanuel Kopp, Daniel Leigh, Susanna Mursula, and Suchanan Tambunlertchai, "U.S. Investment Since the Tax Cuts and Jobs Act of 2017," IMF Working Paper, May 31, 2019. Global Investment Strategy View Matrix
Global Equities Can Still Go Higher
Global Equities Can Still Go Higher
Current MacroQuant Model Scores
Global Equities Can Still Go Higher
Global Equities Can Still Go Higher