Policy

Highlights BCA’s “Golden Rule of Bond Investing” framework, which links developed economy government bond returns to central bank policy rate “surprises” versus market expectations, also works in China. The relationship between unexpected changes in China’s de facto short-term policy rate and government bond yields has been surprisingly strong over the past decade. Any additional easing by the PBoC this year is likely to be focused on reducing lending rates to the real economy, not interbank rates (which drive government bond yields). As such, yields at the short-end are likely to be flat until later this year at the earliest, whereas yields at the long-end are likely to move modestly higher, at most. The persistent historical gap between economic growth and bond yields in China makes it difficult to forecast the structural outlook for yields using conventional methods. To the extent that Chinese policymakers succeed at shifting the drivers of growth from investment to consumption, we believe that bond yields are more likely to structurally rise than fall. Over the coming 6-12 months, investors should underweight Chinese government bonds versus Chinese equities and onshore corporate bonds. Within a regional government bond portfolio, however, investors should overweight USD-hedged China versus US and developed markets ex-US, as well as in unhedged terms. Feature Last year’s inclusion of Chinese onshore government and policy bank bonds in the Bloomberg Barclays Global Aggregate Index was a significant milestone of China’s journey to internationalize its capital markets. Other bond benchmark providers have since followed suit, highlighting that the trend of increased passive exposure to Chinese assets is likely to continue. Over the past year, the bulk of the market discussion concerning the addition of China to the major bond indices has focused on estimating the size of potential capital inflows that could be triggered and the related impact on onshore bond yields. By contrast, comparatively little work has been done to analyze the core drivers of Chinese government bond yields, and how they compare to the factors that influence yields in the developed markets that dominate the bond indices. This Special Report attempts to fill a hole in the analysis of Chinese bonds. This Special Report attempts to fill that hole in the analysis of Chinese bonds. We look at the predictability of China’s government bond market through the lens of BCA’s “golden rule” framework, and find a surprisingly strong relationship between changes in China’s de facto short-term policy rate and government bond yields. We then present our cyclical (6-12 month) and secular outlooks for government yields given this relationship, and conclude by presenting four specific investment recommendations pertaining to China’s fixed-income market with two audiences in mind: mainland/onshore investors who are focused on returns in unhedged RMB terms, and global fixed-income investors who are primarily focused on hedged US-dollar regional bond exposure. The Golden Rule Of Bond Investing, With Chinese Characteristics In a July 2018 Special Report,1 BCA’s Chief US Bond Strategist, Ryan Swift, elegantly distilled the cyclical US government bond call into a simple question: During the next 12-months, will the Federal Reserve move interest rates by more or less than what is currently priced into the market? Chart 1The (US) Golden Rule Of Bond Investing In Practice
The (US) Golden Rule Of Bond Investing In Practice
The (US) Golden Rule Of Bond Investing In Practice
Ryan argued that a predictive framework for US Treasury returns built around the answer to this question has historically worked so well that it should be referred to as the “Golden Rule of bond investing” (Chart 1). In a follow-up report, our Global Fixed Income Strategy service confirmed that the Golden Rule also largely works in non-US developed market economies, with the exception of Japan due to the absence of any meaningful fluctuation in policy rates over the past two decades.2 The Golden Rule provides a very strong framework to aid fixed-income investors with their cyclical (i.e. 6-12 month) asset allocation decisions, by quantitatively linking government bond returns relative to cash – in other words, the excess return earned by taking duration risk - to policy rate “surprises” compared to what is discounted in shorter-term money markets. The practical application is that a decision to allocate to longer-maturity government bonds is reduced to a bet on whether a central bank will adjust policy rates by more or less than the market expects. The first question we address in this report is to what degree does the Golden Rule apply in China (in yield space rather than in return space), along with an explanation of any differences that may exist. However, we must first note why the Golden Rule of bond investing works, particularly in the US. The first reason is that there is a strong relationship between the US 3-month T-bill rate and Treasury yields of all other maturities. Conceptually, all fixed income investors have a choice when buying US government bonds: they can purchase a 3-month Treasury bill and simply perpetually roll over the position as it matures, or they can purchase a Treasury bond of a longer maturity. This means that yields on longer maturity Treasury bonds simply reflect investor expectations for the average 3-month T-bill rate over the life of the bond, plus some positive risk premium to compensate for the inherent uncertainty of the path and tendency of short-term yields. This helps explain the close link between cyclical changes in 3-month T-bill rates and yields on longer maturity Treasurys. Chart 2In The US, The 3-Month T-Bill Rate Perfectly Tracks The Fed Funds Rate
In The US, The 3-Month T-Bill Rate Perfectly Tracks The Fed Funds Rate
In The US, The 3-Month T-Bill Rate Perfectly Tracks The Fed Funds Rate
The second reason for the Golden Rule’s success is that there is a very tight relationship between the effective Fed funds rate and the 3-month T-bill rate. While it is the (higher) discount rate that is the theoretical no-arbitrage ceiling for the 3-month rate, in practice T-bill rates trade extremely close to the Fed funds rate (Chart 2). This means that Fed funds rate “surprises” (relative to traded market expectations) are akin to surprises in the 3-month rate, which in turn strongly influence the expected future path of short-term interest rates and thus yields on longer maturity Treasurys. In China, we noted in a February 2018 Special Report3 that the 7-day interbank repo rate is now the de jure short-term policy rate in China following the establishment of an interest rate corridor system in 2015. Chart 3 presents our first test of the Golden Rule in China (in yield space rather than in return space), by plotting the annual change in the level of Chinese government bond yields alongside the 7-day repo rate “surprise” over the past year from 2010 to the present. Here, we use the first principal component of zero coupon Chinese government bond yields to represent the average level of yields (rather than selecting a particular maturity), and we use the 12-month RMB swap rate (versus 7-day repo) to represent market expectations for the policy rate. The chart highlights that the fit is good, as measured by a 50% R-squared between the two series. However, deviations in the relationship do exist, with the most notable exception having occurred in 2017: Chinese government bond yields rose considerably more than what the annual surprise in the 7-day repo rate would have suggested. Chart 3In China, The Golden Rule Works Decently Well Using 7-Day Repo...
In China, The Golden Rule Works Decently Well Using 7-Day Repo...
In China, The Golden Rule Works Decently Well Using 7-Day Repo...
Chart 4...And Extremely Well Using 3-Month SHIBOR
...And Extremely Well Using 3-Month SHIBOR
...And Extremely Well Using 3-Month SHIBOR
Chart 4 helps resolve a good portion of the 2017 discrepancy, and clarifies the link between Chinese monetary policy and government bond yields. Chart 4 is similar to Chart 3, except that it replaces the 7-day repo rate surprise with that of 3-month SHIBOR (which trades very closely to the 3-month repo rate). The chart illustrates an even closer fit between the two series (with an R-squared close to 80%), and shows that the 3-month SHIBOR surprise does a meaningfully better job at explaining the 2017 rise in Chinese government bond yields. The Golden Rule of bond investing works surprisingly well in China. The fact that the annual surprise in 3-month SHIBOR has done a better job at predicting changes in bond yields over the past decade underscores that the 3-month repo rate is the de facto short-term policy rate in China, a point that we have made in several previous reports. We have noted that the spike in the 3-month/7-day repo rate spread that occurred in late-2016 and lasted until mid-2018 happened because of China’s crackdown on shadow banking activity. This crackdown caused a funding squeeze for China’s small & medium banks, which caused a material rise in lending rates and government bond yields. This episode highlights that future changes in the 3-month repo rate are likely to reflect both underlying changes in net liquidity provided to large commercial banks (measured by the 7-day repo rate), and any dislocations in the interbank market that have the potential to push up lending rates and government bond yields. Bottom Line: BCA’s “Golden Rule” framework, which links developed economy government bond returns to central bank policy rate “surprises” versus market expectations, works for China as well – using the correct measure of the PBOC policy rate. This provides a useful investment framework for Chinese government bonds, which are now significant part of major global bond market benchmarks. The Cyclical Outlook For Chinese Government Bond Yields Given the establishment of the relationship between Chinese short-term interbank rates and government bond yields detailed above, we are now able to more precisely discuss the likely cyclical trajectory of Chinese government bond yields as a function of Chinese monetary policy. Two opposing forces have the potential to affect China’s government bond market this year. The first, a stabilization and modest rebound in Chinese economic activity, may exert upward pressure on yields due to expectations of eventual policy tightening. The second, continued attempts by the PBoC to ease corporate lending rates, may exert downward pressure on yields as it will reflect not just easy but easier monetary conditions. Yields at the long-end are likely to move modestly higher this year, at most. For investors, the raises the obvious question of whether Chinese government bond yields are likely to move up, down, or trend sideways this year. In our view, yields at the short-end are likely to be flat until later this year at the earliest, whereas yields at the long-end are likely to move modestly higher, at most. Yields at the short-end of China’s government bond curve are likely to stay flat for most of this year. There are two reasons why yields at the short-end of China’s government bond curve are likely to stay flat for most of this year. The first is that the PBoC is generally a reactive central bank and has historically lagged a pickup in economic activity, as illustrated in Chart 5. The chart shows the historical path of 3-month SHIBOR in the year following a bottom in economic activity in 2009, 2012, and 2015, and makes it clear that there has been no precedent for a significant rise in interbank rates in the first nine months of an economic recovery. The 2012 episode did see a very sharp rise in 3-month SHIBOR once the PBoC shifted into tightening mode, but we doubt that this experience will be repeated again unless economic growth accelerates much more aggressively than we expect. The second reason why we expect yields at the short-end of the curve to remain muted this year is because any additional easing by the PBoC is likely to be focused on reducing corporate lending rates, not interbank rates. Chart 6 highlights that while there is a strong correlation between changes in Chinese government bond yields and average lending rates in the economy, the former leads the latter. In the past, this relationship has existed because changes in interbank rates have coincided with reductions in the now obsolete benchmark lending rate, with the former usually occurring earlier than the latter. But in a scenario where the PBoC reduces the loan prime rate (LPR) and keeps net banking sector liquidity roughly constant, the extremely tight relationship shown in Chart 4 suggests that short-term bond yields are unlikely to be affected by a reduction in lending rates. Any meaningful decline in short-term yields below short-term interbank rates would simply prompt banks to stop buying these bonds. Chart 5The PBoC Is Generally A Reactive Central Bank
The PBoC Is Generally A Reactive Central Bank
The PBoC Is Generally A Reactive Central Bank
Chart 6Average Lending Rates Lag Short-Term Bond Yields
Average Lending Rates Lag Short-Term Bond Yields
Average Lending Rates Lag Short-Term Bond Yields
Chart 7China's Yield Curve Is Generally Pro-Cyclical
China's Yield Curve Is Generally Pro-Cyclical
China's Yield Curve Is Generally Pro-Cyclical
Additional easing by the PBoC does have the potential to impact the long-end of the government bond curve if investors view these actions as a sign that interbank rates will remain low for some time. This view is reinforced by the fact that China’s yield curve is not particularly flat, and thus has room to move lower. However, Chart 7 also shows that China’s yield curve, defined here as the second principal component of zero coupon Chinese government bond yields, is positively correlated with the relative performance of investable Chinese equities. This suggests that there is a procyclical element to the curve. We suspect that this procyclical element will dominate a potential decline in expectations for future short-term interest rates, but that yields at the long-end are likely to move modestly higher this year, at most. Bottom Line: Any additional easing by the PBoC this year is likely to be focused on reducing lending rates to the real economy, not interbank rates (which drive government bond yields). As such, yields at the short-end are likely to be flat until later this year at the earliest, whereas yields at the long-end are likely to move modestly higher, at most. The Secular Outlook For Chinese Government Bond Yields A common approach to forecasting the likely structural trend for nominal government bond yields is to estimate the trajectory of real long-term potential output growth and to add the monetary authority’s inflation target. This framework is based on the idea that interest rates are in equilibrium when the cost of borrowing is roughly equal to nominal income growth, a condition that results in no change in the burden to service existing debt. Chart 8China's Potential Growth Is Likely To Trend Lower...
China's Potential Growth Is Likely To Trend Lower...
China's Potential Growth Is Likely To Trend Lower...
Based on this framework, we would expect Chinese government bond yields to trend down over time, or possibly flat if the PBoC were to tolerate higher inflation over the coming decade. Chart 8 illustrates the IMF’s forecast of falling real potential growth in China over the coming several years, which is consistent with a shift in the composition of growth from investment to consumption as well as China’s looming demographic crisis. But Chart 9highlights an obvious problem with applying this framework to forecast the secular trend in Chinese government bond yields: over the past decade, yields have persistently averaged below actual nominal GDP growth, both in China and in the developed world. In the latter case, it is an open question whether this will continue to be true in the future, but in China’s case it is clear that government bond yields have little connection (in magnitude) to the pace of GDP growth. This reflects the longstanding strategy of Chinese policymakers to promote investment via persistently low interest rates, as has occurred in other manufacturing and export-oriented Asian economies (Chart 10). Chart 9...But Bond Yields Are Well Below GDP Growth, Just Like In Developed Markets
...But Bond Yields Are Well Below GDP Growth, Just Like In Developed Markets
...But Bond Yields Are Well Below GDP Growth, Just Like In Developed Markets
Chart 10In Industrial Asian Economies, Low Bond Yields Are A Policy Choice
In Industrial Asian Economies, Low Bond Yields Are A Policy Choice
In Industrial Asian Economies, Low Bond Yields Are A Policy Choice
The persistent historical gap between economic growth and bond yields in China makes it difficult to forecast the structural outlook for yields using conventional methods, and largely limits us to inference. To the extent that Chinese policymakers succeed at shifting the drivers of growth from investment to consumption, bond yields are more likely to rise than fall over time. This is because as long as interest rates remain well below the pace of income growth, the incentive to excessively borrow (and invest) is likely to persist. Chart 11China Needs Higher Interest Rates, But Only To A Point
China Needs Higher Interest Rates, But Only To A Point
China Needs Higher Interest Rates, But Only To A Point
However, even in a scenario where Chinese government bond yields structurally trend higher, we expect the rise to be modest. Chart 11 highlights that China’s “private sector” debt service ratio is extremely elevated, underscoring that the country’s ability to tolerate significantly higher bond yields is not strong. In addition, since 2015, China’s debt service ratio has been mostly flat despite rising a rising debt-to-GDP ratio, which has been achieved through lower short-term interest rates. To the extent that policymakers fail to make meaningful progress in shifting China’s growth drivers away from investment over the coming few years, lower (potentially sharply lower) bond yields would appear to be all but inevitable to cope with what would become a permanently growing drag on economic activity from the servicing of debt. For now, we would characterize this scenario as a risk to our base case view, but it is a risk that we will be closely monitoring over the coming years. Bottom Line: The persistent gap between Chinese nominal GDP growth and government bond yields is likely contributing to the problem of excessive leveraging. To the extent that Chinese policymakers succeed at shifting the drivers of growth from investment to consumption, bond yields are more likely to structurally rise than fall. Investment Conclusions Our analysis above points to four recommendations for investors over the coming year: Overweight Chinese stocks versus Chinese government bonds in RMB and USD terms Overweight Chinese onshore corporate bonds versus duration-matched Chinese government bonds in RMB terms Overweight 7-10 year USD-hedged Chinese government bonds versus their US and developed market (DM) counterparts For offshore US dollar-based investors, long 7-10 year Chinese government bonds in unhedged terms Regarding the first two recommendations, our view that yields are likely to be flat at the short-end and modestly higher at the long-end suggests that investors can expect total returns on the order of 2-3% from Chinese government bonds this year. Barring a major and lasting economic slowdown from the 2019-nCoV outbreak, we expect Chinese domestic and investable equities to outperform government securities over the coming 6-12 months. Onshore corporate bonds have a similar outlook: onshore spreads are pricing in (massively) higher default losses than we believe is warranted, meaning that they will outperform duration-matched government equivalents without any changes in yield. Chart 12Within Global Fixed-Income, Hedged Chinese 10-Year Yields Are Relatively Attractive
Within Global Fixed-Income, Hedged Chinese 10-Year Yields Are Relatively Attractive
Within Global Fixed-Income, Hedged Chinese 10-Year Yields Are Relatively Attractive
Chart 13Unhedged Yield Spreads Predict Hedged Relative Performance Versus The US
Unhedged Yield Spreads Predict Hedged Relative Performance Versus The US
Unhedged Yield Spreads Predict Hedged Relative Performance Versus The US
For global fixed-income investors, Charts 12-14 present USD-hedged 10-year Chinese government yields versus the US and DM/DM ex-US, along with the historical relative return profile of USD-hedged Chinese bonds versus hedged and unhedged returns. In hedged space, Chinese 10-year government bond yields are modestly attractive: 2.2% versus 1.6% in the US and 1.8% in DM ex-US. China’s historically low yield beta to the overall level of global 10-year bond yields (Chart 15) suggests that Chinese yields should perform well in 2020 – a year where we expect global bond yields to drift higher as economic growth rebounds. Combined with relatively attractive valuation, this bodes well for the relative performance of Chinese debt versus DM equivalents. A low yield beta against a backdrop of drifting higher global yields implies that longer-maturity Chinese government bonds will outperform their DM equivalents. Chart 14Unhedged Yield Spreads Predict Hedged Relative Performance Versus DM
Unhedged Yield Spreads Predict Hedged Relative Performance Versus DM
Unhedged Yield Spreads Predict Hedged Relative Performance Versus DM
Chart 15China's Yield Beta Has Been Rising, But Is Still Japan-Like
China's Yield Beta Has Been Rising, But Is Still Japan-Like
China's Yield Beta Has Been Rising, But Is Still Japan-Like
We would also recommend longer-maturity Chinese government bonds in unhedged terms versus a USD-hedged global government bond portfolio. Chart 16 highlights that the relative return of this trade is strongly (negatively) linked to USD-CNY, and we expect further (albeit more modest) gains in RMB over the cyclical horizon. Chart 16Modest Further RMB Upside Means Unhedged Chinese Bonds Will Outperform
Modest Further RMB Upside Means Unhedged Chinese Bonds Will Outperform
Modest Further RMB Upside Means Unhedged Chinese Bonds Will Outperform
As a final point, investors should note that today’s report is part of a heightened focus on China’s fixed income market, in terms of both forecasting fixed income returns and analyzing the cyclical and structural implications of the increasing investability of China’s financial markets. More research on this topic is likely to come in 2020 and beyond: Stay Tuned! Jonathan LaBerge, CFA, Vice President Special Reports jonathanl@bcaresearch.com Footnotes 1 Please see US Bond Strategy Special Report "The Golden Rule Of Bond Investing," dated July 24, 2018, available at usbs.bcaresearch.com 2 Please see Global Fixed Income Strategy Special Report "The Global Golden Rule Of Bond Investing," dated September 25, 2018, available at gfis.bcaresearch.com 3 Please see China Investment Strategy Special Report "Seven Questions About Chinese Monetary Policy," dated February 22, 2018, available at cis.bcaresearch.com
Dear clients, Please note that in next week’s China Macro And Market Review, we will include a section explaining our view on the coronavirus outbreak and its economic as well as financial market implications. We maintain our overweight stance on both Chinese investable and A-share equities, over a tactical (0-3 months) and cyclical (6-12 months) time horizon. Please stay tuned. Jing Sima, China Strategist Highlights BCA’s “Golden Rule of Bond Investing” framework, which links developed economy government bond returns to central bank policy rate “surprises” versus market expectations, also works in China. The relationship between unexpected changes in China’s de facto short-term policy rate and government bond yields has been surprisingly strong over the past decade. Any additional easing by the PBoC this year is likely to be focused on reducing lending rates to the real economy, not interbank rates (which drive government bond yields). As such, yields at the short-end are likely to be flat until later this year at the earliest, whereas yields at the long-end are likely to move modestly higher, at most. The persistent historical gap between economic growth and bond yields in China makes it difficult to forecast the structural outlook for yields using conventional methods. To the extent that Chinese policymakers succeed at shifting the drivers of growth from investment to consumption, we believe that bond yields are more likely to structurally rise than fall. Over the coming 6-12 months, investors should underweight Chinese government bonds versus Chinese equities and onshore corporate bonds. Within a regional government bond portfolio, however, investors should overweight USD-hedged China versus US and developed markets ex-US, as well as in unhedged terms. Feature Last year’s inclusion of Chinese onshore government and policy bank bonds in the Bloomberg Barclays Global Aggregate Index was a significant milestone of China’s journey to internationalize its capital markets. Other bond benchmark providers have since followed suit, highlighting that the trend of increased passive exposure to Chinese assets is likely to continue. Over the past year, the bulk of the market discussion concerning the addition of China to the major bond indices has focused on estimating the size of potential capital inflows that could be triggered and the related impact on onshore bond yields. By contrast, comparatively little work has been done to analyze the core drivers of Chinese government bond yields, and how they compare to the factors that influence yields in the developed markets that dominate the bond indices. This Special Report attempts to fill a hole in the analysis of Chinese bonds. This Special Report attempts to fill that hole in the analysis of Chinese bonds. We look at the predictability of China’s government bond market through the lens of BCA’s “golden rule” framework, and find a surprisingly strong relationship between changes in China’s de facto short-term policy rate and government bond yields. We then present our cyclical (6-12 month) and secular outlooks for government yields given this relationship, and conclude by presenting four specific investment recommendations pertaining to China’s fixed-income market with two audiences in mind: mainland/onshore investors who are focused on returns in unhedged RMB terms, and global fixed-income investors who are primarily focused on hedged US-dollar regional bond exposure. The Golden Rule Of Bond Investing, With Chinese Characteristics In a July 2018 Special Report,1 BCA’s Chief US Bond Strategist, Ryan Swift, elegantly distilled the cyclical US government bond call into a simple question: During the next 12-months, will the Federal Reserve move interest rates by more or less than what is currently priced into the market? Chart 1The (US) Golden Rule Of Bond Investing In Practice
The (US) Golden Rule Of Bond Investing In Practice
The (US) Golden Rule Of Bond Investing In Practice
Ryan argued that a predictive framework for US Treasury returns built around the answer to this question has historically worked so well that it should be referred to as the “Golden Rule of bond investing” (Chart 1). In a follow-up report, our Global Fixed Income Strategy service confirmed that the Golden Rule also largely works in non-US developed market economies, with the exception of Japan due to the absence of any meaningful fluctuation in policy rates over the past two decades.2 The Golden Rule provides a very strong framework to aid fixed-income investors with their cyclical (i.e. 6-12 month) asset allocation decisions, by quantitatively linking government bond returns relative to cash – in other words, the excess return earned by taking duration risk - to policy rate “surprises” compared to what is discounted in shorter-term money markets. The practical application is that a decision to allocate to longer-maturity government bonds is reduced to a bet on whether a central bank will adjust policy rates by more or less than the market expects. The first question we address in this report is to what degree does the Golden Rule apply in China (in yield space rather than in return space), along with an explanation of any differences that may exist. However, we must first note why the Golden Rule of bond investing works, particularly in the US. The first reason is that there is a strong relationship between the US 3-month T-bill rate and Treasury yields of all other maturities. Conceptually, all fixed income investors have a choice when buying US government bonds: they can purchase a 3-month Treasury bill and simply perpetually roll over the position as it matures, or they can purchase a Treasury bond of a longer maturity. This means that yields on longer maturity Treasury bonds simply reflect investor expectations for the average 3-month T-bill rate over the life of the bond, plus some positive risk premium to compensate for the inherent uncertainty of the path and tendency of short-term yields. This helps explain the close link between cyclical changes in 3-month T-bill rates and yields on longer maturity Treasurys. Chart 2In The US, The 3-Month T-Bill Rate Perfectly Tracks The Fed Funds Rate
In The US, The 3-Month T-Bill Rate Perfectly Tracks The Fed Funds Rate
In The US, The 3-Month T-Bill Rate Perfectly Tracks The Fed Funds Rate
The second reason for the Golden Rule’s success is that there is a very tight relationship between the effective Fed funds rate and the 3-month T-bill rate. While it is the (higher) discount rate that is the theoretical no-arbitrage ceiling for the 3-month rate, in practice T-bill rates trade extremely close to the Fed funds rate (Chart 2). This means that Fed funds rate “surprises” (relative to traded market expectations) are akin to surprises in the 3-month rate, which in turn strongly influence the expected future path of short-term interest rates and thus yields on longer maturity Treasurys. In China, we noted in a February 2018 Special Report3 that the 7-day interbank repo rate is now the de jure short-term policy rate in China following the establishment of an interest rate corridor system in 2015. Chart 3 presents our first test of the Golden Rule in China (in yield space rather than in return space), by plotting the annual change in the level of Chinese government bond yields alongside the 7-day repo rate “surprise” over the past year from 2010 to the present. Here, we use the first principal component of zero coupon Chinese government bond yields to represent the average level of yields (rather than selecting a particular maturity), and we use the 12-month RMB swap rate (versus 7-day repo) to represent market expectations for the policy rate. The chart highlights that the fit is good, as measured by a 50% R-squared between the two series. However, deviations in the relationship do exist, with the most notable exception having occurred in 2017: Chinese government bond yields rose considerably more than what the annual surprise in the 7-day repo rate would have suggested. Chart 3In China, The Golden Rule Works Decently Well Using 7-Day Repo...
In China, The Golden Rule Works Decently Well Using 7-Day Repo...
In China, The Golden Rule Works Decently Well Using 7-Day Repo...
Chart 4...And Extremely Well Using 3-Month SHIBOR
...And Extremely Well Using 3-Month SHIBOR
...And Extremely Well Using 3-Month SHIBOR
Chart 4 helps resolve a good portion of the 2017 discrepancy, and clarifies the link between Chinese monetary policy and government bond yields. Chart 4 is similar to Chart 3, except that it replaces the 7-day repo rate surprise with that of 3-month SHIBOR (which trades very closely to the 3-month repo rate). The chart illustrates an even closer fit between the two series (with an R-squared close to 80%), and shows that the 3-month SHIBOR surprise does a meaningfully better job at explaining the 2017 rise in Chinese government bond yields. The Golden Rule of bond investing works surprisingly well in China. The fact that the annual surprise in 3-month SHIBOR has done a better job at predicting changes in bond yields over the past decade underscores that the 3-month repo rate is the de facto short-term policy rate in China, a point that we have made in several previous reports. We have noted that the spike in the 3-month/7-day repo rate spread that occurred in late-2016 and lasted until mid-2018 happened because of China’s crackdown on shadow banking activity. This crackdown caused a funding squeeze for China’s small & medium banks, which caused a material rise in lending rates and government bond yields. This episode highlights that future changes in the 3-month repo rate are likely to reflect both underlying changes in net liquidity provided to large commercial banks (measured by the 7-day repo rate), and any dislocations in the interbank market that have the potential to push up lending rates and government bond yields. Bottom Line: BCA’s “Golden Rule” framework, which links developed economy government bond returns to central bank policy rate “surprises” versus market expectations, works for China as well – using the correct measure of the PBOC policy rate. This provides a useful investment framework for Chinese government bonds, which are now significant part of major global bond market benchmarks. The Cyclical Outlook For Chinese Government Bond Yields Given the establishment of the relationship between Chinese short-term interbank rates and government bond yields detailed above, we are now able to more precisely discuss the likely cyclical trajectory of Chinese government bond yields as a function of Chinese monetary policy. Two opposing forces have the potential to affect China’s government bond market this year. The first, a stabilization and modest rebound in Chinese economic activity, may exert upward pressure on yields due to expectations of eventual policy tightening. The second, continued attempts by the PBoC to ease corporate lending rates, may exert downward pressure on yields as it will reflect not just easy but easier monetary conditions. Yields at the long-end are likely to move modestly higher this year, at most. For investors, the raises the obvious question of whether Chinese government bond yields are likely to move up, down, or trend sideways this year. In our view, yields at the short-end are likely to be flat until later this year at the earliest, whereas yields at the long-end are likely to move modestly higher, at most. Yields at the short-end of China’s government bond curve are likely to stay flat for most of this year. There are two reasons why yields at the short-end of China’s government bond curve are likely to stay flat for most of this year. The first is that the PBoC is generally a reactive central bank and has historically lagged a pickup in economic activity, as illustrated in Chart 5. The chart shows the historical path of 3-month SHIBOR in the year following a bottom in economic activity in 2009, 2012, and 2015, and makes it clear that there has been no precedent for a significant rise in interbank rates in the first nine months of an economic recovery. The 2012 episode did see a very sharp rise in 3-month SHIBOR once the PBoC shifted into tightening mode, but we doubt that this experience will be repeated again unless economic growth accelerates much more aggressively than we expect. The second reason why we expect yields at the short-end of the curve to remain muted this year is because any additional easing by the PBoC is likely to be focused on reducing corporate lending rates, not interbank rates. Chart 6 highlights that while there is a strong correlation between changes in Chinese government bond yields and average lending rates in the economy, the former leads the latter. In the past, this relationship has existed because changes in interbank rates have coincided with reductions in the now obsolete benchmark lending rate, with the former usually occurring earlier than the latter. But in a scenario where the PBoC reduces the loan prime rate (LPR) and keeps net banking sector liquidity roughly constant, the extremely tight relationship shown in Chart 4 suggests that short-term bond yields are unlikely to be affected by a reduction in lending rates. Any meaningful decline in short-term yields below short-term interbank rates would simply prompt banks to stop buying these bonds. Chart 5The PBoC Is Generally A Reactive Central Bank
The PBoC Is Generally A Reactive Central Bank
The PBoC Is Generally A Reactive Central Bank
Chart 6Average Lending Rates Lag Short-Term Bond Yields
Average Lending Rates Lag Short-Term Bond Yields
Average Lending Rates Lag Short-Term Bond Yields
Chart 7China's Yield Curve Is Generally Pro-Cyclical
China's Yield Curve Is Generally Pro-Cyclical
China's Yield Curve Is Generally Pro-Cyclical
Additional easing by the PBoC does have the potential to impact the long-end of the government bond curve if investors view these actions as a sign that interbank rates will remain low for some time. This view is reinforced by the fact that China’s yield curve is not particularly flat, and thus has room to move lower. However, Chart 7 also shows that China’s yield curve, defined here as the second principal component of zero coupon Chinese government bond yields, is positively correlated with the relative performance of investable Chinese equities. This suggests that there is a procyclical element to the curve. We suspect that this procyclical element will dominate a potential decline in expectations for future short-term interest rates, but that yields at the long-end are likely to move modestly higher this year, at most. Bottom Line: Any additional easing by the PBoC this year is likely to be focused on reducing lending rates to the real economy, not interbank rates (which drive government bond yields). As such, yields at the short-end are likely to be flat until later this year at the earliest, whereas yields at the long-end are likely to move modestly higher, at most. The Secular Outlook For Chinese Government Bond Yields A common approach to forecasting the likely structural trend for nominal government bond yields is to estimate the trajectory of real long-term potential output growth and to add the monetary authority’s inflation target. This framework is based on the idea that interest rates are in equilibrium when the cost of borrowing is roughly equal to nominal income growth, a condition that results in no change in the burden to service existing debt. Chart 8China's Potential Growth Is Likely To Trend Lower...
China's Potential Growth Is Likely To Trend Lower...
China's Potential Growth Is Likely To Trend Lower...
Based on this framework, we would expect Chinese government bond yields to trend down over time, or possibly flat if the PBoC were to tolerate higher inflation over the coming decade. Chart 8 illustrates the IMF’s forecast of falling real potential growth in China over the coming several years, which is consistent with a shift in the composition of growth from investment to consumption as well as China’s looming demographic crisis. But Chart 9highlights an obvious problem with applying this framework to forecast the secular trend in Chinese government bond yields: over the past decade, yields have persistently averaged below actual nominal GDP growth, both in China and in the developed world. In the latter case, it is an open question whether this will continue to be true in the future, but in China’s case it is clear that government bond yields have little connection (in magnitude) to the pace of GDP growth. This reflects the longstanding strategy of Chinese policymakers to promote investment via persistently low interest rates, as has occurred in other manufacturing and export-oriented Asian economies (Chart 10). Chart 9...But Bond Yields Are Well Below GDP Growth, Just Like In Developed Markets
...But Bond Yields Are Well Below GDP Growth, Just Like In Developed Markets
...But Bond Yields Are Well Below GDP Growth, Just Like In Developed Markets
Chart 10In Industrial Asian Economies, Low Bond Yields Are A Policy Choice
In Industrial Asian Economies, Low Bond Yields Are A Policy Choice
In Industrial Asian Economies, Low Bond Yields Are A Policy Choice
The persistent historical gap between economic growth and bond yields in China makes it difficult to forecast the structural outlook for yields using conventional methods, and largely limits us to inference. To the extent that Chinese policymakers succeed at shifting the drivers of growth from investment to consumption, bond yields are more likely to rise than fall over time. This is because as long as interest rates remain well below the pace of income growth, the incentive to excessively borrow (and invest) is likely to persist. Chart 11China Needs Higher Interest Rates, But Only To A Point
China Needs Higher Interest Rates, But Only To A Point
China Needs Higher Interest Rates, But Only To A Point
However, even in a scenario where Chinese government bond yields structurally trend higher, we expect the rise to be modest. Chart 11 highlights that China’s “private sector” debt service ratio is extremely elevated, underscoring that the country’s ability to tolerate significantly higher bond yields is not strong. In addition, since 2015, China’s debt service ratio has been mostly flat despite rising a rising debt-to-GDP ratio, which has been achieved through lower short-term interest rates. To the extent that policymakers fail to make meaningful progress in shifting China’s growth drivers away from investment over the coming few years, lower (potentially sharply lower) bond yields would appear to be all but inevitable to cope with what would become a permanently growing drag on economic activity from the servicing of debt. For now, we would characterize this scenario as a risk to our base case view, but it is a risk that we will be closely monitoring over the coming years. Bottom Line: The persistent gap between Chinese nominal GDP growth and government bond yields is likely contributing to the problem of excessive leveraging. To the extent that Chinese policymakers succeed at shifting the drivers of growth from investment to consumption, bond yields are more likely to structurally rise than fall. Investment Conclusions Our analysis above points to four recommendations for investors over the coming year: Overweight Chinese stocks versus Chinese government bonds in RMB and USD terms Overweight Chinese onshore corporate bonds versus duration-matched Chinese government bonds in RMB terms Overweight 7-10 year USD-hedged Chinese government bonds versus their US and developed market (DM) counterparts For offshore US dollar-based investors, long 7-10 year Chinese government bonds in unhedged terms Regarding the first two recommendations, our view that yields are likely to be flat at the short-end and modestly higher at the long-end suggests that investors can expect total returns on the order of 2-3% from Chinese government bonds this year. Barring a major and lasting economic slowdown from the 2019-nCoV outbreak, we expect Chinese domestic and investable equities to outperform government securities over the coming 6-12 months. Onshore corporate bonds have a similar outlook: onshore spreads are pricing in (massively) higher default losses than we believe is warranted, meaning that they will outperform duration-matched government equivalents without any changes in yield. Chart 12Within Global Fixed-Income, Hedged Chinese 10-Year Yields Are Relatively Attractive
Within Global Fixed-Income, Hedged Chinese 10-Year Yields Are Relatively Attractive
Within Global Fixed-Income, Hedged Chinese 10-Year Yields Are Relatively Attractive
Chart 13Unhedged Yield Spreads Predict Hedged Relative Performance Versus The US
Unhedged Yield Spreads Predict Hedged Relative Performance Versus The US
Unhedged Yield Spreads Predict Hedged Relative Performance Versus The US
For global fixed-income investors, Charts 12-14 present USD-hedged 10-year Chinese government yields versus the US and DM/DM ex-US, along with the historical relative return profile of USD-hedged Chinese bonds versus hedged and unhedged returns. In hedged space, Chinese 10-year government bond yields are modestly attractive: 2.2% versus 1.6% in the US and 1.8% in DM ex-US. China’s historically low yield beta to the overall level of global 10-year bond yields (Chart 15) suggests that Chinese yields should perform well in 2020 – a year where we expect global bond yields to drift higher as economic growth rebounds. Combined with relatively attractive valuation, this bodes well for the relative performance of Chinese debt versus DM equivalents. A low yield beta against a backdrop of drifting higher global yields implies that longer-maturity Chinese government bonds will outperform their DM equivalents. Chart 14Unhedged Yield Spreads Predict Hedged Relative Performance Versus DM
Unhedged Yield Spreads Predict Hedged Relative Performance Versus DM
Unhedged Yield Spreads Predict Hedged Relative Performance Versus DM
Chart 15China's Yield Beta Has Been Rising, But Is Still Japan-Like
China's Yield Beta Has Been Rising, But Is Still Japan-Like
China's Yield Beta Has Been Rising, But Is Still Japan-Like
We would also recommend longer-maturity Chinese government bonds in unhedged terms versus a USD-hedged global government bond portfolio. Chart 16 highlights that the relative return of this trade is strongly (negatively) linked to USD-CNY, and we expect further (albeit more modest) gains in RMB over the cyclical horizon. Chart 16Modest Further RMB Upside Means Unhedged Chinese Bonds Will Outperform
Modest Further RMB Upside Means Unhedged Chinese Bonds Will Outperform
Modest Further RMB Upside Means Unhedged Chinese Bonds Will Outperform
As a final point, investors should note that today’s report is part of a heightened focus on China’s fixed income market, in terms of both forecasting fixed income returns and analyzing the cyclical and structural implications of the increasing investability of China’s financial markets. More research on this topic is likely to come in 2020 and beyond: Stay Tuned! Jonathan LaBerge, CFA, Vice President Special Reports jonathanl@bcaresearch.com Footnotes 1 Please see US Bond Strategy Special Report "The Golden Rule Of Bond Investing," dated July 24, 2018, available at usbs.bcaresearch.com 2 Please see Global Fixed Income Strategy Special Report "The Global Golden Rule Of Bond Investing," dated September 25, 2018, available at gfis.bcaresearch.com 3 Please see China Investment Strategy Special Report "Seven Questions About Chinese Monetary Policy," dated February 22, 2018, available at cis.bcaresearch.com Cyclical Investment Stance Equity Sector Recommendations
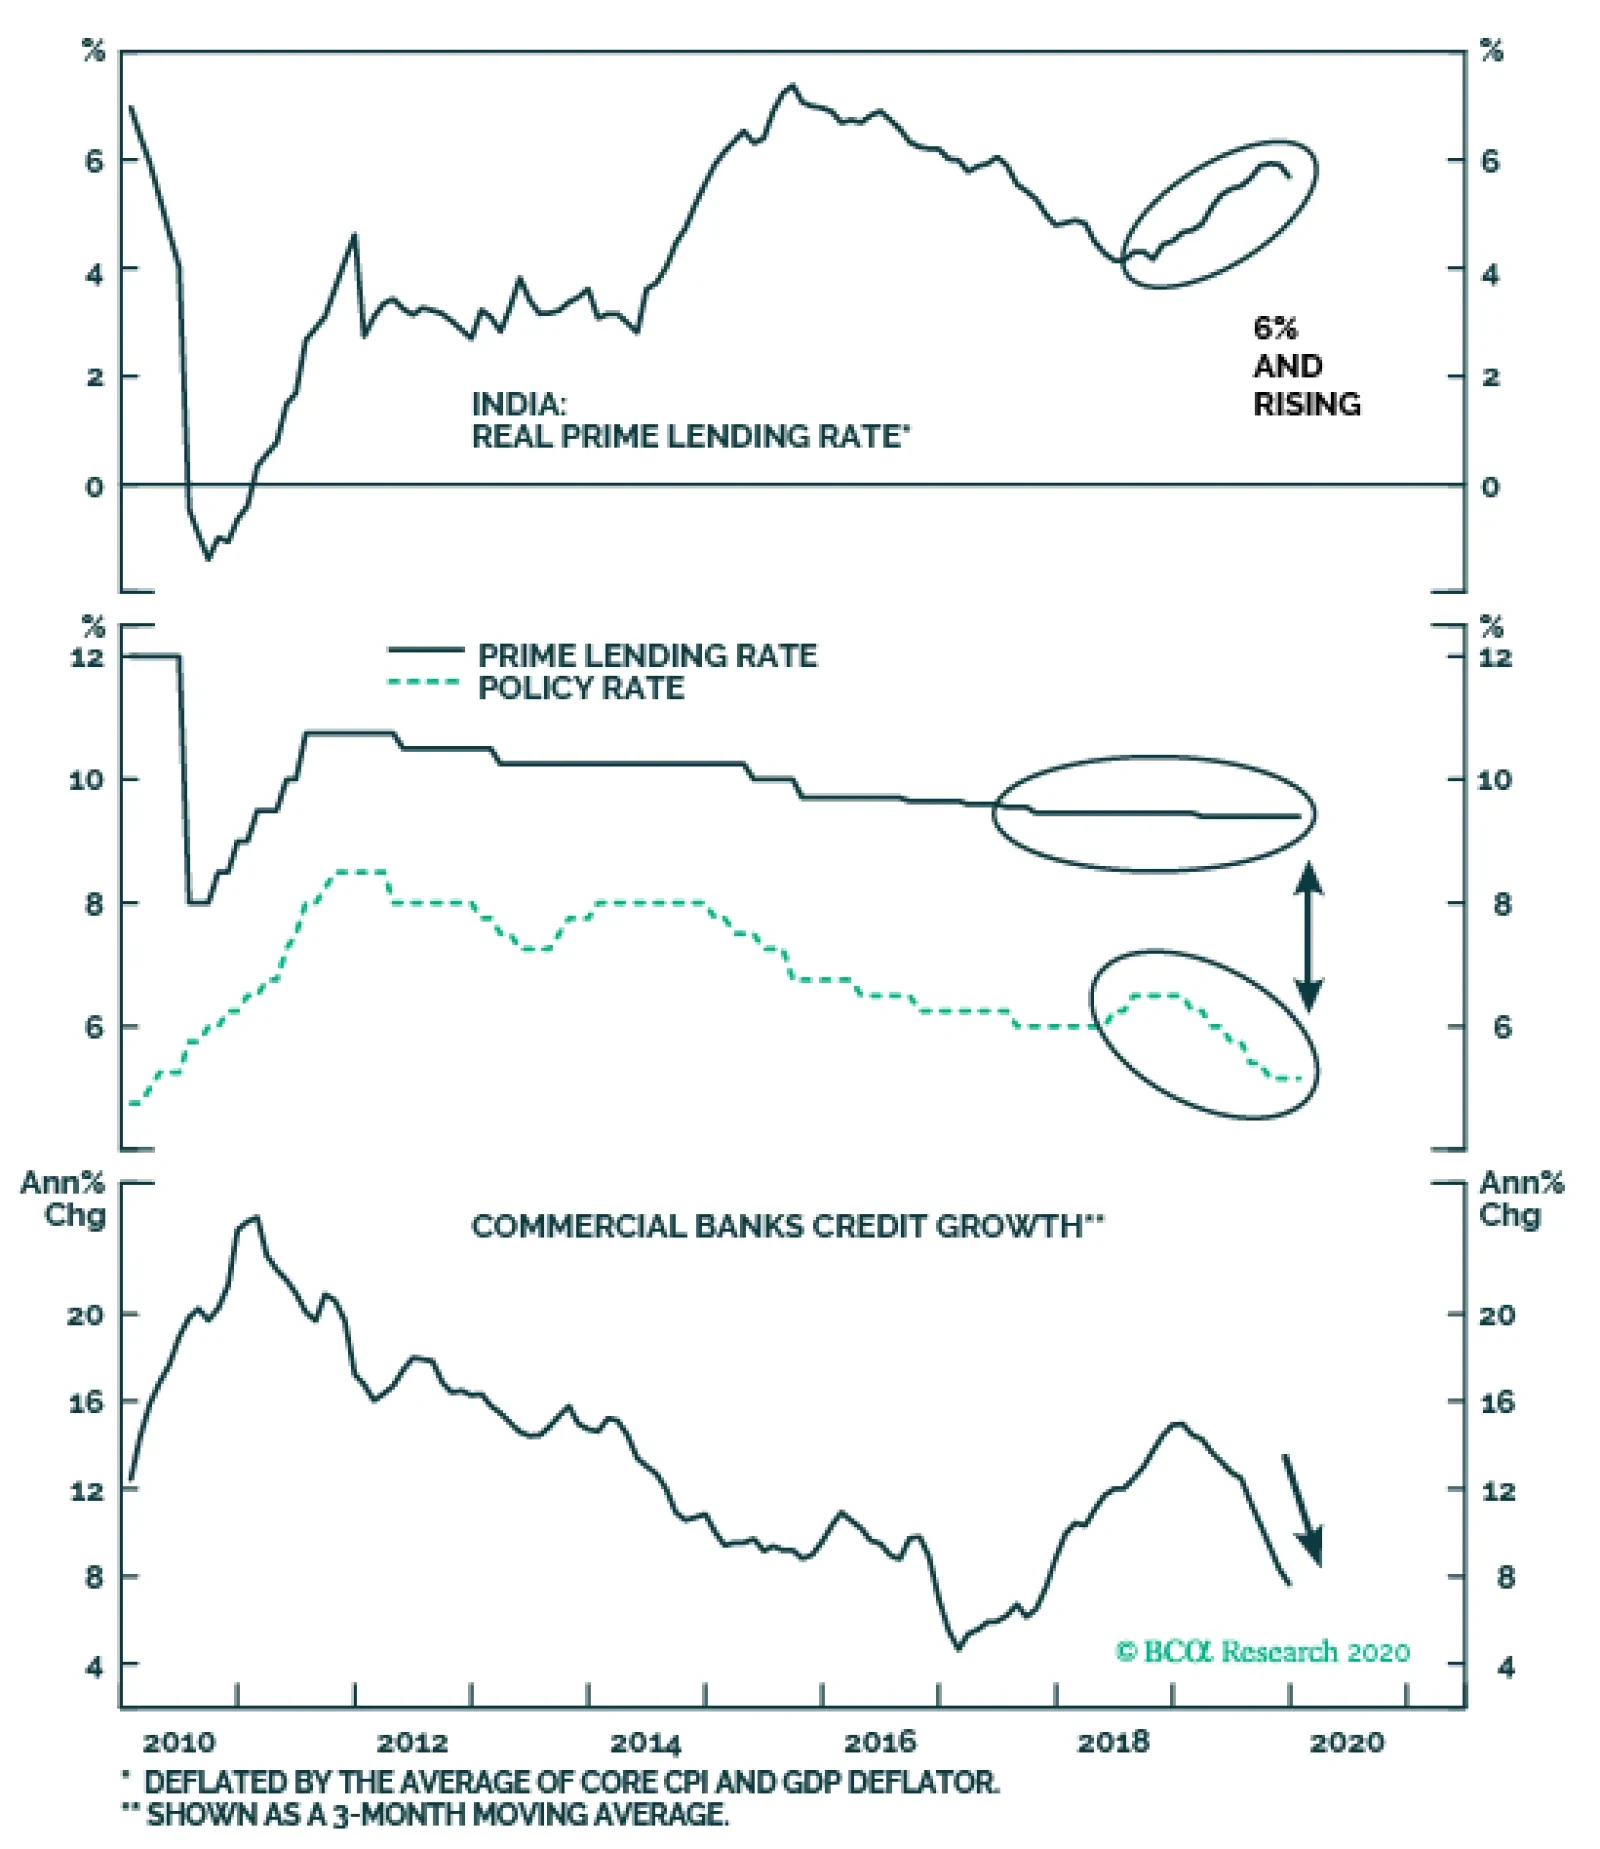
The entire Indian economy is suffering from high real borrowing costs. The monetary policy transmission mechanism has not been working effectively in India. Even though the central bank has cut its policy rate by 135 basis points in 2019, the prime lending…
Highlights Most central banks still consider economic risks asymmetrical to the downside. This means that even if global growth rebounds in earnest, policy is likely to stay pat over the next three to six months. The conclusion is that relative growth fundamentals rather than central bank policy will likely drive FX price action in the next few months. Our bias remains that the growth impulse will be strongest outside the US during the first half of this year. Stay short the DXY index. The BoJ’s inaction this week makes long yen bets cheap insurance against a rise in FX volatility. Remain short USD/JPY and go short CHF/JPY. The pound remains a buy on dips but will likely underperform the euro over the next few months. EUR/GBP should touch 0.88. The BoC kept rates on hold, but erred on the dovish side, in line with our expectations. Stay short CAD/NOK and long AUD/CAD. We were stopped out of our long NOK/SEK trade for a profit of 1.8%. We will look to rebuy the cross at lower levels. Feature Chart I-1Currency Markets Have Priced In A Benign Recovery
Currency Markets Have Priced In A Benign Recovery
Currency Markets Have Priced In A Benign Recovery
The powerful bounce in global equity markets since the August lows has pushed many stock indices into overbought territory. Chart I-1 shows that the rise in global stocks has already discounted an improvement in global manufacturing in order of magnitude similar to the 2012 and 2016 episodes. However, currency markets have been discounting a much more benign outcome (bottom panel). The divergence between currency and equity performance is a marked change from what has prevailed during past cycles. For example, trough to peak, AUD/JPY, a key barometer of greed versus fear in currency markets, appreciated 40% during the 2012 episode, and 25% in 2016-2017, along with rising equity prices. The performance of even more high-octane currency pairs such as the RUB/JPY, the ZAR/JPY, or even the BRL/JPY, was explosive. More muted currency action this time around therefore calls into question the durability of this recovery. Perhaps given that equities are long-duration assets, it is quite plausible that the drop in interest rates in 2019 has increased their relative appeal, boosting nominal values. While that makes sense, most bond markets have also seen higher yields over the past few months, making this explanation questionable. Alternatively, the easing in trade tensions and/or the Federal Reserve’s liquidity injections may have rekindled animal spirits among domestic investors. Or perhaps, a synchronized recovery has narrowed G10 growth differentials, muting currency performance in the process but boosting share prices. The rise in global stocks has already discounted an improvement in global manufacturing. However, currency markets have been discounting a much more benign outcome. Either way, the resolution to this dissonance will be either through marked improvement in global economic data in the coming months (which will support pro-cyclical currencies), or a period of indigestion for stock markets (which will lift volatility) – or a combination of both. At a minimum, this suggests tweaking currency portfolios in anticipation of these dynamics. On Volatility And The Dollar Everyone understands that currency markets are about relative trends. Therefore, the implicit assumption that the dollar will weaken as global growth picks up is that the epicenter of this recovery will be outside the US. Chart I-2 shows that economic data is not yet surprising to the upside outside the US, even though there has been marked improvement on a rate-of-change basis. Beneath the surface, the strongest data surprises have been in the euro area, Switzerland, New Zealand and Australia, while disappointments have been in Canada and the UK. In hindsight, the chart also highlights why the Canadian dollar was the best performing G10 currency in 2019, while the Swedish krona was the weakest. Chart I-2Growth Dispersion Has Fallen
Growth Dispersion Has Fallen
Growth Dispersion Has Fallen
The drop in economic dispersion has pushed currency volatility near record lows (Chart I-3). Every seasoned investor does and should pay attention to low volatility. This is because what destroys portfolios is not exuberance, but complacency. This might sound like a tautology, but during the last three episodes of volatility dropping to these levels, the dollar soared and pro-cyclical currencies suffered severe losses. Everyone remembers 1997-1998, 2007-2008 and 2014-2015. Will this time be the same? While a rise in volatility is usually associated with a higher dollar, there are three key differences this time around. First, real rates turned positive in the US relative to its G10 counterparts in 2014 (Chart I-4). This meant the US dollar, which has typically been a funding currency (not least because it is a reserve currency), became the object of carry trades. It is a fair contention that any capital that wanted to find its way into US Treasurys has had more than five years of positive real carry to do so. With real relative yields in the US now rolling over, which way will capital gravitate? Chart I-3Volatility Near Record Lows
Volatility Near Record Lows
Volatility Near Record Lows
Chart I-4Real Rates Lower In The US
Real Rates Lower In The US
Real Rates Lower In The US
The dollar has been in a bull market since 2011, which has shifted valuations towards expensive quartiles. This is a key difference from previous low-volatility episodes when the dollar was much earlier into bull-market territory (Chart I-5). The dollar tends to run in long cycles, and a spike in volatility can either mark the beginning or the end of a cycle. As we have emphasized numerous times in previous reports, being long the US dollar is a consensus trade. Our primary basis for this is CFTC positioning data. However, a timelier leading indicator to watch is the gold-to-bond ratio. Currencies are about confidence, and a key measure of confidence in the US dollar is the total return in the US 10-year Treasury compared to gold bullion, which has collapsed (Chart I-6). The budget deficit in the US is about to explode, while it was low and falling during prior dollar riot points. Chart I-5The Dollar Is Expensive
The Dollar Is Expensive
The Dollar Is Expensive
Chart I-6Tug Of War Between US Bonds And Gold
Tug Of War Between US Bonds And Gold
Tug Of War Between US Bonds And Gold
More importantly, currency markets are likely to gyrate with relative fundamentals. The slowdown in the global economy was driven by the manufacturing sector, so it is fair to assume that this is the part of the economy that is ripe for mean reversion. Historically, cyclical swings in most economies tend to be driven by manufacturing and exports rather than services (and consumption). More specifically, the currencies that have borne the brunt of the manufacturing slowdown should logically be the ones to experience the quickest reversals. This is already being manifested in a very steep rise in their bond yields vis-à-vis those in the US. For example, yields in Norway, Sweden, Switzerland and Japan have risen significantly versus those in the US since the bottom. A synchronized recovery in global growth will go a long way in further eroding the US’ yield advantage. Currencies are about confidence, and a key measure of confidence in the US dollar is the total return in the US 10-year Treasury compared to gold bullion. Bottom Line: Remain short the DXY index with an initial target of 90 and a stop loss at 100. The Yen As Portfolio Insurance Should our thesis that the dollar is in a downtrend for 2020 be correct, it is unlikely to occur in a straight line. This argues for having some portfolio insurance. The Bank of Japan’s inaction this week may have been a red herring, since one of the most potent moves in asset markets in recent months has been the +130-basis-point move in favor of Japanese yields (Chart I-7). The gap between the USD/JPY and real rates has opened up a rare arbitrage opportunity. Should a selloff in global risk assets materialize, the yen will strengthen. On the other hand, if global growth does eventually accelerate, the yen could weaken on its crosses but strengthen vis-à-vis the dollar. This keeps short USD/JPY bets in an enviable “heads I win, tails I do not lose too much” position. The rise in Japanese yields has been driven by three key pivotal developments: For most of the past five years, the BoJ was one of the most aggressive central banks in terms of asset purchases. This was a huge catalyst for a downturn in the trade-weighted yen (Chart I-8). With a renewed expansion in the Fed’s balance sheet, monetary policy is tightening on a relative basis in Japan. Total annual asset purchases by the BoJ are currently running at about ¥20 trillion, while JGB purchases are running at ¥15 trillion. This is a far cry from the central bank’s soft target of ¥80 trillion, and unlikely to change anytime soon. Chart I-7Japanese Bond Yields Have Surged
Japanese Bond Yields Have Surged
Japanese Bond Yields Have Surged
Chart I-8The Yen And QE
The Yen And QE
The Yen And QE
Movements in the yen are as influenced by external conditions as what is happening domestically, given Japan’s huge export sector. Credit default swap spreads of cyclical sectors are collapsing to new lows, symptomatic of an improving profit outlook (Chart I-9). This suggests it is the growth component driving Japanese yields higher (Japanese CPI swaps have indeed been flat). This also mirrors the recent outperformance of Asian cyclical sectors relative to defensive ones. The Abe government announced a huge fiscal package last year, in part driven by the disastrous typhoons as well as the upcoming Olympics. This allowed the BoJ to upgrade its growth forecasts in its latest policy minutes. The relative performance of construction and engineering stocks are an important barometer for when the funds are flowing into the economy (Chart I-10). Chart I-9Default Risk Easing In Japan
Default Risk Easing In Japan
Default Risk Easing In Japan
Chart I-10Fiscal Stimulus And Construction Stocks
Fiscal Stimulus And Construction Stocks
Fiscal Stimulus And Construction Stocks
As a defensive currency, the yen tends to weaken as global growth improves, given it is usually used to fund carry trades. That said, our contention is that the yen will surely weaken at the crosses, but could still strengthen versus the dollar. As mentioned above, one catalyst is the divergence from the traditional relationship with real rates. More importantly, the USD/JPY and the DXY tend to have a positive correlation, because the dollar drives the yen most of the time. Meanwhile, net short positioning in the yen versus the dollar makes it attractive from a contrarian standpoint (Chart I-11). Given extremely low volatility, this places short USD/JPY bets as an attractive vehicle to play a rise in volatility. Chart I-11Investors Are Short The Yen
Investors Are Short The Yen
Investors Are Short The Yen
More conservative investors could go short CHF/JPY. The recent rise in the Swiss franc threatens the nascent recovery in inflation (Chart I-12), while weakness in the Japanese yen will help lift domestic tradeable goods prices. This puts more pressure on the Swiss National Bank rather than the BoJ. Meanwhile, as a safe haven, the yen is cheaper than the franc. This is confirmed by many of our in-house models. In simple terms, relative inflation with the US has been lower in Japan over the last several decades, but the franc has been stronger. In simple terms, relative inflation with the US has been lower in Japan over the last several decades, but the franc has been stronger (Chart I-13). Meanwhile, over the last two years, a rise in volatility has benefited the yen more than the franc. Chart I-12Strong Franc Is A Headwind For Swiss Inflation
Strong Franc Is A Headwind For Swiss Inflation
Strong Franc Is A Headwind For Swiss Inflation
Chart I-13The Yen Is Cheaper ##br##Insurance
The Yen Is Cheaper Insurance
The Yen Is Cheaper Insurance
Bottom Line: The yen is the most attractive safe-haven currency at the moment. Remain short USD/JPY and sell CHF/JPY. Housekeeping We were stopped out of our long NOK/SEK trade for a profit of 1.8%. We will look to rebuy this cross at lower levels. The trade is mostly about carry, and we are both positive on the NOK and SEK. This makes market timing important. NOK/SEK at 1.04 will be attractive. There were no new insights from the Norges bank this week, in the context of all the central bank meetings. We will also be looking to opportunistically buy the pound, but buying EUR or GBP volatility might be a better bet. For now, despite the robust labor report, economic surprises in the UK remain negative (Chart I-14). Stay tuned. Chart I-14GBP Is Vulnerable
GBP Is Vulnerable
GBP Is Vulnerable
Chester Ntonifor Foreign Exchange Strategist chestern@bcaresearch.com Currencies U.S. Dollar Chart II-1USD Technicals 1
USD Technicals 1
USD Technicals 1
Chart II-2USD Technicals 2
USD Technicals 2
USD Technicals 2
Recent data in the US have been mixed: Industrial production fell by 1% year-on-year in December. The preliminary Michigan consumer sentiment index fell slightly to 99.1 in January. MBA mortgage applications fell by 1.2% for the week ended January 17th. However, existing home sales surprised to the upside, rising 3.6% month-on-month in December. Chicago Fed national activity index fell to -0.35 from 0.41 in December. Initial jobless claims increased to 211K for the week ended January 17th, better than expectations. The DXY index increased by 0.4% this week. There are growing concerns over whether China's coronavirus would significantly drag down global growth. While this is a hiccup in the short term, we remain positive and believe that global growth will accelerate this year on easy financial conditions and faded trade war risks. Report Links: On Oil, Growth And The Dollar - January 10, 2020 Updating Our Balance Of Payments Monitor - November 29, 2019 Place A Limit Sell On DXY At 100 - November 15, 2019 The Euro Chart II-3EUR Technicals 1
EUR Technicals 1
EUR Technicals 1
Chart II-4EUR Technicals 2
EUR Technicals 2
EUR Technicals 2
Recent data in the euro area have been mostly positive: The current account balance came in at €33.9 billion in November. Headline and core inflation were both unchanged at 1.3% year-on-year respectively in December. The ZEW economic sentiment survey soared to 25.6 from 11.2 in January. The euro fell by 0.8% against the US dollar this week. On Thursday, the ECB maintained interest rates at -0.5%. The key takeaway from the ECB is that they are grappling with a review of their monetary policy objective in a manner that might increase accommodation. A switch to an explicit 2% inflation target and/or including a climate change objective into quantitative easing decisions heralds a much more dovish ECB. We are tightening our stop on long EUR/CAD to 1.42. Report Links: Updating Our Balance Of Payments Monitor - November 29, 2019 On Money Velocity, EUR/USD And Silver - October 11, 2019 A Few Trade Ideas - Sept. 27, 2019 Japanese Yen Chart II-5JPY Technicals 1
JPY Technicals 1
JPY Technicals 1
Chart II-6JPY Technicals 2
JPY Technicals 2
JPY Technicals 2
Recent data in Japan have been negative: Industrial production fell by 8.2% year-on-year in November. The trade deficit widened to ¥152.5 billion in December. Imports and exports both fell by 4.9% and 6.3% year-on-year, respectively. All industry activity index increased by 0.9% month-on-month in November. Both the coincident index and the leading economic index fell to 94.7 and 90.8, respectively in November. The Japanese yen appreciated by 0.3% against the US dollar this week. The BoJ kept interest rates unchanged, in line with expectations. More importantly, the outlook report revised the growth forecast upward to 0.9% from 0.7% for the fiscal year 2020. Moreover, the BoJ revised down the inflation forecast by 10 bps due to lower crude oil prices. Please refer to our front section this week for a more in-depth analysis on the Japanese yen. Report Links: Updating Our Balance Of Payments Monitor - November 29, 2019 Signposts For A Reversal In The Dollar Bull Market - November 1, 2019 A Few Trade Ideas - Sept. 27, 2019 British Pound Chart II-7GBP Technicals 1
GBP Technicals 1
GBP Technicals 1
Chart II-8GBP Technicals 2
GBP Technicals 2
GBP Technicals 2
Recent data in the UK have been positive: Retail sales grew by 0.9% year-on-year in December. The Rightmove house price index increased by 2.7% year-on-year in January. The ILO unemployment rate was unchanged at 3.8% in November. Average earnings grew by 3.2% year-on-year in November. This followed a 3-month improvement in employment of 208K, after what had been a dismal employment report for most of 2019. The British pound appreciated by 0.7% against the US dollar this week. The biggest volatility in European currencies in the next few weeks is likely to emerge in the EUR/GBP cross. European economic data has had the best positive surprises in the last few weeks, in part due to base effects. However, the ECB’s transcript this week suggests leaning against any currency strength. In the UK, the pound will still trade partly on politics for now. Buying GBP and EUR volatility looks like a good bet. Report Links: Updating Our Balance Of Payments Monitor - November 29, 2019 A Few Trade Ideas - Sept. 27, 2019 United Kingdom: Cyclical Slowdown Or Structural Malaise? - Sept. 20, 2019 Australian Dollar Chart II-9AUD Technicals 1
AUD Technicals 1
AUD Technicals 1
Chart II-10AUD Technicals 2
AUD Technicals 2
AUD Technicals 2
Recent data in Australia have been positive: The Westpac consumer confidence index fell by 1.8% in January. Consumer inflation expectations increased to 4.7% from 4% in January. 28.9K new jobs were created in December, above consensus. This was a combination of 29.2K part-time jobs but a loss of 0.3K full-time jobs. The participation rate was unchanged at 66% in December, while the unemployment rate fell further to 5.1%. The Australian dollar fell by 0.6% against the US dollar this week. The positive jobs report placed a bid under AUD, but that quickly dissipated as the coronavirus scare started to dominate headlines. We discussed AUD in depth last week and are buyers at 68 cents. Our primary rationale is that this is a potent contrarian bet. Report Links: On AUD And CNY - January 17, 2020 Updating Our Balance Of Payments Monitor - November 29, 2019 A Contrarian View On The Australian Dollar - May 24, 2019 New Zealand Dollar Chart II-11NZD Technicals 1
NZD Technicals 1
NZD Technicals 1
Chart II-12NZD Technicals 2
NZD Technicals 2
NZD Technicals 2
Recent data in New Zealand have been negative: Visitor arrivals fell by 3.5% year-on-year in November. Net migration fell to 2610 from 3400 in November. The performance services index fell to 51.9 from 52.9 in December. The New Zealand dollar fell by 0.5% against the US dollar this week. While we believe that the kiwi dollar will outperform the US dollar this year amid improving global growth, domestic constraints including decreasing net migration might limit upside potential. Stay long AUD/NZD and SEK/NZD. Report Links: Updating Our Balance Of Payments Monitor - November 29, 2019 Place A Limit Sell On DXY At 100 - November 15, 2019 USD/CNY And Market Turbulence - August 9, 2019 Canadian Dollar Chart II-13CAD Technicals 1
CAD Technicals 1
CAD Technicals 1
Chart II-14CAD Technicals 2
CAD Technicals 2
CAD Technicals 2
Recent data in Canada have been soft: Manufacturing sales fell by 0.6% month-on-month in November. Headline inflation was unchanged at 2.2% year-on-year in December. Core inflation however, fell to 1.7% from 1.9% in December. New house prices grew by 0.1% year-on-year in December. The Canadian dollar fell by 0.8% against the US dollar this week. On Wednesday, the BoC decided to put interest rates on hold, while opening the door for possible rate cuts later this year if the Canadian data disappointed. In short, like most other central banks, the BoC is data dependent. Our story for CAD is simple – if the epicenter of a growth rebound is outside the US, CAD will underperform its antipodean counterparts. Stay long AUD/CAD. Report Links: The Loonie: Upside Versus The Dollar, But Downside At The Crosses Updating Our Balance Of Payments Monitor - November 29, 2019 Making Money With Petrocurrencies - November 8, 2019 Swiss Franc Chart II-15CHF Technicals 1
CHF Technicals 1
CHF Technicals 1
Chart II-16CHF Technicals 2
CHF Technicals 2
CHF Technicals 2
There have been scant data from Switzerland this week: Producer prices fell by 1.7% year-on-year in December, compared with a decrease of 2.5% the previous month. Money supply (M3) grew by 0.7% year-on-year in December. The Swiss franc has been more or less flat against the US dollar this week. We continue to favor the Swiss franc as global risks persist, including concerns about the coronavirus. However, as discussed in the front section of this report, the yen is a better hedge than the franc at the current juncture. Report Links: Updating Our Balance Of Payments Monitor - November 29, 2019 Notes On The SNB - October 4, 2019 What To Do About The Swiss Franc? - May 17, 2019 Norwegian Krone Chart II-17NOK Technicals 1
NOK Technicals 1
NOK Technicals 1
Chart II-18NOK Technicals 2
NOK Technicals 2
NOK Technicals 2
There was scant data out of Norway this week: The Labor Force Survey recorded an increase in the unemployment rate to 4% in November. The Norwegian krone fell by 1.3% against the US dollar this week amid lower energy prices. On Thursday, the Norges Bank kept interest rates on hold at 1.5%, as widely expected. Moreover, the Bank Governor Øystein Olsen said that "The Committee’s current assessment of the outlook and the balance of risks suggests that the policy rate will most likely remain at the present level in the coming period," implying no change in the policy rate in the near-term. This suggests that going forward, relative fundamentals rather than policy decisions will dictate NOK’s path. Our bias is that a valuation cushion offers a margin of safety for long NOK positions. Remain short USD/NOK and CAD/NOK. Report Links: On Oil, Growth And The Dollar - January 10, 2020 Updating Our Balance Of Payments Monitor - November 29, 2019 Making Money With Petrocurrencies - November 8, 2019 Swedish Krona Chart II-19SEK Technicals 1
SEK Technicals 1
SEK Technicals 1
Chart II-20SEK Technicals 2
SEK Technicals 2
SEK Technicals 2
There was scant data out of Sweden this week: After rising from 6% to 6.8% in November, the unemployment rate fell back to 6% in December. The Swedish krona fell by 0.2% against the US dollar this week. Going forward, improving global growth, diminished trade tensions, and fewer concerns about a near-term recession all underpin the Swedish economy and the krona. SEK is the most potent G10 cross to play a global manufacturing rebound. Report Links: Updating Our Balance Of Payments Monitor - November 29, 2019 Where To Next For The US Dollar? - June 7, 2019 Balance Of Payments Across The G10 - February 15, 2019 Trades & Forecasts Forecast Summary Core Portfolio Tactical Trades Limit Orders Closed Trades
Today, the major development of the ECB’s policy meeting was the announcement of the new monetary strategy policy review. Following the press conference where the program was announced, the euro fell 0.6% and bunds outperformed Treasury Notes. The policy…
As expected, the BoC kept interest rates at 1.75%. While the BoC highlighted that the economy possesses more slack than originally estimated, it refrained from committing policy to any path this year. After all, while the Canadian economy continues to suffer…
As tensions from the US-China trade war abate, investors are starting to refocus on economic fundamentals. This year, Chinese policymakers will maintain their tight grip on local government spending and bank lending, and will continue to fine-tune policies…
Highlights The recently signed Phase One deal is positive for China and global equity markets as it brings a temporary truce to the trade war. However, China is unlikely to change its current policy trajectory to create additional domestic demand to consume $200 billion in new imports from the US. China is likely to meet the commitment only half way in the next two years, and meet the 2020 import target from the US by a redistribution of its purchases overseas. The RMB will modestly appreciate in the next three to six months. On the monetary policy front, there is no sign of further monetary easing from the PBoC. We continue to recommend an overweight stance towards Chinese stocks in the next six months, relative to the global benchmark. Feature Economic data released last week, including Q4 GDP growth, December industrial production, fixed-asset investment and trade data, all suggest that the Chinese economy bottomed before the end of 2019. The Phase One trade deal between China and the US marks a significant de-escalation in a two-year trade war. The RMB appreciated by 1.4% against the greenback since the beginning of the year, pushing USD-CNY firmly below the key psychological 7 mark. The performance of equities in China’s onshore and offshore markets confirms that the economy has bottomed. Since December 11, 2019, Chinese cyclical sectors have outperformed defensives and both the investable and domestic markets have broken above their respective 200-day moving averages versus global stocks (Chart 1A and 1B). Chart 1ABoth Onshore And Offshore Equities Signal A Bottoming In China's Economy
Both Onshore And Offshore Equities Signal A Bottoming In China's Economy
Both Onshore And Offshore Equities Signal A Bottoming In China's Economy
Chart 1BCyclicals Have Significantly Outperformed Defensives Lately
Cyclicals Have Significantly Outperformed Defensives Lately
Cyclicals Have Significantly Outperformed Defensives Lately
We continue to recommend a cyclical long stance on Chinese stocks. We expect pro-growth policy support to accelerate in the first quarter, economic recovery to further solidify, and the Phase One trade deal to reduce economic and financial market volatility until the November 2020 US presidential election. All of these factors should support an outperformance in Chinese stocks relative to their global peers. Some Inconvenient Truth To The Truce China’s commitment to purchase an additional $200 billion in goods from the US was more than market participants anticipated. We do not think China will honor this commitment to its full extent. Moreover, we also do not think this will change China’s domestic economic policy trajectory for 2020. Details in Chapter 6 of the Phase One trade agreement titled “Expanding Trade”1 include: In the next 2 years, China is committed to purchase an additional $200 billion worth of goods and services from the US, from the 2017 baseline. The additional $200 billion amount is split over the next two years: China will need to add no less than $77 billion of imports from the US in 2020, and $123 billion in 2021. This amounts to a 41% increase in 2020 and a 66% increase in 2021, from the 2017 baseline of $186 billion (Chart 2). The text from Chapter 6 of the Phase One deal also specifies that, between January 2020 and December 2021, China will add a total of $77.7 billion in purchases of manufactured goods (including aircraft components), $32 billion in agricultural products, $52.4 billion in energy and $37.9 billion in services from the US (Chart 3). Chart 2Phase One Trade Deal Sets An Ambitious Import Target For The Next Two Years
Phase One Trade Deal Sets An Ambitious Import Target For The Next Two Years
Phase One Trade Deal Sets An Ambitious Import Target For The Next Two Years
Chart 3Chinese Imports Of Agro And Energy Goods From The US Likely To See The Biggest Increase In 2020 From 2019
Chinese Imports Of Agro And Energy Goods From The US Likely To See The Biggest Increase In 2020 From 2019
Chinese Imports Of Agro And Energy Goods From The US Likely To See The Biggest Increase In 2020 From 2019
China’s annual import growth from the US in 2017 was the highest one in the past ten years. If we assume that China will simply add $200 billion of new imports in the next two years from the US to this high starting point, it will need to boost domestic demand to accommodate at least a 4-6% increase in total imports in the next two years from 2019.2 In contrast, growth in China’s total imports in 2019 contracted by 3% from 2018, and averaged at only 2% in the last five years. In other words, in 2020 and 2021, even if China does not increase imports from other countries, just the commitment from purchases of US goods alone would require a sizable boost in China’s domestic demand. However, the assumption above is overly simplified and optimistic. Even though Chinese leadership may have shifted their policy priority from financial deleveraging to supporting economic growth this year, we do not think they will fully abandon the battle against systemic risks in the financial sector. Therefore, China is unlikely to significantly deviate from its current policy trajectory and stimulate aggressively to create additional domestic demand to consume the agreed $200 billion in new imports from the US. It is equally unlikely that China will absorb the $200 billion additional imports from the US, at the expense of its domestic production. A more plausible approach, which is our base case scenario, is that China will meet a large portion of the 2020 import target before November, to show good faith. After the US presidential election, China will face the challenge of either a re-escalation from the Phase Two trade talk with a re-elected President Trump, or a new US president with his/her own political agenda. In either case, at this point China is unlikely to have the intention to meet the import target for 2021. Chart 4China Likely To Shift Agro And Energy Import Suppliers To The US
Managing Expectations
Managing Expectations
In 2020, to absorb a $77 billion additional imports from the US, China will likely shift some of its imports, such as agriculture and energy products, from other countries to suppliers in the US. China currently imports $150 billion of agriculture goods and $298 billion of energy related products on an annual basis, so the pie is large enough to absorb some of increased import commitments by shifting the sources of imports (Chart 4). The same logic goes for the manufactured goods category in the trade agreement, which includes cars, airplanes, steel, industrial machinery, and so on.3 China is likely to choose to shift its import suppliers of these goods to the US, while increasing its own share of intermediate goods supplies to the US manufacturers. Almost all of the eight subcategories under the manufactured goods category in the Phase One trade agreement are deeply integrated in the global supply chain. For example, foreign value-added share accounts for 23% of the total output value of the US automobile industry.4 In other words, if a “Made in America” car is worth $20,000, $4,600 is produced by foreign suppliers of intermediate goods. Since China has been the leading source of this foreign value-added in the US automobile industry, a sizeable slice of these additional imports will likely benefit Chinese manufacturers. In this scenario, we expect an increase in bilateral trade between China and the US in 2020, at the expense of other players in the global supply chain. Lastly, while this is not our base case scenario, it is possible the Phase One trade agreement was set up for failure, if China is simply hoping to delay the imposition of additional tariffs as part of a gamble that President Trump will not be re-elected. In this scenario, China might not make any meaningful additional purchases from the US even in 2020 (while claiming that they will be made closer to the election), implying that bilateral trade between China and the US will only revert to its historical average this year, at best. Bottom Line: Chinese policymakers are unlikely willing to alter their existing policy trajectory when accommodating more imports of US goods. China will, at best, reshuffle its supply chain to absorb a portion of the commitment before November 2020. The RMB And Monetary Policy: A Refocus On The Economic Fundamentals As tensions from the US-China trade war abate, investors are starting to refocus on economic fundamentals. The RMB has appreciated by 1.4% against the USD since the beginning of this year (Chart 5). The recent appreciation in the currency is a reversal to its fair value, which reflects an ongoing economic recovery (Chart 6). In the next three to six months, the improvement in China’s economic fundamentals and market sentiment should support a continuation in the RMB’s reversal to its structural trend. Chart 5USD/CNY Has Durably Fallen Below 7
USD/CNY Has Durably Fallen Below 7
USD/CNY Has Durably Fallen Below 7
Chart 6The Recent Appreciation In RMB Is A Reversal To Its Fair Value
The Recent Appreciation In RMB Is A Reversal To Its Fair Value
The Recent Appreciation In RMB Is A Reversal To Its Fair Value
But Chinese leadership’s cautious approach to boosting domestic demand will also cap the upside potential in the RMB appreciation. We think Chinese policymakers will maintain their tight grip this year on local government spending and bank lending, and will continue to fine-tune policies based on economic conditions. This will limit the magnitude in both the stimulus and economic recovery. Baring a major re-escalation in the trade war, the RMB should oscillate within a relatively narrow band through the third quarter of this year. For that reason, the PBoC is unlikely to intervene in the RMB exchange rate by significantly altering its monetary stance (Chart 7). The 3-month interbank lending rate, China’s de facto policy rate, remains low compared with the 2015-16 easing cycle. There is no sign that the PBoC will allow the rate to fall much more. The recent bank reserve requirement ratio (RRR) rate cut provides additional liquidity to the interbank system, but on a net basis liquidity does not seem excessive (Chart 8). Chart 7PBoC Unlikely To Alter Monetary Policy To Intervene RMB Exchange Rate This Year
PBoC Unlikely To Alter Monetary Policy To Intervene RMB Exchange Rate This Year
PBoC Unlikely To Alter Monetary Policy To Intervene RMB Exchange Rate This Year
Chart 8No Sign Of Meaningful Monetary Easing From PBoC
No Sign Of Meaningful Monetary Easing From PBoC
No Sign Of Meaningful Monetary Easing From PBoC
Historically, the 3-month interbank lending rate only falls significantly and durably when the PBoC places consecutive RRR rate cuts (in both 2015 and mid-2018) and/or keeps net fund injections positive through the open market for a prolonged period (such as in the 2015/16 easing cycle). Chart 8 suggests the current monetary environment does not indicate that such an extremely easy stance is in place, as PBoC net fund injections through the open market remain negative. Furthermore, neither the 3-month interbank lending rate nor the 10-year government bond yield has fallen below its most recent lows in the third quarter of last year. Bottom Line: While the current environment supports a stronger RMB, the upside potential in RMB appreciation is capped by a modest scale of economic recovery. There is no sign that the PBoC is easing its monetary stance by lowering the policy rate. Investment Conclusions We have been cyclically overweight Chinese stocks on the basis of a bottoming in the economy in the first quarter of 2020, and the likelihood of an eventual trade deal. These two factors were confirmed in the past two weeks. Last week’s small selloffs in both onshore and offshore Chinese equity markets were likely technical corrections and pre-Chinese New Year profit taking, rather than a fundamental shift in investors’ sentiment towards Chinese stocks (Chart 9). We expect Chinese stocks to resume an upward trajectory after the Chinese New Year. Chart 9Small Corrections Following A 14% Gain Since Dec 2019
Small Corrections Following A 14% Gain Since Dec 2019
Small Corrections Following A 14% Gain Since Dec 2019
Chart 10Offshore Stocks Still Showing More Upside Potential Than Onshore
Offshore Stocks Still Showing More Upside Potential Than Onshore
Offshore Stocks Still Showing More Upside Potential Than Onshore
China’s economic conditions and corporate earnings should continue to improve, with investable stocks showing more upside potential than their domestic counterparts (Chart 10). As growth supporting measures continue to work their way through the economy and solidify an economic recovery, China’s leadership may pull back the scale of the stimulus in the second half of the year. Therefore, the relative outperformance in both markets may be front loaded and subsequently subside in the second half of 2020. Jing Sima China Strategist jings@bcaresearch.com Footnotes 1 https://assets.bwbx.io/documents/users/iqjWHBFdfxIU/rVaHxDBUtdew/v0 2 China’s total imports of goods and services in 2019 was $2604 billion, including $168 billion imports from the US. If China was to fully meet the $200 billion target of additional imports from the US, assuming no change to imports from other countries in 2020 from 2019, China’s total imports would jump to $2699 billion in 2020 and $2745 billion in 2021. 3 The eight subcategories of Manufacturing Goods listed in the Annex 6.1 of the Phase One Trade agreement include: Industrial Machinery, Electrical Equipment and Machinery, Pharmaceutical Products, Aircraft, Vehicles, Optical and Medical Instruments, Iron and Steel, Other Manufactured Goods including solar-grade polysilicon and other organic and inorganic chemicals, hardwood lumber, integrated circuits (manufactured in US), and chemical products. 4 WIOD Data, 2016 release and OECD Input-Output Tables (IOTs), 2015 release. Cyclical Investment Stance Equity Sector Recommendations
Highlights We continue to have a positive view on global equities over the next 12 months, but see heightened risks of a near-term correction. Despite dwindling spare capacity, government bond yields are still lower today than they were shortly after the financial crisis. Many investors argue that bond yields cannot rise much because asset values would plunge if yields rose sharply, while debt burdens would quickly become unsustainable. We disagree. We think there is greater scope for yields to rise than is widely believed. Investors should maintain below-benchmark duration in fixed-income portfolios, favoring inflation-linked over nominal bonds and positioning for steeper yield curves. Gold should also do well next year. As long as bond yields are rising in response to stronger growth, as will be the case for the next two years, equities will fare well. The stock market will buckle, however, once stagflation sets in around 2022. Stocks Need To Work Off Overbought Conditions Before Moving Higher Again In last week’s report, entitled “Time For A Breather,” we downgraded our tactical three-month view on global equities from overweight to neutral on the grounds that stocks had run up too hard, too fast. Net long positions in equity futures among asset managers and levered funds are now at levels that have historically preceded corrections (Chart 1). Chart 1Stocks Are At A Heightened Risk Of A Correction
Stocks Are At A Heightened Risk Of A Correction
Stocks Are At A Heightened Risk Of A Correction
Chart 2Breadth Is Quite Narrow
Breadth Is Quite Narrow
Breadth Is Quite Narrow
Chart 3The Equity Risk Premium Is Fairly High, Especially Outside The US
The Equity Risk Premium Is Fairly High, Especially Outside The US
The Equity Risk Premium Is Fairly High, Especially Outside The US
The rally has been lopsided, characterized by very narrow breadth. The top five stocks in the S&P 500 (Apple, Microsoft, Alphabet, Amazon, and Facebook) now comprise 18% of market cap, a higher share than in the late 1999/early 2000s (Chart 2). As my colleague, Anastasios Avgeriou, has pointed out, Apple’s $30 billion one day market cap gain on January 9th was greater than the market cap of the median stock in the S&P 500 index. Despite our near-term concerns, we continue to maintain a positive 12-month view on global equities. Easier financial conditions, a turn in the global inventory cycle, modestly looser fiscal policy in the UK and euro area, and re-upped fiscal/credit stimulus in China should all support global growth this year. Faster growth, in turn, will lift corporate earnings. The equity risk premium also remains quite high, particularly outside the US (Chart 3). A Fragile Trade Truce A de-escalation in the trade war should provide a further tailwind to equities. The “phase one” agreement signed on Wednesday features a commitment by China to purchase an additional $200 billion in US goods and services over the next two years relative to 2017 levels. In return, the US will halve tariffs, to 7.5%, on the $120 billion tranche in Chinese imports and suspend any further tariff hikes. No firm schedule exists to begin “phase two” talks, and at this point, it is quite likely that no negotiations will take place until after the US presidential election. Nevertheless, the tail risk of an out-of-control trade war has receded for the time being, which is positive for stocks. Better Chinese Trade Data Adding to growing optimism over the global economy and diminished trade tensions, Chinese trade data surprised on the upside this week. Exports rose 7.6% in December, well above the consensus estimate of 2.9%. Imports surged 16.3%, easily surpassing the consensus estimate of 9.6%. While base effects explain some of the improvement, the overall tone of the trade data is consistent with the strengthening Chinese PMIs and improvement in industrial production and retail sales (Chart 4). Chart 4Chinese Trade Data Is Improving
Chinese Trade Data Is Improving
Chinese Trade Data Is Improving
Chart 5Better News Out Of China Has Propelled The Yuan Higher Versus The US Dollar
Better News Out Of China Has Propelled The Yuan Higher Versus The US Dollar
Better News Out Of China Has Propelled The Yuan Higher Versus The US Dollar
Better news out of China has pushed the yuan to the strongest level against the US dollar since last summer (Chart 5). The Chinese currency is the most important driver of other EM currencies. If the yuan continues to strengthen, as we expect, EM assets – particularly EM stocks and local-currency bonds – should do well this year. How High Can Bond Yields (Realistically) Go? Despite rising over the past few months, global government bond yields are lower today than they were shortly after the financial crisis ended (Chart 6). The decline in yields has occurred alongside dwindling spare capacity. In most countries, the unemployment rate today is below 2007/08 lows (Chart 7). Many investors argue that bond yields cannot rise much from current levels because asset values would plunge if yields rose sharply, while debt burdens would quickly become unsustainable. If such an unfortunate turn of events were to occur, central bankers would have to shelve any tightening plans, just as Jay Powell had to do in late 2018. Chart 6Bond Yields Are Lower Today Than They Were After The Great Recession
Bond Yields Are Lower Today Than They Were After The Great Recession
Bond Yields Are Lower Today Than They Were After The Great Recession
Chart 7Unemployment Rates Are Below Their Pre-Recession Lows In Most Economies
Bond Yields: How High Is Too High?
Bond Yields: How High Is Too High?
Convexity Fears One argument often heard these days is that asset prices have become hypersensitive to changes in interest rates. There is some basis for thinking this. As Box 1 explains, the relationship between asset returns and interest rates tends to be “convex,” meaning that any given change in interest rates will have a bigger effect on returns if rates are low to begin with, as they are today. The effect is particularly pronounced for long duration assets such as long-term bonds, equities, or real estate. Nevertheless, while the theoretical presence of convexity in asset returns is crystal clear, many commentators overstate its practical importance. As Chart 8 shows, the average maturity of government debt stands at seven years. At that level of maturity, the effects of convexity tend to be quite small.1 Chart 8Average Debt Maturity Is Below 10 Years In Most Countries
Bond Yields: How High Is Too High?
Bond Yields: How High Is Too High?
Granted, the overall stock of debt has increased in relation to GDP. However, much of that additional debt has been absorbed by central banks, reducing the amount of government debt available for the private sector. What about equities? The ratio of stock market capitalization-to-GDP has risen to 59%, up from a low of 24% in 2009, and close to its 2000 highs (Chart 9). Does that mean that stocks will sink if yields rise from current levels? Not necessarily. Remember that the discount rate is not the only thing that affects the present value of a stream of income. The expected growth rate of that income also matters. In fact, in the standard dividend discount model, it is simply the difference between the discount rate and the growth rate of dividends that determines how much a stock is worth. If higher bond yields coincide with rising growth expectations, stock prices do not need to fall at all. Chart 9Equity Market Cap Is Approaching Previous Highs
Equity Market Cap Is Approaching Previous Highs
Equity Market Cap Is Approaching Previous Highs
Chart 10 shows that the monthly correlation between equity returns and bond yields remains as high as ever. This suggests that favorable economic news, to the extent that it leads investors to revise up the expected growth rate for earnings, usually more than compensates for a rising discount rate (Chart 11). Chart 10Correlation Between Equity Returns And Bond Yields Remains High
Correlation Between Equity Returns And Bond Yields Remains High
Correlation Between Equity Returns And Bond Yields Remains High
Chart 11Earnings Estimates Tend To Move In Sync With Swings In Bond Yields
Earnings Estimates Tend To Move In Sync With Swings In Bond Yields
Earnings Estimates Tend To Move In Sync With Swings In Bond Yields
So why are so many investors worried that higher bond yields will undercut stocks? The answer has less to do with convexity and more to do with the fear that bond yields will reach a level that chokes off growth. The combination of a rising discount rate and a falling growth rate would be toxic for equities and other risk assets. Debt Worries Likewise, it is not so much that corporate bond investors are worried that rising yields will cause interest payments to swell. After all, interest costs are still quite low as a share of cash flows for most firms (Chart 12). Rather, the fear is that higher yields will imperil growth, causing those cash flows to evaporate. Government debt is also much less of a problem than often assumed, at least in countries that issue bonds in their own currencies. The standard rule for debt sustainability says that the debt-to-GDP ratio will always converge to a stable level if the interest rate is below the growth rate of the economy.2 This is easily the case in almost all economies today (Chart 13). Chart 12US Corporate Sector: Interest Payments Are Not A Worry
US Corporate Sector: Interest Payments Are Not A Worry
US Corporate Sector: Interest Payments Are Not A Worry
Chart 13Bond Yield Minus GDP Growth: Please Mind The Gap
Bond Yields: How High Is Too High?
Bond Yields: How High Is Too High?
The only places where central banks are severely constrained in raising rates are in economies such as Canada, Sweden, and Australia where debt-financed housing bubbles have formed (Chart 14). However, even in these countries, the quality of mortgage underwriting has generally been strong, implying that a banking crisis would likely be avoided. Chart 14Canada, Sweden, And Australia Stand Out As Having Very Frothy Housing Markets
Canada, Sweden, And Australia Stand Out As Having Very Frothy Housing Markets
Canada, Sweden, And Australia Stand Out As Having Very Frothy Housing Markets
It’s Really About The Neutral Rate The discussion above suggests that the main constraint to higher bond yields is the economy itself. If bond yields rise enough, the interest rate-sensitive sectors of the economy will weaken, and a recession will ensue. As long as bond yields are rising in response to stronger growth, as will be the case for the next two years, equities will be fine. Unfortunately, no one knows where the neutral rate – the interest rate demarcating the boundary between expansionary and contractionary monetary policy – really lies. Chart 15Rising Labor Share Of Income Occurring Alongside Labor Market Tightening
Rising Labor Share Of Income Occurring Alongside Labor Market Tightening
Rising Labor Share Of Income Occurring Alongside Labor Market Tightening
Slower trend growth has probably reduced the neutral rate, as has the shift to a more “capital-lite” economy. On the flipside, other forces have probably raised the neutral rate over the past few years. A tighter labor market has increased workers’ share of national income (Chart 15). Since workers spend more of every dollar of income than companies, this has raised aggregate demand. Fiscal policy has also been loosened, while elevated asset prices have likely incentivized some spending that would otherwise not have taken place. Even though we do not know the exact value of the neutral rate, we do know that the unemployment rate has been falling in most countries for the past 10 years, a period during which bond yields were generally higher than today. This suggests that monetary policy remains in expansionary territory. True, global growth did slow in 2018, just as the Fed was raising rates. However, this probably had more to do with the natural ebb and flow of the global manufacturing cycle, exacerbated by the Chinese deleveraging campaign and the brewing trade war. If global growth recovers this year, as we expect, estimates of the neutral rate will rise. This will allow equity prices to increase even in an environment of modestly higher bond yields. Inflation Is Coming… Eventually While stronger economic growth will lift bond yields this year, the big move in yields will only come when inflation breaks out. Core inflation tends to track unit labor costs (Chart 16). Unit labor cost inflation has remained range-bound for most of the recovery in the United States, which explains the failure of inflation to take flight. Unit labor cost inflation has been even more moribund elsewhere. Chart 16Core Inflation Tends To Track Unit Labor Costs
Core Inflation Tends To Track Unit Labor Costs
Core Inflation Tends To Track Unit Labor Costs
Chart 17Correlation Between Labor Market Slack And Wage Growth Remains Intact
Bond Yields: How High Is Too High?
Bond Yields: How High Is Too High?
Looking out, barring a major surge in productivity, rising wage growth should lead to accelerating unit labor cost inflation, first in the US and then in the rest of the world, which will translate into higher price inflation. We doubt that such a price-wage spiral will erupt this year. If anything, US wage growth has leveled off recently, with the year-over-year change in average hourly earnings falling back below the 3% mark. Nevertheless, the long-term correlation between labor market slack and wage growth remains intact (Chart 17). As wage growth reaccelerates, unit labor cost inflation will drift higher, setting the stage for a period of rising price inflation. Investors should maintain below-benchmark duration in global fixed-income portfolios, favoring inflation-linked over nominal bonds and positioning for steeper yield curves. Gold should also do well next year. As long as bond yields are rising in response to stronger growth, as will be the case for the next two years, equities will be fine. The stock market will buckle, however, once stagflation sets in around 2022. Box 1 Asset Prices And Interest Rates: The Role Of Convexity
Bond Yields: How High Is Too High?
Bond Yields: How High Is Too High?
Peter Berezin Chief Global Strategist peterb@bcaresearch.com Footnotes 1Assuming semi-annual compounding, the price of a 10-year bond with a 5% coupon rate falls by 7.9% if the yield increases from 1% to 2%, which is only slightly higher than the 7.6% decline that would be incurred if the yield increases from 4% to 5%. 2One might add that if the interest rate is below the growth rate of the economy, a higher starting point for the debt stock will allow for more debt issuance without leading to a higher debt-to-GDP ratio. As we have shown before, the steady-state debt-to-GDP ratio can be expressed as p/(r-g), where r is the interest rate, g is trend GDP growth, and p is the primary (i.e., non-interest) budget balance. Thus, for example, if the government wanted to achieve a stable debt-to-GDP ratio of 50% and r-g is -2%, it would need to run a primary budget deficit of 0.5*0.02=1% of GDP. However, if the government targeted a stable debt-to-GDP ratio of 200%, it could run a primary budget deficit of 2*0.02=4% of GDP. Global Investment Strategy View Matrix
Bond Yields: How High Is Too High?
Bond Yields: How High Is Too High?
MacroQuant Model And Current Subjective Scores
Bond Yields: How High Is Too High?
Bond Yields: How High Is Too High?
Strategic Recommendations Closed Trades
Highlights Our top five geopolitical “Black Swans” are risks that the market is seriously underpricing. With the “phase one” trade deal signed, Chinese policy could become less accommodative, resulting in a negative economic surprise. The trade deal may fall victim to domestic politics, raising the risk of a US-China military skirmish. A Biden victory at the Democratic National Convention or a Democratic takeover of the White House could trigger social unrest and violence in the US. A pickup in the flow of migrants to Europe would fundamentally undermine political stability there. Russia’s weak economy will add fuel to domestic unrest, risking an escalation beyond the point of containment. Feature Over the past four years, we have started off the year with our top five geopolitical “Black Swans.” These are low-probability events whose market impact would be significant enough to matter for global investors. Unlike the great Byron Wien’s perennial list of market surprises, we do not assign these events a “better than 50% likelihood of happening.” We offer risks that the market is seriously underpricing by assigning them only single-digit probabilities when we think the reality is closer to 10%-15%, a level at which a risk premium ought to be assigned. Some of our risks below are so obscure that it is not clear how exactly to price them. We exclude issues that are fairly probable, such as flare-ups in Indo-Pakistani conflict. The two major risks of the year – discussed in our annual outlook – are that either US President Donald Trump or Chinese President Xi Jinping overreaches in a major way. But what would truly surprise the market would be a policy-induced relapse in Chinese growth or a direct military clash between the two great powers. That is how we begin. Other risks stem from domestic affairs in the US, Europe, and Russia. Black Swan 1: China’s Financial Crisis Begins The risk of Xi Jinping’s concentration of power in his own person is that individuals can easily make mistakes, especially if unchecked by advisors or institutions. Lower officials will fear correcting or admonishing an all-powerful leader. Inconvenient information may not be relayed up the hierarchy. Such behavior was rampant in Chairman Mao Zedong’s time, leading to famine among other ills. Insofar as President Xi’s cult of personality successfully imitates Mao’s, it will be subject to similar errors. If President Xi overreaches and makes a policy mistake this year, it could occur in economic policy or other policies. We begin with economic policy, as we have charted the risks of Xi’s crackdown on the financial system since early 2017 (Chart 1). Chart 1A Crackdown On Financial Risk Could Cause China's Economy To Derail
A Crackdown On Financial Risk Could Cause China's Economy To Derail
A Crackdown On Financial Risk Could Cause China's Economy To Derail
Chart 2Easing Of Trade Tensions May Re-Incentivize Tighter Policy
Easing Of Trade Tensions May Re-Incentivize Tighter Policy
Easing Of Trade Tensions May Re-Incentivize Tighter Policy
This year is supposed to be the third and final year of Xi Jinping’s “three battles” against systemic risk, pollution, and poverty. The first battle actually focuses on financial risk, i.e. China’s money and credit bubble. The regime has compromised on this goal since mid-2018, allowing monetary easing to stabilize the economy amid the trade war. But with a “phase one” trade deal having been signed, there is an underrated risk that economic policy will return to its prior setting, i.e. become less accommodative (Chart 2). When Xi launched the “deleveraging campaign” in 2017, we posited that the authorities would be willing to tolerate an annual GDP growth rate below 6%. This would not only cull excesses in the economy but also demonstrate that the administration means business when it says that China must prioritize quality rather than quantity of growth. While Chinese authorities are most likely targeting “around 6%” in 2020, it is entirely possible that the authorities will allow an undershoot in the 5.5%-5.9% range. They will argue that the GDP target for 2020 has already been met on a compound growth rate basis (Chart 3), as astute clients have pointed out. They may see less need for stimulus than the market expects. Chart 3Chinese Authorities Might Tolerate A Growth Undershoot In 2020
Chinese Authorities Might Tolerate A Growth Undershoot In 2020
Chinese Authorities Might Tolerate A Growth Undershoot In 2020
Similarly, while urban disposable income is ostensibly lagging its target of doubling 2010 levels by 2020, China’s 13th Five Year Plan, which concludes in 2020, conspicuously avoided treating urban and rural income targets separately. Chart 4Lower Impetus For Economic Support Due To Improvements In National Income?
Lower Impetus For Economic Support Due To Improvements In National Income?
Lower Impetus For Economic Support Due To Improvements In National Income?
Chart 5Has China's Stimulus Peaked?
Has China's Stimulus Peaked?
Has China's Stimulus Peaked?
If the authorities focus only on general disposable income, then they are on track to meet their target (Chart 4). This would reduce the impetus for greater economic support. There are already tentative signs that Chinese authorities are “satisfied” with the amount of stimulus they have injected: some indicators of money and credit have already peaked (Chart 5). The crackdown on shadow banking has eased, but informal lending is still contracting. The regime is still pushing reforms that shake up state-owned enterprises. The Xi administration may aim only for stability, not acceleration, in the economy. An added headwind for the Chinese economy stems from the currency. The currency should track interest rate differentials. Beijing’s incremental monetary stimulus, in the form of cuts to bank reserve requirement ratios (RRRs), should also push the renminbi down over time (Chart 6). However, an essential aspect of any trade deal with the Trump administration is the need to demonstrate that China is not competitively devaluing. Hence the CNY-USD could overshoot in the first half of the year. This is positive for global exports to China, but it tightens Chinese financial conditions at home. A stronger than otherwise justified renminbi would add to any negative economic surprises from less accommodative monetary and fiscal policy. Conventional wisdom says China will stimulate the economy ahead of two major political events: the centenary of the Communist Party in 2021 and the twentieth National Party Congress in 2022. The former is a highly symbolic anniversary, as Xi has reasserted the supremacy of the party in all things, while the latter is more significant for policy, as it is a leadership reshuffle that will usher in the sixth generation of China’s political elite. But conventional wisdom may be wrong – the Xi administration may aim only for stability, not acceleration, in the economy. It would make sense to save dry powder for the next US or global recession. The obvious implication is that China’s economic rebound may lose steam as early as H2 – but the black swan risk is that negative surprises could cause a vicious spiral inside of China. This is a country with massive financial and economic imbalances, a declining potential growth profile, and persistent political obstacles to growth both at home and abroad. Corporate defaults have spiked sharply. While the default rate is lower than elsewhere, the market may be sniffing out a bigger problem as it charges a much higher premium for onshore Chinese bonds (Chart 7). Chart 6CNY-USD Overshoot Would Tighten Chinese Financial Conditions
CNY-USD Overshoot Would Tighten Chinese Financial Conditions
CNY-USD Overshoot Would Tighten Chinese Financial Conditions
Chart 7Is China's Bond Market Sniffing Out A Problem?
Is China's Bond Market Sniffing Out A Problem?
Is China's Bond Market Sniffing Out A Problem?
Bottom Line: Our view is that China’s authorities will remain accommodative in 2020 in order to ensure that growth bottoms and the labor market continues to improve. But Beijing has compromised its domestic economic discipline since 2018 in order to fight trade war. The risk now, with a “phase one” deal in hand, is that Xi Jinping returns to his three-year battle plan and underestimates the downward pressures on the economy. The result would be a huge negative surprise for the Chinese and global economy in 2020. Black Swan 2: The US And China Go To War In 2013, we predicted that US-China conflict was “more likely than you think.” This was not just an argument for trade conflict or general enmity that raises the temperature in the Asia-Pacific region – we included military conflict. Chart 8Americans' Attitudes Toward China Plunged …
Five Black Swans In 2020
Five Black Swans In 2020
At the time, the notion that a Sino-American armed conflict was the world’s greatest geopolitical threat seemed ludicrous to many of our clients. We published this analysis in October of that year, months after the Islamic State “Soldier’s Harvest” offensive into Iraq. Trying to direct investors to the budding rivalry between American and Chinese naval forces in the South China Sea amidst the Islamic State hysteria was challenging, to say the least. The suggestion that an accidental skirmish between the US and China could descend into a full-blown conflict involved a stretch of the imagination because China was not yet perceived by the American public as a major threat. In 2014, only 19%of the US public saw China as the “greatest threat to the US in the future.” This came between Russia, at 23%, and Iran, at 16%. Today, China and Russia share the top spot with 24%. Furthermore, the share of Americans with an unfavorable view of China has increased from 52% to 60% in the six intervening years (Chart 8). The level of enmity expressed by the US public toward China is still lower than that toward the Soviet Union at the onset of the Cold War in the 1950s (Chart 9). However, the trajectory of distrust is clearly mounting. We expect this trend to continue: anti-China sentiment is one of the few sources of bipartisan agreement remaining in Washington, DC (Chart 10). Chinese sentiment toward the United States has also darkened dramatically. The geopolitical rivalry is deepening for structural reasons: as China advances in size and sophistication, it seeks to alter the regional status quo in its favor, while the US grows fearful and seeks to contain China. Chart 9… But Not Yet To War-Inducing Levels
Five Black Swans In 2020
Five Black Swans In 2020
Chart 10Distrust Of China Is Bipartisan
Five Black Swans In 2020
Five Black Swans In 2020
Chart 11Newfound American Concern For China’s Repression
Five Black Swans In 2020
Five Black Swans In 2020
One example of rising enmity is the US public’s newfound concern for China’s domestic policies and human rights, specifically Beijing’s treatment of its Uyghur minority in Xinjiang. A Google Trends analysis of the term “Uyghur” or “Uyghur camps” shows a dramatic rise in mentions since Q2 of 2018, around the same time the trade war ramped up in a major way (Chart 11). While startling revelations of re-education camps in Xinjiang emerged in recent years, the reality is that Beijing has used heavy-handed tactics against both militant groups and the wider Uyghur minority since at least 2008 – and much earlier than that. As such, the surge of interest by the general American public and legislators – culminating in the Uyghur Human Rights Policy Act of 2019 – is a product of the renewed strategic tension between the two countries. The “phase one” trade deal risks falling victim to domestic politics due to greater public engagement in foreign policy. The same can be said for Hong Kong: the US did not pass a Hong Kong Human Rights and Democracy Act in 2014, during the first round of mass protests, which prompted Beijing to take heavy-handed legal, legislative, and censorship actions. It passed the bill in 2019, after the climate in Washington had changed. Why does this matter for investors? There are two general risks that come with a greater public engagement in foreign policy. First, the “phase one” trade deal between China and the US could fall victim to domestic politics. This deal envisions a large step up in Sino-American economic cooperation. But if China is to import around $200 billion of additional US goods and services over the next two years – an almost inconceivable figure – the US and China will have to tamp down on public vitriol. This is notably the case if the Democratic Party takes over the White House, given its likely greater focus on liberal concerns such as human rights. And yet the latest bills became law under President Trump and a Republican Senate, and we fully expect a second Trump term to involve a re-escalation of trade tensions to ensure compliance with phase one and to try to gain greater structural concessions in phase two. Second, mounting nationalist sentiment will make it more difficult for US and Chinese policymakers to reduce tensions following a potential future military skirmish, accidental or otherwise. While our scenario of a military conflict in 2013 was cogent, the public backlash in the United States was probably manageable.1 Today we can no longer guarantee that this is the case. China has greater control over the domestic narrative and public discourse, but the rise of the middle class and the government’s efforts to rebuild support for the single-party regime have combined to create an increase in nationalism. Thus it is also more difficult for Chinese policymakers to contain the popular backlash if conflict erupts. In short, the probability of a quick tamping down of public enmity is actively being reduced as American public vilification of China is closing the gap with China’s burgeoning nationalism at an alarming pace. Chart 12Tsai Ing-Wen Enjoys A Greater Mandate On Higher Turnout …
Five Black Swans In 2020
Five Black Swans In 2020
Another of our black swan risks – Taiwan island – is inextricably bound up in this dangerous US-China dynamic. To be clear, Washington will tread carefully, as a conflict over Taiwan could become a major war. Nevertheless Taiwan’s election, as we expected, has injected new vitality into this already underrated geopolitical risk. It is not only that a high-turnout election (Chart 12) gave President Tsai Ing-wen a greater mandate (Chart 13), or that her Democratic Progressive Party retained its legislative majority (Chart 14). It is not only that the trigger for this resounding victory was the revolt in Hong Kong and the Taiwanese people’s rejection of the “one country, two systems” formula for Taiwan. It is also that Tsai followed up with a repudiation of the mainland by declaring, “We don’t have a need to declare ourselves an independent state. We are an independent country already and we call ourselves the Republic of China, Taiwan.” Chart 13… Popular Support …
Five Black Swans In 2020
Five Black Swans In 2020
Chart 14… And A Legislative Majority
Five Black Swans In 2020
Five Black Swans In 2020
This statement is not a minor rhetorical flourish but will be received as a major provocation in Beijing: the crystallization of a long-brewing clash between Beijing and Taipei. Additional punitive economic measures against Taiwan are now guaranteed. Saber-rattling could easily ignite in the coming year and beyond. Taiwan is the epicenter of the US-China strategic conflict. First, Beijing cannot compromise on its security or its political legitimacy and considers the “one China principle” to be inviolable. Second, the US maintains defense relations with Taiwan (and is in the process of delivering on a relatively large new package of arms). Third, the US’s true willingness to fight a war on Taiwan’s behalf is in doubt, which means that deterrence has eroded and there is greater room for miscalculation. Bottom Line: A US-China military skirmish has been our biggest black swan risk since we began writing the BCA Geopolitical Strategy. The difference between then and now, however, is that the American public is actually paying attention. Political ideology – the question of democracy and human rights – is clearly merging with trade, security, and other differences to provoke Americans of all stripes. This makes any skirmish more than just a temporary risk-off event, as it could lead to a string of incidents or even protracted military conflict. Black Swan 3: Social Unrest Erupts In America There are numerous lessons that one can learn from the ongoing unrest in Hong Kong, but perhaps the most cogent one is that Millennials and Generation Z are not as docile and feckless as their elders think. Images of university students and even teenagers throwing flying kicks and Molotov cocktails while clad in black body armor have shocked the world. Perhaps all those violent video games did have a lasting impact on the youth! What is surprising is that so few commentators have made the cognitive leap from the ultra-first world streets of Hong Kong to other developed economies. Perhaps what is clouding analysts’ minds is the idiosyncratic nature of the dispute in Hong Kong, the “one China” angle. However, Hong Kong youth are confronted with similar socio-economic challenges that their peers in other advanced economies face: overpriced real estate and a bifurcated service-sector labor market with few mid-tier jobs that pay a decent wage. In the US, Millennials and Gen Z are also facing challenges unique to the US. First, their debt burden is much more toxic than that of the older cohorts, given that it is made up of student loans and credit card debt (Chart 15). Second, they find themselves at odds – demographically and ideologically – with the older cohorts (Chart 16). Chart 15Younger American Cohorts Plagued By Toxic Debt
Five Black Swans In 2020
Five Black Swans In 2020
Chart 16Younger And Older Cohorts At Odds Demographically
Five Black Swans In 2020
Five Black Swans In 2020
The adage that the youth are apolitical and do not turn out to vote may have ended thanks to President Trump. The 2018 midterm election, which the Democratic Party successfully turned into a referendum on the president, saw the youth (18-29) turnout nearly double from 20% to 36% (the 30-44 year-old cohort also saw a jump in turnout from 35.6% to 48.8%). The election saw one of the highest turnouts in recent memory, with a 53.4% figure, just two points off the 2016 general election figure (Chart 17). Chart 17Massive Turnout To The 2016 Referendum On Trump
Five Black Swans In 2020
Five Black Swans In 2020
Despite the high turnout in 2018, the-most-definitely-not-Millennial Vice President Joe Biden continues to lead the Democratic Party in the polls. Chart 18Biden Unpopular Among Young American Voters
Five Black Swans In 2020
Five Black Swans In 2020
Chart 19Bookies Pulled Down "Uncle Joe's" Odds, Capturing Democratic Party Zeitgeist
Five Black Swans In 2020
Five Black Swans In 2020
His probability of winning the nomination is not overwhelming, but it is the highest of any contender. In recent polls, Biden comes third place in Millennial/Gen-Z vote preferences (Chart 18). Yet he is hardly out of contention, especially for the 30-44 year-old cohort. The view that “Uncle Joe” does not fit the Democratic Party zeitgeist has become so entrenched in the Democratic Party narrative that it became conventional wisdom last year, pulling oddsmakers and betting markets away from the clear frontrunner (Chart 19). As such, a Biden victory at the Democratic National Convention in Milwaukee, Wisconsin on July 13-16 may come as an affront to the left-wing activists who will surely descend on the convention. This will particularly be the case if Biden wins despite the progressive candidates amassing a majority of overall delegates, which is possible judging by the combined progressive vote share in current polling (Chart 20). He would arrive in Milwaukee without clearing the 1990 delegate count required to win on the first ballot. On the second ballot, his presidency would then receive a boost from “superdelegates” and those progressives who are unwilling to “rock the boat,” i.e. unify against an establishment candidate with the largest share of votes. This is also how Mayor Michael Bloomberg could pull off a surprise win. Chart 20Progressives Come Closest To Victory
Five Black Swans In 2020
Five Black Swans In 2020
Such a “brokered” – or contested – convention has not occurred since 1952. However, several Democratic Party conventions came close, including 1968, 1972, and 1984. The 1968 one in Chicago was notable for considerable violence and unrest. Even if the Milwaukee Democratic Party convention does not produce unrest, it could sow the seeds for unrest later in the year. First, a breakout Biden performance in the primaries is unlikely. As such, he will likely need to pledge a shift to the left at the convention, including by accepting a progressive vice-presidential candidate. Second, an actual progressive may win the primary. Chart 21Zealots In Both Parties Perceive Each Other As A National Threat
Five Black Swans In 2020
Five Black Swans In 2020
It is likely that either of the two options would be seen as an existential threat to many of Trump’s loyal supporters across the United States. President Trump’s rhetoric often paints the scenario of a Democratic takeover of the White House in apocalyptic terms. And data suggests that the zealots in both parties perceive each other as a “threat to the nation’s wellbeing” (Chart 21). The American Civil War in the nineteenth century began with the election of a president. This is not just because Abraham Lincoln was a particularly reviled figure in the South, but because the states that ultimately formed the Confederacy saw in his election the demographic writing-on-the-wall. The election was an expression of a general will that, from that point onwards, was irreversible. Given demographic trends in the US today, it is possible that many would see in Trump’s loss a similar fait accompli. If one perceives progressive Democrats as an existential threat to the US constitution, rebellion is the obvious and rational response. There is a risk of rebellion from Trump’s most ardent supporters if he loses the White House. Bottom Line: Year 2020 may be a particularly violent one for the US. First, left wing activists may be shocked and angered to learn that Joe Biden (or Bloomberg) is the nominee of the Democratic Party come July. With so much hype behind the progressive candidates throughout the campaign, Biden’s nomination could be seen as an affront to what was supposed to be “the big year” for left-wing candidates. Second, investors have to start thinking about what happens if Biden – or a progressive candidate – goes on to defeat President Trump in the general election. While liberal America took Trump’s election badly, it has demographics – and thus time – on its side. Trump’s most ardent supporters may conclude that his defeat means the end of America as they know it. Black Swan 4: Europe’s Migration Crisis Restarts Chart 22Decline In Illegal Immigration Dampened European Populism
Five Black Swans In 2020
Five Black Swans In 2020
It is a testament to Europe’s resilience that we do not have a Black Swan scenario based on an election or a political crisis set on the continent in 2020. Support for the common currency and the EU as a whole has rebounded to its highest since 2013. Even early elections in Germany and Italy are unlikely to produce geopolitical risk. The populists in the former are in no danger of outperforming whereas the populists in the latter barely deserve the designation. But what if one of the reasons for the surge in populism – unchecked illegal immigration – were to return in 2020? The data suggests that the risk of migrant flows has massively subsided. From its peak of over a million arrivals in 2015, the data shows that only 125,472 migrants crossed into Europe via land and sea routes in the Mediterranean last year (Chart 22). Why? There are five reasons that we believe have checked the flow of migrants: Supply: The civil wars in Syria, Iraq, and Libya have largely subsided. Heterogenous regions, cities, and neighborhoods have been ethnically cleansed and internal boundaries have largely ossified. It is unlikely that any future conflict will produce massive outflows of refugees as the displacement has already taken place. These countries are now largely divided into armed, ethnically homogenous, camps. Enforcement: The EU has stepped up border enforcement since 2015, pouring resources into the land border with Turkey and naval patrols across the Mediterranean. Individual member states – particularly Italy and Hungary – have also stepped up border enforcement policy. While most EU member states have publicly chided both for “draconian” policies, there is no impetus to force Rome and Budapest to change policy. Libyan Imbroglio: Conflict in Libya has flared up in 2019 with military warlord Khalifa Haftar looking to wrest control from the UN-backed Government of National Accord led by Fayez al-Serraj. The Islamic State has regrouped in the country as well. Ironically, the conflict is helping stem the flow of migrants as African migrants from sub-Saharan countries dare not cross into Libya as they did in 2015 when there was a brief lull in fighting. Turkish benevolence: Ankara is quick to point out that it is the only thing standing between Europe and a massive deluge of migrants. Turkey is said to host somewhere between two and four million refugees from various conflicts in the Middle East. Fear of the crossing: If crossing the Mediterranean was easy, Europe would have experienced a massive influx of migrants throughout the twentieth century. Not only is it not easy, it is costly and quite deadly, with thousands lost each year. Furthermore, most migrants are not welcomed when they arrive to Europe, many are held in terrible conditions in holding camps in Italy and Greece. Over time, migrants who made it into Europe have reported these dangers and conditions, reducing the overall demand for illegal migration. We do not foresee these five factors changing, at least not all at once. However, there are several reasons to worry about the flow of migrants in 2020. US-Iran tensions have sparked outright military action, while unrest is flaring up across Iran’s sphere of influence. Going forward, Iran could destabilize Iraq or fuel Shia unrest against US-backed regimes. Second, Afghanistan has been the source of most migrants to Europe via sea and land Mediterranean routes – 19.2%. The conflict in the country continues and may flare up with President Trump’s decision to formally withdraw most US troops from the country in 2020. Third, a break in fighting in Libya may encourage sub-Saharan migrants to revisit routes to Europe. Migrants from Guinea, Cote d’Ivoire, and the Democratic Republic of Congo make up over 10% of migrants to Europe. Finally, Turkish relationship with the West could break up further in 2020, causing Ankara to ship migrants northward. We highly doubt that President Erdogan will risk such a break, given that 50% of Turkish exports go to Europe. A European embargo on Turkish exports – which would be a highly likely response to such an act – would crush the already decimated Turkish economy. Bottom Line: While we do not see a return to the 2015 level of migration in 2020, we flag this risk because it would fundamentally undermine political stability in Europe. Black Swan 5: Russia Faces A “Peasant Revolt” Our fifth and final black swan risk for the year stems from Russia. This risk may seem obvious, since the US election creates a dynamic that revives the inherent conflict in US-Russian relations. Russia could seek to accomplish foreign policy objectives – interfering in US elections, punishing regional adversaries. The Trump administration may be friendly toward Russia but Trump is unlikely to veto any sanctions passed by the House and Senate in an election year, should an occasion for new sanctions arise. Conversely Russia could anticipate greater US pressure if the Democrats win in November. Yet it is Russia’s domestic affairs that represent the real underrated risk. Putin’s fourth term as president has been characterized by increased focus on domestic political control and stability as opposed to foreign adventurism. The creation of a special National Guard in 2016, reporting directly to Putin and responsible for quelling domestic unrest, symbolizes the shift in focus. So too does Russia’s adherence to the OPEC 2.0 regime of production control to keep oil prices above their budget breakeven level. Meanwhile Putin’s courting of Europe for the Nordstream II pipeline, and his slight peacemaking efforts with Ukraine, has suggested a slightly more restrained international posture. Chart 23Sluggish Wage Growth Threatens Russian Stability
Sluggish Wage Growth Threatens Russian Stability
Sluggish Wage Growth Threatens Russian Stability
Strategically it makes little sense for Russia to court negative attention at a time when the US and Europe are at odds over trade and the Middle East, the US is preoccupied with China and Iran, and Russia itself faces mounting domestic problems. The domestic problems are long in coming. The central bank has maintained a stringent monetary policy for the better part of the decade. Despite cutting interest rates recently, monetary and credit conditions are still tight, hurting domestic demand. Moscow has also imposed fiscal austerity, namely by cutting back on state pensions and hiking the value added tax. Real wage growth is weak (Chart 23), retail sales are falling, and domestic demand looks to weaken further, as Andrija Vesic of BCA Emerging Markets Strategy observes in a recent Special Report. The effect of Russia’s policy austerity has been a drop in public approval of the administration (Chart 24). Protests erupted in 2019 but were largely drowned out by the larger and more globally significant protests in Hong Kong. These were met by police suppression that has not removed their underlying cause. Putin’s first major decision of the new year was to reshuffle the government, entailing Prime Minister Dmitri Medvedev’s transfer to a new post and the appointment of a new cabinet. This move reveals the need to show some accountability to reduce popular pressure. While Moscow now has room to cut interest rates and ease fiscal policy, it is behind the curve and the weak economy will add fuel to domestic unrest. Meanwhile Putin’s efforts to alter the Russian constitution so he can stay in power beyond current term limits, effectively becoming emperor for life, like Xi Jinping, should not be dismissed merely because they are expected. They reflect a need to take advantage of Putin’s popular standing to consolidate domestic political power at a time when the ruling United Russia party and the federal government face discontent. They also ensure that strategic conflict with the United States will take on an ideological dimension. Chart 24Austerity Weighed On The Administration's Popularity In Russia
Austerity Weighed On The Administration's Popularity In Russia
Austerity Weighed On The Administration's Popularity In Russia
Chart 25Russian Political Risk Is Unsustainably Low
Russian Political Risk Is Unsustainably Low
Russian Political Risk Is Unsustainably Low
Russia's recent cabinet shakeup is positive from the point of view of economic reform. And the country's monetary and fiscal room provide a basis for remaining overweight equities within EM, as our Emerging Markets Strategy recommends. However, Russian equities have rallied hard and the political risk is understated. Bottom Line: It is never easy predicting Putin’s next international move. Our market-based indicators of Russian political risk have hit multi-year lows, but both the domestic and international context suggest that these lows will not be sustained (Chart 25). A new bout of risk can emanate from Putin, or from changes in Washington, or from the Russian people themselves. What would take the world by surprise would be domestic unrest on a larger scale than Russia can easily suppress through the police force. Housekeeping We are closing our long European Union / short Chinese equities strategic trade with a 1.61% loss since inception on May 10, 2019. Dhaval Joshi of BCA’s European Investment Strategy downgraded the Eurostoxx 50 to underweight versus the S&P 500 and the Nikkei 225 this week. He makes the point that the Euro Area bond yield 6-month impulse hit 100 bps – a critical technical level – and will be a strong headwind to growth. We will look to reopen this trade at a later date when the euphoria over the “phase one” trade deal subsides, as we still favor European equities and DM bourses over EM. We will reinstitute our long Brent crude H2 2020 versus H2 2021 tactical position, which was stopped out on January 9, 2020. We remain bullish on oil fundamentals and expect Middle East instability to add a political risk premium. China's stimulus and the oil view also give reason for us to reinitiate our long Malaysian equities relative to EM as a tactical position. The Malaysian ringgit will benefit as oil prices move higher, helping Malaysian companies make payments on their large pile of dollar-denominated debt and improving household purchasing power. Higher oil prices also correlate with higher equity prices, while China's stimulus and the US trade ceasefire will push the US dollar lower and help trade revive in the region. Marko Papic Consulting Editor marko@bcaresearch.com Matt Gertken Vice President Geopolitical Strategist mattg@bcaresearch.com Footnotes 1 Observe how little attention the public paid to US-China saber-rattling around China’s announcement of an Air Defense Identification Zone in the East China Sea that year.