Policy
The jump in overnight lending rates in mid-September torpedoed the Federal Reserve’s efforts to shrink its balance sheet. Thanks to a steady stream of Treasury bill purchases since then, the Fed’s asset holdings have swelled by over $400 billion, reversing…
In 2000, the Fed moved quickly to reverse the liquidity injection it had orchestrated the prior year. This time around, we do not expect such a reversal anytime soon. Moreover, unlike in 2000, when the Federal Reserve kept raising rates – ultimately bringing…

Highlights Global Investment Strategy View Matrix
Time For A Breather
Time For A Breather
Receding trade tensions; diminished risks of a hard Brexit; reduced odds of a victory for Elizabeth Warren in the US presidential elections; liquidity injections by most major central banks; and improved sentiment about the state of the global economy all helped push stocks higher late last year. Some clouds have formed over the outlook since the start of the year, however. The December US ISM manufacturing index fell to the lowest level since 2009, while the PMIs in the euro area, UK, and Japan gave up some of their November gains. The conflict between the US and Iran also flared up. Although tensions have abated in recent days, BCA’s geopolitical strategists worry that the détente may not last. The US is seeking to shift its military focus towards East Asia in order to counter China’s ascendency. They argue that this could create a dangerous power vacuum in the Middle East. Stock market sentiment is quite bullish at the moment, which makes equities more vulnerable to any disappointing news. While we are maintaining our positive 12-month view on global equities and high-yield credit in anticipation that global growth will rebound convincingly later this year, we are downgrading our tactical 3-month view to neutral. Ho Ho Ho After handing investors a sack of coal last Christmas, Santa was back to his true self this past holiday season. Global equities rose 3.4% in December, finishing the year off with a stellar fourth quarter which saw the MSCI All-Country World index surge by 8.6%. Five forces helped push stocks higher: 1) Receding trade tensions; 2) Diminished risks of a hard Brexit; 3) Reduced odds of a victory for Elizabeth Warren in the US presidential elections; 4) Liquidity injections by the Fed, ECB, and the People’s Bank of China; and arguably most importantly 5) Improved sentiment about the state of the global economy. Tarrified No More Trade tensions subsided sharply after China and the US reached a “Phase One” agreement. The deal prevented tariffs from rising on December 15th on $160 billion of Chinese imports. It also rolls back the tariff rate from 15% to 7.5% on about $120 billion in imports that have been subject to levies since September (Chart 1). Chart 1The Evolution Of The US-China Trade War
The Evolution Of The US-China Trade War
The Evolution Of The US-China Trade War
In addition, the Trump Administration allowed the November 13th deadline on European auto tariffs to lapse. This suggests that the US is unlikely to impose tariffs under the Section 232 investigation of auto imports. The auto sector has been at the forefront of the global manufacturing slowdown, so any good news for that industry is welcome. To top it all off, the US House of Representatives ratified the USMCA, the successor to NAFTA, on December 19th. We expect it to be signed into law in the first quarter of this year. Brexit Risks Fading... Chart 2The Majority Of British Voters Aren't Keen On Brexit
The Majority Of British Voters Aren't Keen On Brexit
The Majority Of British Voters Aren't Keen On Brexit
Boris Johnson’s commanding victory in the UK elections has given him the votes necessary to push a withdrawal bill through parliament by the end of the month. The British government will then seek to negotiate a free trade agreement by the end of the year. A “no-deal” Brexit is unacceptable to the majority of British voters (Chart 2). As such, the Johnson government will have no choice but to strike a deal with the EU. ... While Trump Gains On the other side of the Atlantic, President Trump’s re-election prospects improved late last year despite (and perhaps because of) the ongoing impeachment process. There is an uncanny correlation between the probability that betting markets assign to a Trump victory and the value of the S&P 500 (Chart 3). Chart 3An Uncanny Correlation
An Uncanny Correlation
An Uncanny Correlation
Chart 4Who Will Win The 2020 Democratic Nomination?
Time For A Breather
Time For A Breather
It certainly has not hurt market sentiment that Elizabeth Warren’s poll numbers have been dropping recently (Chart 4). Warren’s best hope was to squeeze out Bernie Sanders as soon as possible, thereby leaving the far-left populist lane all to herself. That dream appears to have been dashed, which suggests that even if Trump loses, a centrist like Joe Biden could emerge as president. An Uneasy Truce It remains to be seen how President Trump’s decision to assassinate General Qassem Soleimani, a top Iranian commander, will affect the election outcome. A YouGov/HuffPost poll taken over the weekend revealed that 43% of Americans approved of the airstrike against Soleimani compared to 38% that disapproved.1 History suggests that the public’s patience for war will quickly wear thin if it results in American casualties or significantly higher gasoline prices. Neither side has an incentive to allow the conflict to spiral out of control. Foreign minister Mohammad Javad Zarif tweeted on Tuesday shortly after Iran lobbed missiles at two US military bases that Iran had “concluded” its retaliatory strike, adding that “We do not seek escalation or war.” Despite claims on Iranian public television that 80 “American terrorists” were killed in the attacks, no US troops were harmed. This suggests that the Iranians may be putting on a show for domestic consumption. The US economy is less vulnerable to spikes in oil prices than in the past. Nevertheless, plenty of things could still go wrong. BCA’s geopolitical team, led by Matt Gertken, has argued that the US is seeking to shift its military focus towards East Asia in order to counter China’s ascendency. This could create a dangerous power vacuum in the Middle East. There is also a risk that President Trump overplays his hand. Contrary to the President’s claims, Soleimani was quite popular in Iran (Chart 5). If Trump begins to mock the Iranian leadership’s feeble response, Iran will have no choice but to take more aggressive action. Chart 5Soleimani Was More Popular In Iran Than Trump Claims
Time For A Breather
Time For A Breather
Chart 6US Economy Is Less Vulnerable To Spikes In Oil Prices Than In The Past
US Economy Is Less Vulnerable To Spikes In Oil Prices Than In The Past
US Economy Is Less Vulnerable To Spikes In Oil Prices Than In The Past
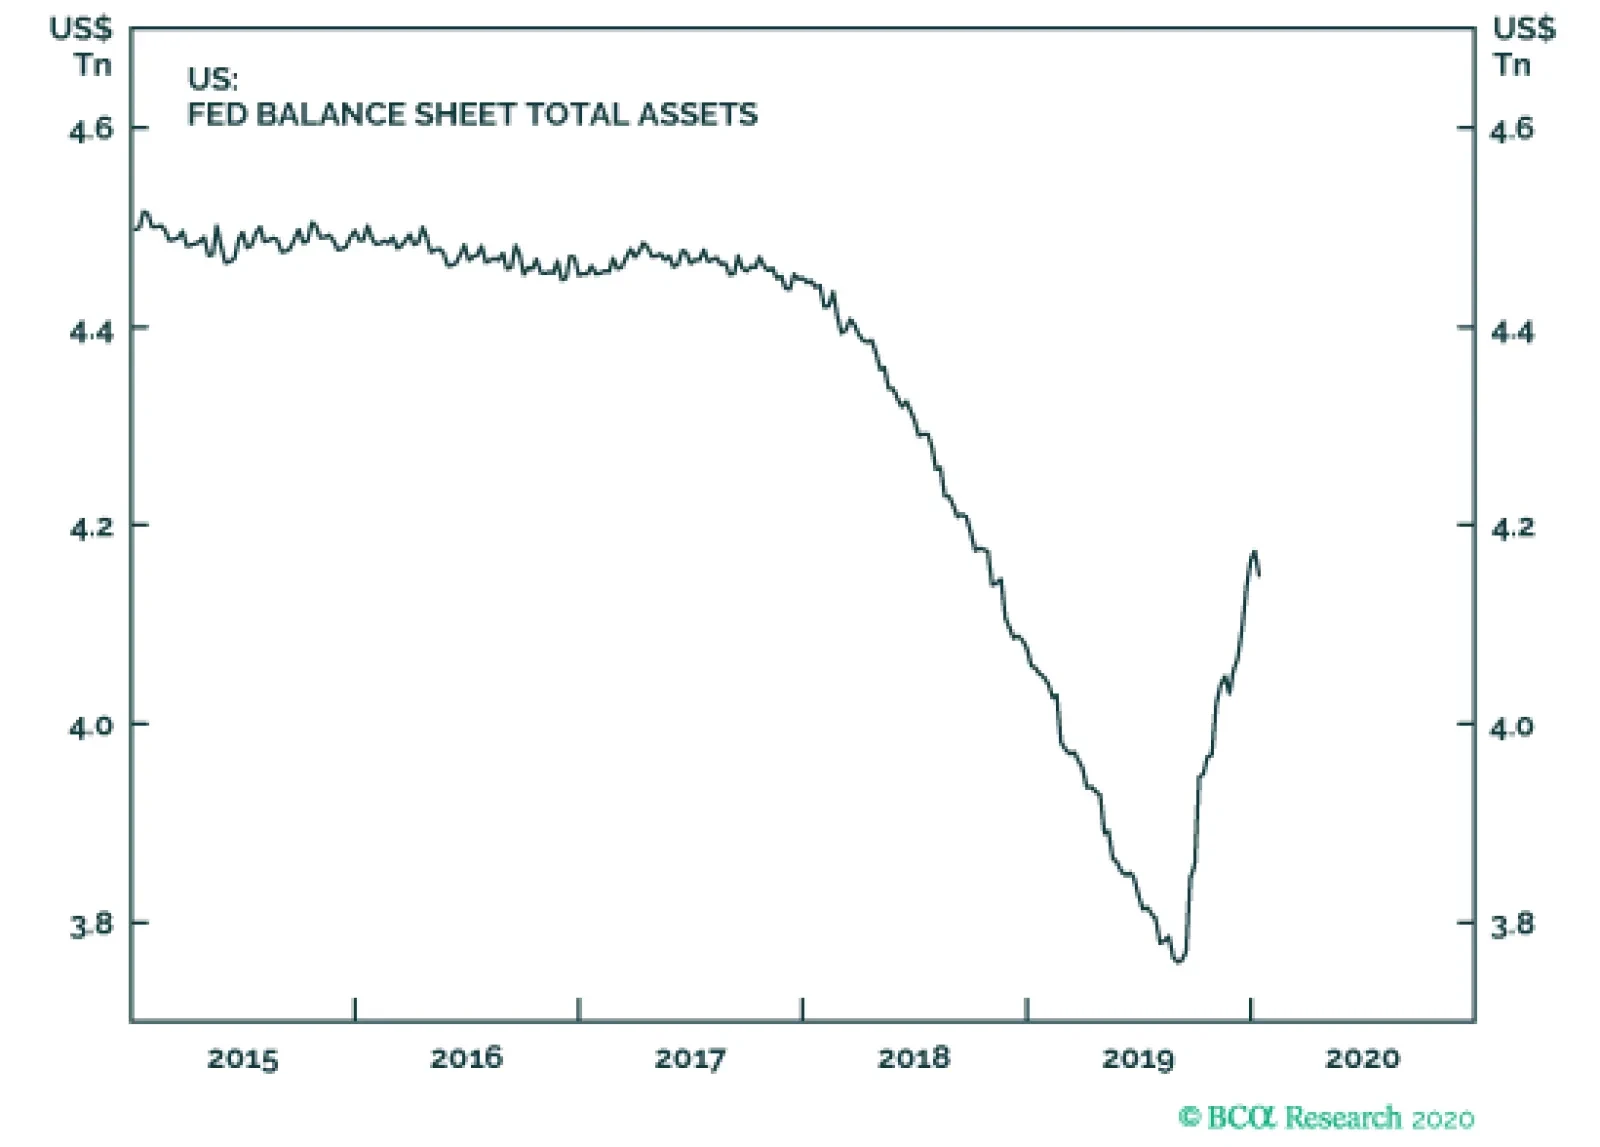
One thing that could embolden Trump is that the US economy is less vulnerable to spikes in oil prices than in the past. US oil output reached as high as 12.9 mm b/d in 2019, allowing the country to become a net exporter of oil for the first time in history (Chart 6). Any increase in oil prices would incentivize further domestic production, which would help bring prices back down. The US economy has also become less energy intensive – it takes less than half as much oil to produce a unit of GDP today than it did in the early 1980s. Finally, unlike in the past, the Fed will not need to raise rates in response to higher oil prices due to the fact that inflation expectations are currently well anchored. In fact, as we discuss below, we expect the Fed and other central banks to continue to provide a tailwind for growth over the course of 2020. The Fed’s “It’s Not QE” QE Program The jump in overnight lending rates in mid-September torpedoed the Federal Reserve’s efforts to shrink its balance sheet. Thanks to a steady stream of Treasury bill purchases since then, the Fed’s asset holdings have swelled by over $400 billion, reversing more than half of the decline observed since early 2018 (Chart 7). Chart 7Fed's Asset Holdings Are Growing Anew
Fed's Asset Holdings Are Growing Anew
Fed's Asset Holdings Are Growing Anew
Chart 8The Fed's Balance-Sheet Expansion Helped Fuel The Dot-Com Bubble
The Fed's Balance-Sheet Expansion Helped Fuel The Dot-Com Bubble
The Fed's Balance-Sheet Expansion Helped Fuel The Dot-Com Bubble
The Fed has insisted that its latest intervention does not amount to a new QE program, stressing that it is buying short-term securities rather than long-dated bonds. In so doing, it is simply creating bank reserves, rather than seeking to suppress the term premium by altering the maturity structure of the private sector’s holdings of government debt. Nevertheless, even such straightforward interventions have proven to be powerful signaling tools. By growing its balance sheet, a central bank is implicitly promising to keep monetary policy very accommodative. It is worth remembering that the run-up in the NASDAQ in 1999 coincided with a significant balance-sheet expansion by the Fed in response to Y2K fears, which came on the heels of three “insurance cuts” in 1998 (Chart 8). Gentle Jay Paves The Way Chart 9Inflation Expectations Remain Muted
Inflation Expectations Remain Muted
Inflation Expectations Remain Muted
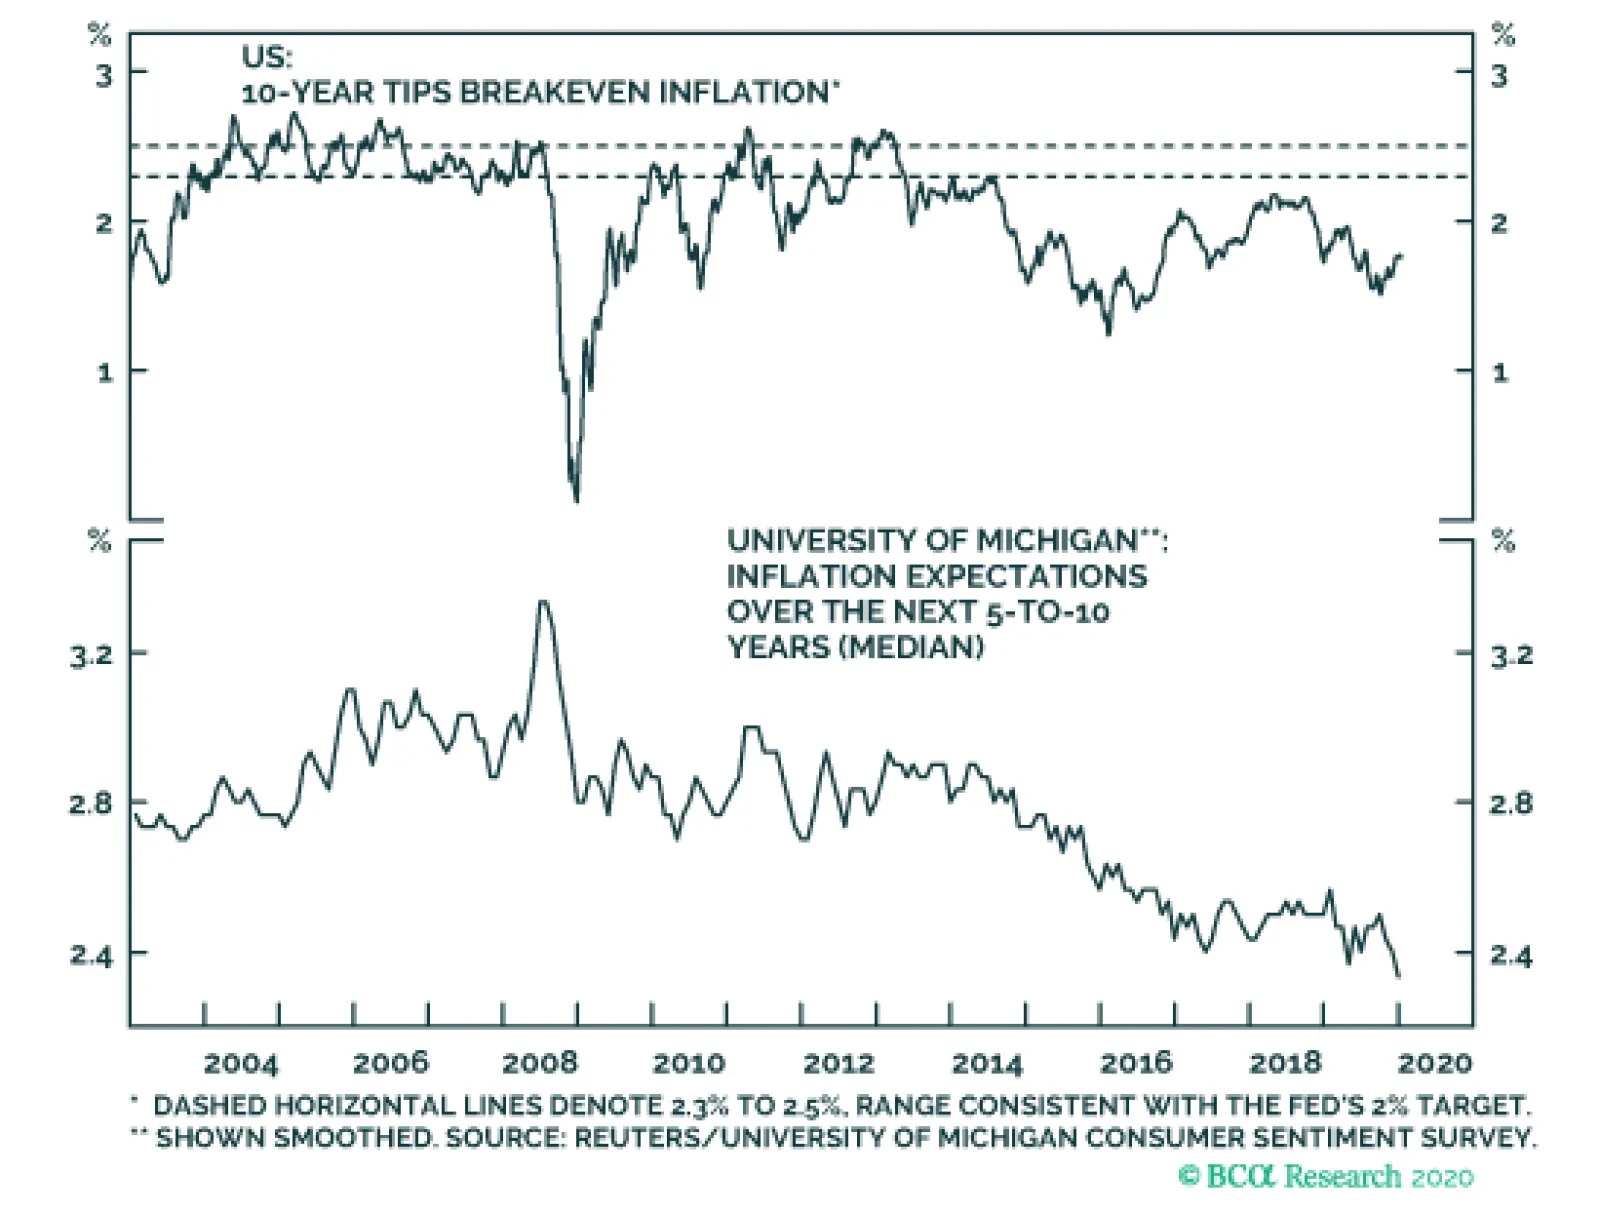
In 2000, the Fed moved quickly to reverse the liquidity injection it had orchestrated the prior year. We do not expect such a reversal anytime soon. Moreover, unlike in 2000, when the Federal Reserve kept raising rates – ultimately bringing the Fed funds rate up to 6.5% in May 2000 – the Fed is likely to stay on hold this year. The Fed’s ongoing strategic policy review is poised to move the central bank even closer towards explicitly adopting an average inflation target of 2% over the course of a business cycle. Since inflation tends to fall during recessions, this implies that the Fed will seek to target an inflation rate somewhat higher than 2% during expansions. Realized core PCE inflation has averaged only 1.6% since the recession ended. Both market-based and survey-based measures of long-term inflation expectations remain downbeat (Chart 9). This suggests that the bar for raising rates this year is quite high. More Monetary Easing In The Euro Area And China Chart 10Chinese Monetary Easing Should Help Global Growth Bottom Out
Chinese Monetary Easing Should Help Global Growth Bottom Out
Chinese Monetary Easing Should Help Global Growth Bottom Out
The ECB resumed its QE program in November after a 10-month hiatus. While the current pace of €20 billion in monthly asset purchases is well below the prior pace of €80 billion, the central bank did say it would continue buying assets for “as long as necessary” to bring inflation up to its target. The language harkens back to Mario Draghi’s 2012 “whatever it takes” pledge, this time applied to the ECB’s inflation mandate. Not to be outdone, the People’s Bank of China cut the reserve requirement ratio by 50 basis points last week, a move that will release RMB 800 billion ($US 115 billion) of fresh liquidity into the banking system. Historically, cuts in reserve requirements have led to faster credit growth and ultimately, to stronger economic growth both in China and abroad (Chart 10). The PBOC has also instructed lenders to adopt the Loan Prime Rate (LPR) as the new benchmark lending rate. The LPR currently sits 20bps below the old benchmark rate (Chart 11). Hence, the PBOC’s order amounts to a stealth rate cut. Our China strategists expect further reductions in the LPR over the next six months. In addition, the crackdown on shadow bank lending seems to be subsiding, which bodes well for overall credit growth later this year (Chart 12). Chart 11China: Stealth Monetary Easing
China: Stealth Monetary Easing
China: Stealth Monetary Easing
Chart 12Crackdown On Shadow Banking In China Is Easing
Crackdown On Shadow Banking In China Is Easing
Crackdown On Shadow Banking In China Is Easing
Rising Economic Confidence Chart 13Recession Fears Amongst Economists Began To Gather Steam At The Start Of Last Year
Recession Fears Amongst Economists Began To Gather Steam At The Start Of Last Year
Recession Fears Amongst Economists Began To Gather Steam At The Start Of Last Year
Chart 14The Wider Public Was Also Worried About A Downturn
The Wider Public Was Also Worried About A Downturn
The Wider Public Was Also Worried About A Downturn
At the start of 2019, nearly half of US CFOs thought the economy would be in a recession by the end of the year. Similarly, two-thirds of European CFOs and four-fifths of Canadian CFOs expected their respective economies to succumb to recession. Professional economists were equally dire (Chart 13). Households also became increasingly worried about a downturn. Google searches for “recession” spiked to near 2009-highs last summer (Chart 14). The mood has certainly improved since then. According to the latest Duke CFO survey, optimism about the economic outlook has increased. More importantly, CFO optimism about the prospects for their own firms has risen to the highest level in the 18-year history of the survey (Chart 15). Chart 15CFOs Have Become More Optimistic Of Late
CFOs Have Become More Optimistic Of Late
CFOs Have Become More Optimistic Of Late
Show Me The Money Going forward, global growth needs to accelerate in order to validate the improved confidence of CFOs and investors alike. We think that it will, thanks to the lagged effects from the easing in financial conditions in 2019, a turn in the global inventory cycle, a de-escalation in the trade war, easier fiscal policy in the UK and euro area, and re-upped fiscal/credit stimulus in China. For now, however, the economic data remains mixed. On the positive side, household spending is still robust across most of the world, a fact that has been reflected in the resilience of service-sector PMIs (Chart 16). Chart 16AThe Service Sector Has Remained Resilient (I)
The Service Sector Has Remained Resilient (I)
The Service Sector Has Remained Resilient (I)
Chart 16BThe Service Sector Has Remained Resilient (II)
The Service Sector Has Remained Resilient (II)
The Service Sector Has Remained Resilient (II)
Chart 17US Wage Growth Has Picked Up, Especially At The Bottom Of The Income Distribution
Time For A Breather
Time For A Breather
Chart 18US Housing Backdrop Is Solid
US Housing Backdrop Is Solid
US Housing Backdrop Is Solid
The US consumer, in particular, is showing little signs of fatigue. The Atlanta Fed GDPNow estimates that real personal consumption grew by 2.4% in the fourth quarter, having increased at an average annualized pace of 3% in the first three quarters of 2019. Both a strong labor market and housing market have buoyed US consumption. Payrolls have risen by an average of 200K per month for the past six months, double what is necessary to keep up with labor force growth. This week’s strong ADP release – which featured a 29K jump in jobs in goods-producing industries in December, the best since April – suggests that today’s jobs report will remain healthy. In addition, wage growth has picked up, particularly at the bottom of the income distribution (Chart 17). Residential construction has also been strong. Homebuilder sentiment reached the best level since June 1999 (Chart 18). Global Manufacturing: Too Early To Call The All-Clear The outlook for manufacturing remains the biggest question mark in the global economy. The US ISM manufacturing index dropped to 47.2 in December, its lowest level since June 2009. The composition of the report was poor, with the new orders-to-inventory ratio dropping close to recent lows. Chart 19Other US Manufacturing Gauges Are Not As Weak As The ISM
Other US Manufacturing Gauges Are Not As Weak As The ISM
Other US Manufacturing Gauges Are Not As Weak As The ISM
We would discount the ISM report to some extent. The regional Fed manufacturing indices have not been nearly as disappointing as the ISM (Chart 19). The Markit PMI, which tracks US manufacturing activity better than the ISM, clocked in at a respectable 52.4 in December, down only slightly from November’s reading of 52.6. Nevertheless, it is hard to be excited about the near-term outlook for US manufacturing, especially in light of Boeing’s decision to suspend production of the 737 Max temporarily. Most estimates suggest that the production halt will reduce real US GDP growth by 0.3%-to-0.5% in the first quarter. The euro area manufacturing PMI gave up some of its November gains, falling to 46.3 in December. While the index is still above its September low of 45.7, it has been under 50 for 11 straight months now. The UK and Japanese PMI also retreated. Chinese manufacturing has shown clearer signs of bottoming out. Despite dipping in December, the private sector Caixin manufacturing PMI remains near its 2017 highs. The official PMI published by the National Bureau of Statistics is less upbeat, but still managed to come in slightly above 50 in December. The production subcomponent reached the highest level since August 2018. Reflecting the positive trend in the Chinese economy, Korean exports to China rose by 3.3% in December, the first positive growth rate in 14 months (Chart 20). Taiwan’s exports have also rebounded. The manufacturing PMI rose above 50 in both economies in December. In Taiwan’s case, this was the first time the PMI moved into expansionary territory since September 2018. On balance, we continue to expect global manufacturing to recover in 2020. This is in line with our observation that global manufacturing cycles typically last three years, with 18 months of weaker growth followed by 18 months of stronger growth (Chart 21). That said, the weakness in European and US manufacturing (at least judged by the ISM) is likely to give investors pause. Chart 20Some Positive Signs Emerging From Korea And Taiwan
Time For A Breather
Time For A Breather
Chart 21A Fairly Regular Three-Year Manufacturing Cycle
A Fairly Regular Three-Year Manufacturing Cycle
A Fairly Regular Three-Year Manufacturing Cycle
Investment Conclusions We turned bullish on stocks in late 2018, having temporarily moved to the sidelines during the summer of that year. Global equities have gained 25% since our upgrade. We see another 10% of upside for 2020, led by European and EM bourses. Despite its recent gains, the real value of the MSCI All-Country World Index is only 3% above its prior peak in January 2018. The 12-month forward PE ratio of 16.3 is still somewhat lower than it was back then. The valuation picture is even more enticing if we compare equity earnings yields with bond yields, which is tantamount to computing a rough equity risk premium (ERP). The global ERP remains quite high by historic standards, especially outside the US where earnings yields are higher and bond yields are generally lower (Chart 22). Chart 22The Equity Risk Premium Is Fairly High, Especially Outside The US
The Equity Risk Premium Is Fairly High, Especially Outside The US
The Equity Risk Premium Is Fairly High, Especially Outside The US
Chart 23Stock Market Sentiment Is Quite Bullish
Stock Market Sentiment Is Quite Bullish
Stock Market Sentiment Is Quite Bullish
Nevertheless, sentiment is quite positive towards stocks at the moment (Chart 23). Elevated bullish sentiment, against the backdrop of ongoing uncertainty about the outlook for global manufacturing and an uneasy truce between the US and Iran, poses a near-term headwind to risk assets. As such, while we are maintaining our positive 12-month view on global equities and high-yield credit, we are downgrading our tactical 3-month view to neutral for the time being. We do not regard this as a major realignment of our views; we will turn tactically bullish again if stocks dip about 5% from current levels. Peter Berezin Chief Global Strategist peterb@bcaresearch.com Footnotes 1 Ariel Edwards-Levy, “Here's What Americans Think About Trump's Iran Policy,” TheHuffingtonPost.com (January 6, 2020). MacroQuant Model And Current Subjective Scores
Time For A Breather
Time For A Breather
Strategic Recommendations Closed Trades
Any signs that inflation expectations are rising would signal that we are truly in the “end game”. For now, there are no such signs. US inflation is likely to soften over the next six months, as a result of the economic slowdown and strong dollar. And TIPS…
Highlights The consensus view seems to be that equities have to cool off in 2020, even if the danger has passed: Recession fears have dissipated as the yield curve has returned to its normal upward-sloping orientation and US-China trade tensions have abated, but equity return expectations are modest following last year’s bonanza. We agree that a bear market is unlikely, but expect a better year than the consensus, … : Bull markets tend to sprint to the finish line, and if the next recession won’t start before the middle of 2021, 2020 should be another strong year for the S&P 500. … even if earnings growth is uninspiring: Multiples almost always expand when the Fed eases from an already accommodative position, and they expand a lot provided the Fed isn’t easing in response to a market bust or financial crisis. We expect that an inflation revival will take the consensus by surprise, but not this year: We think rising inflation will induce the Fed to bring the curtain down on the expansion and the equity bull market, but not until 2021 at the earliest. Feature We spent the last full week before the holidays meeting with clients and prospects on the west coast. As they look ahead to 2020, investors don’t see any major storm clouds on the horizon, but they sense that stocks have run about as far as they can. We agree with the view that neither a recession nor a bear market awaits, but we expect equities will comfortably outdistance bonds and cash. Forced to take a stand on whether the S&P 500 will beat or fall short of the typical consensus expectation for mid-to-high-single-digit gains,1 we would happily bet the over. As we detailed in our last two publications in December, our optimistic take stems from the deliberately reflationary policy being pursued by the Fed and other major central banks. Restoring inflation expectations to its desired range is job number one for the Fed, and its open commitment to doing so ensures that risk assets will have the monetary policy wind at their back for an extended period. The European Central Bank and the Bank of Japan want to rekindle inflation as well, and can be counted upon to maintain easy policy settings. The rest of the world’s central banks will continue to take their cue from their more influential peers, as no one wants the export headwind of a strong currency in a low-growth environment. Earnings growth has been the primary driver of the 11-year-old equity bull market, not multiple expansion. In our base-case scenario, easy monetary policy will encourage multiple expansion, while a less threatening trade climate, and a modest revival in Chinese aggregate demand, will boost economic activity, especially outside of the US. The modest global acceleration provoked by a pickup in Chinese imports will support earnings growth, so that both equity drivers, earnings and multiples, will be moving in the right direction. We anticipate that at least half of the current bull market’s remaining upside will come from multiple expansion, however. Dismaying as it might be for investors with a value bent, our bull thesis is built on the view that today’s fully-to-somewhat-richly-valued stocks will become overvalued before this market cycle is complete. A Stealth Earnings Boom Skeptics of the efficacy of extraordinarily accommodative monetary policy have decried the current bull market as “manipulated,” fed by monetary steroid injections that have inflated asset prices at the cost of undermining the real economy’s future prospects. The data flatly contradict the skeptics’ claims: since the end of February 2009, consensus forward four-quarter S&P 500 earnings expectations have grown at an annualized rate of 9.6% (Chart 1, middle panel), while the forward multiple has expanded at a 4.6% pace (Chart 1, bottom panel). Growth in forward earnings estimates has accounted for two-thirds of the 14.6% annualized appreciation in the S&P 500 (Chart 1, top panel); multiple expansion has only contributed a third. Chart 1A Great Decade For Earnings
A Great Decade For Earnings
A Great Decade For Earnings
Chart 2DM Growth Has Been Weak
DM Growth Has Been Weak
DM Growth Has Been Weak
Positioning for a valuation overshoot does not inspire as much confidence as positioning for robust earnings growth. US economic growth has been lackluster since the crisis (Chart 2, top panel), and it’s been downright anemic in Europe (Chart 2, middle panel) and Japan (Chart 2, bottom panel). Few investors foresaw potent earnings growth against that macro backdrop, as aggregate corporate revenue growth ought to converge with nominal GDP growth over time. Only margin expansion could deliver S&P 500 earnings growth above and beyond a meager 4% revenue growth base. As early as 2011, US corporate profit margins looked quite stretched (Chart 3), making further expansion seem improbable. After adjusting for the secular decline in effective corporate income tax rates, corporations’ growing share of national income, the expansion of the high-margin financial sector and the secular decline in debt service costs,2 however, history suggested that profit margins still had room to grow. It would be 2018 before they would peak, thanks in part to the 40% cut in the top marginal corporate income tax rate, and the plunge in debt service costs (Chart 4). Compensation is corporations’ single largest expense, though, and the inexorable decline in labor's share of profits was the key driver (Chart 5). Since China’s entry into the WTO, real wages have failed to keep up with productivity gains (Chart 6), dramatizing the shift of profit share from labor to capital. Chart 3Never Say Die Margin Growth, Nourished On...
Never Say Die Margin Growth, Nourished On...
Never Say Die Margin Growth, Nourished On...
Chart 4... Rock-Bottom Rates ...
... Rock-Bottom Rates ...
... Rock-Bottom Rates ...
Chart 5... And Labor's Woes
... And Labor's Woes
... And Labor's Woes
Chart 6Globalization Has Helped Corporate Profits
Globalization Has Helped Corporate Profits
Globalization Has Helped Corporate Profits
Profit margins contracted across the first three quarters of 2019, with per-share revenue growth topping per-share earnings growth by an average of three percentage points. We expect that real unit labor costs will rise as the pendulum swings back in labor’s direction in line with an extremely tight job market and a slowdown in outsourcing as globalization loses momentum. Revived activity in the rest of the world can offset some margin pressure from a rising wage bill, however, especially if it helps push the dollar lower. And rising wages aren’t all bad for profits, as rising household income leads to rising consumption, and rising consumption boosts corporate revenue growth. In our base-case 2020 scenario, S&P 500 earnings will grow despite accelerating wage growth. Multiples And The Monetary Policy Cycle Although the S&P 500’s forward multiple is already elevated (Chart 7), the historical relationship between monetary policy and equity multiples argues that re-rating is more likely than de-rating going forward. We divide the fed funds rate cycle (Chart 8) into four phases based on the direction of the fed funds rate (higher or lower) and the state of monetary policy (easy or tight). We are currently in Phase IV, when the Fed has most recently eased policy while policy settings were already accommodative. If margins have finally peaked, multiple expansion will have to assume a bigger role in supporting the bull market. Chart 7Elevated But Not Worrisome
Elevated But Not Worrisome
Elevated But Not Worrisome
Chart 8The Fed Funds Rate Cycle
The Conventional Wisdom
The Conventional Wisdom
Since consensus earnings estimates began to be compiled in 1979, forward multiples have shrunk when the Fed hikes rates and expanded when it cuts them (Table 1). The empirical results align with intuition and arithmetic: investors should become stingier when the rate used to discount future earnings rises, and more generous when that rate falls. While we believe that the mid-cycle rate cuts are finished and that the fed funds rate will fall no further over the rest of this bull market, continued multiple expansion does not require continued rate cuts. Phase IV usually ends with an extended stretch when the Fed holds the funds rate at its trough level, but forward multiples do not peak until the final stages of the phase. Making the intuition-and-arithmetic statement more exact, investors become more generous when rates fall, and remain that way until a rate hike is a sure bet. Table 1A Consistent Inverse Relationship
The Conventional Wisdom
The Conventional Wisdom
Away from the last two Phase IVs, when the Fed cut rates in response to the duress issuing from the end of the dot-com mania and the financial crisis, re-rating gains have been significantly larger. Table 2 details the changes in multiples in each Phase IV episode over the last 40 years. Away from the grinding de-rating following the dot-com bust, and the slow re-rating accompanying the tepid post-crisis recovery, multiples have expanded at better than a 17% annualized rate. Voluntary cuts like last summer’s, made when policy is already easy, independent of the imperative to nurse a post-crisis economy back to health, have been awfully good for investors. Table 2Voluntary Cuts Turbocharge Multiples
The Conventional Wisdom
The Conventional Wisdom
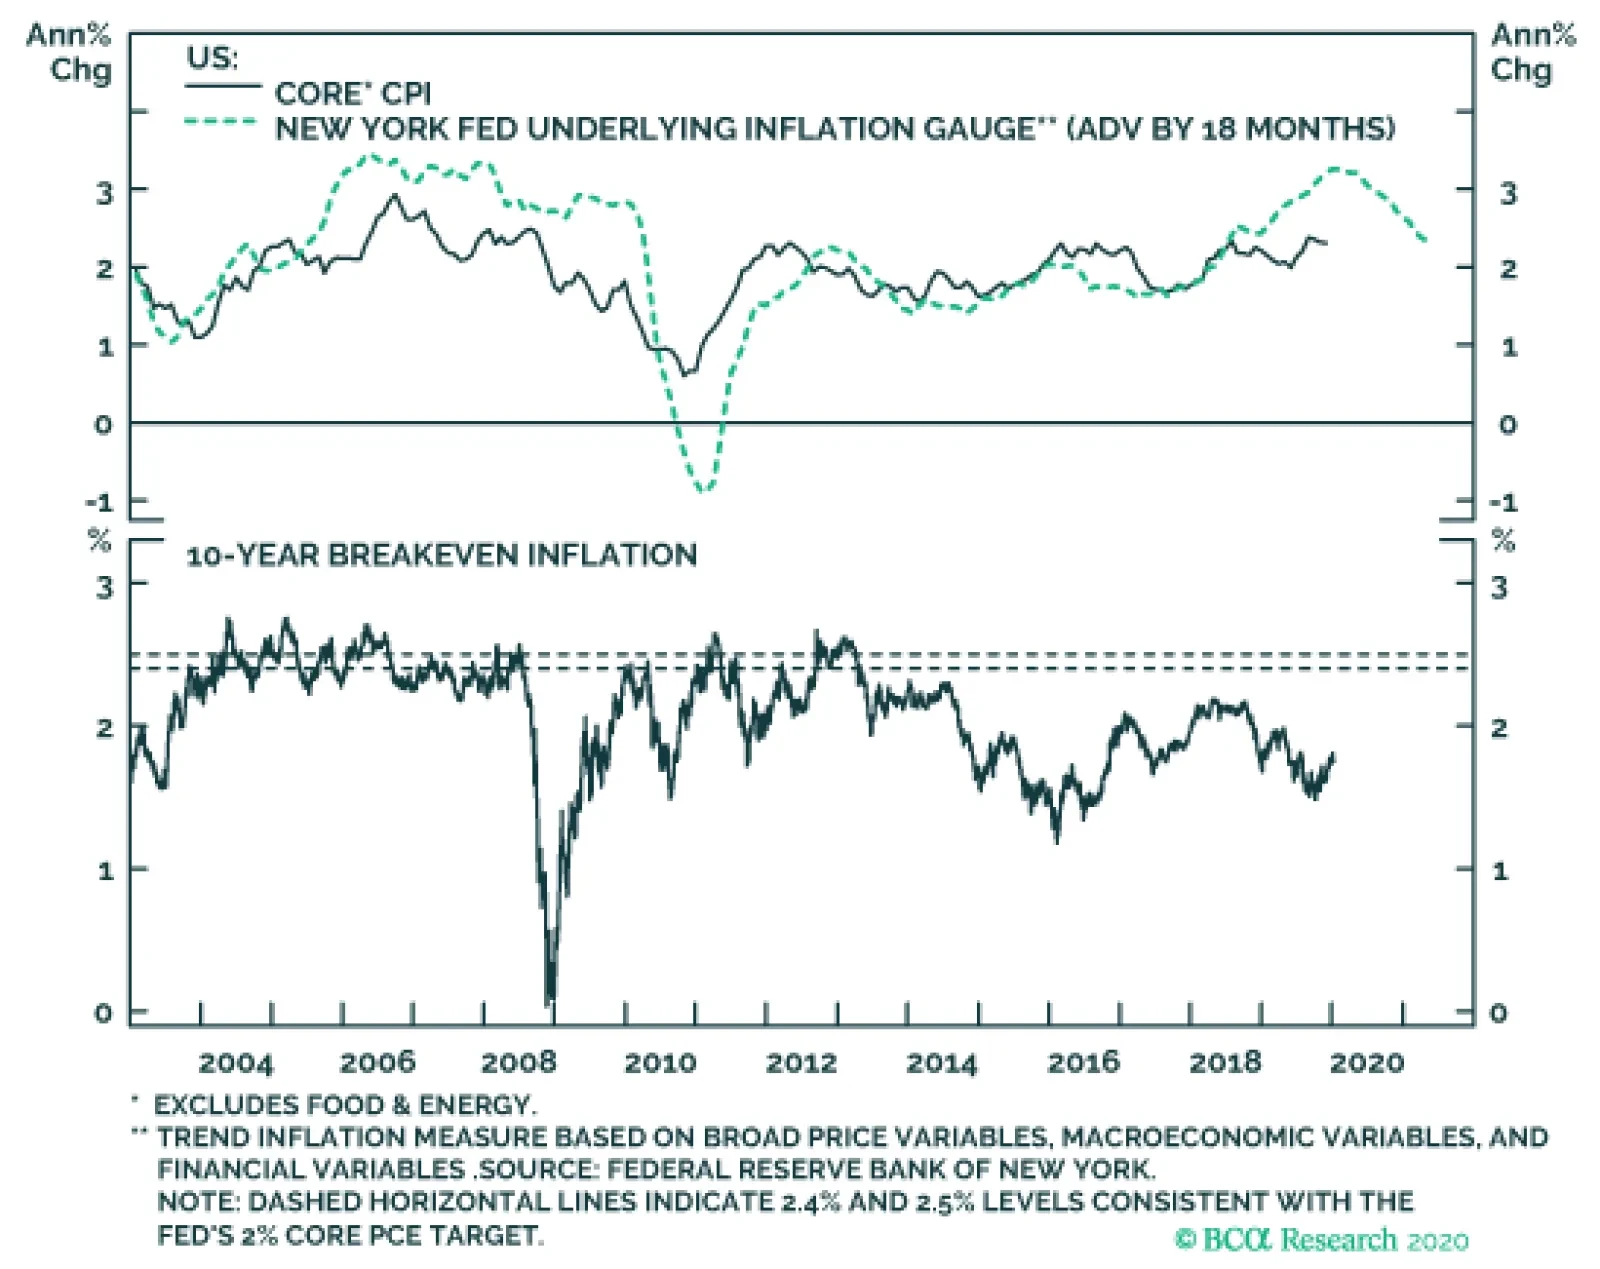
There have been only two instances when the starting multiple has been as high as it was at the start of the latest run of rate cuts. As noted above, conditions in the spring of 2001, when the NASDAQ was a year into its eventual two-and-a-half-year slide, and a recession had just begun, bear little resemblance to conditions today. The fall of 1998, when the Fed delivered a rapid-fire 75 basis points of easing to protect the economy from the potential ramifications of Long Term Capital Management’s failure, looks a lot more like last summer. It is not our base case that the latest round of insurance cuts will push forward multiples to dot-com levels, but they do have scope to expand. The Inflation Timetable It remains our high-conviction view that inflation expectations will not return to the Fed’s target levels quickly. Their path has seemed to provide a nearly perfect real-life case study supporting the adaptive expectations framework, which posits that the recent past exerts a powerful influence on near-term expectations about the future. Inflation is way down the list of investors’ concerns because it has been dormant ever since the crisis, just as it was in the mid-‘60s once memories of high postwar inflation had faded. It conversely remained an acute fear for more than a decade after the Volcker Fed turned the tide in the early ‘80s (Chart 9). Multiples have really surged when the Fed has provided discretionary accommodation outside of periods of distress. The slow but meaningful rise in the trimmed mean PCE (Chart 10, top panel) and CPI series3 (Chart 10, bottom panel) should pull core PCE and core CPI higher over time. In the near term, however, the absence of upward momentum in several leading inflation indicators will likely stretch “over time” beyond the first half of the year, if not the whole year. As tight as the labor market is, unit labor costs have not been able to break out of the range that’s contained them for the last five years (Chart 11, top panel); the New York Fed’s Underlying Inflation Gauge has pulled a disappearing act after a seemingly decisive breakout in mid-2018 (Chart 11, middle panel); and the share of small businesses planning price increases has come off the late 2018 boil (Chart 11, bottom panel). Chart 9Recency Bias In Action
Recency Bias In Action
Recency Bias In Action
Chart 10Inflation's Not Dead, ...
Inflation's Not Dead, ...
Inflation's Not Dead, ...
Chart 11... But It's Still Hibernating
... But It's Still Hibernating
... But It's Still Hibernating
Investment Implications We spent the holidays reading up on the history of strikes in the United States and believe a shift in the balance of negotiating power from management to labor may be stirring, as a two-part Special Report will soon explore. Such a shift would render wages much more sensitive to a lack of labor market slack. Upward wage pressure could then filter into consumer prices either via a cost-push or demand-pull framework, as corporations either seek to defend margins from higher input costs or try to implement opportunistic price hikes. Cost-push or demand-pull, many investors seem to be dismissing the potential for an inflation revival, especially the ones we met in northern California, where the deeply held consensus view asserts that looming job destruction from artificial intelligence makes broad wage growth all but impossible. Inflation is not an immediate concern, but we expect it will ultimately spell the end of the bull market and the expansion. Allocating a generous share of long-maturity Treasury exposures to TIPS is an excellent way to protect a portfolio against its eventual re-emergence. We advise investors to maintain at least an equal weight allocation to equities to profit from our view that ongoing multiple expansion will surprise to the upside. Risk-friendly positioning remains appropriate, as long as intensifying US-Iran tensions or other geopolitical conflicts don’t negate the positive impact of reflationary monetary policy. Doug Peta, CFA Chief US Investment Strategist dougp@bcaresearch.com Footnotes 1 The ten buy- and sell-side strategists surveyed in Barron’s 2020 Outlook, published December 16th, called for an average gain of 4%. 2 Please see the October 2012 BCA Special Report, “Are US Corporate Profit Margins Really All That High?” available at www.bcaresearch.com. 3 Trimmed-mean inflation series operate like figure skating judging in the Olympics – the top and bottom readings are thrown out, and the mean is calculated from the remaining scores.
Feature Recommended Allocation
Monthly Portfolio Update: Counting The Milestones
Monthly Portfolio Update: Counting The Milestones
Since BCA published its 2020 Outlook,1 and the December GAA Monthly Portfolio Update,2 nothing has happened to make us fundamentally change our views. We see the global manufacturing cycle rebounding over the coming quarters, but major central banks remaining dovish. This combination of accelerating growth and easy monetary policy should be positive for risk assets. We accordingly continue to recommend an overweight on equities versus bonds, prefer the more cyclical euro zone and EM equity markets over the US, and selectively like credit (particularly the riskier end of the US junk bond universe). In the 2020 Outlook, we laid out a series of milestones that would indicate how our scenario is playing out: whether we need to reconsider it, or whether we should be adding further to risk (Table 1). Here is how those milestones are progressing. Table 1Milestones For The 2020 Outlook
Monthly Portfolio Update: Counting The Milestones
Monthly Portfolio Update: Counting The Milestones
Chinese growth. Total Social Financing picked up in November (CNY1.75 trillion versus CNY619 billion the previous month) and the most recent hard data (notably retail sales and industrial production) showed improvement. But the momentum of credit creation and activity generally remain weak (Chart 1). We expect that Chinese growth will begin to accelerate in early 2020, due to the lagged effect of monetary stimulus in the first half of last year, and easier fiscal policy. Moreover, December’s annual Central Economic Work Conference pointed to greater government emphasis on growth stability.3 The clampdown on shadow banking also seems to be easing (Chart 2). However, we need to see further signs of Chinese growth accelerating before, for example, we become more bullish on Emerging Markets and commodities. Chart 1Chinese Credit And Activity Remain Weak
Chinese Credit And Activity Remain Weak
Chinese Credit And Activity Remain Weak
Chart 2Clampdown On Shadow Banking Easing?
Clampdown On Shadow Banking Easing?
Clampdown On Shadow Banking Easing?
Trade war. The last-minute agreement to cancel the December 15 rise in US tariffs on Chinese imports represents the “ceasefire” we expected, rather than “phase one” of a more profound agreement. It is still unclear whether previous tariffs will be rolled back (Chart 3). China’s supposed promise to increase imports of US agricultural products from $10 billion a year to $40 billion-$50 billion seems unrealistic. Progress on more fundamental topics such as China’s subsidies for state-owned companies seems far off. For now, President Trump has done enough to minimize the negative impact on the US economy in an election year. But there remains a possibility that trade war reemerges as a risk during 2020. Chart 3How Far The Rollback?
How Far The Rollback?
How Far The Rollback?
Progress against these milestones suggests that our current asset allocation recommendation structure – moderately risk-on, but with hedges against downside risk – is appropriate for now. Global growth. Data confirming the rebound in the manufacturing cycle remain mixed. Economic surprises have generally been positive in the euro zone, but have slipped in the US and Japan, and remain soft in the Emerging Markets (Chart 4). In Germany, the manufacturing PMI slipped back to 43.7 in December, but the Ifo and ZEW surveys both rebounded (Chart 5). There is, however, still little sign that the weakness in manufacturing is spilling over into consumption and services. In Germany, unemployment remains at a record low and wages are strong. In the US, wage growth continues to trend up, and there is no indication in the weekly initial claims data that companies are starting to lay off workers at more than the seasonally normal pace (Chart 6). Market indicators of the cycle are also showing some positive signs. Among commodities, the price of copper – the most cyclical metal – has begun to rise. Chinese cyclical stocks are outperforming defensives. But the US dollar has not yet showed any significant depreciation (Chart 7). Chart 4Economic Surprises Mixed
Economic Surprises Mixed
Economic Surprises Mixed
Chart 5Germany Showing Signs Of Bottoming
Germany Showing Signs Of Bottoming
Germany Showing Signs Of Bottoming
Chart 6No Problems In The Labor Market
No Signs Of Weakening Labor Market No Problems In The Labor Market
No Signs Of Weakening Labor Market No Problems In The Labor Market
Chart 7Some Positive Signs From The Markets
Some Positive Signs From The Markets
Some Positive Signs From The Markets
US politics. President Trump’s approval rating has picked up slightly – we warned that its slipping might cause him to get aggressive on trade or foreign policy (Chart 8). Markets might worry at the possibility of “President Warren” given her focus on increased regulation of industries such as finance, energy, and technology. But she has fallen a little in the polls. Even in liberal California (where the primary will be unusually early next year – March 3), she is only level with Biden and Sanders in opinion polls. Our geopolitical strategists see US politics as one of the key geopolitical risks this year,4 but the risk seems subdued for now. Chart 8Trump’s Approval Rating Stable To Rising
Monthly Portfolio Update: Counting The Milestones
Monthly Portfolio Update: Counting The Milestones
Fed tightening. Expansions usually end when inflation rises, either causing the Fed to raise rates to choke it off, or with the Fed ignoring the inflation and allowing debt and asset bubbles to form. Any signs, therefore, that inflation, or inflation expectations, are rising would signal that we are truly in the “end game”. For now, there are no such signs. US inflation is likely to soften over the next six months, as a result of the economic slowdown and strong dollar. And TIPS breakevens imply the market believes the Fed will miss its inflation target by an average of 80-90 BPs a year over the next decade (Chart 9). The Fed is likely to sound very dovish over the coming year. The review of its monetary policy framework, probably to be announced in July, may result in some sort of “catch-up” policy: under this, if inflation undershoots the Fed’s target, the target automatically rises the following year.5 Its efforts to support the repo market, including short-term Treasury securities purchases of $60 billion a month, will increase the Fed’s balance-sheet, and represent a “mini-QE” (Chart 10). The Fed is likely to be reluctant to turn more hawkish ahead of the presidential election. These dovish moves – and continued accommodative policies from the ECB and Bank of Japan – mean that monetary policy will be supportive for risk assets throughout 2020. Chart 9Inflation Remains Subdued
Inflation Expectations Driven By Oil Inflation Remains Subdued
Inflation Expectations Driven By Oil Inflation Remains Subdued
These milestones suggest, therefore, that our current asset allocation recommendation structure – moderately risk-on, but with hedges (long cash and gold) against downside risk – is appropriate for now. Chart 10A "Mini-QE"?
A Mini-"QE"?
A Mini-"QE"?
Equities: We shifted last month to an underweight on US equities, with an overweight on the euro zone, and neutral on Emerging Markets. The US tends to underperform during upswings in the global manufacturing cycle (Chart 11). Europe looks attractive because of its heavy weighting in sectors we like such as Financials, Autos and Capital Goods. Europe’s returns will also be boosted by the appreciation in the euro and pound that we expect (our equity recommendations assume no currency hedging). For EM, we would turn more positive if we saw a clear pickup in Chinese credit and economic growth. Chart 11US Underperforms When Growth Picks Up
US Underperforms When Growth Picks
US Underperforms When Growth Picks
Chart 12Fed Won't Cut As The Market Expects
Fed Won't Cut As The Market Expects
Fed Won't Cut As The Market Expects
Fixed Income: Our positive view on global growth implies that long-term rates will rise. We see the US Treasury 10-year yield reaching 2.5% by mid-2020. The market still expects the Fed to cut rates once over the next 12 months. If it stays on hold, as we expect, that slight hawkish surprise would be compatible with a moderate rise in rates (Chart 12). Core euro zone rates might rise by a little less, perhaps by 30-40 BPs, and Japanese government bond yields by 10-15 BPs. We, therefore, continue to recommend a small underweight on duration and an overweight on TIPS which look particularly cheaply valued. Within credit, our preferences are for European investment grade (not as expensive as in the US, and with the ECB buying corporate debt again) and the lower end of the US junk-bond universe (since CCC-rated bonds missed out on 2019’s rally). In a rebounding global economy, the US dollar should depreciate, particularly since it looks somewhat over-valued, and with speculative positions long the dollar. Currencies: In a rebounding global economy, the US dollar should depreciate, particularly since it looks somewhat over-valued (Chart 13), and with speculative positions long the dollar (Chart 14). But its performance is likely to vary depending on the currency pair. Our FX strategists expect the dollar to weaken to 1.18 against the euro and 1.40 against the pound over the next 12 months, and even more against currencies such as the NOK, SEK, and AUD.6 But the dollar is likely to strengthen against the yen (an even more counter-cyclical currency) and against currencies in EM, where central banks will continue to cut rates and inject liquidity aggressively to support their economies. Chart 13Dollar Looks Expensive...
Dollar Looks Expensive...
Dollar Looks Expensive...
Chart 14...And Speculators Are Long
Monthly Portfolio Update: Counting The Milestones
Monthly Portfolio Update: Counting The Milestones
Commodities: Supply in the oil market remains tight, with OPEC deepening its production cuts to 1.7 million barrels/day. The crude oil price was held down in 2019 by weakening demand, which should recover along with the cycle in 2020 (Chart 15). Our energy strategists expect Brent to average $67 a barrel in 2020 (compared to $66 now), with WTI $4 lower. Metal prices could rise in 2020 as Chinese growth recovers and the US dollar depreciates – the two most important factors that drive them (Chart 16). Given the uncertainty over both, we remain neutral for now, but would turn more positive (including on commodity-related assets, such as Australian or EM equities) if we see clear signs of their moving in the right direction. We see gold as a good downside hedge in a world of ultra-low interest rates, especially since central banks may allow inflation to overshoot over the coming years. Chart 15Supply/Demand Balance Points To Higher Oil Price
Markets Will Tighten In 2020 Supply/Demand Balance Points To Higher Oil Price
Markets Will Tighten In 2020 Supply/Demand Balance Points To Higher Oil Price
Chart 16Metals Are Driven By The Dollar And China
Metals Are Driven By The Dollar And China
Metals Are Driven By The Dollar And China
Garry Evans, Senior Vice President Chief Global Asset Allocation Strategist garry@bcaresearch.com Footnotes 1 Please see "Outlook 2020: Heading Into The End Game," dated 22 November 2019, available at bca.bcaresearch.com. 2 Please see "GAA Monthly Portfolio Update: How To Position For The End Game," dated 2 December 2019, available at gaa.bcaresearch.com. 3 Please see China Investment Strategy Weekly Report, "A Year-End Tactical Upgrade," dated 18 December 2019, available at cis.bcaresearch.com 4 Please see Geopolitical Strategy "Strategic Outlook: 2020 Key Views: The Anarchic Society," dated 6 December 2019, available at gps.bcaresearch.com 5 For example, if the Fed's inflation target is 2% but inflation is only 1.7% one year, the target would automatically rise to 2.3% the following year. 6 Please see Foreign Exchange Strategy, "2020 Key Views: Top Trade Ideas," dated December 13, 2019, available at fes.bcaresearch.com GAA Asset Allocation
Feature The purpose of this Special Report is to identify and provoke a healthy debate on the prevailing investment themes for the 2020s and to speculate on what the key US sector beneficiaries and likely losers may be. Every decade a dominant theme captures investors’ imaginations and morphs into a bubble. Massive speculation typically propels the relevant asset class into the stratosphere as investors extrapolate the good times far into the future and go on a buying frenzy. Chart 1 shows previous manic markets starting with the Nifty Fifty, gold bullion, the Nikkei 225, the NASDAQ 100, crude oil and most recently the FAANGs. Chart 1Manias: An Historical Roadmap
Manias: An Historical Roadmap
Manias: An Historical Roadmap
What will be the dominant themes of the next decade? How should investors capitalize on some of these big trends? The purpose of this Special Report is to identify and provoke a healthy debate on the prevailing investment themes for the 2020s and to speculate on what the key US sector beneficiaries and likely losers may be. Theme #1: De-Globalization Picks Up Steam The first investment theme for the upcoming decade is the “apex of globalization” or “de-globalization”. We have written about this theme extensively at BCA Research and it is the mega-theme of our sister Geopolitical Strategy (GPS) service. Odds are high that countries will continue looking inward as the US adopts a more aggressive trade policy, China’s trend growth slows, and US-China strategic tensions intensify. The three pillars of globalization are the free movement of goods, capital, and people across national borders. We expect to see marginally less of each in the future. Chart 2 shows that we are at the conclusion of a period of tranquility. Pax Americana underpinned globalization as much as Pax Britannica before it. The US is in a relative decline after decades of geopolitical stability allowed countries like China to rise to “great power” status and rivals like Russia to recover from the chaos of the 1990s. Chart 2De-globalization Has Commenced
De-globalization Has Commenced
De-globalization Has Commenced
De-globalization has become the consensus since the election of Donald Trump. But Trump is not the prophet of de-globalization; he is its acolyte. Globalization is ending because of structural factors, not cyclical ones. And its decline was pre-written into its “source code.” Three factors stand at the center of this assessment, outlined in our 2014 Special Report, “The Apex Of Globalization – All Downhill From Here”: multipolarity, populism and protectionism. Events have since confirmed this view. The three pillars of globalization are the free movement of goods, capital, and people across national borders. We expect to see marginally less of each in the future. Investment Implication #1: Profit Margin Peak The most profound and provocative investment implication from de-globalization is that SPX profit margins have peaked and will likely come under intense pressure, especially for US conglomerates that – on a relative basis to international peers – most enthusiastically embraced globalization. Reconstructed S&P 500 profits and sales data date back to the late-1920s. Historically, corporate profit margins and globalization (depicted as global trade as a percentage of GDP) have been positively correlated (Chart 3). Chart 3Profit Margin Trouble
Profit Margin Trouble
Profit Margin Trouble
As countries are more outward looking, trade flourishes and openness to trade allows the free flow of capital to take advantage of profit-maximizing projects. Following the Great Recession and similar to the Great Depression, trade has suffered and trade barriers have risen. The Sino-American trade war has accelerated the inward movement of countries, including Korea and Japan, and has had negative knock-on effects on trade as evidenced by the now two-year old global growth deceleration. China’s response to President Trump’s election was to redouble its pursuit of economic self-sufficiency, which meant a crackdown on corporate debt and a fiscal boost to household consumption. Trump’s tariffs then damaged sentiment and trade between the two countries. Any deal reached prior to the 2020 US election will remain in doubt among global investors. The longer the trade war remains unresolved, the deeper the cracks will be in the foundations of the global trading system. Such a backdrop is negative for profit margins, as inward looking countries prevent capital from being allocated most efficiently. Moreover, the uprooting of supply chains due to the trade war hurts margins and the redeployment of equipment in different jurisdictions will do the same at a time when final demand is suffering a setback. In addition, rising profit margins are synonymous with wealth accruing to the top 1% of US families and vice versa. This relationship dates back to the late-1920s, as far back as our dataset goes. Using Piketty and Saez data, which exclude capital gains, it is clear that profit margin expansion exacerbates income inequality (top panel, Chart 4). Chart 4Heightened Risk Of Wealth Re-distribution
Heightened Risk Of Wealth Re-distribution
Heightened Risk Of Wealth Re-distribution
Expanding margins lead to higher profits. Because families at the top of the income distribution are more often than not business owners, income disparities are the widest when margins are in overshoot territory. Eventually this income chasm comes to a head and generates political discontent. Populism has emerged on both the right and left wings of the US political spectrum – and since the rise of Trump, even Republicans complain about inequality and the excesses of “corporate welfare” and laissez-faire capitalism. Because inequality is extreme – relative to America’s developed peers – and political forces are mobilizing against it, the probability of wealth re-distribution is rising in the coming decades (middle panel, Chart 4). Labor’s share of national income has nowhere to go but higher in coming years and that is negative for profit margins, ceteris paribus (bottom panel, Chart 4). Drilling beneath the surface, the three secular US equity sector/factor implications of the apex of globalization paradigm shift are: prefer small caps over large caps prefer value over growth overweight the pure-play BCA Defense Index Investment Implication #2: Small Is Beautiful While a small cap bias is contrary to the cyclical US Equity Strategy view of preferring large caps to small caps, the issue is timing: the small cap preference is a secular view with a time horizon that spans the next decade. The small versus large cap share price ratio’s ebbs and flows persist over long cycles. Small caps outshined large caps uninterruptedly from 1999 to 2010. Since then large caps have had the upper hand (Chart 5). Were the apex of globalization theme to gain traction in the 2020s, small caps should reclaim the lead from large caps, especially in the wake of the next US recession. Similar to the death of the global banking model, companies with global footprints will suffer the most, especially compared with domestically focused outfits. One way to explore this theme is via domestic versus global sector preference. But a more investable way to position for this sea change, is to buy small caps (or microcaps) at the expense of large caps (or mega caps). Small caps are traditionally domestically geared compared with large caps that have significantly more foreign sales exposure. Chart 5It’s A Small World After All
It’s A Small World After All
It’s A Small World After All
The closest ETF ticker symbols resembling this trade is long IWM:US/short SPY:US. Investment Implication #3: Buy Value At The Expense Of Growth Similar to the size bias, the style bias also moves in secular ways. Value outperformed growth from the dot com bust until the GFC. Since then growth has crushed value, even temporarily breaking below the year 2000 relative trough. This breakneck pace of appreciation for growth stocks is clearly unsustainable and offers long-term oriented investors a compelling entry point near two standard deviations below the historical mean (Chart 6). Chart 6Value Has The Upper Hand Versus Growth
Value Has The Upper Hand Versus Growth
Value Has The Upper Hand Versus Growth
Financials populate value indexes, a similarity with small cap outfits. Traditionally, financials are a domestically focused sector with export exposure registering at half of the S&P’s average 40% level of internationally sourced revenues. On the flip side, tech stocks sit atop the growth table and they garner 60% of their revenue from abroad. This value over growth style preference will pay handsome dividends if the de-globalization theme becomes more main stream as countries become more hawkish on trade and the Sino-American war continues to erect barriers to trade that took decades to lift. The caveat? If President Trump strikes a short-term deal with China ahead of the 2020 election, the de-globalization theme will suffer a setback. But our geopolitical strategists expect a ceasefire at best, not a durable deal, and also expect the trade war to resume in some way, shape or form in 2021-22, regardless of the outcome of the US election. The closest ETF ticker symbols resembling this trade is long IVE:US/short IVW:US. Investment Implication #4: Defense Fortress One final long-term playable investment idea from the apex of globalization is a structural bull market in defense stocks (Chart 7). Our October 2016 “Brothers In Arms” Special Report drew parallels with the late nineteenth century period of European rearmament, and the American and Soviet arms race of the 1960s. These movements were greatly beneficial to the aerospace and defense industry. Currently, the move by several countries to adopt more independent foreign policies, i.e. to move away from collaboration and cooperation toward isolationism and self-sufficiency, entails an accompanying arms race. Chart 7Stick With Pure-play Defense Stocks
Stick With Pure-play Defense Stocks
Stick With Pure-play Defense Stocks
Table 1
Top US Sector Investment Ideas For The Next Decade
Top US Sector Investment Ideas For The Next Decade
China’s challenge to the regional political status quo motivates a boost to defense spending globally. In fact SIPRI data on global military spending by 2030 (Table 1) increases our conviction that this trade will succeed on a five-to-ten year horizon. Beyond the global arms race, two additional forces are at work underpinning pure-play defense contractors. A global space race with China, India and the US wanting to have manned missions to the moon, and the rise of global cybersecurity breaches. Defense companies are levered to both of these secular forces and should be prime sales and profit beneficiaries to rising space budgets and increasing cybersecurity combat budgets. The ticker symbols for the stocks in the pure-play BCA defense index are: LMT, RTN, NOC, GD, HII, AJRD, BWXT, CW, MRCY. Theme #2: Tech Sector Regulation, US Enacts Privacy Laws The second long-term geopolitical theme that we are exploring is the regulatory or “stroke of pen” risk that is rising on FAANG stocks – Facebook, Apple, Amazon, Netflix, and Google. These companies were this decade’s undisputed stock market winners. The US anti-trust regulatory framework was designed to curb broad anti-competitive actions of trusts. As Lina Khan discusses in her seminal article, these actions “include not only cost but also product quality, variety, and innovation.” However, through subsequent regulatory evolution, the Chicago School has focused the US anti-trust process on consumer welfare and prices. If President Reagan and the courts could change how anti-trust laws were administered in the 1980s, so too can future administrations and courts. Today the US Congress, on both sides of the aisle, is looking into regulatory tightening, while the judicial system will take longer to change its approach. Moreover, the impetus for tougher anti-trust policy is here. It comes from a long period of slow growth, income inequality, and economic volatility – such as in the 1870s-80s. This was certainly the case for Standard Oil in 1911, which became a nation-wide boogeyman despite most of its transgressions occurring in the farm belt states. Today, income inequality is a prominent political theme and source of consumer discontent. A narrative is emerging – which will be super-charged during the next recession – that growth has been unequally distributed between the old economy and the twenty-first century technology leaders. With regard to privacy, the news is equally grim for large tech outfits. The EU General Data Protection Regulation (GDPR), which came into force on May 2018, imposes compliance burdens on any company handling user data. In the US, California has signed its own version of the law – the Consumer Privacy Act – which will go into effect in January 2020. These laws give consumers the right to know what information companies are collecting about them and what companies that data is being shared with. They also allow consumers to ask technology companies to delete their data or not to sell it. While tech companies are likely to fight the new California law, and the US court system is a source of uncertainty, we believe the writing is on the wall. The EU is by some measures the largest consumer market on the planet. California is certainly the largest US market of the states. It is unlikely that the momentum behind consumer protection will change, especially with the EU and California taking the lead. The odds of a federal privacy law, following in the footsteps of the Consumer Privacy Act, are also rising. Investment Implication #5: Shun Interactive Media & Services Stocks These risks introduce a severe overhang for FAANG stocks. We are especially worried for the S&P interactive media & services index that includes GOOGL and FB. Tack on the threat of federal regulation and this represents another major headwind for profits and net profit margins that are extremely elevated for these near monopolies. Given that advertising revenue is crucial to the business model of social media companies (GOOGL and FB included), a significant uptick in privacy regulation will likely hurt their bottom line. With regard to profit margins, tech stocks in general command a profit margin twice as high as the SPX. Specifically, FB and GOOGL enjoy margins that are 500 basis points higher than the broad tech sector (Chart 8)! This is unsustainable and will likely serve as easy prey for policymakers. Our view does not necessarily call for breaking up these monopolies. The US will have to weigh the economic consequences of anti-trust policy in a context of multipolarity in which China’s national tech champions are emerging to compete with American companies for global market share. Nevertheless increased regulation is inevitable and some forced sales of crown jewel assets may take place. Moreover, the threat of a breakup will lurk in the background, creating uncertainty until key legislative and judicial battles have already been fought. That will take years. Finally, we doubt the tech sector will be left alone to “self-regulate” its incumbents and negotiate a price on consumers’ privacy. More likely, a new privacy law will loom overhead, serving as a negative catalyst for profit growth. Uncertainty will weigh on the S&P interactive media & services relative performance. Chart 8Regulation Will Squeeze Tech Margins
Regulation Will Squeeze Tech Margins
Regulation Will Squeeze Tech Margins
The ticker symbols to short/underweight the S&P interactive media & services index are an equally weighted basket of GOOGL and FB (they command a 98% market cap weight in the index). Theme #3: SaaS, Artificial Intelligence, Augmented Reality And Autonomous Driving Are Not Fads The third big theme that will even outlive the upcoming decade is the proliferation of software as a service (SaaS). The move to cloud computing and SaaS, the wider adoption of artificial intelligence, machine learning, autonomous driving and augmented reality are not fads, but enjoy a secular growth profile. In the grander scheme of things today’s world is surrounded by software. Millions of lines of code go even into gasoline powered automobiles, let alone electric vehicles. Autonomous driving is synonymous with software, the Internet of Things (IoT) needs software, the space race depends on software, modern manufacturing and software are closely intertwined, phone calls for quite some time have been a software solution, and the list goes on and on. This tidal effect is hard to reverse and is already embedded in workflows across industries. Opportunities to penetrate health care and financial services more deeply remain unexplored and it is difficult to envision another competing industry unseating “king software”. These secular trends are not only productivity enhancing, but will also most likely prove recession-proof. When growth is scarce investors flock to any source of growth they can come by and we are foreseeing that when the next recession arrives, investors will likely seek shelter in pure play SaaS firms. Investment Implication #6: Software Is Eating The World Buying software stocks for the long haul seems like a bulletproof investment idea. But the recent stellar performance of software stocks that has moved valuations to overshoot territory. Our recommended strategy is to buy or add software stock exposure on any weakness with a 10-year investment time horizon. All of these secular trends have pushed capital outlays on software into a structural uptrend. Software related capex is not only garnering a larger slice of the tech spending budgets but also of the overall capex pie. If it were not for software capex, the contraction in non-residential investment in recent quarters would have been more severe (Chart 9). Private sector software capex is near all-time highs as a share of total outlays. Government investment in software is also reaccelerating at the fastest pace since the tech bubble. When productivity gains are anemic, both the business and government sectors resort to software upgrades in order to boost productivity. Cyber security is another more recent source of software related demand as governments around the globe are taking such risks extremely seriously (bottom panel, Chart 9). Given this upbeat demand backdrop and ongoing equity retirement, software stocks are primed to grow into their pricey valuations. Chart 9Software Is Eating The World
Software Is Eating The World
Software Is Eating The World
Finally, this long-term trade will also serve as a hedge to the short/underweight position we recommend in the S&P interactive media & services index. The closest ETF ticker symbol resembling the S&P software index is IGV:US. Theme #4: Millennials Already Are The Largest Cohort And Will Dominate Spending The fourth long-term theme we anticipate will gain traction in the 2020s is the demographic rise of the Millennial generation. Much has been made of preparing for the arrival of the Millennial generation, accompanied by well-worn stereotypes of general "failure to launch" as they reach adulthood. However, "arrival" is a misnomer as this age cohort is already the largest and "failure" is simply untrue. According to the U.S. Census Bureau, Millennials are the US’s largest living generation. Millennials (or Echo Boomers) defined as people aged 18 to 37 (born 1982 to 2000), now number more than 80mn and represent more than one quarter of the US’s population. Baby Boomers (born 1946 to 1964) number about 75mn. Stealthily becoming the largest age group in the US over the last few years, Millennials per-year-birth-rate peaked at 4.3mn in 1990. Surprisingly, the pace matched that of the post-war Baby Boom peak-per-year-birth-rate in 1957 - the per-year average over the period was higher for the Baby Boomers (Chart 10). Chart 10Millennials Are The Largest Cohort
Millennials Are The Largest Cohort
Millennials Are The Largest Cohort
This gap is now set to grow rapidly as the death rate of Baby Boomers accelerates. What is more, the largest one-year age cohort is only 25 years old, thus, Millennials will be the dominant generation for many years. It is unclear how these “kids” will impact the market as they become the most important consumers, borrowers and investors, but make no mistake: this is a seismic shift in economic power and it is here to stay. The Echo Boom is a big, generational demographic wave. A difficult and painful delay has not tempered its looming importance. Finally, this wave of echo-boomers is educated, relatively unburdened by debt (please see BOX in the June 11, 2018 Special Report on demystifying the student debt load as it pertains to Millennials), and as they inevitably “grow up”, form new households and have kids. They will borrow, spend, earn, but not necessarily save and invest to the same extent as the Boomers. And this will be an important long-term theme going forward. Near term we might already be seeing signs of their arrival and firms have begun to pivot accordingly. Investment Implication #7: Buy The BCA Millennials Equity Basket Millennials will boost consumption spending in a number of different ways. The relatively unburdened Millennial cohort will be entering prime home acquisition age soon and this should underpin the long-term prospects of the US housing market and derivative industries. Further, Millennials consume differently from their parents; social media, online shopping and smart phones are not the consumption categories of the Baby Boomers. With this in mind, we have created a basket of ten stocks that we think will be driven over the long term by the demographic rise of the Millennial. We note that these stocks are heavily weighted to the technology and consumer discretionary sectors, which is logical as Millennial consumption habits tend to be discretionary focused and technology-based. Beginning with consumer discretionary, we are highlighting AMZN, NFLX and SPOT as core holdings in our Millennials basket. AMZN’s heft dwarfs consumer discretionary indexes but it could fall in several categories; the acquisition of Whole Foods makes it a Millennials-focused consumer staples retailer and its cloud computing web services segment is a tech leader. NFLX and SPOT represent the means by which Millennials consume media, by streaming movies and music over the internet. The idea of owning physical media is rapidly becoming an anachronism. The home ownership themes noted in the report above lead us to add HD and LEN to the basket. Millennials are “doers” and are set to be the dominant DIYers in the next few years, making HD a logical choice. LEN, as the nation’s largest home builder, should benefit from the Millennials coming of age into home buyers. We are also adding TSLA to our basket as a lone clean tech-oriented equity. TSLA capitalizes on the increasing shift to clean energy of Millennials (the key reason why no traditional energy companies have a spot in our basket). The technology stocks in our Millennials basket are AAPL, UBER (which replaces FB as of today) and MSFT, together representing more than 9% of the total value of the S&P 500. AAPL’s inclusion in the list is predictable as the leading domestic purveyor of devices on which Millennials consume media content. FB is a predictable holding, with more than half of all Americans being monthly active users, dominated by the Millennial cohort. It has served our basket well since inception, but today we are compelled to remove it and replace it with UBER. UBER is a Millennial favorite and the epitome of the sharing economy. In reality UBER is a logistics company and while it is losing money it is eerily reminiscent of AMZN in its early days. Maybe UBER will dominate all means of transportation and its ease of use will propel it to a mega cap in the coming decade. Our inclusion of MSFT is based on its leadership in cloud computing, a rapidly growing industry. We expect the connectivity and mobile computing demands of Millennials will accelerate. The last stock we are adding to our basket is also the only financial services equity. Though avid consumers, Millennials have shown an aversion to cash, preferring card payment systems, including both debit and credit-based. Accordingly, we are adding the leader in both of these, V, to our Millennials basket (Chart 11). Chart 11Buy BCA’s Millennial Equity Basket
Buy BCA’s Millennial Equity Basket
Buy BCA’s Millennial Equity Basket
Investors seeking long term exposure to stocks lifted by the supremacy of the Millennial generation should own our Millennial basket (AAPL, AMZN, UBER, HD, LEN, MSFT, NFLX, SPOT, TSLA, V). We would not hesitate to add other sharing economy stocks, including Airbnb, to this basket should they become investable in the near future. Theme #5: ESG Becomes Mainstream Investors are increasingly looking at allocating assets based on environmental, social, and governance (ESG) considerations, and this mini-theme has the potential to become a big trend in the 2020s. There are a number of factors that underpin ESG investing. First, Millennials are climate conscious and given that they already are the largest cohort in the US they will not only dominate spending, but also influence election results. Moreover, via social media Millennials can sway public opinion and participate in the ESG conversation. Second, ECB President Christine Lagarde recent speech to the Economic and Monetary Affairs Committee of the European Parliament is a must read.1 If the ECB were to explicitly focus on climate change policy as part of its monetary policy operations then this is a game changer. Green investment financing including “green bonds” could become mainstream. Keep in mind the as reported in the FT “the European Parliament has declared a climate emergency; the new European Commission (EC) has taken office on a promise of an imminent “green new deal”, and Commission president Ursula von der Leyen has vowed to accelerate emissions cuts.” Last Wednesday, the EC released “The European Green Deal” with a pretty aggressive time table. The EC president said “The green deal is Europe’s man on the moon moment” and presented 50 policies slated to get rolled by 2022 to meet revamped climate goals. The implication is that once ESG takes center stage at a number of these institutions it will be easier to become mainstream and propagate the world over. Third, large institutional investors are starting to adopt an ESG mindset, especially pension plans. These investors with trillions of dollars at their disposal can not only disfavor fossil fuel investment, but also undertake investments in “green projects” via private and public equity markets. Banks are also moving in the “greening of finance” direction and given that they are the pipelines of the global plumbing system, swift adoption will go a long way in taking ESG mainstream. Finally, the electric vehicle (EV) proliferation is another key driver on how the ESG theme will play out in the 2020s. As a reminder, in the US 50% of all energy consumption is gasoline related linked to automobiles. While battery technology still has limitations, EV is no longer a fad as the German and Japanese automakers are starting to make inroads on TSLA. These car manufacturers do not want to be left out, especially if this shift toward EV becomes mainstream in the 2020s. The Chinese are not far behind on the EV manufacturing front, however government policy can really become a game changer. If a number of countries and/or California mandate a large share of all new vehicles sold be EV, then the investment implications will be massive. Investment Implication #8: Avoid Fossil Fuels, Gambling, Alcohol And Tobacco… While there are a few ESG related ETFs, we would rather explore this theme’s investment implications of sectors to avoid in the coming decade. We are believers that ESG criteria will continue to gain in importance in institutional investment management decisions. Accordingly, we would tend to avoid ‘sin stocks’, including gambling, tobacco and alcohol; demand for their services is unlikely to decline but investment weightings should mean that share prices will underperform. Further, we think a clean energy shift will mean energy stocks will likely continue to be long-term underperformers (Chart 12). Chart 12Areas To Avoid As ESG Becomes Mainstream
Areas To Avoid As ESG Becomes Mainstream
Areas To Avoid As ESG Becomes Mainstream
Final Thoughts On The US Dollar In this report, we tried to focus on the upcoming decade’s big themes that we deem will play out, and centered recommendations on US equities/sectors. We do not want to neglect some macroeconomic variables that tend to mean revert over time. Specifically, the US dollar, interest rates and most importantly US indebtedness, will also be key drivers of investment theses in the 2020s. Currently, debt is rising faster than nominal GDP growth with the government and non-financial business debt-to-GDP profiles on an unsustainable path (second panel, Chart 13). Granted, the saving grace has been generationally low interest rates as the debt service ratios have fallen (top panel, Chart 13). However, if the four decade bull market in Treasury bonds is over, or may end definitively with the next US recession sometime in the early 2020s, then rising interest rates are the only mechanism to concentrate CEOs’ and politicians’ minds. On the dollar front, Chart 14 highlights the ebbs and flows of the trade-weighted US dollar since it floated in the early-1970s. The DXY index has moved in six-to-ten year bull and bear markets. The most recent trough was during the depths of the Great Recession, while the (tentative?) peak was in late-2016. If history repeats, eventually the dollar will mean revert lower in the 2020s, especially given the fiscal profligacy of the current administration that may continue into 2024, assuming President Trump gets re-elected next November. Chart 13Unsustainable Debt Profiles
Unsustainable Debt Profiles
Unsustainable Debt Profiles
Chart 14Greenback’s Historical Ebbs And Flows
Greenback’s Historical Ebbs And Flows
Greenback’s Historical Ebbs And Flows
The US dollar remains the reserve currency of the world today, but that exorbitant privilege is clearly fraying on the edges as the balance-of-payments dynamics are heading in the wrong direction. Over the next five years, the US Congressional Budget Office (CBO) estimates that the US budget deficit will swell to 4.8% of GDP. Assuming the current account deficit widens a bit then stabilizes (usually happens when global growth improves), this will pin the twin deficits at 8% of GDP. This assumes no recession, which would have the potential to swell the deficit even further. The US saw its twin deficits swell to almost 13% of GDP following the financial crisis, but the difference then was that in the wake of the commodity boom the dollar was cheap (and commodity currencies overvalued). The subsequent shale revolution also greatly cushioned the US trade deficit. Shale productivity remains robust and US output will continue to rise, but the low-hanging fruit has already been plucked. Another dollar-negative force is its expensiveness. By rising 35% since its trough, the USD has sapped the competitiveness of the US manufacturing sector, which is accentuating the American trade deficit outside of the commodity sector (Chart 14). If the ESG trend ends up hurting oil prices, the US current account will follow the widening deficit in manufactured products. Moreover, the US is lagging Europe on the green revolution. Either the US will have to import green technologies, or the US government will have to provide more subsidies to the private sector. Either way, both of these dynamics will hurt the US current account deficit further. Historically, the currency market is the main vehicle to correct such imbalances. Chart 15Twin Deficits Will Weigh On The US Dollar
Twin Deficits Will Weigh On The US Dollar
Twin Deficits Will Weigh On The US Dollar
The apex of globalization will also hurt the greenback. In a world where all the markets are integrated, borrowers in EM nations often use the reserve currency to issue liabilities at a lower cost. This boosts the demand by EM central banks for US dollar reserves to protect domestic banking systems funded in USD. Moreover, some countries like China implement pegs (both official and unofficial) to the US dollar in order to maintain their competitiveness and export their production surpluses to the US. To do so they buy US assets. If the global economy becomes more fragmented and the Sino-US relationship continues to deteriorate structurally as we expect, then these sources of demand for the dollar will recede. Overlay the widening US current account deficit, and you have the perfect recipe for a depreciating trade-weighted US dollar. Finally, the US is likely to experience more inflation than the rest of the world following the next recession. The US economy has a smaller capital stock as a share of GDP than Europe or Japan, and American demographics are much more robust. This means that the neutral rate of interest is higher in the US than in other advanced economies. As a result, the Fed will have an easier time generating inflation by cutting real rates than both the ECB and the BoJ. Higher inflation will ultimately erode the purchasing power of the dollar and prove to be a structurally negative force for the USD. Anastasios Avgeriou US Equity Strategist anastasios@bcaresearch.com Matt Gertken Geopolitical Strategist mattg@bcaresearch.com Marko Papic Chief Strategist, Clocktower Group marko@clocktowergroup.com Chester Ntonifor Foreign Exchange Strategist chestern@bcaresearch.com Mathieu Savary The Bank Credit Analyst mathieu@bcaresearch.com References Please click on the links below to view reports: Peak Margins - October 7, 2019 The Polybius Solution - July 5, 2019 War! What Is It Good For? Global Defense Stocks! - October 31, 2018 The Dollar: Will The U.S. Invoke A "Nuclear" Option? - August 30, 2018 Is The Stock Rally Long In The FAANG? - August 1, 2018 Millennials Are Not Coming Of Age; They Are Already Here - June 11, 2018 Brothers In Arms - October 31, 2016 The End Of The Anglo-Saxon Economy? - April 13, 2016 Apex of Globalization - November 12, 2014 Footnotes 1 https://www.imf.org/en/News/Articles/2019/09/04/sp090419-Opening-Statement-by-Christine-Lagarde-to-ECON-Committee-of-European-Parliament
Every decade a dominant theme captures investors’ imaginations and morphs into a bubble. Massive speculation typically propels the relevant asset class into the stratosphere as investors extrapolate the good times far into the future and go on a buying frenzy. Chart II-1 shows previous manic markets starting with the Nifty Fifty, gold bullion, the Nikkei 225, the NASDAQ 100, crude oil and most recently the FAANGs. Chart II-1Manias: An Historical Roadmap
Manias: An Historical Roadmap
Manias: An Historical Roadmap
What will be the dominant themes of the next decade? How should investors capitalize on some of these big trends? The purpose of this Special Report is to identify and provoke a healthy debate on the prevailing investment themes for the 2020s and to speculate on what the key US sector beneficiaries and likely losers may be. Theme #1: De-Globalization Picks Up Steam The first investment theme for the upcoming decade is the “apex of globalization” or “de-globalization”. We have written about this theme extensively at BCA Research and it is the mega-theme of our sister Geopolitical Strategy (GPS) service. Odds are high that countries will continue looking inward as the US adopts a more aggressive trade policy, China’s trend growth slows, and US-China strategic tensions intensify. The small cap preference is a secular view with a time horizon that spans the next decade. Chart II-2 shows that we are at the conclusion of a period of tranquility. Pax Americana underpinned globalization as much as Pax Britannica before it. The US is in a relative decline after decades of geopolitical stability allowed countries like China to rise to “great power” status and rivals like Russia to recover from the chaos of the 1990s. Chart II-2De-globalization Has Commenced
De-globalization Has Commenced
De-globalization Has Commenced
De-globalization has become the consensus since the election of Donald Trump. But Trump is not the prophet of de-globalization; he is its acolyte. Globalization is ending because of structural factors, not cyclical ones. Three factors stand at the center of this assessment, outlined in our 2014 Special Report, “The Apex Of Globalization – All Downhill From Here”: multipolarity, populism and protectionism. Events have since confirmed this view. One final long-term playable investment idea from the apex of globalization is a structural bull market in defense stocks. The three pillars of globalization are the free movement of goods, capital, and people across national borders. We expect to see marginally less of each in the future. Investment Implication #1: Profit Margin Peak The most profound and provocative investment implication from de-globalization is that SPX profit margins have peaked and will likely come under intense pressure, especially for US conglomerates that – on a relative basis to international peers – most enthusiastically embraced globalization. Chart II-3 shows reconstructed S&P 500 profits and sales data back to the late-1920s. Historically, corporate profit margins and globalization (depicted as global trade as a percentage of GDP) have been positively correlated. Chart II-3Profit Margin Trouble
Profit Margin Trouble
Profit Margin Trouble
As countries are more outward looking, trade flourishes and openness to trade allows the free flow of capital to take advantage of profit-maximizing projects. Following the Great Recession and similar to the Great Depression, trade has suffered and trade barriers have risen. The Sino-American trade war has accelerated the inward movement of countries, including Korea and Japan, and has had negative knock-on effects on trade as evidenced by the now two-year old global growth deceleration. China’s response to President Trump’s election was to redouble its pursuit of economic self-sufficiency, which meant a crackdown on corporate debt and a fiscal boost to household consumption. Trump’s tariffs then damaged sentiment and trade between the two countries. Any deal reached prior to the 2020 US election will remain in doubt among global investors. The longer the trade war remains unresolved, the deeper the cracks will be in the foundations of the global trading system. We are especially worried for the S&P interactive media & services index that includes GOOGL and FB. Such a backdrop is negative for profit margins, as inward looking countries prevent capital from being allocated most efficiently. Moreover, the uprooting of supply chains due to the trade war hurts margins and the redeployment of equipment in different jurisdictions will do the same at a time when final demand is suffering a setback. In addition, rising profit margins are synonymous with wealth accruing to the top 1% of US families and vice versa. This relationship dates back to the late-1920s, as far back as our dataset goes. Using Piketty and Saez data, which exclude capital gains, it is clear that profit margin expansion exacerbates income inequality (top panel, Chart II-4). Chart II-4Heightened Risk Of Wealth Re-distribution
Heightened Risk Of Wealth Re-distribution
Heightened Risk Of Wealth Re-distribution
Expanding margins lead to higher profits. Because families at the top of the income distribution are often business owners, income disparities are the widest when margins are in overshoot territory. Eventually this income chasm comes to a head and generates political discontent. Populism has emerged on both the right and left wings of the US political spectrum – and since the rise of Trump, even Republicans complain about inequality and the excesses of “corporate welfare” and laissez-faire capitalism. Because inequality is extreme – relative to America’s developed peers – and political forces are mobilizing against it, the probability of wealth re-distribution is rising in the coming decades (middle panel, Chart II-4). Labor’s share of national income has nowhere to go but higher in coming years and that is negative for profit margins, ceteris paribus (bottom panel, Chart II-4). Buy or add software stock exposure on any weakness with a 10-year investment time horizon. Drilling beneath the surface, the three secular US equity sector/factor implications of the apex of globalization paradigm shift are: prefer small caps over large caps prefer value over growth overweight the pure-play BCA Defense Index Investment Implication #2: Small Is Beautiful Chart II-5It's A Small World After All
It's A Small World After All
It's A Small World After All
While a small cap bias is contrary to the cyclical US Equity Strategy view of preferring large caps to small caps, the issue is timing: the small cap preference is a secular view with a time horizon that spans the next decade. The small versus large cap share price ratio’s ebbs and flows persist over long cycles. Small caps outshined large caps uninterruptedly from 1999 to 2010. Since then large caps have had the upper hand (Chart II-5). Were the apex of globalization theme to gain traction in the 2020s, small caps should reclaim the lead from large caps, especially in the wake of the next US recession. Similar to the death of the global banking model, companies with global footprints will suffer the most, especially compared with domestically focused outfits. One way to explore this theme is via domestic versus global sector preference. But a more investable way to position for this sea change, is to buy small caps (or microcaps) at the expense of large caps (or mega caps). Small caps are traditionally domestically geared compared with large caps that have significantly more foreign sales exposure. The closest ETF ticker symbols resembling this trade is long IWM:US/short SPY:US. Investment Implication #3: Buy Value At The Expense Of Growth Similar to the size bias, the style bias also moves in secular ways. Value outperformed growth from the dot com bust until the GFC. Since then growth has crushed value, even temporarily breaking below the year 2000 relative trough. This breakneck pace of appreciation for growth stocks is clearly unsustainable and offers long-term oriented investors a compelling entry point near two standard deviations below the historical mean (Chart II-6). Chart II-6Value Has The Upper Hand Versus Growth
Value Has The Upper Hand Versus Growth
Value Has The Upper Hand Versus Growth
Financials populate value indexes, a similarity with small cap outfits. Traditionally, financials are a domestically focused sector with export exposure registering at half of the S&P’s average 40% level of internationally sourced revenues. On the flip side, tech stocks sit atop the growth table and they garner 60% of their revenue from abroad. This value over growth style preference will pay handsome dividends if the de-globalization theme becomes more mainstream as countries become more hawkish on trade and the Sino-American war continues to erect barriers to trade that took decades to lift. We have created a basket of ten stocks that we think will be driven over the long term by the demographic rise of the Millennial. The caveat? President Trump's recent short-term deal with China could set back the de-globalization theme. But our geopolitical strategists do not anticipate it to be a durable deal, and they also expect the trade war to resume in some way, shape or form in 2021-22, regardless of the outcome of the US election. The closest ETF ticker symbols resembling this trade is long IVE:US/short IVW:US. Investment Implication #4: Defense Fortress Chart II-7Stick With Pure-play Defense Stocks
Stick With Pure-play Defense Stocks
Stick With Pure-play Defense Stocks
One final long-term playable investment idea from the apex of globalization is a structural bull market in defense stocks (Chart II-7). The US Equity Sector service's October 2016 “Brothers In Arms” Special Report drew parallels with the late nineteenth century period of European rearmament, and the American and Soviet arms race of the 1960s.1 These movements were greatly beneficial to the aerospace and defense industry. Currently, the move by several countries to adopt more independent foreign policies, i.e. to move away from collaboration and cooperation toward isolationism and self-sufficiency, entails an accompanying arms race. Table II-1
January 2020
January 2020
China’s challenge to the regional political status quo motivates a boost to defense spending globally. In fact, SIPRI data on global military spending by 2030 (Table II-1) increases our conviction that this trade will succeed on a five-to-ten year horizon. Beyond the global arms race, two additional forces are at work underpinning pure-play defense contractors. A global space race with China, India and the US wanting to have manned missions to the moon, and the rise of global cybersecurity breaches. Defense companies are levered to both of these secular forces and should be prime sales and profit beneficiaries of rising space budgets and increasing cybersecurity combat budgets. The ticker symbols for the stocks in the pure-play BCA defense index are: LMT, RTN, NOC, GD, HII, AJRD, BWXT, CW, MRCY. Theme #2: Tech Sector Regulation, US Enacts Privacy Laws The second long-term geopolitical theme that we are exploring is the regulatory or “stroke of pen” risk that is rising on FAANG stocks – Facebook, Apple, Amazon, Netflix, and Google. These companies were this decade’s undisputed stock market winners. The US anti-trust regulatory framework was designed to curb broad anti-competitive actions of trusts. As Lina Khan discusses in her seminal article, these actions “include not only cost but also product quality, variety, and innovation.” However, through subsequent regulatory evolution, the Chicago School has focused the US anti-trust process on consumer welfare and prices. If President Reagan and the courts could change how anti-trust laws were administered in the 1980s, so too can future administrations and courts. Today the US Congress, on both sides of the aisle, is looking into regulatory tightening, while the judicial system will take longer to change its approach. Moreover, the impetus for tougher anti-trust policy is here. It comes from a long period of slow growth, income inequality, and economic volatility – such as in the 1870s-80s. This was certainly the case for Standard Oil in 1911, which became a nation-wide boogeyman despite most of its transgressions occurring in the farm belt states. Today, income inequality is a prominent political theme and source of consumer discontent. A narrative is emerging – which will be super-charged during the next recession – that growth has been unequally distributed between the old economy and the twenty-first century technology leaders. While there are a few ESG related ETFs, we would rather explore this theme’s investment implications of sectors to avoid in the coming decade. With regard to privacy, the news is equally grim for large tech outfits. The EU General Data Protection Regulation (GDPR), which came into force on May 2018, imposes compliance burdens on any company handling user data. In the US, California has signed its own version of the law – the Consumer Privacy Act – which will go into effect in January 2020. These laws give consumers the right to know what information companies are collecting about them and who that data is shared with. They also allow consumers to ask technology companies to delete their data or not to sell it. While tech companies are likely to fight the new California law, and the US court system is a source of uncertainty, we believe the writing is on the wall. The EU is by some measures the largest consumer market on the planet. California is certainly the largest US market. It is unlikely that the momentum behind consumer protection will change, especially with the EU and California taking the lead. The odds of a federal privacy law, following in the footsteps of the Consumer Privacy Act, are also rising. Investment Implication #5: Shun Interactive Media & Services Stocks These risks introduce a severe overhang for FAANG stocks. We are especially worried for the S&P interactive media & services index that includes GOOGL and FB. Chart II-8Regulation Will Squeeze Tech Margins
Regulation Will Squeeze Tech Margins
Regulation Will Squeeze Tech Margins
Tack on the threat of federal regulation and this represents another major headwind for profits and margins that are extremely elevated for these near monopolies. Given that advertising revenue is crucial to the business model of social media companies (GOOGL and FB included), a significant uptick in privacy regulation will likely hurt their bottom line. With regard to profit margins, tech stocks in general command a profit margin twice as high as the SPX. Specifically, FB and GOOGL enjoy margins that are 500 basis points higher than the broad tech sector (Chart II-8)! This is unsustainable and they will likely serve as easy prey for policymakers. Our view does not necessarily call for breaking up these monopolies. The US will have to weigh the economic consequences of anti-trust policy in a context of multipolarity in which China’s national tech champions are emerging to compete with American companies for global market share. Nevertheless, increased regulation is inevitable and some forced sales of crown jewel assets may take place. Moreover, the threat of a breakup will lurk in the background, creating uncertainty until key legislative and judicial battles have already been fought. That will take years. Finally, we doubt the tech sector will be left alone to “self-regulate” its incumbents and negotiate a price on consumers’ privacy. More likely, a new privacy law will loom, serving as a negative catalyst for profit growth. Uncertainty will weigh on the S&P interactive media & services relative performance. The ticker symbols to short/underweight the S&P interactive media & services index are an equally weighted basket of GOOGL and FB (they command a 98% market cap weight in the index). Theme #3: SaaS, Artificial Intelligence, Augmented Reality And Autonomous Driving Are Not Fads The third big theme that will even outlive the upcoming decade is the proliferation of software as a service (SaaS). The move to cloud computing and SaaS, the wider adoption of artificial intelligence, machine learning, autonomous driving and augmented reality are not fads, but enjoy a secular growth profile. In the grander scheme of things today’s world is surrounded by software. Millions of lines of code go even into gasoline powered automobiles, let alone electric vehicles. Autonomous driving is synonymous with software, the Internet of Things (IoT) needs software, the space race depends on software, modern manufacturing and software are closely intertwined, phone calls for quite some time have been a software solution, and the list goes on and on. This tidal effect is hard to reverse and is already embedded in workflows across industries. Opportunities to penetrate health care and financial services more deeply remain unexplored and it is difficult to envision another competing industry unseating “king software”. These secular trends are not only productivity enhancing, but will also most likely prove recession-proof. When growth is scarce investors flock to any source of growth they can come by and we are foreseeing that when the next recession arrives, investors will likely seek shelter in pure play SaaS firms. Investment Implication #6: Software Is Eating The World Chart II-9Software Is Eating The World
Software Is Eating The World
Software Is Eating The World
Buying software stocks for the long haul seems like a bulletproof investment idea. But the recent stellar performance of software stocks has moved valuations to overshoot territory. Our recommended strategy is to buy or add software stock exposure on any weakness with a 10-year investment time horizon. All of these secular trends have pushed capital outlays on software into a structural uptrend. Software related capex is not only garnering a larger slice of the tech spending budgets but also of the overall capex pie. If it were not for software capex, the contraction in non-residential investment in recent quarters would have been more severe (Chart II-9). Private sector software capex is near all-time highs as a share of total outlays. Government investment in software is also reaccelerating at the fastest pace since the tech bubble. When productivity gains are anemic, both the business and government sectors resort to software upgrades in order to boost productivity. Cyber security is another more recent source of software related demand as governments around the globe are taking such risks extremely seriously (bottom panel, Chart II-9). Given this upbeat demand backdrop and ongoing equity retirement, software stocks are primed to grow into their pricey valuations. Finally, this long-term trade will also serve as a hedge to the short/underweight position we recommend in the S&P interactive media & services index. The closest ETF ticker symbol resembling the S&P software index is IGV:US. Theme #4: Millennials Already Are The Largest Cohort And Will Dominate Spending The fourth long-term theme we anticipate to gain traction in the 2020s is the demographic rise of the Millennial generation. Much has been made of preparing for the arrival of the Millennial generation, accompanied by well-worn stereotypes of general "failure to launch" as they reach adulthood. However, "arrival" is a misnomer as this age cohort is already the largest and "failure" is simply untrue. According to the US Census Bureau, Millennials are the US’s largest living generation. Millennials (or Echo Boomers) defined as people aged 18 to 37 (born 1982 to 2000), now number more than 80mn and represent more than one quarter of the US’s population. Baby Boomers (born 1946 to 1964) number about 75mn. Stealthily becoming the largest age group in the US over the last few years, Millennials per-year-birth-rate peaked at 4.3mn in 1990. Surprisingly, the pace matched that of the post-war Baby Boom peak-per-year-birth-rate in 1957 - the per-year average over the period was higher for the Baby Boomers (Chart II-10). Chart II-10Millennials Are The Largest Cohort
Millennials Are The Largest Cohort
Millennials Are The Largest Cohort
This gap is now set to grow rapidly as the death rate of Baby Boomers accelerates. What is more, the largest one-year age cohort is only 25 years old, thus, Millennials will be the dominant generation for many years. It is unclear how these “kids” will impact the market as they become the most important consumers, borrowers and investors, but make no mistake: this is a seismic shift in economic power and it is here to stay. The Echo Boom is a big, generational demographic wave. A difficult and painful delay has not tempered its looming importance. Finally, this wave of echo-boomers is educated, relatively unburdened by debt (please see BOX in the June 11, 2018 Special Report on demystifying the student debt load as it pertains to Millennials), and as they inevitably “grow up”, form new households and have kids. They will borrow, spend, earn, but not necessarily save and invest to the same extent as the Boomers. And this will be an important long-term theme going forward. Near term, we might already be seeing signs of their arrival and firms have begun to pivot accordingly. Investment Implication #7: Buy The BCA Millennials Equity Basket Millennials will boost consumption spending in a number of different ways. The relatively unburdened Millennial cohort will be entering prime home acquisition age soon and this should underpin the long-term prospects of the US housing market and related industries. Furthermore, Millennials consume differently from their parents; social media, online shopping and smart phones are not the consumption categories of the Baby Boomers. With this in mind, we have created a basket of ten stocks that we think will be driven over the long term by the demographic rise of the Millennial. We note that these stocks are heavily weighted to the technology and consumer discretionary sectors, which is logical as Millennial consumption habits tend to be discretionary focused and technology-based. Beginning with consumer discretionary, we are highlighting AMZN, NFLX and SPOT as core holdings in our Millennials basket. AMZN’s heft dwarfs consumer discretionary indexes but it could fall in several categories; the acquisition of Whole Foods makes it a Millennials-focused consumer staples retailer and its cloud computing web services segment is a tech leader. NFLX and SPOT represent the means by which Millennials consume media, by streaming movies and music over the internet. The idea of owning physical media is rapidly becoming an anachronism. The home ownership theme noted in this report leads us to add HD and LEN to the basket. Millennials are “doers” and are set to be the dominant DIYers in the next few years, making HD a logical choice. LEN, as the nation’s largest home builder, should benefit from the Millennials coming of age into home buyers. We are also adding TSLA to our basket as a lone clean tech-oriented equity. TSLA capitalizes on the increasing shift to clean energy of Millennials (the key reason why no traditional energy companies have a spot in our basket). Chart II-11Buy BCA's Millennial Equity Basket
Buy BCA's Millennial Equity Basket
Buy BCA's Millennial Equity Basket
The technology stocks in our Millennials basket are AAPL, UBER (which replaces FB as of today) and MSFT, together representing more than 9% of the total value of the S&P 500. AAPL’s inclusion in the list is predictable as the leading domestic purveyor of devices on which Millennials consume media content. FB is a predictable holding, with more than half of all Americans being monthly active users, dominated by the Millennial cohort. It has served our basket well since inception, but today we are compelled to remove it and replace it with UBER. UBER is a Millennial favorite and the epitome of the sharing economy. In reality UBER is a logistics company and while it is losing money, it is eerily reminiscent of AMZN in its early days. Maybe UBER will dominate all means of transportation and its ease of use will propel it to a mega cap in the coming decade. Our inclusion of MSFT is based on its leadership in cloud computing, a rapidly growing industry. We expect the connectivity and mobile computing demands of Millennials will accelerate. The last stock we are adding to our basket is also the only financial services equity. Though avid consumers, Millennials have shown an aversion to cash, preferring card payment systems, including both debit and credit-based. Accordingly, we are adding the leader in both of these, V, to our Millennials basket (Chart II-11). Investors seeking long-term exposure to stocks lifted by the supremacy of the Millennial generation should own our Millennial basket (AAPL, AMZN, UBER, HD, LEN, MSFT, NFLX, SPOT, TSLA, V). We would not hesitate to add other sharing economy stocks, including Airbnb, to this basket should they become investable in the near future. Theme #5: ESG Becomes Mainstream Investors are increasingly looking at allocating assets based on environmental, social, and governance (ESG) considerations, and this mini-theme has the potential to become a big trend in the 2020s. There are a number of factors that underpin ESG investing. First, Millennials are climate conscious and given that they already are the largest cohort in the US they will not only dominate spending, but also influence election results. Moreover, via social media Millennials can sway public opinion and participate in the ESG conversation. Second, ECB President Christine Lagarde recent speech to the Economic and Monetary Affairs Committee of the European Parliament is a must read.2 If the ECB were to explicitly focus on climate change policy as part of its monetary policy operations then this is a game changer. Green investment financing including “green bonds” could become mainstream. Keep in mind that as reported in the FT, “the European Parliament has declared a climate emergency; the new European Commission (EC) has taken office on a promise of an imminent “green new deal”, and Commission president Ursula von der Leyen has vowed to accelerate emissions cuts.” Last week, the EC released “The European Green Deal” with a pretty aggressive time table. The EC president said “The green deal is Europe’s man on the moon moment” and presented 50 policies slated to get rolled by 2022 to meet revamped climate goals. The implication is that once ESG takes center stage at a number of these institutions, it will be easier to become mainstream and propagate the world over. Third, large institutional investors are starting to adopt an ESG mindset, especially pension plans. These investors with trillions of dollars at their disposal can not only disfavor fossil fuel investment, but also undertake investments in “green projects” via private and public equity markets. Banks are also moving in the “greening of finance” direction and given that they are the pipelines of the global plumbing system, swift adoption will go a long way in taking ESG mainstream. Finally, the electric vehicle (EV) proliferation is another key driver on how the ESG theme will play out in the 2020s. As a reminder, in the US 50% of all energy consumption is gasoline related linked to automobiles. While battery technology still has limitations, EV is no longer a fad as the German and Japanese automakers are starting to make inroads on TSLA. These car manufacturers do not want to be left out, especially if this shift toward EV becomes mainstream in the 2020s. The Chinese are not far behind on the EV manufacturing front, however government policy can really become a game changer. If a number of countries and/or California mandate a large share of all new vehicles sold be EV, then the investment implications will be massive. Investment Implication #8: Avoid Fossil Fuels, Gambling, Alcohol And Tobacco… While there are a few ESG related ETFs, we would rather explore this theme’s investment implications of sectors to avoid in the coming decade. We are believers that ESG criteria will continue to gain in importance in institutional investment management decisions. Accordingly, we would tend to avoid ‘sin stocks’, including gambling, tobacco and alcohol; demand for their services is unlikely to decline but investment weightings should mean that share prices will underperform. Further, we think a clean energy shift will mean energy stocks will likely continue to be long-term underperformers (Chart II-12). Final Thoughts On The US Dollar In this report, we tried to focus on the upcoming decade’s big themes that we expect to play out, and centered our recommendations on US equities/sectors. We do not want to neglect some macroeconomic variables that tend to mean revert over time. Specifically, the US dollar, interest rates and most importantly US indebtedness, will also be key drivers of investment theses in the 2020s. Currently, debt is rising faster than nominal GDP growth with the government and non-financial business debt-to-GDP profiles on an unsustainable path (second panel, Chart II-13). Chart II-12Areas To Avoid As ESG Becomes Mainstream
Areas To Avoid As ESG Becomes Mainstream
Areas To Avoid As ESG Becomes Mainstream
Chart II-13Unsustainable Debt Profiles
Unsustainable Debt Profiles
Unsustainable Debt Profiles
Granted, the saving grace has been generationally low interest rates as the debt service ratios have fallen (top panel, Chart II-13). However, if the four decade bull market in Treasurys is over, or may end definitively with the next US recession sometime in the early 2020s, then rising interest rates are the only mechanism to concentrate CEOs’ and politicians’ minds. On the dollar front, Chart II-14 highlights the ebbs and flows of the trade-weighted US dollar since it floated in the early-1970s. The DXY index has moved in six-to-ten year bull and bear markets. The most recent trough was during the depths of the Great Recession, while the (tentative?) peak was in late-2016. If history repeats, eventually the dollar will mean revert lower in the 2020s, especially given the fiscal profligacy of the current administration that may continue into 2024, assuming President Trump gets re-elected next November. Chart II-14Greenback's Historical Ebbs And Flows
Greenback's Historical Ebbs And Flows
Greenback's Historical Ebbs And Flows
The US dollar remains the reserve currency of the world today, but that exorbitant privilege is clearly fraying on the edges as the balance-of-payments dynamics are heading in the wrong direction. Over the next five years, the US Congressional Budget Office (CBO) estimates that the US budget deficit will swell to 4.8% of GDP. Assuming the current account deficit widens a bit then stabilizes (usually happens when global growth improves), this will pin the twin deficits at 8% of GDP. This assumes no recession, which would have the potential to swell the deficit even further. The US saw its twin deficits swell to almost 13% of GDP following the financial crisis, but the difference then was that in the wake of the commodity boom the dollar was cheap (and commodity currencies overvalued). The subsequent shale revolution also greatly cushioned the US trade deficit. Shale productivity remains robust and US output will continue to rise, but the low-hanging fruit has already been plucked. Chart II-15Twin Deficits Will Weigh On The US Dollar
Twin Deficits Will Weigh On The US Dollar
Twin Deficits Will Weigh On The US Dollar
For one reason or another, foreign central banks are diversifying out of dollars. If due to the changing landscape in trade, this is set to continue. If it is an excuse to shy away from the rapidly rising US twin deficits, this will continue as well. In a nutshell, there has been hardly a time in recent history when the twin deficits in the US were rising and the dollar was in a secular uptrend (Chart II-15). Another dollar-negative force is its expensiveness. By rising 35% since its trough, the USD has sapped the competitiveness of the US manufacturing sector, which is accentuating the American trade deficit outside of the commodity sector. If the ESG trend ends up hurting oil prices, the US current account will follow the widening deficit in manufactured products. Moreover, the US is lagging Europe on the green revolution. Either the US will have to import green technologies, or the US government will have to provide more subsidies to the private sector. Either way, both of these dynamics will hurt the US current account deficit further. Historically, the currency market is the main vehicle to correct such imbalances. The apex of globalization will also hurt the greenback. In a world where all the markets are integrated, borrowers in EM nations often use the reserve currency to issue liabilities at a lower cost. This boosts the demand by EM central banks for US dollar reserves to protect domestic banking systems funded in USD. Moreover, some countries like China implement pegs (both official and unofficial) to the US dollar in order to maintain their competitiveness and export their production surpluses to the US. To do so they buy US assets. If the global economy becomes more fragmented and the Sino-US relationship continues to deteriorate structurally as we expect, then these sources of demand for the dollar will recede. Overlay the widening US current account deficit, and you have the perfect recipe for a depreciating trade-weighted US dollar. Finally, the US is likely to experience more inflation than the rest of the world following the next recession. The US economy has a smaller capital stock as a share of GDP than Europe or Japan, and American demographics are much more robust. This means that the neutral rate of interest is higher in the US than in other advanced economies. As a result, the Fed will have an easier time generating inflation by cutting real rates than both the ECB and the BoJ. Higher inflation will ultimately erode the purchasing power of the dollar and prove to be a structurally negative force for the USD. Anastasios Avgeriou US Equity Strategist Matt Gertken Geopolitical Strategist Marko Papic Chief Strategist, Clocktower Group Chester Ntonifor Foreign Exchange Strategist Mathieu Savary Vice President The Bank Credit Analyst Footnotes 1 Please see US Equity Strategy Special Report "Brothers In Arms," dated October 31, 2016, available at uses.bcaresearch.com 2 https://www.imf.org/en/News/Articles/2019/09/04/sp090419-Opening-Statement-by-Christine-Lagarde-to-ECON-Committee-of-European-Parliament
As 2019 draws to a close, we thank you for your ongoing readership and support. We wish you and your loved ones a happy holiday season and all the best for a healthy and prosperous 2020. Highlights We explore the principal risks to our optimistic 2020 outlook. Trade and the 2020 US Presidential election remain potential landmines. A stronger dollar would tighten global financial conditions and be deflationary. Credit market tremors would end buybacks. Stronger-than-expected inflation would force a cycle-ending Federal Reserve tightening. Weaker-than-expected inflation would first allow for larger bubbles to form at the expense of a more painful recession and deeper a bear market down the road. Hedging against those risks warrants overweighting cash, TIPs and gold. Feature Chart I-1Timing is Ripe For A Recovery
Timing is Ripe For A Recovery
Timing is Ripe For A Recovery
As always, this year’s visit from Ms. and Mr. X was thought-provoking and generated diverse investment ideas.1 While we did not share Mr. X’s fears, his caution may be justified because an aging business cycle, elevated equity multiples and extremely expensive government bonds do not mesh with pro-risk portfolio positioning. With this in mind, we will explore the greatest risks to our positive market outlook, which include politics, the US dollar, problems in the credit market, a quicker resumption of inflation and lower inflation. The Central Scenario To understand how these five risks affect our central thesis, let’s review the key views and themes that underpin our bullish outlook. BCA expects global economic activity to recover in 2020. First, the global inventory contraction is advanced, which increases the chance that the manufacturing cycle will track its usual pattern of an 18-month decline followed by an 18-month acceleration (Chart I-1). Secondly, Chinese policymakers are putting a floor under domestic economic activity and the stabilization in credit growth and the climbing fiscal impulse already augur well for global growth (Chart I-2). Thirdly, global liquidity is in a major upswing, thanks to easing by central banks around the world (Chart I-3). Finally, the trade détente between the US and China agreed last week reduces the odds of a destructive trade war. Chart I-2China's Policy Turnaround
China's Policy Turnaround
China's Policy Turnaround
Chart I-3Easing Abound!
Easing Abound!
Easing Abound!
US monetary policy will remain accommodative next year. US inflation will remain subdued in the first half of 2020 in response to both the global growth slowdown underway since mid-2018 and the lagged effect of a stronger dollar. Moreover, Fed policy will remain sensitive to inflation expectations. According to BCA’s US Bond Strategy’s model, it could take an extended overshoot in realized inflation before inflation expectations move back to the 2.3% to 2.5% range consistent with achieving a 2% inflation target (Chart I-4). Thus, the Fed will remain on pause for all of 2020. BCA’s positive outlook depends on both China and the US respecting their trade truce. In this context, the dollar will depreciate. The USD is a countercyclical currency and typically suffers when global economic activity rebounds, especially if inflation remains tame (Chart I-5). This behavior is due to the low share of the US economy dedicated to manufacturing and exports, which makes the US less sensitive to global trade and industrial activity. Moreover, when the world economy strengthens, safe-haven flows that boost the dollar in times of duress reverse, which accentuates the selling pressure on the USD. Chart I-4Realized Inflation Will Guide Expectations
Realized Inflation Will Guide Expectations
Realized Inflation Will Guide Expectations
Chart I-5The Dollar Won't Respond Well To Stronger Global Growth
The Dollar Won't Respond Well To Stronger Global Growth
The Dollar Won't Respond Well To Stronger Global Growth
Global bond prices will be another victim of an improving economic outlook. Global safe-haven securities are extremely expensive and investors are too bullish toward this asset class (Chart I-6). This puts government bonds at risk in the face of positive economic surprises. However, the upside in Treasury yields will be capped between 2.25 and 2.5% because the Fed will be cautious about lifting rates. This move will likely be led by inflation expectations. As a result, we favor TIPs over nominal Treasurys. Chart I-6Safe-Haven Yields Have Upside
Safe-Haven Yields Have Upside
Safe-Haven Yields Have Upside
Chart I-7Investors Aren't Feeling Exuberant About Earnings Growth
Investors Aren't Feeling Exuberant About Earnings Growth
Investors Aren't Feeling Exuberant About Earnings Growth
Equities will outperform bonds. The S&P 500 is trading at 18-times forward earnings and 2.3-times sales. However, those elevated multiples are due to depressed risk-free rates. Long-term growth expectations embedded in stock prices are only 1%, toward the bottom of this series’ historical distribution (Chart I-7). Therefore, investors are not particularly optimistic on the long-term prospects of per-share earnings. This lack of euphoria implies that stocks are not as expensive as bonds, and that if yields climb because of improving global economic activity, then equities will outperform bonds. Moreover, with a backdrop of easy money and no recession forecast until 2022, the timing still favors positive returns for equities in the coming 12 to 18 months (Table I-1). Table I-1The End Game Can Be Rewarding
January 2020
January 2020
Finally, we favor European equities over US stocks. This regional slant is as much a reflection of the better value offered by European stocks as it is of their sector composition. European stocks are trading at a forward PE of 14, implying an equity risk premium of 846 basis points versus 546 basis points in the US. Moreover, our preference for industrials, energy and financials favors European equities (Table I-2). Additionally, European banks are our favorite equity bet worldwide because they trade at a price-to-book ratio of only 0.6 and the drivers of their return on tangible equity are perking up (Chart I-8). Table I-2Europe: Overweight In The Right Sectors
January 2020
January 2020
Chart I-8Brightening Prospects For Euro Area Banks
Brightening Prospects For Euro Area Banks
Brightening Prospects For Euro Area Banks
Risk 1: Politics BCA’s positive outlook depends on both China and the US respecting their trade truce. However, the two countries are long-term rivals and the rising geopolitical power of China relative to the US will cause tensions to escalate in the coming decades (Chart I-9). This also suggests that China and the US are highly unlikely to ever have an agreement that fully covers intellectual property transfers. Chart I-9China/US Tensions Are Structural
China/US Tensions Are Structural
China/US Tensions Are Structural
The US could still renege on the “Phase One” deal. President Trump faces an election in 2020 and the majority of Democratic hopefuls are also hawkish on China. If Trump’s low approval rating does not improve soon (Chart I-10), he could become a more war-like president, in the hope that electors will rally around the flag. A renewed trade war would hurt business sentiment and undermine consumer spending (Chart I-11). A bellicose approach to international relations, especially on trade, would spark another spike in global policy uncertainty that will hurt global capex intentions. Meanwhile, companies could cut employment, which would weigh on household incomes. A rising unemployment rate could also hurt household confidence, reinforcing the slowdown in consumer spending. This would guarantee an earlier recession. Stocks would decline along with global government bond yields. Chart I-10President Trump Can Still Make It
January 2020
January 2020
Chart I-11Households On The Edge
Households On The Edge
Households On The Edge
The US election creates an additional political risk. Democratic candidates are touting higher corporate taxes, a wealth tax, a greater regulatory burden, antitrust actions, and so on. These policies are worrisome to corporate leaders and business owners. For the time being, our Geopolitical Strategy team favors a Trump victory in 2020 (Chart I-12).2 However, if his odds deteriorate significantly, then business executives would likely curtail capex and hiring. This could also result in a US recession that would invalidate our central scenario for 2020. Chart I-12Our Model Still Favors President Trump
January 2020
January 2020
Risk 2: A Strong Dollar A strong US dollar would hurt growth. A continued dollar rally would counteract a large proportion of the easing in liquidity conditions created by accommodative central banks around the world. The dollar affects the global cost of capital. Both advanced economies and emerging markets have USD-denominated foreign currency debt totaling around $6 trillion each. A strong USD raises the cost of servicing this large debt load, which could force borrowers to curtail their spending. A continued dollar rally would counteract a large proportion of the easing in liquidity conditions created by accommodative central banks around the world. Despite our conviction that the US dollar will depreciate in 2020, the following factors may invalidate our thesis: The USD still possesses the highest carry in the G10. When the dollar is supported by some of the highest interest rates in the G10, it often continues to rally (Chart I-13). Chart I-13The Dollar Offers An Elevated Carry
The Dollar Offers An Elevated Carry
The Dollar Offers An Elevated Carry
The global growth rebound may be led by the US. If the US leads the rest of the world higher, then rates of return in the US would climb quicker than in the rest of the world. The resulting capital inflows would bid up the dollar. The shortage of USDs in offshore markets may flare up again. The September seize-up in the repo market was a reminder that because of the Basel III rules, global banks have a strong appetite for high-quality collateral and reserves. This generates substantial demand for the USD, which could put upward pressure on its exchange rate. The US dollar is a momentum currency. Among the G10 currencies, the USD responds most strongly to the momentum factor (Chart I-14).3 The dollar’s strength in the past 18 months could initiate another wave of appreciation. The dollar may not be as expensive as suggested by purchasing power parity (PPP) models. According to PPP estimates, the trade-weighted dollar is 24.2% overvalued. However, according to behavioral effective exchange rate models (BEER), the dollar may be trading closer to its fair value (Chart I-15). Chart I-14The Dollar Is A Momentum Currency
January 2020
January 2020
Chart I-15Is The Dollar Expensive?
Is The Dollar Expensive?
Is The Dollar Expensive?
Why are the five items listed above risks for the dollar, but not our central scenario? Regarding the dollar’s carry, in 1985, 1999, and 2006, the US still offered some of the highest short-term interest rates among advanced economies, nevertheless the dollar began to depreciate. In those three instances, an acceleration in foreign economic activity relative to the US was the key culprit behind the USD’s weakness. In 2020, we expect foreign economies to lead the US higher. Since mid-2018, the manufacturing sector has been at the center of the global slowdown. But now, inventory and monetary dynamics point towards a re-acceleration in manufacturing activity. The US was the last nation to be hit by the growth slowdown; it will also be the last to reap a dividend from the recovery. The marginal buyers of US equities have been US firms. On the danger created by the dollar and the collateral shortage, the Fed is tackling the lack of excess reserves head-on by injecting $60 billion per month of reserves via its asset purchases. Moreover, the US fiscal deficit, which is tabulated to reach $1.1 trillion in 2020, will add a similar amount of dollars to the pool of high-quality collateral around the world, especially as the US current account deficit is widening anew. On the momentum tendency of the USD, the dollar’s momentum seems to be petering off. A move in the Dollar Index below 96 would indicate a major change in the trend for the DXY. Finally, estimates of a currency’s fair value based on BEER fluctuate much more than those based on PPP. If the global growth pick-up allows foreign neutral rates to increase relative to the US over the coming 12 to 24 months, then the dollar’s BEER equilibrium will likely converge toward PPP, putting downward pressure on the USD. Risk 3: Credit Market Tremors A credit market selloff is not our base case, but it would be damaging to risk assets. A deterioration in credit quality would be the main culprit behind a widening in credit spreads. Our Corporate Health Monitor already shows that the credit quality of US firms is worsening (Chart I-16). Moreover, the return on capital of the US corporate sector is rapidly deteriorating. Accentuating these risks, US profit margins have begun to decline because a tight labor market is exerting an upward pull on real unit labor costs (Chart I-17). Furthermore, the near-total disappearance of covenants in new corporate bond issuance increases the risks to lenders and will likely depress recovery rates when a default wave emerges. Chart I-16Deteriorating Fundamentals For US Corporates
Deteriorating Fundamentals For US Corporates
Deteriorating Fundamentals For US Corporates
Chart I-17A Tight Labor Market Is Biting Into Margins
A Tight Labor Market Is Biting Into Margins
A Tight Labor Market Is Biting Into Margins
Widening credit spreads would signal a darkening economic outlook. Historically, wider spreads have been an excellent leading indicator of recessions (Chart I-18). Wider spreads have a reflexive relationship with the economy: they reflect anticipation of rising defaults by investors, but they also represent a price-based measure of lenders’ willingness to extend credit. Therefore, wider spreads force open the underlying cracks in the economy by depriving funds to weak borrowers. The resulting deterioration in capex and hiring would prompt a decline in consumer confidence and spending, ultimately leading to a recession. Chart I-18Widening Spreads Foreshadow Recessions
Widening Spreads Foreshadow Recessions
Widening Spreads Foreshadow Recessions
Chart I-19Who Is Buying Stocks? Businesses!
Who Is Buying Stocks? Businesses!
Who Is Buying Stocks? Businesses!
US equities may prove to be even more sensitive to the health of the credit market than in previous cycles. The marginal buyers of US equities have been US firms, which have engaged in equity retirements totaling $16.5 trillion since 2010. Since that date, pension plans, foreigners and households have sold a total of $7.7 trillion in US equities (Chart I-19). Both internally generated cash flows and borrowings have allowed for a decline in the equity portion of funding among US firms. Therefore, a weak credit market would hurt equities because a recession would depress firms’ free cash flows and hamper the capacity of firms to buy back their shares. Finally, the tendency of US firms to borrow to buy back their shares means that newly issued debt has not been matched by as much asset growth as in previous cycles. Therefore, borrowing is not backed by the same degree of collateral as in past cycles. If the credit market seizes up, then default and recovery rates will suffer even more than suggested by our corporate health monitor. The VIX will blow up and equities could suffer. Higher US inflation is potentially the most important downside risk for next year. While a widening in credit spreads would have a profound impact on stocks, it is unlikely to materialize when the Fed conducts a very accommodative monetary policy and global growth recovers. Risk 4: Higher Inflation Chart I-20The US Labor Market Is Tight
The US Labor Market Is Tight
The US Labor Market Is Tight
Higher US inflation is potentially the most important downside risk for next year as it would catalyze the aforementioned dangers. Inflation could surprise to the upside because the labor market is tight. At 3.5%, the unemployment rate is well below equilibrium estimates that range between 4.1% and 4.6%. Small firms are increasingly citing their inability to find qualified labor as the biggest constraint to expand production. In the Conference Board Consumer Confidence survey, the number of households reporting that jobs are easily procured is near a record high relative to those preoccupied by poor job prospects. Finally, the voluntary quit rate is at 2.3%, a near record high (Chart I-20). Core PCE remains at only 1.6% year-on-year, but investors should recall the experience of the late 1960s. Through the 1960s, the labor market was tight, yet core inflation remained between 1% and 2%. However, in 1966, inflation suddenly accelerated to 4% before peaking near 7% in 1970. Some inflation dynamics warrant close monitoring. The three-month annualized rate of service inflation excluding rent of shelter has already surged to 4.5% and the same metric for medical care inflation stands at 5.9%. A continued tightening in the labor market could solidify a broadening of these trends because a rising employment-to-population ratio for prime-age workers points toward stronger salaries and ultimately higher domestic demand (Chart I-21). A very weak dollar would also allow this scenario to develop. Chart I-21Household Income Growth Will Accelerate
January 2020
January 2020
A sudden flare in inflation would prompt an abrupt tightening in liquidity conditions that would be lethal for the economy. An out of the blue surge in CPI would likely cause a swift reassessment of inflation expectations by households and investors. Under these circumstances, the Fed could tighten monetary policy much faster than we currently envision. If interest rate markets are forced to price in a prompt removal of monetary accommodation, Treasury yields could easily spike above 3.5% by year end, which would hurt both the economy and the expensive equity market. If realized inflation turns out weaker than we expect in 2020, then central banks will maintain accommodative policies beyond next year. For now, this scenario remains a tail risk because the recent economic slowdown will probably continue to act as a dampener on US inflation in the first half of the year. Additionally, we do not expect the USD to collapse by 40% and fan inflation and inflation expectations, as occurred from 1985 to 1987. Instead, inflation expectations are much better anchored than they were in either the 1960s or 1980s, decreasing the risk that the Fed will suddenly have to tighten policy. Risk 5: Weaker-Than-Expected Inflation Chart I-22An Aggressive BoJ Did Not Achieve Inflation
An Aggressive BoJ Did Not Achieve Inflation
An Aggressive BoJ Did Not Achieve Inflation
The last risk is paradoxical, but it is the one with the highest probability. It is paradoxical because it involves greater upside for stocks next year than we currently anticipate, but at the expense of a much deeper bear market in the future. The labor market may be tight, but Japan’s experience cautions us against extrapolating that inflation is necessarily around the corner. In Japan, the unemployment rate has been below 3.5% since 2014 and minimal domestically generated inflation has emerged. Inflation excluding food and energy remains at a paltry 0.7% year-on-year, even as the Bank of Japan has kept the policy rate at -0.1% and expanded its balance sheet from 20% of GDP in 2008 to 102% today (Chart I-22). If realized inflation turns out weaker than we expect in 2020, then central banks will maintain accommodative policies beyond next year. Central banks are currently toying with their inflation targets, discussing allowing inflation overshoots and displaying deep paranoia in the face of deflation. By weighing on inflation expectations, low realized inflation would nail policy rates around the world at currently depressed levels or even lower. Chart I-23Bubbles Destroy Long-Term Return On Capital
Bubbles Destroy Long-Term Return On Capital
Bubbles Destroy Long-Term Return On Capital
In this context, bond yields would have even more limited upside than we envision and risk assets could experience higher multiples than today. In other words, we would have a perfect scenario for another stock market bubble. Vulnerability would escalate as valuations balloon and the perceived risk of monetary tightening dissipates from both investors’ and economic agents’ minds. Elevated asset valuations portend lower long-term expected returns (Chart I-23) and a larger share of the capital stock would become misallocated. Ultimately, the stimulative impact of such a bubble would create its own inflationary pressures. Consumers and companies would accumulate more debt and cyclical spending would rise (Chart I-24). In the end, the Fed would raise rates more aggressively, but the economy would be more vulnerable to those higher rates. Chart I-24Higher Cyclical Spending Creates Vulnerabilities
Higher Cyclical Spending Creates Vulnerabilities
Higher Cyclical Spending Creates Vulnerabilities
Therefore, we would see a larger recession and, because assets are more expensive, a greater decline in prices. This would be extremely destabilizing for the global economy, potentially much more so than if a recession were to emerge today. Moreover, since the resulting slump would be yet another balance-sheet recession, it would likely entail a lack of capacity by central banks to reflate their economies. Conclusion The scenarios above are all risks to our benign view for 2020. The first four represent downside threats for assets next year, but the last one (weaker-than-expected inflation) entails upside potential to our forecast next year with significantly more painful results down the line. These risks are important to consider when protecting our portfolio, which has a pro-cyclical bias. It is overweight stocks, underweight bonds, and favors cyclical equities as well as foreign bourses at the expense of the US. BCA’s Global Asset Allocation service recently published an article on safe havens, which studied the profile of risk assets under various circumstances.4 Treasurys normally are the best safe haven, however, at current levels of yields, this benefit will be small compared with previous cycles. Instead, we favor an overweight position in cash, TIPs and gold. The best defense against short-term gyrations is to think about long-term strategic asset allocation. In this regard, this month’s Special Report – co-authored with BCA’s Equity, Geopolitical and Foreign Exchange Strategists, and Marko Papic, Chief Strategist at Clocktower Group – discusses our top sector calls for the upcoming decade. Mathieu Savary Vice President The Bank Credit Analyst December 20, 2019 Next Report: January 30, 2020 II. Top US Sector Investment Ideas For The Next Decade Every decade a dominant theme captures investors’ imaginations and morphs into a bubble. Massive speculation typically propels the relevant asset class into the stratosphere as investors extrapolate the good times far into the future and go on a buying frenzy. Chart II-1 shows previous manic markets starting with the Nifty Fifty, gold bullion, the Nikkei 225, the NASDAQ 100, crude oil and most recently the FAANGs. Chart II-1Manias: An Historical Roadmap
Manias: An Historical Roadmap
Manias: An Historical Roadmap
What will be the dominant themes of the next decade? How should investors capitalize on some of these big trends? The purpose of this Special Report is to identify and provoke a healthy debate on the prevailing investment themes for the 2020s and to speculate on what the key US sector beneficiaries and likely losers may be. Theme #1: De-Globalization Picks Up Steam The first investment theme for the upcoming decade is the “apex of globalization” or “de-globalization”. We have written about this theme extensively at BCA Research and it is the mega-theme of our sister Geopolitical Strategy (GPS) service. Odds are high that countries will continue looking inward as the US adopts a more aggressive trade policy, China’s trend growth slows, and US-China strategic tensions intensify. The small cap preference is a secular view with a time horizon that spans the next decade. Chart II-2 shows that we are at the conclusion of a period of tranquility. Pax Americana underpinned globalization as much as Pax Britannica before it. The US is in a relative decline after decades of geopolitical stability allowed countries like China to rise to “great power” status and rivals like Russia to recover from the chaos of the 1990s. Chart II-2De-globalization Has Commenced
De-globalization Has Commenced
De-globalization Has Commenced
De-globalization has become the consensus since the election of Donald Trump. But Trump is not the prophet of de-globalization; he is its acolyte. Globalization is ending because of structural factors, not cyclical ones. Three factors stand at the center of this assessment, outlined in our 2014 Special Report, “The Apex Of Globalization – All Downhill From Here”: multipolarity, populism and protectionism. Events have since confirmed this view. One final long-term playable investment idea from the apex of globalization is a structural bull market in defense stocks. The three pillars of globalization are the free movement of goods, capital, and people across national borders. We expect to see marginally less of each in the future. Investment Implication #1: Profit Margin Peak The most profound and provocative investment implication from de-globalization is that SPX profit margins have peaked and will likely come under intense pressure, especially for US conglomerates that – on a relative basis to international peers – most enthusiastically embraced globalization. Chart II-3 shows reconstructed S&P 500 profits and sales data back to the late-1920s. Historically, corporate profit margins and globalization (depicted as global trade as a percentage of GDP) have been positively correlated. Chart II-3Profit Margin Trouble
Profit Margin Trouble
Profit Margin Trouble
As countries are more outward looking, trade flourishes and openness to trade allows the free flow of capital to take advantage of profit-maximizing projects. Following the Great Recession and similar to the Great Depression, trade has suffered and trade barriers have risen. The Sino-American trade war has accelerated the inward movement of countries, including Korea and Japan, and has had negative knock-on effects on trade as evidenced by the now two-year old global growth deceleration. China’s response to President Trump’s election was to redouble its pursuit of economic self-sufficiency, which meant a crackdown on corporate debt and a fiscal boost to household consumption. Trump’s tariffs then damaged sentiment and trade between the two countries. Any deal reached prior to the 2020 US election will remain in doubt among global investors. The longer the trade war remains unresolved, the deeper the cracks will be in the foundations of the global trading system. We are especially worried for the S&P interactive media & services index that includes GOOGL and FB. Such a backdrop is negative for profit margins, as inward looking countries prevent capital from being allocated most efficiently. Moreover, the uprooting of supply chains due to the trade war hurts margins and the redeployment of equipment in different jurisdictions will do the same at a time when final demand is suffering a setback. In addition, rising profit margins are synonymous with wealth accruing to the top 1% of US families and vice versa. This relationship dates back to the late-1920s, as far back as our dataset goes. Using Piketty and Saez data, which exclude capital gains, it is clear that profit margin expansion exacerbates income inequality (top panel, Chart II-4). Chart II-4Heightened Risk Of Wealth Re-distribution
Heightened Risk Of Wealth Re-distribution
Heightened Risk Of Wealth Re-distribution
Expanding margins lead to higher profits. Because families at the top of the income distribution are often business owners, income disparities are the widest when margins are in overshoot territory. Eventually this income chasm comes to a head and generates political discontent. Populism has emerged on both the right and left wings of the US political spectrum – and since the rise of Trump, even Republicans complain about inequality and the excesses of “corporate welfare” and laissez-faire capitalism. Because inequality is extreme – relative to America’s developed peers – and political forces are mobilizing against it, the probability of wealth re-distribution is rising in the coming decades (middle panel, Chart II-4). Labor’s share of national income has nowhere to go but higher in coming years and that is negative for profit margins, ceteris paribus (bottom panel, Chart II-4). Buy or add software stock exposure on any weakness with a 10-year investment time horizon. Drilling beneath the surface, the three secular US equity sector/factor implications of the apex of globalization paradigm shift are: prefer small caps over large caps prefer value over growth overweight the pure-play BCA Defense Index Investment Implication #2: Small Is Beautiful Chart II-5It's A Small World After All
It's A Small World After All
It's A Small World After All
While a small cap bias is contrary to the cyclical US Equity Strategy view of preferring large caps to small caps, the issue is timing: the small cap preference is a secular view with a time horizon that spans the next decade. The small versus large cap share price ratio’s ebbs and flows persist over long cycles. Small caps outshined large caps uninterruptedly from 1999 to 2010. Since then large caps have had the upper hand (Chart II-5). Were the apex of globalization theme to gain traction in the 2020s, small caps should reclaim the lead from large caps, especially in the wake of the next US recession. Similar to the death of the global banking model, companies with global footprints will suffer the most, especially compared with domestically focused outfits. One way to explore this theme is via domestic versus global sector preference. But a more investable way to position for this sea change, is to buy small caps (or microcaps) at the expense of large caps (or mega caps). Small caps are traditionally domestically geared compared with large caps that have significantly more foreign sales exposure. The closest ETF ticker symbols resembling this trade is long IWM:US/short SPY:US. Investment Implication #3: Buy Value At The Expense Of Growth Similar to the size bias, the style bias also moves in secular ways. Value outperformed growth from the dot com bust until the GFC. Since then growth has crushed value, even temporarily breaking below the year 2000 relative trough. This breakneck pace of appreciation for growth stocks is clearly unsustainable and offers long-term oriented investors a compelling entry point near two standard deviations below the historical mean (Chart II-6). Chart II-6Value Has The Upper Hand Versus Growth
Value Has The Upper Hand Versus Growth
Value Has The Upper Hand Versus Growth
Financials populate value indexes, a similarity with small cap outfits. Traditionally, financials are a domestically focused sector with export exposure registering at half of the S&P’s average 40% level of internationally sourced revenues. On the flip side, tech stocks sit atop the growth table and they garner 60% of their revenue from abroad. This value over growth style preference will pay handsome dividends if the de-globalization theme becomes more mainstream as countries become more hawkish on trade and the Sino-American war continues to erect barriers to trade that took decades to lift. We have created a basket of ten stocks that we think will be driven over the long term by the demographic rise of the Millennial. The caveat? President Trump's recent short-term deal with China could set back the de-globalization theme. But our geopolitical strategists do not anticipate it to be a durable deal, and they also expect the trade war to resume in some way, shape or form in 2021-22, regardless of the outcome of the US election. The closest ETF ticker symbols resembling this trade is long IVE:US/short IVW:US. Investment Implication #4: Defense Fortress Chart II-7Stick With Pure-play Defense Stocks
Stick With Pure-play Defense Stocks
Stick With Pure-play Defense Stocks
One final long-term playable investment idea from the apex of globalization is a structural bull market in defense stocks (Chart II-7). The US Equity Sector service's October 2016 “Brothers In Arms” Special Report drew parallels with the late nineteenth century period of European rearmament, and the American and Soviet arms race of the 1960s.5 These movements were greatly beneficial to the aerospace and defense industry. Currently, the move by several countries to adopt more independent foreign policies, i.e. to move away from collaboration and cooperation toward isolationism and self-sufficiency, entails an accompanying arms race. Table II-1
January 2020
January 2020
China’s challenge to the regional political status quo motivates a boost to defense spending globally. In fact, SIPRI data on global military spending by 2030 (Table II-1) increases our conviction that this trade will succeed on a five-to-ten year horizon. Beyond the global arms race, two additional forces are at work underpinning pure-play defense contractors. A global space race with China, India and the US wanting to have manned missions to the moon, and the rise of global cybersecurity breaches. Defense companies are levered to both of these secular forces and should be prime sales and profit beneficiaries of rising space budgets and increasing cybersecurity combat budgets. The ticker symbols for the stocks in the pure-play BCA defense index are: LMT, RTN, NOC, GD, HII, AJRD, BWXT, CW, MRCY. Theme #2: Tech Sector Regulation, US Enacts Privacy Laws The second long-term geopolitical theme that we are exploring is the regulatory or “stroke of pen” risk that is rising on FAANG stocks – Facebook, Apple, Amazon, Netflix, and Google. These companies were this decade’s undisputed stock market winners. The US anti-trust regulatory framework was designed to curb broad anti-competitive actions of trusts. As Lina Khan discusses in her seminal article, these actions “include not only cost but also product quality, variety, and innovation.” However, through subsequent regulatory evolution, the Chicago School has focused the US anti-trust process on consumer welfare and prices. If President Reagan and the courts could change how anti-trust laws were administered in the 1980s, so too can future administrations and courts. Today the US Congress, on both sides of the aisle, is looking into regulatory tightening, while the judicial system will take longer to change its approach. Moreover, the impetus for tougher anti-trust policy is here. It comes from a long period of slow growth, income inequality, and economic volatility – such as in the 1870s-80s. This was certainly the case for Standard Oil in 1911, which became a nation-wide boogeyman despite most of its transgressions occurring in the farm belt states. Today, income inequality is a prominent political theme and source of consumer discontent. A narrative is emerging – which will be super-charged during the next recession – that growth has been unequally distributed between the old economy and the twenty-first century technology leaders. While there are a few ESG related ETFs, we would rather explore this theme’s investment implications of sectors to avoid in the coming decade. With regard to privacy, the news is equally grim for large tech outfits. The EU General Data Protection Regulation (GDPR), which came into force on May 2018, imposes compliance burdens on any company handling user data. In the US, California has signed its own version of the law – the Consumer Privacy Act – which will go into effect in January 2020. These laws give consumers the right to know what information companies are collecting about them and who that data is shared with. They also allow consumers to ask technology companies to delete their data or not to sell it. While tech companies are likely to fight the new California law, and the US court system is a source of uncertainty, we believe the writing is on the wall. The EU is by some measures the largest consumer market on the planet. California is certainly the largest US market. It is unlikely that the momentum behind consumer protection will change, especially with the EU and California taking the lead. The odds of a federal privacy law, following in the footsteps of the Consumer Privacy Act, are also rising. Investment Implication #5: Shun Interactive Media & Services Stocks These risks introduce a severe overhang for FAANG stocks. We are especially worried for the S&P interactive media & services index that includes GOOGL and FB. Chart II-8Regulation Will Squeeze Tech Margins
Regulation Will Squeeze Tech Margins
Regulation Will Squeeze Tech Margins
Tack on the threat of federal regulation and this represents another major headwind for profits and margins that are extremely elevated for these near monopolies. Given that advertising revenue is crucial to the business model of social media companies (GOOGL and FB included), a significant uptick in privacy regulation will likely hurt their bottom line. With regard to profit margins, tech stocks in general command a profit margin twice as high as the SPX. Specifically, FB and GOOGL enjoy margins that are 500 basis points higher than the broad tech sector (Chart II-8)! This is unsustainable and they will likely serve as easy prey for policymakers. Our view does not necessarily call for breaking up these monopolies. The US will have to weigh the economic consequences of anti-trust policy in a context of multipolarity in which China’s national tech champions are emerging to compete with American companies for global market share. Nevertheless, increased regulation is inevitable and some forced sales of crown jewel assets may take place. Moreover, the threat of a breakup will lurk in the background, creating uncertainty until key legislative and judicial battles have already been fought. That will take years. Finally, we doubt the tech sector will be left alone to “self-regulate” its incumbents and negotiate a price on consumers’ privacy. More likely, a new privacy law will loom, serving as a negative catalyst for profit growth. Uncertainty will weigh on the S&P interactive media & services relative performance. The ticker symbols to short/underweight the S&P interactive media & services index are an equally weighted basket of GOOGL and FB (they command a 98% market cap weight in the index). Theme #3: SaaS, Artificial Intelligence, Augmented Reality And Autonomous Driving Are Not Fads The third big theme that will even outlive the upcoming decade is the proliferation of software as a service (SaaS). The move to cloud computing and SaaS, the wider adoption of artificial intelligence, machine learning, autonomous driving and augmented reality are not fads, but enjoy a secular growth profile. In the grander scheme of things today’s world is surrounded by software. Millions of lines of code go even into gasoline powered automobiles, let alone electric vehicles. Autonomous driving is synonymous with software, the Internet of Things (IoT) needs software, the space race depends on software, modern manufacturing and software are closely intertwined, phone calls for quite some time have been a software solution, and the list goes on and on. This tidal effect is hard to reverse and is already embedded in workflows across industries. Opportunities to penetrate health care and financial services more deeply remain unexplored and it is difficult to envision another competing industry unseating “king software”. These secular trends are not only productivity enhancing, but will also most likely prove recession-proof. When growth is scarce investors flock to any source of growth they can come by and we are foreseeing that when the next recession arrives, investors will likely seek shelter in pure play SaaS firms. Investment Implication #6: Software Is Eating The World Chart II-9Software Is Eating The World
Software Is Eating The World
Software Is Eating The World
Buying software stocks for the long haul seems like a bulletproof investment idea. But the recent stellar performance of software stocks has moved valuations to overshoot territory. Our recommended strategy is to buy or add software stock exposure on any weakness with a 10-year investment time horizon. All of these secular trends have pushed capital outlays on software into a structural uptrend. Software related capex is not only garnering a larger slice of the tech spending budgets but also of the overall capex pie. If it were not for software capex, the contraction in non-residential investment in recent quarters would have been more severe (Chart II-9). Private sector software capex is near all-time highs as a share of total outlays. Government investment in software is also reaccelerating at the fastest pace since the tech bubble. When productivity gains are anemic, both the business and government sectors resort to software upgrades in order to boost productivity. Cyber security is another more recent source of software related demand as governments around the globe are taking such risks extremely seriously (bottom panel, Chart II-9). Given this upbeat demand backdrop and ongoing equity retirement, software stocks are primed to grow into their pricey valuations. Finally, this long-term trade will also serve as a hedge to the short/underweight position we recommend in the S&P interactive media & services index. The closest ETF ticker symbol resembling the S&P software index is IGV:US. Theme #4: Millennials Already Are The Largest Cohort And Will Dominate Spending The fourth long-term theme we anticipate to gain traction in the 2020s is the demographic rise of the Millennial generation. Much has been made of preparing for the arrival of the Millennial generation, accompanied by well-worn stereotypes of general "failure to launch" as they reach adulthood. However, "arrival" is a misnomer as this age cohort is already the largest and "failure" is simply untrue. According to the US Census Bureau, Millennials are the US’s largest living generation. Millennials (or Echo Boomers) defined as people aged 18 to 37 (born 1982 to 2000), now number more than 80mn and represent more than one quarter of the US’s population. Baby Boomers (born 1946 to 1964) number about 75mn. Stealthily becoming the largest age group in the US over the last few years, Millennials per-year-birth-rate peaked at 4.3mn in 1990. Surprisingly, the pace matched that of the post-war Baby Boom peak-per-year-birth-rate in 1957 - the per-year average over the period was higher for the Baby Boomers (Chart II-10). Chart II-10Millennials Are The Largest Cohort
Millennials Are The Largest Cohort
Millennials Are The Largest Cohort
This gap is now set to grow rapidly as the death rate of Baby Boomers accelerates. What is more, the largest one-year age cohort is only 25 years old, thus, Millennials will be the dominant generation for many years. It is unclear how these “kids” will impact the market as they become the most important consumers, borrowers and investors, but make no mistake: this is a seismic shift in economic power and it is here to stay. The Echo Boom is a big, generational demographic wave. A difficult and painful delay has not tempered its looming importance. Finally, this wave of echo-boomers is educated, relatively unburdened by debt (please see BOX in the June 11, 2018 Special Report on demystifying the student debt load as it pertains to Millennials), and as they inevitably “grow up”, form new households and have kids. They will borrow, spend, earn, but not necessarily save and invest to the same extent as the Boomers. And this will be an important long-term theme going forward. Near term, we might already be seeing signs of their arrival and firms have begun to pivot accordingly. Investment Implication #7: Buy The BCA Millennials Equity Basket Millennials will boost consumption spending in a number of different ways. The relatively unburdened Millennial cohort will be entering prime home acquisition age soon and this should underpin the long-term prospects of the US housing market and related industries. Furthermore, Millennials consume differently from their parents; social media, online shopping and smart phones are not the consumption categories of the Baby Boomers. With this in mind, we have created a basket of ten stocks that we think will be driven over the long term by the demographic rise of the Millennial. We note that these stocks are heavily weighted to the technology and consumer discretionary sectors, which is logical as Millennial consumption habits tend to be discretionary focused and technology-based. Beginning with consumer discretionary, we are highlighting AMZN, NFLX and SPOT as core holdings in our Millennials basket. AMZN’s heft dwarfs consumer discretionary indexes but it could fall in several categories; the acquisition of Whole Foods makes it a Millennials-focused consumer staples retailer and its cloud computing web services segment is a tech leader. NFLX and SPOT represent the means by which Millennials consume media, by streaming movies and music over the internet. The idea of owning physical media is rapidly becoming an anachronism. The home ownership theme noted in this report leads us to add HD and LEN to the basket. Millennials are “doers” and are set to be the dominant DIYers in the next few years, making HD a logical choice. LEN, as the nation’s largest home builder, should benefit from the Millennials coming of age into home buyers. We are also adding TSLA to our basket as a lone clean tech-oriented equity. TSLA capitalizes on the increasing shift to clean energy of Millennials (the key reason why no traditional energy companies have a spot in our basket). Chart II-11Buy BCA's Millennial Equity Basket
Buy BCA's Millennial Equity Basket
Buy BCA's Millennial Equity Basket
The technology stocks in our Millennials basket are AAPL, UBER (which replaces FB as of today) and MSFT, together representing more than 9% of the total value of the S&P 500. AAPL’s inclusion in the list is predictable as the leading domestic purveyor of devices on which Millennials consume media content. FB is a predictable holding, with more than half of all Americans being monthly active users, dominated by the Millennial cohort. It has served our basket well since inception, but today we are compelled to remove it and replace it with UBER. UBER is a Millennial favorite and the epitome of the sharing economy. In reality UBER is a logistics company and while it is losing money, it is eerily reminiscent of AMZN in its early days. Maybe UBER will dominate all means of transportation and its ease of use will propel it to a mega cap in the coming decade. Our inclusion of MSFT is based on its leadership in cloud computing, a rapidly growing industry. We expect the connectivity and mobile computing demands of Millennials will accelerate. The last stock we are adding to our basket is also the only financial services equity. Though avid consumers, Millennials have shown an aversion to cash, preferring card payment systems, including both debit and credit-based. Accordingly, we are adding the leader in both of these, V, to our Millennials basket (Chart II-11). Investors seeking long-term exposure to stocks lifted by the supremacy of the Millennial generation should own our Millennial basket (AAPL, AMZN, UBER, HD, LEN, MSFT, NFLX, SPOT, TSLA, V). We would not hesitate to add other sharing economy stocks, including Airbnb, to this basket should they become investable in the near future. Theme #5: ESG Becomes Mainstream Investors are increasingly looking at allocating assets based on environmental, social, and governance (ESG) considerations, and this mini-theme has the potential to become a big trend in the 2020s. There are a number of factors that underpin ESG investing. First, Millennials are climate conscious and given that they already are the largest cohort in the US they will not only dominate spending, but also influence election results. Moreover, via social media Millennials can sway public opinion and participate in the ESG conversation. Second, ECB President Christine Lagarde recent speech to the Economic and Monetary Affairs Committee of the European Parliament is a must read.6 If the ECB were to explicitly focus on climate change policy as part of its monetary policy operations then this is a game changer. Green investment financing including “green bonds” could become mainstream. Keep in mind that as reported in the FT, “the European Parliament has declared a climate emergency; the new European Commission (EC) has taken office on a promise of an imminent “green new deal”, and Commission president Ursula von der Leyen has vowed to accelerate emissions cuts.” Last week, the EC released “The European Green Deal” with a pretty aggressive time table. The EC president said “The green deal is Europe’s man on the moon moment” and presented 50 policies slated to get rolled by 2022 to meet revamped climate goals. The implication is that once ESG takes center stage at a number of these institutions, it will be easier to become mainstream and propagate the world over. Third, large institutional investors are starting to adopt an ESG mindset, especially pension plans. These investors with trillions of dollars at their disposal can not only disfavor fossil fuel investment, but also undertake investments in “green projects” via private and public equity markets. Banks are also moving in the “greening of finance” direction and given that they are the pipelines of the global plumbing system, swift adoption will go a long way in taking ESG mainstream. Finally, the electric vehicle (EV) proliferation is another key driver on how the ESG theme will play out in the 2020s. As a reminder, in the US 50% of all energy consumption is gasoline related linked to automobiles. While battery technology still has limitations, EV is no longer a fad as the German and Japanese automakers are starting to make inroads on TSLA. These car manufacturers do not want to be left out, especially if this shift toward EV becomes mainstream in the 2020s. The Chinese are not far behind on the EV manufacturing front, however government policy can really become a game changer. If a number of countries and/or California mandate a large share of all new vehicles sold be EV, then the investment implications will be massive. Investment Implication #8: Avoid Fossil Fuels, Gambling, Alcohol And Tobacco… While there are a few ESG related ETFs, we would rather explore this theme’s investment implications of sectors to avoid in the coming decade. We are believers that ESG criteria will continue to gain in importance in institutional investment management decisions. Accordingly, we would tend to avoid ‘sin stocks’, including gambling, tobacco and alcohol; demand for their services is unlikely to decline but investment weightings should mean that share prices will underperform. Further, we think a clean energy shift will mean energy stocks will likely continue to be long-term underperformers (Chart II-12). Final Thoughts On The US Dollar In this report, we tried to focus on the upcoming decade’s big themes that we expect to play out, and centered our recommendations on US equities/sectors. We do not want to neglect some macroeconomic variables that tend to mean revert over time. Specifically, the US dollar, interest rates and most importantly US indebtedness, will also be key drivers of investment theses in the 2020s. Currently, debt is rising faster than nominal GDP growth with the government and non-financial business debt-to-GDP profiles on an unsustainable path (second panel, Chart II-13). Chart II-12Areas To Avoid As ESG Becomes Mainstream
Areas To Avoid As ESG Becomes Mainstream
Areas To Avoid As ESG Becomes Mainstream
Chart II-13Unsustainable Debt Profiles
Unsustainable Debt Profiles
Unsustainable Debt Profiles
Granted, the saving grace has been generationally low interest rates as the debt service ratios have fallen (top panel, Chart II-13). However, if the four decade bull market in Treasurys is over, or may end definitively with the next US recession sometime in the early 2020s, then rising interest rates are the only mechanism to concentrate CEOs’ and politicians’ minds. On the dollar front, Chart II-14 highlights the ebbs and flows of the trade-weighted US dollar since it floated in the early-1970s. The DXY index has moved in six-to-ten year bull and bear markets. The most recent trough was during the depths of the Great Recession, while the (tentative?) peak was in late-2016. If history repeats, eventually the dollar will mean revert lower in the 2020s, especially given the fiscal profligacy of the current administration that may continue into 2024, assuming President Trump gets re-elected next November. Chart II-14Greenback's Historical Ebbs And Flows
Greenback's Historical Ebbs And Flows
Greenback's Historical Ebbs And Flows
The US dollar remains the reserve currency of the world today, but that exorbitant privilege is clearly fraying on the edges as the balance-of-payments dynamics are heading in the wrong direction. Over the next five years, the US Congressional Budget Office (CBO) estimates that the US budget deficit will swell to 4.8% of GDP. Assuming the current account deficit widens a bit then stabilizes (usually happens when global growth improves), this will pin the twin deficits at 8% of GDP. This assumes no recession, which would have the potential to swell the deficit even further. The US saw its twin deficits swell to almost 13% of GDP following the financial crisis, but the difference then was that in the wake of the commodity boom the dollar was cheap (and commodity currencies overvalued). The subsequent shale revolution also greatly cushioned the US trade deficit. Shale productivity remains robust and US output will continue to rise, but the low-hanging fruit has already been plucked. Chart II-15Twin Deficits Will Weigh On The US Dollar
Twin Deficits Will Weigh On The US Dollar
Twin Deficits Will Weigh On The US Dollar
For one reason or another, foreign central banks are diversifying out of dollars. If due to the changing landscape in trade, this is set to continue. If it is an excuse to shy away from the rapidly rising US twin deficits, this will continue as well. In a nutshell, there has been hardly a time in recent history when the twin deficits in the US were rising and the dollar was in a secular uptrend (Chart II-15). Another dollar-negative force is its expensiveness. By rising 35% since its trough, the USD has sapped the competitiveness of the US manufacturing sector, which is accentuating the American trade deficit outside of the commodity sector. If the ESG trend ends up hurting oil prices, the US current account will follow the widening deficit in manufactured products. Moreover, the US is lagging Europe on the green revolution. Either the US will have to import green technologies, or the US government will have to provide more subsidies to the private sector. Either way, both of these dynamics will hurt the US current account deficit further. Historically, the currency market is the main vehicle to correct such imbalances. The apex of globalization will also hurt the greenback. In a world where all the markets are integrated, borrowers in EM nations often use the reserve currency to issue liabilities at a lower cost. This boosts the demand by EM central banks for US dollar reserves to protect domestic banking systems funded in USD. Moreover, some countries like China implement pegs (both official and unofficial) to the US dollar in order to maintain their competitiveness and export their production surpluses to the US. To do so they buy US assets. If the global economy becomes more fragmented and the Sino-US relationship continues to deteriorate structurally as we expect, then these sources of demand for the dollar will recede. Overlay the widening US current account deficit, and you have the perfect recipe for a depreciating trade-weighted US dollar. Finally, the US is likely to experience more inflation than the rest of the world following the next recession. The US economy has a smaller capital stock as a share of GDP than Europe or Japan, and American demographics are much more robust. This means that the neutral rate of interest is higher in the US than in other advanced economies. As a result, the Fed will have an easier time generating inflation by cutting real rates than both the ECB and the BoJ. Higher inflation will ultimately erode the purchasing power of the dollar and prove to be a structurally negative force for the USD. Anastasios Avgeriou US Equity Strategist Matt Gertken Geopolitical Strategist Marko Papic Chief Strategist, Clocktower Group Chester Ntonifor Foreign Exchange Strategist Mathieu Savary Vice President The Bank Credit Analyst III. Indicators And Reference Charts With a breakthrough in trade talks and Fed officials changing their language to suggest that policy will remain accommodative until inflation meaningfully overshoots 2%, the S&P 500 decisively broke out. Because it eases global financial conditions and boosts the profit outlook, the recent breakdown in the dollar should fuel the equity rally. Tactically, the S&P 500 may have overshot the mark, but on a cyclical basis, stronger growth and an easy Fed will propel US and global stocks higher. Our Revealed Preference Indicator (RPI) remains cautious towards equities. The RPI combines the idea of market momentum with valuation and policy measures. However, our Willingness-to-Pay (WTP) indicator for the US and Japan continues to improve. In Europe, this indicator has finally hooked up. The WTP indicator tracks flows, and thus provides information on what investors are actually doing, as opposed to sentiment indexes that track how investors are feeling. This broad-based improvement therefore bodes well for equities. Moreover, the pickup in Europe suggests that European stocks are increasingly ripe to outperform their US counterparts. Global yields have turned higher but they remain at exceptionally stimulating levels. Moreover, money and liquidity growth remains very strong as global central banks have adopted strongly dovish slants. Additionally, a Fed that will allow inflation to overshoot before tightening policy is adding to this supportive monetary backdrop. As a result, our Monetary Indicator remains at extremely elevated levels. Furthermore, our Composite Technical Indicator is still flashing a buy signal. Finally, our BCA Composite Valuation index is suggesting that stocks are expensive, but not so much as to cancel out the supportive monetary and technical backdrop. As a result, our Speculation Indicator remains in the neutral zone. 10-year Treasurys yields are becoming slightly less expensive, however, they are no bargain. Moreover, our Composite Technical Indicator is quickly moving away from overbought territory but has yet to flash oversold conditions, indicating that yields are roughly half way through their move. The strengthening of the Commodity Index Advance/Decline line and higher natural resource prices further confirm the upside for yields. Therefore, the current setup argues for a below-benchmark duration in fixed-income portfolios. Small signs that global growth is bottoming, such as the stabilization in the global PMIs, the pick-up in the German ZEW and IFO surveys, or the acceleration in Singapore’s container throughput growth, point to a worsening outlook for the counter-cyclical US dollar. Moreover, the dollar trades at a large premium of 24% relative to its purchasing-power parity equilibrium. Additionally, our Composite Technical Indicator is quickly deteriorating after having formed a negative divergence with the Greenback’s level. Since the dollar is a momentum currency, this represents a dark omen for the USD. In fact, we continue to believe that a breakdown in the dollar will be the clearest signal that global growth is rebounding for good. EQUITIES: Chart III-1US Equity Indicators
US Equity Indicators
US Equity Indicators
Chart III-2Willingness To Pay For Risk
Willingness To Pay For Risk
Willingness To Pay For Risk
Chart III-3US Equity Sentiment Indicators
US Equity Sentiment Indicators
US Equity Sentiment Indicators
Chart III-4Revealed Preference Indicator
Revealed Preference Indicator
Revealed Preference Indicator
Chart III-5US Stock Market Valuation
US Stock Market Valuation
US Stock Market Valuation
Chart III-6US Earnings
US Earnings
US Earnings
Chart III-7Global Stock Market And Earnings: Relative Performance
Global Stock Market And Earnings: Relative Performance
Global Stock Market And Earnings: Relative Performance
Chart III-8Global Stock Market And Earnings: Relative Performance
Global Stock Market And Earnings: Relative Performance
Global Stock Market And Earnings: Relative Performance
FIXED INCOME: Chart III-9US Treasurys And Valuations
US Treasurys And Valuations
US Treasurys And Valuations
Chart III-10Yield Curve Slopes
Yield Curve Slopes
Yield Curve Slopes
Chart III-11Selected US Bond Yields
Selected US Bond Yields
Selected US Bond Yields
Chart III-1210-Year Treasury Yield Components
10-Year Treasury Yield Components
10-Year Treasury Yield Components
Chart III-13US Corporate Bonds And Health Monitor
US Corporate Bonds And Health Monitor
US Corporate Bonds And Health Monitor
Chart III-14Global Bonds: Developed Markets
Global Bonds: Developed Markets
Global Bonds: Developed Markets
Chart III-15Global Bonds: Emerging Markets
Global Bonds: Emerging Markets
Global Bonds: Emerging Markets
CURRENCIES: Chart II-16US Dollar And PPP
US Dollar And PPP
US Dollar And PPP
Chart II-17US Dollar And Indicator
US Dollar And Indicator
US Dollar And Indicator
Chart II-18US Dollar Fundamentals
US Dollar Fundamentals
US Dollar Fundamentals
Chart II-19Japanese Yen Technicals
Japanese Yen Technicals
Japanese Yen Technicals
Chart II-20Euro Technicals
Euro Technicals
Euro Technicals
Chart II-21Euro/Yen Technicals
Euro/Yen Technicals
Euro/Yen Technicals
Chart II-22Euro/Pound Technicals
Euro/Pound Technicals
Euro/Pound Technicals
COMMODITIES: Chart II-23Broad Commodity Indicators
Broad Commodity Indicators
Broad Commodity Indicators
Chart II-24Commodity Prices
Commodity Prices
Commodity Prices
Chart III-25Commodity Prices
Commodity Prices
Commodity Prices
Chart III-26Commodity Sentiment
Commodity Sentiment
Commodity Sentiment
Chart III-27Speculative Positioning
Speculative Positioning
Speculative Positioning
ECONOMY: Chart III-28US And Global Macro Backdrop
US And Global Macro Backdrop
US And Global Macro Backdrop
Chart III-29US Macro Snapshot
US Macro Snapshot
US Macro Snapshot
Chart III-30US Growth Outlook
US Growth Outlook
US Growth Outlook
Chart III-31US Cyclical Spending
US Cyclical Spending
US Cyclical Spending
Chart III-32US Labor Market
US Labor Market
US Labor Market
Chart III-33US Consumption
US Consumption
US Consumption
Chart III-34US Housing
US Housing
US Housing
Chart III-35US Debt And Deleveraging
US Debt And Deleveraging
US Debt And Deleveraging
Chart III-36US Financial Conditions
US Financial Conditions
US Financial Conditions
Chart III-37Global Economic Snapshot: Europe
Global Economic Snapshot: Europe
Global Economic Snapshot: Europe
Chart III-38Global Economic Snapshot: China
Global Economic Snapshot: China
Global Economic Snapshot: China
Mathieu Savary Vice President The Bank Credit Analyst Footnotes 1 Please see The Bank Credit Analyst "OUTLOOK 2020: Heading Into The End Game," dated November 22, 2019, available at bca.bcaresearch.com 2 Please see Geopolitical Strategy Special Report "US Election 2020: Civil War Lite," dated November 22, 2019, available at gps.bcaresearch.com 3 Please see Foreign Exchange Strategy Special Report "Riding The Wave: Momentum Strategies In Foreign Exchange Markets," dated December 8, 2017, available at fes.bcaresearch.com 4 Please see Global Asset Allocation Special Report "Safe Haven Review: A Guide To Portfolio Protection In The 2020s," dated October 29, 2019, available at gaa.bcaresearch.com. 5 Please see US Equity Strategy Special Report "Brothers In Arms," dated October 31, 2016, available at uses.bcaresearch.com 6 https://www.imf.org/en/News/Articles/2019/09/04/sp090419-Opening-Statement-by-Christine-Lagarde-to-ECON-Committee-of-European-Parliament
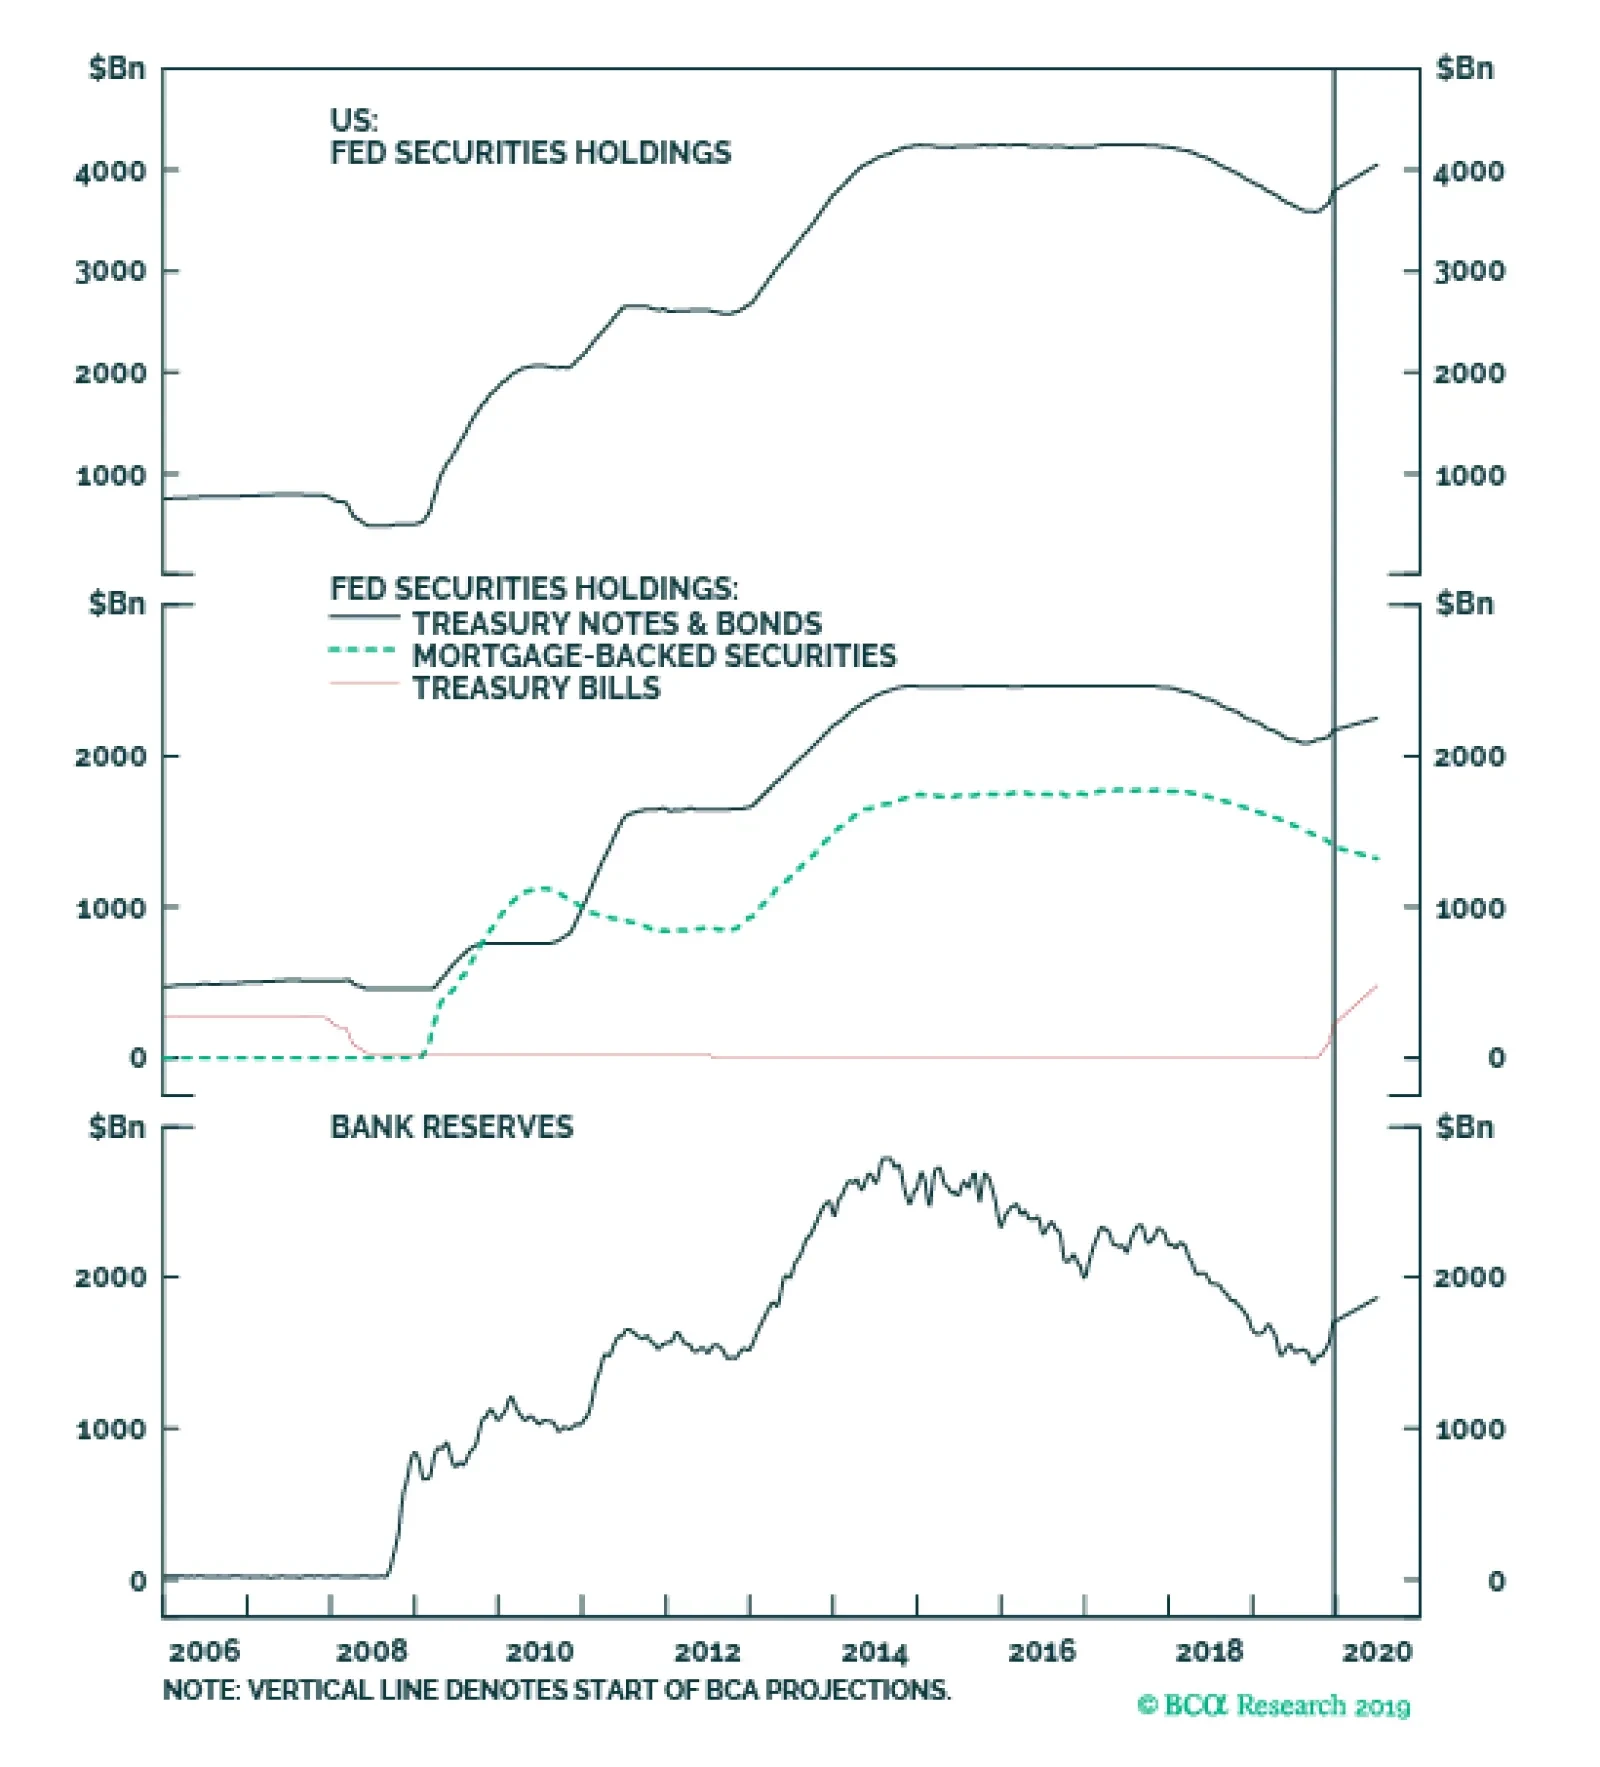
In 2020 the Fed will attack its balance sheet problems on two fronts. 1) Increase Reserve Supply First, it will continue to purchase T-bills in order to increase the supply of reserves at a pace of $60 billion per month. Second, if the Fed decides to…