Policy

An analysis on Ukraine is available below. Highlights A number of liquidity and technical reasons have led us to give benefit of the doubt to the bullish market action and chase this EM rally. We still doubt that the US-China trade truce alone is sufficient to propel a cyclical recovery in global trade and manufacturing. However, it seems the market is operating on a “buy now, ask questions later” principle. Therefore, we are initiating a long position in the EM equity index as of today. Despite the potential for higher EM share prices in absolute terms, we are still reluctant to upgrade EM versus DM stocks. The basis is that EM corporate profits will continue lagging those in DM. Feature We could be in for a replay of the 2012-2014 DM equity rally, where EM stocks rebounded in absolute terms but massively underperformed DM on a relative basis. Chart I-1EM Share Prices: In Absolute Terms And Relative To DM
EM Share Prices: In Absolute Terms And Relative To DM
EM Share Prices: In Absolute Terms And Relative To DM
EM share prices have spiked on the announcement of a trade truce between the US and China. As a result, our buy stop at 1075 on the EM MSCI Equity Index has been triggered, and we are initiating a long position in EM stocks as of today (Chart I-1, top panel). That said, we are still reluctant to upgrade EM versus DM stocks. Regardless of the direction of the market (bull, bear or sideways), EM share prices will likely underperform the global equity benchmark. As we discussed in our report, the primary risk to our view has been that EM share prices get pulled higher as a result of rallying DM markets. Nevertheless, our fundamental assessment remains that EM corporate profits will lag those in DM, heralding EM relative equity underperformance. In fact, we could be in a replay of the 2012-2014 DM equity rally where EM stocks massively underperformed (Chart I-1, bottom panel), as we elaborated in our November 28 report. In this report, we review the indicators that support a bullish stance, the ones that are inconclusive and those that are not confirming the current rally in China-plays in general and EM risk assets in particular. Bullish Liquidity And Technical Settings The following points have led us to give benefit of the doubt to recent market action and to chase this rally: The global liquidity backdrop appears to be conducive for higher share prices. Global narrow and broad money growth have accelerated (Chart I-2). That said, a caveat is in order: These money measures do not always strongly correlate with both global share prices and the global business cycle. There are numerous times when they gave a false signal or were too early or late at turning points. Chart I-2Global Narrow And Broad Money: A Useful But Not Always Reliable Indicator
Global Narrow And Broad Money: A Useful But Not Always Reliable Indicator
Global Narrow And Broad Money: A Useful But Not Always Reliable Indicator
The technical profile of EM equities is rather bullish. As shown on the top panel of Chart I-1 on page 1, EM share prices have found a support at their six-year moving average. When a market fails to break down below its long-term technical support line, odds are that a major bottom has been reached, and the path of the least resistance is up. The reason we look at these long-term (multi-year) moving averages is because they have historically worked very well for key markets like the S&P 500 and 10-year US Treasury bond yields (Chart I-3A & I-3B). Chart I-3AThe Reason Why We Use Multi-Year Moving Averages
The Reason Why We Use Multi-Year Moving Averages
The Reason Why We Use Multi-Year Moving Averages
Chart I-3BThe Reason Why We Use Multi-Year Moving Averages
The Reason Why We Use Multi-Year Moving Averages
The Reason Why We Use Multi-Year Moving Averages
As another positive development, both EM share prices in local currency terms and the EM equity total return index in US dollar terms have bounced from their three-year moving averages (Chart I-4). Chart I-4A Bullish Chart Formation For EM Equities
A Bullish Chart Formation For EM Equities
A Bullish Chart Formation For EM Equities
In addition, when a market does not drop below its previous top, this creates a bullish chart configuration (Chart I-4). This seems to be the case with EM share prices currently. Bottom Line: A number of liquidity and technical reasons have led us to give benefit of the doubt to the bullish market action and to chase this rally. Inconclusive Indicators It is rare that all types of indicators – directional market, business cycle, valuation and technical – all line up together to convey the same investment recommendation. Below we present the market indicators and signals that we have been watching to get confirmation of sustainability in the bull market in EM risk assets, commodities and global cyclical equity sectors. They are still inconclusive: The US broad trade-weighted dollar has recently sold off, but it has not broken down technically (Chart I-5). A decisive relapse below its 200-day moving average will signify that the greenback has entered a major bear market. The latter would be consistent with a sustainable and extended bull market in EM risk assets, commodities and global cyclical equity sectors. Chart I-5The US Dollar Has Fallen But Not Broken Down
The US Dollar Has Fallen But Not Broken Down
The US Dollar Has Fallen But Not Broken Down
Chart I-6Indecisive Signals From Commodities And Commodity Currencies
bca.ems_wr_2019_12_19_s1_c6
bca.ems_wr_2019_12_19_s1_c6
Even though copper prices have recently rebounded, they have not yet broken above their three-year moving average (Chart I-6, top panel). The latter can be viewed as the neckline of the head-and-shoulders pattern that has formed in recent years. The same holds true for the overall London Metals Exchange Industrial Metals Price Index, as well as our Risk-On/Safe-Haven currency ratio1 (Chart I-6, middle and bottom panels). Barring a decisive break above their three-year moving averages, the jury is still out on the durability of the rally in commodities prices and EM/China plays. Finally, global industrial share prices and US high-beta stocks have advanced to their 2018 highs, but have not yet broken out (Chart I-7). The same is true for the euro area aggregate stock index in local currency terms (Chart I-8). A decisive breakout above these levels will confirm that global equities in general and cyclical segments in particular are in an enduring bull market. Chart I-7Decisive Breakouts Here Are Needed To Confirm The EM Rally
Decisive Breakouts Here Are Needed To Confirm The EM Rally
Decisive Breakouts Here Are Needed To Confirm The EM Rally
Chart I-8European Share Prices Are At A Critical Juncture
European Share Prices Are At A Critical Juncture
European Share Prices Are At A Critical Juncture
Bottom Line: Several cyclical and high-beta segments of global financial markets are at a critical juncture. A decisive breakout from these key technical levels is required for us to uphold that EM risk assets and global cyclical plays are in a medium-term bull market. The Eye Of The Storm? There are a number of leading indicators and market signals that do not corroborate the common narrative of a sustainable improvement in global manufacturing/trade in general and China’s industrial cycle in particular: First, China’s narrow and broad money growth appear to be rolling over (Chart I-9). Notably, the money impulses lead the credit impulse, as illustrated in Chart I-10. Consequently, we expect the credit impulse – which is the main indicator currently portraying a revival in the Chinese economy as well as in the global business cycle – to roll over in early 2020. Chart I-9China: Narrow And Broad Money Growth Are Rolling Over
bca.ems_wr_2019_12_19_s1_c9
bca.ems_wr_2019_12_19_s1_c9
Chart I-10China: Money Impulses Are Coincident Or Lead Credit Impulse
bca.ems_wr_2019_12_19_s1_c10
bca.ems_wr_2019_12_19_s1_c10
This entails that the recent tentative improvements in China’s manufacturing, its imports and global trade will not be sustained going forward. Crucially, China’s narrow money (M1) growth point to the lack of a cyclical upturn in EM corporate profits in H1 2020 (Chart I-11). In short, EM listed companies’ profit growth rate stabilizing at around -10% is not a recovery. Second, government bond yields in both China and Korea are not corroborating a revival in their respective business cycles (Chart I-12). Chart I-11EM Corporate Profit Growth To Remain Negative In H1 2020
bca.ems_wr_2019_12_19_s1_c11
bca.ems_wr_2019_12_19_s1_c11
Chart I-12Asian Rates Are Not Confirming A Recovery
Asian Rates Are Not Confirming A Recovery
Asian Rates Are Not Confirming A Recovery
Chinese onshore interest rates have been a reliable compass for both its business cycle as well as EM share prices and currencies as we illustrated in Chart 15 of the November 28 report. For now, the mainland fixed-income market is not predicting an upturn in China’s industrial economy (Chart I-12, top panel). In Korea, exports account for 40% of GDP. Hence, without a considerable export recovery, there cannot be a business cycle revival in Korea. In brief, the latest relapse in local bond yields could be sending a downbeat signal for global trade (Chart I-12, bottom panel). Third, the four-month rise in the Chinese Caixin manufacturing PMI can be partially explained by front-running production and shipments of smartphones, laptops, computers and other electronics ahead of the December 15 round of US tariffs on imports from China. Right after President Trump announced these tariffs in the summer, businesses likely did not take a chance to wait and see. In fact, whether or not these tariffs would have come into effect was unknown till December 13. Manufacturers and US importers of these electronic goods initiated orders, produced and shipped these goods to the US ahead of December 15. Chart I-13Caixin And Taiwanese PMIs Benefited From Front Running
Caixin And Taiwanese PMIs Benefited From Front Running
Caixin And Taiwanese PMIs Benefited From Front Running
Given the focus on that particular round of tariffs was electronics, producers of these goods got a temporary but notable boost from such front-running. Smartphone and electronics manufacturers and their suppliers are predominantly located in Shenzhen and Taiwan. The Caixin manufacturing PMI is a survey of 500 companies, many of which are private enterprises located in Shenzhen. Not surprisingly, the Caixin manufacturing PMI index often fluctuates with Taiwan’s electronics and optical PMI (Chart I-13). In brief, there has been meaningful improvement in China’s and Taiwan’s tech manufacturing. Yet it can be attributed to front-running of production and shipments of electronic products to the US ahead of the December 15 tariff deadline as well as stockpiling of semiconductors by China. The odds are that these measures of manufacturing will slump in early 2020 as the front-running ends. Chart I-14Commodities Prices In China
Commodities Prices In China
Commodities Prices In China
Finally, several commodities prices in China, that troughed in late 2015 ahead of the bottom in global and EM/Chinese equities in early 2016, continue to drift lower or exhibit only a mild uptick. Specifically, these include prices of nickel, steel, iron ore, thermal coal, coke, polyethylene and rubber (Chart I-14). They corroborate that there has been no broad-based amelioration in the mainland’s industrial sector. Bottom Line: In China, narrow and broad money growth has rolled over, onshore interest rates are subsiding and many commodities prices are weak. All of these signify the lack of sustainable growth revival in China in the coming months. Putting It All Together EM risk assets have rallied on the consensus market narrative that the temporary truce between the US and China will lift global growth. We have written at length that China’s domestic demand – not its exports – has been the epicenter of and basis for the global slowdown over the past two years. Without Chinese domestic demand and imports, not exports, staging a material amelioration, global trade and manufacturing are unlikely to experience a cyclical upturn. In short, we doubt that the US-China trade truce is alone sufficient to propel a cyclical recovery in global trade and manufacturing. Yet, when the majority of investors perceive things the same way and act on these perceptions, asset prices can move a lot. We continue to believe that China’s industrial sector, global trade, EM ex-China domestic demand and consequently EM corporate profits will continue to disappoint in the first half of 2020. Nevertheless, we presently concede that we need to give benefit of the doubt to markets. We still doubt that the US-China trade truce alone is sufficient to propel a cyclical recovery in global trade and manufacturing. It could be that the EM equity and currency market rallies are not driven by their fundamentals – i.e., corporate profits/exports do not matter. However, it is rather possible that this rally is only stoked by the worst-kept secret in the investment industry: the search for yield. If that is the case, then there is no dichotomy between our fundamental thesis – that EM/China profits/growth will disappoint in H1 2020 – and the rally in EM markets. It seems the market is operating on a “buy now, ask questions later” principle. We had thought that the ongoing and enduring contraction in EM corporate profits (please refer to Chart I-11 on page 8) amid various structural malaises would overwhelm the impact of the global search for yield. However, it seems the market is operating on a “buy now, ask questions later” principle. Overall, we are initiating a long position in the EM equity index as of today. Provided the high uncertainty over the outlook, we are also instituting a stop point at 1050 for the MSCI EM equity index, 5% below its current level. For global equity investors, we continue recommending favoring DM over EM stocks. Finally, our country equity overweights are Korea, Thailand, Russia, central Europe, Pakistan, Vietnam and Mexico. A basket of these bourses is likely to outperform the EM equity benchmark in any market scenario in terms of EM absolute share price performance. We have been and remain neutral on Chinese, Indian, Taiwanese and Brazilian equities. As always, our list of overweight, underweight and market weight recommendations for EM equities, local and US dollar government bonds and currencies are available at the end of our report on pages 17-18 and on our website. Arthur Budaghyan Chief Emerging Markets Strategist arthurb@bcaresearch.com Ukraine: Buy Local Currency Bonds EM fixed-income investors should buy Ukraine local currency government bonds as well as overweight Ukraine sovereign credit within an EM credit portfolio. The exchange rate is the key for EM fixed-income investors. The Ukrainian hryvnia will be supported by high real interest rates, improving public debt and balance of payment dynamics, as well as abating geopolitical risks. In turn, a stable currency will keep inflation at bay. In such an environment, investors should favor local currency government bonds, as local interest rates will continue falling. Chart II-1Inflation Will Fall Further
Inflation Will Fall Further
Inflation Will Fall Further
In turn, a stable currency will keep inflation at bay (Chart II-1). In such an environment, investors should favor local currency government bonds, as local interest rates will continue falling. The primary risk of owning Ukrainian domestic bonds is a major depreciation in the hryvnia stemming from a risk-off phase in EM. However, as a periphery country, Ukraine’s financial markets might not correlate with their EM peers. Besides, these bonds offer high carry, which protects them against moderate currency depreciation. Overall, the case for buying Ukraine local currency government bonds is based on the following: First, Ukraine satisfies the two prerequisites for public debt sustainability, namely (1) it runs a robust primary fiscal surplus and/or (2) the government’s borrowing costs are below nominal GDP growth. The public debt-to-GDP ratio stands at 56% and will continue to fall so long as the above two conditions are satisfied. The primary consolidated fiscal surplus currently amounts to 1.8% of GDP (Chart II-2). The recently approved 2020 budget projects the primary surplus to be above 1% of GDP and the overall fiscal deficit to be close to 2% of GDP. Local currency interest rates are below nominal GDP growth (Chart II-3). In addition, public debt servicing is at 3.2% and 9% as a share of GDP and total government expenditures, respectively. According to the new budget, the government plans to use close to 12% of total spending for debt repayments in 2020. This will further help reduce the public debt load. Chart II-2A Healthy Fiscal Position
A Healthy Fiscal Position
A Healthy Fiscal Position
Chart II-3Interest Rates Are Below Nominal GDP Growth And Are Falling
Interest Rates Are Below Nominal GDP Growth And Are Falling
Interest Rates Are Below Nominal GDP Growth And Are Falling
Second, the central bank has more scope to cut interest rates because various measures of inflation will continue falling. Real (adjusted for inflation) interest rates are still very elevated. In particular, the prime lending rate is at 17% for companies and 35% for households, both in nominal terms. Provided core inflation is running at 6%, lending rates are extremely high in real terms. Not surprisingly, narrow and broad money growth are sluggish (Chart II-4). Commercial banks are undergoing major balance sheet deleveraging: their asset growth is in the low single digits in nominal terms, while their value is dropping relative to nominal GDP (Chart II-5). Chart II-4Money Growth Is Sluggish
Money Growth Is Sluggish
Money Growth Is Sluggish
Chart II-5Deleveraging In The Banking Sector
Deleveraging In The Banking Sector
Deleveraging In The Banking Sector
Meanwhile, tighter regulations are forcing banks to recognize bad assets and boost their capital. This has led to a sharp drop in the number of registered banks. Such a structural overhaul of the banking system is cyclically deflationary and warrants lower interest rates. Critically, these reforms are a positive for the exchange rate in the long run. Third, receding foreign funding pressures are helping the balance of payments dynamics and are supportive for the currency. Ukrainian exports have been outperforming global exports since 2017 (Chart II-6). Agricultural exports – which represent 40% of total exports – are an important source of foreign currency revenue for the country. Chart II-6Ukraine Exports Are Outperforming Global Trade
Ukraine Exports Are Outperforming Global Trade
Ukraine Exports Are Outperforming Global Trade
Chart II-7Tight Fiscal And Monetary Policies Are Good For The Current Account Balance
Tight Fiscal And Monetary Policies Are Good For The Current Account Balance
Tight Fiscal And Monetary Policies Are Good For The Current Account Balance
The current account deficit has been narrowing due to slowing domestic demand, arising from tight fiscal and monetary policies (Chart II-7). Foreign ownership of local currency government bonds is $4.6 billion and it makes only 12% of total outstanding amount. Consequently, risk of major foreign portfolio capital outflows due to a risk-off phase in global markets is low. Lastly, Ukraine’s foreign debt obligations – the sum of short-term claims, interest payment and amortization – have been declining and are presently well covered by exports. They comprise 34% of total exports. Finally, geopolitical risks will continue to subside over the coming months. Peace talks between Ukraine and Russia will continue. Importantly, two sets of constraints could force Ukraine and Russia towards resolving the conflict. Specifically: Russia is constrained by its commitment to be a reliable gas supplier to the EU. Half of its gas export capacity passes through Ukraine. European demand for Russian gas is falling and Gazprom gas revenues are decelerating. Cutting transit of gas through Ukraine could now severely jeopardize Russia’s relations with Europe. Therefore, as much as Europe is dependent on Russian gas, Russia is as dependent on European demand for its natural gas. The EU’s support for Ukraine is contingent on reliable transits of Russian gas into EU countries. As such, President Zelensky is under pressure from Europe to assure transmission of Russian gas to Europe. This has led Zelensky into opening a dialogue with Russia and motivated him to seek a new gas transit deal with Gazprom. Given President Zelensky’s high popularity at home, he has political capital to pursue a rapprochement with Russia and attempt to find a resolution to end the conflict in the Donbass. All of these developments have been, and will continue to be, positively perceived by international investors, sustaining the recent stampede into Ukraine’s fixed-income markets. Investment Recommendation We recommend investors purchase 5-year local currency government bonds currently yielding 12%. EM fixed-income investors should also consider overweighting US dollar sovereign bonds in an EM credit portfolio on the back of improving public debt and balance of payments dynamics. Andrija Vesic Research Analyst andrijav@bcaresearch.com Footnotes 1 The Risk-On/Safe-Haven currency ratio is the average of high-beta commodity currencies such as the CAD, AUD, NZD, BRL, CLP and ZAR total return (including carry) indices relative to the average of JPY and CHF total returns (including carry). This ratio is dollar-agnostic. Equities Recommendations Currencies, Credit And Fixed-Income Recommendations
Highlights Mega-theme 1: A hypersensitivity to higher interest rates. Overweight equities versus bonds until 10-year bond yields rise 75 bps. At which point, switch into bonds. Mega-theme 2: Europe conquers its disintegration forces. Overweight European currencies, and underweight core European bonds within a fixed income portfolio. Mega-theme 3: Non-China exposed investments outperform structurally. Overweight non-China plays, underweight materials and resources, and underweight commodity currencies. Mega-theme 4: The rise of blockchain and alternative energy. Overweight alternative energy, underweight oil and gas, and underweight financials. Feature Feature ChartUnderweight Materials And Resources In The 2020s
Underweight Materials And Resources In The 2020s
Underweight Materials And Resources In The 2020s
“Study the past if you would divine the future” – Confucius To paraphrase Confucius, we must study the mega-themes of the 2010s if we are to identify the mega-themes of the 2020s. From an economic, financial, and political perspective, the mega-themes of the past decade were: ‘universal QE’; Europe’s threatened disintegration; China becoming the world’s ‘stimulator of last resort’; and the decentralization of information, which threatened the established hierarchies in politics and society. These mega-themes of the 2010s point the way to four mega-themes for the 2020s: A hypersensitivity to higher interest rates. Europe conquers its disintegration forces. Non-China exposed investments outperform structurally. The rise of blockchain and alternative energy. Mega-Theme 1: A Hypersensitivity To Higher Interest Rates The 2010s was the decade of ‘universal QE’. One after another, the world’s major central banks bought trillions of dollars of government bonds (Chart I-2). Yet for all its apparent mystique, QE is nothing more than a signalling mechanism – signalling that central banks intend to keep policy interest rates depressed for a long time. Thereby, QE depresses long-term bond yields – which themselves are nothing more than the expected path of policy interest rates. Chart I-2The 2010s Was The Decade Of 'Universal QE'
The 2010s Was The Decade Of 'Universal QE'
The 2010s Was The Decade Of 'Universal QE'
Something else happens. Close to the lower bound of interest rates, bonds become riskier investments. As holders of Swiss bonds discovered in 2019, low-yielding bonds become a ‘lose-lose’ proposition: prices can no longer rise much, but they can fall a lot. The upshot is that all long-duration assets become risky, and the much higher return required on formerly riskier assets – such as equities – collapses to the feeble return offered on equally-risky bonds. 'Universal QE' has boosted the valuation of all risky assets. Ten years ago, when the global 10-year bond yielded 3.5 percent, equities offered a prospective 10-year return of 9 percent (per annum). Today, when the bond is yielding around 1.5 percent, equities are offering a paltry 3 percent (Chart I-3 and Chart I-4). Meaning that while the present value of the 10-year bond is up around 20 percent, the present value of equities has surged by 60 percent.1 Chart I-3Equities Are Offering A Paltry 3 Percent Return
Equities Are Offering A Paltry 3 Percent Return
Equities Are Offering A Paltry 3 Percent Return
Chart I-4The Return Offered By Equities Has Collapsed To The Feeble Return Offered By Bonds
The Return Offered By Equities Has Collapsed To The Feeble Return Offered By Bonds
The Return Offered By Equities Has Collapsed To The Feeble Return Offered By Bonds
This exponential dynamic has applied to all risky assets in the 2010s. Most notably, real estate prices have sky-rocketed: Shenzhen 325 percent; Beijing 285 percent; Berlin 125 percent; Bangkok 120 percent; San Francisco 90 percent; Los Angeles 85 percent; Sydney 75 percent; and so on. From 2010 to 2020, the value of global real estate surged from an estimated $160 trillion to $300 trillion.2 The market value of equities also doubled from $35 trillion to $70 trillion.3 But global GDP grew by less than a third from $66 trillion to $85 trillion.3 The upshot is that in 2010 the value of real estate plus equities stood at 2.9 times GDP, whereas in 2020 it stands at 4.5 times GDP. Now add in the aforementioned exponentiality of risk-asset valuations at low bond yields. In 2010, a 1 percent rise in yields required a 10 percent decline in present values, whereas in 2020 it might require a 30 percent decline. In 2010, this meant a decline equivalent to 29 percent of global GDP, but in 2020 it means a decline equivalent to a staggering 135 percent of global GDP.4 So mega-theme 1 for the early 2020s is that any monetary policy tightening – in response to, say, wage inflation fears – will unleash a massive deflationary impulse into the economy from falling stock and real estate prices. This deflationary sledgehammer will annihilate the inflationary peanut, and almost certainly trigger the next major recession. But the good news is that it is unlikely to be a 2020 story, as all the major central banks are in ‘wait-and-see’ mode. Structural recommendation: Overweight equities versus bonds until 10-year bond yields rise 75 bps. At which point, switch into bonds. Mega-Theme 2: Europe Conquers Its Disintegration Forces In sub-atomic physics, a nucleus disintegrates when the electrostatic forces pulling it apart becomes stronger than the nuclear forces holding it together. Using the nucleus as a metaphor for Europe, two of the forces pulling it apart have weakened, while one of the forces holding it together has strengthened. We now know that Europe’s biggest rebel – the UK – is leaving the European Union in 2020. In the sub-atomic metaphor, the UK has become a free radical which will try and attach itself to the largest attractive body it can find. But in losing its most wayward member the European nucleus has, by definition, become more cohesive. A second destructive force has been the economic divergences between the ‘core’ and ‘periphery’ European member states. But over the past decade, these divergences have narrowed substantially. Relative to Germany, unit labour costs have declined by 25 percent in Spain, and 15 percent in Italy. More convergence is needed, but the economic forces pulling the European nucleus apart are much weaker in 2020 than they were in 2010 (Chart I-5). Chart I-5The Economic Divergence Between Europe's Core And Periphery Has Narrowed
The Economic Divergence Between Europe's Core And Periphery Has Narrowed
The Economic Divergence Between Europe's Core And Periphery Has Narrowed
Meanwhile, a force holding the European nucleus together has strengthened. In 2010, the Target2 banking imbalance stood at €0.3 trillion; in 2020, it stands close to €1.5 trillion. In simple terms, this means Germany’s exposure to ‘Italian euro’ assets has surged via the ECB’s massive purchases of Italian BTPs. At the same time, Italian investors have parked their cash in German banks, meaning they are owed ‘German euros’ (Chart I-6). Chart I-6Europe’s Target2 Banking Imbalance Stands Close To €1.5 Trillion
2020s Key Views: Four Mega-Themes For The 2020s
2020s Key Views: Four Mega-Themes For The 2020s
With such a massive Target2 imbalance, the biggest casualty of the euro’s disintegration would be Germany, whose 2008 recession would look like a stroll in the park. Giving Germany a huge incentive to become more conciliatory to its partners, for example on the use of fiscal stimulus. The best way to play mega-theme 2 is through the currency and bond markets. European equity markets are plays on their dominant sectors, and as we are about to see, many of the sectors over-weighted in Europe face structural headwinds. Structural recommendation: Overweight European currencies, and underweight core European bonds within a fixed income portfolio. Mega-Theme 3: Non-China Exposed Investments Outperform Structurally The 2010s was the decade when China became the global ‘stimulator of last resort’. Prior to the 2010s, the credit impulse in China was inconsequential compared to the credit impulses in the US and Europe. But in the 2010s the tables turned. The credit impulses in the US and Europe became inconsequential, as the amplitude of China’s waves of stimulus swamped all others (Chart I-7). Chart I-7In The 2010s, China Became The Global 'Stimulator Of Last Resort'
In The 2010s, China Became The Global 'Stimulator Of Last Resort'
In The 2010s, China Became The Global 'Stimulator Of Last Resort'
China became the global stimulator of last resort because in 2010 its indebtedness was significantly less than in other major economies. But today, China’s indebtedness has overtaken the others, and is levelling off at a point that has proved to be a reliable upper bound (Chart I-8). Chart I-8China's Indebtedness Is Reaching Its Upper Bound
China's Indebtedness Is Reaching Its Upper Bound
China's Indebtedness Is Reaching Its Upper Bound
An upper bound to indebtedness exists because further debt creates mal-investments whose returns are lower than the cost of the debt. And as indebtedness approaches the upper bound, each wave of stimulus loses potency compared to the preceding wave. For example, in 2011 China’s nominal GDP growth accelerated to 20 percent, but in 2017 it accelerated to 10 percent. In the financial markets, China’s waves of stimulus enabled short bursts of countertrend outperformance within the structural bear market in materials and resources – sectors which feature large in European markets. However, as Chinese stimulus loses its potency in the 2020, the structural bear markets in China-exposed investments will re-establish (Chart I-1). Structural recommendation: Overweight non-China plays, underweight materials and resources, and underweight commodity currencies. Mega Theme 4: The Rise Of Blockchain And Alternative Energy Historian Niall Ferguson describes history as a perpetual oscillation between periods dominated by centralized hierarchies and periods dominated by decentralized networks. And quite often, he says, the switch is enabled by a revolutionary new technology. For example, the advent of the printing press in the mid-15th century catalysed the Protestant Reformation and turbocharged the Renaissance by unleashing a decentralization of knowledge, information, and news. Sound familiar? In the early-21st century the internet has similarly decentralized the production and consumption of knowledge, information, and news. And the new networked age has threatened the established hierarchies in politics and society, fuelled populism, and disrupted many sectors in the economy. Yet Ferguson points out that it is futile (as well as Luddite) to resist such shifts from hierarchical structures towards decentralized networks. In the 2020s the decentralization baton will pass from the internet to the blockchain. Just as the internet decentralizes information, the blockchain decentralizes intermediation and trust functions. Hence, the blockchain will be maximally disruptive to any economic sector whose raison d’être is intermediation and trust – most notably finance and law. The blockchain will be maximally disruptive to any economic sector whose raison d’être is intermediation and trust – most notably finance and law. By the end of the decade, you will no longer need a bank to intermediate your excess savings to a borrower. And you will no longer need a lawyer to oversee a change of ownership. The blockchain will do these for you just as securely and much more cost effectively. One consequence is that the nature of the world’s energy requirements will change. The blockchain is very energy intensive, but unlike the internal combustion engine, the energy does not have to be portable. Hence, there will be a structural shift towards energy in the form of ‘moving electrons’ and away from energy in the form of the ‘chemical bonds’ in fossil fuels. This will be a boon for the alternative energy sector at the expense of oil and gas (Chart I-9). Chart I-9Underweight Oil And Gas In The 2020s
Underweight Oil And Gas In The 2020s
Underweight Oil And Gas In The 2020s
We will cover this mega-theme in more detail in a Special Report next year. Structural recommendation: Overweight alternative energy, underweight oil and gas, underweight financials. And with that, it’s time to sign off for this year and for this decade. I do hope that you have found the past decade’s reports insightful, sometimes provocative, but always enjoyable. We promise to continue in the same vein in the 2020s. It just remains for me and the team to wish you a happy new year and a happy new decade! Fractal Trading System* The Conservatives won a surprise landslide victory in the UK election last week, but fractal structures suggest that some of the market euphoria is now overdone. Specifically, the 30 percent rally in UK homebuilders through the last 65 days is vulnerable to a short-term countertrend move. Accordingly, this week’s recommended trade is short UK homebuilders / long UK oil and gas. Set the profit target at 9 percent with a symmetrical stop-loss. Chart I-10UK: Homebuilders Vs. Oil and Gas
UK: Homebuilders Vs. Oil and Gas
UK: Homebuilders Vs. Oil and Gas
In other trades, short MSCI AC World versus the global 10-year bond was closed at its 2.5 percent stop-loss, leaving three trades in comfortable profit, one neutral, and one in loss. When the fractal dimension approaches the lower limit after an investment has been in an established trend it is a potential trigger for a liquidity-triggered trend reversal. Therefore, open a countertrend position. The profit target is a one-third reversal of the preceding 13-week move. Apply a symmetrical stop-loss. Close the position at the profit target or stop-loss. Otherwise close the position after 13 weeks. Use the position size multiple to control risk. The position size will be smaller for more risky positions. * For more details please see the European Investment Strategy Special Report “Fractals, Liquidity & A Trading Model,” dated December 11, 2014, available at eis.bcaresearch.com. Dhaval Joshi Chief European Investment Strategist dhaval@bcaresearch.com Footnotes 1 In simple terms, if the 10-year yield declines by 2 percent, a 2 percent a year lower return for 10 years requires the present value to rise by 2 percent times 10, which equals 20 percent. In the case of equities, the equivalent calculation is 6 percent times 10, which equals 60 percent. 2 Source: Savills 3 Source: Thomson Reuters 4 2.9 times 10 percent equals 29 percent, 4.5 times 30 percent equals 135 percent. Fractal Trading System
2020s Key Views: Four Mega-Themes For The 2020s
2020s Key Views: Four Mega-Themes For The 2020s
2020s Key Views: Four Mega-Themes For The 2020s
2020s Key Views: Four Mega-Themes For The 2020s
Cyclical Recommendations Structural Recommendations
2020s Key Views: Four Mega-Themes For The 2020s
2020s Key Views: Four Mega-Themes For The 2020s
2020s Key Views: Four Mega-Themes For The 2020s
2020s Key Views: Four Mega-Themes For The 2020s
2020s Key Views: Four Mega-Themes For The 2020s
2020s Key Views: Four Mega-Themes For The 2020s
2020s Key Views: Four Mega-Themes For The 2020s
2020s Key Views: Four Mega-Themes For The 2020s
Trades Closed Trades Asset Performance Currency & Bond Equity Sector Country Equity
Highlights OPEC 2.0 production discipline and the capital markets’ parsimony in re funding US shale-oil producers will restrain oil supply growth. Monetary and fiscal stimulus will revive EM demand. These fundamentals will push inventories lower, further backwardating forward curves. Base metals demand will pick up as EM income growth revives. Demand also will get a boost from the ceasefire in the Sino-US trade war. Gold will remain range-bound for most of next year: A weaker USD and rising inflation expectations are bullish, but rising bond yields and reduced trade tensions will be headwinds. Grain markets will drift, although dry conditions in Argentina and the trade-war ceasefire could provide short-term price support, along with a weaker USD. Risk to our view: Continued elevated global policy uncertainty would support a stronger USD and stymie central bank efforts to revive global growth in 2020. Feature Dear Client, We present our key views for 2020 in this issue of Commodity & Energy Strategy. This will be our last publication of 2019, and we would like to take the opportunity to thank you for your on-going interest in the commodity markets and in our publication. It has been our privilege to serve you. We wish you and your loved ones all the best of this beautiful Christmas season and a prosperous New Year in 2020! Robert Ryan Chief Commodity & Energy Strategist Going into 2020, policy uncertainty again will be a key driver of commodity demand, the Sino-US trade-war ceasefire and UK election results notwithstanding.1 As uncertainty has increased, demand for safe havens like the USD and gold have increased. The principal impact of this uncertainty shows up in FX markets. As uncertainty has increased, demand for safe havens like the USD and gold has increased. Indeed, the Fed’s Broad Trade-Weighted USD index for goods (TWIBG) has become highly correlated with the Global Economic Policy Uncertainty index (GEPU). The three-year rolling correlation between these indexes reached a record high in November 2019 (Chart of the Week).2 Individually, the record for the TWIBG was posted in September 2019, while the GEPU record was hit in August 2019. Chart of the WeekGlobal Economic Policy Uncertainty Highly Correlated With USD
2020 Key Views: Policy Uncertainty Continues To Drive Commodity Markets
2020 Key Views: Policy Uncertainty Continues To Drive Commodity Markets
A strong USD affects commodity demand directly, because it slows income growth in EM economies – the engine-house of commodity demand. A stronger USD raises the local-currency cost of consuming commodities – an important driver of EM demand – and reduces the local-currency cost of producing commodities. So, at the margin, demand is pressured lower and supply growth is incentivized – together, these effects combine to push prices lower. Economic policy uncertainty likely will diminish in early 2020, following the Sino-US trade-war ceasefire, the decisive UK election results and continued central-bank signaling – particularly from the Fed – that rates policy will remain accommodative for the foreseeable future. That said, the ceasefire does not mark the end of the Sino-US trade war, and many issues – ongoing US-China tensions, US election uncertainty, global populism and nationalism, rising geopolitical tensions in the Persian Gulf, ad hoc monetary policy globally – still are to be resolved. Terra Incognita The GEPU index does not measure uncertainty per se, as uncertainty per se cannot be measured.3 The index picks up word usage connected with the word “uncertainty.” So, it is more the perception of uncertainty that is being reported by Economic Policy Uncertainty in its data. Nonetheless, this is a good way to measure such sentiment, as research from the St. Louis Fed found: “Increases in the economic uncertainty index tend to be associated with declines (or slower growth) in real GDP and in real business fixed investment.” In past three years, increased policy uncertainty also has been fueling demand for safe havens, chiefly the USD and gold. This is a highly unusual coincidence – i.e., a rising USD accompanied by a rising gold price. Typically, a weaker USD puts a bid under gold prices. Indeed, this relationship is one of the primary drivers of our gold model, which suggests the effect of the heightened policy uncertainty dominates the USD impact on gold prices in the current environment (Chart 2). Chart 2Gold Typically Rallies When the USD Weakens
Gold Typically Rallies When the USD Weakens
Gold Typically Rallies When the USD Weakens
The flip-side of the deleterious effects of higher economic policy uncertainty is its resolution: Growing cash balances and a higher capacity to lever balance sheets of households, firms and investor accounts means there is a lot of dry powder available to recharge growth in the real and financial economies globally.4 Chart 3BCA's Grwowth Gauges Indicate Global Economy Rebounding
BCA's Grwowth Gauges Indicate Global Economy Rebounding
BCA's Grwowth Gauges Indicate Global Economy Rebounding
Our commodity-driven economic activity gauges are picking up growth impulses, most likely in response to the global monetary stimulus that has been deployed this year (Chart 3). In addition, systemically important central banks have given no indication they are going to be reversing this stimulus. A meaningful reduction in uncertainty could turbo-charge global growth prospects. Below, we provide our key views for each of the commodity complexes we cover. Oil Outlook Energy: Overweight. The oil market is poised to move higher on the back of OPEC 2.0’s deepening of production cuts to 1.7mm b/d, mostly because of actions by the Kingdom of Saudi Arabia (KSA) to cut output deeper, to a total of close to 900k b/d vs. its October 2018 production levels.5 Combined with the loss of ~ 1.9mm b/d of production in Iran and Venezuela due to US sanctions, the supply side can be expected to tighten next year (Chart 4). The Vienna meeting – which ended December 6, 2019 – demonstrated commitment to OPEC 2.0’s production-restraint strategy, and we expect member states will deliver. At least they will reduce the incidence of free riding at KSA’s expense – there were subtle hints from the Saudis they will not tolerate such behavior. KSA’s threats in this regard are credible, given its follow-through in 1986 when they surged production and briefly drove WTI prices below $10/bbl to send a message to free riders in the OPEC cartel. The Saudis acted similarly during the 2014 – 2016 market share war. US shale-oil production growth will slow next year to 800k b/d y/y, vs. the 1.35mm b/d we expect for this year. US lower 48 crude production will increase to 10.7mm b/d in 2020, taking total US production to 13.1mm b/d, a ~ 850k b/d increase y/y. On the demand side, we lowered our expectation for 2019 growth to 1.0mm b/d, given the continued downgrades of historical consumption estimates this year from the EIA, IEA and OPEC. Nonetheless, we continue to expect 2020 growth of 1.4mm b/d, on the back of continued easing of global financial conditions, led by central-bank accommodation. Given our view, we remain long oil exposures in several ways. First, we remain long WTI futures outright going into 2020; this position is up 30% from January 3, 2019 when it was initiated. Second, we recommended getting long 2H20 vs. short 2H21 Brent futures, expecting crude oil forward curves to backwardate further as tighter supply and stronger demand force refiners to draw inventories harder next year (Chart 5). Chart 4Markets Will Tighten In 2020
Markets Will Tighten In 2020
Markets Will Tighten In 2020
Chart 5Oil Inventories Will Draw Harder In 2020
Oil Inventories Will Draw Harder In 2020
Oil Inventories Will Draw Harder In 2020
We expect Brent crude oil to average $67/bbl next year, given the fundamentals outlined above. We also expect a weaker dollar to be supportive of demand ex-US. WTI will trade at a $4/bbl discount to Brent next year, based on our modeling (Chart 6). Chart 6Brent, WTI Will Trade Higher
Brent, WTI Will Trade Higher
Brent, WTI Will Trade Higher
We remain overweight energy, crude oil in particular, given our expectation markets will tighten on the supply side and demand growth, particularly in EM economies, will revive. Bottom Line: We remain overweight energy, crude oil in particular, given our expectation markets will tighten on the supply side and demand growth, particularly in EM economies, will revive. This expectation will be challenged by continued economic policy uncertainty. On the flip side, however, a meaningful resolution to this uncertainty could turbo-charge growth as real economic activity picks up and the USD weakens. Base Metals Outlook Base Metals: Neutral. We remain strategically neutral base metals going into 2020, but tactically bullish, carrying a long LMEX and iron-ore spread position into the new year.6 The behavior of base metals prices – used by economists as proxies for EM growth – is indicating industrial demand is picking up (Chart 7). This aligns well with our proprietary indicators of commodity demand and global industrial activity (Chart 8). Base metals prices are more sensitive to changes in global growth than other commodities. For this reason, we use these prices to confirm the signals coming from the proprietary models we use to gauge EM growth. Chart 7Base Metals Prices Signaling EM Growth Revival
Base Metals Prices Signaling EM Growth Revival
Base Metals Prices Signaling EM Growth Revival
The so-called phase-one agreement to reduce tariffs in the Sino-US trade war will support global demand at the margin for base metals. This is a ceasefire in the trade war not a resolution, so we are not expecting a surge in demand. Chart 8BCA Proprietary Indicators Also Signaling Growth Revival
BCA Proprietary Indicators Also Signaling Growth Revival
BCA Proprietary Indicators Also Signaling Growth Revival
That said, base metals – aluminum and copper, in particular – have a tailwind in the form of global monetary accommodation by central banks. This was undertaken to reverse the negative effect on global financial conditions brought about by the Fed’s rates normalization policy last year and China’s 2017-18 deleveraging campaign. In addition, our China strategists expect modest fiscal and monetary stimulus from Beijing, which also will be supportive of demand.7 Aluminium and copper comprise 75% of the LMEX index. These are primary industrial markets, in which China accounts for ~ 50% of global demand, and EM ex-China demand remains stout. Even with a trade war raging for most of 2019, the supply and demand of aluminum and copper – the largest components of the LMEX index – was diverging: Consumption outpaced production – a multi-year trend – which forced inventories to draw hard (Charts 9A and 9B). Chart 9AGlobal Aluminum Markets Getting Tighter …
Global Aluminum Markets Getting Tighter ...
Global Aluminum Markets Getting Tighter ...
Chart 9B… As Are Copper Markets
... As Are Copper Markets
... As Are Copper Markets
Bottom Line: Inventories in industrial-metals markets have been drawing hard for years – particularly in aluminum – as metals' demand remained above supply. Given this, we are long the LMEX index: Even a marginal growth pick-up could rally prices. Precious Metals Outlook Precious Metals: Neutral. Going into 2020, gold’s outlook could be volatile – especially in 1H20 – as the metal’s key drivers will send conflicting signals (Table 1). Table 1Fundamental And Technical Gold-Price Drivers
2020 Key Views: Policy Uncertainty Continues To Drive Commodity Markets
2020 Key Views: Policy Uncertainty Continues To Drive Commodity Markets
Gold prices are holding up above $1,450/oz. Our latest fair-value estimate indicates gold will hover around $1,475/Oz over the short-term (Chart 10). We break next year’s gold forecast into two parts: Phase 1: Growth revival and uncertainty respite. These two factors are closely intertwined; the magnitude of global growth’s rebound is conditional on a reduction of global economic policy uncertainty. We expect this relief will come from a ceasefire in the US-China trade war. Combined, accelerating economic activity – mainly driven by EM economies – and falling uncertainty will push the US dollar lower.8 For gold prices, this phase will be characterized by two contrasting forces: A falling USD (bullish gold) vs. lower safe-haven demand and rising US interest rates (bearish gold). US rates will increase early next year as global uncertainty is reduced and bond markets price-out Fed rates cuts. The current unusually high correlation between gold and US rates implies gold will face selling pressures during this period (Chart 11). Nonetheless, we expect the Fed will stay on hold and not start raising rates next year, which will cap price risks to gold. Chart 10High USD Correlation Throws Off Fair-Value Model Gold Prices Will Rise 4Q20
High USD Correlation Throws Off Fair-Value Model Gold Prices Will Rise 4Q20
High USD Correlation Throws Off Fair-Value Model Gold Prices Will Rise 4Q20
Chart 11US Rates Could Hurt Gold Prices In 1H20
US Rates Could Hurt Gold Prices In 1H20
US Rates Could Hurt Gold Prices In 1H20
Phase 2: EM wealth effect and inflation rebound. As income growth accelerates, EM households will slowly accumulate jewelry, coins, and bars – of which China and India are the largest consumers. Demand pressure from these consumers will manifest itself in 2H20, adding to buoyant central-banks purchases of gold. The upside in bond yields will be limited by major central banks’ dovish stance until inflation is well-established above target. Closely monitoring the evolution of inflation will become increasingly important in 2020, given inflation pressures are building in the US and globally (Chart 12). A lower USD – supporting stronger commodity demand – will magnify global inflation trends (Chart 13). There is a very real risk inflation shoots up in 4Q20, keeping real rates low. This differs from our BCA House view, which does not see inflation pressures building until 2021. Chart 12Inflationary Pressures Are Building Up In The US And Globally
Inflationary Pressures Are Building Up In The US And Globally
Inflationary Pressures Are Building Up In The US And Globally
Political uncertainty likely will return ahead of the 2020 US election. A resurgence in popular support for one of the progressive Democratic candidates – Elizabeth Warren or Bernie Sanders – could disrupt US stock markets. Gold would advance in such an environment. Chart 13No Inflation Without A Weaker USD
No Inflation Without A Weaker USD
No Inflation Without A Weaker USD
Progressive populists would lead to domestic policy uncertainty and larger budget deficits, yet would not remove the threat of trade protectionism. We expect the Fed will stay on hold and not start raising rates next year, which will cap price risks to gold. Bottom Line: Gold prices will move sideways in 1H20 and will drift higher in 4Q20 supported by depressed real rates, a lower dollar, and US election uncertainty. Silver Market Chart 14Silver Prices Will Move Higher With Gold Prices
Silver Prices Will Move Higher With Gold Prices
Silver Prices Will Move Higher With Gold Prices
Silver prices have traded closely with gold since the Global Financial Crisis (GFC), moreso than with industrial metals (Chart 14). Prior to the GFC, silver traded like a base metal, owing to the high growth rates in EM economies undergoing rapid industrialization. Post-GFC, the evolution of silver’s price more closely tracked gold prices, following the massive injections of money and credit by central banks globally. Thus, we expect it will continue to follow the evolution of gold prices outlined above. Nonetheless, industrial applications still represent ~ 50% of silver’s physical demand and its supply-demand balance is estimated to have been tight this year. Silver likely will outperform gold next year as global growth and industrial activity rebound. PGM Markets The palladium market will remain tight in 2020. According to Johnson Matthey, the 10-year-long supply deficit is expected to widen massively this year, when all’s said and done. Prices surpassed $1,900/oz in December, forcing inventory liquidation (Chart 15). We believe the platinum-to-palladium ratio is at a level that would incentivize substitution in the pollution-control technology in gasoline-powered engines, and supports higher platinum content in diesel catalyzers (Chart 16).9 Nonetheless, swapping palladium for platinum is complex and requires a redesign of the production process. A lot will depend on how much the added cost of the more expensive palladium affects new-car buyers’ demand.10 To date, there are no signs car makers have already – or are willing to – initiate this process on a significant scale. Chart 15Palladium Inventories Are Depleted
Palladium Inventories Are Depleted
Palladium Inventories Are Depleted
A few factors need to align to incentivize substitution of palladium for platinum. The price ratio between the two metals should reach extreme levels; the price divergence should be expected to last for a prolonged period of time, and concerns over supply security of platinum should be low. Chart 16Relative Inventory levels Drive The Palladium To Platinum Price Ratio
Relative Inventory levels Drive The Palladium To Platinum Price Ratio
Relative Inventory levels Drive The Palladium To Platinum Price Ratio
In today’s context, this last condition could slow substitution. South African platinum supply – which represents close to 73% of the world primary supply – is projected to fall by close to 3% next year. Automakers need stable platinum supplies as they increase their demand for the metal and with persistent power-supply issues in South Africa – exacerbated by recent flooding – this condition will be hard to meet. No market has been harder hit by the Sino-US trade war than grains and ags generally. Thus, palladium holds an advantage over platinum on that front. Its supply sources are more diversified, and with 15% comes from stable North American countries and 40% comes from Russia. We believe substitution will commence, but this is a gradual process and will only slowly affect the metals’ price ratio.11 For 2020, we expect palladium prices to continue increasing due to stricter pollution regulation in China, India, and Europe.12 Ag Outlook Chart 17Sino-US Trade War, USD Hammer Grain Prices
Sino-US Trade War, USD Hammer Grain Prices
Sino-US Trade War, USD Hammer Grain Prices
Ags/Softs: Underweight. The final form of the ceasefire in the Sino-US trade war – i.e., the “phase one” deal between China and the US to roll back tariffs – has yet to show itself. Last Friday, US Trade Representative Robert Lighthizer stated China has agreed to buy $32 billion – over the next two years – of US ag products as part of a “phase one” deal. This news moved corn, wheat and beans prices up 6.3%, 3.2%, and 3.4% respectively as of Tuesday’s close. Another positive news for US farmers was an announcement from the USDA that the final $3.6 billion of the $14.5 billion budgeted for farm subsidies this year to offset the trade war impact on US farmers most likely would be made in the near future by the Trump administration.13 No market has been harder hit by the Sino-US trade war than grains and ags generally. Severe weather across much of the US Midwest should have produced a rally, as offshore demand competed for available supply, which likely would have been lower at the margin last year absent a trade war. Instead, corn, wheat and beans are going into 2020 pretty much at the same price levels they went into 2019. In addition to the deleterious effect of the US-China trade war, ag markets have been particularly hard hit by the strong USD, which makes exports from the US expensive relative to alternative suppliers – e.g., Argentina and Brazil, which are posing serious challenges to US farmers (Chart 17). Global inventories are, nonetheless, being whittled away, which is good news for farmers generally (Chart 18). And, this likely will continue in 2020, given the physical deficits expected this year (Chart 19). Chart 18GLOBAL GRAIN STOCKS BEING WHITTLED DOWN ...
GLOBAL GRAIN STOCKS BEING WHITTLED DOWN ...
GLOBAL GRAIN STOCKS BEING WHITTLED DOWN ...
Chart 19... Physical Deficits Will Whittle Stocks Further Next Year
... Physical Deficits Will Whittle Stocks Further Next Year
... Physical Deficits Will Whittle Stocks Further Next Year
Markets are still awaiting final details of the ceasefire in the Sino-US trade war. The deal is expected to be signed in the first week of January. 2020 could be the year the global ag markets come more into balance, with stocks-to-use levels falling and normal trade resuming. We are not inclined to take a view on this possibility and are therefore remaining underweight the ag complex. Robert P. Ryan Chief Commodity & Energy Strategist rryan@bcaresearch.com Hugo Bélanger Senior Analyst Commodity & Energy Strategy HugoB@bcaresearch.com Footnotes 1 Our outlook last year was entitled 2019 Key Views: Policy-Induced Volatility Will Drive Markets. It was published December 13, 2018, and is available at ces.bcaresearch.com. This year’s outlook again reflects our House view, which was published in the Bank Credit Analyst on November 28, 2019, entitled OUTLOOK 2020: Heading Into The End Game. It was sent to all clients last month and is available at bca.bcaresearch.com. 2 Uncertainty is measured using the Baker-Bloom-Davis Global Economic Policy Uncertainty (GEPU) index. GEPU is a monthly GDP-weighted index of newspaper headlines containing a list of words related to three categories – “economy,” “policy” and “uncertainty.” Newspapers from 20 countries representing almost 80% of global GDP (on an exchange rates-weighted basis) are scoured monthly to create the index. Please see Economic Policy Uncertainty for additional information. We use the Fed's USD broad trade-weighted index for goods (TWIBG) reported by the St. Louis Fed to track the USD. Please see the St. Louis Fed’s FRED website at Trade Weighted U.S. Dollar Index: Broad, Goods. 3In a June 2011 interview with the Minneapolis Fed, Ricardo Caballero, a professor of economics at MIT, provided a succinct description of risk and uncertainty, paraphrasing former US Defense Secretary under President George W. Bush Donald Rumsfeld: “(W)hen he talked about the difference between known unknowns and unknown unknowns. The former is risk; the latter is uncertainty. Risk has a more or less well-defined set of outcomes and probabilities associated with them. Uncertainty does not—things are much less clear.” Kevin L. Kliesen of the St. Louis Fed explores the link between rising uncertainty and slower economic growth in Uncertainty and the Economy (April 2013), observing, “If the business and financial community believes the near-term outlook is murkier than usual, then the pace of hiring and outlays for capital spending projects may be unnecessarily constrained, thereby slowing the overall pace of economic activity.” 4The Wall Street Journal reported investors have accumulated a $3.4 trillion cash position, a decade-high level; this is consistent with the risk aversion that can be expected when economic uncertainty is high. Please see Ready to Boost Stocks: Investors’ Multitrillion Cash Hoard, published by The Wall Street Journal November 5, 2019. 5 Accounting for Saudi Arabia's 400k b/d of additional voluntary cuts. 6 The LMEX no long trades on the LME, but we are using the index as a proxy for a position. In iron ore, we are long December 2020 65% Fe futures vs. short 62% Fe futures on the Singapore Exchange, expecting steelmakers will favor the high-grade material in the new mills they’ve brought on line. 7 Our China strategists expect “Chinese policymakers will roll out more stimulus to secure an economic recovery in 2020, and external demand will improve. But we expect growth in both the domestic economy and exports to only modestly accelerate.” Please see 2020 Key Views: Four Themes For China In The Coming Year, published by BCA Research’s China Investment Strategy December 11, 2019. It is available at cis.bcareserach.com. 8 The US dollar is a countercyclical – i.e. it is inversely correlated with the global business cycle – due to the fact that the US economy is driven more by services than manufacturing. 9 Palladium is used mostly in pollution-abatement catalysts in gasoline-powered cars, while Platinum is favored in diesel-engine cars (along with a small amount of palladium). Catalysts production represents close to 80% and 45% of palladium's and platinum's total demand. 10 Considering there’s ~ 3.5g of palladium in a new car and palladium trades at ~ $1,900/oz, close to $240 is added to the cost of a new gasoline-powered car by using this metal in pollution-abatement technology. 11 Please see South African Mines Grind To Halt As Floods Deepen Power Crisis, published by reuters.com on December 10, 2019. 12 Stricter emissions standards in the car industry – mainly in China where China 6 emissions legislation is taking effect – are increasing the PGMs loadings in each car, supporting demand growth. 13 Please see China May Agree to Buy U.S. Ag Exports, But a Final Tranche of Cash to Farmers is Still Likely, published by agriculture.com’s Successful Farming news service. Investment Views and Themes Recommendations Strategic Recommendations Tactical Trades TRADE RECOMMENDATION PERFORMANCE IN 2019 Q3
2020 Key Views: Policy Uncertainty Continues To Drive Commodity Markets
2020 Key Views: Policy Uncertainty Continues To Drive Commodity Markets
Commodity Prices and Plays Reference Table Trades Closed in 2019 Summary of Trades Closed
2020 Key Views: Policy Uncertainty Continues To Drive Commodity Markets
2020 Key Views: Policy Uncertainty Continues To Drive Commodity Markets
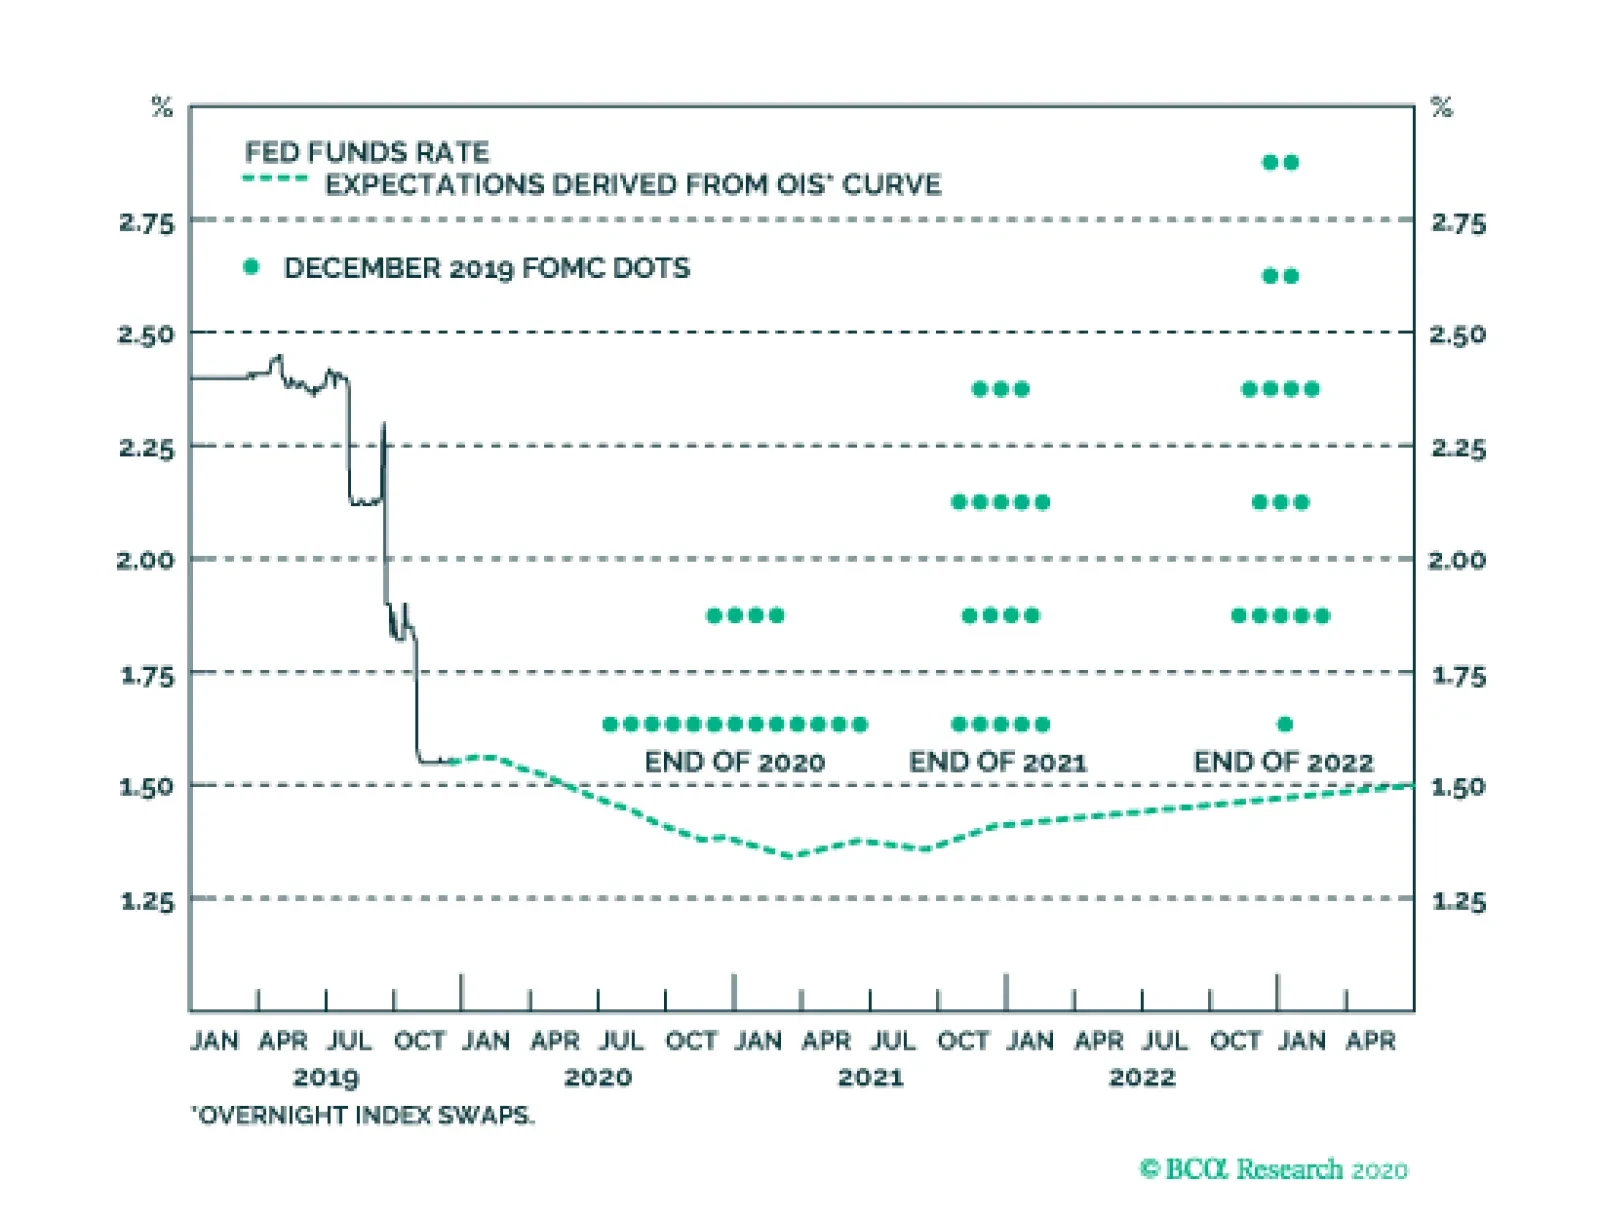
At last week’s FOMC meeting, the Fed’s reaction function underwent a significant dovish shift. Currently, only four FOMC participants expect to lift rates in 2020 while the remaining 13 expect the funds rate to stay between 1.5% and 1.75%. Back in…
Dear Clients, In our final publication of the year, we bring you a recap of this past week’s significant events in Sino-US relations and the key messages from the Central Economic Work Conference. Accordingly, we are upgrading our tactical stance towards Chinese stocks from neutral to overweight. Our publishing schedule will resume on January 9, 2020 with our monthly Macro and Market Review. Our China Investment Strategy team wishes you a happy holiday season and a prosperous New Year! Best regards, Jing Sima, China Investment Strategist Highlights We are upgrading our tactical call on Chinese stocks from neutral to overweight. Recent developments in the Chinese investable equity market point to a risk-on sentiment. The fact the US and China have reached an agreement likely marks the beginning of a truce, which could potentially last through the US presidential election in November 2020. The CEWC statement from last week reinforces our view that China's leadership feels the urgency to stabilize the economy now outweighs the desire to continue financial deleveraging. Feature Signals from the Chinese investable equity market have titled in a bullish direction. This shift is accompanied by two modestly bullish developments: First, the annual China Economic Work Conference (CEWC) concluded on December 12 with support for a more reflationary stance for the coming year. Then, a day later, the US and Chinese officials confirmed they have agreed on a Phase One trade deal. The combination of these developments provides a sufficient basis to upgrade our tactical (0-3 month) stance on Chinese stocks from neutral to overweight (within a global equity portfolio), to be consistent with our bullish cyclical (6-12 month) stance. Equity Market Signals Have Become Bullish In our previous reports, we highlighted that the relative performance of some sectors in the Chinese investable equity market reflects China’s policy direction and financial market conditions, supporting our bullish/bearish calls on Chinese stocks. Recently, two of the three equity market telltale signs that we have been watching have turned favorable for a bullish view on Chinese stocks (Chart 1A and 1B): Chart 1ACountercyclical Sector Stock Performance Points To Improvement In Economic Activity
Countercyclical Sector Stock Performance Points To Improvement In Economic Activity
Countercyclical Sector Stock Performance Points To Improvement In Economic Activity
Chart 1BThe Breakdown Of Defensive Stocks Suggests A Return Of Risk-On Sentiment
The Breakdown Of Defensive Stocks Suggests A Return Of Risk-On Sentiment
The Breakdown Of Defensive Stocks Suggests A Return Of Risk-On Sentiment
Chart 1A (top panel) shows that the relative performance of investable utility stocks have broken down, signifying that market participants anticipate the slowdown in China’s economy will soon bottom. Investable healthcare stocks have not breached their 200-day trend, but are headed in that direction (Chart 1A, bottom panel). Key equity market signs have turned supportive for a bullish tactical call on Chinese stocks. Cyclical stocks are outperforming defensives in both China’s onshore and offshore markets, reflecting improved investor sentiment towards China’s economic outlook (Chart 1B). Bottom Line: Key equity market signs have turned supportive for a bullish call on Chinese stocks for the next 0 to 3 months. Phase One Trade Deal: Unimpressive But Pragmatic Adding to this bullish shift in equity market signals was the first of two positive fundamental improvements over the past week. The US and China reached agreement on a Phase One deal just a few days before the 15% tariff increase on $160 billion of Chinese export goods to the US was scheduled to come into effect. Reportedly, the two sides agreed to pause the 15% tariff scheduled for December 15 and lower the tariff on about $120 billion of Chinese imports to 7.5%. However, the 25% tariffs on the first $250 billion of Chinese imports will remain in place (Chart 2). Chart 2Tariff Rollbacks Unimpressive...
Tariff Rollbacks Unimpressive...
Tariff Rollbacks Unimpressive...
Chart 3...But China's Promise To Buy American Goods Helps Trump Claim Victory
...But China's Promise To Buy American Goods Helps Trump Claim Victory
...But China's Promise To Buy American Goods Helps Trump Claim Victory
In return, China agrees to, in the next two years, boost imports of American goods and services by a total of $200 billion from their levels in 2017 (Chart 3). While no specific number has been confirmed from the Chinese side, in a news conference, Chinese officials said that China “will expand imports of some agriculture products currently in urgent need, such as pork and poultry.” Given that both sides picked low hanging fruit in the Phase One deal, the tougher issues to be discussed in Phase Two could lead to a breakdown in negotiations, which potentially could unravel the Phase One tariff rollbacks. Nevertheless, the agreement serves an interim purpose for both President Trump and President Xi: it allows Trump to claim a short-term political victory on his trade negotiations with China, and gives Xi some breathing space to focus on domestic economic challenges. Bottom Line: While the Phase Two negotiations, when commencing, will be a risk to the Phase One trade deal, the current agreement likely marks the beginning of a truce, which could potentially last through the November’s presidential election in 2020. CEWC: Reinforcing Reflationary Bias For 2020 In addition to the trade deal, another bullish factor for stocks is the fact that Chinese policymakers will proactively fine-tune economic policy to mitigate the impact from the US tariffs that remain in effect and to ensure stable economic growth in the coming year. President Xi at last week’s Central Economic Work Conference (CEWC) urged that Chinese policymakers must “make contingency plans” to combat challenges from both domestic and external environment. At the three-day annual CEWC this year, Chinese central and local government officials set the direction and strategy of China’s economic policy for the coming year. The meeting also reveals the challenges Chinese policymakers are facing, and the areas they will likely mobilize monetary resources to tackle. Investors can therefore benefit from insights into both the direction and constraints of China’s near-term policy framework. We highlight four investment-relevant messages from this year’s CEWC: A Greater Emphasis On Growth Stability The tone from this year’s CEWC reflects an urgency to stabilize the economy and meet growth targets. The tone from this year’s CEWC reflects an urgency to stabilize the economy and meet growth targets. The statement from the meeting mentioned “stability” 31 times, compared with 22 in 2018.1 The statement also reiterated the importance of doubling GDP and per capita income by 2020. This suggests that a growth imperative remains the top priority and reinforces the leadership’s reflationary policy stance for next year. We previously projected that the Chinese government would allow a lower GDP growth target for 2020, between 5.5 and 6.0%. However, we think growth targets to be set at next March’s National People’s Congress (NPC) are more likely to be in a “reasonable range” (verbiage used in the CEWC statement) between 5.8 and 6.2%. As noted in our December 11 report,2 the Chinese economy needs to increase by 6% in 2020 to double its size from the 2010 level in real terms. While China’s real GDP statistics are suspiciously smooth and largely invalid when it comes to equity market pricing, the deviation between market expectations and the actual GDP growth target range set at NPC can help investors gauge how much more (or less) ammunition Chinese policymakers are willing to deploy to support the economy in that year. China is falling short of its target to double real urban per capita income next year from 10 years ago (Chart 4). Nominal wage and salary per capita growth has experienced a sharp drop since the third quarter of 2018 and probably contributed to the subdued appetite for consumption (Chart 5). Chart 4Household Income: Rural Overshooting; Urban Falling Short
Household Income: Rural Overshooting; Urban Falling Short
Household Income: Rural Overshooting; Urban Falling Short
Chart 5Wage Growth Only Started Stabilizing Recently
Wage Growth Only Started Stabilizing Recently
Wage Growth Only Started Stabilizing Recently
To meet the target, urban per capita income will need to grow at an above-real GDP rate of 10% in 2020, almost doubling the growth in 2018 and 2019. Given the still weak domestic economic conditions, we are not optimistic that China will be able to double the growth rate of urban income per capita in 2020 from 2019. Additionally, income typically lags economic activity. Even if China’s economic slowdown bottoms in the first quarter of 2020, it is unlikely we will see significant improvement in income until a few quarters later. Therefore, we think policymakers will likely focus on overall economic and employment growth stability, and poverty reduction through improving rural income in 2020 (Chart 4, top panel). A Shift In Policy Priorities The new year marks the final year of the “Three Major Battles” against financial deleveraging, poverty elimination, and pollution. In this year’s CEWC statement, for the first time in three years, the order of the battles has been rearranged with financial deleveraging ranked behind poverty reduction and environment protection. The PBoC will stay on a mild rate-cutting cycle throughout next year. The shift in policy priorities suggests that the pressure to deleverage has greatly eased. Banks’ asset balance sheets will expand at a faster rate, while the pace of reduction in shadow banking will likely continue to moderate (Chart 6). The description of monetary policy stance was amended to “maintaining a flexible and appropriate monetary policy” from last year’s “appropriately loose or tight.” The change points to a more dovish tone, confirming our assessment that the PBoC will stay on a mild rate-cutting cycle to lower corporate funding costs throughout the next year3 (Chart 7). Chart 6In 2020, Expect Faster Bank Balance Sheet Expansion
In 2020, Expect Faster Bank Balance Sheet Expansion
In 2020, Expect Faster Bank Balance Sheet Expansion
Chart 7The PBoC's Rate-Cutting Cycle Will Continue Next Year
The PBoC's Rate-Cutting Cycle Will Continue Next Year
The PBoC's Rate-Cutting Cycle Will Continue Next Year
At this stage, we do not anticipate the Chinese policymakers will entirely abandon financial risk containment or significantly loosen financial regulations. Rather, we think the reduced pressure on deleveraging and lowering of funding costs will provide moderate support for the private sector, specifically small- and medium-sized enterprises. A slew of new policies announced before the CEWC, including an adjustment to some of the parameters in the Macro-Prudential Assessment (MPA) framework to encourage lending to the private sector,4 will help strengthen the impact of PBoC’s countercyclical measures. A Bigger Fiscal Push This year’s CEWC statement indicated policymakers will continue to fine-tune a proactive fiscal policy, but unlike last year, the meeting did not specify further cuts to taxes. The statement suggests fiscal support to the economy will mainly focus on infrastructure, and listed transportation, urban and rural development, and the 5G networks to be the government’s main investment projects next year. Chart 8Local Governments Have Borrowed More Than They Spent
Local Governments Have Borrowed More Than They Spent
Local Governments Have Borrowed More Than They Spent
In 2019, infrastructure investment was subdued, despite increased quotas for local government special-purpose bond issuance. Our research shows that local government infrastructure expenditures in 2019 have consistently lagged behind their borrowing (Chart 8). The gap between local government infrastructure funding deficit and borrowing has only started flattening in the third quarter of this year. The delayed conversion from borrowing to spending means local governments have accumulated more spending power for 2020. In order to encourage local governments to speed up spending, the central government is also likely to further loosen up project restrictions. A bigger fiscal push by the central government, coupled with a frontloading of 2020 local government special-purpose bond issuance, will likely boost infrastructure spending to around 10% in the first two quarters, doubling the growth in the first eleven months of 2019.5 More robust fiscal stimulus will lead to an increase in the debt load of local governments, but Chinese policymakers are caught between a rock and a hard place and therefore must choose the least risky tools to stimulate the economy. In our view, local government bonds are still a better option over local government financing vehicles (LGFVs) or other illicit channels. Social Housing Gets Another Boost Surprisingly,6 last week’s CEWC statement again emphasized the importance of shantytown renovation (Chart 9). While this implies there would likely be a significant monetary boost to social housing in the coming year, the statement also indicated that policymakers would not want property prices to dramatically change in either direction. Even though local governments have been granted more flexibility to fine-tune their local housing policies, we think the possibility of a broad-based regulatory easing in the housing market remains low in 2020. Therefore, government subsidies in social housing in 2020 will unlikely to lead to another property market boom like that of 2016. Chart 9Social Housing Gets Another Fiscal Boost
Social Housing Gets Another Fiscal Boost
Social Housing Gets Another Fiscal Boost
If the scale of the cyclical policy support in 2020 is still moderate, then we think the stimulus may delay, but not entirely derail China’s progress in structural rebalancing, particularly if the current financial regulations remain in place. The CEWC statement also mentioned deepening reforms of state-owned enterprises (SOEs), and a “three-year SOE reform executive plan”, which we will be closely monitoring in the coming year. Last year’s reference to “striving for stronger, better and larger state assets” was replaced this year by “accelerating the reform of SOEs and optimization of SOE resource allocation”, implying there will be a greater emphasis on the quality and efficiency of SOEs’ assets. These plans can potentially impact SOE profit margins and accelerate the pace of industry consolidation among SOEs. The statement also dedicated a lengthy and detailed segment to "promoting high-quality development", covering topics ranging from the reform of the agricultural supply side to accelerating the implementation of regional development strategies. Further details are expected after next March’s NPC in Beijing. At that time, we will have a Special Report to consider some of the strategic and regional planning initiatives discussed at the meeting and their market implications. Bottom Line: The past week’s CEWC reinforces our view, that the Chinese leadership’s urgency to stabilize the economy has shifted to overweigh the desire to continue financial deleveraging. Monetary policy will only moderately loose further, but fiscal stimulus may overshoot in the first half of 2020. Investment Conclusions We have been cyclically overweight Chinese stocks on the basis of a bottoming in the economy in the first quarter of 2020, and the likelihood of an eventual trade deal. Tactically however, we have been more cautious because of the potential for further near-term downside in the economic data, and the uncertainty surrounding the timing and nature of a trade deal. While the tariff reduction in the trade deal announced last week is somewhat disappointing, the combination of a trade agreement, bullish equity market signals, and the positive messages from last week’s CEWC warrant an upgrade to our tactical stance on Chinese stocks from neutral to overweight. As such, our cyclical and tactical calls are now both aligned in favor of Chinese stocks within a global equity portfolio. As a final point, we noted in last week's report that there are decent odds that all of the outperformance of Chinese stocks in 2020 will be frontloaded in the first half of the year. In the new year, we look forward to providing an ongoing assessment of whether Chinese economic growth has more or less potential upside than we currently expect, along with the attendant investment implications of our analysis. Stay tuned! Jing Sima China Strategist jings@bcaresearch.com Footnotes 1 http://www.gov.cn/xinwen/2019-12/12/content_5460670.htm http://www.xinhuanet.com/english/2019-12/12/c_138626531.htm 2 Please see China Investment Strategy Weekly Report "2020 Key Views: Four Themes For China In The Coming Year," dated December 11, 2019, available at cis.bcaresearch.com 3, 5 Please see China Investment Strategy Weekly Report "Questions From The Road: Timing The Turn," dated November 20, 2019, available at cis.bcaresearch.com 4 http://www.gov.cn/premier/2019-12/14/content_5461147.htm 6 In our last week’s China Investment Strategy 2020 Outlook report, we had projected less monetary support to this sector in 2020. Cyclical Investment Stance Equity Sector Recommendations
This is the final report of the year from BCA’s Global Fixed Income and US Bond Strategies. Our regular publication schedule will resume on January 7, 2020. We wish you a happy, healthy and prosperous new year. Highlights Interest Rate Policy: The Fed’s next interest rate move will be a hike, but it probably won’t occur until 2021. It will not occur until either long-maturity TIPS breakeven inflation rates reach our target band of 2.3%-2.5% or financial asset valuations reach extreme levels. We provide several indicators to monitor to assess the timing of the next Fed hike. Balance Sheet Policy: The era of balance sheet shrinkage is over. The Fed will continue to grow its balance sheet in 2020, and will also tweak regulations to make banks more indifferent between holding Treasury securities and reserves. Strategic Review: The exact form of any new policy strategy is uncertain, but we expect the Fed to make an announcement in mid-2020 that makes it clear that it will explicitly target above-2% inflation for some unspecified period of time in order to re-anchor inflation expectations and make up for past inflation misses. Feature Last week, both our Global Fixed Income Strategy and US Bond Strategy services published their key fixed income views for 2020.1 Those reports presented investment ideas that we think will be profitable next year, but only discussed Fed policy to the extent that it informs those views. This Special Report delves into exactly what we expect to see from the US Federal Reserve in 2020. Specifically, we consider what the Fed will do with its interest rate and balance sheet policies in 2020, and also what might result from the Fed’s ongoing strategic review. Interest Rate Policy The final FOMC meeting of 2019 took place last week, and we learned that the Fed’s reaction function underwent a significant dovish shift between the September and December meetings. Currently, only 4 FOMC participants expect to lift rates in 2020 while the remaining 13 expect the funds rate to stay in its present range between 1.5% and 1.75% (Chart 1). Back in September, 9 participants thought the fed funds rate would be above 1.75% by the end of 2020. Chart 1Fed Will Stay On Hold In 2020, Market Still Priced For Cuts
Fed Will Stay On Hold In 2020, Market Still Priced For Cuts
Fed Will Stay On Hold In 2020, Market Still Priced For Cuts
The yield curve is still discounting a slight decline in the funds rate next year, and the Fed will of course deliver more rate cuts if economic growth deteriorates. However, given our positive global growth outlook for 2020, we think rate cuts are unlikely.2 Rather, we expect a flat fed funds rate next year followed by rate hikes in 2021. The Fed’s reaction function underwent a significant dovish shift between the September and December meetings. If our economic view pans out, then getting a sense of what will be required for the Fed to lift rates is the most pressing monetary policy issue. On that front, we continue to believe that inflation expectations and financial conditions are the two most important factors to monitor.3 Recent remarks from Fed officials have only strengthened our conviction in that view. Inflation Expectations & The Fed’s Phillips Curve Model Last week, when Chair Powell was asked what it will take to lift rates again, he said that he wants to see “a significant move up in inflation that’s also persistent”. This scripted response reveals a lot about the Fed’s reaction function in 2020, and about the importance of inflation expectations. To see why, let’s consider the Expectations-Augmented Phillips Curve, the typical model that the Fed uses to assess trends in inflation. An example of this sort of model, taken from a 2015 Janet Yellen speech, is presented in Box 1.4 Box 1The Fed's Inflation Model
The Fed In 2020
The Fed In 2020
According to the Fed’s model, core inflation is determined by: (i) inflation expectations, (ii) resource utilization and (iii) relative import prices. But inflation expectations are especially important because they determine inflation’s long-run trend. As explained by former Chair Yellen: Chart 2The Importance Of Inflation Expectations
The Importance Of Inflation Expectations
The Importance Of Inflation Expectations
… economic slack, changes in imported goods prices, and idiosyncratic shocks all cause core inflation to deviate from its longer-term trend that is ultimately determined by long-run inflation expectations. This is what Chair Powell means when he says he wants to see a “persistent” move up in inflation. He wants to make sure that inflation expectations return to levels that are consistent with the Fed’s target in order to re-anchor inflation’s long-run trend. The widespread consensus that the “Phillips Curve is flat” makes inflation expectations even more important in the minds of Fed policymakers. When people say that the “Phillips Curve is flat”, they mean that there is very little relationship between resource utilization and inflation. In other words, the coefficient b4 in Box 1 is very small. Logically, if the relationship between resource utilization and inflation is weak, then expectations become an even more important driver of core inflation. As Fed Vice Chair Richard Clarida recently said:5 A flatter Phillips Curve makes it all the more important that inflation expectations remain anchored at levels consistent with our 2 percent inflation objective. Simply put, the Fed needs to see a re-anchoring of inflation expectations before it lifts rates. Our sense is that this will be achieved when both the 10-year and 5-year/5-year forward TIPS breakeven inflation rates reach a range between 2.3% and 2.5%. We are not yet close to those levels. The 10-year and 5-year/5-year forward TIPS breakeven rates currently sit at 1.71% and 1.79%, respectively (Chart 2). Meanwhile, household survey measures from the University of Michigan and the New York Fed also show very low inflation expectations (Chart 2, bottom 2 panels). With all this in mind, the big question for monetary policy is how long will it take for inflation expectations to rise back to “well anchored” levels? Will it occur next year, or not until 2021? How Long Until Inflation (And Inflation Expectations) Return To Target? Chart 3High Inflation No Longer A Worry
The Fed In 2020
The Fed In 2020
We have long held the view that inflation expectations adapt only slowly to changes in the actual inflation data.6 In other words, inflation expectations are low today because actual inflation has been consistently below the Fed’s target for much of the past decade. This makes it very difficult for people to believe that inflation will be high in the future. In fact, when asked what CPI inflation is likely to average over the next 10 years, most forecasters think it will be in a range between 2% and 2.5%, consistent with the Fed’s target.7 This is similar to what forecasters thought in 2004 when TIPS breakeven rates were well-anchored within our target band (Chart 3). The main difference between 2004 and today is that in 2004 a sizeable minority thought inflation might average above 2.5% over the next 10 years. Now, almost nobody expects a significant overshoot of the Fed’s inflation target, and a sizeable minority think inflation will undershoot. The lesson we take from these survey responses is that in order for TIPS breakeven inflation rates to reach our 2.3%-2.5% target, more people need to expect a significant overshoot of the Fed’s 2% inflation target. This will only happen if actual inflation rises to the Fed’s target, or above, and stays there for a significant period of time. Long enough to bring the fear of high inflation back to the forefront of investors’ minds. To further quantify this notion, our Adaptive Expectations Model of the 10-year TIPS breakeven inflation rate pegs current fair value for the 10-year breakeven at 1.94% (Chart 4). The model’s fair value is primarily determined by the 10-year rate of change in core CPI, meaning that a prolonged period of year-over-year core inflation near (or above) the Fed’s target will be required before our model’s fair value pushes above 2.3%. So how long will it take before core inflation is sustainably running at, or above, the Fed’s target? While we expect core inflation to continue along its slow upward trend. It probably won’t be high enough to push long-maturity TIPS breakevens into our target range until 2021, or late-2020 at the earliest. Chart 4Adaptive Expectations Model
Adaptive Expectations Model
Adaptive Expectations Model
Chart 5Trimmed Means Are Rising...
Trimmed Means Are Rising...
Trimmed Means Are Rising...
At present, core PCE inflation is running at a year-over-year rate of 1.59%, considerably below the Fed’s 2% target. One point in favor of rising core inflation is that trimmed mean price measures are accelerating more quickly than core measures (Chart 5). This will tend to drag core inflation higher over time. However, there is still a long way to go before core inflation reaches the Fed’s target and many leading inflation indicators have moderated this year (Chart 6): Chart 6...But Many Headwinds Remain
...But Many Headwinds Remain
...But Many Headwinds Remain
Unit labor cost growth rebounded in the past few quarters, but has yet to break out of its post-crisis range (Chart 6, top panel). The New York Fed’s Underlying Inflation Gauge rolled over sharply in 2019 (Chart 6, panel 2). NFIB surveys of planned and reported price increases have also turned down (Chart 6, bottom 2 panels). Considering the main components of core inflation, we find that the strong month-over-month core inflation prints of June, July and August were driven mostly by accelerating goods prices (Chart 7). Goods inflation has reversed course since then, and should continue to be a drag on core inflation going forward. This is because core goods inflation follows import price inflation with a long lag, and some import price deflation is already baked in (Chart 8). Chart 7CPI Components
CPI Components
CPI Components
Chart 8Expect Some Import Price Deflation
Expect Some Import Price Deflation
Expect Some Import Price Deflation
On the flipside, we have also seen core services inflation (excluding shelter and medical care) inflect higher during the past six months (Chart 7, panel 4). Continued strength in this component is essential if overall core inflation is going to move up. Shelter is the largest component of core inflation and we expect it to trend sideways as we head into 2020. The rental vacancy rate has flattened off at a low level, and the Apartment Market Tightness Index is just barely in net tightening territory (Chart 9). Neither indicator is sending a strong signal in either direction. Chart 9Shelter Inflation Trending Sideways
Shelter Inflation Trending Sideways
Shelter Inflation Trending Sideways
All in all, we see core inflation and TIPS breakeven rates moving slowly higher in 2020. But it will take some time before inflation is strong enough to push long-maturity breakeven rates into our target range of 2.3%-2.5%. Given the importance placed on re-anchoring inflation expectations, the Fed won’t hike rates again until our TIPS breakeven target is met. We don’t expect this to occur until 2021, or late-2020 at the earliest. The Financial Conditions Wildcard Chart 10The Importance Of Financial Conditions
The Importance Of Financial Conditions
The Importance Of Financial Conditions
We mentioned above that the Fed’s interest rate policy will be determined by two factors: inflation expectations and financial conditions. In a perfect world, financial market valuations will stay at reasonable levels and inflation expectations will determine the timing of the next Fed rate hike. However, we must also consider what is likely to happen if it takes a very long time for inflation expectations to reach our target. The longer it takes, the longer that monetary conditions will be accommodative, and any extended period of easy money could lead to an asset bubble. Eventually, if valuations look bubbly enough, there may be a case for the Fed to sacrifice a bit on its inflation target and attempt to deflate a potentially de-stabilizing bubble in financial markets. This is not just a hypothetical situation. As Governor Lael Brainard remarked last December:8 The last several times resource utilization approached levels similar to today, signs of overheating showed up in financial-sector imbalances rather than in accelerating inflation. With greater focus on financial stability than in the past, it is conceivable that we could eventually see Fed tightening to head off an asset bubble. But we are not close to such bubbly conditions yet (Chart 10). The Financial Conditions component of our Fed Monitor is close to neutral, and while corporate bond spreads are tighter than average, they are well above the lows seen in the mid-2000s. Meanwhile, the S&P 500’s forward multiple is not yet back to its early-2018 level, let alone the highs of the late 1990s (Chart 10, bottom panel). Bottom Line: The Fed’s next interest rate move will be a hike, but it probably won’t occur until 2021. It will not occur until either long-maturity TIPS breakeven inflation rates reach our target band of 2.3%-2.5% or financial asset valuations reach extreme levels. Balance Sheet Policy 2019 was a tumultuous year for the Fed’s balance sheet policy. At the start of the year, the Fed was continuing the process of balance sheet shrinkage that started in October 2017. The goal was never to return the Fed’s balance sheet to its pre-crisis size. Policymakers had already decided that they would shift permanently to a floor system of monetary policy implementation. A floor system is one where the central bank supplies more reserves to the banking system than are demanded, pushing interest rates down toward a floor that is set by the Fed. In this case, the floor is the Fed’s overnight reverse repo facility (ON RRP). Using this facility, the Fed agrees to borrow any excess cash at the ON RRP rate in return for a security from the Fed’s balance sheet as collateral. To implement this policy correctly, the Fed’s balance sheet must remain large so that bank reserves are plentiful. The Fed thought that it was supplying more reserves than the banking system demanded, but banks found themselves hoarding liquidity for a few days in September. Everything was going smoothly until September when this strategy hit a snag. The Fed thought that it was supplying more reserves than the banking system demanded, but banks found themselves hoarding liquidity for a few days in September. The result was that the fed funds rate shot higher, and actually printed outside the Fed’s target band for one day (Chart 11).9 Chart 11The Fed Briefly Lost Control Of Rates In September
The Fed Briefly Lost Control Of Rates In September
The Fed Briefly Lost Control Of Rates In September
Clearly, the Fed had actually not been supplying the banking system with more reserves than it wanted, otherwise overnight liquidity would have remained plentiful throughout September. Even more vexing is that surveys of primary dealers and market participants all showed that reserve supply was comfortably above demand (Chart 12), even though this turned out not to be the case. Chart 12The Fed Was Blindsided
The Fed Was Blindsided
The Fed Was Blindsided
Though there are many questions that still need to be answered, the Fed quickly took action and intervened in the repo market to increase the daily reserve supply. It also re-started T-bill purchases at a rate of $60 billion per month, ending the period of balance sheet shrinkage. Then just last week, the Fed announced a program of term repo agreements that will increase overnight liquidity heading into the volatile year-end period. After all that, the Fed’s balance sheet is once again growing as we head into 2020. But there is much uncertainty about how the balance sheet will evolve during the next 12 months. A Two-Pronged Strategy In 2020 the Fed will attack its balance sheet problems on two fronts. 1) Increase Reserve Supply First, it will purchase T-bills in order to increase the supply of reserves. Chart 13 shows how the Fed’s securities holdings and bank reserves will evolve in the first half of 2020, assuming that the Fed buys $60 billion of T-bills per month. We also assume that maturing MBS roll over into Treasury securities and that currency in circulation grows at a rate of 5% per year. Table 1 gives a breakdown of what the Fed’s balance sheet looks like today and what it will look like at the end of June, according to our assumptions. Chart 13The Fed's Balance Sheet Over Time
The Fed's Balance Sheet Over Time
The Fed's Balance Sheet Over Time
But increasing the reserve supply will be a bit more difficult than that. For one thing, Table 1 shows that the Treasury Department’s General Account at the Fed is expected to grow by another $106 billion. All else equal, this will drain $106 billion of reserve supply. The Treasury depleted its cash holdings down to $130 billion in August, as it took extraordinary measures to stay under the debt ceiling. But now that the debt ceiling has been suspended until July 2021, the Treasury has been re-building its cash stores, targeting a level of $410 billion. Table 1Fed’s Balance Sheet: Projections
The Fed In 2020
The Fed In 2020
Second, Table 1 assumes that Fed repos stay flat at $213 billion. But if the Fed decides to extricate itself from the repo market in the first half of 2020 then, all else equal, reserve supply will shrink by $213 billion. So far the Fed has provided very little guidance about its future presence in the repo market, but we expect it to err on the side of caution. That is, the Fed will not completely unwind its repo operations until it is confident that reserve supply is comfortably above demand. What we can say for certain is that the Fed will try to increase the reserve supply in early-2020. Then, at some point during the year, it will decide that the reserve supply is high enough and it will shift to purchasing only enough securities to keep pace with growth in non-reserve liabilities, holding reserve supply flat. It is unknown when that shift will occur, but whenever it does, the Fed’s balance sheet will still be growing, just more slowly. We can say decisively that the era of balance sheet shrinkage is over. At some point in 2020 the Fed will probably also introduce a standing repo facility. This will act as the mirror image of the current ON RRP, providing a ceiling on interest rates. The facility will promise to supply overnight cash at a stated rate in return for Treasury collateral. If reserve supply is sufficiently high, then the standing repo facility is irrelevant. It would merely be a safety measure in case of periods like last September when reserve demand spiked. 2) Decrease Reserve Demand Other than increasing reserve supply, the Fed will also take steps in 2020 to reduce the amount of reserves demanded by the banking sector. It will do this by tweaking some banking regulations that possibly encouraged banks to hoard reserves in September. The Liquidity Coverage Ratio is the regulation that requires banks to hold enough high-quality liquid assets (HQLA) to cover 30 days of cash outflows in a stressed scenario. Bank reserves and Treasury securities both count as HQLAs, as do other fixed income securities with a haircut. In theory, the Liquidity Coverage Ratio shouldn’t prevent banks from swapping reserves for Treasuries in the repo market. But banks also undergo frequent internal stress testing, in preparation for the Fed’s periodic stress tests, and those internal tests may place a premium on reserves over Treasuries. It is very likely that, in 2020, the Fed will take steps to make banks increasingly indifferent between holding reserves and Treasury securities. This should reduce overall reserve demand and make cash more freely available in the overnight repo market. Investment Implications With all that said, we place very little importance on the Fed’s balance sheet policy in terms of what it means for asset returns. Our longstanding view is that asset purchases were only an effective policy tool because they reinforced the Fed’s forward guidance about changes in the funds rate. In fact, any perceived correlation between changes in the size of the Fed’s balance sheet and financial asset prices is only because balance sheet policy was moving in the same direction as interest rate policy. That is, during the past few years, periods of Fed asset purchases have always coincided with easier interest rate policy and periods of balance sheet shrinkage have always coincided with tighter interest rate policy. It is the interest rate policy that determines movements in asset prices, not the balance sheet. Finally, in 2019, we witnessed a period when balance sheet policy diverged from interest rate policy and we were able to test our thesis. Between December 2018 and July 2019, the Fed was shrinking its balance sheet but also easing its forward rate guidance and preparing for rate cuts. Outstanding bank reserves fell by $124 billion, but the expected 12-month change in the fed funds rate fell from +11 bps to -88 bps. It is very likely that, in 2020, the Fed will take steps to make banks increasingly indifferent between holding reserves and Treasury securities. What happened during this period? Bond yields declined and the dollar depreciated (Chart 14). Meanwhile, risk asset prices shot higher (Chart 15). In other words, markets behaved as you would expect if the Fed were easing policy, clearly taking their cues from interest rate policy not the balance sheet. Chart 14Rates Policy Trumps Balance Sheet Part I
Rates Policy Trumps Balance Sheet Part I
Rates Policy Trumps Balance Sheet Part I
Chart 15Rates Policy Trumps Balance Sheet Part II
Rates Policy Trumps Balance Sheet Part II
Rates Policy Trumps Balance Sheet Part II
Bottom Line: The era of balance sheet shrinkage is over. The Fed will continue to grow its balance sheet in 2020, and will also tweak regulations to make banks more indifferent between holding Treasury securities and reserves. But more importantly, the Fed’s balance sheet policy is now completely de-linked from its interest rate policy. That being the case, investors should largely ignore trends in the Fed’s balance sheet and focus on interest rate policy as the main driver of asset returns. The Fed’s Strategic Review The Fed is currently undertaking a strategic review of its monetary policy strategy, tools and communications practices. Chair Powell has said that he expects the review to be completed by the middle of 2020, and it is likely that some important changes will be announced. According to the Fed, the review is taking place because “the US economy appears to have changed in ways that matter for the conduct of monetary policy.” Specifically, the Fed believes that the neutral fed funds rate – the rate consistent with stable inflation – is structurally lower. The Fed is concerned that this increases the risk of the fed funds rate being pinned at its effective lower bound (ELB), making it more difficult to consistently hit its inflation target. The review is about considering different strategies and tools that the Fed could use to more consistently hit its 2% inflation target in the future, but the 2% target itself is not up for discussion. The Fed has already decided that 2% inflation is most consistent with its price stability mandate. Policy Strategy Chart 16A Big Miss
A Big Miss
A Big Miss
One thing that’s clear is that most Fed participants agree that some changes to policy strategy are necessary. There is widespread concern about the fact that the Fed has not hit its inflation target during the past decade. The Fed officially adopted a 2% target for PCE inflation in January 2012, but inflation has not come close to those levels since. Headline and core PCE have increased at average annual rates of only 1.3% and 1.6%, respectively, since 2012 (Chart 16). At the July and September FOMC meetings, the Fed discussed several different strategies that could make it easier to hit its inflation target. Most of the proposals fall into the category of “makeup strategies”, strategies where the Fed tries to make up for a period of below-2% inflation by targeting above-2% inflation for a stretch of time. In theory, most Fed members agree that such strategies make sense. From the September FOMC minutes:10 Because of the downside risk to inflation and employment associated with the ELB, most participants were open to the possibility that the dual-mandate objectives of maximum employment and stable prices could be best served by strategies that deliver inflation rates that over time are, on average, equal to the Committee’s longer-run objective of 2 percent. Promoting such outcomes may require aiming for inflation somewhat above 2 percent when the policy rate was away from the ELB, recognizing that inflation would tend to be lower than 2 percent when the policy rate was constrained by the ELB. The main problem with these sorts of makeup strategies is what Fed Governor Lael Brainard calls the time-inconsistency problem.11 For example, if inflation has been running well below – or above – target for a sustained period, when the time arrives to maintain inflation commensurately above – or below – 2 percent for the same amount of time, economic conditions will typically be inconsistent with implementing the promised action. In other words, when it comes time to deliver on its past promises, the Fed may not want to. But if it fails to deliver, it makes any future promises less impactful. Governor Brainard thinks that this problem can be mitigated by adopting a more flexible approach. That is, rather than following a strict rule that says that the Fed must aim for average inflation of 2 percent over a specific timeframe, it could simply opportunistically change its target inflation range based on the circumstances. She gives the following example: For instance, following five years when the public has observed inflation outcomes in the range of 1-1/2 to 2 percent, to avoid a decline in expectations, the Committee would target inflation outcomes in a range of, say, 2 to 2-1/2 percent for the subsequent five years to achieve inflation outcomes of 2 percent on average overall. We think it is very likely that something similar to Brainard’s plan will be announced when the review is completed in 2020. There is widespread consensus that the Fed should temporarily target an overshoot of its 2 percent inflation target to ensure that inflation expectations stay anchored near target levels. Opportunistically shifting the inflation target to 2%-2.5% on a temporary basis seems like the easiest way to communicate that goal. ELB Tools In addition to potential changes to policy strategy, the Fed has also been talking about potential policy tools that could be deployed the next time that interest rates reach the ELB. Policymakers took up this question in detail at the October FOMC meeting and generally agreed that the combination of forward guidance and asset purchases had been effective at delivering policy accommodation at the lower bound. Now that the committee is comfortable with these tools, we would expect them to be deployed very quickly the next time that the fed funds rate reaches zero. In all likelihood, if the funds rate reaches zero again, the Fed will quickly announce a round of asset purchases and pledge to keep rates on hold until some economic outcome – likely related to inflation – is met. The Fed also discussed the possibility of cutting rates into negative territory, but there is very little appetite for negative rates policy in the US. From the October FOMC minutes:12 All participants judged that negative interest rates currently did not appear to be an attractive monetary policy tool in the United States. Participants commented that there was limited scope to bring the policy rate into negative territory, that the evidence on the beneficial effects of negative interest rates abroad was mixed, and that it was unclear what effects negative rates might have on the willingness of financial intermediaries to lend and on the spending plans of households and businesses. If, during the next ELB phase, the combination of forward rate guidance and asset purchases does not appear to be working quickly enough, we think it’s most likely that the Fed will follow the Bank of Japan and simply extend these policies further out the yield curve. For example, the Fed would set a cap on some intermediate-maturity Treasury yield (say the 2-year yield), and pledge to buy as many securities as necessary to keep the yield below that cap. This potential tool was discussed at the October FOMC meeting, and it received a more favorable response than the negative rates policy. Results Of The Strategic Review The exact form of any new policy strategy is uncertain, but we expect the Fed to make an announcement in mid-2020 that makes it clear that it will explicitly target above-2% inflation for some unspecified period of time in order to re-anchor inflation expectations and make up for past inflation misses. This will make it even more important to use inflation expectations as our guide for detecting shifts in Fed policy, rather than the actual inflation data. In many ways, the Fed’s reaction function has already moved toward targeting expectations. The results of the 2020 strategic review will make that even more explicit. There is less urgency to announce any potential new tools for conducting policy at the ELB, and we do not expect much in that regard. Other than some ideas for further study. Ryan Swift US Bond Strategist rswift@bcaresearch.com Footnotes 1 Please see Global Fixed Income Strategy Special Report, “2020 Key Views: Delay Of Reckoning”, dated December 10, 2019, available at gfis.bcaresearch.com and US Bond Strategy Special Report, “2020 Key Views: US Fixed Income”, dated December 10, 2019, available at usbs.bcaresearch.com 2 For details on BCA’s economic outlook for 2020 please see The Bank Credit Analyst, “Outlook 2020: Heading Into The End Game”, dated November 22, 2019, available at bca.bcaresearch.com 3 Please see US Bond Strategy Weekly Report, “The New Battleground For Monetary Policy”, dated March 26, 2019, available at usbs.bcaresearch.com 4 https://www.federalreserve.gov/newsevents/speech/yellen20150924a.htm 5 https://www.federalreserve.gov/newsevents/speech/clarida20190926a.htm 6 Please see US Bond Strategy Weekly Report, “Adaptive Expectations In The TIPS Market”, dated November 20, 2018, available at usbs.bcaresearch.com 7 CPI inflation runs about 0.4%-0.5% above PCE inflation, so the Fed’s 2% PCE target translates to a 2.4%-2.5% target for CPI. 8 https://www.federalreserve.gov/newsevents/speech/brainard20181207a.htm 9 This September episode is discussed in detail in the US Bond Strategy Weekly Report, “What’s Up In US Money Markets?”, dated September 24, 2019, available at usbs.bcaresearch.com 10 https://www.federalreserve.gov/monetarypolicy/fomcminutes20190918.htm 11 https://www.federalreserve.gov/newsevents/speech/brainard20191126a.htm 12 https://www.federalreserve.gov/monetarypolicy/files/fomcminutes20191030.pdf
Highlights Easy monetary policy is the linchpin of our 2020 market views and investment strategy, … : As we outlined in our 2020 Key Views report, easy monetary policy should extend the economic expansion and the bull markets in risk assets. ... and last week’s FOMC meeting made it crystal clear that the Fed’s default policy setting for next year is easy: The meeting came and went without much of a fuss, but the FOMC revealed that it will take a major inflation surprise to bring it off the sidelines in 2020. The labor market still has plenty of momentum, and should help keep the real economy humming, … : Through November, 2019’s average net monthly job gains are snugly within the last nine years’ range, and the JOLTS and NFIB surveys point to more hiring and accelerated wage gains. … while trade tensions are apparently less likely to derail it: Details remained vague as we went to press, but Chinese and American trade negotiators have reportedly reached a Phase 1 agreement that will be executed soon. Feature Dear Client, This is our last report of 2019. Our regular publishing schedule will resume on Monday, January 6th. We wish you a happy, healthy and prosperous new year. Chart 1The Fed Stood Down In 2019
The Fed Stood Down In 2019
The Fed Stood Down In 2019
Why bother fighting the Fed? Central bankers exert tremendous sway over the economy and markets, and although they’re hardly infallible, they typically get their way over the timeframes that most investors are judged. It’s much easier to make money going with the monetary policy flow than it is to try to resist it, because resistance is only viable when the Fed is plainly behind the curve. Consistent money-making investment strategies revolve around deploying capital when the odds are in one’s favor, and they’re stacked in favor of risk assets when policy is easy, and against them when it’s tight. We missed the latest instance when the Fed was fighting a losing battle at this time last year, when we continued to stick with our below-benchmark-duration recommendation. The money markets called for a 25-basis-point rate cut in 2019 in defiance of the FOMC, which projected 50 basis points ("bps") of hikes (Chart 1). We sided with the Fed, and wound up on the wrong side of the 10-year Treasury rally from 2.70% at the beginning of January to under 1.50% at the end of August. Since the crisis, however, BCA has remained squarely in the easier-for-longer monetary policy camp, which has led us to recommend overweighting stocks throughout the longest US equity bull market on record. The importance of the Fed’s influence was all over the 2020 outlook we laid out last week. The common thread linking our market views and investment strategy is the expectation that monetary policy settings will remain amply accommodative until the election is over. Easy monetary conditions are not confined to the US; major central banks around the world are deliberately pursuing reflationary policy. With the wind of an additional year of generous accommodation filling their sails, we expect that equities and spread product will easily outperform Treasuries and cash in 2020. The Latest From The Fed Chart 2Same Outlook, Fewer Hikes
Paddling With The Current
Paddling With The Current
The run-up to last week’s FOMC meeting was devoid of suspense, but members’ dot-plot projections and Chair Powell’s press conference supported our sense that promoting higher inflation expectations is the Fed’s foremost priority. Our base case remains that the Fed will stay on hold at least until its November meeting. Although the Fed remains at pains to remind investors that policy is not on a preset course, the committee clearly expects the growth-without-inflation sweet spot will last through 2020 and beyond. As a group, the 17 FOMC members dialed back their rate-hike expectations from the September meeting, rescinding a net 13 votes for 25-bps hikes in 2020 (Chart 2, top panel) and 7 in 2021 (Chart 2, bottom panel). Several of Powell’s comments at the press conference reinforced the take that the Fed is on hold for the foreseeable future. In his prepared remarks, he repeated the message from the July, September and October meetings that the Fed has not yet accomplished its full-employment mandate. “[W]ages have been rising, particularly for lower-paying jobs. [I]n low- and middle-income communities, … many who have struggled to find work are now finding new opportunities. [Broad-based employment gains] underscore … the importance of sustaining the expansion so that the strong job market reaches more of those left behind.” When the chair says that unemployment can be a full percentage point below NAIRU for an extended period without generating "unwanted upward pressure on inflation," ... He characterized low inflation as a mixed blessing, and was more explicit about the need to get it higher than he was in the past three meetings, when the committee actually cut rates. “While low and stable inflation is certainly a good thing, inflation that runs persistently below our objective can lead to an unhealthy dynamic in which longer-term inflation expectations drift down, pulling actual inflation even lower. In turn, interest rates would be lower as well and closer to their effective lower bound. As a result, the scope for interest rate reductions to support the economy in a future downturn would be diminished, resulting in worse economic outcomes for American families and businesses. … We are strongly committed to achieving our symmetric 2 percent inflation goal.” In the Q&A segment of the press conference, Powell amplified the boilerplate employment language with repeated assertions that the labor market still has some slack. [W]e think we’ve learned that unemployment can remain at quite low levels for an extended period of time without unwanted upward pressure on inflation. In fact, we need some upward pressure [on] inflation to get back to 2 percent. … [E]ven though we’re at three-and-a-half percent unemployment, there’s actually more slack out there. … I’ll say that the labor market is strong. I don’t know that it’s tight because you’re not seeing wage increases[.] … Ultimately[,] … to call it hot, you’d want to see heat. You’d want to see … higher wages. That take contrasts with the Congressional Budget Office’s 4.6% NAIRU estimate, but NAIRU is only a concept. To this point, the economy has been supporting an unemployment rate in the low-3s without overheating, and economists will only have a clear idea of where NAIRU is today well after the fact. The relevant point for investors is that an FOMC that believes the natural rate of unemployment is below its current 50-year low is an FOMC that has sworn off proactive tightening. ... you know the FOMC isn't going to tighten policy pre-emptively. The chair also elaborated on the inflation mandate by saying that “a significant move up in inflation that’s also persistent” is a personal prerequisite for tightening policy. Our US Bond Strategy colleagues interpret “persistent” as meaning that inflation expectations have to get back to the 2.3-2.5% range that is consistent with the Fed’s 2% inflation target. Taken together, the prepared remarks, the Q&A and the fairly significant downward adjustment in the dots – absent any change in the outlook – suggest that the Fed’s reaction function has shifted materially. It will take a significant pickup in inflation, or undeniable signs of froth in the financial markets, for the Fed to tighten policy. The Labor Market Remains On Track November marked the record 110th consecutive month that net nonfarm payrolls have expanded, and the rest of the employment situation report confirmed that the jobs machine continues to motor along eleven years into the expansion (Chart 3). The annual job gains have not been as large as they often were in the 1991-2001 expansion, but they have been remarkably steady since 2011, averaging an even 200,000 net additions per month without once dipping below 170,000 for a full year (Chart 4). The unemployment rate fell back to the 3.5% 50-year low first reached in September, and the broader unemployment rate, capturing discouraged workers and involuntary part-time workers, is just a tick above the dot-com boom’s 6.8% low (Chart 5). Chart 3The Job Gains Haven't Been As Big As They Were In The '90s, ...
The Job Gains Haven't Been As Big As They Were In The '90s, ...
The Job Gains Haven't Been As Big As They Were In The '90s, ...
Chart 4... But They've Been Remarkably Steady
... But They've Been Remarkably Steady
... But They've Been Remarkably Steady
Chart 5All Unemployment Measures Are Extremely Low
All Unemployment Measures Are Extremely Low
All Unemployment Measures Are Extremely Low
Neither the JOLTS nor the NFIB survey offers any indication that employment gains are about to dry up. JOLTS job openings have exceeded the number of unemployed workers since early 2018, and job openings as a share of overall employment remain way above the last cycle’s peak (Chart 6). The NFIB survey’s share of small businesses with unfilled job openings is similarly extended (Chart 7, top panel), and the diffusion index of firms planning to expand payrolls in the next three months is around its dot-com highs (Chart 7, middle panel). Hiring momentum appears as if it will remain solid over the visible horizon. Chart 6Survey Says ...
Survey Says ...
Survey Says ...
With labor demand exceeding readily available supply, wage gains ought to accelerate. The prime-age employment-to-population ratio remained at an 11-year high last month, shy of only its dot-com boom highs (Chart 8). The Phillips Curve using the prime-age employment-to-population ratio is not kinked, and exhibits a strong correlation with compensation gains (Chart 9). Chart 7... More Jobs Are On The Way
... More Jobs Are On The Way
... More Jobs Are On The Way
Chart 8Prime-Age Employment Is Back To Its Pre-Crisis Peak
Prime-Age Employment Is Back To Its Pre-Crisis Peak
Prime-Age Employment Is Back To Its Pre-Crisis Peak
Average hourly earnings for production and nonsupervisory employees, which comprise about 80% of the labor force, have already been growing at a 3.7-3.8% clip, and the Conference Board’s consumer confidence survey (Chart 10, middle panel) and the quits rate (Chart 10, bottom panel) suggest that they can keep climbing. So, too, does the Fed’s pivot; it usually tightens policy to slow the economy when real wage gains reach today’s levels, but now it appears bent on abetting further gains (Chart 10, top panel). Chart 9There Will Be Upward Pressure On Wages, ...
Paddling With The Current
Paddling With The Current
Bottom Line: The labor market is strong, and poised to stay that way for the immediate future, especially given that the Fed seems to be egging it on in an attempt to boost inflation expectations and spread the expansion’s gains more evenly. Chart 10... And The Fed Doesn't Mind At All
... And The Fed Doesn't Mind At All
... And The Fed Doesn't Mind At All
Investment Implications A robust labor market should keep household income growing nicely, and fortified balance sheets will enable households to spend much of their income gains, supporting consumption. Government spending is certain to support the economy ahead of a hotly contested election. We have worried about volatile fixed investment’s potential to stymie growth, largely because of concerns that the uncertainty surrounding trade tensions could cause corporations to pull back on capex until they get a better sense of the rules of the road. The apparent breakthrough in the US-China trade negotiations may resolve some of that uncertainty. With the Fed seemingly settling in for an extended period of holding the target fed funds rate at 1.75%, the risk to our view may be that we’re being insufficiently bullish on the markets. Another year of generous accommodation, here and abroad, is likely to keep life insurers, pension funds and endowments avidly searching for yield. It will be hard to default while that search is afoot, and it will also be hard for spreads to widen in an appreciable way. The combination should allow spread product to continue to generate excess returns over Treasuries and cash, though we echo our US Bond Strategy colleagues’ preference for high-yield over investment-grade corporates. Easy policy also supports equity outperformance. Global ex-US acceleration will benefit international indexes more than US indexes, but US equities will still generate attractive absolute returns. S&P 500 earnings will pick up a little as the rest of the world begins to stir, though truly juicy equity returns will require multiple expansion. We are not yet ready to call for a couple of points of re-rating, but note that it would be consistent with the monetary policy backdrop, the historical sprint-to-the-finish equity bull market pattern, and investors’ need for investment destinations in a persistently low-yield world. Doug Peta, CFA Chief US Investment Strategist dougp@bcaresearch.com
Feature The purpose of this Special Report is to identify and provoke a healthy debate on the prevailing investment themes for the 2020s and to speculate on what the key US sector beneficiaries and likely losers may be. Every decade a dominant theme captures investors’ imaginations and morphs into a bubble. Massive speculation typically propels the relevant asset class into the stratosphere as investors extrapolate the good times far into the future and go on a buying frenzy. Chart 1 shows previous manic markets starting with the Nifty Fifty, gold bullion, the Nikkei 225, the NASDAQ 100, crude oil and most recently the FAANGs. Chart 1Manias: An Historical Roadmap
Manias: An Historical Roadmap
Manias: An Historical Roadmap
What will be the dominant themes of the next decade? How should investors capitalize on some of these big trends? The purpose of this Special Report is to identify and provoke a healthy debate on the prevailing investment themes for the 2020s and to speculate on what the key US sector beneficiaries and likely losers may be. Theme #1: De-Globalization Picks Up Steam The first investment theme for the upcoming decade is the “apex of globalization” or “de-globalization”. We have written about this theme extensively at BCA Research and it is the mega-theme of our sister Geopolitical Strategy (GPS) service. Odds are high that countries will continue looking inward as the US adopts a more aggressive trade policy, China’s trend growth slows, and US-China strategic tensions intensify. The three pillars of globalization are the free movement of goods, capital, and people across national borders. We expect to see marginally less of each in the future. Chart 2 shows that we are at the conclusion of a period of tranquility. Pax Americana underpinned globalization as much as Pax Britannica before it. The US is in a relative decline after decades of geopolitical stability allowed countries like China to rise to “great power” status and rivals like Russia to recover from the chaos of the 1990s. Chart 2De-globalization Has Commenced
De-globalization Has Commenced
De-globalization Has Commenced
De-globalization has become the consensus since the election of Donald Trump. But Trump is not the prophet of de-globalization; he is its acolyte. Globalization is ending because of structural factors, not cyclical ones. And its decline was pre-written into its “source code.” Three factors stand at the center of this assessment, outlined in our 2014 Special Report, “The Apex Of Globalization – All Downhill From Here”: multipolarity, populism and protectionism. Events have since confirmed this view. The three pillars of globalization are the free movement of goods, capital, and people across national borders. We expect to see marginally less of each in the future. Investment Implication #1: Profit Margin Peak The most profound and provocative investment implication from de-globalization is that SPX profit margins have peaked and will likely come under intense pressure, especially for US conglomerates that – on a relative basis to international peers – most enthusiastically embraced globalization. Reconstructed S&P 500 profits and sales data date back to the late-1920s. Historically, corporate profit margins and globalization (depicted as global trade as a percentage of GDP) have been positively correlated (Chart 3). Chart 3Profit Margin Trouble
Profit Margin Trouble
Profit Margin Trouble
As countries are more outward looking, trade flourishes and openness to trade allows the free flow of capital to take advantage of profit-maximizing projects. Following the Great Recession and similar to the Great Depression, trade has suffered and trade barriers have risen. The Sino-American trade war has accelerated the inward movement of countries, including Korea and Japan, and has had negative knock-on effects on trade as evidenced by the now two-year old global growth deceleration. China’s response to President Trump’s election was to redouble its pursuit of economic self-sufficiency, which meant a crackdown on corporate debt and a fiscal boost to household consumption. Trump’s tariffs then damaged sentiment and trade between the two countries. Any deal reached prior to the 2020 US election will remain in doubt among global investors. The longer the trade war remains unresolved, the deeper the cracks will be in the foundations of the global trading system. Such a backdrop is negative for profit margins, as inward looking countries prevent capital from being allocated most efficiently. Moreover, the uprooting of supply chains due to the trade war hurts margins and the redeployment of equipment in different jurisdictions will do the same at a time when final demand is suffering a setback. In addition, rising profit margins are synonymous with wealth accruing to the top 1% of US families and vice versa. This relationship dates back to the late-1920s, as far back as our dataset goes. Using Piketty and Saez data, which exclude capital gains, it is clear that profit margin expansion exacerbates income inequality (top panel, Chart 4). Chart 4Heightened Risk Of Wealth Re-distribution
Heightened Risk Of Wealth Re-distribution
Heightened Risk Of Wealth Re-distribution
Expanding margins lead to higher profits. Because families at the top of the income distribution are more often than not business owners, income disparities are the widest when margins are in overshoot territory. Eventually this income chasm comes to a head and generates political discontent. Populism has emerged on both the right and left wings of the US political spectrum – and since the rise of Trump, even Republicans complain about inequality and the excesses of “corporate welfare” and laissez-faire capitalism. Because inequality is extreme – relative to America’s developed peers – and political forces are mobilizing against it, the probability of wealth re-distribution is rising in the coming decades (middle panel, Chart 4). Labor’s share of national income has nowhere to go but higher in coming years and that is negative for profit margins, ceteris paribus (bottom panel, Chart 4). Drilling beneath the surface, the three secular US equity sector/factor implications of the apex of globalization paradigm shift are: prefer small caps over large caps prefer value over growth overweight the pure-play BCA Defense Index Investment Implication #2: Small Is Beautiful While a small cap bias is contrary to the cyclical US Equity Strategy view of preferring large caps to small caps, the issue is timing: the small cap preference is a secular view with a time horizon that spans the next decade. The small versus large cap share price ratio’s ebbs and flows persist over long cycles. Small caps outshined large caps uninterruptedly from 1999 to 2010. Since then large caps have had the upper hand (Chart 5). Were the apex of globalization theme to gain traction in the 2020s, small caps should reclaim the lead from large caps, especially in the wake of the next US recession. Similar to the death of the global banking model, companies with global footprints will suffer the most, especially compared with domestically focused outfits. One way to explore this theme is via domestic versus global sector preference. But a more investable way to position for this sea change, is to buy small caps (or microcaps) at the expense of large caps (or mega caps). Small caps are traditionally domestically geared compared with large caps that have significantly more foreign sales exposure. Chart 5It’s A Small World After All
It’s A Small World After All
It’s A Small World After All
The closest ETF ticker symbols resembling this trade is long IWM:US/short SPY:US. Investment Implication #3: Buy Value At The Expense Of Growth Similar to the size bias, the style bias also moves in secular ways. Value outperformed growth from the dot com bust until the GFC. Since then growth has crushed value, even temporarily breaking below the year 2000 relative trough. This breakneck pace of appreciation for growth stocks is clearly unsustainable and offers long-term oriented investors a compelling entry point near two standard deviations below the historical mean (Chart 6). Chart 6Value Has The Upper Hand Versus Growth
Value Has The Upper Hand Versus Growth
Value Has The Upper Hand Versus Growth
Financials populate value indexes, a similarity with small cap outfits. Traditionally, financials are a domestically focused sector with export exposure registering at half of the S&P’s average 40% level of internationally sourced revenues. On the flip side, tech stocks sit atop the growth table and they garner 60% of their revenue from abroad. This value over growth style preference will pay handsome dividends if the de-globalization theme becomes more main stream as countries become more hawkish on trade and the Sino-American war continues to erect barriers to trade that took decades to lift. The caveat? If President Trump strikes a short-term deal with China ahead of the 2020 election, the de-globalization theme will suffer a setback. But our geopolitical strategists expect a ceasefire at best, not a durable deal, and also expect the trade war to resume in some way, shape or form in 2021-22, regardless of the outcome of the US election. The closest ETF ticker symbols resembling this trade is long IVE:US/short IVW:US. Investment Implication #4: Defense Fortress One final long-term playable investment idea from the apex of globalization is a structural bull market in defense stocks (Chart 7). Our October 2016 “Brothers In Arms” Special Report drew parallels with the late nineteenth century period of European rearmament, and the American and Soviet arms race of the 1960s. These movements were greatly beneficial to the aerospace and defense industry. Currently, the move by several countries to adopt more independent foreign policies, i.e. to move away from collaboration and cooperation toward isolationism and self-sufficiency, entails an accompanying arms race. Chart 7Stick With Pure-play Defense Stocks
Stick With Pure-play Defense Stocks
Stick With Pure-play Defense Stocks
Table 1
Top US Sector Investment Ideas For The Next Decade
Top US Sector Investment Ideas For The Next Decade
China’s challenge to the regional political status quo motivates a boost to defense spending globally. In fact SIPRI data on global military spending by 2030 (Table 1) increases our conviction that this trade will succeed on a five-to-ten year horizon. Beyond the global arms race, two additional forces are at work underpinning pure-play defense contractors. A global space race with China, India and the US wanting to have manned missions to the moon, and the rise of global cybersecurity breaches. Defense companies are levered to both of these secular forces and should be prime sales and profit beneficiaries to rising space budgets and increasing cybersecurity combat budgets. The ticker symbols for the stocks in the pure-play BCA defense index are: LMT, RTN, NOC, GD, HII, AJRD, BWXT, CW, MRCY. Theme #2: Tech Sector Regulation, US Enacts Privacy Laws The second long-term geopolitical theme that we are exploring is the regulatory or “stroke of pen” risk that is rising on FAANG stocks – Facebook, Apple, Amazon, Netflix, and Google. These companies were this decade’s undisputed stock market winners. The US anti-trust regulatory framework was designed to curb broad anti-competitive actions of trusts. As Lina Khan discusses in her seminal article, these actions “include not only cost but also product quality, variety, and innovation.” However, through subsequent regulatory evolution, the Chicago School has focused the US anti-trust process on consumer welfare and prices. If President Reagan and the courts could change how anti-trust laws were administered in the 1980s, so too can future administrations and courts. Today the US Congress, on both sides of the aisle, is looking into regulatory tightening, while the judicial system will take longer to change its approach. Moreover, the impetus for tougher anti-trust policy is here. It comes from a long period of slow growth, income inequality, and economic volatility – such as in the 1870s-80s. This was certainly the case for Standard Oil in 1911, which became a nation-wide boogeyman despite most of its transgressions occurring in the farm belt states. Today, income inequality is a prominent political theme and source of consumer discontent. A narrative is emerging – which will be super-charged during the next recession – that growth has been unequally distributed between the old economy and the twenty-first century technology leaders. With regard to privacy, the news is equally grim for large tech outfits. The EU General Data Protection Regulation (GDPR), which came into force on May 2018, imposes compliance burdens on any company handling user data. In the US, California has signed its own version of the law – the Consumer Privacy Act – which will go into effect in January 2020. These laws give consumers the right to know what information companies are collecting about them and what companies that data is being shared with. They also allow consumers to ask technology companies to delete their data or not to sell it. While tech companies are likely to fight the new California law, and the US court system is a source of uncertainty, we believe the writing is on the wall. The EU is by some measures the largest consumer market on the planet. California is certainly the largest US market of the states. It is unlikely that the momentum behind consumer protection will change, especially with the EU and California taking the lead. The odds of a federal privacy law, following in the footsteps of the Consumer Privacy Act, are also rising. Investment Implication #5: Shun Interactive Media & Services Stocks These risks introduce a severe overhang for FAANG stocks. We are especially worried for the S&P interactive media & services index that includes GOOGL and FB. Tack on the threat of federal regulation and this represents another major headwind for profits and net profit margins that are extremely elevated for these near monopolies. Given that advertising revenue is crucial to the business model of social media companies (GOOGL and FB included), a significant uptick in privacy regulation will likely hurt their bottom line. With regard to profit margins, tech stocks in general command a profit margin twice as high as the SPX. Specifically, FB and GOOGL enjoy margins that are 500 basis points higher than the broad tech sector (Chart 8)! This is unsustainable and will likely serve as easy prey for policymakers. Our view does not necessarily call for breaking up these monopolies. The US will have to weigh the economic consequences of anti-trust policy in a context of multipolarity in which China’s national tech champions are emerging to compete with American companies for global market share. Nevertheless increased regulation is inevitable and some forced sales of crown jewel assets may take place. Moreover, the threat of a breakup will lurk in the background, creating uncertainty until key legislative and judicial battles have already been fought. That will take years. Finally, we doubt the tech sector will be left alone to “self-regulate” its incumbents and negotiate a price on consumers’ privacy. More likely, a new privacy law will loom overhead, serving as a negative catalyst for profit growth. Uncertainty will weigh on the S&P interactive media & services relative performance. Chart 8Regulation Will Squeeze Tech Margins
Regulation Will Squeeze Tech Margins
Regulation Will Squeeze Tech Margins
The ticker symbols to short/underweight the S&P interactive media & services index are an equally weighted basket of GOOGL and FB (they command a 98% market cap weight in the index). Theme #3: SaaS, Artificial Intelligence, Augmented Reality And Autonomous Driving Are Not Fads The third big theme that will even outlive the upcoming decade is the proliferation of software as a service (SaaS). The move to cloud computing and SaaS, the wider adoption of artificial intelligence, machine learning, autonomous driving and augmented reality are not fads, but enjoy a secular growth profile. In the grander scheme of things today’s world is surrounded by software. Millions of lines of code go even into gasoline powered automobiles, let alone electric vehicles. Autonomous driving is synonymous with software, the Internet of Things (IoT) needs software, the space race depends on software, modern manufacturing and software are closely intertwined, phone calls for quite some time have been a software solution, and the list goes on and on. This tidal effect is hard to reverse and is already embedded in workflows across industries. Opportunities to penetrate health care and financial services more deeply remain unexplored and it is difficult to envision another competing industry unseating “king software”. These secular trends are not only productivity enhancing, but will also most likely prove recession-proof. When growth is scarce investors flock to any source of growth they can come by and we are foreseeing that when the next recession arrives, investors will likely seek shelter in pure play SaaS firms. Investment Implication #6: Software Is Eating The World Buying software stocks for the long haul seems like a bulletproof investment idea. But the recent stellar performance of software stocks that has moved valuations to overshoot territory. Our recommended strategy is to buy or add software stock exposure on any weakness with a 10-year investment time horizon. All of these secular trends have pushed capital outlays on software into a structural uptrend. Software related capex is not only garnering a larger slice of the tech spending budgets but also of the overall capex pie. If it were not for software capex, the contraction in non-residential investment in recent quarters would have been more severe (Chart 9). Private sector software capex is near all-time highs as a share of total outlays. Government investment in software is also reaccelerating at the fastest pace since the tech bubble. When productivity gains are anemic, both the business and government sectors resort to software upgrades in order to boost productivity. Cyber security is another more recent source of software related demand as governments around the globe are taking such risks extremely seriously (bottom panel, Chart 9). Given this upbeat demand backdrop and ongoing equity retirement, software stocks are primed to grow into their pricey valuations. Chart 9Software Is Eating The World
Software Is Eating The World
Software Is Eating The World
Finally, this long-term trade will also serve as a hedge to the short/underweight position we recommend in the S&P interactive media & services index. The closest ETF ticker symbol resembling the S&P software index is IGV:US. Theme #4: Millennials Already Are The Largest Cohort And Will Dominate Spending The fourth long-term theme we anticipate will gain traction in the 2020s is the demographic rise of the Millennial generation. Much has been made of preparing for the arrival of the Millennial generation, accompanied by well-worn stereotypes of general "failure to launch" as they reach adulthood. However, "arrival" is a misnomer as this age cohort is already the largest and "failure" is simply untrue. According to the U.S. Census Bureau, Millennials are the US’s largest living generation. Millennials (or Echo Boomers) defined as people aged 18 to 37 (born 1982 to 2000), now number more than 80mn and represent more than one quarter of the US’s population. Baby Boomers (born 1946 to 1964) number about 75mn. Stealthily becoming the largest age group in the US over the last few years, Millennials per-year-birth-rate peaked at 4.3mn in 1990. Surprisingly, the pace matched that of the post-war Baby Boom peak-per-year-birth-rate in 1957 - the per-year average over the period was higher for the Baby Boomers (Chart 10). Chart 10Millennials Are The Largest Cohort
Millennials Are The Largest Cohort
Millennials Are The Largest Cohort
This gap is now set to grow rapidly as the death rate of Baby Boomers accelerates. What is more, the largest one-year age cohort is only 25 years old, thus, Millennials will be the dominant generation for many years. It is unclear how these “kids” will impact the market as they become the most important consumers, borrowers and investors, but make no mistake: this is a seismic shift in economic power and it is here to stay. The Echo Boom is a big, generational demographic wave. A difficult and painful delay has not tempered its looming importance. Finally, this wave of echo-boomers is educated, relatively unburdened by debt (please see BOX in the June 11, 2018 Special Report on demystifying the student debt load as it pertains to Millennials), and as they inevitably “grow up”, form new households and have kids. They will borrow, spend, earn, but not necessarily save and invest to the same extent as the Boomers. And this will be an important long-term theme going forward. Near term we might already be seeing signs of their arrival and firms have begun to pivot accordingly. Investment Implication #7: Buy The BCA Millennials Equity Basket Millennials will boost consumption spending in a number of different ways. The relatively unburdened Millennial cohort will be entering prime home acquisition age soon and this should underpin the long-term prospects of the US housing market and derivative industries. Further, Millennials consume differently from their parents; social media, online shopping and smart phones are not the consumption categories of the Baby Boomers. With this in mind, we have created a basket of ten stocks that we think will be driven over the long term by the demographic rise of the Millennial. We note that these stocks are heavily weighted to the technology and consumer discretionary sectors, which is logical as Millennial consumption habits tend to be discretionary focused and technology-based. Beginning with consumer discretionary, we are highlighting AMZN, NFLX and SPOT as core holdings in our Millennials basket. AMZN’s heft dwarfs consumer discretionary indexes but it could fall in several categories; the acquisition of Whole Foods makes it a Millennials-focused consumer staples retailer and its cloud computing web services segment is a tech leader. NFLX and SPOT represent the means by which Millennials consume media, by streaming movies and music over the internet. The idea of owning physical media is rapidly becoming an anachronism. The home ownership themes noted in the report above lead us to add HD and LEN to the basket. Millennials are “doers” and are set to be the dominant DIYers in the next few years, making HD a logical choice. LEN, as the nation’s largest home builder, should benefit from the Millennials coming of age into home buyers. We are also adding TSLA to our basket as a lone clean tech-oriented equity. TSLA capitalizes on the increasing shift to clean energy of Millennials (the key reason why no traditional energy companies have a spot in our basket). The technology stocks in our Millennials basket are AAPL, UBER (which replaces FB as of today) and MSFT, together representing more than 9% of the total value of the S&P 500. AAPL’s inclusion in the list is predictable as the leading domestic purveyor of devices on which Millennials consume media content. FB is a predictable holding, with more than half of all Americans being monthly active users, dominated by the Millennial cohort. It has served our basket well since inception, but today we are compelled to remove it and replace it with UBER. UBER is a Millennial favorite and the epitome of the sharing economy. In reality UBER is a logistics company and while it is losing money it is eerily reminiscent of AMZN in its early days. Maybe UBER will dominate all means of transportation and its ease of use will propel it to a mega cap in the coming decade. Our inclusion of MSFT is based on its leadership in cloud computing, a rapidly growing industry. We expect the connectivity and mobile computing demands of Millennials will accelerate. The last stock we are adding to our basket is also the only financial services equity. Though avid consumers, Millennials have shown an aversion to cash, preferring card payment systems, including both debit and credit-based. Accordingly, we are adding the leader in both of these, V, to our Millennials basket (Chart 11). Chart 11Buy BCA’s Millennial Equity Basket
Buy BCA’s Millennial Equity Basket
Buy BCA’s Millennial Equity Basket
Investors seeking long term exposure to stocks lifted by the supremacy of the Millennial generation should own our Millennial basket (AAPL, AMZN, UBER, HD, LEN, MSFT, NFLX, SPOT, TSLA, V). We would not hesitate to add other sharing economy stocks, including Airbnb, to this basket should they become investable in the near future. Theme #5: ESG Becomes Mainstream Investors are increasingly looking at allocating assets based on environmental, social, and governance (ESG) considerations, and this mini-theme has the potential to become a big trend in the 2020s. There are a number of factors that underpin ESG investing. First, Millennials are climate conscious and given that they already are the largest cohort in the US they will not only dominate spending, but also influence election results. Moreover, via social media Millennials can sway public opinion and participate in the ESG conversation. Second, ECB President Christine Lagarde recent speech to the Economic and Monetary Affairs Committee of the European Parliament is a must read.1 If the ECB were to explicitly focus on climate change policy as part of its monetary policy operations then this is a game changer. Green investment financing including “green bonds” could become mainstream. Keep in mind the as reported in the FT “the European Parliament has declared a climate emergency; the new European Commission (EC) has taken office on a promise of an imminent “green new deal”, and Commission president Ursula von der Leyen has vowed to accelerate emissions cuts.” Last Wednesday, the EC released “The European Green Deal” with a pretty aggressive time table. The EC president said “The green deal is Europe’s man on the moon moment” and presented 50 policies slated to get rolled by 2022 to meet revamped climate goals. The implication is that once ESG takes center stage at a number of these institutions it will be easier to become mainstream and propagate the world over. Third, large institutional investors are starting to adopt an ESG mindset, especially pension plans. These investors with trillions of dollars at their disposal can not only disfavor fossil fuel investment, but also undertake investments in “green projects” via private and public equity markets. Banks are also moving in the “greening of finance” direction and given that they are the pipelines of the global plumbing system, swift adoption will go a long way in taking ESG mainstream. Finally, the electric vehicle (EV) proliferation is another key driver on how the ESG theme will play out in the 2020s. As a reminder, in the US 50% of all energy consumption is gasoline related linked to automobiles. While battery technology still has limitations, EV is no longer a fad as the German and Japanese automakers are starting to make inroads on TSLA. These car manufacturers do not want to be left out, especially if this shift toward EV becomes mainstream in the 2020s. The Chinese are not far behind on the EV manufacturing front, however government policy can really become a game changer. If a number of countries and/or California mandate a large share of all new vehicles sold be EV, then the investment implications will be massive. Investment Implication #8: Avoid Fossil Fuels, Gambling, Alcohol And Tobacco… While there are a few ESG related ETFs, we would rather explore this theme’s investment implications of sectors to avoid in the coming decade. We are believers that ESG criteria will continue to gain in importance in institutional investment management decisions. Accordingly, we would tend to avoid ‘sin stocks’, including gambling, tobacco and alcohol; demand for their services is unlikely to decline but investment weightings should mean that share prices will underperform. Further, we think a clean energy shift will mean energy stocks will likely continue to be long-term underperformers (Chart 12). Chart 12Areas To Avoid As ESG Becomes Mainstream
Areas To Avoid As ESG Becomes Mainstream
Areas To Avoid As ESG Becomes Mainstream
Final Thoughts On The US Dollar In this report, we tried to focus on the upcoming decade’s big themes that we deem will play out, and centered recommendations on US equities/sectors. We do not want to neglect some macroeconomic variables that tend to mean revert over time. Specifically, the US dollar, interest rates and most importantly US indebtedness, will also be key drivers of investment theses in the 2020s. Currently, debt is rising faster than nominal GDP growth with the government and non-financial business debt-to-GDP profiles on an unsustainable path (second panel, Chart 13). Granted, the saving grace has been generationally low interest rates as the debt service ratios have fallen (top panel, Chart 13). However, if the four decade bull market in Treasury bonds is over, or may end definitively with the next US recession sometime in the early 2020s, then rising interest rates are the only mechanism to concentrate CEOs’ and politicians’ minds. On the dollar front, Chart 14 highlights the ebbs and flows of the trade-weighted US dollar since it floated in the early-1970s. The DXY index has moved in six-to-ten year bull and bear markets. The most recent trough was during the depths of the Great Recession, while the (tentative?) peak was in late-2016. If history repeats, eventually the dollar will mean revert lower in the 2020s, especially given the fiscal profligacy of the current administration that may continue into 2024, assuming President Trump gets re-elected next November. Chart 13Unsustainable Debt Profiles
Unsustainable Debt Profiles
Unsustainable Debt Profiles
Chart 14Greenback’s Historical Ebbs And Flows
Greenback’s Historical Ebbs And Flows
Greenback’s Historical Ebbs And Flows
The US dollar remains the reserve currency of the world today, but that exorbitant privilege is clearly fraying on the edges as the balance-of-payments dynamics are heading in the wrong direction. Over the next five years, the US Congressional Budget Office (CBO) estimates that the US budget deficit will swell to 4.8% of GDP. Assuming the current account deficit widens a bit then stabilizes (usually happens when global growth improves), this will pin the twin deficits at 8% of GDP. This assumes no recession, which would have the potential to swell the deficit even further. The US saw its twin deficits swell to almost 13% of GDP following the financial crisis, but the difference then was that in the wake of the commodity boom the dollar was cheap (and commodity currencies overvalued). The subsequent shale revolution also greatly cushioned the US trade deficit. Shale productivity remains robust and US output will continue to rise, but the low-hanging fruit has already been plucked. Another dollar-negative force is its expensiveness. By rising 35% since its trough, the USD has sapped the competitiveness of the US manufacturing sector, which is accentuating the American trade deficit outside of the commodity sector. If the ESG trend ends up hurting oil prices, the US current account will follow the widening deficit in manufactured products. Moreover, the US is lagging Europe on the green revolution. Either the US will have to import green technologies, or the US government will have to provide more subsidies to the private sector. Either way, both of these dynamics will hurt the US current account deficit further. Historically, the currency market is the main vehicle to correct such imbalances. Chart 15Twin Deficits Will Weigh On The US Dollar
Twin Deficits Will Weigh On The US Dollar
Twin Deficits Will Weigh On The US Dollar
The apex of globalization will also hurt the greenback. In a world where all the markets are integrated, borrowers in EM nations often use the reserve currency to issue liabilities at a lower cost. This boosts the demand by EM central banks for US dollar reserves to protect domestic banking systems funded in USD. Moreover, some countries like China implement pegs (both official and unofficial) to the US dollar in order to maintain their competitiveness and export their production surpluses to the US. To do so they buy US assets. If the global economy becomes more fragmented and the Sino-US relationship continues to deteriorate structurally as we expect, then these sources of demand for the dollar will recede. Overlay the widening US current account deficit, and you have the perfect recipe for a depreciating trade-weighted US dollar. Finally, the US is likely to experience more inflation than the rest of the world following the next recession. The US economy has a smaller capital stock as a share of GDP than Europe or Japan, and American demographics are much more robust. This means that the neutral rate of interest is higher in the US than in other advanced economies. As a result, the Fed will have an easier time generating inflation by cutting real rates than both the ECB and the BoJ. Higher inflation will ultimately erode the purchasing power of the dollar and prove to be a structurally negative force for the USD. Anastasios Avgeriou US Equity Strategist anastasios@bcaresearch.com Matt Gertken Geopolitical Strategist mattg@bcaresearch.com Marko Papic Chief Strategist, Clocktower Group marko@clocktowergroup.com Chester Ntonifor Foreign Exchange Strategist chestern@bcaresearch.com Mathieu Savary The Bank Credit Analyst mathieu@bcaresearch.com References Please click on the links below to view reports: Peak Margins - October 7, 2019 The Polybius Solution - July 5, 2019 War! What Is It Good For? Global Defense Stocks! - October 31, 2018 The Dollar: Will The U.S. Invoke A "Nuclear" Option? - August 30, 2018 Is The Stock Rally Long In The FAANG? - August 1, 2018 Millennials Are Not Coming Of Age; They Are Already Here - June 11, 2018 Brothers In Arms - October 31, 2016 The End Of The Anglo-Saxon Economy? - April 13, 2016 Apex of Globalization - November 12, 2014 Footnotes 1 https://www.imf.org/en/News/Articles/2019/09/04/sp090419-Opening-Statement-by-Christine-Lagarde-to-ECON-Committee-of-European-Parliament
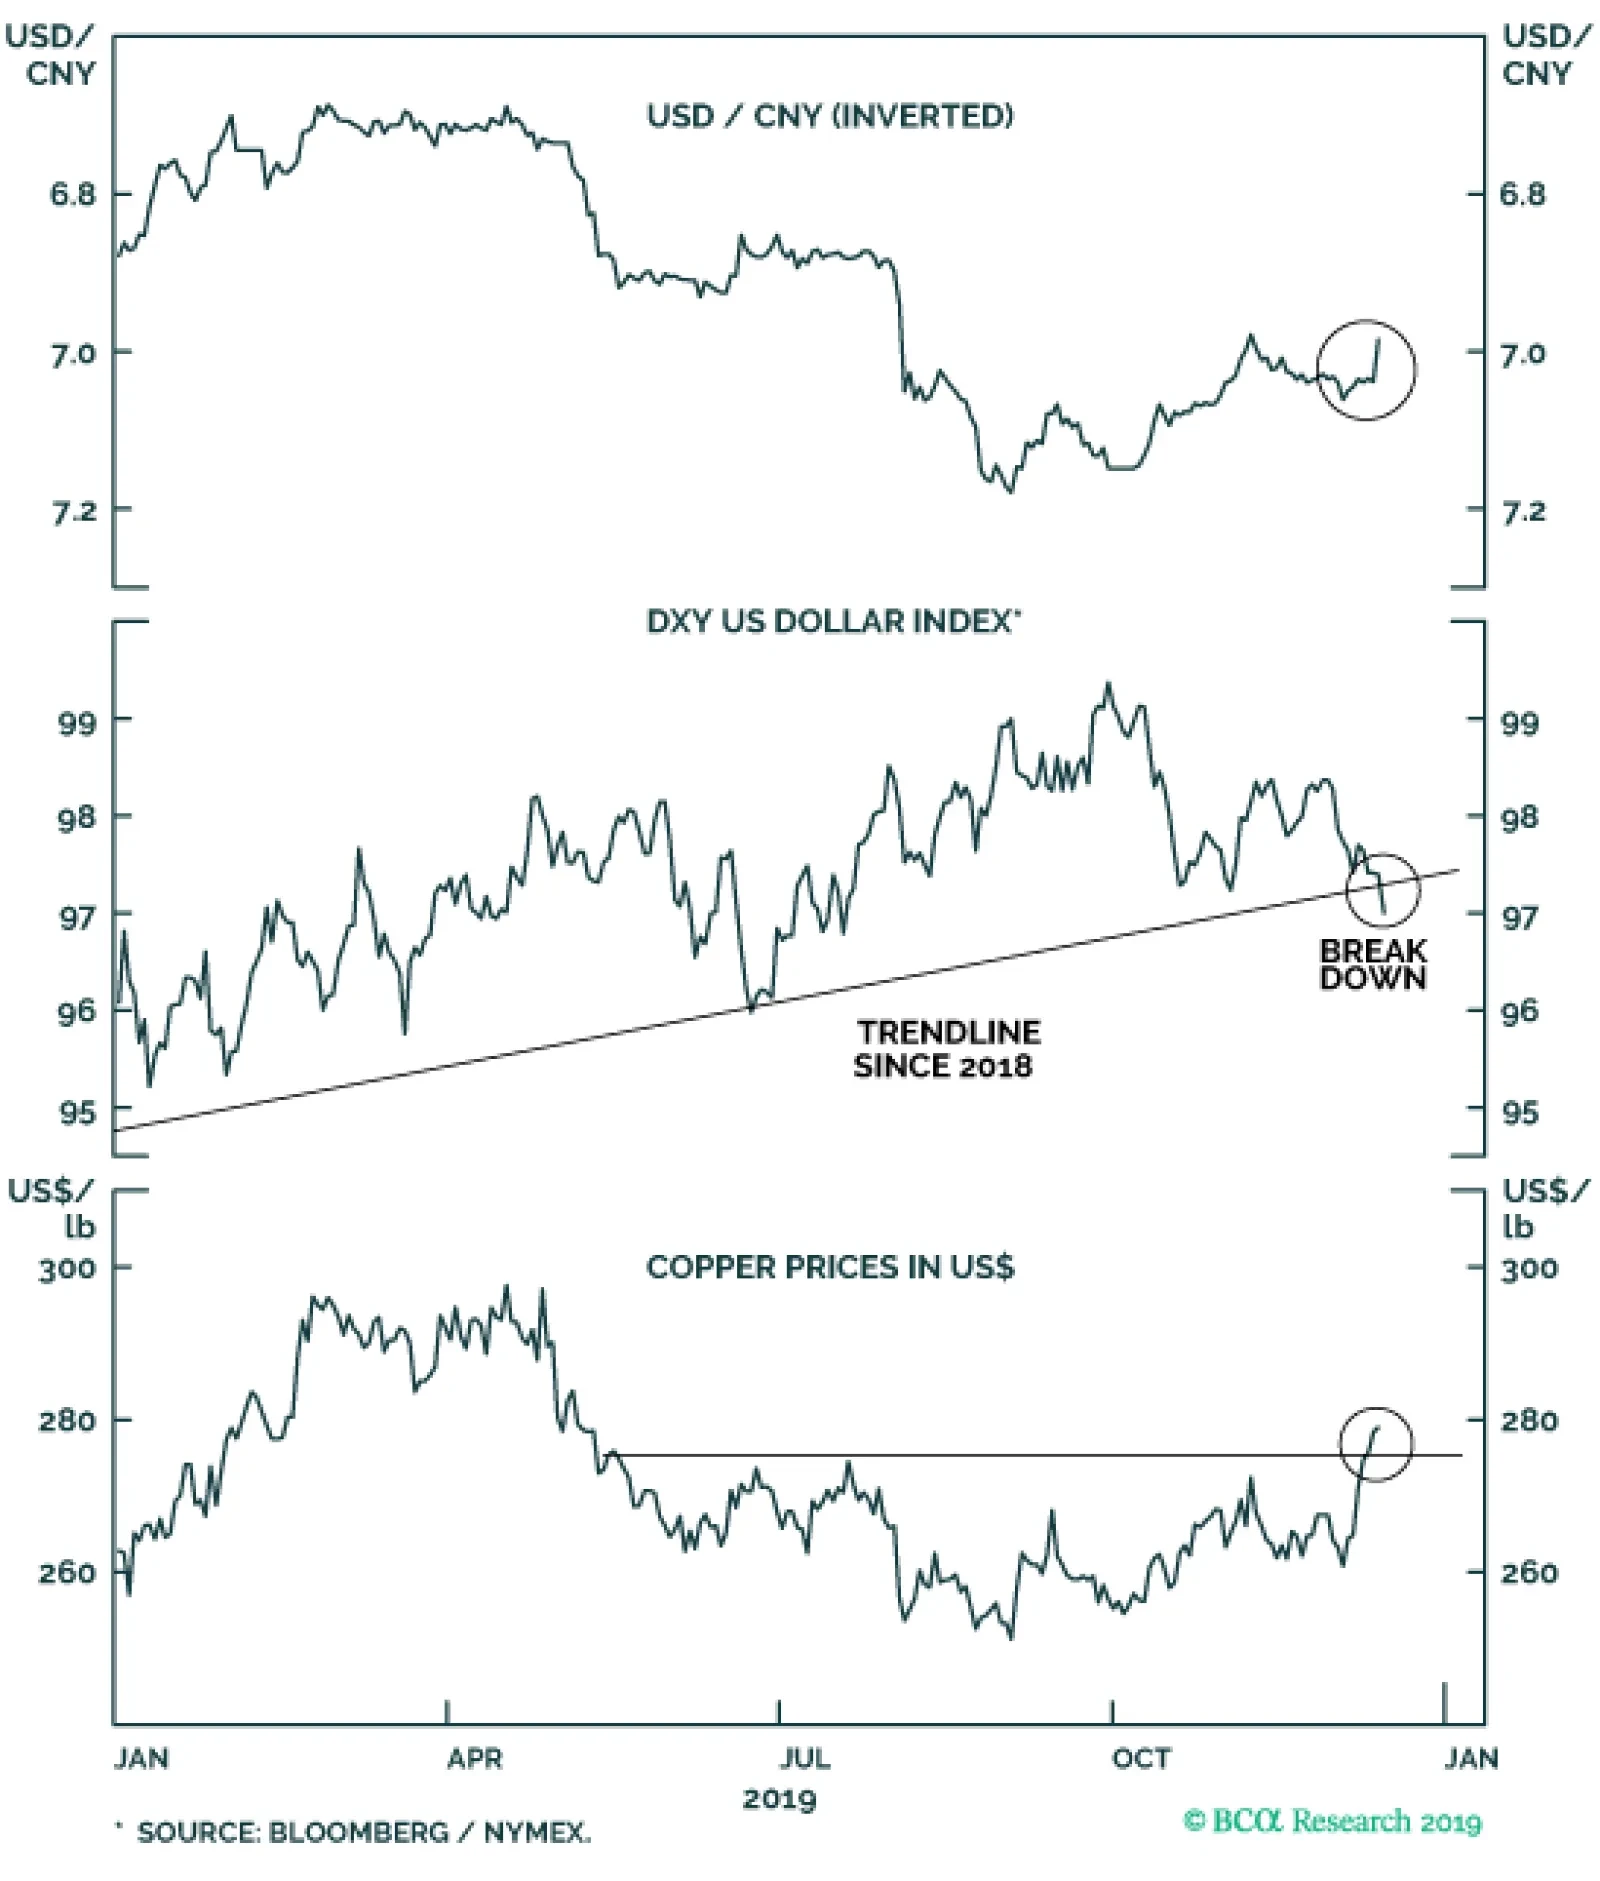
Details of the deal have still not been fully clarified in a consistent fashion by both sides; but one thing is clear, no further tariffs are forthcoming next year as long as China abides by its agricultural purchases. The main benefit of this news is that a…
Highlights Go short the DXY index with a target of 90 and a stop loss of 100. The top-performing G10 currencies in 2020 will be the NOK and SEK. Remain short USD/JPY as portfolio insurance. USD/JPY and the DXY are usually positively correlated. A weak dollar will lend support to gold prices. Gold will also benefit from abundant liquidity and persistently low/negative real rates. EUR/USD should touch 1.18, while GBP/USD will retest 1.40. There are abundant trade opportunities at the crosses. Our favorites are long AUD/NZD and short CAD/NOK. Feature The DXY index has been trading on the weaker side in recent months and is breaking below the upward-sloped channel in place since the middle of last year. In a nutshell, the performance of the dollar DXY index has been unimpressive for this year (Chart 1). The decisive break down represents an important fundamental shift, since the next level of support lies all the way towards the 90-92 zone. Given additional confirmation from a few of our indicators in recent weeks, we are selling the DXY at current levels, with a tight stop at 100. Chart 1A Report Card On Currency Performance
2020 Key Views: Top Trade Ideas
2020 Key Views: Top Trade Ideas
Green Shoots On Global Growth Frequent readers of our bulletin are well aware of the observation that the dollar is a countercyclical currency. As such, when global growth is rebounding, more cyclical economies benefit most from this growth dividend. This tends to weaken the dollar. Recent data confirms that this trend remains firmly intact. We expect continued improvement in both the ISM and global manufacturing PMI, but for now, the message is that the epicenter of the growth recovery is from outside the US. Chart 2Major Dollar Tailwinds Have Peaked
Major Dollar Tailwinds Have Peaked
Major Dollar Tailwinds Have Peaked
We expect continued improvement in both the ISM and global manufacturing PMI, but for now, the message is that the epicenter of the growth recovery is from outside the US (Chart 2). This has typically been synonymous with a lower dollar. In the euro area, the expectations components of the ZEW and Sentix surveys continue to outpace current conditions, which tends to lead European PMIs by about six months. It is becoming more and more evident that we will be out of a manufacturing recession in the euro area early next year (Chart 3). Chinese imports surprised to the upside for the month of November, in line with the message from easing in financial conditions (Chart 4). Should stimulus continue to be frontloaded into next year, this should continue to support global growth. The perk-up in copper prices is a good confirmatory signal. Chart 3A V-Shaped Recovery In European Manufacturing
A V-Shaped Recovery In European Manufacturing?
A V-Shaped Recovery In European Manufacturing?
Chart 4Chinese Growth Will Benefit From Stimulus
Chinese Imports Could Soon Rebound
Chinese Imports Could Soon Rebound
Japanese GDP saw a big upward revision for the third quarter, and a few leading indicators suggest nascent green shoots despite the October consumption tax hike. A new fiscal package was announced recently and should go a long way in boosting domestic demand (Chart 5). Chart 5Japanese Growth
The Story Of Japan In One Chart
The Story Of Japan In One Chart
Chart 6USD/SEK Has Peaked
USD/SEK Has Peaked
USD/SEK Has Peaked
The currencies of small, open economies such as the SEK and the NZD have started to stage meaningful reversals. These currencies are usually good at sensing shifts in the investment landscape, and our suspicion is that they were primary funding vehicles for long USD trades (Chart 6). The slowdown in the global economy has been driven by the manufacturing sector, so it is fair to assume that this is the part of the economy that is ripe for mean reversion. Not to mention, cyclical swings in most economies tend to be driven by manufacturing and exports rather than services. More specifically, the currencies that have borne the brunt of the manufacturing slowdown should also experience the quickest reversals. This is already being manifested in a very steep rise in their bond yields vis-à-vis those in the US (Chart 7A and 7B). For example, yields in Norway, Sweden, Switzerland and Japan have risen significantly versus those in the US since the bottom. Should the nascent pickup in global growth morph into a synchronized recovery, this will go a long way in further eroding the US’s yield advantage. Chart 7AInterest Differentials And Exchange Rates
Interest Differentials And Exchange Rates
Interest Differentials And Exchange Rates
Chart 7BInterest Differentials And Exchange Rates
Interest Differentials And Exchange Rates
Interest Differentials And Exchange Rates
The key risk to a bearish dollar view is a US-led global growth rebound, allowing the Federal Reserve to adopt a much more hawkish stance relative to other central banks. This would be an environment in which US inflation would also surprise to the upside. This is not our baseline view, especially following the dovish revisions of the Summary of Economic projections made by the Fed this week. Bottom Line: Given further confirmation from a swath of indicators, we are going short the DXY index at current levels with an initial target of 90 and a stop loss at 100. Go Long SEK Our highest-conviction views on currencies are being long the NOK and SEK. Our highest-conviction views on currencies are being long the NOK and SEK. This view has been in place for a few months via other crosses, but we are taking the leap today in putting these positions on versus the dollar. Less aggressive investors can still stick to NOK and SEK trades as the crosses. Chart 8Soft Data Is Much Worse
Soft Data Is Much Worse
Soft Data Is Much Worse
Of all the G10 currencies we follow, the Swedish krona is probably the most perplexing. The Riksbank is one of the few central banks to have raised rates this year, but the krona remains the weakest G10 currency. Admittedly, the performance of the Swedish manufacturing sector has been dismal, especially so in October (Chart 8). That said, the euro area, which has also experienced a deep manufacturing recession, has seen a better currency performance this year despite a more dovish European Central Bank. The big question for Sweden is whether the manufacturing sector is just in a volatile bottoming process, or about to contract much further. Domestically, retail sales were strong for the month of October and inflation is surprising to the upside. Exchange rates tend to be extremely fluid in discounting a wide swath of economic data, and in the case of Sweden, in discounting the outcome for global growth. This suggests that the quick reversals in the EUR/SEK and USD/SEK – from levels close to or above their 2008 highs – means that it will take anything but a deep recession to justify a weaker krona. Bottom Line: In terms of SEK trading strategy, short USD/SEK and short NZD/SEK are good bets, since the SEK has a higher beta to global growth than the US dollar and the kiwi (Sweden exports 45% of its GDP versus 27% for New Zealand). However, an additional trade suggestion is to go short EUR/SEK for Europe-centric investors. Go Long NOK As Well Chart 9Opportunity Or Regime Shift?
Opportunity Or Regime Shift?
Opportunity Or Regime Shift?
Since the middle of the last decade, another perplexing disconnect has been the divergence between the price of oil and the performance of petrocurrencies. From the 2016 bottom, oil prices have more than doubled, but the petrocurrency basket has massively underperformed versus the US dollar (Chart 9). We agree with our commodity strategists that the outlook for oil prices is to the upside. Oil demand tends to follow the ebbs and flows of the business cycle, with demand having slowed sharply on the back of a manufacturing recession. Transport constitutes the largest share of global petroleum demand. A manufacturing pickup will therefore boost oil demand. Rising oil prices are bullish for petrocurrencies but being long versus the US dollar is no longer an appropriate strategy. This is because the landscape for oil production is rapidly shifting, with the US shale revolution grabbing market share from both OPEC and non-OPEC members. In 2010, only about 6% of global crude output came from the US. Fast forward to today and the US produces almost 15% of global crude, having grabbed market share from many other countries. In short, as the now-largest oil producer in the world, the US dollar is itself becoming a petrocurrency (Chart 10). Chart 10US Has Grabbed Oil Production Market Share
US Has Grabbed Oil Production Market Share
US Has Grabbed Oil Production Market Share
Chart 11Buy Oil Producers Versus Oil Consumers
Buy Oil Producers Versus Oil Consumers
Buy Oil Producers Versus Oil Consumers
The strategy going forward will be twofold. First, buying a petrocurrency basket versus the dollar will require perfect timing in the dollar down leg. The second strategy is to be long a basket of oil producers versus oil consumers. Chart 11 shows that a currency basket of oil producers versus consumers has had both a strong positive correlation with the oil price and has outperformed a traditional petrocurrency basket. Our recommendation is that NOK long positions should be played both via selling the CAD and USD (Chart 12). The discount between Western Canadian Select crude oil and Brent has also widened, which has historically heralded a lower CAD/NOK exchange rate (Chart 13). We are also long the NOK/SEK, given our belief that interest rate differentials and momentum will favor this cross over the next three months. Chart 12CAD/NOK And DXY
CAD/NOK And DXY
CAD/NOK And DXY
Chart 13NOK Will Outperform CAD
NOK Will Outperform CAD
NOK Will Outperform CAD
Bottom Line: Remain short CAD/NOK for a trade, but more aggressive investors should begin accumulating long NOK positions versus the US dollar outright. The Yen As Portfolio Insurance Chart 14Short USD/JPY: A Contrarian Bet
Short USD/JPY: A Contrarian Bet
Short USD/JPY: A Contrarian Bet
The yen tends to underperform at the crosses as global growth rebounds but still outperform versus the dollar, at least, until the Bank of Japan is forced to act (Chart 14). This places short USD/JPY bets in an enviable “heads I win, tails I do not lose too much,” position. Economic data from Japan over the past few weeks suggests the economy is weakening, but not fully succumbing to pressures of weak external growth and the consumption tax hike. The labor market remains relatively tight, and Tokyo office vacancies are hitting post-crisis lows, suggesting the demand for labor remains tight. The final print of third-quarter GDP growth rose to 1.8%. Wages are inflecting higher as well. The new fiscal spending package is likely to lend support to these trends. What these developments suggest is that the BoJ is likely to stand pat in the interim, a course of action that will eventually reignite deflationary pressures in Japan (Chart 15). A return towards falling prices will eventually force the BoJ’s hand, but might see a knee-jerk rise in the yen before. Total annual asset purchases by the BoJ are currently a far cry from the central bank’s soft target of ¥80 trillion, and unlikely to change anytime soon (Chart 16). Chart 15What More Could The BoJ Do?
What More Could The BoJ Do?
What More Could The BoJ Do?
Chart 16Stealth Tapering By The BoJ
Stealth Tapering By The BoJ
Stealth Tapering By The BoJ
It is important to remember why deflation is so pervasive in Japan, making the BoJ’s target of 2% a bit of a pipedream if it stands pat. The overarching theme for prices in Japan is a rapidly falling (and rapidly ageing) population, leading to deficient demand (Chart 17). Meanwhile, domestically, an aging population (that tends to be the growing voting base), prefers falling prices. What is needed is to convince the younger population to save less and consume more, but that is difficult when high debt levels lead to insecurity about the social safety net. On the other side of the coin, the importance of financial stability to the credit intermediation process has been a recurring theme among Japanese policymakers, with the health of the banking sector an important pillar. YCC and negative interest rates have been anathema for Japanese net interest margins and share prices (Chart 18). Any policy shift that is increasingly negative for banks could easily tip them over. This suggests the shock needed for the BoJ to act may be greater than history. Chart 172% Inflation = Mission Impossible?
2% Inflation = Mission Impossible?
2% Inflation = Mission Impossible?
Chart 18Negative Rates Are Anathema To Banks
Negative Rates Are Anathema To Banks
Negative Rates Are Anathema To Banks
We believe global growth is bottoming, but the traditional yen/equity correlation can also shift. Inflows into Japan could accelerate, given cheap equity valuations and improved corporate governance that has been lifting the relative return on capital. The propensity of investors to hedge these purchases will be less if the dollar is in a broad-based decline. Bottom Line: An external shock could tip the Japanese economy back into deflation. The risk is that if the dollar falls, the yen remains flat to lower in the interim. Given cheap valuations and a lack of ammunition by the BoJ, our view is that it is a low cost for portfolio insurance. EUR/USD As The Anti-Dollar Our near-term target for EUR/USD is 1.18. This level will retest the downward sloping trendline in place since the Great Financial Crisis (Chart 19). Chart 20 plots the relative growth performance of the euro area versus the US, superimposed with the exchange rate. The result is very evident: The collapse in the euro since the financial crisis has been driven by falling growth differentials between the Eurozone and the US. There is little the central bank can do about deteriorating demographic trends, but it can at the margin stem falling productivity. One of its levers is to lower the cost of capital in the entire Eurozone, such that it makes sense even for the less productive peripheral countries to borrow and invest. Chart 19EUR/USD
EUR/USD
EUR/USD
Chart 20Structural Slowdown In European Growth
Structural Slowdown In European Growth
Structural Slowdown In European Growth
Importantly, yields across the periphery are rapidly converging towards those in Germany, solving a critical dilemma that has long plagued the Eurozone in general and the euro in particular. In simple terms, ECB policy has historically always been too easy for some member countries while too stimulative for others. This has traditionally led to internal friction for the currency. However, with 10-year government bond yields in France, Spain and even Portugal now close to the neutral rate of interest for the entire Eurozone, this dilemma is slowly fading. Labor market reforms in Mediterranean Europe have seen unit labor costs in Greece, Ireland, Portugal and Spain collectively contract by almost 10%. This has effectively eliminated the competitiveness gap that had accumulated over the past two decades. Italy remains saddled with a rigid and less productive workforce, but overall adjustments have still come a long way to closing a key fissure plaguing the common currency area. Earnings estimates for euro zone equities versus the US are rising. This tends to firmly lead the euro by about nine to 12 months, suggesting we are due for a pop in the coming quarters. Chart 21Relative R-Star* In The Eurozone Could Rebound
Relative R-Star* In The Eurozone Could Rebound
Relative R-Star* In The Eurozone Could Rebound
The bottom line is that the various forces that may have been keeping the neutral rate of interest artificially low in the euro area are ebbing. The proverbial saying is that a chain is only as strong as its weakest link. This means that if the forces pressuring equilibrium rates in the periphery are slowly dissipating, this should lift the neutral rate of interest in the entire euro zone. Over a cyclical horizon, this should be bullish for the euro (Chart 21). Bottom Line: European equities, especially those in the periphery, remain unloved, given they are trading at some of the cheapest cyclically adjusted price-to-earnings multiples in the developed world. Earnings estimates for euro zone equities versus the US are rising. This tends to firmly lead the euro by about nine to 12 months, suggesting we are due for a pop in the coming quarters (Chart 22). Chart 22The Euro Might Soon Pop
The Euro Might Soon Pop
The Euro Might Soon Pop
Concluding Thoughts Being long Treasurys and the dollar has been a consensus trade for many years now (Chart 23). According to CFTC data, this has been expressed mostly through the aussie and kiwi, although our bias is that the Swedish krona and Norwegian krone have been the real victims. Chart 23Unfavorable Dollar Technicals
Unfavorable Dollar Technicals
Unfavorable Dollar Technicals
Chart 24The US Dollar Is Overvalued
The US Dollar Is Overvalued
The US Dollar Is Overvalued
Various models have shown valuation to be a very poor tool for managing currencies, but an excellent one at extremes (Chart 24). The results show the US dollar as overvalued, especially versus the Swedish krona, Japanese yen and Norwegian krone. Commodity currencies are closer to fair value, and within the safe-haven complex the Japanese yen is more attractive than the Swiss franc. The euro is less undervalued than implied by the overvaluation in the DXY index. Finally, we are keeping our long GBP/JPY position for now, but with a new target of 155, and tightening the stop to 145 (near our initial target). Inflows into the UK should improve given more clarity from the political overhang, which can lead to an overshoot in the cross. Reviving global growth will also benefit inflows into sterling assets. On a tactical basis however, EUR/GBP is ripe for mean revision given oversold conditions. Chester Ntonifor Foreign Exchange Strategist chestern@bcaresearch.com Forecast Summary Core Portfolio Tactical Trades Limit Orders Closed Trades