Policy
U.S. monetary conditions will continue to support asset prices and worldwide economic activity for the coming 18 months or so. The Fed will ease policy further and is a long way from tightening. We are still on track for three 25-basis-point rate cuts this…

Highlights The global manufacturing cycle is likely to bottom soon, and consumption and services remain robust. The risk of recession over the next 12 months is low. This suggests that equities will continue to outperform bonds. But the risks to this optimistic scenario are rising. A denting of consumer confidence and worsening of geopolitical tensions could hurt risk assets. We hedge this by overweighting cash. China remains reluctant for now to use aggressive monetary easing. Until it does, the less cyclical U.S. equity market should outperform. We may shift into EM and European equities when China ramps up stimulus and the manufacturing cycle clearly bottoms. To hedge against this upside risk, we go tactically overweight Financials, and reiterate our overweight on Industrials and neutral on Australia. Bond yields should continue their rebound. We recommend an underweight on duration and favor TIPS. Credit should outperform on the cyclical horizon, but high corporate debt is a risk – we recommend a neutral position. Recommendations
Quarterly Portfolio Outlook: Hedges All Around
Quarterly Portfolio Outlook: Hedges All Around
Feature Overview Hedges All Around This is a particularly uncertain time for the global economy – and so a tricky one for asset allocators. Will manufacturing activity bottom soon, or will it drag down the services sector and consumption with it? Will bond yields continue their strong rebound? Is the Fed done cutting rates? Will China now ramp up monetary stimulus? Will Iran escalate a confrontation with Saudi Arabia? What will President Trump tweet about next? This is the sort of environment in which portfolio construction comes into its own. We have our view on all these questions, but our level of conviction is somewhat lower than usual. The way for investors to react is to plan asset allocation in such a way that a portfolio is robust in all the most probable scenarios. We expect the global manufacturing cycle to bottom soon. The Global Leading Economic Indicator is already picking up, and the Global PMI shows some signs of bottoming (Chart 1). The shortest-term lead indicator, the Citigroup Economic Surprise Index, has recently jumped in every region except Europe (Chart 2). (See also What Our Clients Are Asking on page 7 for some more esoteric indicators of cycle bottoms.) The bottoming-out is due to easier financial conditions over the past nine months, a stabilization in Chinese growth, and simply time – the down-leg in manufacturing cycles typically last 18 months, and this one peaked in H1 2018. Chart 1First Signs Of Bottoming
First Signs Of Bottoming
First Signs Of Bottoming
Chart 2Surprisingly Strong Surprises
Surprisingly Strong Surprises
Surprisingly Strong Surprises
At the same time, government bond yields should have further to rise. The Fed may cut rates once more but, given the resilient U.S. economy, no more than that. This is less than the 59 basis points of cuts over the next 12 months priced in by the Fed Fund futures. The recent pick-up in economic surprises suggests that the 10-year U.S. Treasury yield should return at least to where it was six months ago, 2.3-2.4% (Chart 3). This might be delayed, however, if there is an increase in political tensions, for example a break-up of the U.S./China trade talks (Chart 4). Chart 3Long-Term Rates To Rebound Further...
Long-Term Rates To Rebound Further...
Long-Term Rates To Rebound Further...
Chart 4...But Geopolitical Tensions Remain A Risk
...But Geopolitical Tensions Remain A Risk
...But Geopolitical Tensions Remain A Risk
This implies that equities are likely to continue to outperform bonds over the next few quarters, and so we remain overweight global equities and underweight global bonds on the 12-month investment horizon. However, the risks to this rosy scenario are rising. We remain concerned about the inverted yield curve, which has accurately forecast every recession since World War II, usually about 18 months in advance (Chart 5). The 3-month/10-year curve inverted in the middle of this year. We also worry that the weakness in the manufacturing sector may dent consumer confidence. There are some signs of this in Europe and Japan – but none significant yet in the U.S. (Chart 6). Accordingly last month, as a hedge against an economic downturn, we went overweight cash, which we see as a more attractive hedge, from a risk/reward point-of-view, than bonds. Chart 5Can We Ignore The Message From The Yield Curve?
Can We Ignore The Message From The Yield Curve?
Can We Ignore The Message From The Yield Curve?
Chart 6Some Signs Of Weaker Consumer Confidence
Some Signs Of Weaker Consumer Confidence
Some Signs Of Weaker Consumer Confidence
We also remain overweight U.S. equities, which are lower-beta and have fewer structural headwinds than equities in other regions. However, we continue to look for an entry point into the more cyclical equity markets which would also be beneficiaries of bolder China stimulus. China’s monetary easing remains more tepid than in previous stimulus episodes. It has probably been enough to stabilize domestic activity (Chart 7) but not to trigger a rally in industrial commodity prices, EM assets, and euro area equities, as it did in 2016. A pick-up in global PMIs and signs of stronger Chinese credit growth would clearly help EM and Europe (Chart 8) but we need higher conviction that these things are indeed happening before making that move. In the meantime, we are hedging the upside risk by raising the global Financials sector tactically to overweight, since it would likely do well if euro area stocks started to outperform. Earlier this year, we raised the Industrials sector to overweight and Australian equities to neutral, also to hedge against the upside risk from more aggressive Chinese stimulus. Chart 7Chinese Stimulus Has Merely Stabilized Growth
Chinese Stimulus Has Merelyy Stabilized Growth
Chinese Stimulus Has Merelyy Stabilized Growth
Chart 8Europe And EM Are The Most Cyclical Markets
Europe And EM Are The Most Cyclical Markets
Europe And EM Are The Most Cyclical Markets
Chart 9Oil Price Spikes Often Precede Recessions
Oil Price Spikes Often Precede Recessions
Oil Price Spikes Often Precede Recessions
The biggest geopolitical risk to our sanguine scenario is the situation in the Middle East, after the attacks on Saudi oil refineries. Every recession in the past 50 years has been preceded by a 100% year-on-year spike in the crude oil price (though note that Brent would need to rise to over $100 a barrel by year-end, from $61 today, for that to eventuate (Chart 9)). A short-term oil shortage is not the problem since strategic reserves are ample. But the attack demonstrates the vulnerability of the Saudi installations. And a reprisal attack on Iran could lead it to block the Strait of Hormuz, through which more than 20% of global oil passes. We have an overweight on the Energy sector, partly as a hedge against these risks. BCA’s oil strategists expected Brent crude to rise to $70 this year, and average $74 in 2020, even before the recent attack. They argue that the risk premium in the oil price (the residual in Chart 10) is too low, given not only tensions with Iran, but also other potential supply disruptions in Iraq, Libya, Venezuela and elsewhere. Chart 10Is The Oil Risk Premium Too Low?
Quarterly Portfolio Outlook: Hedges All Around
Quarterly Portfolio Outlook: Hedges All Around
Garry Evans, Senior Vice President Chief Global Asset Allocation Strategist garry@bcaresearch.com What Our Clients Are Asking Which Leading Indicators Should Investors Watch To Time The Rebound In Global Growth? Chart 11Positive Signals For Global Growth
Is Eurozone Manufacturing Close To A Bottom? Positive Signals For Global Growth
Is Eurozone Manufacturing Close To A Bottom? Positive Signals For Global Growth
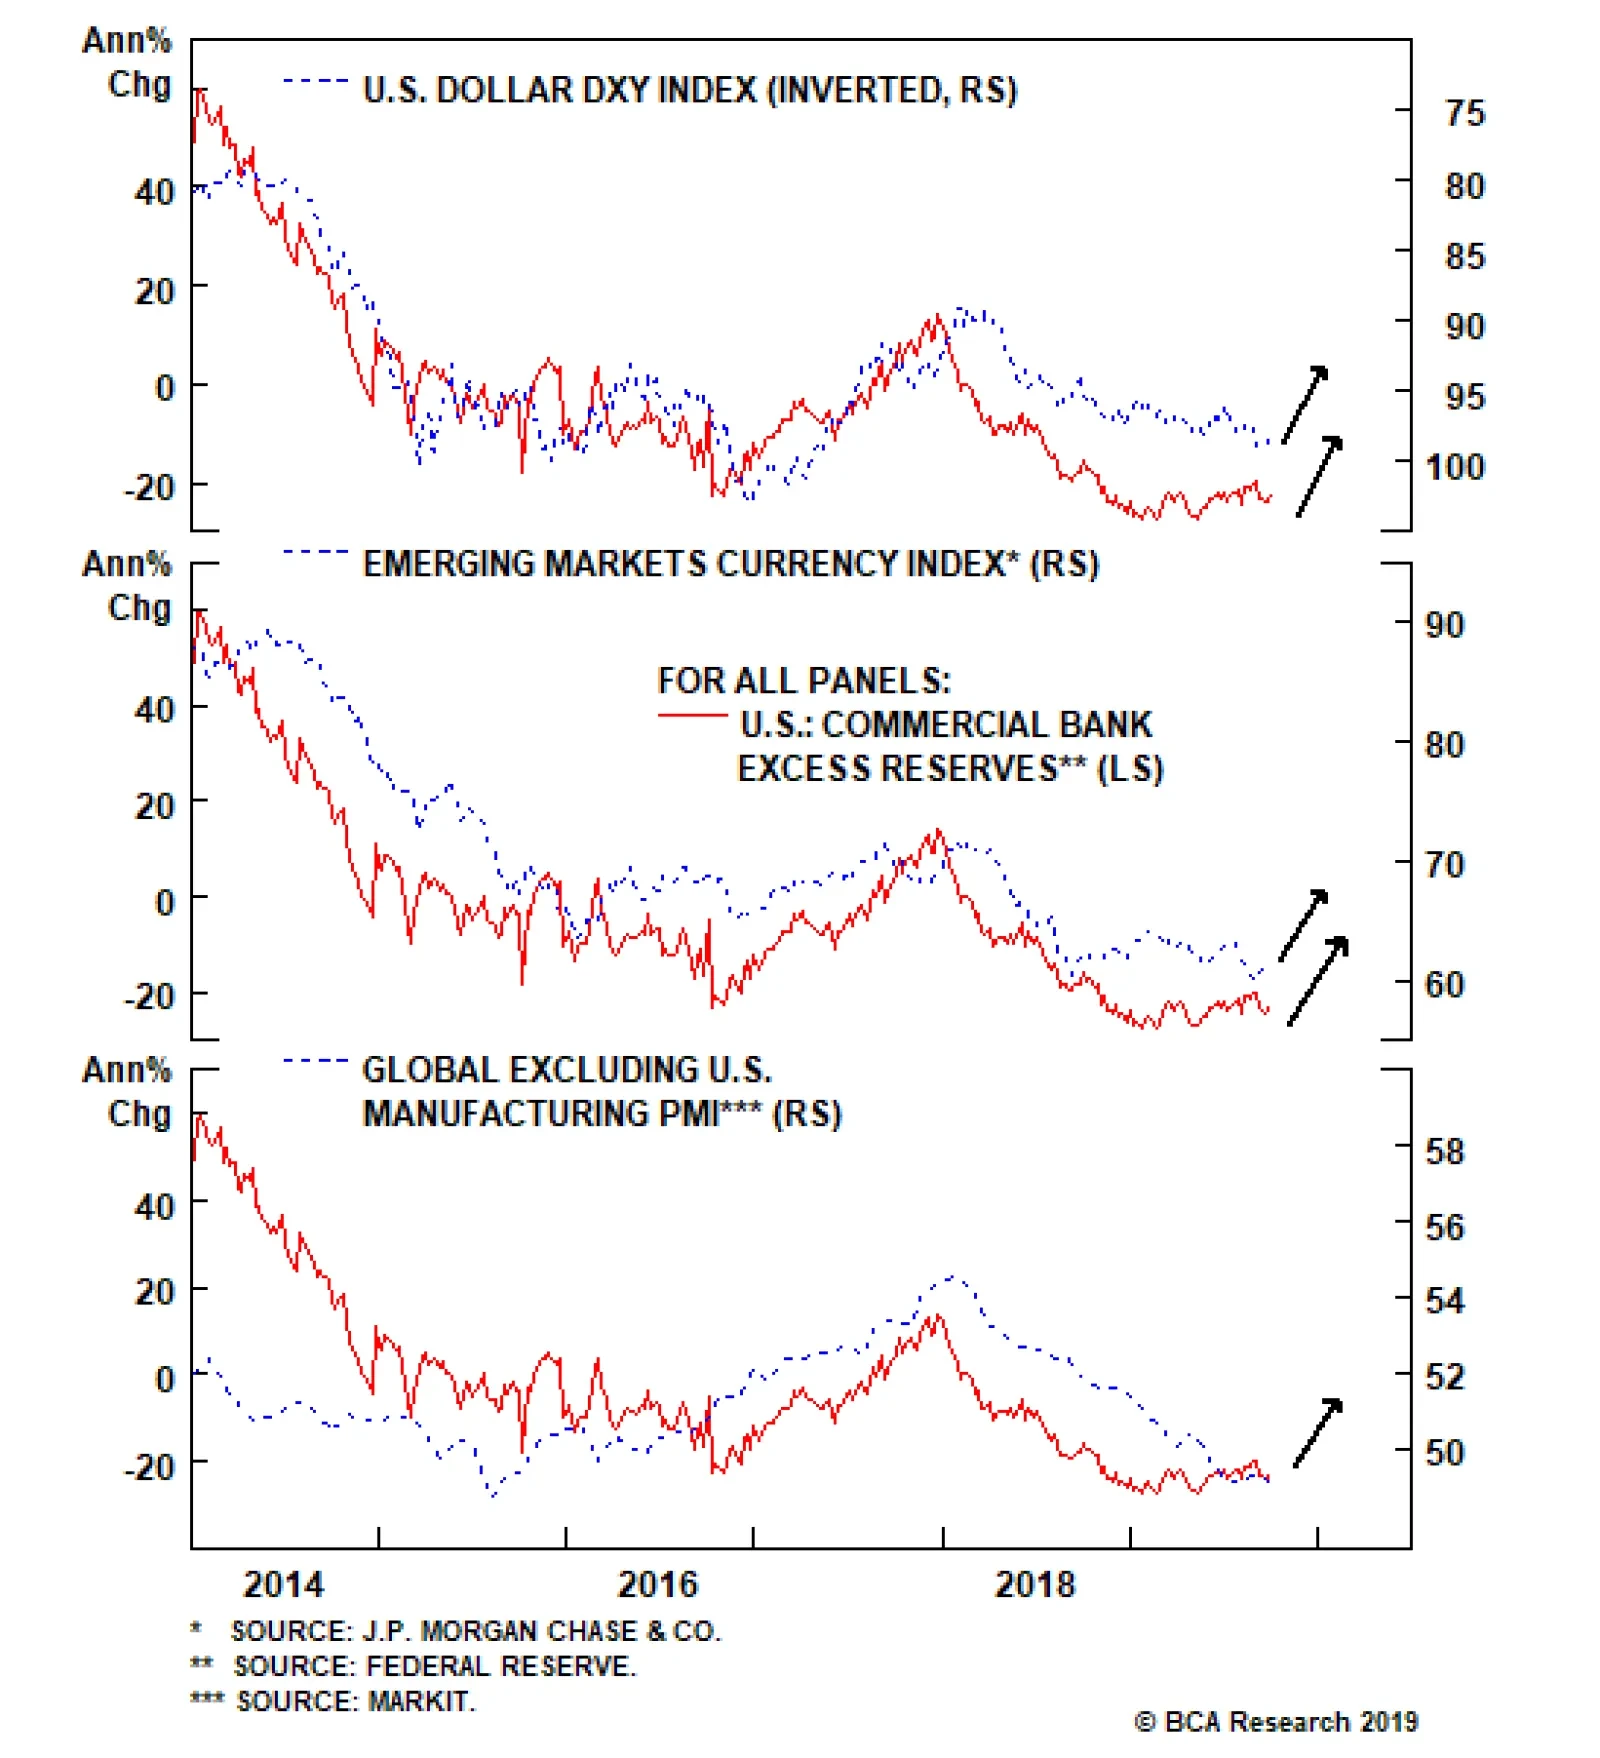
During 2019, the global growth decline was a key driver of the bond rally and the outperformance of defensive assets. Thus, timing when this decline will reverse will be crucial, since it would also result in a change of leadership from defensive to cyclical assets. But how can this be done? Below we list three of our favorite indicators that have provided reliable leading signals on the global economy in the past: Carry-trade performance: The performance of EM currencies with very high carry versus the yen tends to be a leading indicator for global growth (Chart 11, panel 1). In general, carry trades distribute liquidity from countries where funds are plentiful but rates of return are low (like Japan), to places with savings shortfalls and high risk, but where prospective returns are high. Positive performance of these currencies tends to signal a positive shift in global liquidity, which usually fuels global growth. Swedish inventory cycle: The Swedish new-orders-to-inventories ratio is a leading indicator of the global manufacturing cycle (panel 2). Why? Sweden is a small open economy that is very sensitive to global growth dynamics. Moreover, Swedish exports are weighted towards intermediate goods, which sit early in the global supply chain. This makes the Swedish inventory cycle a good early barometer of the health of the global manufacturing cycle. G3 monetary trends: G3 excess money supply – measured as the difference between money supply growth and loan growth – is a leading indicator of global industrial production (panel 3). As base money and deposits become more plentiful in the banking system relative to the pool of existing loans, the liquidity position of commercial banks improves. This provides banks with the necessary fuel to generate more loan growth, a development which eventually provides a boon to economic activity. Importantly, all these leading indicators are sending a positive signal on the global economy. This confirms our view that rates should go up as global growth strengthens. Therefore, investors should remain overweight equities and underweight bonds in their portfolios. Is It Time To Buy Euro Area Banks? In a Special Report on euro area banks in December 2018, we noted that “Historically, when the relative P/B discount hits the lower band and the relative dividend yield hits the upper band, a rebound in relative return performance could be expected”.1 Our recommendation back then was that “long-term investors should avoid banks in the region, but investors with a more tactical mandate and much nimbler style could use the valuation indicators to ‘time’ their entry into and exit out of banks as a short-term trade.” Since then, banks have continued to underperform the overall market by over 10%, further pushing down relative valuation metrics. Currently, both relative P/B and relative dividend yield are at extreme levels that have historically heralded at least a short-term bounce. The euro area PMI is still below 50, but there are signs that the euro area economy could rebound later this year, which should be positive for banks’ relative earnings. Already, forward EPS growth has been stabilizing relative to the broad market (Chart 12, panel 4). In addition, two of the key concerns back in December 2018 were Italian government debt and the unwinding of QE. Now Italian debt is no longer in crisis and the ECB has relaunched QE. As such, investors with a tactical mandate and a nimble style should buy (overweight) banks in the euro area. Long-term investors should still avoid such a short-term trade because structural issues remain. Chart 12Tactically Upgrade Euro Area Banks
Tactically Upgrade Euro Area Banks
Tactically Upgrade Euro Area Banks
Is The Gold Rally Over? Spot gold prices have increased 17% year-to-date, on the back of global growth weakness, dovish central banks, and rising political tensions. Should investors now pare back their gold exposure? Common sense would suggest they should. However, these are not ordinary times. In the short term, gold prices might suffer from some profit-taking due to overbought technicals and excessively positive sentiment (Chart 13, panel 1). Moreover, gold prices have moved this year due to increased market expectations of central bank easing (panel 2). We expect that markets will be disappointed going forward by only limited rate cuts, which could put downward pressure on gold. On the other hand, with approximately 27%, or $14.9 trillion, of global debt with negative yields at the moment, investors will continue to shift to the next best asset – zero-yielding gold (panel 3). This is clear from the rise in holdings of gold over the past few years by both central banks and investors (panels 4 & 5). We expect this trend to persist as investors continue their search to avoid negative yields and focus on capital preservation. Geopolitical tensions have intensified since the beginning of the year: ongoing yet inconclusive trade negotiations between the U.S. and China, implementation of further tariffs, Brexit uncertainty, and the recent military attacks in the Middle East (panel 6). This environment should also continue to push gold prices higher. We continue to recommend gold as a hedge against inflation – which we see picking up over the next 12 months – as well as against any further deterioration in global growth and the geopolitical situation. Chart 13Gold: Sell Or Hold?
Gold: Sell Or Hold?
Gold: Sell Or Hold?
Risks to the rosy scenario are rising. We remain concerned about the inverted yield curve, which has accurately forecast every recession since World War II. How Low Can Rates Go? The zero lower bound is a thing of the past. Last month, Denmark’s central bank cut rates to -0.75%, and 10-year government bonds in Switzerland hit a historic low for any major country, -1.12%. In the next recession, how much further could interest rates theoretically fall? For individuals, cash rates might be limited by the cost of storing paper currency, which has a zero yield (unless governments find a way to ban cash or charge an annual fee on it). A bank safety deposit box costs about $300 a year, and a professional-quality safe big enough to store $1 million (which would be a pile of $100 bills 31 x 55 cms, weighing 10 kg) costs $2,000 with installation costs. Amortize the latter over 10 years, and the cost of storing $1 million is about 0.2%-0.3% a year. Swiss franc bills – maximum denomination CHF1,000 – would cost less to store. But storage costs for physical gold are around 2% a year. Since rates have fallen below this, there must be other constraints. Individuals would find storing money in cash possibly dangerous and certainly very inconvenient (imagine having to transport the cash to a bank to pay a tax bill). And the cost for a rich individual or company of storing, say, $1 billion (weighing 10 tonnes) would be much higher. Given the history in even low-rate countries (Chart 14, panel 1), we suspect around -1% is the level at which cashholders would seek alternatives to bank deposits of government bills. Chart 14How Low Can They Go?
How Low Can They Go?
How Low Can They Go?
Chart 15Yield Curves When Rates Are At Zero Or Below
Yield Curves When Rates Are At Zero Or Below
Yield Curves When Rates Are At Zero Or Below
At the long end, the yield curve does not typically invert much when short-term rates are zero or negative (Chart 15). The biggest 3-month/10-year inversion was in Switzerland earlier this year, -0.05%. This points then to the absolute lowest level for 10-year bonds anywhere, even in the middle of a nasty recession, at around -1.1%. That is a worry for asset allocators. It means that the maximum mathematical upside for Swiss government bonds from their current level (-0.8%) is 3% while it is 5% for German bonds (currently -0.5%). This is not much of a hedge. Only the U.S. looks better: if the 10-year Treasury yield falls to 0%, the total return is 18%. Global Economy Chart 16U.S. Growth Remains Solid
U.S. Growth Remains Solid
U.S. Growth Remains Solid
Overview: Industrial-sector growth globally has been weak, with the manufacturing PMI in most countries falling below 50. But consumption and services almost everywhere have remained resilient, even in the manufacturing-heavy euro area. And there are tentative signs of a bottoming-out in manufacturing. However, a full-scale rebound will depend on further monetary stimulus in China, where the authorities still seem cautious about rolling out easing on the scale of what was done in 2016. U.S.: U.S. manufacturing has now followed the rest of the world into contraction, with the ISM manufacturing index slipping below 50 in August (Chart 16, panel 2). However, consumption and services are holding up well. Employment continues to expand (albeit at a slightly slower pace than last year, perhaps because of a lack of jobseekers), there is no sign of a rise in layoffs, and consumer confidence remains close to a historical high (though it slipped slightly in September). Housing has recovered after last year’s slowdown, and the recent congressional budgetary agreement means fiscal policy will be mildly expansionary over the coming 12 months. Only capex (panel 5) has slowed, as companies postpone investment decisions due to uncertainty surrounding the trade war. The consensus expects U.S. real GDP growth of 2.2% this year, above most estimates of trend growth. Euro Area: Given its higher concentration in manufacturing, European growth is weaker than in the U.S. The manufacturing PMI has been below 50 since February, and fell further to 45.6 in August. Industrial production is shrinking by 2% year-on-year. Italy has experienced two negative quarters of growth, and Germany may also enter a technical recession in Q3 (GDP shrank by 0.1% in Q2). However, there are some tentative signs that manufacturing is bottoming: the ZEW survey in September, for example, surprised on the upside. And, like the U.S., consumption remains strong. Even in manufacturing-heavy Germany, employment continues to grow, and retail sales in July were up 4.4% year-on-year. In the U.K., however, uncertainty surrounding Brexit has damaged business investment, though employment has been strong.2 Chart 17First Signs Of A Rebound In The Rest Of The World?
First Signs Of A Rebound In The Rest Of The World?
First Signs Of A Rebound In The Rest Of The World?
Japan: Consumption has already slipped, even before the consumption tax hike scheduled in October. Retail sales in July fell 2% year-on-year, due to negative wage growth and consumer sentiment falling to a five-year low. Manufacturing continues to suffer from China’s slowdown and the strong yen (up 6% over the past 12 months), with exports falling 6% and industrial production down 2% year-on-year over the past three months. The effect of the consumption tax hike may be cushioned by government measures (lowering taxes on autos and making high-school education free, for example). And a pickup in Chinese growth would boost exports. But there are scant signs yet of a bottoming in activity. Emerging Markets: China’s growth appears to have stabilized, with both manufacturing and non-manufacturing PMIs above 50 (Chart 17, panel 3). But confidence remains fragile, with retail sales growth slowing to a 20-year low and car sales down 7% in August, despite the introduction of cars compliant with new emissions standards. The authorities have responded with further easing measures (including a further cut in the reserve requirement in September) but seem reluctant to launch a full-scale monetary stimulus, similar to what they did in 2016. Elsewhere in EM, growth has slowed in countries with structural issues (latest year-on-year real GDP growth in Argentina is -5.7%, in Turkey -1.5% and in Mexico -0.8%) but remains fairly resilient elsewhere (India 5%, Indonesia 5%, Poland 4.2%, Colombia 3.4%). Interest Rates: Central banks almost everywhere have turned dovish, with the Fed cutting rates for a second time, the ECB restarting asset purchases, and the Bank of Japan signaling it will ease in October. But further monetary accommodation will probably be less than the market expects. The Fed signaled that its cuts were just a mid-cycle correction and that further easing is unlikely. And the ECB and BoJ have little ammunition left. With signs of growth bottoming, and the market understanding that central banks’ dovish turn is reaching its end, long-term rates, which have already risen in the U.S. from 1.45% to 1.72% in September, are likely to move higher. Investors should also carefully watch U.S. inflation, which is showing signs of underlying strength, with core CPI inflation rising 2.4% year-on-year in August (and as much as 3.4% annualized over the past three months). Global Equities Chart 18Has Earnings Growth Bottomed?
Has Earnings Growth Bottomed?
Has Earnings Growth Bottomed?
Still Cautious, But Adding An Upside Hedge: Global equities registered a small loss of 8 basis points in Q3 (Chart 18) despite all the headline risks from geopolitics and weakening economic data. Overall, our defensive country allocation worked well in Q3, since DM equities outperformed EM by 4.5%, and the U.S. outperformed the euro area by 2.8%. Our sector positioning did not do as well since underweights in Utilities and Consumer Staples and overweights in Industrials, Energy and Health Care all went in the wrong direction, even though the underweight in Materials did help to offset the loss. During the quarter, however, both sector and country rotations were evident within the global equity universe, in line with the wild swings in bond yields. September saw some reversals in DM/EM, U.S./euro area and cyclical/defensives. Going forward, BCA’s House View remains that global economic growth will begin to recover over the coming months, albeit a little later than we previously expected. As such, our defensive country allocation remains appropriate. We did put euro area and EM equities on upgrade watch in April,3 but the delay in the global recovery also implies that it is still not the time to trigger this call. With our view that bond yields have hit bottom,4 we are making one adjustment in our global sector allocation by upgrading Financials to overweight from neutral. We are financing this by cutting in half the double overweight in Health Care to overweight (see next page for more details). This adjustment also acts as a hedge against two possible outcomes: 1) that the euro area outperforms the U.S., and 2) that Elizabeth Warren wins in the upcoming U.S. presidential election.5 Upgrade Global Financials To Overweight From Neutral Chart 19Upgrade Global Financials
Upgrade Global Financials
Upgrade Global Financials
The relative performance of global Financials to the overall equity market has been hugely affected by the movements in global bond yields (Chart 19, panel 1). As bond yields made a sharp reversal in September, so did the relative performance of Financials, even though it is barely evident on the chart given how much Financials have underperformed the broad market over recent years. It’s not clear how sustainable the sharp reversal in bond yields will be, but BCA’s House View is that bond yields will move higher over the next 9-12 months. As such, we are upgrading Financials to overweight from neutral, for the following additional reasons: Valuations are extremely attractive as shown in panel 2. More importantly, the relative valuation is now at an extreme level that historically heralded a bounce in Financials’ relative performance. Loan quality has improved. The U.S. non-performing loan (NPL) ratio is nearing the lows reached before the Global Financial Crisis (GFC). Even in Spain and Italy, NPL ratios have fallen significantly, though they remain higher than they were prior to the GFC (panel 3). U.S. consumption has been strong, housing has rebounded, and demand for loans is getting stronger (panel 4), in line with data such as the Citi Economic Surprise Index, suggesting that economic data may have hit bottom. To finance this upgrade, we cut the double overweight of Health Care to overweight, as a hedge against Elizabeth Warren winning next year’s U.S. presidential election and tightening rules on drug pricing. Government Bonds Maintain Slight Underweight On Duration. Our below-benchmark duration call was severely challenged by the global bond markets in the first two months of the third quarter. The U.S. 10-year Treasury yield hit 1.43% on September 3 in response to the weaker-than-expected ISM manufacturing index in the U.S., 57 bps lower than the level at the end of previous quarter, and just a touch higher than the historical low of 1.32% reached on July 6, 2016. The rebound in bond yields since September 5, however, was driven not only by the ebb and flow in the U.S./China trade policy dynamics, but also by the positive surprises in economic data releases, as shown in Chart 20. BCA’s Global Duration Indicator, constructed by our Global Fixed Income Strategy team using various leading economic indicators, is also pointing to higher yields globally going forward. Investors should maintain a slight underweight on duration over the next 9-12 months. Favor Linkers Vs. Nominal Bonds. Global inflation expectations have also rebounded after continuing their downtrend in the first two months of the quarter. This largely reflects the acceleration in August in realized inflation measures such as core CPI, core PCE, and average hourly earnings. In addition, historically, the change in the crude oil price tends to have a good correlation with inflation expectations. The oil price jumped initially by 20% following the attack on the Saudi Arabian oil production facilities. While it’s not clear how the geopolitical tensions will evolve in the Middle East, a conservative assumption of a flat oil price until the end of the year still points to much higher inflation expectations, supporting our preference for inflation-linked bonds over nominal bonds. We also favor linkers in Japan and Australia over their respective nominal bonds (Chart 21). Chart 20Bond Yields Have Hit Bottom
Bond Yields Have Hit Bottom
Bond Yields Have Hit Bottom
Chart 21Favor Inflation Linkers
Favor Linkers
Favor Linkers
We continue to look for an entry point into more cyclical markets which would benefit from a bolder Chinese stimulus. Corporate Bonds Since we turned cyclically overweight on credit within a fixed-income portfolio, investment-grade bonds and high-yield bonds have produced 220 and 73 basis points, respectively, of excess return over duration-matched government bonds. We remain bullish on the outlook for credit over the next 12 months, as we expect global growth to accelerate before the end of the year. Historically, improving global growth has resulted in sustained outperformance of credit over government bonds. Moreover, default rates should remain subdued over the next year given that lending standards continue to ease (Chart 22, panel 1). How long will we remain overweight credit? High levels of leverage, declining interest coverage ratios, and the high share of Baa-rated debt in the U.S. corporate debt market continue to make credit a risky proposition on a structural basis. However, with inflation expectations still very low, the Fed has a strong incentive to keep monetary policy easy. This dovish monetary policy should keep interest costs at bay, helping credit outperform over the next year. That said, we believe that there are some credit categories that are more attractive than others. Specifically, we recommend investors favor Baa-rated and high yield securities, given that there is still room for further credit compression in these credit buckets (panel 2 and panel 3). On the other hand, investors should stay away from the highest credit categories, as they no longer offer value (panel 4). Chart 22Baa-rated And High-Yield Credit Offer The Most Value
Baa-rated And High-Yield Credit Offer The Most Value
Baa-rated And High-Yield Credit Offer The Most Value
Commodities Chart 23No Supply Shock In The Oil Market
Quarterly Portfolio Outlook: Hedges All Around
Quarterly Portfolio Outlook: Hedges All Around
Energy (Overweight): September’s drone attack on Saudi crude facilities sent oil prices soaring as much as 20% in the days following, before falling back to pre-attack levels. Initial estimates estimated the supply disruption at 5.7 million barrels a day – approximately 5.5% of global supply – making it the largest crude supply outage in history. However, assuming the Saudis can return 70% of the lost output back online as they claim, OPEC’s spare capacity, approximately 1.8 million barrels a day, should be able to balance the market and cover the remaining lost production.6,7 In the longer-term, a pick-up in global oil demand, as economic growth rebounds, plus supply tightness should keep oil price elevated, with Brent reaching $70 this year and averaging $74 in 2020 (Chart 23, panels 1 & 2). Industrial Metals (Neutral): A combination of half-hearted year-to-date stimulus by Chinese authorities and a stronger USD in the second and third quarters of 2019 have driven industrial metals spot prices lower. However, the Chinese government announced additional stimulus in September, with further bond issuance to finance infrastructure projects and an easing of monetary policy (panel 3). This should give some upside for industrial metal prices over the coming six-to-12 months. Precious Metals (Neutral): We remain positive on gold, despite its strong performance year-to-date, since we see it as a good hedge against recession, inflation, and geopolitical risks. We discuss gold in detail in the What Our Clients Are Asking section on page 9. Silver also looks attractive in the short term. The nature of the use of silver has changed over the past two decades, from being mostly a base metal for industrial fabrication to becoming more of a precious metal viewed as a safe haven. The correlation between gold and silver prices has increased since the Global Financial Crisis from an average of 0.5 pre-crisis to 0.8 post-crisis (panels 4 & 5). Global growth and political uncertainty should support silver prices in the coming months. Currencies U.S. Dollar: The trade-weighted dollar has appreciated by 2.5% since we turned neutral in April. We expect that the steep drop in yields will continue to ease financial conditions and help global growth in the last quarter of the year. Given that the dollar is a counter-cyclical currency, an environment where global growth rallies have historically been negative for the greenback. Euro: Since we turned bullish in April, EUR/USD has depreciated by 2.7%. Overall, we continue to be positive on EUR/USD on a cyclical timeframe. After the ECB cut rates by 10 basis points and announced further rounds of quantitative easing, there is not much room left for the euro area to keep easing relative to the U.S. (Chart 24, panel 1). Moreover, improving expectations of profit growth in the euro area vis-à-vis the U.S. will drive money flows towards Europe, pushing EUR/USD up in the process (panel 2). Emerging Market Currencies: We remain bearish on emerging market currencies for the time being. That being said, they remain on upgrade watch for the end of the year. There are multiple signs that global growth is turning up, a consequence of the easy financial conditions caused by some of the lowest bond yields on record. Moreover, the marginal propensity to spend (proxied by M1 growth relative to M2 growth) in China, the main engine of EM growth, continues to point to further appreciation in emerging market currencies (panel 3). Chart 24Interest Rate And Profit Expectation Differentials Favor The Euro
The Euro Might Soon Pop Interest Rate And Profit Expectations Differentials Favor The Euro
The Euro Might Soon Pop Interest Rate And Profit Expectations Differentials Favor The Euro
Alternatives Chart 25Favor Hedge Funds Untill Global Growth Bottoms
Favor Hedge Funds Untill Global Growth Bottoms
Favor Hedge Funds Untill Global Growth Bottoms
Return Enhancers: Over the past 12 months, we have recommended investors pare back on private equity and increase allocations to hedge funds – macro hedge funds in particular. This was due to our judgement that we are late in the economic cycle. While we expect growth to pick up over the coming months, this is not yet clear in the data (Chart 25, panel 1). This uncertain macro outlook will prove tough for private equity funds, especially given an environment of rising multiples and increasing competition for deals. We continue to see global macro hedge funds as the best hedge ahead of the next recession and would advise investors to allocate funds now, given the time it takes to move allocations in the illiquid space. Inflation Hedges: In the current environment, TIPS are likely a better inflation hedge than illiquid alternative assets. Our May 2019 Special Report 8 showed that TIPS produce a particularly attractive risk-adjusted return during times when inflation is rising, but still fairly low (below 2.3%). TIPS should do well, therefore, in the environment we expect over the next few months, where the Fed remains dovish, cutting rates perhaps once more, while condoning a moderate acceleration of inflation (panel 2). Volatility Dampeners: Structured products – mostly Mortgage-Backed Securities (MBS) – have had an excellent record of reducing portfolio volatility (panel 3). Despite that, we do not recommend more than a neutral allocation to MBS currently due to a less-than-attractive valuation picture. Despite Treasury yields falling by more than 100 basis points this year and refinancing activity picking up, nominal MBS spreads remained near their all-time lows. However, as Treasury yields bottom, we expect refinancing to slow, putting downward pressure on spreads. Risks To Our View The most likely upside risk comes from the Fed being too dovish and falling behind the curve. Underlying inflation pressures in the U.S. remain strong (with core CPI up 3.4% annualized over the past three months). After two rate cuts, the Fed Funds rate is now comfortably below the neutral rate: 0.1% in real terms compared to a Laubach-Williams r* of 0.8% (Chart 26). Tightness in the money markets have pushed the Fed to start expanding its balance sheet again. If manufacturing growth accelerates next year, and wages and profits begin to rise, a stock market melt-up, similar to that in 1999, would be possible. Eventually, though, the Fed would need to raise rates (perhaps sharply) to kill inflation, which could usher in the next recession. There are a broader range of possible downside risks. As argued throughout this Quarterly, there are various possible triggers of recession: failure of China to stimulate, and a loss of confidence by consumers, in particular. Some models of recession put the risk over the next 12 months as high as 30% (Chart 27). Structurally, the biggest risk is probably the high level of corporate debt in the U.S. (Chart 28). A breakdown in the junk bond market, as seen briefly last December, could lead to companies failing to refinance the large amount of debt maturing over the next 18 months. Geopolitical risks also remain elevated and are, by nature, hard to forecast. The outcome of Brexit remains highly uncertain – though we see low risk of a no-deal exit. We expect trade talks between the U.S. and China to drag on, without a comprehensive deal, while a clear breakdown would be negative. Impeachment of President Trump is probably not a significant market event, but might hurt market sentiment briefly (particularly if it makes the election of Elizabeth Warren more likely). The Iran/Saudi conflict could escalate. Risk premiums may need to rise to take into account these threats. Chart 26Is The Fed Turning Too Dovish?
Is The Fed Turning Too Dovish?
Is The Fed Turning Too Dovish?
Chart 27What Risk Of Recession?
What Risk Of Recession?
What Risk Of Recession?
Chart 28Is Corporate Debt The Biggest Risk?
Is Corporate Debt The Biggest Risk?
Is Corporate Debt The Biggest Risk?
Footnotes 1Please see Global Asset Allocation Special Report, titled "Euro Area Banks: Value Play Or Value Trap?" dated December 14, 2018, available at gaa.bcaresearch.com. 2 Please see Foreign Exchange Strategy Special Report, “United Kingdom: Cyclical Slowdown Or Structural Malaise?”, dated 20 September 2019, available at fes.bcaresearch.com. 3Please see Global Asset Allocation Quarterly, titled "Quarterly - April 2019" dated April 1, 2019, available at gaa.bcaresearch.com. 4Please see Global Investment Strategy Weekly Report, titled "Bond Yields Have Hit Bottom," dated September 6, 2019, available at gis.bcaresearch.com. 5Please see Global Investment Strategy Weekly Report, titled "Elizabeth Warren And The Markets," dated September 13, 2019, available at gis.bcaresearch.com. 6Dmitry Zhdannikov and Alex Lawler “Exclusive: Saudi oil output to return faster than first thought - sources,” Reuters, dated Sepetmber 17, 2019. 7Please see Geopolitical Strategy Special Alert titled, “Attacks On Critical Infrastructure In KSA Raises Questions About U.S. Response,” dated September 16, 2019, available at gps.bcaresearch.com. 8Please see Global Asset Allocation Special Report, titled “Investors’ Guide To Inflation Hedging: How To Invest When Inflation Rises,” dated May 22, 2019, available at gaa.bcaresearch.com GAA Asset Allocation
Highlights The fundamentals of the U.S. economy remain strong but investors’ skittishness has caused stocks to fluctuate with the ebb and flow of news headlines. With investor sentiment playing a leading role, we introduce a simple framework for tracking the course of animal spirits. Earnings expectations are undemanding, risk appetite remains robust and the monetary policy backdrop is supportive of the expansion. However, geopolitical unpredictability and potential irrational exuberance send warning signals. We continue to believe that recession worries are overblown, but there is no rule that says bear markets can only occur alongside recessions. Although there are some areas of concern, our overall assessment of other potential bear market triggers does not suggest that trouble is at hand. Feature A bear can find plenty to worry about these days. The trade war is still casting a shadow over global trade prospects, global manufacturing activity is slowing, the U.K. and German economies contracted in the second quarter and recent attacks demonstrated that Middle Eastern oil facilities were more vulnerable than investors realized. The R-word has abounded in the financial press all summer and the number of Google searches for the term “recession” surged to levels last reached in the months leading to the Great Financial Crisis. The summer anxiety did not last, though. Powered by a perceived cooling of trade tensions and monetary support from the Fed, the S&P 500 has already recouped all of its summer losses. The market swings were not driven by the domestic macroeconomic backdrop, which remained largely unremarkable. The U.S. economy is slowing after 2018’s sugar rush, but is still getting enough fiscal support to grow at or above trend despite the global slowdown. To this point, the slowdown has been confined to manufacturing, and the history of past industrial production cycles suggests it has almost run its course. The service sector is resilient across the developed world and the fundamentals for U.S. consumption remain strong. Fundamentals are not the whole story, however, and they have lately taken a backseat to politicians’ whims. The resulting anxiety has made it relatively easy to surpass downwardly revised expectations (Chart 1), and we have little concern that the bottom is about to drop out of S&P 500 earnings. But earnings are only half of the equation. The multiple investors are willing to pay for those earnings is the other half, and they could be the key swing factor if earnings growth is going to remain in the low single digits. Chart 1Markets And Economic Data Are Out Of Sync
Markets And Economic Data Are Out Of Sync
Markets And Economic Data Are Out Of Sync
We introduce a simple framework for tracking animal spirits. Multiples are largely a function of investor enthusiasm, and we attempt to track it via the Ex-Recession Bear Market Checklist developed by our sister Global ETF Strategy service (Table 1). It seeks to measure animal spirits across six dimensions: expectations, prices, appetite, euphoria, policy and geopolitics. Constructing the checklist is necessarily subjective, and as such we consider it a welcome complement to our fundamental analysis. We remain deeply invested in searching out the coming equity market inflection point, and delving into animal spirits allows us to track a wider range of potential catalysts. Table 1Ex-Recession Bear Market Checklist
Euphoric Angst
Euphoric Angst
Expectations Chart 2Back To Sustainable Levels...
Back To Sustainable Levels...
Back To Sustainable Levels...
After calling for unusually strong late-cycle profits growth last year on the back of the cut in corporate tax rates, earnings expectations are undemanding relative to history (Chart 2). Consensus S&P 500 earnings estimates for the full year project just 1.5% growth over 2018. As of the beginning of last week, analysts had penciled in a 3% year-over-year decline in 3Q earnings for the S&P 500. Those estimates are likely to be revised even lower as corporations make sure they’ve underpromised in the final two weeks before 3Q earnings season kicks off. Perhaps the consensus is a bit too conservative. Even though the year-over-year benefits of corporate tax cuts are gone, the dovish pivots by the Fed and other major central banks will support earnings growth. In the U.S. in particular, where the economy is still strong, easier financial conditions should help extend the shelf life of the current expansion through 2020. Bottom Line: Earnings growth is not going to blast higher, but profits are unlikely to contract as long as the Fed continues to support the expansion. The earnings bar has been set very low, and it will be rather easy for S&P 500 companies to exceed it. Prices We keep close tabs on valuation metrics, though we try not to get too wrapped up in them. Expensive (cheap) stocks can get more expensive (cheaper) as investors can remain irrational for a while. Valuations only become prone to mean-revert when they reach extreme levels. Chart 3Restored Normal Mirror-Image Relationship
Restored Normal Mirror-Image Relationship
Restored Normal Mirror-Image Relationship
Forward multiples offer greater insight when considered in conjunction with forward earnings estimates. It is unusual for both earnings estimates and forward multiples to be extended at the same time, as they were in 2018, because investors are typically unwilling to pay high multiples when they suspect that earnings may be peaking. The more normal mirror-image relationship has restored itself this year, as projected earnings growth has slipped below its mean level, balancing out the above-mean forward multiple (Chart 3). Chart 4Definitely Elevated, But Not Problematic Yet
Definitely Elevated, But Not Problematic Yet
Definitely Elevated, But Not Problematic Yet
Other conventional valuation measures remain elevated but valuations within one standard deviation of the mean are far from extreme (Chart 4). The S&P 500 price-to-sales ratio is the only metric nearing the two-standard-deviation level that marks what we view as the beginning of extreme territory. It is worth noting valuations have only eroded modestly in the current global geopolitical backdrop. Though they slid in the wake of the first tariff announcement, they have mostly recovered and have seemed somewhat inured to subsequent escalations, which may suggest that investors are becoming complacent about trade threats. Bottom Line: Stocks are fully priced and the fact that valuations were only modestly affected by tariff uncertainty has gotten our attention. One-sigma deviations do not point to an immediate reversal, however, so we will wait for more metrics to approach the two-sigma threshold before raising a red flag on valuations. Appetite IPO activity is a proxy for animal spirits. Well-received IPOs are a sign that investors still have a hearty appetite for what the future might hold and suggests that they do not fear the imminent end of the bull market. If new issues are too well received, however, IPO appetite becomes a contrary indicator. When an IPO frenzy takes hold, it’s a sign that optimism has reached unsustainable levels and the end of the cycle must be near. For now, we judge that the IPO market is healthy but not too healthy. Chart 5Improved Corporate Health Or Heightened Risk Appetite?
Improved Corporate Health Or Heightened Risk Appetite?
Improved Corporate Health Or Heightened Risk Appetite?
We consider it healthy that the number of IPO deals has remained stable since 2017, though the fact that their average value has more than doubled over that time could be a sign that investors are willing to grant increasingly higher values to private and newly-public companies (Chart 5). The fact that a steadily increasing share of the companies commanding larger valuations have yet to turn a profit is somewhat unsettling (please see the “Euphoria” section, below). We are therefore encouraged that investors pushed back so vigorously against the IPO of We Work’s parent company. Media reports suggesting that the sub-lessor of office space may be valued around a quarter of management’s initial estimates indicates that institutional investors are not blindly chasing the next hot deal. The companies that have completed offerings this year have fared well. 60% of the U.S. companies that have gone public so far this year are trading above their initial offering price. The median “successful” IPO in 2019 has returned 50% since inception, while the median “unsuccessful” IPO lost 23%. This asymmetry and the larger number of “successful” IPOs suggests that IPOs continue to be generally well-received. Bottom Line: Investors’ appetite for new issues has held up despite a challenging geopolitical and global growth backdrop, while We Work’s struggles to attract a public ownership base suggests they have maintained some healthy skepticism. As it relates to the near-term outlook, we rate investor appetites as light green. Euphoria IPO activity can also offer a window into investor euphoria. The share of companies going public with negative earnings has reached levels last observed in the years preceding the dot-com crash. The fact that profitless IPOs are currently better received by investors than IPOs of profitable companies is a concern (Chart 6). Chart 6Getting Carried Away
Getting Carried Away
Getting Carried Away
While we noted that aggregate S&P 500 valuations are within normal ranges, valuations among the most highly valued stocks suggest that some exuberance has broken out. Using the backtest functionality of BCA’s Equity Trading Strategy platform,1 we devised baskets of the top deciles of stocks ranked by Price-to-Earnings, Forward Price-to-Earnings, Price-to-Tangible Book Value, Price-to-Sales and Price-to-Operating Cash Flow. Chart 7The Most Expensive Stocks Are Getting More Expensive
The Most Expensive Stocks Are Getting More Expensive
The Most Expensive Stocks Are Getting More Expensive
The rising median P/E ratio of the top-decile P/E stocks suggests that investors continue to support the highest valuations by piling into the most richly valued firms. The same pattern prevails for the top deciles of stocks ranked on the four other multiples (Chart 7). Four out of the five metrics we track are now at or above two standard deviations from their mean. Bottom Line: Demand for unprofitable companies’ IPOs and the extreme valuations of the highest-valued companies on a range of metrics suggest that investors have gotten a little carried away. We rate this dimension orange. Policy We previously noted that restrictive monetary policy has been a precondition for every recession in the last 50 years. Consistent with its repeated pledge to sustain the expansion as long as possible, the Fed delivered its second rate cut earlier this month, and central banks around the world have embarked on what is turning into a synchronized dovish pivot. Despite unanimous expectations of easier policy at its September meeting, the ECB managed to surprise somewhat dovishly with the announcement of an open-ended bond purchase program, dubbed “QE Infinity”. Other developed-economy central banks like the already accommodative Reserve Bank of New Zealand have been delivering dovish surprises in the form of larger-than-expected rate cuts. Bottom Line: Uber-dovish U.S. and global central banks should prolong the shelf life of the expansion. Geopolitics The U.S.-China trade war continues to loom as the biggest risk to the global economy and the main source of investor angst. The Iranian attack on critical Saudi Arabian infrastructure also has the potential to destabilize markets and exacerbate investor concerns. Our Geopolitical Strategy service could see U.S.-China tensions receding in the near term, but fear that Iran will be an ongoing irritant. The motivations on the U.S. side are straightforward: first and foremost, the current administration wants to be re-elected next November. It is way too early to call the election – we won’t know who will face off until next summer – but one ironclad law of presidential elections is surely on the administration’s mind. The incumbent party always loses the White House if a recession occurs during the campaign (Chart 8). If hard-nosed trade policy appeared to be pushing the economy in the direction of a recession, it is likely the administration would dial down its aggressiveness. Chart 8A 2020 Recession Is The Biggest Threat To Trump's Reelection Prospects
A 2020 Recession Is The Biggest Threat To Trump's Reelection Prospects
A 2020 Recession Is The Biggest Threat To Trump's Reelection Prospects
Enter the Iranians. Their (apparent) attack on critical Saudi oil facilities2 signals that Middle Eastern tensions could intensify and crude prices could blast higher. As we wrote last week, the U.S. economy is far less exposed to an oil price shock than it was in the ‘70s, due mainly to its emergence as the world’s largest oil producer, but the rest of the world is vulnerable. An oil price shock could induce a global ex-U.S. recession. The U.S. is a comparatively closed economy, and it regularly responds to global forces with a longer lag than other economies. It does eventually respond to them, however, and if an oil price shock leads to recessions in major economies in the rest of the world, it will ultimately threaten the U.S. economy. Keeping the expansion going through November 2020 may require U.S. policymakers to focus carefully on the Middle East to defuse the potential implications of Iranian belligerence. The administration may need to cool tensions with China to free up the bandwidth to deal with Iran, and also to prevent trade tensions’ marginal pressure on global growth from making the global economy more vulnerable to an oil price spike. Our overall assessment of bear market triggers does not suggest that trouble is imminent. The U.S.-China pause our geopolitical colleagues have been calling for would not be as beneficial for markets as a holistic trade settlement, but it appears to be materializing. In deference to China’s National Day celebrations, the U.S. will delay the tariff hike that was supposed to begin October 1st (from 25% to 30% on $250 billion worth of Chinese imports). China, for its part, has issued waivers for tariffs and promised to increase purchases of U.S. farm goods. A trade deal with Japan has also been agreed in principle and is slated to be signed any day, while U.S. relations with Europe are marginally improving.3 Bottom Line: The latest pause in trade tensions is boosting investor sentiment and risk-asset performance but the unpredictability of the current administration’s actions and public communications still have the potential to rattle markets. We rate this dimension orange. Investment implications We continue to believe that worries of a recession are overblown, but it might also take time for investors to overcome all of their concerns. A lot of fear is already discounted in the 2019 earnings estimates correction, bringing the bar quite low for corporate earnings to beat expectations. Coupled with an accommodative policy backdrop and still-robust investor appetites, the expansion still has room to run. Equities are not a slam dunk at this point in the cycle. Valuations are full, global growth is uncertain, and geopolitics are a wild card. Volatility is likely to be elevated and subject to sporadic spikes. We remain positive on the U.S. economy and continue to expect global growth will pick up later this year, however, so we continue to recommend that investors remain at least equal weight equities in balanced portfolios. Jennifer Lacombe, Senior Analyst jenniferl@bcaresearch.com Doug Peta, CFA Chief U.S. Investment Strategist dougp@bcaresearch.com Footnotes 1 Available at https://ets.bcaresearch.com/ 2 Abqaiq is the most important oil-processing facility in the world, and the Khurais oil field is adjacent to the Ghawar oil field, the world’s largest. 3 Please see BCA Research Geopolitical Strategy Weekly Report “Trump’s Tactical Retreat”, published September 13, 2019. Available at gps.bcaresearch.com.
Highlights The world remains mired in a manufacturing recession. As such, it is still too early to put on fresh pro-cyclical trades. Focus on the crosses rather than outright U.S. dollar bets. Two new trade ideas: sell EUR/NOK and buy GBP/JPY. Also consider selling the gold/silver ratio. Feature Currency markets tend to trade into and out of various regimes. This means that to be an effective FX manager, you have to be extremely fluid. For example, interest rate differentials might dominate FX moves during a particular period, pivoting your job to a central bank monitor. Other times, flows dominate, perhaps even equity flows, like when a disruptive technology is developed in a specific market. The outperformance of U.S. equities, specifically technology stocks, is a case in point. Balance-of-payments dynamics usually matter mostly at critical turning points, making them not very useful as timing indicators. The exorbitant privilege of the U.S. dollar we discussed a fortnight ago is also a case in point. But more often than not, being able to identify whether the investment climate is about to become more hostile or not could be the key difference between being a successful FX manager or a relic. There has been no shortage of news for investors to digest over the last few days, from the Brexit imbroglio, to the Fed, to the drone attacks in Saudi Arabia and finally to U.S. President Donald Trump’s possible impeachment. But the most perplexing (and perhaps the most important) has been the German manufacturing flash PMI print for the month of September of 41.4, the lowest in over a decade (Chart I-1). If the country with the “cheapest currency” cannot manage to pull itself out of a manufacturing recession, then the message to the periphery is clearly that they have an impending problem. In short, our contention that the euro was close to a bottom might be offside by a few months, based on the latest manufacturing data release (Chart I-2). Chart I-1A Eurozone Manufacturing Recession
A Eurozone Manufacturing Recession
A Eurozone Manufacturing Recession
Chart I-2The Euro Needs Stronger Growth
The Euro Needs Stronger Growth
The Euro Needs Stronger Growth
Which FX Regime? Chart I-3A Recession Will Be Dollar Bullish
A Few Trade Ideas
A Few Trade Ideas
The performance of the dollar since the 10/2 yield curve inverted is instructive. So far, we are tracking both the 2005 and 1998 roadmaps, meaning the window for cautious optimism on risk assets could still pan out (Chart I-3). Specifically, the dollar tends to rally during recessions but the window before the dollar bull market takes hold can be quite long. In both 2006 and 1998, the dollar eventually catapulted higher, but it took longer than 12 months. Having an accurate recession probability-timing model is therefore crucial for strategy. Historically, domestic flows have been a very timely indicator, since repatriation by residents occurs during episodes of severe capital flight. In 2005, domestic individuals were deploying funds outside the U.S., which suggested patience before positioning for dollar strength. This made sense, since the return on capital was higher outside the U.S. with the EM and commodity bull market in full swing. More often than not, FX markets tend to favor regions with the highest return on capital. These tend to be the most difficult to bet against, but potentially the most potent blindside at turning points. If economic data continues to deteriorate due to much larger endogenous factors, a defensive strategy is clearly warranted. One way to tell will be an emerging divergence between our leading indicators and actual underlying data as is occurring so far in September. On the flip side, any specter of positive news could light a fire under sectors, currencies and countries that have borne the brunt of the slowdown. Both are highly risky bets. For now, we prefer to focus on the crosses rather than outright U.S. dollar bets. Sell EUR/NOK Sometimes, the best ideas are the simplest ones. The Norges bank is the most hawkish G-10 central bank, while the European Central Bank restarted QE at its latest meeting. This is a powerful catalyst for a short EUR/NOK trade: The dollar tends to rally during recessions but the window before the dollar bull market takes hold can be quite long. The slowdown in the euro zone has been concentrated in the manufacturing sector, but the deflationary impulse is starting to shift to other parts of the economy. Euro area overall core CPI continues to blast downwards, which has historically been a bad omen for the euro (Chart I-4). We expect euro zone inflation expectations to eventually rise, in part helped by the recovery in oil prices (Chart I-5), but this will also benefit the Norwegian krone. EUR/NOK has historically tracked the performance of relative stock prices between Europe and Norway, but a gaping wedge opened up in 2018 (Chart I-6). This divergence is unsustainable. In short, it is a bet on oil fields in Norway versus European banks. The ECB’s tiering of reserves might prevent euro zone banks from teetering over the edge, but unless the manufacturing recession ends soon and firms start to borrow to invest, banks will continue to have a demand problem. Meanwhile, the flareup in the Middle East means that oil prices will remain bid in the near term. This should favor Norwegian equities over those in the euro zone, and be negative for EUR/NOK (Chart I-7). 10-year German bunds are yielding -0.57% while the yield pickup on Norwegian bonds is a positive carry of 1.8%, despite liquidity concerns. In their latest policy meeting, Central Bank Governor Øystein Olsen stressed that Norway had much more fiscal room to maneuver in the event of a downturn, meaning the supply of Norwegian paper could increase, easing the liquidity premium. Chart I-4Deflation Remains Predominant In The Eurozone
Deflation Remains Predominant In The Eurozone
Deflation Remains Predominant In The Eurozone
Chart I-5A Rise In Oil Prices Will Help Inflation Expectations
A Rise In Oil Prices Will Help Inflation Expectations
A Rise In Oil Prices Will Help Inflation Expectations
Chart I-6Stocks And Currencies: An Unsustainable Divergence
Stocks And Currencies: An Unsustainable Divergence
Stocks And Currencies: An Unsustainable Divergence
Chart I-7Higher Oil is Negative ##br##For EUR/NOK
Higher Oil is Negative For EUR/NOK
Higher Oil is Negative For EUR/NOK
Bottom Line: Sell EUR/NOK at 9.937. Buy GBP/JPY Last week’s Special Report made the case for a cyclical recovery in the U.K., even though structural factors remain a headwind. This week, we are re-attempting to buy cable versus the yen: Most importantly, the Bank of England stood pat at its latest policy meeting while the Bank of Japan is likely to introduce more stimulus or stronger guidance. Real interest rate differentials favor a stronger pound. Most importantly, the Bank of England stood pat at its latest policy meeting while the Bank of Japan is likely to introduce more stimulus or stronger guidance (Chart I-8). Chart i-8A Tactical Bounce In GBP/JPY Is Likely
A Tactical Bounce In GBP/JPY Is Likely
A Tactical Bounce In GBP/JPY Is Likely
Chart I-9The Benefit Of A Weaker Pound
The Benefit Of A Weaker Pound
The Benefit Of A Weaker Pound
Speculators are very short the pound while they have been covering their short bets on the yen, as the investment environment has become more uncertain. The fall in the pound should begin to improve the U.K.’s balance-of-payment dynamics relative to Japan (Chart I-9). Bottom Line: Buy GBP/JPY at 132.6. Concluding Thoughts We continue to track various indicators for the dollar, from interest rate differentials, balance-of-payment dynamics, valuations, portfolio flows and positioning – and none of them are sending a bullish signal at the moment. Global growth remains in a funk, which has been supercharging dollar bulls. However, long-dollar bets remain susceptible should global growth stabilize. Our strategy is to continue focusing on the crosses until categorical evidence emerges that global growth has bottomed. In our trading portfolio, we continue to favor the NOK, SEK, petrocurrencies and the AUD. So far, these trades have been implemented at the crosses to limit downside risk, should our view on the dollar be offside. We intend to eventually start placing outright dollar bets once evidence emerges that global growth has bottomed and the world has skidded a recession. Chester Ntonifor, Foreign Exchange Strategist chestern@bcaresearch.com Currencies U.S. Dollar Chart II-1USD Technicals 1
USD Technicals 1
USD Technicals 1
Chart II-2USD Technicals 2
USD Technicals 2
USD Technicals 2
Recent data in the U.S. have been relatively strong: The Markit flash manufacturing PMI rebounded to 51 in September from 50.3. Flash services PMI increased to 50.9. The Chicago Fed national activity index increased to 0.1 from -0.4 in August. The Richmond Fed manufacturing index fell to -9 in September from 1. The Conference Board consumer confidence fell to 125.1 in September from 135.1. On the housing front, home prices grew by 0.4% month-on-month in July. Mortgage applications decreased by 10% for the week ended September 20th, but new home sales increased by 7% month-on-month in August. Initial jobless claims increased to 213,000 for the week ended September 20th. Annualized GDP growth was unchanged at 2% quarter-on-quarter in Q2. Trade deficit of goods was little changed at $72.8 billion. Headline and core PCE increased to 2.4% and 1.9% quarter-on-quarter, respectively in Q2. The DXY index appreciated by 0.6% this week. The recent data from the U.S. have been holding up quite well compared with the rest of the world. Net speculative positions on the greenback remain elevated due to U.S. relative strength. While we see dollar resilience in the near term, declining net foreign purchases of U.S. securities, diminishing interest rate differentials and the plunging bond-to-gold ratio all suggest the path of least resistance for the dollar is down. Report Links: Preserving Capital During Riot Points - September 6, 2019 Has The Currency Landscape Shifted? - August 16, 2019 USD/CNY And Market Turbulence - August 9, 2019 The Euro Chart II-3EUR Technicals 1
EUR Technicals 1
EUR Technicals 1
Chart II-4EUR Technicals 2
EUR Technicals 2
EUR Technicals 2
Recent data in the euro area continue to deteriorate: The Markit flash manufacturing and services PMIs for the euro area both fell to 45.6 and 52, respectively in September. In France, the Markit flash manufacturing PMI fell to 50.3; services PMI decreased to 51.6. In Germany, the manufacturing PMI collapsed to 41.4; services PMI fell to 52.5. German IFO current assessment increased to 98.5 in September. However, the IFO expectations fell to 90.8. Monetary supply (M3) grew by 5.7% year-on-year in August. German Gfk consumer confidence nudged up to 9.9 in October. The EUR/USD fell by 0.8% this week. The recent data from the euro area has unfortunately showed no signs of global growth bottoming. The manufacturing PMI in Germany is now at its lowest level since the Great Financial Crisis. A major concern faced by investors is that weak activity in manufacturing may have already begun to infiltrate the service sectors. That said, the services PMIs in major economies, though falling, still remain in expansionary territory above 50. Report Links: Battle Of The Central Banks - June 21, 2019 EUR/USD And The Neutral Rate Of Interest - June 14, 2019 Take Out Some Insurance - May 3, 2019 Japense Yen Chart II-5JPY Technicals 1
JPY Technicals 1
JPY Technicals 1
Chart II-6JPY Technicals 2
JPY Technicals 2
JPY Technicals 2
Recent data in Japan have been negative: National headline inflation fell from 0.5% year-on-year to 0.3% year-on-year in August. Core inflation was unchanged at 0.6% year-on-year. The Markit flash manufacturing PMI fell to 48.9 in September from 49.3. Services PMI also fell to 52.8 from 53.3. The leading index and coincident index were both little changed at 93.7 and 99.7, respectively, in July. The USD/JPY has been flat this week. Japanese exports have been weak, weighed by the global trade war and manufacturing slowdown. However, accordingly to the BoJ, domestic demand has remained firm, and capex also continues to increase. Moreover, the consumption tax hike next month will probably have a marginal impact compared with previous tax hikes. In a speech this week, BoJ Governor Haruhiko Kuroda emphasized that the central bank will ease without hesitation if the economy loses momentum. Report Links: Has The Currency Landscape Shifted? - August 16, 2019 Portfolio Tweaks Into Thin Summer Trading - July 5, 2019 Battle Of The Central Banks - June 21, 2019 British Pound Chart II-7GBP Technicals 1
GBP Technicals 1
GBP Technicals 1
Chart II-8GBP Technicals 2
GBP Technicals 2
GBP Technicals 2
There is little data from the U.K. this week: Mortgage approvals decreased slightly to 42,576 in August from 43,303 in July. The GBP/USD fell by 1.4% this week. British Prime Minister Boris Johnson has now lost his majority in Westminster after large profile defections from the so-called rebels, thus another election is highly likely by year-end. Besides, a further delay of Brexit is almost certain. We have downgraded the probability for a no-deal Brexit. We remain positive on the pound and are buying GBP/JPY this week. Report Links: United Kingdon: Cyclical Slowdown Or Structural Malaise? - September 20, 2019 Battle Of The Central Banks - June 21, 2019 A Contrarian View On The Australian Dollar - May 24, 2019 Australian Dollar Chart II-9AUD Technicals 1
AUD Technicals 1
AUD Technicals 1
Chart II-10AUD Technicals 2
AUD Technicals 2
AUD Technicals 2
Recent data in Australia have been mixed: The preliminary commonwealth manufacturing PMI fell to 49.4 in September from 50.9 in August. On the other hand, the services PMI rebounded to 52.5 from 49.1, back to above-50 expansionary territory. Consumer confidence increased to 110.1 from 109.3 this week. The AUD/USD fell by 1% this week. Reserve Bank of Australia Governor Philip Lowe commented on Tuesday that the Australian economy is picking up, and is now at a “gentle turning point.” The previous rate cuts have allowed the property markets in big cities like Sydney and Melbourne to regain some strength, but will likely take longer to flow through the whole economy. In terms of monetary policy, Governor Lowe reiterated his commitment to ease monetary conditions when needed, though he did not signal an imminent move for next week. Australia has a large beta to global shifts as a small, open economy. Should the global manufacturing recession come to an end, the positive fundamentals will continue to lift the Australian economy through the rest of the year and into 2020. Report Links: A Contrarian View On The Australian Dollar - May 24, 2019 Beware Of Diminishing Marginal Returns - April 19, 2019 Not Out Of The Woods Yet - April 5, 2019 New Zealand Dollar Chart II-11NZD Technicals 1
NZD Technicals 1
NZD Technicals 1
Chart II-12NZD Technicals 2
NZD Technicals 2
NZD Technicals 2
Recent data in New Zealand have been negative: Imports increased by NZ$30 million to NZ$5.69 billion in August, while exports fell by NZ$830 million to NZ$4.13 billion. The total trade deficit widened from NZ$700 million to NZ$1.57 billion. The NZD/USD appreciated by 1% initially, then plunged after the Reserve Bank of New Zealand’s policy meeting, returning flat this week. As widely expected, the RBNZ kept its official cash rate unchanged at 1% this Wednesday while signaling that there is more scope to ease if necessary amid a global slowdown. The market is currently pricing an 80% probability of a rate cut for the next policy meeting in November, reflecting weak business confidence. We are playing the kiwi weakness through the Australian dollar and Swedish krona, which are 1.9% and 1.95% in the money, respectively. Report Links: USD/CNY And Market Turbulence - August 9, 2019 Where To Next For The U.S. Dollar? - June 7, 2019 Not Out Of The Woods Yet - April 5, 2019 Canadian Dollar Chart II-13CAD Technicals 1
CAD Technicals 1
CAD Technicals 1
Chart II-14CAD Technicals 2
CAD Technicals 2
CAD Technicals 2
Recent data in Canada have been resilient: Bloomberg Nanos confidence increased to 57.4 this week from 56.7. Retail sales increased by 0.4% month-on-month in July, lower than the expectations of a 0.6% monthly growth. The USD/CAD has been flat this week. Oil prices have been on a wild ride this year. Since the drone attack a fortnight ago, Saudi Arabia has claimed that it is recovering faster than expected, beating its own targets. Brent crude oil spot prices have fallen by 6% from their September 16th peak, while Western Canada Select (WCS) oil prices have dropped by 12.3%, dampening the loonie’s upside potential. Report Links: Preserving Capital During Riot Points - September 6, 2019 Portfolio Tweaks Into Thin Summer Trading - July 5, 2019 On Gold, Oil And Cryptocurrencies - June 28, 2019 Swiss Franc Chart II-15CHF Technicals 1
CHF Technicals 1
CHF Technicals 1
Chart II-16CHF Technicals 2
CHF Technicals 2
CHF Technicals 2
Recent data in Switzerland have been mostly negative: The trade balance narrowed to CHF 1.2 billion in August from CHF 2.6 billion in July. Credit Suisse survey expectations came in at -15.4 in September, up from the last reading of -37.5 in August. The USD/CHF has been flat this week. As a small, open economy, Switzerland belongs to those countries with highest foreign trade-to-GDP share. The trade balance in August has been the lowest since January 2018, with lower exports of main goods including chemical and pharmaceutical products. Among trading partners, exports to Germany, Italy, and France all declined, reflecting the recent manufacturing slowdown in Europe. That said, we remain positive on the safe-haven Swiss franc during the risk-off period amid trade war uncertainties, Brexit chaos, Middle-East tensions, and more recently, the Trump Impeachment imbroglio. Report Links: What To Do About The Swiss Franc? - May 17, 2019 Beware Of Diminishing Marginal Returns - April 19, 2019 Balance Of Payments Across The G10 - February 15, 2019 Norwegian Krone Chart II-17NOK Technicals 1
NOK Technicals 1
NOK Technicals 1
Chart II-18NOK Technicals 2
NOK Technicals 2
NOK Technicals 2
There is scant data from Norway this week: The unemployment rate increased to 3.8% in July, 0.6 percentage points higher than in April, accordingly to the recent Labour Force Survey. The USD/NOK appreciated by 0.5% this week. The Norges Bank, the one and only hawkish central bank among the G-10, raised its interest rate by 25 basis points to 1.5% last week. Since last September, the Norges Bank has hiked rates four times in total, resulting in a one-percentage-point increase in rates. The central bank stated that “the Norwegian economy has been solid; Employment has risen; Capacity utilization appears to be somewhat above a normal level; Inflation is close to target.” A higher interest rate would also help take the wind out of skyrocketing house prices and household debt levels. In addition, the central bank lowered its projection path for the krone, stating that the factors it outlined, including weaker activity in the petroleum sector, would probably keep weighing on the krone in the years ahead. Report Links: Portfolio Tweaks Into Thin Summer Trading - July 5, 2019 On Gold, Oil And Cryptocurrencies - June 28, 2019 Currency Complacency Amid A Global Dovish Shift - April 26, 2019 Swedish Krona Chart II-19SEK Technicals 1
SEK Technicals 1
SEK Technicals 1
Chart II-20SEK Technicals 2
SEK Technicals 2
SEK Technicals 2
Recent data in Sweden have been negative: Consumer confidence fell to 90.6 in September. PPI yearly growth fell from 2% in July to 1.4% in August. Trade balance shifted to a deficit of SEK 5.4 billion in August. USD/SEK has been flat this week. We are closely monitoring the Swedish foreign trade as a leading indicator for global growth. The Swedish trade balance has shifted to a deficit for the first time this year. However, compared to last August, the deficit was narrowed by SEK 2.6 billion. Year to date, the Swedish trade surplus amounted to SEK 27 billion. Notably, the trade in goods with non-EU countries resulted in a surplus of SEK 6.6 billion, while the trade with EU resulted in a deficit of SEK 12 billion. Report Links: Where To Next For The U.S. Dollar? - June 7, 2019 Balance Of Payments Across The G10 - February 15, 2019 A Simple Attractiveness Ranking For Currencies - February 8, 2019 Trades & Forecasts Forecast Summary Core Portfolio Tactical Trades Limit Orders Closed Trades
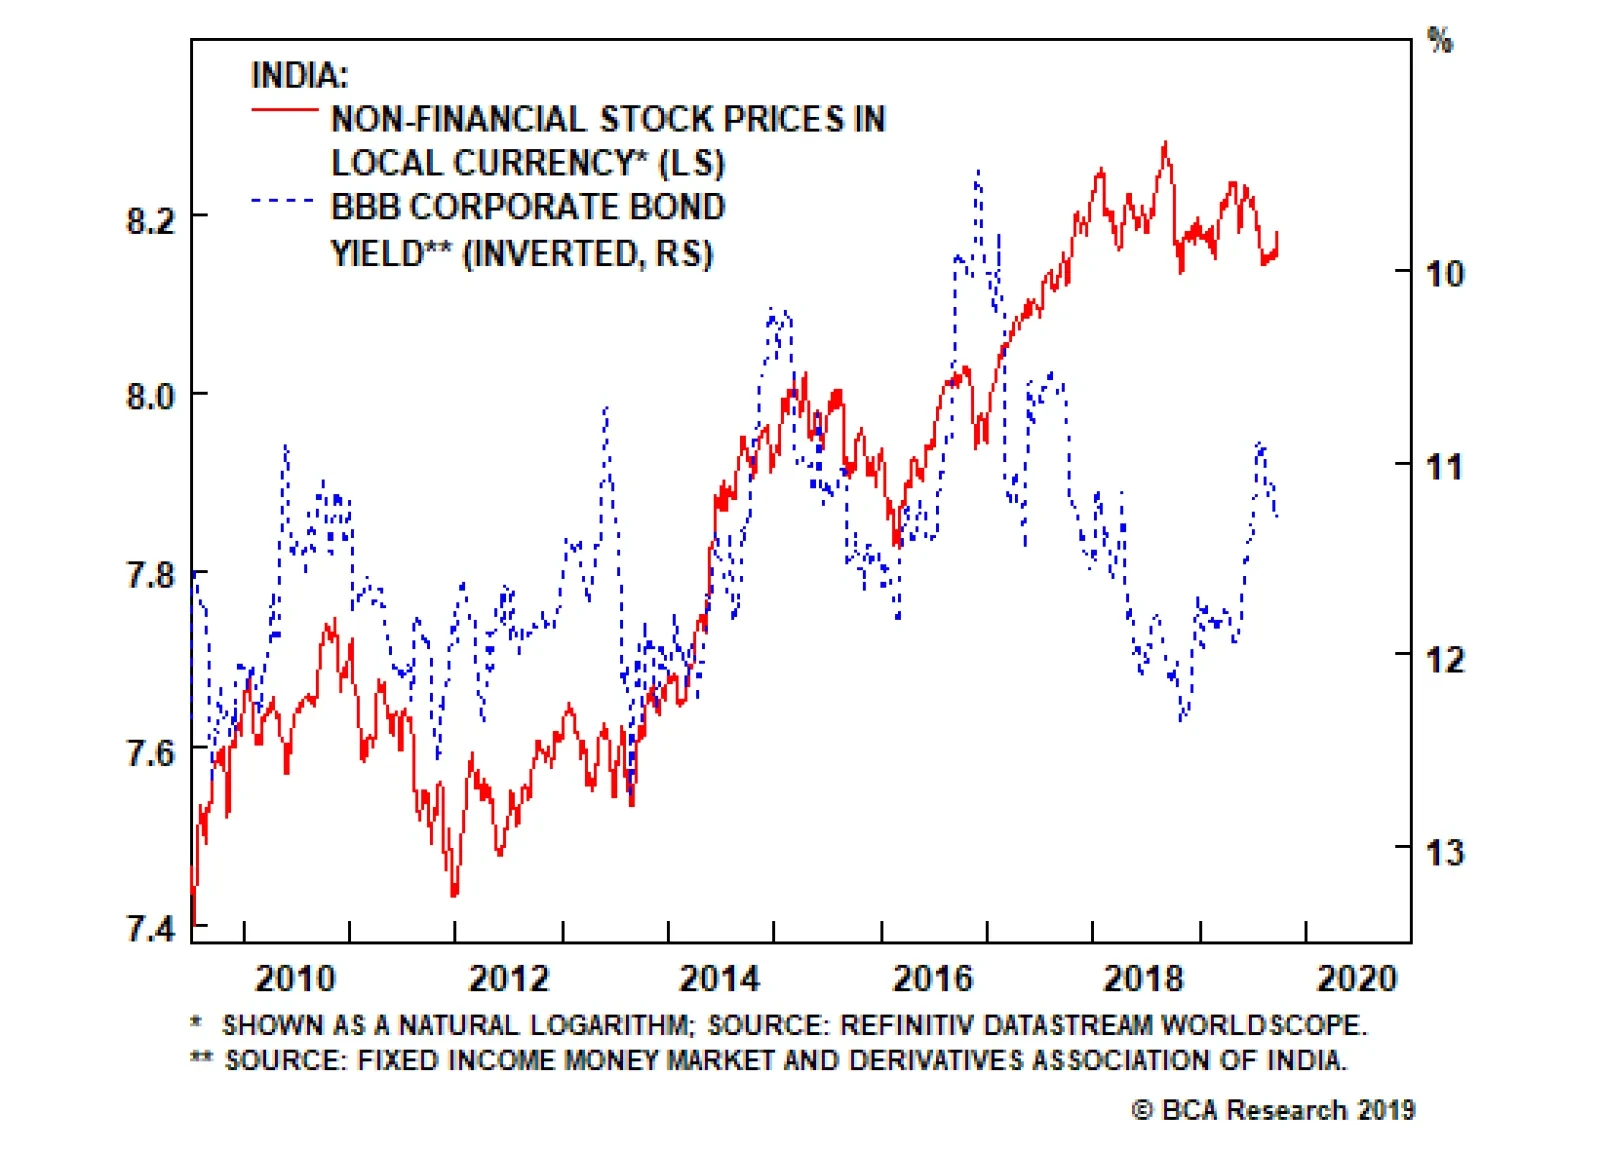
The Indian government resorted to an unexpected large corporate income tax cut last week. The government reduced the effective corporate tax rate from 35% to around 25%. If domestic bond yields rise materially in response to this fiscal stimulus, share…
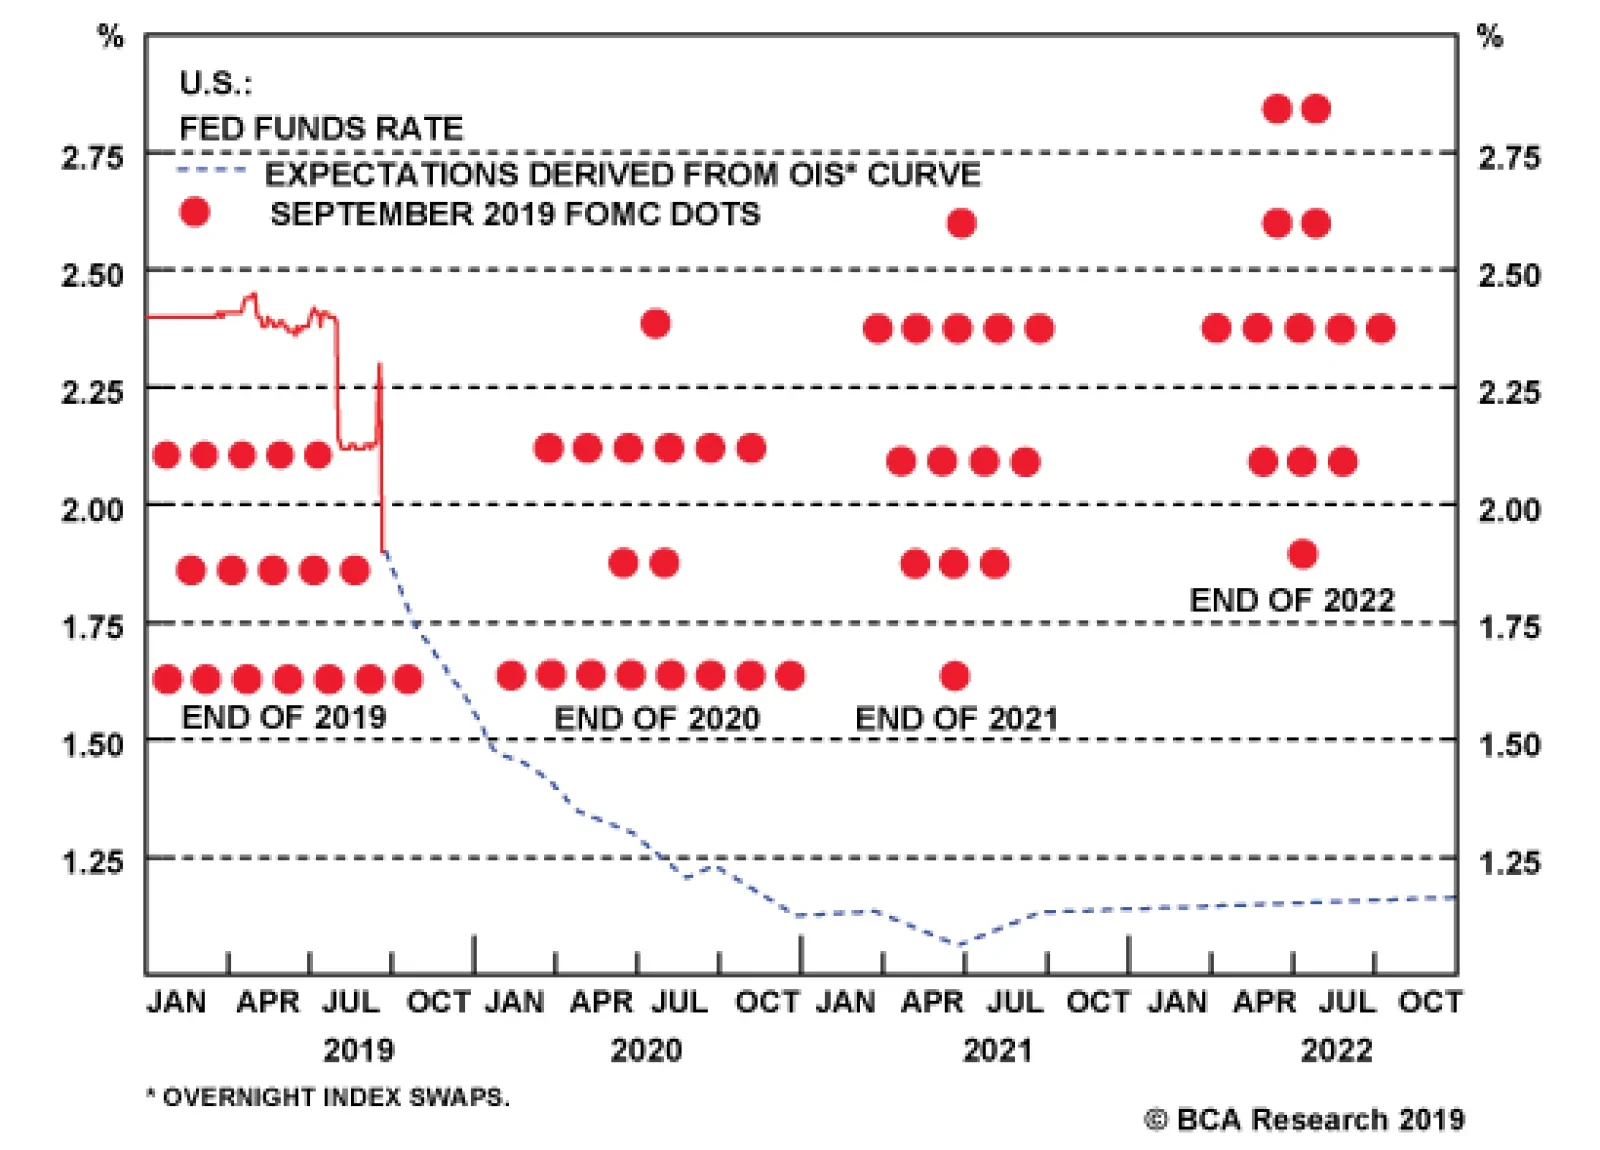
The market is priced for roughly one more 25 bps rate cut before the end of the year. More specifically, the fed funds futures market is split 50/50 on whether that rate cut occurs at the October or December FOMC meeting. The market currently sees only a 4%…
Fed Chairman Jerome Powell had his work cut out for him at last week’s FOMC press conference. First, he had to craft a coherent message about the Fed’s reaction function following a meeting where three voting members dissented from the committee’s decision to…
Highlights Pension reform in Brazil is pushing through. The upcoming 12-18 months offer a window of opportunity, most notably on the privatization and tax reform front. Ongoing efforts should sustain an improvement in “animal spirits” in the short term and create some potential for structural improvements over the long term. Nevertheless, Brazil’s slow grinding economic recovery remains vulnerable to a negative external or domestic shock that could cause it to “stall speed”. If structural reforms or the business cycle hit stall speed, financial markets will sell off. Weighing the pros and cons, we are upgrading Brazil from underweight to neutral. Feature Pension Reform Will (Eventually) Pass, But What Next? Recent progress on Brazil’s economic reform agenda is market-positive but is clearly at risk of “stall speed”1 if reform momentum is not sustained after the likely passage of social security cuts. Having cleared the Chamber of Deputies, the pension reform bill is now likely to pass the senate. The first round of voting is expected any day now and the government’s senate leader, Fernando Bezerra, expects the bill to pass the second round by mid-October (Diagram I-1). Diagram I-1Brazil: Pension Reform Timeline
Brazil: Just Above "Stall Speed"
Brazil: Just Above "Stall Speed"
Chart I-1Pension Bill Will See The Light Of Day
Brazil: Just Above "Stall Speed"
Brazil: Just Above "Stall Speed"
The reform is all but certain to be approved by congress, granting the Bolsonaro administration its first major legislative victory. Lower house deputies voted largely in line with party alliances – if this continues in the senate, the bill should rack up the support of at least 56 of the 81 senators – surpassing the 49 votes needed for passage (Chart I-1). We would not be surprised if the bill faced sudden hang-ups in the senate, such as delays or dilutions. The House bill was introduced in February and after some delay passed in August. Rodrigo Maia, President of the Chamber of Deputies, was instrumental in ensuring the bill’s smooth passage. While Senate President Davi Alcolumbre has a similar interest in ensuring its passage, there is no guarantee that it will be smooth. Fragmentation in the senate, for example, is at the highest level ever, unlike the lower house. The bill requires two rounds of voting. Bezerra’s expectation of voting on September 24 and October 15 is already a delay from the initial projection of September 18 and October 2. Bottom Line: Pension reform is highly likely to pass, if not as rapidly as its promoters say, and the Brazilian congress will soon need to turn to the next major item on the economic reform agenda. Tracking Bolsonaro’s Political Capital For The Post-Pension Reform Agenda Does Bolsonaro have enough political capital to pass other structural reforms? Or will he fall victim to stall speed as his policy focus shifts to less market-friendly areas, his relationship with the legislature breaks down, and his popular support continues to slide? With macroeconomic headwinds and a fragile governing coalition, the answer is a qualified yes that Bolsonaro has sufficient political capital to spend on additional reforms. But since it is impossible to know precisely what will occur after the pension reform goes through, we highlight the key signposts that we will use to monitor Bolsonaro’s progress. A fundamental premise is that neither Bolsonaro nor his party are instinctively or ideologically pro-market. He won the 2018 election due to a specific set of circumstances and popular policies. These form the four pillars of his political support: The Collapse Of The Left: The 2016 and 2018 elections wiped out the Worker’s Party, which had ruled Brazil since 2003, and swept Bolsonaro to power on a wave of deep disillusionment. The success of Bolsonaro’s right-wing Social Liberal Party (PSL), a decidedly minor party, over Fernando Haddad’s left-wing PT, one of the country’s biggest parties, highlighted Brazilians’ disenchantment after the worst recession in a century and a sprawling corruption scandal that implicated most of the political elite. Chart I-2The Left Is Still Wounded
Brazil: Just Above "Stall Speed"
Brazil: Just Above "Stall Speed"
While Bolsonaro’s “honeymoon period” after election has ended, the PT has not recovered from its loss of legitimacy over the past decade. A poll conducted in late August reveals that if the 2022 election were held today, Bolsonaro would secure a sizable lead not only over the PT but also over the combined opposition (Chart I-2). Pension Reform: All of Brazil’s political elites recognize that the bloated pension system must be cut back to improve the country’s fiscal profile and debt sustainability. After the previous government failed to do so, this became a central Bolsonaro campaign promise. Consensus on pension reform has enabled him to form a majority coalition; it is among the most popular items on the government’s agenda not because people love having their pensions cut but because of the widespread perception that it is necessary and will improve Brazil’s overall economic circumstances (Chart I-3). Chart I-3Brazilians See The Value In Pension Reform
Brazil: Just Above "Stall Speed"
Brazil: Just Above "Stall Speed"
Ironically, however, passing this reform will also remove this pillar of the administration’s political capital. Bolsonaro will be left with less political capital to spend on other reforms and he will face less unity within his coalition having accomplished its greatest shared goal. Thus if the bill passes yet fails to boost his approval rating, or immediately prompts him to pursue less market-friendly policies or to lose major parties from his coalition, then it is a red flag suggesting that he is a one-trick pony and will not get other major reforms done in his term. Law And Order: Bolsonaro was elected on a ticket of restoring order. The crime rate has fallen since the beginning of the year and voters will be looking for this to be sustained (Chart I-4). The fall in the crime rate and the net approval of the security environment in Brazil are positive for Bolsonaro’s credibility. However, it is not clear that his policies are directly responsible for this improvement, which means the trend could change. If crime goes up, he loses political capital to do other things. Moreover the public may not approve of his approach. As indicated by Chart I-3 above, while the population is divided over the right to possess weapons in the home, there is clear disapproval of the right to possess weapons on the street. Pursuit of an unpopular solution could diminish his support on law and order. Chart I-4A Rise In Crime Would Hurt Bolsonaro
Brazil: Just Above "Stall Speed"
Brazil: Just Above "Stall Speed"
Chart I-5Moro Key For Bolsonaro Anti-Corruption Drive
Brazil: Just Above "Stall Speed"
Brazil: Just Above "Stall Speed"
Corruption: The third panel of Chart I-4 also reveals that combating corruption is a key area of perceived success by the Bolsonaro administration to date. Bolsonaro won the office partly because he was seen as a clean leader during a time of pervasive corruption. His administration is also fortified by the presence of Minister of Justice Sergio Moro, who played a leading role in prosecuting corrupt figures in the Lava Jato operation. Moro is by far the most popular minister in cabinet today (Chart I-5). A decline in Moro’s popularity would be an indication that Brazilians are not satisfied with the administration’s progress on the anti-corruption front. As such it would flag declining political capital. If Moro departs the administration for any reason, that would also hurt Bolsonaro's credibility on this critical issue. Bolsonaro’s approval rating to date is very low relative to previous presidents and falling (Chart I-6). The only way this can change is if he gets credit for the pension reform and then prioritizes policies that are broadly popular rather than ideological. As mentioned, the change in the wake of pension reform will be critical to observe: polls show that the public gives the federal government and President Bolsonaro personally the most credit for improvements in Brazil (Chart I-7), but it is not clear that he will be greatly rewarded for cutting pensions. Chart I-6Will Pension Reform Passage Save Bolsonaro?
Brazil: Just Above "Stall Speed"
Brazil: Just Above "Stall Speed"
Chart I-7All Credit Goes To The Bolsonaro Administration
Brazil: Just Above "Stall Speed"
Brazil: Just Above "Stall Speed"
The legislative effort has succeeded largely due to House Speaker Rodrigo Maia, a clutch player in congress. The economic liberal Maia has set aside personal differences with the leadership to shepherd economic reforms through congress. This has involved a pragmatic approach that sidelines the president’s controversial social policies and focuses on getting pro-market bills passed. Chart I-8A Weak Starting Point For PSL
Brazil: Just Above "Stall Speed"
Brazil: Just Above "Stall Speed"
The political news flow from Brazil this year has been preoccupied with the rift between the legislative and executive branches. At first glance, congress looks impossible to navigate. As is typical in Brazil, congress is extremely fractured. Bolsonaro’s PSL holds only 10% of seats that belong to the 25 parties in the lower house, and only 5% of the seats that belong to the 17 parties in the upper house (Chart I-8). This is comparable to the first Cardoso administration – so it is not impossible to grow this legislative base – but it is a weak starting point. On top of that, Bolsonaro has held true to his campaign promise to shun so-called “old politics” – the granting of cabinet positions or “pork” based on congressional patronage. This reinforces his anti-corruption pillar but makes it hard to grease the wheels of legislation. The passage of the pension reform proposal through Brazil’s Chamber of Deputies shows that congress can be navigated, but it highlights Maia’s critical role. This relationship could break down after pension reform, which would reduce the government’s ability to accomplish additional reforms that require legislative approval. Maia’s third two-year term will expire at the end of next year. He technically cannot be elected for a successive term (although this rule has already been broken). This raises the threat that his successor may not be as pro-market or as successful in managing the lower house. In fact, the coming 12 to 18 months create a window of opportunity for the administration and legislature to pass bills before the 2020 local elections and the 2022 general election begin to interfere. Since the pension cuts will be back-loaded – delayed until subsequent years – voters will not immediately feel the pain of the social security changes, which will reduce the chances of a major popular backlash during this window. Provided Maia’s pragmatism continues to prevail, the government can use the pension reform to launch into another major reform initiative. Economy minister Paulo Guedes, another key pro-market player, has highlighted privatization and tax reforms as the next big issues on his agenda. The upcoming 12-18 months offer a window of opportunity for further reforms. Bottom Line: Tensions between the executive and legislative branches of government have not prevented pension reforms from passing because Bolsonaro had a fresh mandate, full political capital, and a broad consensus on the policy itself. Going forward a great deal of political capital will have been spent while consensus will have to be built for the next policy priority. House Speaker Rodrigo Maia is a clutch player, pragmatically enabling the passage of bills through congress, so his cooperation is essential. The upcoming 12-18 months offer a window of opportunity for further reforms, most notably privatization and tax reform. An Executive Way Forward On Privatization The administration’s privatization plan is overly ambitious but there is an executive path forward while the government enters a long slog in the legislature. Guedes has indicated that he wants to sell all of Brazil’s state owned enterprises to the private sector. In value terms, the government hopes to raise 1.3 trillion reals ($323 billion) in the process, about 20% of total public debt. Brazil has 418 SOEs controlled directly or indirectly by the state, both at the state and municipal levels. Of the 134 federal companies, 46 are under direct control, while the remaining 88 are under indirect control – subsidiaries of major SOEs such as Petrobras, Eletrobras, Banco do Brasil, Caixa, and BNDES. With Brazil’s public debt at 86% of GDP, profit from these sales would go toward paying down the debt and hopefully also raising GDP through gains from increased competition and efficiency. The program would also reduce the government’s interest payments – that account for 25% of government spending and 5% of GDP. Salim Mattar – Special Secretary of Privatization, Divestment and Market — argues that the interest saved will allow the government to divert funds to education and health, buoying Brazil’s human capital over the long term. The privatization of inefficient and loss-generating SOEs is positive for both the near-term and long-term outlook, but the government’s plan is completely unrealistic. Even Mattar’s significantly lower projected gains – up to 800 billion reals ($214 billion) – are likely unattainable. Although the government will easily meet its target of raising $20 billion this year,2 these sales represent the low-hanging fruit – they are the asset sales that face no or low resistance from the public and congress. On August 21, the Bolsonaro government released a list of 17 state-owned companies that it intends to privatize (Table I-1). From among the largest SOEs, – Petrobras, Eletrobras, BNDES, Banco do Brasil, and Caixa Economica Federal – only Eletrobras is on the list. The rest of the major SOEs will face greater hurdles as they have been identified as “strategic” and face greater resistance from the public (Chart I-9). In fact, although government officials expressed confidence that Eletrobras will be privatized in 2020, Senate President Davi Alcolumbre indicated that the process faces significant resistance in the senate. As such we would expect the legislature to tackle companies that are not as controversial. Table I-1Government Privatization List
Brazil: Just Above "Stall Speed"
Brazil: Just Above "Stall Speed"
What is more, while congressional approval is required for the sale of SOEs, a supreme court ruling earlier this year allows the government to sell subsidiaries of its companies without approval from congress. Thus while major state companies such as Petrobras or Eletrobras are unlikely to be privatized (certainly not wholly), the government will attempt to move forward by selling non-core assets of non-strategic companies, and taking other measures to improve efficiency of operations. Chart I-9These "Strategic" SOEs Face Privatization Resistance
Brazil: Just Above "Stall Speed"
Brazil: Just Above "Stall Speed"
Chart I-10Privatization Will Reduce Debt Burden
Privatization Will Reduce Debt Burden
Privatization Will Reduce Debt Burden
Putting aside the administration’s plan to accelerate the program next year, if we project $20 billion worth of privatizations per year for the remainder of Bolsonaro’s term, the total $80 billion in total sales will bring Brazil’s debt-to-GDP ratio down to 81% from 85% (Chart I-10). Bottom Line: Although the sale of the largest “strategic” state-owned companies will not happen, the administration’s privatization program can succeed by diverting congressional efforts to non-strategic companies. The administration can also move alone on non-core assets. This is a net positive for overall productivity, competitiveness, and fiscal sustainability although it is not huge in magnitude. Less Optimism On Tax And Tariff Reform In addition to the outsized economic role of the state, Brazil has been suffering from inefficiencies due to the relatively elevated tax burden and overly complicated system (Chart I-11). This has reduced its ranking in the World Bank’s Doing Business rankings which assigns it the seventh worst spot in paying taxes (Chart I-12). The nearly six thousand laws governing taxes in Brazil likely hold back the country’s FDI potential and encourages tax evasion. Chart I-11Brazilians Suffer From Outsized Tax Burden …
Brazil: Just Above "Stall Speed"
Brazil: Just Above "Stall Speed"
Chart I-12… Contributing To An Unattractive Business Environment
Brazil: Just Above "Stall Speed"
Brazil: Just Above "Stall Speed"
Given Brazil’s poor fiscal standing and large debt load, there is no room to reduce taxes. Rather, reform efforts are centered around simplifying the tax code in order to improve the investment environment. A complete overhaul requires the approval of three-fifths of congress. Pension reform shows this is theoretically possible, but the process will be lengthy and unlikely to occur before the second half of next year. There are currently four main proposals being considered. All aim to simplify the tax system by combining all current taxes imposed on consumption into a single tax. The proposal most advanced in the legislative process enjoys the support of Maia and has already been deemed lawful by a lower house committee. It recommends applying the single tax rate uniformly across all states. Bolsonaro’s administration is also designing its own reform proposals, but has yet to release details. As revealed by the firing of special secretary to Brazil’s federal revenue service Marcos Cintra on September 11, the cabinet is in conflict over the reintroduction of a financial transactions tax, such as the CPMF which expired in 2007. Chart I-3 above illustrates that the tax is generally unpopular, causing Bolsonaro to be staunchly against the tax, while Guedes has indicated that it should be part of the reform. The proposal is expected to be put to lawmakers in a congressional committee responsible for drafting the bill by October 8 before being introduced to the lower house. However, given that the financial transactions tax is unpopular and a point of contention in the administration, the timeline will likely be delayed. Moreover the legislative approval process will be lengthy. While Bezerra Coelho does not expect tax reform to be approved until the second half of 2020, this is an optimistic assessment. Given the complexity of overhauling the tax system, we expect a one-year process at minimum and therefore doubt that approval will come in 2020. Instead modifications to the current system may be easier to enact and implement. Guedes has also signaled the need for a reduction in Brazil’s extremely elevated import tariffs which have been erected amid a policy of import substitution (Chart I-13). With most tariffs in the range of 10% and 35%, Guedes has stated that the government plans to reduce tariffs by 10 percentage points during Bolsonaro’s four year term by cutting the rate by one percentage point in the first year, two in the second, three in the third, and four in the fourth. This can be done by executive action and does not require legislation. What about Bolsonaro's trade liberalization push? On the campaign trail, Bolsonaro expressed his intention to step back from Mercosur and instead prioritize bilateral trade with rich countries such as the United States. However, given the importance of the bloc to Brazilian trade, the reality is that Bolsonaro cannot afford to neglect these countries (Chart I-14). The recently agreed EU-Mercosur trade deal, 20 years in the making, could create opportunities for Brazil over the long-run, but it is being held up by European countries as appetite for free trade deals becomes politically problematic across the world. Chart I-13Elevated Tariff Rate Hurts Brazil's Competitiveness
Elevated Tariff Rate Hurts Brazil's Competitiveness
Elevated Tariff Rate Hurts Brazil's Competitiveness
Chart I-14Trade Surplus With Mercosur Is Reliable
Trade Surplus With Mercosur Is Reliable
Trade Surplus With Mercosur Is Reliable
While greater integration with global trade will increase Brazil’s market access – a positive for exports – it also results in increased competition and a threat to existing companies that are unable to compete at an international level over the near term. Thus it is not immediately clear whether trade liberalization will generate net gains for Brazil’s economy in the short term. If Bolsonaro and Guedes do not move immediately, they will have to pause these efforts in the 2021 lead up to the 2022 election. Moreover the Mercosur agreement, as well as Brazil’s general bilateral trade with Argentina, are at risk if opposition leader Alberto Fernandez wins the presidential election on October 27. A return to protectionist policies by Argentina could harm Brazilian exports and threaten progress on the Mercosur trade bloc. There is more reason to be optimistic about privatization than about tax reform or trade liberalization. Bottom Line: There is more reason to be optimistic about privatization efforts than about the passage of a major overhaul to Brazil’s tax system or the integration of Brazil with global markets. Nevertheless, ongoing efforts should sustain an improvement in “animal spirits” in the short term and create some potential for structural improvements over the long term. The Economy: A Stall Speed Risk Chart I-15A Slow Grinding Recovery
A Slow Grinding Recovery
A Slow Grinding Recovery
The Brazilian economy is en route to recovery, albeit a slow one. The level of economic activity is still well below its pre-recession level but is grinding slowly back (Chart I-15). The key economic risk is stall speed. Like an aircraft, if the pace of growth falls below stall speed, gravity forces will overwhelm, and the economy will descend into a recession. In the case of Brazil, gravity forces refer to indebtedness – public debt, household debt servicing costs and corporate foreign currency debt. The path of least resistance for the business cycle is up and bullishness on Brazil is pervasive in the global investment community. Nevertheless, the economy remains very fragile. At the current juncture, while acknowledging that odds for the positive outlook to pan out are reasonably high, we would like to emphasize that gravity forces remain acute in Brazil. While odds for the positive outlook to pan out are high, gravity forces remain reasonably acute. Weakening narrow money growth fore shadows a weaker pace of nominal and real economic activity (Chart I-16). Brazilian households have increasingly relied on credit cards and revolving credit lines to finance their consumption in recent years. These types of credit carry high interest rates. Consequently, at 21% of disposable income, household debt servicing remains very elevated despite a large reduction in bond yields and policy rates (Chart I-17). Chart I-16Is Growth About To Stall?
Is Growth About To Stall?
Is Growth About To Stall?
Chart I-17Household Servicing Costs Remain Elevated
Household Servicing Costs Remain Elevated
Household Servicing Costs Remain Elevated
Private banks have experienced a modest uptick in non-performing loans (NPLs) (Chart I-18). This may incentivize private banks to moderate credit growth. With public banks deleveraging or shrinking their balance sheets, any moderation in private bank lending could stall the pace of growth in the economy. Interestingly, all-time low bond yields and the Selic rate have not yet translated into a meaningful recovery in real estate prices and new construction launches remain anemic (Chart I-19). Chart I-18Private Banks NPLs And Credit Growth
Private Banks NPLs And Credit Growth
Private Banks NPLs And Credit Growth
Chart I-19Weak Property Market Despite Low Interest Rates
Weak Property Market Despite Low Interest Rates
Weak Property Market Despite Low Interest Rates
Fiscal policy is straightjacketed by the spending cap rule, which indexes government spending to the rate of inflation of the previous year. Nominal fiscal spending will grow only 4.3% this year and will expand by a mere 3.4% in 2020. Foreign debt obligations (FDO) – the sum of short-term claims, interest payments and amortization over the next 12 months – stand at $180 billion, equivalent to 78% of Brazil’s annual exports (Chart I-20). The current account deficit will continue widening if domestic demand and, consequently, imports recover. Foreign funding requirements – FDO plus the current account balance – are substantial, standing at $250 billion (Chart I-21). If portfolio flows to EM are disturbed, Brazil will feel the pain. Chart I-20Foreign Debt Obligation Are Elevated
Foreign Debt Obligation Are Elevated
Foreign Debt Obligation Are Elevated
Chart I-21Brazil Has Large Funding Gap...
Brazil Has Large Funding Gap...
Brazil Has Large Funding Gap...
Chart I-22...With Exports Contracting
...With Exports Contracting
...With Exports Contracting
With export growth contracting by double digits on both a value and volume basis (Chart I-22), the demand vesus supply of dollars in Brazil will likely keep the greenback well bid versus the Brazilian real. The nation’s pension bill is a very positive and much-needed step in the structural reform process. However, in its current form, it is insufficient to make public debt dynamics sustainable – i.e., halt the rise in the government debt-to-GDP ratio. Bottom Line: The path of least resistance for the business cycle is up. However, the economy remains very fragile. A negative external or domestic shock could cause the Brazilian economy to stall speed. Barring such negative shocks, the economy will continue its recovery. Have Financial Markets Reached Escape Velocity? Financial markets are vulnerable to the risk of stall speed on both the structural reforms and economic growth fronts. This is especially true now that equity and bond prices have risen substantially. If the pace of structural reforms or the economy fall victim to stall speed, financial markets will tumble. On the contrary, if the reform agenda progresses and economic growth accelerates, financial markets will reach escape velocity and sustain their bull markets. Apart from the outlook for both structural reforms and the business cycle, the largest risks to Brazil’s financial markets are as follows: BCA’s Emerging Markets Strategy team expects base metals and energy prices to decline further, weighing on EM currencies. The main culprit is weakening Chinese demand. This scenario entails non-negligible odds of Brazilian real depreciation because the latter has historically been positively correlated with commodity prices (Chart I-23). Brazil has become a net exporter of oil, so lower crude prices are negative for the currency. Importantly, the real is not cheap based on the real effective exchange rate (Chart I-24). Chart I-23Commodity Prices Hold The Key
Commodity Prices Hold The Key
Commodity Prices Hold The Key
Chart I-24Real Valuations Are Not Yet Attractive
Real Valuations Are Not Yet Attractive
Real Valuations Are Not Yet Attractive
The gap between local currency and U.S. dollar bond yields has narrowed to a record low. This along with the large overhang of corporate foreign currency debt, as discussed above, is already encouraging debt swap - corporates borrow in reals to repay their foreign currency debt. These capital outflows from residents will continue weighing on the exchange rate. A widening current account deficit has historically foreshadowed lower share prices in U.S. dollar terms (Chart I-25). Finally, local bond yields, and sovereign and corporate spreads have plummeted despite currency depreciation. Such resilience by fixed-income markets to currency depreciation is historically unprecedented. It remains to be seen if yields and credit spreads can remain low if the currency breaks down. Bottom Line: Barring stall speed in structural reforms and economic growth, downside in Brazilian asset prices is limited. However, near-term volatility is likely as the nation’s financial markets are overbought and investor sentiment is very bullish. Besides, equity prices in dollar terms have not broken above important technical resistance levels, as shown in Chart I-26. Hence, we can say the bull market in the Bovespa in dollar terms has not yet reached escape velocity. Chart I-25The Current Account Is A Risk To Share Prices
The Current Account Is A Risk To Share Prices
The Current Account Is A Risk To Share Prices
Chart I-26The Bovespa In Dollar Terms Has Not Reached Escape Velocity
The Bovespa In Dollar Terms Has Not Reached Escape Velocity
The Bovespa In Dollar Terms Has Not Reached Escape Velocity
Investment Recommendations Weighing the pros and cons, we recommend upgrading Brazil from underweight to neutral for dedicated EM equity, credit and domestic bond portfolios. Given the potential risks discussed above, we are looking for a better entry point to upgrade Brazil to overweight. We upgraded Brazil to overweight on October 9, 2018 following the first round of presidential elections but downgraded it on April 4, 2019 when volatility began rising. In retrospect, that was the wrong decision. Volatility could rise but there is a basis for giving the administration the benefit of the doubt as long as it remains committed to pro-market reforms. Chart I-27Real Estate Stocks Offer An Opportunity
bca.ems_sr_2019_09_27_s1_c27
bca.ems_sr_2019_09_27_s1_c27
For long-term absolute return investors the key risk is the exchange rate. Hence, these investors should adopt a positive long-term bias for local currency returns but hedge currency risk periodically. Currently, global financial markets are in a juncture where the dollar will likely move higher and the Brazilian real will depreciate. Hence, investors already invested in Brazil should hedge exchange rate risk. Within the Brazilian equity universe, BCA’s Emerging Markets Strategy service favors real estate because low nominal and real interest rates are bullish for the property sector. The latter was devastated during the recession and has not yet recovered (Chart I-27). Consequently, for long-term investors, we continue recommending Brazilian real estate plays/assets on dips. Footnotes 1 "Stall speed" is the velocity below which an aircraft will descend, or 'stall', regardless of its angle of attack. If an aircraft's airspeed is greater than the stall speed then the pilot can increase the aircraft's angle of attack to achieve additional lift. 2 So far in 2019 the government has already sold off $12.3 billion worth of assets from Petrobras, $4.9 billion in shares held in various companies, and gained $1.9 billion from leases on airports, railways and ports.
Highlights President Trump’s support among Republicans and lack of smoking gun evidence will prevent his removal from office. Trade risk will increase if Trump’s approval benefits from impeachment proceedings and the U.S. economy is resilient. Political risk on the European mainland is falling. However, watch out for Russia and Turkey, and short 10-year versus 2-year gilts. A new election in Spain may not resolve the political deadlock. Book gains on our Hong Kong Hang Seng short. Feature Impeachment proceedings against U.S. President Donald Trump, the brazen Iranian attack on Saudi Arabia, the persistence of trade war risk, and additional weak data from China and Europe all suggest that investors should remain risk averse for now. Specifically, Trump’s impeachment could drive him to seek distractions abroad – abandoning the tactical retreat from aggressive foreign and trade policy that had only just begun. Geopolitical risk outside of the hot spots is falling, especially in Europe. The risk of a no-deal Brexit has collapsed in line with our expectations. Italy and Germany have pleased markets by providing some fiscal stimulus sans populism. In France, President Emmanuel Macron’s popularity is recovering. And – as we discuss in this report – Spain’s election will not add any significant fear factor. In what follows we introduce a new GeoRisk Indicator, review the signal from all of our indicators over the past month, and then focus on Spain. Fear U.S. Politics, Not Impeachment The House Democrats’ decision to impeach Trump gives investors another reason to remain cautious on risk assets. Why not be bullish? It is true that impeachment without smoking gun evidence increases Trump’s chances of reelection, which is market positive relative to a Democratic victory. President Trump is virtually invulnerable to Democratic impeachment measures as long as Republicans continue to support him at a 91% rate (Chart 1). Senators will not defect in these circumstances, so Trump will not be removed from office. Trump is invulnerable to impeachment measures as long as GOP support remains high. Moreover the transcript of his phone conversation with Ukrainian President Volodymyr Zelenskiy did not produce a bombshell: there is no explicit quid pro quo in which President Trump suggests he will withhold military aid to Ukraine in exchange for an investigation into former Vice President Joe Biden’s and his son Hunter’s doings involving Ukraine. Any wrongdoing is therefore debatable, pending further evidence. This includes evidence beyond the “whistleblower’s complaint,” which suggests that the Trump team attempted to stifle the transcript of the aforementioned phone call. The point is that the grassroots GOP and Senate are the final arbiters of the debate. The problem is that scandal and impeachment will still likely feed equity market volatility (Chart 2). The House Democrats could turn up new evidence now that they are fully focused on impeachment and hearing from whistleblowers in the intelligence community. Chart 1GOP Not Yet Willing To Impeach Trump
Impeachment, Trade War, And A Sojourn To Spain – GeoRisk Update: September 27, 2019
Impeachment, Trade War, And A Sojourn To Spain – GeoRisk Update: September 27, 2019
Impeachment also has a negative market impact via the Democratic Party’s primary election. Elizabeth Warren has not dislodged Biden in the early Democratic Primary yet. Chart 2Impeachment Proceedings Likely To Raise Vol
Impeachment Proceedings Likely To Raise Vol
Impeachment Proceedings Likely To Raise Vol
If she does, it will have a sizable negative impact on equity markets, as President Trump will still be only slightly favored to win reelection. Under any circumstances, this election will be extremely close, it has significant implications for fiscal policy and regulation, and therefore it will create a lot of uncertainty between now and November 2020. The whistleblower episode has if anything aggravated this uncertainty. As mentioned at the top of the report, if impeachment proceedings ever gain any traction they could drive Trump to seek distractions abroad – abandoning the tactical retreat from aggressive foreign and trade policy that had only just begun. Finally, Trump’s reelection, while more market-friendly than the alternative and likely to trigger a relief rally, is not as bullish as meets the eye. Trump’s policies in the second term will not be as favorable to corporates as in the first term. Unshackled by electoral concerns yet still facing a Democratic House, Trump will not be able to cut taxes but he will be likely to conduct his foreign and trade policy even more aggressively. This is not a market-positive outlook, regardless of whether it is beneficial to U.S. interests over the long run. Bottom Line: President Trump’s approval among Republican voters is the critical data point. Unless they abandon faith, the senate will not turn, and Trump’s support may even go up. But this is not a reason to turn bullish. The coming year will inevitably see a horror show of American political dysfunction that will lead to volatility and potentially escalating conflicts abroad. Introducing … Our Sino-American Trade Risk Indicator This week we introduce a new GeoRisk Indicator for the U.S.-China trade war (Chart 3). The indicator is based on the outperformance of overall developed market equities relative to those same equities that have high exposure to China, and on China’s private credit growth (“total social financing”). As our chart commentary shows, the indicator corresponds with the course of events throughout the trade war. It also correlates fairly well with alternative measures of trade risk, such as the count of key terms in news reports. Chart 3Trade Risk Will Go Up From Here
Impeachment, Trade War, And A Sojourn To Spain – GeoRisk Update: September 27, 2019
Impeachment, Trade War, And A Sojourn To Spain – GeoRisk Update: September 27, 2019
As we go to press, our indicator suggests that trade-war related risk is increasing. Over the past month Trump has staged a tactical retreat on foreign and trade policy in order to control economic risks ahead of the election. Our indicator suggests this is now priced. The problem is that Trump’s re-election risk enables China to drive a harder bargain, which is tentatively confirmed by China’s detainment of a FedEx employee (signaling it can trouble U.S. companies) and its cancellation of a tour of farms in Montana and Nebraska. These were not major events but they suggest China smells Trump’s hesitation and is going on the offensive in the negotiations. Principal negotiators are meeting in early October for a highly significant round of talks. If these result in substantive statements of progress – and evidence that the near-finished draft text from April is being completed – they could set up a summit between Presidents Xi Jinping and Donald Trump in November at the APEC summit in Santiago, Chile. At this point we would need to upgrade our 40% chance that a deal is concluded by November 2020. If the talks do not conclude with positive public outcomes then investors should not take it lightly. The Q4 negotiations are possibly the last attempt at a deal prior to the U.S. election. If there is no word of a Trump-Xi summit, it will confirm our pessimistic outlook on the end game. U.S.-China trade talks are unlikely to produce a durable agreement. Ultimately we do not believe that the U.S.-China trade talks will produce a conclusive and durable agreement that substantially removes trade war risk and uncertainty. This is especially the case if financial market and economic pressure – amid global monetary policy easing – is not pressing enough to force policymakers to compromise. But we will watch closely for any signs that Trump’s tactical retreat is surviving the impeachment proceedings and eliciting reciprocation from China, as this would point to a more sanguine outlook. Bottom Line: As long as the president’s approval rating benefits from the Democratic Party’s impeachment proceedings, and the U.S. economy is resilient, as we expect, Trump can avoid any capitulation to a shallow deal with China. Trade risk could go up from here. By the same token, impeachment proceedings could eventually force Trump to change tactics yet again and stake out a much more aggressive posture in foreign affairs. If impeachment gains traction, or a bear market develops, he could become more aggressive than at any stage in his presidency – and this aggression could be directed at China (or Iran, North Korea, Venezuela, or another country). The risk to our view is that China accepts Trump’s trade position in order to win a reprieve for its economy and the two sides agree to a deal at the APEC summit. European Risk Falls, While Russian And Turkish Risk Can Hardly Fall Further Elsewhere our measures of geopolitical risk indicate a decrease in tensions for a number of developed and emerging markets (see Appendix). In Germany, risk can rise a bit from current levels but is mostly contained – this is not the case in the United Kingdom beyond the very short run. In Russia and Turkey, risk can hardly fall further. Take, for starters, Germany, where political risk declined after Chancellor Angela Merkel’s ruling coalition agreed to a 50 billion euro fiscal spending package to battle climate change. This agreement confirms our assessment that while German politics are fundamentally stable, the administration will be reactive rather than proactive in applying stimulus. Europe will have to wait for a global crisis, or a new German government, for a true “game changer” in German fiscal policy. Perhaps the Green Party, which is surging in polls and as such drove Merkel into this climate spending, will enable such a development. But it is too early to say. Meanwhile Merkel’s lame duck years and external factors will prevent political risk from subsiding completely. We see the odds of U.S. car tariffs at no higher than 30%, at least as long as Sino-American tensions persist. By contrast, the United Kingdom’s political risks are not contained despite a marked improvement this month. The Supreme Court’s decision on September 25 to nullify Prime Minister Boris Johnson’s prorogation of parliament drove another nail into the coffin of his threat to pull the country out of the EU without a deal. This was a gambit to extract concessions from the EU that has utterly flopped.1 Since it was the most credible threat of a no-deal exit that is likely to be mounted, its failure should mark a step down in political risk for the U.K. and its neighbors. However, paradoxically, our GeoRisk indicator failed to corroborate the pound’s steep slide throughout the summer and now, as no-deal is closed off, it has stopped falling. The reason is that the pound’s rate of depreciation remained relatively flat over the summer, while U.K. manufacturing PMI – one of the explanatory variables in our indicator – dropped off much faster as global manufacturing plummeted. As a result, our indicator registered this as a decrease in political risk. The world feared recession more than it feared a no-deal Brexit – and this turned out to be the right call by the market. But the situation will reverse if global growth improves and new British elections are scheduled, since the latter could well revive the no-deal exit risk, especially if the Tories are returned with thin majority under a coalition. The truth is that the Brexit saga is far from over and the U.K. faces an election, a possible left-wing government, and ultimately resilient populism once it becomes clear that neither leaving nor staying in the EU will resolve the middle class’s angst. Our long GBP-USD recommendation is necessarily tactical and we will turn sellers at $1.30. In emerging markets, Russia and Turkey have seen political risk fall so low that it is hard to see it falling any further without some political development causing an increase. Based on our latest assessment, Turkey is almost assured to see a spike in risk in the near future. This could happen because of the formation of a domestic political alliance against President Recep Erdogan or because of the increase in external risks centering on the fragile U.S.-Turkey deal on Syria. Tensions with Iran could also produce oil price shocks that weaken the economy and embolden the opposition. As for Russia, our base case is that Russia will continue to focus internal domestic problems to the neglect of foreign objectives, which helps geopolitical risk stay low. With U.S. politics in turmoil and a possible conflict with Iran on the horizon, Moscow has no reason to attract hostile attention to itself. Nevertheless Moscow has proved unpredictable and aggressive throughout the Putin era, it has no real loyalty to Trump yet could fall victim to the Democrats’ wrath, and it has an incentive to fan the flames in the Middle East and Asia Pacific. So to expect geopolitical risk to fall much further is to tempt the fates. Bottom Line: European political risk is falling, but Merkel’s lame duck status and trade war make German risk likely to rise from here despite stable political fundamentals. The United Kingdom still faces generationally elevated political risk despite the happy conclusion of the no-deal risk this summer. Go short 10-year versus 2-year gilts. Russia should remain quiet for now, but Turkey is almost guaranteed to experience a rise in political risk. Spain: Election Could Surprise But Risks Are Low Spanish voters will head to the polls on November 10 for the fourth time in four years after political leaders failed to reach a deal to form a permanent government. The Spanish Socialist Workers’ Party (PSOE) has served as a caretaker government after winning 123 out of 350 seats in the snap election in April. A new Spanish election will not resolve the current political deadlock. Prime Minister and PSOE leader Pedro Sanchez failed to be confirmed in July, and has since attempted to make a governing deal with the left-wing, anti-establishment party Podemos. However, PSOE is not looking for a full coalition but merely external support to continue governing in the minority. Hence it is only offering Podemos non-ministerial agencies (rather than high-level cabinet positions) in negotiations, leaving Podemos and other parties ready for an election. The outcome of the upcoming election may not differ much from the April election. The Spanish voter is not demanding change. Unemployment and underemployment have been decreasing, and wage growth has been positive since 2014 (Chart 4). In opinion polls, support for the various parties has not shifted significantly (Chart 5, top panel). PSOE is still leading by a considerable gap. Chart 4Spanish Voter Is Not Demanding Change
Spanish Voter Is Not Demanding Change
Spanish Voter Is Not Demanding Change
However, the election will increase uncertainty at an inconvenient time, and it could produce surprises. PSOE’s support has slightly decreased since late July, when negotiations with Podemos started falling apart. Chart 5Not Much Change In Polls...
Not Much Change In Polls...
Not Much Change In Polls...
Even if PSOE and Podemos form a governing pact, their combined popular support is not significantly higher than the combined support for the three main conservative parties. These are the Popular Party, Ciudadanos, and Vox (Chart 5, bottom panel) – which recently showed they can work together by making a governing deal to rule the regional government in Madrid. Chart 6…But Lower Turnout Could Hurt The Left
Impeachment, Trade War, And A Sojourn To Spain – GeoRisk Update: September 27, 2019
Impeachment, Trade War, And A Sojourn To Spain – GeoRisk Update: September 27, 2019
The Socialist Party hopes to capture borderline voters from Ciudadanos, namely those who are skeptical towards the party’s right-wing populist shift and hardening stance regarding Catalonia. However, even capturing as many as half of Ciudadanos’ voters would place PSOE support at ~37% – far short of what is needed to form a single-party majority government. Another factor that can hurt PSOE is voter turnout. Spanish voters have been less and less interested in supporting any party at all since the April election. A decrease in turnout would hurt left-wing parties the most, given that voters blame Podemos and PSOE more than PP and Ciudadanos for the failure to form a government (Chart 6). The most likely outcomes are the status quo, or a PSOE-Podemos alliance. But a conservative victory cannot be ruled out. In the former two cases, the implication is slightly more positive fiscal accommodation that is beneficial in the short-term, but at the risk of a loss of reform momentum that has long-term negative implications. To put this into context, Spanish politics remains domestic-oriented, not a threat to European integration. Voters in Spain are some of the most Europhile on the continent, both in terms of the currency and EU membership (Chart 7). Spain is a primary beneficiary of EU budget allocations, along with Italy. Even Spain’s extreme right-wing party Vox is not considered to be “hard euroskeptic.” Within Spain, however, political polarization is a problem. Inequality and social immobility are a concern, if not as extreme as in Italy, the U.K., or the United States. Moreover the Catalan separatist crisis is divisive. While a new Catalonian election is not scheduled until 2022, the pro-independence coalition of the Republican Left of Catalonia and Catalonia Yes has been gaining momentum in the polls, and Ciudadanos’s support plummeted since the party hardened its stance on Catalonia earlier this year (Chart 8). Catalonia is by no means going independent – support for independence in the region peaked in 2013 – but it remains a driving factor in Spanish politics. Chart 7Spaniards Love Europe
Spaniards Love Europe
Spaniards Love Europe
Chart 8Catalonia Is A Divisive Issue
Impeachment, Trade War, And A Sojourn To Spain – GeoRisk Update: September 27, 2019
Impeachment, Trade War, And A Sojourn To Spain – GeoRisk Update: September 27, 2019
In the very short term, election paralysis introduces fiscal policy crosswinds. On one hand, regional governments may be forced to cut spending. The regions were expecting to receive EUR 5 billion more than last year, which was promised to be spent in part on healthcare and education. Until a stable (or at least caretaker) government can approve a 2019 budget, the regions will base their 2019 budgets on last year’s numbers, meaning they will have to cut any projected increases in spending. Yet on the other hand, the budget deficit will widen as taxes fail to be collected. In late 2018 Spain approved increases in pensions, civil servants’ salaries, and minimum wage by decree, but any corresponding revenue increases that were to be implemented in the 2019 budget will fail to materialize until government is in place, putting upward pressure on the deficit. Beyond the election the trend should be slightly greater fiscal thrust due to the continental slowdown. Spain has some fiscal room to play with – its budget deficit is projected to decrease to 2% in 2019 and 1.1% in 2020.2 The more conservative estimate by the European Commission forecasts the 2019 and 2020 deficits to be 2.3% and 2%, respectively (Chart 9). This means that Spain can provide roughly 10-15 billion euros worth of additional stimulus in 2020 without so much as hinting at triggering Excessive Deficit Procedures, a welcome change after nearly a decade of austerity. The risk is that Spain’s structural reform momentum could be lost with negative long-term consequences. In 2012 Spain undertook painful labor and pension reforms that underpinned its impressive economic recovery. The economy continues to grow faster than the average among its peers, unemployment has fallen by 12% in the past six years, and export competitiveness has had one of the sharpest recoveries in Europe since 2008 (Chart 10). This recovery has now begun to slow down, and the current political deadlock means that reforms could be rolled back farther than the market prefers. Chart 9Spain Has Some Fiscal Room
Spain Has Some Fiscal Room
Spain Has Some Fiscal Room
This is more likely to be avoided if a surprise occurs and the conservatives come back into power, although that would also mean less accommodative near-term policies. Chart 10Recovery Starting To Slow
Recovery Starting To Slow
Recovery Starting To Slow
Bottom Line: Our geopolitical risk indicator is signaling subdued levels of risk for Spain. This is fitting as the election may not change anything and at any rate the country will remain in an uneasy equilibrium. Politics are fundamentally more stable than in the populist-afflicted developed countries – the U.S., U.K., and Italy. However, an outcome that produces a left-wing government will lead to greater short-term fiscal accommodation at the expense of Spain’s recent outstanding progress on structural reforms. Housekeeping We are booking gains on our Hong Kong Hang Seng short. Unrest is not yet over, but is about to peak as we approach October 1, the National Day of the People’s Republic of China, and Beijing will look to avoid an aggressive intervention. Ekaterina Shtrevensky, Research Analyst ekaterinas@bcaresearch.com Matt Gertken, Vice President Geopolitical Strategist mattg@bcaresearch.com Footnotes 1 The Supreme Court deemed Johnson’s government’s prorogation of parliament an unlawful frustration of parliament’s role as sovereign lawgiver and government overseer without reasonable justification. The court was larger than usual, with 11 judges, and they ruled unanimously against the prorogation. We had expected the vote at least to be narrow – given the historic uses of prorogation, the fact that parliament still had time to act prior to October 31 Brexit Day, and the prime minister’s historical authority over foreign affairs and treaties. But the Supreme Court has risen to fill the power vacuum created by parliament’s paralysis amid the Brexit saga; it has “quashed” what might have become a neo-Stuart precedent that prime ministers can curtail parliament’s role at important junctures. The pragmatic, near-term consequence is the reduction in the political and economic risks of a no-deal exit; but the long-term consequence may be the rise of the judiciary to greater prominence within Britain’s ever-evolving constitutional system. 2 Please see “Stability Programme Update 2019-2022, Kingdom of Spain,” available at www.ec.europa.eu. U.K.: GeoRisk Indicator
U.K.: GEORISK INDICATOR
U.K.: GEORISK INDICATOR
France: GeoRisk Indicator
FRANCE: GEORISK INDICATOR
FRANCE: GEORISK INDICATOR
Germany: GeoRisk Indicator
GERMANY: GEORISK INDICATOR
GERMANY: GEORISK INDICATOR
Spain: GeoRisk Indicator
SPAIN: GEORISK INDICATOR
SPAIN: GEORISK INDICATOR
Italy: GeoRisk Indicator
ITALY: GEORISK INDICATOR
ITALY: GEORISK INDICATOR
Russia: GeoRisk Indicator
RUSSIA: GEORISK INDICATOR
RUSSIA: GEORISK INDICATOR
Turkey: GeoRisk Indicator
TURKEY: GEORISK INDICATOR
TURKEY: GEORISK INDICATOR
Brazil: GeoRisk Indicator
BRAZIL: GEORISK INDICATOR
BRAZIL: GEORISK INDICATOR
Taiwan: GeoRisk Indicator
TAIWAN: GEORISK INDICATOR
TAIWAN: GEORISK INDICATOR
Korea: GeoRisk Indicator
KOREA: GEORISK INDICATOR
KOREA: GEORISK INDICATOR
What's On The Geopolitical Radar?
Impeachment, Trade War, And A Sojourn To Spain – GeoRisk Update: September 27, 2019
Impeachment, Trade War, And A Sojourn To Spain – GeoRisk Update: September 27, 2019
Section III: Geopolitical Calendar
Highlights We are upgrading Indian stocks from underweight to neutral within an EM equity portfolio. Nevertheless, the outlook for the absolute performance of Indian share prices remains downbeat. Odds are that local bond yields will rise due to a widening budget deficit. Higher bond yields and still depressed growth will overwhelm the one-off positive effect of corporate tax cuts on equity prices. Feature The unexpected extraordinary measure was adopted because growth in the Indian economy has downshifted drastically. The Indian government resorted to an unexpected large corporate income tax cut last week. The government reduced the effective corporate tax rate from 35% to around 25%. What are the investment implications of this dramatic policy change? Why The Extraordinary Measure? The unexpected extraordinary measure was adopted because growth in the Indian economy has downshifted drastically: Household discretionary spending is shrinking (Chart I-1). Measures of capital spending by enterprises are extremely weak, and in many cases are also contracting (Chart I-2). Chart I-1India: Household Discretionary Spending Is Contracting
India: Household Discretionary Spending Is Contracting
India: Household Discretionary Spending Is Contracting
Chart I-2India: Capital Spending Is In The Doldrums
India: Capital Spending Is In The Doldrums
India: Capital Spending Is In The Doldrums
Earnings per share for the top 500 listed Indian companies are down 8% from a year ago in local currency terms (Chart I-3). Core measures of inflation are low (Chart I-4). Chart I-3Indian Corporate Earnings Are Contracting
Indian Corporate Earnings Are Contracting
Indian Corporate Earnings Are Contracting
Chart I-4Inflation Is Extremely Subdued
Inflation Is Extremely Subdued
Inflation Is Extremely Subdued
The central bank has been cutting interest rates, but borrowing costs in real terms remain elevated. The reason is that inflation has dropped, pushing lending rates higher in real (inflation-adjusted) terms (Chart I-5). Besides, corporate borrowing costs (local currency BBB corporate bond yields) are above nominal GDP growth (Chart I-6). This implies that borrowing costs are not at levels conducive for capital expenditure outlays among businesses. The government’s decision to cut corporate income taxes drastically is the right policy decision in the current environment. Policymakers are hoping businesses will in turn invest and a virtuous economic cycle will unfold. Chart I-5Real Rates Are High And Rising
Real Rates Are High And Rising
Real Rates Are High And Rising
Chart I-6Borrowing Rates Are High Relative To Nominal Growth
Borrowing Rates Are High Relative To Nominal Growth
Borrowing Rates Are High Relative To Nominal Growth
Chart I-7Commercial Bank Lending: Public Vs. Private
Commercial Bank Lending: Public Vs. Private
Commercial Bank Lending: Public Vs. Private
Finally, lenders are still licking their wounds from non-performing loans. Public banks have undergone retrenchment, non-bank finance companies are currently shrinking their balance sheets and private banks could be the next in line to reduce their pace of credit origination (Chart I-7). Realizing that gradual reduction in the central bank’s policy rates is unlikely to boost growth in the near term, authorities have resorted to fiscal policy to stimulate. India is an underinvested country and capital spending holds the key to its long-term growth potential. Therefore, the government’s decision to cut corporate income taxes drastically is the right policy decision in the current environment. Policymakers are hoping businesses will in turn invest and a virtuous economic cycle will unfold. A pertinent question for investors, however, is whether these policy measures will put a floor under share prices now or if a better buying opportunity lies ahead. Local Bond Yields Hold The Key To Stock Prices If government and corporate local bond yields rise materially in response to this fiscal stimulus, share prices will struggle. Chart I-8High Borrowing Costs Are Negative For Stock Prices
High Borrowing Costs Are Negative For Stock Prices
High Borrowing Costs Are Negative For Stock Prices
If domestic bond yields rise materially in response to this fiscal stimulus, share prices will struggle. In contrast, if local bond yields remain close to current levels, equity prices will fare well, especially relative to the EM benchmark (Chart I-8). Critically, stock prices are much more sensitive to interest rates and long-term growth expectations than to next year’s profits or dividends.1 The reduction in corporate taxes is a one-off event that will boost earnings and possibly dividends next year, but only next year. If interest rates rise or expectations of long-term nominal growth moderate, a one-off rise in corporate profits will not be sufficient to justify higher equity valuations. On the contrary, higher interest rates or lower nominal growth expectations will overwhelm the positive effect of one-off rise in corporate profits next year. As a result, the fair value of equities will drop, not rise. Bottom Line: Local currency bond yields and long-term growth expectations are much more important for equity valuations than the one-off rise in corporate earnings. The Outlook For Domestic Bonds Why would local bond yields spike amid lingering weak growth and very low inflation? The primary reason is a sharply widening fiscal deficit, instigating a need to increase issuance of government bonds. The central government’s overall fiscal deficit was 3.7% of GDP prior to the latest corporate tax cut. Combined with state governments, the aggregate fiscal deficit is around 6% of GDP. Going forward, the central budget deficit will considerably exceed the government’s 3.3% of GDP forecast for this fiscal year. On top of the corporate tax reductions, government revenue growth has been plunging and will continue to drop until at least the end of the current fiscal year – March 2020 – due to very sluggish nominal growth. Chart I-9India: Money Creation Versus The Fiscal Deficit
India: Money Creation Versus The Fiscal Deficit
India: Money Creation Versus The Fiscal Deficit
If broad money creation by commercial banks falls short of the aggregate fiscal deficit (which is equivalent to net government bond issuance), bond yields will come under upward pressure. Chart I-9 shows that as the aggregate fiscal deficit surges, the incremental increase in broad money supply might not be sufficient to absorb the widening deficit. Barring banks’ large purchases of bonds, this would entail that there is less financing available for both the public and private sectors. This would push bond yields higher. There are rising odds that new bond issuance is unlikely to be easily absorbed by the market. At 28% of deposits, banks’ holdings of government bonds are already well above the statutory minimum of 18.75%. Foreigners’ holdings of government bonds have also surged since 2014. Foreign investors’ appetite for Indian government bonds will likely be sluggish in the coming months for the following reasons: A sharply rising public debt-to-GDP ratio from its current elevated level of 67%. EM currency depreciation will likely trigger foreign capital outflows from EM fixed-income markets, which will erode international demand for Indian local currency bonds. Banks account for 42% of government bond holdings, insurance companies 23%, and mutual funds and foreigners 3% each. Altogether, they presently account for 71% of outstanding government bonds. Hence, banks hold the key to financing both public and private sectors. Chart I-10RBI Ownership Of Government Bonds
RBI Ownership Of Government Bonds
RBI Ownership Of Government Bonds
A risk to the scenario of higher bond yields is if Indian’s central bank further accelerates its ongoing purchases of government bonds (Chart I-10). In such a case, bond yields will be capped. However, this entails quantitative easing or monetization of public debt. The latter will lead to currency depreciation and trigger capital flight. Bottom Line: Odds are that Indian government bond yields will drift higher. This will push up local currency corporate bond yields and in turn weigh on equity valuations. Investment Conclusions The outlook for the absolute performance of Indian share prices remains downbeat (Chart I-11, top panel). Nevertheless, we are using the underperformance of the past several months to upgrade this bourse from underweight to neutral within an EM equity portfolio (Chart I-11, bottom panel). Odds of equity outperformance versus the EM benchmark have risen because of the corporate tax cuts but are not high enough to justify an overweight allocation. Chart I-11Indian Stock Prices: Profiles Of Absolute And Relative Performance
Indian Stock Prices: Profiles Of Absolute And Relative Performance
Indian Stock Prices: Profiles Of Absolute And Relative Performance
Chart I-12Our Long Indian Software / Short EM Stocks Position
Our Long Indian Software / Short EM Stocks Position
Our Long Indian Software / Short EM Stocks Position
As is the case with other EM currencies, the rupee is vulnerable to a pullback in the coming months. Historically, foreign investors in India have cumulatively pumped $148 billion into equity and investment funds. Hence, accruing disappointments by foreign investors concerning India’s growth trajectory and fiscal deficits could trigger a period of outflows. A weaker currency and our theme of favoring DM growth plays versus EM continue warranting a long Indian software stocks / short overall EM equity index position. We have initiated this position on December 21, 2016 and it has produced sizable gains (Chart I-12). Fixed-income investors should continue betting on yield curve steepening by receiving 1-year / paying 10-year swap rates. Arthur Budaghyan Chief Emerging Markets Strategist arthurb@bcaresearch.com Ayman Kawtharani, Editor/Strategist ayman@bcaresearch.com Footnotes 1 The reason is that both interest rates and earnings long-term growth rate are present in the denominator of any cash flow discount model (Stock Price = Expected Dividends / (Interest rate – Earnings long-term growth rate)). Hence, they have the potential to affect share prices exponentially while dividends/profits are present in the numerator so their impact on equity prices is linear. Equities Recommendations Currencies, Credit And Fixed-Income Recommendations