Policy

Just as it appeared the slowdown in global industrial activity had run its course, commodity markets face another test of demand resiliency brought on by exogenous political shocks (Chart Of The Week). As luck would have it, these shocks – arriving in the form of an unexpected escalation of Sino-U.S. trade tensions – came on the heels of reports of further weakness in global manufacturing activity, a less-dovish-than-expected Fed, and a breach of the 7.0 level of the RMB/USD cross. The fallout – a global risk-off event – raises the spectre of a deeper trade war damaging EM GDP growth, which would weaken commodity demand. We continue to expect global fiscal and monetary stimulus to revive commodity demand, albeit further out the curve – i.e., later this year, as opposed to earlier in 2H19. Given the trade-war escalation, we are recommending a tactical long position in spot silver to hedge portfolio risk. The metal has been tracking gold’s ups and downs post-GFC – more so than industrial demand for silver – indicating it may have some catching up to do. This will make us strategically long gold, and tactically long silver at tonight’s close. Chart Of The WeekRenewed Trade Tensions Threaten Industrial Commodities' Recovery
Renewed Trade Tensions Threaten Industrial Commodities' Recovery
Renewed Trade Tensions Threaten Industrial Commodities' Recovery
Highlights Energy: Overweight. U.S. President Trump informed Congress earlier this week he was imposing a total economic embargo on Venezuela, which freezes assets of the Maduro government and all business dealings with its representatives except for humanitarian aid. Venezuela’s oil production averaged ~ 750k b/d in 2Q19, and was supported by the assistance of Russian technicians, U.S.-based Chevron Corp., and four service companies that were granted 90-day waivers by the U.S. to continue to do business in the country.1 Our long Sept19 Brent vs. short Sept20 Brent position expired with a gain of 101.7%. We remain long 4Q19 Brent vs. short 4Q20 Brent. Base Metals: Neutral. Industrial metals, iron ore and steel came under renewed selling pressure this week, in the wake of heightened trade tensions between the U.S. and China. Precious Metals: Neutral. Safe-haven demand rallied gold 3% over the week ended Tuesday, following the escalation in Sino-U.S. trade tensions. We continue to favor gold as a strategic portfolio hedge, particularly if central banks are compelled to accelerate monetary accommodation as global trade tensions rise, and are adding a tactical long silver position to our recommendations. Ags/Softs: Underweight. China’s Commerce Ministry reported U.S. ag products no longer are being purchased by Chinese companies earlier this week.2 U.S. President Trump’s decision to impose tariffs on Chinese imports to the U.S. were occasioned by his claim China was not living up to an agreement to increase agricultural purchases. This broke the truce in the Sino-U.S. trade war that accompanied the resumption in negotiations last month. Feature A recovery in industrial-commodity demand – particularly for oil and base metals – could be stretched out longer than we expected just a week ago. It’s still too early to tell whether the escalation in Sino-U.S. trade tensions will throw a spanner into the revival of commodity demand we’ve been expecting, but it does give us pause. Prior to the political shocks and other disappointments hitting markets this past week, our commodity demand gauges were indicating the slowdown in demand had – or was close to – run its course, and that EM demand, in particular, was set to revive. EM GDP growth drives commodity demand growth globally, which is why it is so important in our analysis. Our Chart of the Week illustrates this point, showing three relationships we've developed that allow us to track the evolution of EM GDP growth in something close to real time: BCA’s Global Industrial Activity (GIA) index, which is highly sensitive to economic activity in EM generally and China in particular;3 BCA’s Global Commodity Factor (GCF), which condenses the information contained in 28 commodity price series to a common factor using principal components analysis; and BCA’s EM Import Volume model, which generates an expectation of EM import volumes using mainly FX values for countries highly exposed to global trade. To be precise, we find the output of these three models shown in the Chart of the Week and EM GDP growth are deeply entwined.4 As can be seen in the chart, these models appeared to have bottomed and were preparing to hook up. This is supported by current global activity indicators (CAIs), particularly for China and EM, which still is showing positive y/y growth, even if its rate is slowing. (Chart 2), and the recent upturn in EM Financial Conditions we track here at BCA Research (Chart 3). Chart 2Global CAIs Support EM Growth Expectation
Global CAIs Support EM Growth Expectation
Global CAIs Support EM Growth Expectation
Chart 3EM Financial Conditions Move To Easier Setting
EM Financial Conditions Move To Easier Setting
EM Financial Conditions Move To Easier Setting
However, the escalation of Sino-U.S. trade tensions, coming off a somewhat disappointing Fed rate cut of 25bps and weak manufacturing data, was enough to erase 6% and 3% from the GSCI and Bloomberg commodity indices over the week ended Tuesday (Chart 4), and to lift volatility in industrial commodities’ prices sharply (Chart 5).5 Chart 4Policy Shock, Disappointing Rate Cut Hammer Commodity Indices
Policy Shock, Disappointing Rate Cut Hammer Commodity Indices
Policy Shock, Disappointing Rate Cut Hammer Commodity Indices
Chart 5Crude Oil, Copper Vol Jump On Policy Shock
Crude Oil, Copper Vol Jump On Policy Shock
Crude Oil, Copper Vol Jump On Policy Shock
A Fraught Situation The Sino-U.S. trade standoff is fraught with risk for both sides. A full-blown trade war could devolve into domestic recessions (there is a non-trivial risk to the global economy, as well). In addition, a kinetic military confrontation between China and its allies and the U.S. and its allies cannot be ruled out, as tensions rise. The case for resolving the trade dispute is strong. Our colleague Peter Berezin notes that while an escalation in the Sino-U.S. trade war “would tip the scales towards recession, the risk of such an outcome remains low.”6 An all-out trade war could push the U.S. economy into a recession next year, just as President Trump faced re-election, which strongly suggests a goodwill gesture or two from the U.S. – e.g., the Commerce Department renewing the licenses allowing U.S. firms to deal with Huawei – could go a long way to getting trade talks back on track. Our commodity demand gauges were indicating the slowdown in demand had – or was close to – run its course, and that EM demand, in particular, was set to revive. That said, we cannot gainsay the conclusions of our colleague Matt Gertken, who runs our Geopolitical Strategy: “The U.S.-China trade negotiations are falling apart at the moment. … (B)ut with the latest round of tariffs we think it is more likely that we will get a major escalation of strategic tensions and even saber-rattling,” as U.S. and Chinese positions harden, particularly around North Korea, Hong Kong and Taiwan.7 Clearly, the outcome of this latest round of the Sino-U.S. dispute is uncertain, and the risks are elevated. Moving To A Safe Haven: Silver While we continue to expect global fiscal and monetary stimulus will revive commodity demand, the shocks and disappointments visited upon markets could incline firms, households and investors globally to scale back on risky investments and purchases until the dust settles.8 Over the near term – i.e., 3 months or so – seeking refuge in a safe haven is sensible. In particular, we believe silver offers near-term cover, and expect it will continue to follow the evolution of gold prices.9 We expect central banks generally – the Fed in particular – will err on the side of maintaining monetary accommodation while uncertainty over trade and global growth prospects remains elevated. Fed Chairman Jay Powell's description of the central bank's July rate cut of 25 bps as a mid-cycle adjustment – and not the beginning of a lengthy cutting cycle – was perceived as a hawkish surprise, but markets appear to be pricing in additional cuts this year, which will support precious metals until further guidance from the Fed arrives. An escalation of the trade war likely would increase the probability the Fed cuts rates further at its next meeting, which would push down recession fears. The outcome of this latest round of the Sino-U.S. dispute is uncertain, and the risks are elevated. On the supply side, silver typically is mined as a secondary metal, and usually is found with gold, copper and lead deposits, according to the Silver Institute.10 On the demand side, investment and electronics account for much of the usage. Prior to the Global Financial Crisis (GFC), silver traded like a base metal, owing to the high growth rates in EM economies undergoing rapid industrialization, which led to higher consumption. This resulted in a large supply-deficit in most industrial commodities, including silver (Chart 6). Following the GFC, the evolution of silver’s price more closely tracked gold prices, following the massive injections of money and credit by central banks globally. (Chart 7).11 Chart 6Silver Is Less Industrial, More Precious Now
Silver Is Less Industrial, More Precious Now
Silver Is Less Industrial, More Precious Now
Chart 7Post-GFC, Silver and Gold Are More Closely Aligned
Post-GFC, Silver and Gold Are More Closely Aligned
Post-GFC, Silver and Gold Are More Closely Aligned
We expect this to continue, given our view central banks are likely to either increase or accelerate monetary accommodation to offset Sino-U.S. trade tensions, should they worsen. The U.S. dollar outlook remains important for precious metals. The dollar is a counter-cyclical currency. Thus, the escalation in trade tensions risks delaying the rebound we expect in emerging markets. This could support the USD for longer than we expected. Bottom Line: We expect commodity demand to revive on the back of global fiscal and monetary stimulus. However, exogenous political shocks along the way toward that revival likely will force households, firms and investors to re-think spending and investment decisions. This could potentially lead to reduced aggregate demand, in the event uncertainty around manufacturing, which still accounts for significant employment and output in EM economies, and global trade becomes too high. Until this is sorted, taking refuge in a safe haven is prudent. To hedge against this, we are recommending spot silver as a tactical portfolio hedge. We already are long gold as a strategic portfolio hedge, and this position is up 20% this year. Robert P. Ryan, Chief Commodity & Energy Strategist rryan@bcaresearch.com Hugo Bélanger, Senior Analyst Commodity & Energy Strategy HugoB@bcaresearch.com 1 Please see U.S. sanctions waiver for Chevron signals Venezuela solution near: opposition ambassador, published by S&P Global Platts July 30, 2019. 2 Please see U.S. farmers suffer 'body blow' as China slams door on farm purchases published by reuters.com August 5, 2019. 3 Please see Expanded Sino – U.S. Trade War Could Be Bullish For Base Metals, published by BCA Research’s Commodity & Energy Strategy May 9, 2019, for a discussion of the GIA index. The index is a weighted average of selected trade, currency, manufacturing PMIs, and Chinese industrial sector variables. The article is available at ces.bcaresearch.com. 4 This is to say there is strong two-way Granger causality between EM GDP and the output of the models shown above in the Chart of the Week. Knowing the output of one of the models allows one to forecast EM GDP growth, and vice versa. We will be doing further research into using these models to estimate the change in EM GDP at a higher frequency than the stand-alone EM GDP data are reported – e.g., the World Bank’s most recent actual EM GDP data in constant 2010 USD is reported up to 1Q18, while the models shown in the chart can be updated daily (GCF and the EM Import Volume models); and monthly, as the components of the GIA index become available. 5 For a discussion of global fixed-income markets’ response to the escalation of the Sino-U.S. trade war and the outlook for more aggressive monetary policy accommodation globally, please see Trade War Worries: Once More, With Feeling, published by BCA Research’s Global Fixed Income Strategy August 6, 2019. It is available at gfis.bcaresearch.com. 6 Please see A One-Two Punch, published by BCA Research’s Global Investment Strategy August 2, 2019. It is available at gis.bcaresearch.com. 7 Please see Tariffs ... And The Last Prime Minister Of The United Kingdom?, published by BCA Research’s Geopolitical Strategy, August 2, 2019. It is available at gps.bcaresearch.com. Almost on cue, China warned the U.S. it would view its deployment of intermediate-range missiles in Asia following Russia’s revival of its intermediate-range missile development as “offensive in nature.” Please see China warns US against deploying missiles on its ‘doorstep’, published by the Financial Times August 6, 2019. 8 Our global macro expectation can be found in Oil Markets Await Lift From Global Stimulus, published by BCA Research’s Commodity & Energy Strategy August 1, 2019. It is available at ces.bcaresearch.com. 9 Please see "The Gold Trifecta," published June 27, 2019, by BCA Research's Commodity & Energy Strategy, for our most recent analysis of the gold market and of our long-held bullish gold view. It is available at ces.bcaresearch.com. 10 The Institute’s supply-demand annual supply-demand balances showed a 29.2mm-ounce deficit in 2018. 11 When we model silver returns as a function of gold and base metals’ returns, silver’s elasticity to gold prices more than doubles – from 0.68 over the 1999 - 2010 period, to 1.67 post-GFC (2010 to now). The elasticity to changes in base-metals prices was roughly cut in half over this period, to 0.28 post-GFC. Investment Views and Themes Recommendations Strategic Recommendations Tactical Trades TRADE RECOMMENDATION PERFORMANCE IN 2019 Q2
Image
Commodity Prices and Plays Reference Table Trades Closed in 2019 Summary of Closed Trades
Image
Highlights U.S.-China: The escalation of the trade war has renewed investor fears that uncertainty could create an even deeper drag on global growth, requiring a more aggressive easing of global monetary policy. Fed: The Fed had an opportunity last week to regain control of monetary policy from the markets, but opted for only a cautious rate cut that came off as too hawkish. The FOMC will be forced to play defense in the next 3-6 months, likely by cutting rates more than originally envisioned given the market turbulence stemming from the trade war escalation. Fixed Income Asset Allocation: Raise overall global portfolio duration to neutral on a tactical (0-3 months) basis, at least until equity markets stabilize. Maintain strategic (6-12 months) overweights to global corporate bonds, however, as global leading economic indicators are bottoming. Feature A Painful Repricing Chart of the WeekNot A Pretty Picture
Not A Pretty Picture
Not A Pretty Picture
A long-overdue correction in risk assets, or the start of something more sinister? That is the question investors must now consider. Another Twitter blast from @realDonaldTrump has triggered chaos in global financial markets, with the imposition of fresh U.S. tariffs on Chinese imports. This shattered the market calm since the June G20 meeting, when an announced truce on the U.S.-China trade dispute led to optimism that a real deal could be reached. China retaliated to the new tariffs by allowing the USD/CNY exchange rate to depreciate beyond the perceived line in the sand at 7.0. The trade news came at a bad time for financial markets, a few days after the release of soft global manufacturing PMI data for July that highlighted how global growth remains highly vulnerable to trade war developments (Chart of the Week). The Fed did not help matters by delivering an interest rate cut last week but somehow coming across as hawkish (or, at least, not dovish enough). The market response to the renewed trade tensions and yuan weakness has been classic “macro risk-off” – sharply lower government bond yields, alongside big declines in global equity markets and commodity prices (Chart 2) and increases in the value of typical safe-havens like gold and the Japanese yen (Chart 3). Chart 2Growth-Sensitive Assets Not Doing Well
Growth-Sensitive Assets Not Doing Well
Growth-Sensitive Assets Not Doing Well
Chart 3Safe Havens In Demand
Safe Havens In Demand
Safe Havens In Demand
The nature of the fall in global bond yields has been consistent with what has been seen so far in 2019 – fairly coordinated moves in terms of size, with much smaller changes seen in cross-country yield spreads. This suggests that the unobservable “global” bond yield is falling in response to deteriorating global growth expectations, rather than country-specific factors driving local bond yields. Global trade uncertainty – and what that implies for future weakness in corporate profits, investment and employment – is indeed an “external shock” for every nation. We admit that our current duration recommendations have not been aligned to benefit from these moves. Our forecasting philosophy for government bond yields is based on what our colleagues at our sister service, BCA U.S. Bond Strategy, have dubbed “The Golden Rule of Bond Investing”.1 In that framework, the primary driver of government bond market returns (excess returns over cash, to be precise) is the outcome of central bank policy moves versus what is discounted in interest rate markets. In the U.S., we have been steadfast in our expectation that the Fed would disappoint market pricing that was calling for as much as 90bps of rate cuts over the next 12 months. Global trade uncertainty – and what that implies for future weakness in corporate profits, investment and employment – is indeed an “external shock” for every nation. Chart 4Rate Cuts Required - And Discounted - Everywhere
Rate Cuts Required - And Discounted - Everywhere
Rate Cuts Required - And Discounted - Everywhere
Now, with the President giving markets the unpleasant news that a trade deal with China is not imminent, and new tariffs about to be imposed, the pressure is on the Fed to provide an offset through easier monetary policy. Some are even interpreting the timing of Trump’s latest Tariff Tweet in a Machiavellian fashion, as if he wanted to create more uncertainty to get to Fed to cut rates (and, by association, help deliver Trump’s goal of weakening the U.S. dollar). On the surface, Trump ratcheting up the trade tensions sounds like a risky economic game to play leading up to the 2020 Presidential election. Our colleagues at BCA Geopolitical Strategy, however, note that many of the leading Democratic presidential nominee contenders have themselves been pushing for a more hawkish stance on China. Trump may now feel politically emboldened to become even harder on China himself, to avoid being outflanked by the Democrats – even if it means the U.S. stock market suffers a nasty selloff as a result. Although, again, if the Fed cuts rates as a result, Trump will likely view that as a victory given his constant haranguing of Fed Chair Jay Powell over the past year. With Powell tipping his hand last week that trade uncertainty was something that could trigger additional Fed interest rate cuts, and with Trump now highly incentivized to create that uncertainty, the case for betting against the rate cuts discounted in U.S. interest rate markets has weakened – even though it is still debatable whether the U.S. economy has softened enough to justify a full-blown easing cycle. With Powell tipping his hand last week that trade uncertainty was something that could trigger additional Fed interest rate cuts, and with Trump now highly incentivized to create that uncertainty, the case for betting against the rate cuts discounted in U.S. interest rate markets has weakened Our Central Bank Monitors are now signaling a need for some easing of monetary policy in all the major developed economies, including the U.S. (Chart 4). Even though our 12-month Discounters also show that a lot of easing is already priced into Overnight Index Swap (OIS) curves in those same countries, the amount of cuts discounted is consistent with the dovish message from our Central Bank Monitors. Given the renewed trade tensions, alongside no signs of much improvement in overall global growth momentum, we are less certain at the moment that the amount of cuts discounted by markets will not be delivered. Thus, under our Golden Rule framework, a below-benchmark overall global duration stance is not warranted at this time. Therefore, this week, we are increasing our overall duration stance to neutral from below-benchmark, on a tactical basis. In our model bond portfolio on Page 10, we are implementing this view by “neutralizing” the duration exposures within each country. This is done by keeping the same total country weightings versus the benchmark index, but allocating across all maturities in line with the index weightings within each country. This adds about one-half of year of duration to the model portfolio to bring it up the same level as the benchmark index, but without altering the overall allocations to countries or spread product sectors. What To Do Beyond The Short-Term? Chart 5A Lot Of Bad News Discounted In Bond Yields
A Lot Of Bad News Discounted In Bond Yields
A Lot Of Bad News Discounted In Bond Yields
Despite the near-term concerns and volatility stemming from the increased trade tensions, we do not advocate moving to a more defensive portfolio allocation (above-benchmark duration, underweight corporate bonds) to position for a deeper global growth slowdown, for the following reasons: A lot of bad news is already discounted in global bond yields. The rally in government bond markets this year has pushed bond yields down to stretched levels using typical valuation metrics (Chart 5) like the 5-year OIS rate, 5-years forward; the term premium on 10-year yields, and market-implied inflation expectations from CPI swaps or inflation-linked bonds. Additional sustainable declines will be harder to achieve from current levels. The U.S. economy is still holding up relatively well, especially compared to other major economies. Although the U.S. manufacturing sector data has slowed, U.S. Treasury yields already are in line with the diminished readings of the ISM Manufacturing index, which is still above the 50 level signifying expanding activity (Chart 6). The non-manufacturing (services) side of the economy has not seen the same degree of slowing, while consumer confidence and retail sales have both picked up of late. Also, the mean-reverting U.S. data surprise index – which is correlated to the momentum of bond yields – is very stretched to the downside, suggesting less downside potential for Treasury yields from weak U.S. data (Chart 7). Chart 6UST Yields Consistent With Slower Manufacturing
UST Yields Consistent With Slower Manufacturing
UST Yields Consistent With Slower Manufacturing
In addition, the easing of U.S. financial conditions from the 2019 rally in U.S. equity and credit markets before the past few days does suggest a rebound in U.S. growth is likely beyond the next few months. It will take much bigger market declines than seen so far, something beyond a mere “garden-variety” correction in U.S. equities, to tighten financial conditions enough to offset the prior loosening. Chart 7Treasuries Are Vulnerable To Better Data
Treasuries Are Vulnerable To Better Data
Treasuries Are Vulnerable To Better Data
Early leading indicators are flashing a future bottoming of global growth. Several of the more reliable leading economic signals, like our global LEI diffusion index and the China credit impulse, are both flashing the potential for a rebound in global growth to begin around the end of the year (Chart 8). If Chinese policymakers choose to offset the negative domestic economic impact of the new Trump tariffs with even more stimulus measures, as seems likely, then the odds of an eventual growth rebound would improve – especially if there is also a healthy dose of monetary easing from the Fed, ECB (both rate cuts and renewed asset purchases) and other major central banks. Early leading indicators are flashing a future bottoming of global growth. Summing it all up, we see the best way to protect against the risks of an even deeper near-term selloff in risk assets is to increase duration by buying liquid government bonds, rather than reduce credit exposure by selling less liquid corporate bonds. It would take signs that the improvement in leading economic indicators is reversing to justify downgrading global corporate bond exposure. We think it more likely that we’ll be reducing our recommended duration exposure back to below-benchmark sometime in the next few months. We will be watching news on global trade, China stimulus and U.S. non-manufacturing growth before making the next change to our duration call. We see the best way to protect against the risks of an even deeper near-term selloff in risk assets is to increase duration by buying liquid government bonds, rather than reduce credit exposure by selling less liquid corporate bonds. With regards to country allocation within developed market government bonds, we are choosing to stick with our current recommendations: overweight core Europe, the U.K., Japan, Australia and Spain; underweight the U.S. and Italy; and neutral Canada (Chart 9). Those allocations have served us reasonably throughout 2019, with the bulk of the overweights outperforming the Bloomberg Barclays Global Treasury index in hedged USD terms, and the U.S. actually only just matching the global hedged benchmark (thanks to the yield pickup for non-U.S. debt from hedging currency exposure back to higher-yielding U.S. dollars). Chart 8A Light At The End Of The Tunnel?
A Light At The End Of The Tunnel?
A Light At The End Of The Tunnel?
Chart 9We're Sticking With Our Country Allocations
We're Sticking With Our Country Allocations
We're Sticking With Our Country Allocations
Only in the case of Italy, were we have maintained an underweight stance given our concerns about weak Italian growth and the implications for debt sustainability, have we seen a significant underperformance of our recommendation. At current yield/spread levels, however, we remain reluctant to simply chase higher-yielding Italian bond yields in the absence of any sign of improving Italian growth that would justify lower Italian risk premia. Bottom Line: The escalation of the trade war has renewed investor fears that trade could create an even deeper drag on global growth, requiring a more aggressive easing of global monetary policy. Raise overall global portfolio duration to neutral on a tactical (0-3 months) basis, at least until equity markets stabilize. Maintain strategic (6-12 months) overweights to global corporate bonds, however, as global leading economic indicators are bottoming. Robert Robis, CFA, Chief Fixed Income Strategist rrobis@bcaresearch.com Footnotes 1 Please see BCA U.S. Bond Strategy Special Report, “The Golden Rule Of Bond Investing”, dated July 24, 2018, available at usbs.bcaresearch.com. Recommendations The GFIS Recommended Portfolio Vs. The Custom Benchmark Index
Trade War Worries: Once More, With Feeling
Trade War Worries: Once More, With Feeling
Duration Regional Allocation Spread Product Tactical Trades Yields & Returns Global Bond Yields Historical Returns
The textbook answer to the title question is that a lower Fed funds rate directly reduces the cost of financing big-ticket consumer purchases and corporate initiatives while indirectly nudging households and corporate managers to make them by boosting their…
The Bank of England (BoE) held rates steady at last week’s Monetary Policy Committee (MPC) meeting, keeping the Bank Rate at 0.75%. The MPC modestly lowered its growth forecasts for 2019 and 2020 due to the dual uncertainties over global growth and, more…
Highlights Markets expressed disappointment over last week’s FOMC meeting, … : Equities sold off, Treasury yields slid, and the curve flattened. … but we didn’t think there was all that much to get excited about, … : Data dependence remains the Fed’s mantra, and it was never likely that the FOMC would signal that policy through September has been pre-programmed. … though the specter of escalating trade tensions was a bummer: We have followed our repeated exogenous-shock caveat with an acknowledgement of the gravity of trade barriers. Our geopolitical strategists don’t expect a resolution any time soon, though, and White House tweets are here to stay. Marginally easier monetary policy is not likely to have all that much of an effect on the economy: A reduction in the fed funds rate from 2.5% to 2% isn’t likely to turbo-charge housing or corporate investment, but we do expect that the major central banks’ easing bias will support risk assets. Feature The FOMC delivered the result we expected at the conclusion of its meeting last week: a 25-basis-point cut and a dovish adjustment to its balance sheet runoff plans. Markets acted as if they’d been blindsided. Apparently it really isn’t what you say, it’s how you say it. Or maybe, as our colleague Martin Barnes has long contended, press conferences and all the other assorted communications strategies do more harm than good. We have nearly reached the point of Fed fatigue ourselves, but there’s no ignoring the elephant in the room. The Fed is squarely in the center of every investor’s mind and may well remain there for the rest of what was shaping up as a slow-news month before the latest tariff move. American and Chinese negotiators have called it quits until September; lawmakers have left the building in London and Brussels; the ECB’s Governing Council will be idle until mid-September; and the winnowing of the Democratic field is so far off that even Bill de Blasio remains a presidential candidate. We devote this week’s report to an examination of increased accommodation’s implications for financial markets and the U.S. economy. What did the FOMC do on Wednesday? Chart 1An Adjustment, Not A New Direction
An Adjustment, Not A New Direction
An Adjustment, Not A New Direction
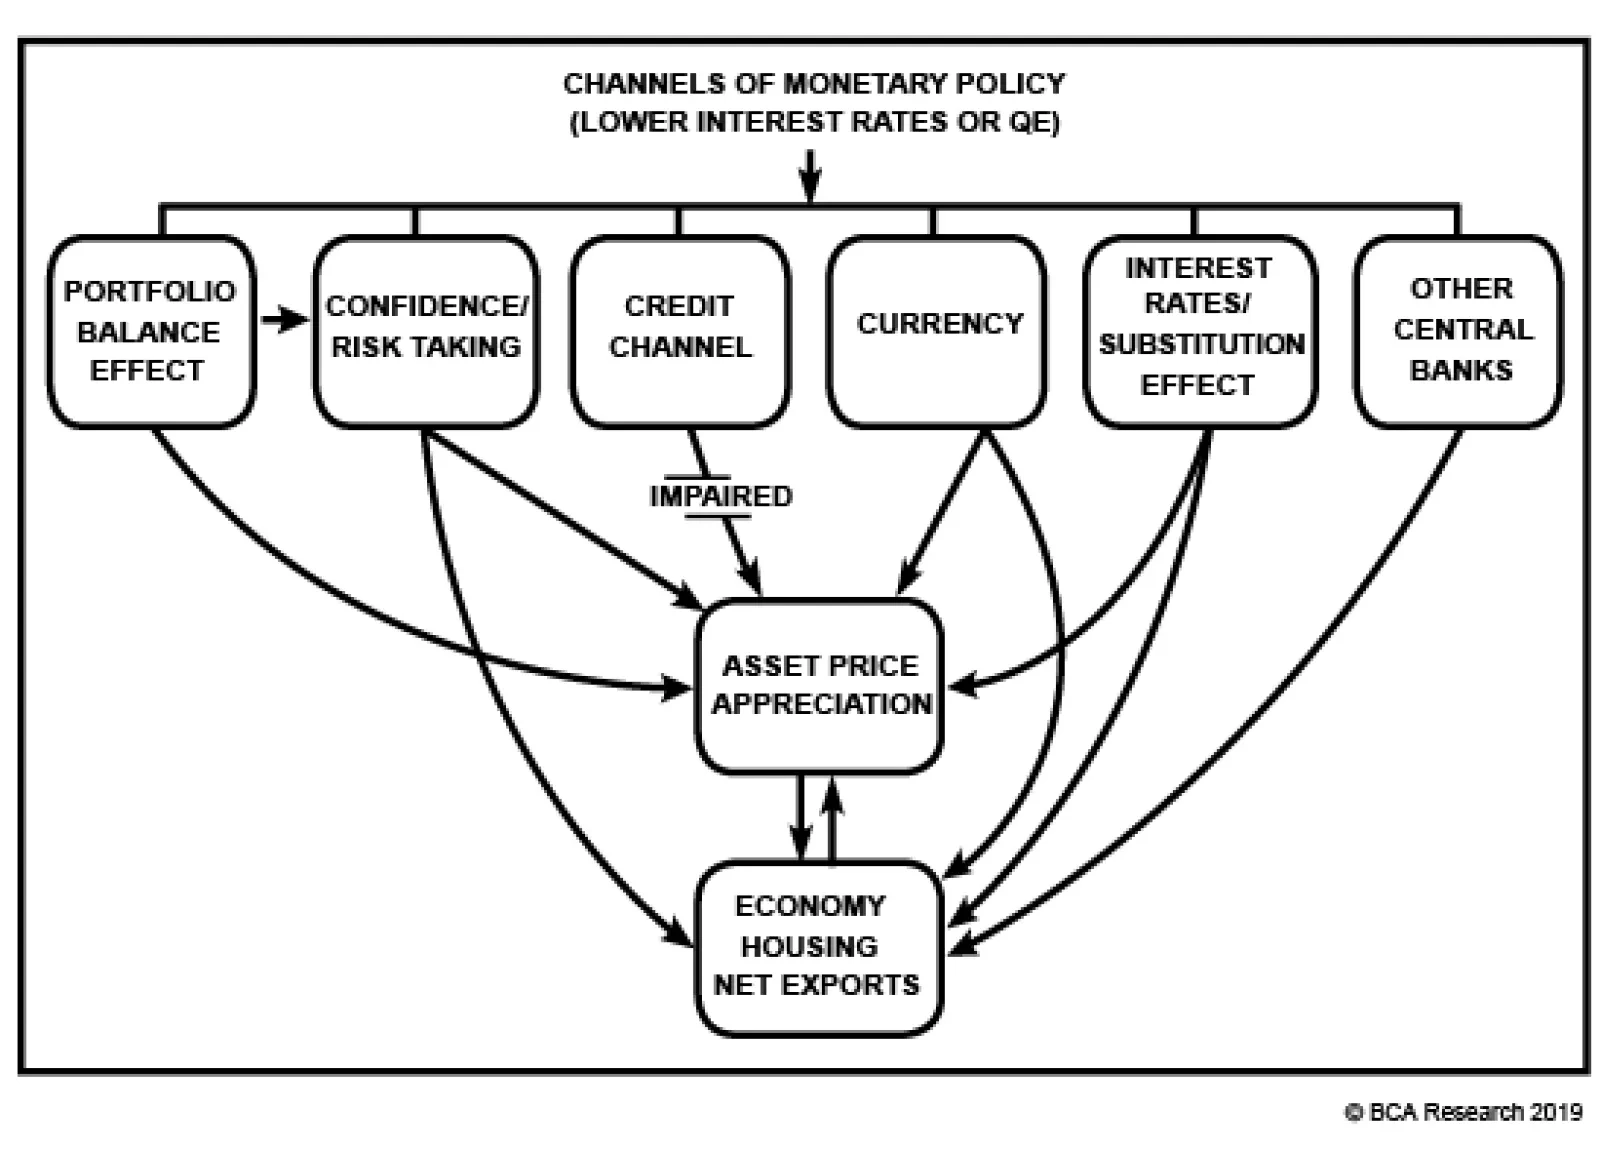
The FOMC cut the fed funds rate by 25 basis points, to a range of 2-2.25%, and terminated its modest balance sheet reduction effort two months ahead of time. It studiously kept its options open with regard to future policy rate adjustments, with Chair Powell describing the cut as a “mid-cycle adjustment,” rather than a transition to full-on policy easing. The mid-cycle reference kiboshed hopes that the cut was meant to bring the curtain down on the tightening cycle that began at the end of 2015 (Chart 1). The hawkish surprise concerning the future direction of the fed funds rate overwhelmed the modestly dovish news that the Fed is immediately ending small-scale quantitative tightening. How did markets take the developments? Not so well, especially over the two hours of Wednesday afternoon trading following the decision. The S&P 500 sold off by close to 2% during the press conference, the dollar surged against the euro, and the yield curve flattened as long-dated Treasuries surged while the 2-year note sold off sharply. Equities recovered their losses in Thursday morning’s trading, though bonds and the dollar held much of their gains, before the latest salvo in the U.S.-China dispute sent investors in all markets scurrying for cover. Overall, financial markets were disappointed that they didn’t get a clearer signal that additional accommodation is on the way. Did markets overreact? In retrospect, it looks like they’d gotten their hopes up too high. The Fed wants to avoid surprises by keeping markets apprised of future developments, but it’s hard to envision it deliberately boxing itself in. It wants to preserve the flexibility to act as it sees fit, so data dependence remains the order of the day, just as it has for the last several years. We continue to take the Fed at its word that policy is not on a pre-set course. Markets seemed to be looking for a little more solicitousness from the Fed. Central bankers will presumably always attempt to guard their discretion, but the monetary policy path is far from clear, given elevated economic uncertainty. Between the stop-and-start trade hostilities with China and the Whack-a-Mole emergence of tariff threats against long-standing allies and trade partners, global manufacturing is reeling and corporate managers have every reason to hold back on capex. The differences of opinion within BCA reflect the lack of an obvious economic direction. Dissention within the Fed – Boston’s Rosengren and Kansas City’s George voted against last week’s cut, while Minneapolis’ Kashkari surely wanted it to be larger – shows that the way forward is not so clear-cut. So is it a good thing or a bad thing that the Fed cut rates? We view easier policy as a market positive over the one-year timeframe that drives most investors. There will come a point of diminishing returns, when risk assets no longer respond to incremental accommodation, but we don’t think we’re there yet. Equity multiples have room to expand before they become silly and the ECB is apparently preparing a new round of asset purchases. Given that it’s exhausted the supply of Eurozone sovereigns, it will have to proceed to evicting incumbent holders from their positions somewhat further out the risk curve, prodding them to venture out still further to redeploy the proceeds, putting downward pressure on spreads globally. How will a lower fed funds rate impact the economy? How much time do you have? The textbook answer is that a lower fed funds rate directly reduces the cost of financing big-ticket consumer purchases and corporate initiatives while indirectly nudging households and corporate managers to make them by boosting their confidence. Unconventional measures like asset purchases (QE) push investors further out the risk curve, lifting the prices of risky assets, lowering lending spreads and increasing asset holders’ wealth. They also promote a broader sense of well-being (the CNBC screen is framed in green, print headlines are cheerful, and jobs are increasingly easier to find), fueling confidence that helps reinforce the direct effects of easier policy. As Chair Powell put it in January, “Our policy works through changing financial conditions[,] … it’s … the essence of what we do.” The logic behind the textbook answer is undeniably sound, and it’s displayed in the simple six-channel model in Figure 1. People respond to incentives, and when the cost of consumption and investment falls, they are likely to save less and consume and invest more (Interest Rates/Substitution Effect). Increasing numbers of observers are becoming restless, however, as events on the ground don’t seem to jibe with the theory. Ten years of a negative real fed funds rate has failed to generate much oomph, and markets sputtered on cue once it tiptoed into positive territory (Chart 2), coinciding with the current global economic softness.
Chart
Chart 2Real Rates Are Still Low Relative To History
Real Rates Are Still Low Relative To History
Real Rates Are Still Low Relative To History
Martin Barnes, our resident grumpy economist, scoffs at how little extraordinary accommodation has been able to achieve. (Don’t get him started on the communication strategies.) Even after adjusting for how a half-century of Scotland and Montreal weather has colored his perspective, he has a point. “Do you really want to buy equities and riskier bonds in an economy that needs this much help just to grow at 2%?” he might ask. For the time being, yes, we still do. Although the channels promoting economic activity are not functioning as reliably as they have in the past, the channels boosting asset prices – Portfolio Balance, Confidence/Risk Taking, and Interest Rates/Substitution – are still A-Okay (Figure 1). The initial reaction to the FOMC meeting suggests that it will be very hard for the Fed to surprise dovishly in a relative sense, blocking the Currency channel for the time being. The Credit channel is still hindered by post-crisis regulations from Basel to Capitol Hill, at least in terms of the official banking system. Trade tensions have roiled net exports via retaliatory tariffs and suppressed global aggregate demand.1 Shouldn’t housing be at the forefront of any pickup in activity? Chart 3Lower Rates Haven't Helped Much Yet
Lower Rates Haven't Helped Much Yet
Lower Rates Haven't Helped Much Yet
Housing is the classic proxy for tracing the effects of easier policy on the domestic economy, since nearly all of its end consumers finance their purchases, and its domestic concentration insulates it from trade effects. It has failed to respond much to the monetary policy shifts that have brought 30-year fixed mortgage rates down nearly 100 basis points year to date (Chart 3). Fed skeptics suggest that the muted response is evidence of the declining efficacy of easy policy, though we have been inclined to read the data as an indication that homebuilders aren’t building enough starter and move-up homes to bring homeownership within reach of first-time homebuyers and median-income households. Housing should exhibit a high sensitivity to changes in monetary policy, but an abundance of other debt burdens and a lack of affordable supply may be holding it back. One should have expected that the housing pickup would be muted, and slower to take hold in this expansion, given the severity of the recession and its mortgage-lending roots. Adjusted for inflation, private residential investment, which has declined slightly for four straight quarters, is just over two-thirds of its 2005 peak (Chart 4, middle panel). In the past, residential investment has been more sensitive to the level of the fed funds rate than its direction. Since 1961, the Fed has hiked rates in as many quarters as it has cut them, and the difference in annualized growth has been relatively modest: 2.8% when the Fed has been cutting rates, and 1.6% when it’s been raising them. Chart 4Residential Investment Responds To The Monetary Policy Backdrop...
Residential Investment Responds To The Monetary Policy Backdrop...
Residential Investment Responds To The Monetary Policy Backdrop...
Per our equilibrium fed funds rate framework, we deem monetary policy to be accommodative when the fed funds rate is below our estimate of equilibrium, and restrictive when the funds rate exceeds it (Chart 4, top panel). Despite the fact that the Fed has hiked as often as it has cut since 1961, we estimate that policy has been easy for two-thirds of the time, and the difference in residential investment growth in the two policy states has been dramatic: 6.8% when policy is easy and -6.6% when policy is tight (Chart 4, bottom panel). With the Fed keeping policy easy for longer, housing will have the wind at its back, though it isn’t much more than a breeze at the moment. The same goes for construction employment, which has grown more rapidly under accommodative monetary policy (2.1% versus 0.7% when policy is tight), but has merely treaded water over the last 11 years of easy policy (Chart 5). Chart 5... And So Does Construction Employment
... And So Does Construction Employment
... And So Does Construction Employment
The bottom line is that the jury is still out on housing activity. Low mortgage rates will help renters buy homes (and fill them with furniture and appliances), and put more cash in the pockets of homeowners who refinance their existing loans, but the market remains soft. Though it can’t be captured by the aggregate data, it does seem possible that median-income households may be burdened by too much student loan, automobile and/or credit card debt to save the required down payment.2 Disparities between households may well be holding the economy back, but they have a silver lining if they encourage the Fed to pursue accommodative policies for longer than it otherwise would. Will rate cuts give the economy a tangible lift? We don’t know for sure, but no one else does, either. We are convinced that easier monetary conditions will help the economy at the margin. Ten years into the expansion, though, it is not clear if the economy has pent-up demand that easier conditions will help release. Externally, worsening trade tensions could exacerbate the global manufacturing slowdown, further squeezing global aggregate demand, and exporting recession pressures to the U.S. Our mandate is not to forecast the economy in itself, though. We and our clients are investors, not government officials or public-policy professors, and we focus on the economy only to the extent that it impacts financial markets. In the near term, incremental accommodation should boost risk asset prices, provided that trade tensions don’t ratchet up enough to undermine investor, consumer and business confidence. Animal spirits matter, and if they shift decisively from greed and toward fear, they can become a self-fulfilling prophecy that sweeps monetary policy efforts before them. Ex-a significantly negative exogenous event, we remain constructive on the U.S. economy, and continue to look for a global revival outside of the U.S. Investment Implications The incremental information received this week – an FOMC meeting that mostly went off as we expected, a modest escalation in U.S. pressure on China in line with our geopolitical strategists’ warnings that a final deal is not at hand, mixed global manufacturing PMIs, a surge in U.S. consumer confidence, a straight-down-the-middle employment situation report, and an upward inflection in S&P 500 earnings growth that has 2Q EPS now tracking to a 2.7% year-over-year gain – did not change our perspective. We see U.S. economic growth decelerating from its 2018 pace, but remaining above trend, and an absence of imbalances that would make the economy more vulnerable. We have made our peace with recurring flare-ups of hostilities between the U.S. and China, and trade tensions will only change our investment outlook if they worsen materially. The Fed is not magic, but it is doing the best it can to keep the expansion going for the purpose of spreading its gains as broadly as possible, and the easing bias among major central banks is gathering force. On balance, the new information received last week didn’t do anything to change our overall take. We remain constructive, and think investment portfolios should as well. We recognize that the climate is uncertain, and that we should accordingly dial back our conviction. Part of the reason the agency mortgage REITs appeal to us at this juncture is that they offer the opportunity to reduce equity beta and enhance a balanced portfolio’s capacity to absorb shocks. We watched the flattening in the yield curve with dismay, but we continue to expect that incremental monetary accommodation will promote a steeper curve. Easier monetary conditions promote growth, boosting the real component of interest rates, and can stoke inflation pressures when an economy is operating at or above capacity, as the U.S. has been for over a year. We remain vigilant, but our base-case constructive take is unchanged. Doug Peta, CFA Chief U.S. Investment Strategist dougp@bcaresearch.com Footnotes 1 As we were preparing to go to press on Thursday, the U.S. announced the imposition of new tariff levies on the subset of Chinese imports that hadn’t yet been subjected to tariffs. The move supported our geopolitical strategists’ view that the trade war is unlikely to be settled soon. 2 Andriotis, AnnaMaria; Brown, Ken; and Shifflett, Shane, “Families Go Deep in Debt to Stay in the Middle Class,” Wall Street Journal, August 1, 2019.
Highlights The Federal Reserve’s 25-basis-point interest rate cut might have disappointed market participants, but Trump’s additional tariffs is a far bigger slap. Our bias is that this is not an escalation in trade tensions. To gauge the dollar’s future path, investors should focus less on what central banks are going to do and more on what will happen to the global manufacturing cycle. The pro-Brexit rhetoric by U.K. Prime Minister Boris Johnson is knocking the pound towards a very compelling buy zone. Sell EUR/GBP at 0.94. Stale longs are currently being flushed out of the gold rally. Trump’s weaponization of the dollar allows investors who missed the first up-leg to accumulate bullion on weakness. Remain short USD/JPY. In the central bank battle towards lower rates, short USD/JPY positions are in an enviable “heads I win, tails I do not lose too much” position. Market volatility is triggering a few stop losses. Stand aside on short CAD/NOK and long AUD/USD. Feature We had the privilege of meeting a few sophisticated investors in South America last week. The general sentiment was cautious in light of the fact that a few end-of-cycle indicators were beginning to flash green. Discussions circled around growth developments in the U.S., the eurozone and China. Even those who have been cautiously optimistic on global growth for some time now are beginning to feel they are waiting for Godot, given the duration of the manufacturing slowdown. South American economies are closely knitted to the Chinese industrial cycle, and so the rising trepidation given credit injections in China should have turned things around by now was both rational and justified. The latest tweets by Trump have done little to alleviate this fear. Our general thesis that a pro-cyclical stance for developed market currencies made sense over the next few months was received with skepticism. The overarching consensus was that the U.S. (and the rest of the world, for that matter) will not go into a recession over the next six-to-12 months, but the dollar will remain in a bull market regardless. We were in agreement that some emerging markets warranted lower currencies versus the dollar, but spent most of our time making the case for a trend reversal in the dollar versus its G10 counterparts. Below is a synopsis of some of our dialogue. Global Growth Remains Weak, But… It is quite remarkable that most investors do not expect a recession in the next six-to-12 months, but expect manufacturing data to keep weakening. If the German manufacturing PMI falls much lower from current levels, Germany will be in deep recession (Chart I-1). What is clear is that this cognitive dissonance is squarely rooted in the recent history of data disappointments, including an escalating trade war. Manufacturing slowdowns have tended to last 18 months peak-to-trough, the final months of which are characterized by fatigue and capitulation. However, unless major imbalances exist (our contention is that so far they do not), mid cycle slowdowns sow the seeds of their own recovery via accumulated savings and pent-up demand. Chart I-1A German Recession?
A German Recession?
A German Recession?
Chart I-2Some Yield Curves Are Steepening
Some Yield Curves Are Steepening
Some Yield Curves Are Steepening
The U.S. 10-year versus 3-month curve inverted in March, which has typically heralded a recession over the coming six-to-18 months. The key difference today is that the term premium (compensation that investors receive for holding a long-duration asset) is severely depressed in 10-year notes, making an apples-to-apples comparison with the past more difficult. The two- or five-year Treasury notes, which have both seen similar compression in term premiums, offer more insight, and those curves have not yet inverted (Chart I-2). The recovery could be more L-shaped than V-shaped because of knock-on effects from the trade war and a falling marginal propensity to consume in China. A pick up in Chinese demand will be critical for a recovery in the global manufacturing cycle. China embarked on massive credit stimulus in March of this year, a development that has been clearly reflected in official loan numbers. If past is prologue, about now is the time that the credit injection should begin to impact underlying data, as the lag is typically six to nine months (Chart I-3). Moreover, the fact that the July manufacturing data were so weak almost guarantees that the next few months will see more aggressive stimulus by the Chinese authorities, and might also explain why China appears so nonchalant to the latest tariffs from the U.S. Chart I-3Chinese Stimulus Works With A Lag
Chinese Stimulus Works With A Lag
Chinese Stimulus Works With A Lag
A constant pushback we received was that credit stimulus will be much less than in the past, because of structural reform concerns. Also, the recovery could be more L-shaped than V-shaped because of knock-on effects from the trade war and a falling marginal propensity to consume in China. These are obviously very valid concerns. Standard economic theory tells us that unless the trade war degenerates from current levels, the exchange rate should have already adjusted for impending price differentials. Ever since the U.S. began to threaten to impose tariffs on $200 billion worth of goods, the USD/CNY has risen by around 10%. This more than accounts for the notional amount of Chinese exports affected, and is now in the rear-view mirror. The marginal propensity question for China is more difficult to answer because it is only observable ex-post. Think about an economy in recession. The central bank has no idea what proportion of companies are in a liquidity versus a solvency crisis. This is why it keeps injecting stimulus until a few rational players stop deleveraging and start borrowing to invest. Until the cost of capital is lowered to the point where it makes sense for these rational players to invest, the marginal propensity to consume (or invest) will fall. Chart I-4The Euro Zone Manufacturing Recession##br## Is Over
The Euro Zone Manufacturing Recession Is Over
The Euro Zone Manufacturing Recession Is Over
We all know that the euro area exports a lot to China. So at times, it is instructive to focus less on what’s happening in China and more on what’s happening to economies highly sensitive to the Chinese pulse. Sweden’s manufacturing new orders-to-inventories ratio is a neat series to track for two reasons. First, Sweden is one of the most export-oriented economies in Europe, selling both to the euro area and outside it. This makes it highly sensitive to the global manufacturing pulse. Second, there are no Chinese credit variables in Sweden’s data, and so it falls outside the judgement call of Chinese reflationary efforts. More importantly, it leads the European PMI tick-for-tick by five months, and so we would be surprised if the eurozone manufacturing recession did not end by the fourth quarter this year (Chart I-4). With new tariffs underway, it will be interesting to see how the balance of forces play out. Bottom Line: In the press conference after the Fed’s rate cut announcement, Fed Chairman Jerome Powell’s delivery was underwhelming, but manufacturing is a small portion of the U.S. economy, suggesting a rate cut was not entirely justified. Going forward, if the Fed delivers less interest rate cuts than is priced in by the market, it is because manufacturing has picked up, which will favor non-U.S. interest rates either way. We are fading the current strength in the dollar as the last hurrah before the ultimate drop. …A Few Tectonic Shifts Are Underway Interest rate differentials have been dictating currency market trends of late, but a few underlying forces that are critical for exchange rates are sending a warning signal for the dollar. Investors are constantly evaluating how to allocate funds, and will rationally deploy capital towards projects that have the highest returns. We know from both the wealth of seminal work that has been done on value investing and from the simple premise that the entry point in any trade could be as important as your entire thesis for that investment, that starting points matter. The starting point for the U.S. is an equity market that is one of the most overvalued, dictating that subsequent returns will pale by historical comparison. The 2017 Trump tax cuts allowed a huge repatriation of capital back to the U.S., to the tune of $400 billion, but that cash is beginning to slowly seep out as high-return projects become more and more difficult to come by (Chart I-5). This may explain why foreigners are stampeding out of U.S. equities, to the tune of about $200 billion a year, not exactly an environment that is conducive for U.S. dollar strength. The reality is that the ebb and flow of U.S. repatriation/outflows have generally captured all the major turning points in the dollar, and there is no reason to believe this time will be different. The ebb and flow of U.S. repatriation/outflows have generally captured all the major turning points in the dollar, and there is no reason to believe this time will be different. The Fed may have delivered a hawkish surprise, and Trump may appear victorious, but confidence in the dollar is fraying at the edges. This can be observed in a falling bond-to-gold ratio. Ever since the end of the Bretton Woods agreement broke the gold/dollar link in the early 1970s, bullion has stood as a viable threat to dollar liabilities, capturing the ebbs and flows of investor confidence in the greenback tick-for-tick. U.S. yields might be the only game in town today, but portfolio outflows and a deteriorating balance of payments backdrop will keep longer-term investors on the sidelines (Chart I-6). Chart I-5Investors Are Stampeding Out Of U.S. Assets
Investors Are Stampeding Out Of U.S. Assets
Investors Are Stampeding Out Of U.S. Assets
Chart I-6Confidence In The Dollar##br## Is Falling
Confidence In The Dollar Is Falling
Confidence In The Dollar Is Falling
Data from the World Gold Council this week showed that central banks continued to load up on gold through the first six months of this year. In fact, both China and Russia have been indiscriminate buyers of bullion, irrespective of price, over the past decade. As the amount of negative-yielding debt keeps rising and confidence in the dollar keeps falling, the conditions for a gold bull market become ever-fervent (Chart I-7). Not to mention that many gold buyers have geopolitical concerns against holding dollar liabilities. Finally, long-dollar bets are a much-crowded trade (Chart I-8). In cyclical markets, you are either a contrarian or a victim. One often-asked question on our trip was: For how long have you had a contrarian view on the dollar? The answer is quite simple: As soon as Charts I-1 to I-8 began showing signs of a reversal, which was around a few months ago. Chart I-7Bullion Tailwinds
Bullion Tailwinds
Bullion Tailwinds
Chart I-8A Crowded Trade
A Crowded Trade
A Crowded Trade
Bottom Line: The dollar bull market is late. Watch the AUD/JPY cross, specifically the 72-74 cent zone, for signs of a reversal. A break below will signal we are entering a deflationary bust, while a bounce could be a prelude to a reflationary rally. Housekeeping The stop-loss on our short CAD/NOK position was triggered at 6.65. Two fundamental reasons triggered the stop. First, the U.S. economy has been surprising to the upside relative to that of the euro area. This favors the CAD over the NOK, and the U.S. dollar in general (Chart I-9). Second, oil price differentials have favored the CAD over the NOK, with the WCS-Brent differential narrowing from -$30/Bbl to -$20/Bbl. We are standing aside for now, but will look to put this trade back on in the future. The pro-Brexit rhetoric by U.K. Prime Minister Boris Johnson is knocking the pound towards a very compelling buy zone. Sell EUR/GBP at 0.94. The EUR/GBP is approaching a sell zone (Chart I-10). We will be discussing the pound in an upcoming report, but in the interim please refer to our July 5th bulletin1 for an analysis on cable. Chart I-9Stand Aside On CAD/NOK
Stand Aside On CAD/NOK
Stand Aside On CAD/NOK
Chart I-10Sell EUR/GBP At 0.94
Sell EUR/GBP At 0.94
Sell EUR/GBP At 0.94
Finally, Trump’s rhetoric to step up the trade war in a very nonchalant fashion has nudged us out of our long AUD/USD position. The loss is meaningful, but manageable given the tight stop loss. Stay long AUD/NZD. We will be looking to put back on outright AUD longs soon. Chester Ntonifor, Foreign Exchange Strategist chestern@bcaresearch.com Footnotes 1 Please see Foreign Exchange Strategy Weekly Report, titled “Portfolio Tweaks Into Thin Summer Trading,” dated July 5, 2019, available at fes.bcaresearch.com Currencies U.S. Dollar Chart II-1USD Technicals 1
USD Technicals 1
USD Technicals 1
Chart II-2USD Technicals 2
USD Technicals 2
USD Technicals 2
Recent data in the U.S. have been mixed: GDP growth fell to 2.1% quarter-on-quarter in Q2, but was stronger than expected. Both headline and core PCE both increased to 2.3% and 1.8% quarter-on-quarter in Q2. Dallas Fed manufacturing business index improved from -12.1 in June to -6.3 in July; Chicago Fed purchasing managers’ index fell to 44.4 in July. Pending home sales increased by 1.6% year-on-year in June. 156 thousand jobs were created in July according to the ADP report. However, initial jobless claims rose to 215 thousand. Markit manufacturing PMI increased to 50.4 in July, while ISM manufacturing PMI fell to 51.2. It was worrisome that the prices paid index fell from 49.6 to 45.1. DXY index surged by 0.5% this week, the highest since the beginning of the year. The Fed cut interest rates by 25 bps this Wednesday, mainly due to the global downside risks and below-trend inflation. However, his delivery towards further interest rate cuts, should the economy warrant it, was underwhelming. As long as the slowdown in manufacturing does not infect services, this might be a one and done but the insurance guarantee the markets needed from the Fed was poorly telegraphed. Report Links: Global Growth And The Dollar - July 19, 2019 On Gold, Oil And Cryptocurrencies - June 28, 2019 Battle Of The Central Banks - June 21, 2019 The Euro Chart II-3EUR Technicals 1
EUR Technicals 1
EUR Technicals 1
Chart II-4EUR Technicals 2
EUR Technicals 2
EUR Technicals 2
Recent data in the euro area have been negative: Confidence remains low in July. Consumer confidence came in at -6.6; Services sentiment fell to 10.6; Industrial confidence decreased to -7.4; Business climate fell to -0.12. Q2 GDP growth fell to 1.1% year-on-year. On a quarter-on-quarter basis, it fell from 0.4% to 0.2%. Unemployment rate was steady at 7.5% in June. Headline and core CPI both decreased to 1.1% and 0.9% year-on-year respectively. Markit manufacturing PMI increased slightly to 46.5 in July. EUR/USD plunged by 0.6% this week. The euro area economy expanded by only 0.2% quarter-on-quarter in Q2. Among the European nations, Spain had the highest quarterly GDP growth rate in Q2 at 0.5%, while Italian economy stagnated in Q2. In its meeting last week, the ECB suggested that it stands ready to cut interest rates further and restart its asset purchase program, should the economy warrant it. This is hugely reflationary. Report Links: Battle Of The Central Banks - June 21, 2019 EUR/USD And The Neutral Rate Of Interest - June 14, 2019 Take Out Some Insurance - May 3, 2019 Japanese Yen Chart II-5JPY Technicals 1
JPY Technicals 1
JPY Technicals 1
Chart II-6JPY Technicals 2
JPY Technicals 2
JPY Technicals 2
Recent data in Japan have been negative: Retail trade yearly growth fell from 1.3% in May to 0.5% in June. The jobs-to-applicants ratio fell slightly to 1.61 in June, while the unemployment rate nudged lower to 2.3% in June. Industrial production contracted by 4.1% year-on-year in June. Housing starts grew by 0.3% year-on-year in June. Consumer confidence fell to 37.8 in July. Nikkei manufacturing PMI fell to 49.4 in July. USD/JPY fell by 1.3% this week. On Tuesday, the Bank of Japan kept interest rates unchanged at -0.1%. In its quarterly outlook, the BoJ cut its inflation forecasts and warned against downside risks to the economy. Kuroda highlighted that additional easing might be required due to increasing exogenous risks: “If Fed moves trigger yen rises, the BOJ could either strengthen forward guidance, allow 10-year bond yields to move in a wider band, or do both.” Report Links: Portfolio Tweaks Into Thin Summer Trading - July 5, 2019 Battle Of The Central Banks - June 21, 2019 Short USD/JPY: Heads I Win, Tails I Don’t Lose Too Much - May 31, 2019 British Pound Chart II-7GBP Technicals 1
GBP Technicals 1
GBP Technicals 1
Chart II-8GBP Technicals 2
GBP Technicals 2
GBP Technicals 2
Recent data in the U.K. have been positive: Mortgage approvals increased to 66.4 thousand in June. Consumer confidence increased from -13 to -11 in July. Nationwide housing prices grew by 0.3% year-on-year in July. Markit manufacturing PMI was unchanged at 48 in July. GBP/USD plunged by 2.6% this week. On Thursday, the BoE’s Monetary Policy Committee voted unanimously to keep rates unchanged at the current level of 0.75%. Growth forecasts were also cut due to Brexit and global trade blues. With Prime Minister Boris Johnson now in power and his commitment to take Britain out of the European Union, markets are seeing increasing risks of a no-deal Brexit in October. Fortunately, this is knocking cable to compelling buy levels. Report Links: Battle Of The Central Banks - June 21, 2019 A Contrarian View On The Australian Dollar - May 24, 2019 Take Out Some Insurance - May 3, 2019 Australian Dollar Chart II-9AUD Technicals 1
AUD Technicals 1
AUD Technicals 1
Chart II-10AUD Technicals 2
AUD Technicals 2
AUD Technicals 2
Recent data in Australia have been positive: Building permits contracted by 25.6% year-on-year in June, but on a chart looks like a lengthy bottoming process. Headline inflation increased to 1.6% year-on-year in Q2. Australian Industry Group (AiG) manufacturing index increased to 51.3 in July. Terms of trade remain a tailwind for the AUD. Export prices rose by 3.8% in Q2 versus expectations for a 2.8% increase. AUD/USD fell by 1.9% this week. This stands in stark contrast to the Australian equity ASX 200 index that reached a new high this week. An accommodative central bank, skyrocketing iron ore prices and a subtle shift in external demand conditions are fuel for the Australian economy, thus the Aussie dollar. Report Links: A Contrarian View On The Australian Dollar - May 24, 2019 Beware Of Diminishing Marginal Returns - April 19, 2019 Not Out Of The Woods Yet - April 5, 2019 New Zealand Dollar Chart II-11NZD Technicals 1
NZD Technicals 1
NZD Technicals 1
Chart II-12NZD Technicals 2
NZD Technicals 2
NZD Technicals 2
There was scant data out of New Zealand this week: Building permits contracted by 3.9% month-on-month in June. The RBNZ activity outlook fell to 5 in July. Business confidence fell to -44.3 in July from -38.1 in June. NZD/USD fell by 1.4% this week. New Zealand remains vulnerable to exogenous downside risks. The RBNZ is lagging the RBA, in a domestic situation that will eventually culminate into the downturn we have witnessed in Australia. Stay long AUD/NZD. . Report Links: Where To Next For The U.S. Dollar? - June 7, 2019 Not Out Of The Woods Yet - April 5, 2019 Balance Of Payments Across The G10 - February 15, 2019 Canadian Dollar Chart II-13CAD Technicals 1
CAD Technicals 1
CAD Technicals 1
Chart II-14CAD Technicals 2
CAD Technicals 2
CAD Technicals 2
Recent data in Canada have been negative: Bloomberg Nanos weekly confidence index fell slightly to 58.2 for the week ending July 26. Industrial product price contracted by 1.4% month-on-month in June. Raw material prices decreased by 5.9% month-on-month in June. GDP growth fell from 1.5% year-on-year in April to 1.4% year-on-year in May. Markit manufacturing PMI increased to 50.2 in July. USD/CAD increased by 0.1% this week. Canadian data was disappointing, but not as much as elsewhere. The First-Time Home Buyers Incentive, scheduled to be launched this September, will allow the government to own 10% equity of the purchased homes in a range of qualified buyers. In the near term, this will cement the floor under CAD. We were stopped out of our short CAD/NOK position this week and are standing aside for now. Report Links: Portfolio Tweaks Into Thin Summer Trading - July 5, 2019 On Gold, Oil And Cryptocurrencies - June 28, 2019 Currency Complacency Amid A Global Dovish Shift - April 26, 2019 Swiss Franc Chart II-15CHF Technicals 1
CHF Technicals 1
CHF Technicals 1
Chart II-16CHF Technicals 2
CHF Technicals 2
CHF Technicals 2
There was scant data out of Switzerland this week: KOF leading indicator increased to 97.1 in July. USD/CHF fell by 0.4% this week. We remain positive on the Swiss franc due to the rising market volatility. EUR/CHF has been weakening of late, a trend that might finally catalyze the SNB towards more unconventional policies. In the past, Swiss central bankers have made sizeable gains by de-swaying market participants. With the large euro short positions currently at stake, we will err on the side of caution. Report Links: What To Do About The Swiss Franc? - May 17, 2019 Beware Of Diminishing Marginal Returns - April 19, 2019 Balance Of Payments Across The G10 - February 15, 2019 Norwegian Krone Chart II-17NOK Technicals 1
NOK Technicals 1
NOK Technicals 1
Chart II-18NOK Technicals 2
NOK Technicals 2
NOK Technicals 2
There was little data out of Norway this week: Retail sales contracted by 0.4% in June. USD/NOK rose by 1.8% this week. Oil prices remain volatile as markets await a demand revival. On the supply side, U.S. has posted the seventh consecutive drawdown in inventory. The combination of supply hurdles (Iran and Venezuela production) and rising demand (a pickup in global growth) should underpin the energy market and by extension the Norwegian krone later this year. Report Links: Portfolio Tweaks Into Thin Summer Trading - July 5, 2019 On Gold, Oil And Cryptocurrencies - June 28, 2019 Currency Complacency Amid A Global Dovish Shift - April 26, 2019 Swedish Krona Chart II-19SEK Technicals 1
SEK Technicals 1
SEK Technicals 1
Chart II-20SEK Technicals 2
SEK Technicals 2
SEK Technicals 2
Recent data in Sweden have been mixed: Retail sales increased by 3.8% year-on-year in June. Trade balance narrowed to SEK 2.9 billion in June. Non-manual workers’ wages grew by 2.4% in May. GDP growth fell from 2.1% year-on-year in Q1 to 1.4% year-on-year in Q2. Manufacturing PMI was unchanged at 52 in July. USD/SEK increased by 1.7% this week. In June, the Swedish exports decreased to SEK 123 billion from SEK 137 billion in May. The imports also fell from SEK 129 billion in May to SEK 120 billion in June. This further reflects the slowdown in global trading activities. The good news is that the Swedish manufacturing new orders to inventory ratio ticked up in July. Going forward, we will closely monitor the Chinese stimulus, trade talk progresses, and global trade for the direction of the krona. Report Links: Where To Next For The U.S. Dollar? - June 7, 2019 Balance Of Payments Across The G10 - February 15, 2019 A Simple Attractiveness Ranking For Currencies - February 8, 2019 Trades & Forecasts Forecast Summary Core Portfolio Tactical Trades Limit Orders Closed Trades
Highlights So What? Prime Minister Boris Johnson’s threat to take the U.K. out of the EU without a withdrawal deal in place is a substantial 21% risk. Why? The odds of a no-deal exit could range from today’s 21% to around 30%, depending on whether Johnson manages to obtain some concessions from the EU in forthcoming negotiations. It is far too early to go bottom-feeding for the pound sterling, as Brexit risks are asymmetrical. We maintain our tactically cautious positioning, despite some cyclical improvements, due to elevated geopolitical risks in the United States, East Asia, and the Middle East. Feature Thank you Mr. Speaker, and of course I should welcome the prime minister to his place … the last prime minister of the United Kingdom. – Ian Blackford, head of the Scottish National Party in Westminster, July 25, 2019 Chart 1No-Deal Brexit Would Come At A Very Bad Time
No-Deal Brexit Would Come At A Very Bad Time
No-Deal Brexit Would Come At A Very Bad Time
The Federal Reserve cut interest rates for the first time since the global financial crisis in 2008 on July 31. The Fed suggested that the door is open for future cuts, though Chairman Jerome Powell signaled that the cut should not be seen as the launch of a “lengthy rate cutting cycle” but rather as a “mid-cycle adjustment” comparable to cuts in 1995 and 1998. President Donald Trump responded by declaring a new 10% tariff on $300 billion worth of imports from China! He resumed criticizing Powell for insufficient dovishness – and Trump could in fact fire Powell, though the decision would be contested at the Supreme Court. The Fed’s move shows that Trump’s direct handle on interest rates comes from his ability to control trade policy and hence affect the “the external sector.” The trade war with China has exacerbated a global manufacturing slowdown that is keeping global growth and U.S. inflation weak enough to justify additional rate cuts with each future deterioration (Chart 1). Improvements in global monetary and fiscal policy suggest that the U.S. and global economic expansion will be extended to 2021 or beyond, which is positive for equities relative to government bonds or cash, but we remain defensively positioned in the near-term due to a range of geopolitical risks, highlighted by the new tariffs. The unconvincing U.S.-China tariff ceasefire agreed at the Osaka G20 has fallen apart as we expected; the period of “fire and fury” between the U.S. and Iran continues; and the U.S. is entering what we expect to be a period of socio-political instability in the lead up to the momentous 2020 presidential election. Moreover the risk of a “no deal” Brexit, in which the U.K. exits the European Union and reverts to basic World Trade Organization tariff levels, is rising and will create acute uncertainty over the next three months despite the world’s easy monetary policy settings (Charts 2A & 2B). In June we upgraded our odds of a no-deal Brexit to 21%, up from 7% this spring. While not our base case, the probability is too high for comfort and the critical timing for the rest of Europe warns against taking on additional risk. The risk of a “no deal” Brexit ... is rising and will create acute uncertainty. Chart 2AUncertainty And Sentiment Getting Worse ...
Uncertainty And Sentiment Getting Worse ...
Uncertainty And Sentiment Getting Worse ...
Chart 2B... Despite Easy Monetary Policy
... Despite Easy Monetary Policy
... Despite Easy Monetary Policy
BoJo’s Gambit Boris Johnson – aka “BoJo” – former mayor of London and foreign secretary, cemented his position as the U.K.’s 77th prime minister on July 24. He immediately launched a gambit to renegotiate the U.K.’s withdrawal. He is threatening not to pay the “divorce bill” (the U.K.’s outstanding budget contributions for the 2014-20 budget period and other liabilities in subsequent decades) of 39 billion pounds. He insists that the Irish backstop (which would keep Northern Ireland or the U.K. in the EU customs union to prevent a hard border between the two Irelands) must be abandoned. He has stacked his cabinet with pro-Brexit hardliners who share his “do or die” stance that Brexit must occur on October 31 regardless of whether an agreement for an orderly exit is in place. These developments were anticipated – hence the decline in our GeoRisk indicator – but the pound sterling is falling now that the confrontation is truly getting under way (Chart 3). Parliament is adjourned in August, so Johnson’s hardline negotiating tactics will get full play in the media cycle until early September, when the real showdown begins. Crunch time will likely run up to the eleventh hour, with Halloween marking an ominous deadline. There is plenty of room for the pound to fall further throughout this period, according to our European Investment Strategy’s handy measure (Chart 4), because the success of Boris’s gambit depends entirely upon creating a credible threat of crashing out of the EU in order to wring concessions that could conceivably pass through the British parliament. Chart 3Our Market-Based Indicator Suggests Still Some Complacency On Brexit Risks
Our Market-Based Indicator Suggests Still Some Complacency On Brexit Risks
Our Market-Based Indicator Suggests Still Some Complacency On Brexit Risks
Chart 4GBP-EUR Still Has Room To Fall Under BoJo's Gambit
GBP-EUR Still Has Room To Fall Under BoJo's Gambit
GBP-EUR Still Has Room To Fall Under BoJo's Gambit
Geopolitically, the United Kingdom is not prohibited from exiting the EU without a deal. Though the empire is a thing of the past, the U.K. remains a major world power. It has Europe’s second-largest economy, nuclear weapons, a blue-water navy, a leading voice in global political institutions, and is a close ally of the United States. It mints its own coin. It is a sovereign entity that can survive on its own just as Japan can survive on its own. This geopolitical foundation always supported our view that there was a 50% chance of the referendum passing in 2016, and today it supports the view that fears over a no-deal Brexit are not misplaced. Investors should therefore not confuse Johnson’s bluster with that of Alexis Tsipras in 2015. A British government dead-set on delivering this outcome – given the popular mandate from the 2016 referendum and the government’s constitutional handling of foreign affairs as opposed to parliament – can probably achieve it. However, the probability of a no-deal Brexit may become overstated in the next two-to-three months. Economically and politically, a no-deal exit is extremely difficult to follow through on – hence our 21% probability. Estimates of the negative economic impact range from a 2% reduction in GDP growth to an 11% reduction (Table 1). The 8% drop cited by Scottish National Party leader Ian Blackford in his denunciation of Prime Minister Johnson’s strategy is probably exaggerated. The U.K.’s recorded twentieth-century recessions range from 2%-7% (Chart 5). These offer as good of a benchmark as any. While a no-deal exit is probably not going to create a shock the same size as the Great Depression or the Great Recession, the recessions of 1979 and 1990 would be bad enough for any prime minister or ruling party. Table 1Wide Range Of Estimates For Impact Of No-Deal Brexit
Tariffs ... And The Last Prime Minister Of The United Kingdom?
Tariffs ... And The Last Prime Minister Of The United Kingdom?
Chart 5
A small recession could also spiral out of control – it could create a vicious spiral with the European continent, which is already on the verge of recession. And it could damage consumer confidence more than anticipated – as it would be accompanied by immediate social and political unrest due to the half of the population that opposes Brexit in all forms. Politicians have to pay attention to the opinion polls as well as the referendum result, since opinion polls impact the next election. These show a plurality in favor of remaining in the EU and a strong trend against Brexit since 2017 – a factor that the currency markets are ignoring at the moment (Chart 6). While the evidence does not prove that a second referendum would result in Bremain, it is highly likely that a majority opposes a no-deal exit, given that at least a handful of pro-Brexit voters do not want to leave without a deal. The results of the European parliamentary elections in May (Chart 7) and the public’s preferences for different political parties (Chart 8) both support this conclusion. Chart 6Plurality Of Voters Still Favors Bremain Over Brexit
Plurality Of Voters Still Favors Bremain Over Brexit
Plurality Of Voters Still Favors Bremain Over Brexit
Chart 7
Chart 8Voters Favor Bremain-Leaning Political Parties
Voters Favor Bremain-Leaning Political Parties
Voters Favor Bremain-Leaning Political Parties
Parliament is also opposed to a no-deal Brexit. Though the Cooper-Letwin bill that forbad a no-deal exit initially passed by one vote in April (Chart 9A), the final amended version passed with a majority of 309 votes. Further, in July, with the rise of Boris Johnson, parliament passed a measure by 41 votes that requires parliament to sit this fall (Chart 9B), thus attempting to prevent Boris from proroguing parliament and forcing a no-deal Brexit that way. Technically Queen Elizabeth II could still prorogue parliament, but we highly doubt she would intervene in a way that would divide the nation. Johnson himself will have to face the reality of parliament and public opinion.
Chart 9
Chart 9
Parliament has one crystal clear means of halting a no-deal exit: a vote of no confidence in Johnson’s government.1 Theresa May only survived her vote of no confidence by 19 seats. Yet Johnson is entering 10 Downing Street at a time when parliament is essentially hung. The Conservative Party’s coalition with Northern Ireland’s Democratic Union Party has been reduced to a majority of two, which is likely to fall to a single solitary seat after the Brecon and Radnorshire by-election, which is taking place as we go to press. Johnson has purged several Tories from his cabinet, and there are a handful of Conservatives who are firmly opposed to a no-deal Brexit. It would be an extremely tight vote as to whether these Tory rebels would be willing and able to bring down one of their own governments – a careful assessment suggests that there are about half a dozen swing voters on each side of the House of Commons.2 But 47 Conservatives contrived to block prorogation (see Chart 9B). The magnitude of the crisis members of parliament would face – an unpopular, self-inflicted no-deal exit and recession – is essential context that would motivate rebellious voting behavior. Parliament’s actions so far, the reality of the economic impact, and the popular polling suggest that MPs are likely to halt the Johnson government from forcing a no-deal exit if he makes a mad dash for it. More likely is that Johnson himself pushes to hold an election after securing some technical concessions from Brussels. He is galvanizing the Conservative vote and swallowing up the single-issue Brexit vote (UKIP and the Brexit Party), while the opposition remains divided between the Labour Party under the vacillating Jeremy Corbyn and the resurgent Liberal Democrats (Chart 10). In a first-past-the-post electoral system, this provides a window of opportunity for the Conservatives to improve their parliamentary majority – assuming that Johnson has renegotiated a deal with the EU and has something to show for it. Chart 10BoJo Could Call Election With Deal In Hand
BoJo Could Call Election With Deal In Hand
BoJo Could Call Election With Deal In Hand
Chart 11Ireland Can Compromise For Stability's Sake
Ireland Can Compromise For Stability's Sake
Ireland Can Compromise For Stability's Sake
This would require the EU to delay the deadline yet again (September 3 is the last date for a non-confidence vote to force a pre-Brexit October 24 election). The European Union has a self-interest in preventing a no-deal Brexit, as it needs to maintain economic stability. It ultimately would prefer to keep the U.K. in the bloc, which means that delays can ultimately be granted, especially to accommodate a new election. As to what kind of compromises are available, the Irish backstop can suffer technical changes to its provisions, time frames, or application. In the end, the Irish Sea is already a different kind of border than the other borders in the U.K. and therefore it is possible to enact additional checks that nevertheless have a claim to retaining the integrity of the United Kingdom. The Democratic Unionists could find themselves outnumbered on this issue. Certainly the Republic of Ireland has an interest in preventing a no-deal Brexit as long as a hard border with Northern Ireland is avoided, and Boris Johnson maintains that it will be (Chart 11). The risk of a no-deal Brexit is around 21% Our updated Brexit Decision Tree in Diagram 1 provides the outcomes. Former Prime Minister Theresa May failed three times to pass her Brexit deal. We allot a 30% chance, higher than consensus, that Boris Johnson can do it through galvanizing the Conservative vote – given that he is operating with a hung parliament and is at odds with the median voter on Brexit. We give 21% odds to a no-deal Brexit based on the difficulty of parliament outright halting Johnson if his government is absolutely determined to follow through with it. This is clearly a large risk but not our base case. We would upgrade these odds to around 30% in the event that negotiations with the EU completely fail to produce tangible outcomes. It is far more likely that a delay occurs and leads to new elections (49%) – and these odds rise to 70% if Johnson fails to extract concessions from the EU that enable him to pass a deal through parliament. Diagram 1Brexit Decision Tree (Updated As Of June 21 For Boris Johnson)
Tariffs ... And The Last Prime Minister Of The United Kingdom?
Tariffs ... And The Last Prime Minister Of The United Kingdom?
A final constraint on Johnson comes from Scotland, as highlighted in the epigraph at the top of the report: the demand for a new Scottish independence referendum is reviving as a result of opposition to Brexit in general and specifically to Prime Minister Johnson’s hardline approach (Charts 12A & 12B). The SNP is also improving its favorability among Scottish voters relative to other parties (Chart 13). We have highlighted this risk in the past: support for Scottish independence does not have a clear ceiling amid the antagonism over Brexit, especially if an economic and political shock hits the union as a result of a forced no-deal exit.
Chart 12
Chart 12
Chart 13Scottish Nationals Resurgent
Scottish Nationals Resurgent
Scottish Nationals Resurgent
Bottom Line: The risk of a no-deal Brexit is around 21%, though a complete failure of negotiations with the EU could push it up to 30%. If it occurs it will induce a recession and eventually could result in the breakup of the union with Scotland. China And Investment Recommendations What can investors be certain of regardless of the different Brexit outcomes? The United Kingdom will reverse the fiscal austerity of recent years (Chart 14). Fiscal stimulus will be necessary either to offset the shock of a no-deal exit in the worst-case scenario, or to address the ongoing economic challenges and public grievances in a soft Brexit or no Brexit scenario. These grievances stem from the negative impact on the middle class of globalization, post-financial crisis deleveraging, low real wage growth, and the decline in productivity. Potential GDP growth is set to fall if immigration is curtailed and restrictions on trade with the EU go up. The government will have to offset this trend with spending to boost the social safety net and encourage investment. Chart 14Fiscal Austerity To Go Into Reverse
Fiscal Austerity To Go Into Reverse
Fiscal Austerity To Go Into Reverse
The pound is clearly weak on a long-term and structural basis (Chart 15). Based on our assessment of the British median voter – opposed to a no-deal Brexit – and the fact that parliament is also opposed to a no-deal Brexit Chart 15Deep Value In Sterling
Deep Value In Sterling
Deep Value In Sterling
and is the supreme lawgiving body in the British constitution, we expect that an enormous buying opportunity will emerge when Prime Minister Johnson’s gambit has reached its apex and he is either forced to accept what concessions the EU will give. But if forced out of office, election uncertainty due to a potential Prime Minister Jeremy Corbyn will prolong the pound’s weakness. Brexit is not the only risk affecting Europe this summer – a critical factor is Europe’s own economic status, which in great part hinges on our China view (Chart 16). The Chinese Communist Party’s mid-year Politburo meeting struck a more accommodative tone relative to the April meeting that sounded less dovish in the aftermath of the Q1 credit splurge. The emphasis of the remarks shifted back to the need to take additional measures to stabilize the economy, as in the October 2018 statement. This fits with our view since February that Chinese stimulus will surprise to the upside this year. Chart 16Chinese Reflation Positive For Europe
Chinese Reflation Positive For Europe
Chinese Reflation Positive For Europe
Policymakers’ efforts are working thus far, with signs of stabilization occurring in the all-important labor market (Chart 17). There is some evidence that Xi Jinping’s anti-corruption campaign is moderating, which also supports the view that policy settings in the broadest sense are becoming more supportive of growth (Chart 18). Chart 17China Will Reflate More
China Will Reflate More
China Will Reflate More
Chart 18Relaxing Anti-Corruption Campaign Another Form Of Easing
Relaxing Anti-Corruption Campaign Another Form Of Easing
Relaxing Anti-Corruption Campaign Another Form Of Easing
Chart 19Hong Kong Equities Have Farther To Fall
Hong Kong Equities Have Farther To Fall
Hong Kong Equities Have Farther To Fall
We still are long European equities versus Chinese equities and are short the CNY-USD. From a geopolitical point of view, the U.S.-China conflict is intensifying with President Trump’s threat to raise an additional 10% tariff on $300 billion of Chinese imports despite the resumption of talks. In addition, the Hong Kong protests are intensifying, with China’s People’s Liberation Army (PLA) warning that it may have to intervene. There is high potential for violence to erupt, leading to a more heavy-handed approach by Hong Kong security forces and even eventual PLA deployment. This suggests there is downside in the Hang Seng index (Chart 19) – and PLA intervention could lead to broader investor concerns about China’s internal stability and another reason for tensions with the United States and its allies. The U.S.-China conflict is intensifying. Our alarmist view on Taiwan in advance of the January 2020 election is finally taking shape. Not only has the Hong Kong unrest prompted a notable uptick in Taiwanese people’s view of themselves as exclusively Taiwanese (Chart 20), but Beijing has also announced additional restrictions on travel and tourism to Taiwan – an economic sanction that will harm the economy (Chart 21). These actions and escalation in Hong Kong raise the odds that the ruling Democratic Progressive Party will remain in power in Taiwan after January and hence that cross-strait relations (and by extension Sino-American relations) will remain strained and will require a higher risk premium to be built in. The latest trade war escalation could easily spill into strategic saber-rattling, as the U.S. blames China for North Korea’s return to bad behavior and China blames the U.S. for dissent in Hong Kong and likely Taiwan.
Chart 20
Chart 21Beijing To Sanction Taiwan Tourism Again
Beijing To Sanction Taiwan Tourism Again
Beijing To Sanction Taiwan Tourism Again
The U.S.-China trade negotiations are falling apart at the moment. We had argued that China’s stimulus and stabilization would create a negative reaction from President Trump, who would regret the Osaka ceasefire when he saw that China’s bargaining leverage had improved. This has come to pass, vindicating our 60% odds of an escalation post-G20. The U.S. Commerce Department could still conceivably renew the Temporary General License for U.S. companies to deal with Chinese tech firm Huawei on August 19, in order to create an environment conducive to progress for the next round of trade talks in September, but with the latest round of tariffs we think it is more likely that we will get a major escalation of strategic tensions and even saber-rattling. China’s new announcements regarding reforms to make local officials more accountable and to make it easier for companies to go bankrupt, including unprofitable “zombie” state-owned enterprises, could be a thinly veiled structural concession to the United States, but it remains to be seen whether these will be implemented and reinforced. Beijing rebooted structural reforms at the nineteenth national party congress but we expect stimulus to overwhelm reform amid trade war. We are converting our long non-Chinese rare earth producers recommendation to a strategic trade, after it hit our 5% stop-loss, as it is supported by our major theme of Sino-American strategic rivalry. The secular nature of this rivalry has been greatly confirmed by the fact that President Trump is now responding to American election dynamics. The U.S. Democratic Party’s primary debates have revealed that the candidates most likely to take on President Trump (Bernie Sanders and Elizabeth Warren) are adopting his hawkish foreign policy and trade policy stance toward China. The frontrunner former Vice President Joe Biden is the exception, as he is maintaining President Obama’s more dovish and multilateral approach. Trump’s clear response is to ensure that he still owns the trade and manufacturing narrative, to call Biden weak on trade, and to prevent the left-wing populists from outflanking him. Short the Hang Seng index as a tactical trade and close long Q1 2020 Brent futures versus Q1 2021 at the market bell tonight. Matt Gertken, Vice President Geopolitical Strategist mattg@bcaresearch.com Footnotes 1 See Maddy Thimont Jack, “A New Prime Minister Intent On No Deal Brexit Can’t Be Stopped By MPs,” May 22, 2019, www.instituteforgovernment.org.uk. 2 See Dominic Walsh, “Would MPs really back a no confidence motion to stop no-deal?” The New Statesman, July 15, 2019, www.newstatesman.com.
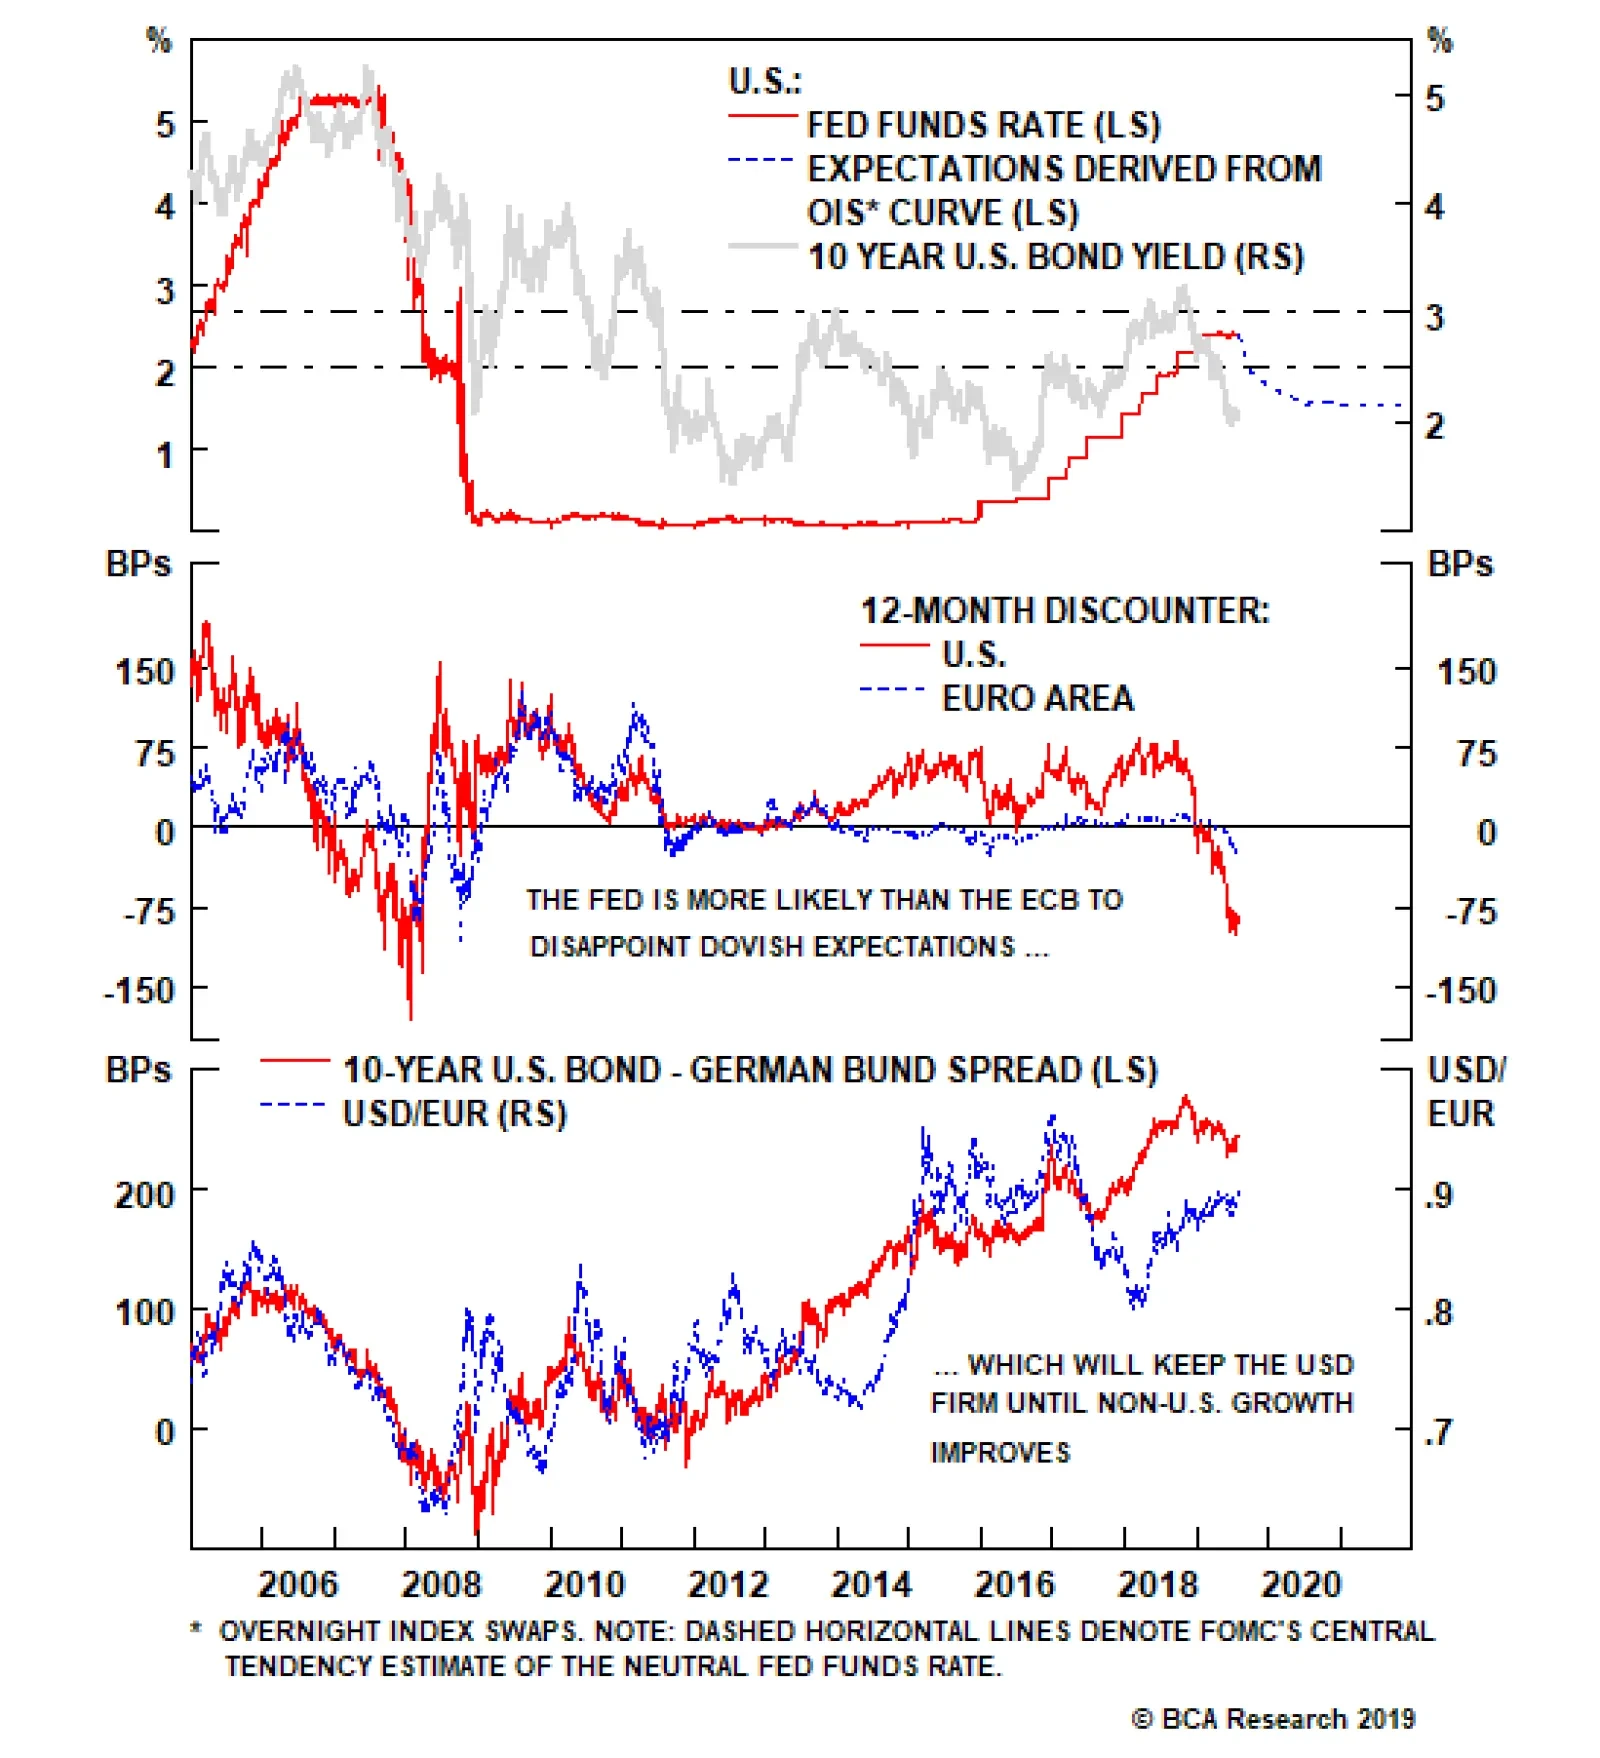
The Fed cut rates yesterday for the first time since the depths of the financial crisis in December 2008, lowering the target range for the funds rate by 25bps to 2-2.25%. The move was expected by markets, but the FOMC did provide a very mild dovish surprise…
Highlights China’s infrastructure investment growth rate could rebound moderately from its current nominal 3% pace, but will remain well below the double-digit rate it has registered for most of the past decade. A lack of funding for local governments and their financing vehicles will somewhat cap the upside in infrastructure fixed-asset investment (FAI) in the next six to nine months. Special bond issuance will be insufficient to ensuring a major recovery in infrastructure spending. Investors should tread cautiously on infrastructure plays in financial markets. Feature Chart I-1Chinese Infrastructure Investment: Double-Digit Growth Again?
Chinese Infrastructure Investment: Double-Digit Growth Again?
Chinese Infrastructure Investment: Double-Digit Growth Again?
Nominal infrastructure investment growth in China has slowed from over 15% in 2017 to 3% currently (Chart I-1). This is the weakest growth rate since 2005 excluding the late 2011-early 2012 period. Over the past decade, each time the Chinese economy experienced a considerable slowdown, infrastructure construction was ramped up to revive growth. Infrastructure spending growth skyrocketed in 2009 and was also boosted in 2012. In 2015-2016, it was not allowed to decelerate with the issuance of nearly RMB 2 trillion of special infrastructure bonds. This time the government has also reacted. Since mid-2018, the Chinese authorities have dramatically raised local governments’ special bonds balance limits, prompted local governments to front-load their issuance this year, and also encouraged the private sector to participate in public-private partnership (PPP) infrastructure projects. Will Chinese infrastructure FAI growth accelerate over the next six to nine months from its current nominal 3% pace to double digits? The short answer is no.
Chart I-2
We believe Chinese infrastructure investment growth could rebound moderately in the next six to nine months, but will still remain below the double-digit growth seen in the past and well below the 18% average growth of the past 15 years. For purposes of this report, the composition of “infrastructure” includes three categories – (1) Transport, Storage and Postal Service, (2) Water Conservancy, Environment & Utility Management, and (3) Electricity, Gas & Water Production and Supply. Chart I-2 presents the breakdown of the nominal infrastructure FAI by category. Funding Constraint Preceding both the 2011-2012 and 2018 infrastructure investment slumps, the Chinese central government increased its scrutiny on local government debt and tightened funding conditions for infrastructure projects. As a result, all three categories of infrastructure spending experienced a sharp deceleration (Chart I-3). Overall, financing and qualitative limitations that Beijing imposes on local government infrastructure spending hold the key to the outlook. We believe Chinese infrastructure investment growth could rebound moderately in the next six to nine months, but will still remain below the double-digit growth seen in the past and well below the 18% average growth of the past 15 years. Looking forward, without a considerable recovery in available financing, there will be no meaningful rebound in Chinese infrastructure investment and construction activity. For now, we are not very optimistic on financing. Chart I-4 shows the breakdown of the major funding sources of Chinese infrastructure investment. All of them are likely to face considerable funding constraints over the next six to nine months. Chart I-3Chinese Infrastructure Investment Growth Has Decelerated Across The Board
Chinese Infrastructure Investment Growth Has Decelerated Across The Board
Chinese Infrastructure Investment Growth Has Decelerated Across The Board
Chart I-4
1. Self-Raised Funds Self-raised funds contribute nearly 60% of overall infrastructure funding. They include net local government special bond issuance, PPP financing and government-managed funds’ (GMFs) revenues excluding proceeds from special bond issuance. A. Local government special bond issuance, which is exclusively used to fund infrastructure projects, has been the major source of financing for local governments in the past 12 months. The authorities significantly boosted net local government bond issuance to RMB 1.2 trillion in the first six months of this year from only RMB 361 billion in the same period in 2018. However, the amount of special bond issuance in the second half of this year will unlikely be significant enough to boost infrastructure FAI greatly. First, the central government has not only set a limit on the aggregate local government special bond balance, but it also set limits for each of the 31 provinces/provincial-level cities.1 In the past three years, nearly all provinces did not use up their special bond issuance quotas. This resulted in an outstanding aggregate amount of special bonds of only about 85% of the limit.2 In both 2017 and 2018, local governments were left with RMB 1.1 trillion special bond issuance quota unused for that year. Second, based on the limit on outstanding amount special bonds set by the central government for the end of 2019, local governments could issue another RMB 0.8-1 trillion of special bonds in the second half of this year. In comparison, in 2018, the issuance was heavily concentrated in the second half of the year with RMB 1.6 trillion. Our estimate shows there will be only RMB 400-600 billion increase in net total special bond issuance in 2019 versus 2018.3 This will translate into a merely 2-3% growth in Chinese infrastructure investment. Third, net local government special bond issuance made up only 15% of overall infrastructure FAI over the past 12 months. Hence, there is still a huge financing gap to be filled (Chart I-5). B. Public-private partnerships (PPP) are unlikely to meet the financing shortage either. PPPs have become an important financing model for Chinese local governments to fund infrastructure investments since 2014. Nevertheless, to control rising local government debt risks, the central government has tightened regulations on PPP projects since early last year. A series of tightened rules have resulted in a sharp deceleration in both PPP investment and overall infrastructure investment growth. Consequently, PPPs contributions to total infrastructure FAI have plunged from over 30% in 2017 to 10% currently (Chart I-6). Chart I-5Special Bond Issuance Accounted For Only 15% Of Infrastructure FAI
Special Bond Issuance Accounted For Only 15% Of Infrastructure FAI
Special Bond Issuance Accounted For Only 15% Of Infrastructure FAI
Chart I-6Public-Private Partnerships: Too Small To Meet The Financing Shortage
Public-Private Partnerships: Too Small To Meet The Financing Shortage
Public-Private Partnerships: Too Small To Meet The Financing Shortage
So far, the rules on PPP projects on local governments remain tight. In March, the central government tightened its rule on local government participation in PPP projects. The new rule states that, if a local government has already spent more than 5% of its overall general expenditures on PPP projects excluding sewage and waste disposal PPP projects, it will not be allowed to invest in any new PPP projects. Before March, the threshold was over 10%. In early July, the National Development and Reform Commission (NDRC) demanded all PPP projects undertake a thorough feasibility study. The NDRC emphasized that PPP projects that do not follow standard procedures will not be allowed. Chart I-7Government-Managed Funds: Headwinds From Falling Land Sales
Government-Managed Funds: Headwinds From Falling Land Sales
Government-Managed Funds: Headwinds From Falling Land Sales
C. Government-managed funds (GMF) excluding special bond issuance accounts, which contribute about 15% of overall infrastructure financing, are also facing constraints. According to the country’s Budget Law, the GMF budget refers to the budget for revenues and expenditures of the funds raised for specific developmental objectives. In brief, GMFs constitute de-facto off-balance-sheet government revenues and spending. Land sales by local governments are one major revenue source for GMFs. Contracting property floor space sold is likely to depress real estate developers’ land purchases, further reducing local governments’ revenues from selling land (Chart I-7). This will curb local governments’ ability to finance their infrastructure projects through GMFs. 2. Domestic Loans Domestic loans contribute to about 15% of overall infrastructure financing. Infrastructure projects are generally long term in nature. Presently, the impulse of non-household medium- and long-term (MLT) lending has stabilized but has not yet improved (Chart I-8). While not all of MLT loans are used for infrastructure, sluggish MLT lending reflects commercial banks’ reluctance to finance infrastructure projects. We believe a decelerating economy, mounting local government debt, and often-low returns on infrastructure projects will continue to constrain loan funding of infrastructure projects from both banks and the private sector. 3. General Government Budget The general government budget (which includes central and local governments) accounts for about 15% of overall infrastructure financing. The general budget is also facing headwinds from declining revenue due to recent tax cuts and lower corporate profit growth (Chart I-9). Chart I-8Sluggish Medium/Long-Term Bank Lending
Sluggish Medium/Long-Term Bank Lending
Sluggish Medium/Long-Term Bank Lending
Chart I-9Government General Budget: Large Deficit
Government General Budget: Large Deficit
Government General Budget: Large Deficit
Bottom Line: Funding constraints will likely linger, making any recovery in Chinese infrastructure investment growth moderate over the next six to nine months. Local government special bonds will not be a game-changer. Their net issuance accounted for only 15% of overall infrastructure FAI over the past 12 months. While local governments could issue another RMB 0.8-1 trillion of special bonds in the second half of 2019, it would be well below the RMB 1.4 trillion of special bond issuance that was rolled out in the second half of 2018. FAI In Transportation: In Nominal Terms… The transportation sector accounts for about 31% of total Chinese infrastructure investment. It includes railway, highway, urban public transit, air and water transport. Table I-1 shows the 13th five-year (2016-2020) transportation investment plan released by the government in February 2017,4 which excludes urban public transit.
Chart I-
The authorities planned to invest RMB 15 trillion in the transportation sector over the five-year period between 2016 and 2020, with highways accounting for over half of the investment, followed by railways (23%), air transportation (4.3%) and water transportation (3.3%). The table also shows our calculation of the realized investment amount in these four sub-sectors for the period of January 2016 to June 2019. Local government special bonds will not be a game-changer. Their net issuance accounted for only 15% of overall infrastructure FAI over the past 12 months. Table I-1 suggests the remaining FAI for the transportation sector for the July 2019 to December 2020 period will be considerably smaller than the FAI amount over the past 18 months. This entails a major drag on infrastructure investment at least over the next 18 months. It is important to emphasize that this is conditional on the central planners in Beijing sticking to their five-year plan for infrastructure FAI. As of now, there has been no announcement of revisions to these five-year FAI targets. Bottom Line: China has already completed the overwhelming majority of its planned transportation FAI for 2016-2020. Consequently, without revisions to the targets and budgets by central planners in Beijing, transportation investment will likely contract year-on-year over the next 18 months. …And Real Terms Table I-2 summarizes the 2020 targets for major Chinese infrastructure development (urban rail transit, railway, highway and airport) in real terms.
Chart I-
Chart I-10Transportation 2020 Targets: Not Far Away
Transportation 2020 Targets: Not Far Away
Transportation 2020 Targets: Not Far Away
In real terms, the annual growth of transportation infrastructure will likely be 4.2% in both 2019 and 2020. We illustrated in the previous section that the five-year budget plan had been front-loaded, leaving a very small budget for transportation investment over the next 18 months. This may suggest that without considerably exceeding the budget, transportation infrastructure will fail to achieve the 4.2% annual growth in real terms both this year and next. In brief, more funding should be dispatched/allowed by the central planners in Beijing for infrastructure FAI not to shrink. Second, urban rail transit, high-speed railways, highways and airports will reach their respective 2020 targets, while non-high-speed railway construction will likely be a little bit off its 2020 target. Third, based on the 2020 targets, urban rail transit will enjoy very fast growth over the next one and a half years. Fourth, the growth of high-speed railways and highways will be very low, at around 1-2% in real terms (Chart I-10). Finally, while the number of airports will increase at a faster pace, their contribution to overall infrastructure investment will remain insignificant as they only account for about 1.4% of overall infrastructure investment. Bottom Line: In real terms, transport infrastructure growth will likely be only about 4% over the next six to nine months. Future Infrastructure Investment Focus Urban rail transit, environmental management and public utility management will likely be the major driving forces for Chinese infrastructure investment over the next 18 months. Urban rail transit line length will likely register fast growth of around 10% over the next six to nine months. As the central government enforces increasingly stringent rules on environmental protection, investment in environmental management will likely experience continued growth acceleration (Chart I-11). China has already completed the overwhelming majority of its planned transportation FAI for 2016-2020. Consequently, without revisions to the targets and budgets by central planners in Beijing, transportation investment will likely contract year-on-year over the next 18 months. Meanwhile, as the country’s urbanization continues and more townships and city suburbs become urbanized,5 public utility management investment will also grow moderately. Public utility management investment, contributing a massive 45% of overall infrastructure investment, includes sewer systems, sewer treatment facilities, waste treatment and disposal, streetlights, city roads construction, parks, bridges and tunnels in the city. Investment Implications Investors should not hold their breath expecting a major upswing in infrastructure FAI and a major rally in related financial markets. Chinese steel demand is sensitive to construction of railways and urban rail transit lines (Chart I-12, top panel). In turn, mainland cement demand is dependent on highway construction (Chart I-12, bottom panel). Chart I-11Environment Management: Will Continue Booming
Environment Management: Will Continue Booming
Environment Management: Will Continue Booming
Chart I-12Chinese Infrastructure Spending Will Moderately Boost Steel & Cement Demand...
Chinese Infrastructure Spending Will Moderately Boost Steel & Cement Demand...
Chinese Infrastructure Spending Will Moderately Boost Steel & Cement Demand...
Chart I-13...And Steel & Cement Prices At The Margin
...And Steel & Cement Prices At The Margin
...And Steel & Cement Prices At The Margin
The infrastructure sector accounts for about 10-15% of total Chinese steel use, and about 30-40% of Chinese cement consumption. Nevertheless, given that we believe Chinese infrastructure spending will only have a moderate recovery, the positive effect on steel and cement prices will be muted as well (Chart I-13). The same holds true for spending on industrial machinery, equipment, chemicals and various materials. Notably, risks to this baseline scenario of a muted recovery are to the downside because of the lack of funding. Barring a substantial increase in the special bond issuance quota this year or a major credit binge, infrastructure FAI growth could in fact stall. Ellen JingYuan He, Associate Vice President ellenj@bcaresearch.com Footnotes 1 Please note that the central government only set the special bond balance limit (not the quota) for local governments. The often-cited “quota” in the news is derived by calculating the difference between the current limit and the previous year’s limit. The “quota” used in this report is the difference between the current special bond balance limit and the actual special bond balance of the previous year end. 2 At the end of 2018, Chinese special bond balance was RMB 7.4 trillion, only 85.8% of the special bond balance limit of RMB 8.6 trillion. This ratio was 84.6% in 2017 and 85.5% in 2016. On average, the ratio was 85.3% in the past three years. 3 Given that the central government is aiming to somewhat stimulate infrastructure spending by increasing special bond issuance, we assume special bond balance at the end of 2019 to reach 88%-90% of the limit (RMB 10.8 trillion) that it has set for 2019. This will be higher than the 85% average of the past three years. In turn, this means that the special bond balance at the end of this year will likely be RMB 9.5-9.7 trillion. Since the balance at the end of last year was RMB 7.4 trillion, this results that net special bond issuance will be around RMB 2.1-2.3 trillion in 2019. Given the net special bond issuance last year was RMB 1.7 trillion, it follows that there will only be a RMB 400-600 billion increase in total special bond issuance in 2019 versus 2018. 4 Please see www.gov.cn/xinwen/2017-02/28/content_5171576.htm, published February 28, 2017, by the Chinese central government website. 5 Please see Emerging Markets Strategy/China Investment Strategy Special Report “Industrialization-Driven Urbanization In China Is Losing Steam,” dated January 2, 2019, available on ems.bcaresearch.com
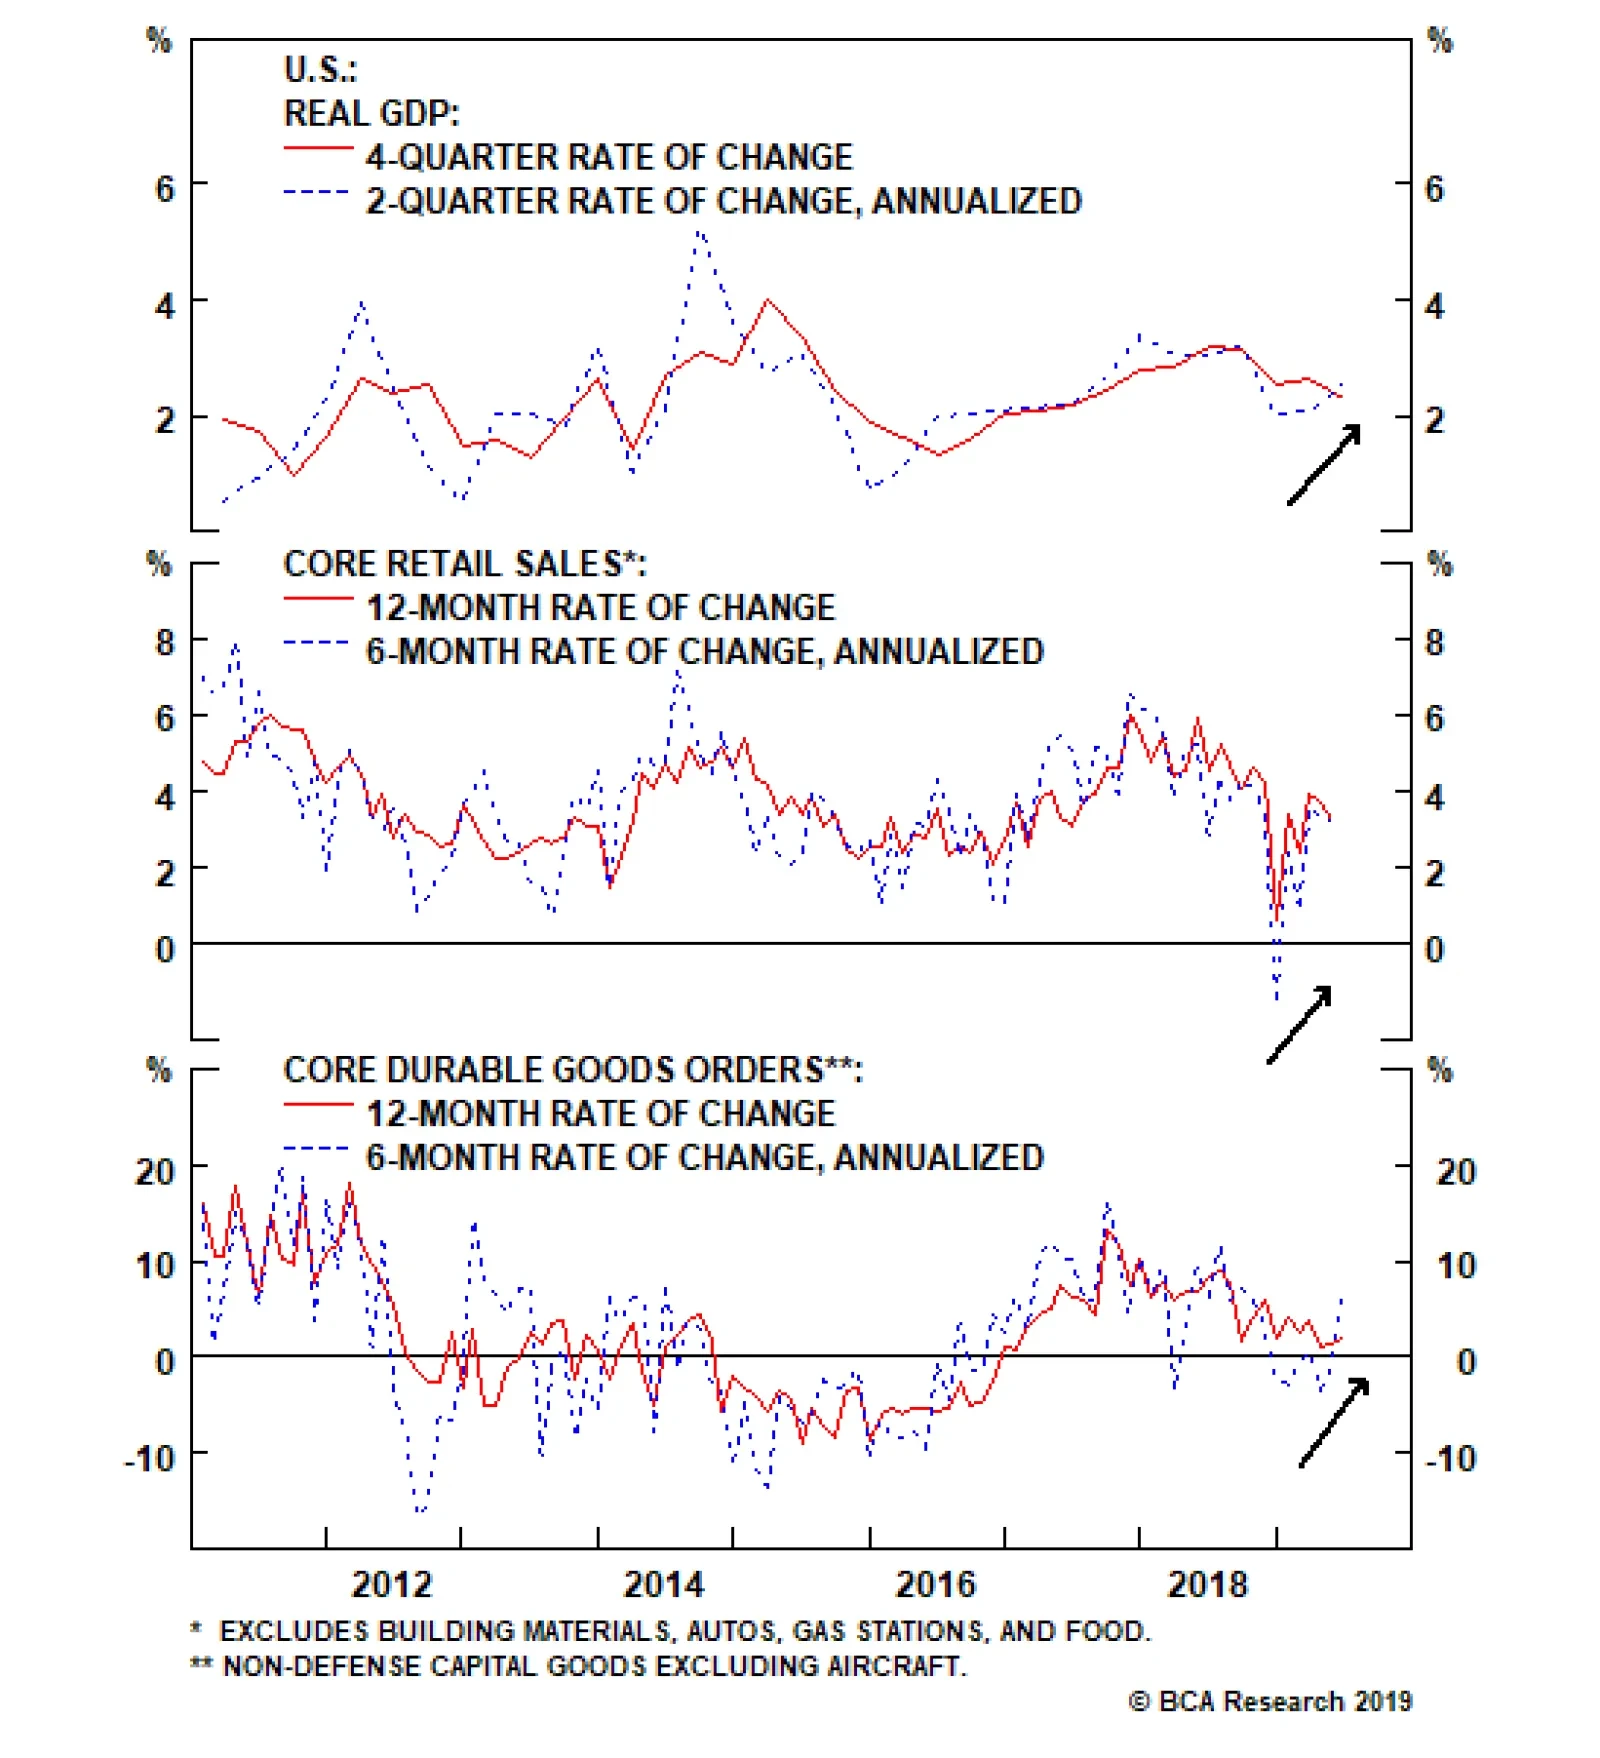
All Eyes On The Fed: Insurance Cuts In July & Possibly September, But No More After That
…