Policy

Highlights As central banks continue to push on a string for 2 percent inflation, it will underpin the valuation of equities and other risk-assets. So long as the global 10-year bond yield remains well below 2.5 percent, equity market sell-offs will be limited to corrections rather than an outright bear market. Within bonds, steer towards those where the monetary policy toolbox is not depleted, namely U.S. T-bonds. Within currencies, steer towards those where the monetary policy toolbox is already depleted, namely the yen and the euro. Expect an early U.K. General Election whose result is extremely difficult to call. Until this fog of U.K. political uncertainty clears, steer clear of the pound and go long the international FTSE100 versus the domestic FTSE250. Dear Client, In lieu of the next weekly report I will be presenting the quarterly webcast on Tuesday 6 August at 10.00AM EDT, 3.00PM BST, 4.00PM CEST, 10.00PM HKT. Be sure to join me. Dhaval Joshi Feature How Central Banks Have Misunderstood Inflation Chart Of The WeekInflation Expectations Just Track Actual Inflation
Inflation Expectations Just Track Actual Inflation
Inflation Expectations Just Track Actual Inflation
Central banks continue to obsess about their failure to achieve inflation of two point zero (Chart I-2). The irony is that they should be rejoicing from the rooftops, because the major developed economies have all now reached the holy grail of price stability. Central banks have misunderstood price stability because they have defined it over-precisely in terms of econometric models and mathematics, when the way we actually perceive it has as much to do with psychology and physiology. Chart I-2Failing To Achieve Two Point Zero
Failing To Achieve Two Point Zero
Failing To Achieve Two Point Zero
The human brain cannot distinguish inflation rates between -1 and 2 percent, a range we just perceive as ‘price stability’. As an example, if a loaf of bread costs 77 pence today, most people – myself included – would not perceive the difference between it costing 70 pence five years ago (2 percent inflation) or 73 pence (1 percent inflation). Compounding the perception difficulty is quality improvements. If the ingredients and nutritional quality are better today, then the price of the loaf may actually have gone down! Yet central banks persist in thinking of inflation within a linear spectrum which they can nail to one decimal place. Even now, Draghi talks about “survey-based inflation expectations at a level of 1.6/1.7 percent” as if the decimal point actually means something! What Draghi fails to recognise is that the human brain cannot perceive inflation to that level of mathematical precision. If I cannot distinguish between -1 and 2 percent inflation, then it is impossible for the central bank to change my inflation expectations within that range, because the entire range just feels like price stability to me. Therefore, my behaviour in terms of wage demands and willingness to borrow will also stay unchanged. And if my behaviour is unchanged, what is the transmission mechanism from -1 to 2 percent inflation? Chart I-3Inflation Expectations Just Track Actual Inflation
Inflation Expectations Just Track Actual Inflation
Inflation Expectations Just Track Actual Inflation
This largely explains why monetary policy can take an economy from price instability into the range of price stability, but cannot fine-tune inflation within this broad range of price stability between -1 to 2 percent. The ultimate proof is that the market-based inflation expectations that central banks try to guide just track actual inflation (Chart Of The Week and Chart I-3). The problem is that central banks have created a rod for their own back. It is difficult for them to change their targets without gravely undermining their credibility. As Fed Chair Jay Powell points out “2 percent has become the global norm… saying that you’re going to change target – I wonder how credible that will be.” When Monetary Policy Is Depleted Monetary policy operates through the term structure of interest rates. The central bank sets short-term rates directly, and it establishes long-term rates through its forward guidance and QE tools. Other tools, like the TLTROs, simply ensure the effective transmission of the term structure to the banking system. Regarding QE, many people still believe that it is the central bank’s removal of bond supply that drives down their yields. This is plain wrong. The bond market sets the price of the QE transaction according to the signal it receives about future interest rate policy. For example, if QE implied rampant inflation down the road – and therefore higher interest rates – the act of QE would lift bond yields, perhaps considerably. In fact, the market interprets QE as a resolve to keep policy rates lower for longer and this is why it depresses yields. At this week’s ECB policy announcement, expect the usual flannel and bluster. To achieve its 2 percent inflation target, “the Governing Council stands ready to act and use all the instruments that are in the toolbox”. The trouble is, once the term structure is at its lower bound all along its length – as it almost is in the euro area and Japan – the monetary policy toolbox is out of tools (Chart I-4 and Chart I-5). Chart I-4The Monetary Policy Toolbox Is Out Of Tools...
The Monetary Policy Toolbox Is Out Of Tools...
The Monetary Policy Toolbox Is Out Of Tools...
Chart I-5...Once The Term Structure Is At Rock Bottom All Along Its Length
...Once The Term Structure Is At Rock Bottom All Along Its Length
...Once The Term Structure Is At Rock Bottom All Along Its Length
The ECB’s increasing impotence is not something it wants to admit. As Upton Sinclair pointed out: it is difficult to get a man to understand something, when his salary depends upon his not understanding it! But to his credit, Draghi has at least hinted that the ECB toolbox is depleted, acknowledging that “in case of adverse contingencies, fiscal policy will have to play a fundamental role.” What Does This Mean For Market Strategy? To repeat, in a range of -1 to 2 percent, inflation expectations become insensitive to monetary policy. So in their obsession to achieve two point zero, central banks have pushed harder and harder on a piece of string. As a result, the experimental policy tools of our era have been forward guidance and QE, which have depressed bond yields to unprecedented lows (Chart I-6 and Chart I-7). Chart I-6Forward Guidance And QE...
Forward Guidance And QE...
Forward Guidance And QE...
Chart I-7...Have Depressed Bond Yields To Historic Lows
...Have Depressed Bond Yields To Historic Lows
...Have Depressed Bond Yields To Historic Lows
Now we come to the crucial twist in the story. When bond yields enter a range of -1 to 2 percent risk-asset valuations become hyper-sensitive to monetary policy. We refer readers to previous reports in which we have extensively explained this dynamic. The upshot is that at ultra-low bond yields, the transmission to price inflation breaks down, but the transmission to risk-asset inflation increases exponentially1 (Chart I-8 and Chart I-9). Chart I-8Ultra-Low Bond Yields...
Ultra-Low Bond Yields...
Ultra-Low Bond Yields...
Chart I-9...Have Lifted Equity Valuations To Historic Highs
...Have Lifted Equity Valuations To Historic Highs
...Have Lifted Equity Valuations To Historic Highs
For market strategy, the good news is that as central banks continue to push on a string for 2 percent inflation, it will underpin the valuation of equities and other risk-assets. So long as the global 10-year bond yield remains well below 2.5 percent, sell-offs will be limited to corrections rather than an outright bear market.2 The other good news is that if there is no major dislocation in financial markets, economic downturns will be limited to down-oscillations rather than an outright recession. This is because, contrary to popular belief, the causality does not run from recessions to financial market dislocations; it almost always runs the other way, from financial market dislocations to recessions. The final strategic point is: within currencies, steer towards those where the monetary policy toolbox is already depleted, namely the yen and the euro. Conversely, within bonds, steer towards those where the monetary policy toolbox is not depleted, namely U.S. T-bonds. Brexit Update Talking of flannel and bluster, Britain’s Conservative party has elected a new leader who, by default, becomes the new Prime Minister. But while the Conservatives and the U.K. have a new leader, as far as Brexit is concerned, plus ça change plus c’est la même chose. A new leader does not change the tight parliamentary arithmetic in which the Conservative/DUP pact now has a wafer-thin working majority of just four, likely reduced to just three after the Brecon and Radnorshire by-election on August 1. Neither does it change the EU27’s ‘red line’ to protect the integrity of the single market at the Republic of Ireland’s border with Northern Ireland. Meaning that either the whole of the U.K. or Northern Ireland must stay in a customs union with the EU27. Chart I-10When The Pound Weakens, The International FTSE100 Outperforms The Domestic FTSE250
When The Pound Weakens, The International FTSE100 Outperforms The Domestic FTSE250
When The Pound Weakens, The International FTSE100 Outperforms The Domestic FTSE250
Given these hard constraints we expect an early General Election whose result is extremely difficult to call. This is because the U.K.’s first past the post voting system is designed for a two party structure, and not for the four parties that are now in contention (five in Scotland).3 Until this fog of political uncertainty clears at least partly, steer clear of the pound. U.K. equity investors should go long the international FTSE100 versus the domestic FTSE250 (Chart I-10). Fractal Trading System* This week we note that the blistering outperformance of the New Zealand electricity sector following the public float last year is technically extended and susceptible to a countertrend reversal. This trade is based on the 52-week fractal dimension and so has a potential duration of a year, longer than our normal trades. Short the New Zealand electricity sector versus the broader New Zealand market setting a profit target of 7 percent with a symmetrical stop-loss. In other trades, short Russia (MOEX) versus Japan (Nikkei) achieved its 5 percent profit target and is now closed. This leaves five open positions. For any investment, excessive trend following and groupthink can reach a natural point of instability, at which point the established trend is highly likely to break down with or without an external catalyst. An early warning sign is the investment’s fractal dimension approaching its natural lower bound. Encouragingly, this trigger has consistently identified countertrend moves of various magnitudes across all asset classes.
New Zealand: Electricity VS. Market
New Zealand: Electricity VS. Market
Dhaval Joshi, Chief European Investment Strategist dhaval@bcaresearch.com Footnotes 1 Please see the European Investment Strategy Weekly Report ‘Risk: The Great Misunderstanding Of Finance’ October 25, 2018 available at eis.bcaresearch.com. 2 We define the global bond yield as the simple average of the 7-10 year government bond yields in the U.S., euro area, and China. A proxy is the simple average of the 10-year yields in the U.S., France, and China. 3 From political left to right, the parties are Labour, Liberal Democrat, Conservative, and Brexit. Scotland also has the Scottish National Party. Fractal Trading System The post-June 9, 2016 fractal trading model rules are: When the fractal dimension approaches the lower limit after an investment has been in an established trend it is a potential trigger for a liquidity-triggered trend reversal. Therefore, open a countertrend position. The profit target is a one-third reversal of the preceding 13-week move. Apply a symmetrical stop-loss. Close the position at the profit target or stop-loss. Otherwise close the position after 13 weeks. Use the position size multiple to control risk. The position size will be smaller for more risky positions. * For more details please see the European Investment Strategy Special Report “Fractals, Liquidity & A Trading Model,” dated December 11, 2014, available at eis.bcaresearch.com. Cyclical Recommendations Structural Recommendations Closed Fractal Trades Trades Closed Trades Asset Performance Currency & Bond Equity Sector Country Equity Indicators Bond Yields Chart II-1Indicators To Watch - Bond Yields
Indicators To Watch - Bond Yields
Indicators To Watch - Bond Yields
Chart II-2Indicators To Watch - Bond Yields
Indicators To Watch - Bond Yields
Indicators To Watch - Bond Yields
Chart II-3Indicators To Watch - Bond Yields
Indicators To Watch - Bond Yields
Indicators To Watch - Bond Yields
Chart II-4Indicators To Watch - Bond Yields
Indicators To Watch - Bond Yields
Indicators To Watch - Bond Yields
Interest Rate Chart II-5Indicators To Watch - Interest Rate Expectations
Indicators To Watch - Interest Rate Expectations
Indicators To Watch - Interest Rate Expectations
Chart II-6Indicators To Watch - Interest Rate Expectations
Indicators To Watch - Interest Rate Expectations
Indicators To Watch - Interest Rate Expectations
Chart II-7Indicators To Watch - Interest Rate Expectations
Indicators To Watch - Interest Rate Expectations
Indicators To Watch - Interest Rate Expectations
Chart II-8Indicators To Watch - Interest Rate Expectations
Indicators To Watch - Interest Rate Expectations
Indicators To Watch - Interest Rate Expectations
The speech focused on how, when interest rates are close to the zero bound, the Fed should “act quickly to lower rates at the first sign of economic distress”. Investors interpreted this dovish speech as a signal that the Fed might be gearing up for a 50…
Highlights Six months into a credit expansionary cycle, China’s economic recovery remains fragile. Lack of government support for the auto and property sectors is undermining a cyclical recovery. Accommodative monetary policy is not enough to lift the Chinese economy out of its doldrums, particularly as households and companies remain restrained in levering up and spending. Fiscal policy has become more proactive this year by front-loading local government bond financing in the first half of 2019. But if policymakers are to stick to their budget deficit target for the year, the second half of the year will see fiscal tightening. Early signs suggest China is positioning for a further loosening of fiscal spending. However, the Chinese leadership will likely only allow limited additional stimulus this year, resulting in a “W-shaped” economic trajectory for the rest of 2019. In the near-term, the risk to Chinese equity underperformance is high. But over the coming 6-12 months, odds are that the economy will have weakened enough for the Chinese government to make concerted efforts to stimulate. An overweight stance on Chinese stocks is hence warranted over that time horizon. Feature China’s credit growth bottomed in December last year. Six months later, however, China’s economy is showing few signs of emerging from the woods: official GDP growth in the second quarter of this year rang in at its lowest pace in 27 years. Our monthly gauge of China’s business activity, after a brief improvement earlier this year, has flat-lined. The growth of investable earnings per share has fallen into negative territory (Chart 1).More concerning, however, is that manufacturing output has been trending straight down following a first-quarter blip (Chart 2). Chart 1Not Yet Out Of The Woods
Not Yet Out Of The Woods
Not Yet Out Of The Woods
Chart 2Turning The Corner In Q3?
Turning The Corner In Q3?
Turning The Corner In Q3?
As we mentioned in our July 10th, 2019 China Investment Strategy Weekly,1 while keeping monetary policy accommodative, China’s central bank has not been particularly proactive at significantly stimulating the economy. We believe the People’s Bank of China will continue to sit on the sidelines until the economy deteriorates further, and until they receive more clear guidance from China’s top leadership. The Politburo mid-year economic review meeting in late July will likely shed some light on any upcoming policy shift.
Chart 3
In the meantime, fiscal policy has taken a more proactive role in supporting the economy this year: unprecedented tax cuts that account for about 1.7% of GDP started on January 1st, and local government bond issuance accelerated in the first half of 2019 relative to the past two years (Chart 3). Nevertheless, reflationary efforts in the past six months measured by aggregate credit growth as a percentage of nominal GDP have been “half-measured” compared to previous credit expansions. As a result, it is taking longer for China’s economy to find its footing. The Missing Two “Prongs” It is convenient to blame the ongoing U.S.-China trade war for the sluggishness in the Chinese economy, especially in the manufacturing sector. But in our view, the trade war has only magnified what was already a weak and deteriorating domestic Chinese economy due to previously tight policy.2 What’s more, the magnitude of the stimulus so far has not been large enough to fully reverse the decline in Chinese domestic demand growth. The imbalances in China’s “old economy” have also stymied the effectiveness of the stimulus. Among the three “prongs” that supported a “V-shaped” economic recovery in 2015-2016 (stepped-up infrastructure spending, and support for the auto and real estate sectors), the latter two have been missing in the current episode3: Automobile. Both car sales and production have been contracting for almost a year. The contractions deepened in the second quarter from the first quarter, despite accommodative monetary and credit conditions. This is in sharp contrast from what happened in the 2015-2016 cycle: As credit growth picked up in mid-2015, year-on-year growth in auto sales and production both turned positive three months later and stayed mostly in positive territory until 2018 (Chart 4). Chart 4Auto Sector Has Not Responded To Stimulus
Auto Sector Has Not Responded To Stimulus
Auto Sector Has Not Responded To Stimulus
Chart 5ALess Demand For Autos
Less Demand For Autos
Less Demand For Autos
BCA’s Emerging Markets Strategy team has written at length on this topic.4 From their lens, both secular and cyclical factors have contributed to this year’s auto sector slump: First, a sharply higher automobile ownership rate in recent years has cyclically reduced household demand for cars (Chart 5A); Second, the central government has only allowed regional governments to loosen up policy restrictions on automobile purchases and license applications, as opposed to providing monetary incentives through sales tax reductions and subsidies in both 2009 and 2016. Another important contributing factor to depressed auto sales is the constraint on Chinese households’ balance sheets (Chart 5B). The rapid growth in mortgage and consumer borrowing from 2015-2017 has pushed Chinese household debt to nearly 120% of disposable income, higher than that in the U.S. (Chart 5C). Chart 5BSlower Pace In Leveraging For Chinese Households...
Slower Pace In Leveraging For Chinese Households...
Slower Pace In Leveraging For Chinese Households...
Chart 5C...Following A Borrowing Binge
...Following A Borrowing Binge
...Following A Borrowing Binge
Real Estate. The real estate sector was another “prong” that was crucial to the 2015-2016 cyclical recovery in China’s economy. Property sales picked up sharply in 2015, along with ballooning mortgage loans (Chart 6). In this cycle, however, housing sales have been sluggish, and real estate developers have been struggling to complete projects they have started (Chart 7). The three factors that drove property demand in 2015-2017 are now absent: Chart 6Property Market Was Red Hot In 2015-2016
Property Market Was Red Hot In 2015-2016
Property Market Was Red Hot In 2015-2016
Chart 7The Party Did Not Repeat In Current Cycle
The Party Did Not Repeat In Current Cycle
The Party Did Not Repeat In Current Cycle
Skyrocketing mortgage lending. As mentioned above, the acceleration in household leveraging is unlikely to repeat in the current cycle. Real estate developers’ access to funding was the key to the strength of construction activity in the property market in 2016. Presently, real estate developers lack access to credit, including financing through shadow banking (Chart 8A). The China Banking and Insurance Regulatory Commission (CBIRC) has stepped up in real estate financing regulations and supervisions: It recently issued window guidance to curb certain borrowing activities among real estate developers in the offshore market, and also from obtaining financing through shadow banking domestically. Government subsidies are missing. Most importantly, subsidies from China’s central bank to the real estate sector was another key pillar of support for the property boom in the previous cycle. Our calculations indicate that about 20% of floor space sold (in volume terms) in 2017 was due to the Pledged Supplementary Lending5 (PSL) facility designed for slum area reconstruction.6 As of June, PSL has remained deeply in negative territory for 11 straight months (Chart 8B). Chart 8ARestrictive Lending Environment Unlikely To Change Soon
Restrictive Lending Environment Unlikely To Change Soon
Restrictive Lending Environment Unlikely To Change Soon
Chart 8BGovernment Subsidies Are Missing
Government Subsidies Are Missing
Government Subsidies Are Missing
The high level of leverage in both the household and property sectors have been focal points in the Chinese leadership’s financial deleveraging and de-risking campaign. Indeed, the restrictive financing environment for both sectors reflects the Chinese authorities’ determination to curb excessive borrowing and speculation in the housing market. Bottom Line: Two of the three impetuses that supported the upswing in the Chinese economy in 2015-2017 – auto sales and real estate – have so far been subdued or have acted as a drag on the economy in the current cycle. China will have to rely on the third pillar – infrastructure spending – to support the economy. Fiscal Policy “China will continue to implement a proactive fiscal policy, a prudent monetary policy and an employment-first policy, while making good use of counter-cyclical regulation tools and carrying out anticipatory adjustments and fine-tuning when necessary.” - Premier Li Keqiang, July 15, 2019. Fiscal policy has been proactive this year, but so far has failed to catalyze a recovery in investment spending. More importantly, the existing institutional framework on fiscal policy suggests that unless the Chinese government is willing to remove budgetary constraints, we will see fiscal tightening in the second half of the year. During the first half of this year, 70% of 2019’s total budgeted local government bonds were issued, double the amount issued in the same period last year.7 According to the Ministry of Finance, 65% of total local government bonds issued (including both general and special-purpose bonds) were invested in infrastructure projects.8 However, the growth figure for fixed-asset investment (including infrastructure) for the first six months of 2019 was the weakest in the past five years. The considerable deceleration in infrastructure investment since late 2017 can be attributed to three factors: a. Sharply shrinking shadow banking. Local government spending has been stymied by the central government’s financial deleveraging efforts (Chart 9A). This affects both on-book fiscal spending and off-book spending by local government financing vehicles (LGFV). Although the exact impact on the latter is hard to quantify, the cracking down on shadow banking, a major financing channel for LGFV, coincides with the peak of infrastructure investment growth. Chart 9AShadow Banking Was A Crucial Funding Source For Infrastructure Investment
Shadow Banking Was A Crucial Funding Source For Infrastructure Investment
Shadow Banking Was A Crucial Funding Source For Infrastructure Investment
Chart 9BA Thinner Wallet This Year
A Thinner Wallet This Year
A Thinner Wallet This Year
b. Lower government revenue. Sluggish land sales have undermined local governments’ revenue streams. Land sales account for three quarters of local government revenue. Chart 9B shows that both land sales and government revenue decelerated in mid-2018, as lending conditions for the property sector became restrictive. In addition, as part of its fiscal stimulus efforts, the Chinese authorities stepped up on tax cuts to businesses and individuals this year. Tax cuts are estimated to augment the government’s 2019 deficit by 0.2 percentage points of GDP. As a result, government revenue from tax income in the first half of 2019 only grew by 0.9% year-on-year, way below the 14% growth clocked last year (Chart 9B, middle panel). By law, local governments cannot exceed their annual budgetary deficit by more than their quote of general purpose bond issuance. Lower revenue from slower land sales and tax cuts have impeded local governments’ spending capabilities. A bigger concern for investors is that the Chinese central and local governments are approaching their annual budgetary limits. By the end of June, while central and local governments have spent half of their budgeted expenditures for 2019, local governments had reached 70% of their total debt limits for the year. If the Chinese government is to stick to its 2019 budget, the fiscal impulse will lose steam in the second half of 2019: fiscal policy will actually tighten through the remainder of the year. Chart 10A and 10B illustrate that under such scenario, both fiscal spending and local government bond issuance will be trending down. Chart 10AFiscal Impulse Losing Steam In 2H?
Fiscal Impulse Losing Steam In 2H?
Fiscal Impulse Losing Steam In 2H?
Chart 10
Increasing spending by raising the budgeted deficit target ceiling is an option, though the least likely one. The basis is that a mid-year budgetary deficit revision would need the National People’s Congress’ approval, which has not occurred in the past 30 years.9 Nonetheless, the tone from the latest policy announcements suggests that the Chinese leadership is increasingly willing to work around these constraints and is positioning for a further loosening of fiscal spending. Chart 11Additional Funds Could Help, A Lot
Additional Funds Could Help, A Lot
Additional Funds Could Help, A Lot
On June 11th, the Ministry of Finance made a policy announcement, relaxing financing restrictions on local government infrastructure spending. Local governments can now use proceeds from special-purpose bonds as capital to finance new spending on infrastructure projects.10 The new policy only applies to non-land development related infrastructure projects, which can make a maximum of 800 billion yuan available for infrastructure investment.11 As Chart 11 shows, if all of the additional 800 billion yuan is invested, a simple calculation suggests that it could lift infrastructure spending by as much as 4 percentage point before year end. The government is also preparing for another round of local government off-balance-sheet debt swaps. The plan, which is still being formulated by the authorities, is to allow financial institutions to either extend or swap maturing local government off-balance-sheet debt with bank loans that carry lower interest rates and longer maturities. There are strict criteria as to what debt qualifies to be swapped. But with an estimated 30-40 trillion yuan of local government implicit debt, the size of this program could potentially be comparable to that of 2015-2016.12 But if the Chinese government were to allow the program to morph into a meaningful stimulus effort, it would require concerted effort from the central bank to equip commercial banks with the required liquidity. This would mean a further loosening in monetary conditions. Bottom Line: There are “soft constraints” hindering China from broadening its scope of fiscal spending for the year. For investors to feel confident that the policy response will lead to a meaningful re-acceleration in economic activity, these constraints will have to be overcome. Investment Implications As we pointed out in our previous China Investment Strategy Weekly,13 even with June’s large number in bank lending and total local government bond issuance, the cumulative progress in credit growth for the first half of the year is still closer to 27% of nominal GDP (assuming 8% nominal GDP growth for the remainder of 2019). This still falls into our “half-strength” credit cycle scenario relative to past reflationary episodes (Chart 12A & 12B).
Chart 12
Chart 12
Our bias is that the Chinese leadership will only allow limited additional stimulus this year, and are likely to wait until the economy weakens further before removing all budgetary and regulatory constraints. This will put the economy and financial market on a “W-shaped” trajectory for the rest of 2019. Therefore we recommend an underweight position in Chinese stocks for the remainder of the year. Ultimately, though, policymakers will respond if the economy weakens meaningfully further. The odds are good that the economy will have weakened enough for the Chinese government to make a concerted effort to fuel its economy over the coming 6-12 months. Thus, an overweight on Chinese stocks over a cyclical horizon is warranted, but the journey to eventual outperformance will be a turbulent one. Jing Sima China Strategist JingS@bcaresearch.com Footnotes: 1 Please see China Investment Strategy Weekly Report, “Threading A Stimulus Needle (Part 1): A Reluctant PBoC”, dated July 10, 2019, available at cis.bcaresearch.com. 2 Please see China Investment Strategy Weekly Report, “Trade Is Not China’s Only Problem”, dated November 21, 2018, available at cis.bcaresearch.com. 3 In 2015, nominal GDP growth bottomed 5 months following a pickup in credit growth. 4 Please see Emerging Markets Strategy and China Investment Strategy Special Report, “The Chinese Auto Market: Moderate Recovery Ahead”, dated February 13, 2019, available at cis.bcaresearch.com. 5 Pledged supplementary lending (PSL) scheme refers to China’s central bank’s direct lending to the real estate market. 6 The People’s Bank of China (PBoC) released RMB 698 billion in 2015 and RMB 971 billion in 2016 in the form of PSL injections into the real estate market as part of its attempts to revive the property market. 7 Including both general and special-purpose bonds, but discounting bonds issued for debt-to-bond swap or refinancing purposes. 8 Ministry of Finance Mid-Year Budgetary Press Conference, July 15, 2019 9 The last time the Chinese government issued a mid-year budget revision was following the Tiananmen Square Massacre, the only year China had a classical business cycle. It did NOT revise the budget during the 2008-‘09 global financial crisis, though. 10 Special-purpose bonds must be used for projects that are proven to make certain returns on investment and are supposed to be repaid with returns from the specific projects they are invest in, rather than fiscal revenue. Previously, local governments were prohibited from using borrowed money as capital in infrastructure projects. http://www.mof.gov.cn/zhengwuxinxi/caizhengxinwen/201906/t20190610_3274511.htm 11 The non-land development portion accounts for about 30% of total special-purpose bonds. 12 Some estimates suggest about 3-4 trillion yuan of local government implicit debt is qualified for the new swap program. 13 Please see China Investment Strategy Weekly Report, “Threading A Stimulus Needle (Part 1): A Reluctant PBoC”, dated July 10, 2019, available at cis.bcaresearch.com. Cyclical Investment Stance Equity Sector Recommendations
Highlights Monetary Policy: The Fed’s message to markets is “lower for longer” until inflation expectations are re-anchored. But that guiding principle will manifest itself in only a 25 bps rate cut this month. Beyond that, we see a good chance that July’s 25 bps rate cut could be one and done. Stay short the February 2020 fed funds futures contract. TIPS: Stay overweight TIPS versus nominal Treasury securities. Our model shows that the 10-year TIPS breakeven inflation rate is 12 bps too low, and core inflation should gradually move higher in the second half of the year. Municipal Bonds: We downgrade our recommended allocation to municipal bonds from overweight to neutral, based on valuations that have become historically expensive. We continue to recommend an overweight allocation to 20-year and 30-year Aaa munis, where yields are more reasonable. Feature Chart 1Is “Lower For Longer” Working?
Is "Lower For Longer" Working?
Is "Lower For Longer" Working?
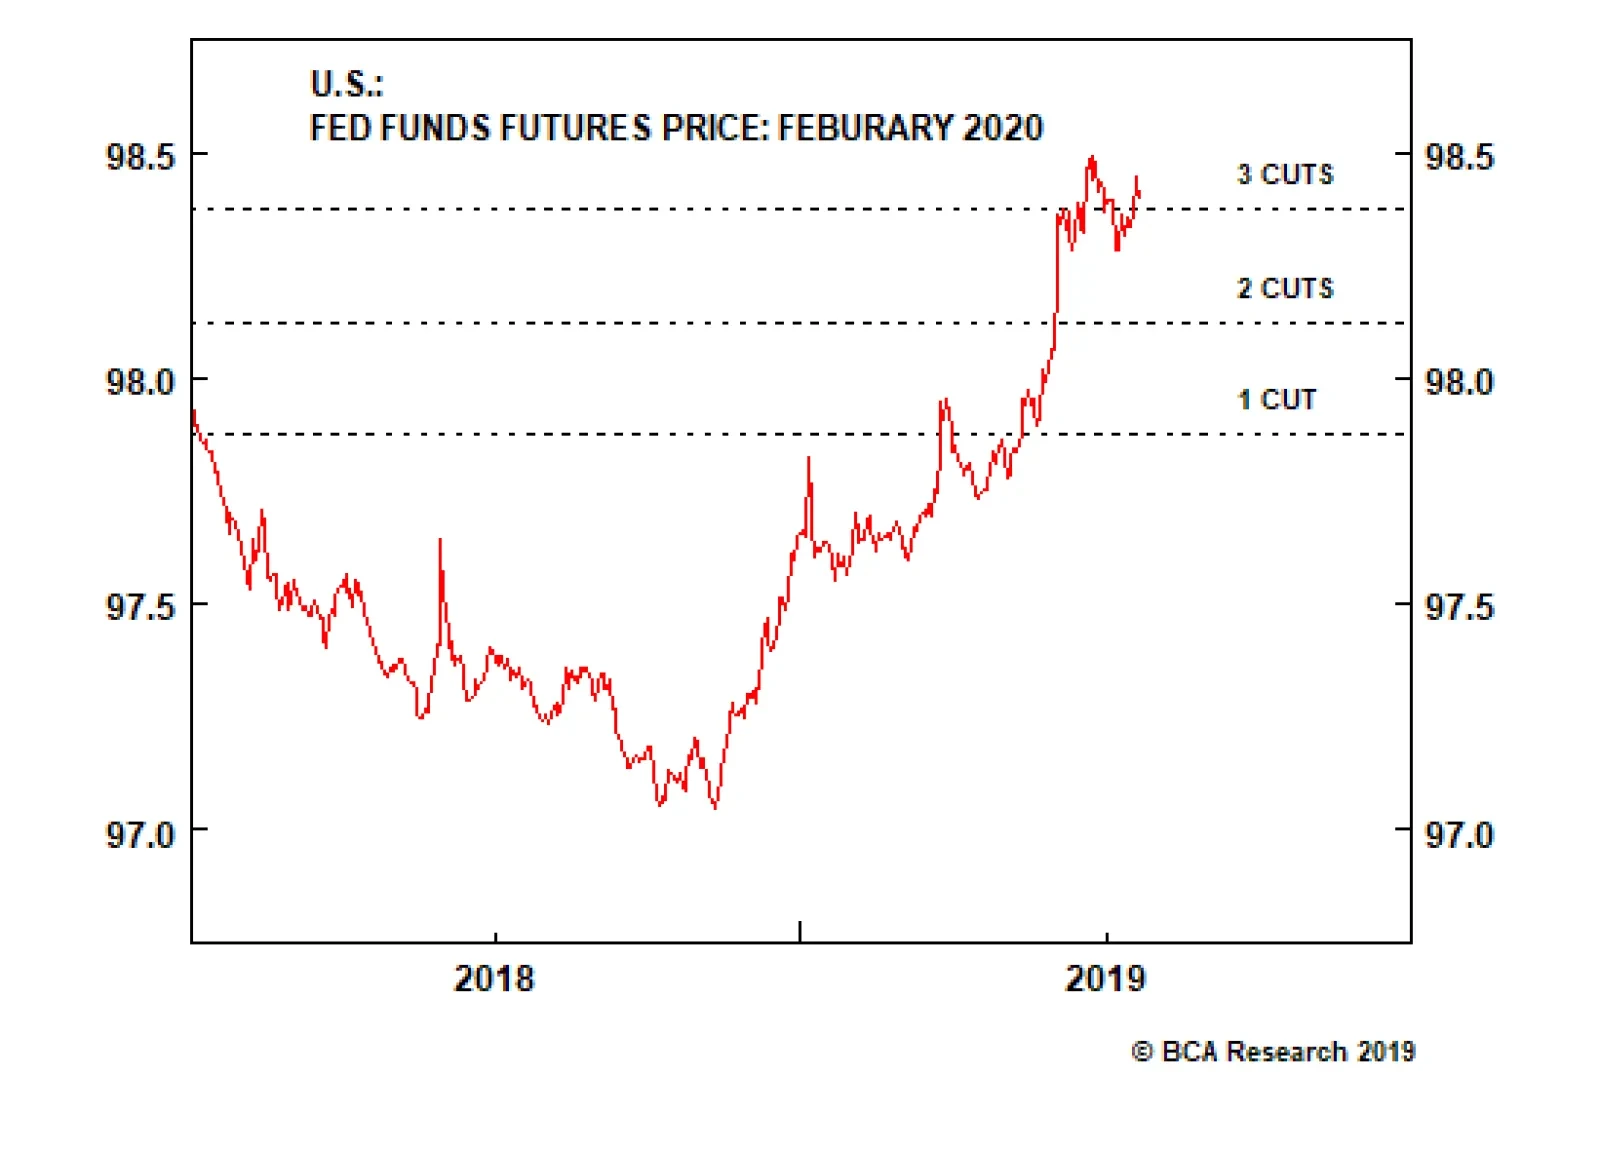
If nothing else, the Fed is definitely staying on message. That message being that monetary policy will remain accommodative until the “re-anchoring” of inflation expectations is complete. Case in point, from the June FOMC minutes:1 Many participants further noted that longer-term inflation expectations could be somewhat below levels consistent with the Committee’s 2 percent inflation objective, or that continued weakness in inflation could prompt expectations to slip further. These developments might make it more difficult to achieve their inflation objective on a sustained basis. And last week, from a speech delivered by New York Fed President John Williams:2 Investors are increasingly viewing these low inflation readings not as an aberration, but rather a new normal. This is evidenced by a broad-based decline in market-based measures of longer-run inflation expectations … According to Williams, the solution to the low inflation expectations problem is: First, take swift action when faced with adverse economic conditions. Second, keep interest rates lower for longer. And third, adapt monetary policy strategies to succeed in the context of low r-star and the ZLB (zero-lower bound). “Lower for longer” until inflation expectations are re-anchored. That’s the Fed’s message to markets and policymakers are going out of their way to deliver it aggressively – sometimes too aggressively (see Box on page 3). The upshot is that there is some indication it might be working. BOX July Rate Cut Will Be 25 bps, And Could Be One And Done Chart B1Short The February 2020 Fed Funds Futures Contract
Short The February 2020 Fed Funds Futures Contract
Short The February 2020 Fed Funds Futures Contract
An interesting series of events unfolded last Thursday when New York Fed President John Williams delivered a speech titled “Living Life Near the ZLB”. The speech focused on how, when interest rates are close to the zero bound, the Fed should “act quickly to lower rates at the first sign of economic distress”. Investors interpreted this dovish speech as a signal that the Fed might be gearing up for a 50 bps rate cut this month, and prices of interest rate futures rose sharply. But within a couple hours, the New York Fed released a statement saying that Williams’ comments were made in the context of an academic speech, and had nothing to do with upcoming policy actions. The New York Fed’s clarification almost certainly means that the Fed intends to cut rates by only 25 bps in July. In fact, based on the June Summary of Economic Projections where 9 out of 17 participants saw no need for rate cuts this year and nobody called for more than 50 bps of cuts in 2019, it seems unlikely that the board could achieve consensus on more than a 25 bps cut this month. Beyond this month, if global growth improves in the second half of this year as we expect, we see high odds that the Fed might only deliver a single 25 bps rate cut in July. With that in mind we continue to recommend a short position in the February 2020 fed funds futures contract (Chart B1). That position will earn 52 bps in the event of only one rate cut over the next five FOMC meetings, 26 bps in the event of two rate cuts, and 1 bp in the event of three rate cuts. Chart 1 on page 1 shows that the 10-year Treasury yield’s recent jump was driven entirely by the compensation for inflation protection. The 10-year real yield, meanwhile, is barely off its lows. The divergence makes perfect sense. A recent spate of stronger-than-expected inflation data has lifted inflation expectations, but the Fed is signaling that it will not respond by running a tighter monetary policy. That dovish forward guidance is capping the upside in real yields. If recent history repeats itself, core PCE should gradually move higher, eventually re-converging with the trimmed mean. In this week’s report we consider the outlooks for inflation and TIPS over the remainder of the year. Inflation: Modest Upside In H2 2019 As noted above, core inflation has rebounded from the extremely low readings seen earlier in the year. In fact, month-over-month core PCE came in above the Fed’s 2% target in both April and May (Chart 2). We also continue to observe a wide divergence between year-over-year core and trimmed mean PCE measures (Chart 2, top panel). If recent history repeats itself, core PCE should gradually move higher, eventually re-converging with the trimmed mean. While we only have PCE inflation data up to May, the June core CPI print was also strong (Chart 2, bottom panel). However, a closer look reveals that the bulk of June’s increase was driven by the core good component (Chart 3). We should not expect core goods to be a major driver of U.S. inflation going forward. Imports make up a large portion of consumer goods, and import prices tend to lead fluctuations in the core goods CPI. Despite the federal government’s push toward protectionism, import prices are currently contracting. This means that any strength in the core goods CPI will be transitory. Chart 2A Rebound In Core Inflation
A Rebound In Core Inflation
A Rebound In Core Inflation
Chart 3Core CPI Components
Core CPI Components
Core CPI Components
Chart 4Shelter CPI Still Has Upside
Shelter CPI Still Has Upside
Shelter CPI Still Has Upside
On the flipside, shelter – the largest component of core CPI – also increased in June (Chart 3, top panel), and we expect further acceleration in the second half of the year. The apartment rental vacancy rate is the main driver of shelter inflation, and it remains at a very low level despite the fact that a lot of multi-family units have been built during the past few years (Chart 4). The depressed vacancy rate suggests that the rental market is still not oversupplied, a message confirmed by the most recent reading from the National Multifamily Housing Council’s Apartment Market Tightness index (Chart 4, panel 2). This index has been above 50 for the past two months. Readings above 50 usually coincide with a falling vacancy rate. Overall, we conclude that core inflation will rise modestly in the second half of the year and that core PCE will eventually re-converge with the trimmed mean. Stronger inflation will be driven by the shelter and core services components. Any near-term strength in core goods inflation should be faded. Stay Overweight TIPS Versus Nominals We noted above that 10-year nominal yield’s recent jump was driven by the cost of inflation protection, rather than the real component. We can gain a broader perspective on the breakdown between the real and inflation components of Treasury yields by looking at the TIPS beta (Chart 5). The 10-year TIPS beta is calculated by regressing monthly changes in the 10-year TIPS yield on monthly changes in the 10-year nominal yield. It has been close to 0.6 for the past few years, meaning that a 1% move in the 10-year nominal yield can be roughly split between a 60 bps move in the real yield and a 40 bps move in the cost of inflation protection. The 10-year TIPS beta has been close to 0.6 for the past few years, meaning that a 1% move in the 10-year nominal yield can be roughly split between a 60 bps move in the real yield and a 40 bps move in the cost of inflation protection. We expect the TIPS beta to remain at or below current levels for the next few months. The TIPS beta tends to be low when long-maturity TIPS breakeven inflation rates are well below target. This is because the Fed will usually deploy dovish forward guidance during these periods in an attempt to goose inflation. Dovish Fed guidance makes the market less likely to price-in future monetary tightening in response to better economic data. This means that a greater proportion of the change in nominal yields will be driven by inflation expectations. Eventually, once long-maturity TIPS breakeven inflation rates move back into a “well-anchored” range between 2.3% and 2.5% (Chart 5, bottom two panels), the Fed will turn increasingly hawkish and the TIPS beta will rise. It will be some time before the 10-year TIPS breakeven inflation rate returns to its 2.3% - 2.5% range. However, our Adaptive Expectations model suggests that the rate will move higher during the next few months (Chart 6).3 Our model considers the 10-year TIPS breakeven inflation rate relative to the trailing 10-year rate of change in core CPI, the trailing 12-month rate of change in headline CPI and the New York Fed’s Underlying Inflation Gauge, with the trailing 10-year rate of change in core CPI being the most important variable. At present, our model pegs fair value for the 10-year breakeven at 1.93%, 12 bps above the current level. Chart 5Fed Guidance Keeps TIPS Beta Low
Fed Guidance Keeps TIPS Beta Low
Fed Guidance Keeps TIPS Beta Low
Chart 6Adaptive Expectations Model
Adaptive Expectations Model
Adaptive Expectations Model
Chart 7Inflation & Commodities
Inflation & Commodities
Inflation & Commodities
Further, every monthly core CPI print that comes in above 1.83% - the current trailing 10-year rate of change – puts slight upward pressure on our model’s fair value reading. In light of current inflation trends, further upside in the 10-year breakeven rate seems likely in the second half of the year. Finally, the 10-year TIPS breakeven inflation rate has also taken cues from oil and commodity markets in recent years (Chart 7). Our preferred broad commodity index – the CRB Raw Industrials index – remains in a tailspin, but should recover in the second half of the year alongside global growth (see section titled “Monitoring The Manufacturing Recession” below). As for oil, our commodity strategists also see upside in the second half of the year, and hold a $70/bbl price target for Brent crude.4 Bottom Line: Stay overweight TIPS versus nominal Treasury securities. Our model shows that the 10-year TIPS breakeven inflation rate is 12 bps too low, and core inflation should gradually move higher in the second half of the year. Cut Municipal Bonds To Neutral Municipal / Treasury yield ratios have tightened dramatically during the past few weeks, and municipal debt now looks quite expensive. 2-year, 5-year and 10-year Aaa-rated Municipal / Treasury yield ratios are all more than one standard deviation below average pre-crisis levels (Chart 8). Only 20-year and 30-year Aaa munis still look cheap, with yield ratios above average pre-crisis levels (Chart 8, bottom two panels). 2-year, 5-year and 10-year Aaa-rated Municipal / Treasury yield ratios are all more than one standard deviation below average pre-crisis levels. Municipal debt looks even more expensive relative to corporate credit. Chart 9 shows the average yield from the Bloomberg Barclays Investment Grade Corporate index and the yield of a Aaa muni bond with the same duration. The Muni / Corporate yield ratio is extremely stretched, and is actually close to levels that have preceded periods of strong corporate bond performance in the past. Chart 8Munis Look Expensive
Munis Look Expensive
Munis Look Expensive
Chart 9Favor Corporate Credit Over Municipals
Favor Corporate Credit Over Municipals
Favor Corporate Credit Over Municipals
Bottom Line: We downgrade our recommended allocation to municipal bonds from overweight to neutral, based on valuations that have become historically expensive. We continue to recommend an overweight allocation to 20-year and 30-year Aaa munis, where yields are more reasonable. We may be seeing the first signs that manufacturing is rebounding as we head into the third quarter. We prefer corporate credit over municipals in this environment, and note that corporate bonds tend to perform well when they are as attractively valued relative to munis as they are now. Monitoring The Manufacturing Recession Chart 10Early Signs Of A Manufacturing Rebound?
Early Signs Of A RebouNd In Manufacturing?
Early Signs Of A RebouNd In Manufacturing?
Much like in 2015/16, the ongoing global growth slowdown has taken its toll on the U.S. manufacturing sector. In fact, the National ISM Manufacturing PMI fell to 51.7 in June, from a 2018 peak of 60.7. We’ve noted in prior research that, as was the case in 2016, the global manufacturing data will likely rebound now that the Fed has adopted a more dovish policy stance and China has stepped up its rate of credit growth.5 In fact, as the Regional Fed Manufacturing PMIs have come in during the past two weeks, we may be seeing the first signs that manufacturing is rebounding as we head into the third quarter (Chart 10). The New York Fed’s PMI, released July 15, rose from -8.6 to 4.3, and three days later the Philadelphia Fed’s PMI jumped from 0.3 to 21.8. Release dates for the remaining four regional Fed surveys are shown in parentheses in Chart 10, and we will be monitoring these releases closely to see if the tentative rebound observed in the New York and Philadelphia manufacturing surveys is confirmed. Stay tuned. Ryan Swift, U.S. Bond Strategist rswift@bcaresearch.com 1 https://www.federalreserve.gov/monetarypolicy/files/fomcminutes20190619.pdf 2 https://www.newyorkfed.org/newsevents/speeches/2019/wil190718 3 For more details on our Adaptive Expectations Model please see U.S. Bond Strategy Weekly Report, “Adaptive Expectations In The TIPS Market”, dated November 20, 2018, available at usbs.bcaresearch.com 4 Please see Commodity & Energy Strategy Weekly Report, “Weak 1H19 Oil Demand Data Fuels Market Uncertainty”, dated July 18, 2019, available at ces.bcaresearch.com 5 Please see U.S. Bond Strategy Weekly Report, “The Fed’s Got Your Back”, dated June 25, 2019, available at usbs.bcaresearch.com Fixed Income Sector Performance Recommended Portfolio Specification
BCA takes pride in its independence. Strategists publish what they really believe, informed by their framework and analysis. Occasionally, this independence results in strongly diverging views and we currently are in one of those times. Within BCA, two views on the cyclical (six to 12-months) outlook for assets have emerged. One camp expects global growth to rebound in the second half of the year. Along with accelerating growth, they anticipate stock prices and risk assets to remain firm, cyclical equities to outperform defensive ones, safe-haven yields to move up, and the dollar to weaken. Meanwhile, another group foresees a further deterioration in activity or a delayed recovery, additional downside in stocks and risk assets, outperformance of defensives relative to cyclicals, low safe-haven yields, and a generally stronger dollar. For the sake of transparency, we have asked representatives of each camp to make their case in a round-table discussion, allowing our clients to decide for themselves which view is more appealing to them. Global Investment Strategy’s Peter Berezin, U.S. Investment Strategy’s Doug Peta, and Global Fixed Income Strategy’s Rob Robis take the mantle for the bullish camp. U.S. Equity Strategy’s Anastasios Avgeriou, Emerging Market Strategy’s Arthur Budaghyan, and European Investment Strategy’s Dhaval Joshi represent the bearish group.1 The round-table discussion below focuses on the cyclical outlook. For longer investment horizons, most strategists agree that a recession is highly likely by 2022. Moreover, on a long-term basis, valuations in both risk assets and safe-haven bonds are very demanding. In this context, a significant back up in yields could hammer risk assets. The BCA Round Table Mathieu Savary: Yield curve inversions have often been harbingers of recessions. Anastasios, you are amongst those investors troubled by this inversion. Do you not worry that this episode might prove similar to 1998, when the curve only inverted temporarily and did not foreshadow a recession? Moreover, how do you account for the highly variable time lags between the inversion of the yield curve and the occurrence of a recession? Anastasios Avgeriou: The yield curve inverts at or near the peak of the business cycle and it eventually forewarns of upcoming recessions. This past December, parts of the yield curve inverted and now, BCA’s U.S. Equity Strategy service is heeding the signal from this simple indicator, especially given that the SPX has subsequently made all-time highs as our research predicted.2 Chart 1 (ANASTASIOS)The 1998 Episode Revisited
The 1998 Episode Revisited
The 1998 Episode Revisited
The yield curve inversion forecasts a Fed rate cut, and it has never been wrong on that front. It served well investors that heeded the message in June of 1998 as the market soon thereafter fell 20% in a heartbeat. If investors got out at the 1998 peak near 1200 and forwent about 350 points of gains until the March 2000 SPX cycle peak, they still benefited if they held tight as the market ultimately troughed near 777 in October 2002 (Chart 1). With regard to timing the previous seven recessions using the yield curve, if we accept that mid-1998 is the starting point of the inversion, it took 33 months before the recession commenced. Last cycle, the recession began 24 months after the inversion. Consequently, December 2020 is the earliest possible onset of recession and September 2021, the latest. Our forecast calls for SPX EPS to fall 20% in 2021 to $140 with the multiple dropping between 13.5x and 16.5x for an SPX end-2020 target range of 1,890-2,310.3 In other words we are not willing to play a 100-200 point advance for a potential 1,000 point drawdown. The risk/reward tradeoff is to the downside, and we choose to sit this one out. Mathieu: Rob, you take a much more sanguine view of the current curve inversion. Why? Rob Robis: While the four most dangerous words in investing are “this time is different,” this time really does appear to be different. Never before have negative term premia on longer-term Treasury yields and a curve inversion coexisted (Chart 2). Longer-term Treasury yields have therefore been pushed down to extremely low levels by factors beyond just expectations of a lower fed funds rate. The negative Treasury term premium is distorting the economic message of the U.S. yield curve inversion. Chart 2 (ROB)Negative Term Premium Distorting The Economic Message Of An Inverted Yield Curve
Negative Term Premium Distorting The Economic Message Of An Inverted Yield Curve
Negative Term Premium Distorting The Economic Message Of An Inverted Yield Curve
Term premia are depressed everywhere, as seen in German, Japanese and other yields, reflecting the intense demand for safe assets like government bonds during a period of heightened uncertainty. Global bond markets may also be discounting a higher probability of the ECB restarting its Asset Purchase Program, as term premia typically fall sharply when central banks embark on quantitative easing. This has global spillovers. Prior to previous recessions, U.S. Treasury curve inversions occurred when the Fed was running an unequivocally tight monetary policy. That is not the case today. The real fed funds rate still is not above the Fed’s estimate of the neutral real rate, a.k.a. “r-star,” which was the necessary ingredient for all previous Treasury curve inversions since 1960 (Chart 3). Chart 3 (ROB)Fed Policy Is Not Tight Enough For Sustained Curve Inversion
Fed Policy Is Not Tight Enough For Sustained Curve Inversion
Fed Policy Is Not Tight Enough For Sustained Curve Inversion
Mathieu: The level of policy accommodation will most likely determine whether Anastasios or Rob is proven right. Peter, you have been steadfastly arguing that policy, in the U.S. at least, remains easy. Can you elaborate why? Peter Berezin: Remember that the neutral rate of interest is the rate that equalizes the level of aggregate demand with the economy’s supply-side potential. Loose fiscal policy and fading deleveraging headwinds are boosting demand in the United States. So is rising wage growth, especially at the bottom of the income distribution. Given that the U.S. does not currently suffer from any major imbalances, I believe that the economy can tolerate higher rates without significant ill-effects. In other words, monetary policy is currently quite easy. Of course, we cannot observe the neutral rate directly. Like a black hole, one can only detect it based on the effect that it has on its surroundings. Housing is by far the most interest rate-sensitive sector of the economy. If history is any guide, the recent decline in mortgage rates will boost housing activity in the remainder of the year (Chart 4). If that relationship breaks down, as it did during the Great Recession, it would suggest that the neutral rate is quite low. Chart 4 (PETER)Declining Mortgage Rates Bode Well For Housing
Declining Mortgage Rates Bode Well For Housing
Declining Mortgage Rates Bode Well For Housing
Given that mortgage underwriting standards have been quite strong and the homeowner vacancy is presently very low, our guess is that housing will hold up well. We should know better in the next few months. Mathieu: Dhaval, you do not agree. Why do you think global rates are not accommodative? Dhaval Joshi: Actually, I think that global rates are accommodative, but that the global bond yield can rise by just 70 bps before conditions become perilously un-accommodative. Here’s where I disagree with Peter: for me, the danger doesn’t come from economics, it comes from the mathematics of ultra-low bond yields. The unprecedented and experimental panacea of our era has been ‘universal QE’ – which has led to ultra-low bond yields everywhere. But what is not understood is that when bond yields reach and remain close to their lower bound, weird things happen to the financial markets.
Chart 5
I refer you to other reports for the details, but in a nutshell, the proximity of the lower bound to yields increases the risk of owning supposedly ‘safe’ bonds to the risk of owning so-called ‘risk-assets’. The result is that the valuation of risk-assets rises exponentially (Chart 5). Because when the riskiness of the asset-classes converges, investors price risk-assets to deliver the same ultra-low nominal return as bonds.4 Comparisons with previous economic cycles miss the current danger. The post-2000 policy easing distorted the global economy by engineering a credit boom – so the subsequent danger emanated from the most credit-sensitive sectors in the economy such as mortgage lending. In contrast, the post-2008 ‘universal QE’ has severely distorted the valuation relationship between bonds and global risk-assets – so this is where the current danger lies. Higher bond yields can suddenly undermine the valuation support of global risk-assets whose $400 trillion worth dwarfs the global economy by five to one. Where is this tipping point? It is when the global 10-year yield – defined as the average of the U.S., euro area,5 and China – approaches 2.5%. Through the past five years, the inability of this yield to remain above 2.5% confirms the hyper-sensitivity of financial conditions to this tipping point (Chart 6). Right now, I agree that bond yields are accommodative. But the scope for yields to move higher is quite limited. Chart 6 (DHAVAL)Since 2015, the Global Long Bond Yield Has Struggled To Surpass 2.5 Percent
Since 2015, the Global Long Bond Yield Has Struggled To Surpass 2.5 Percent
Since 2015, the Global Long Bond Yield Has Struggled To Surpass 2.5 Percent
Mathieu: Monetary policy is important to the outlook, but so is the global manufacturing cycle. The global growth slowdown has been concentrated in the manufacturing sector, tradeable goods in particular. Across advanced economies, the service and consumer sectors have been surprisingly resilient, but this will not last if the industrial sector decelerates further. Arthur, you still do not anticipate any major improvement in global trade and industrial production. Can you elaborate why? Chart 7 (ARTHUR)Global Trade Is Down Due To China Not U.S.
Global Trade Is Down Due To China Not U.S.
Global Trade Is Down Due To China Not U.S.
Arthur Budaghyan: To properly assess the economic outlook, one needs to understand what has caused the ongoing global trade/manufacturing downturn. One thing we know for certain: It originated in China, not the U.S. Chart 7 illustrates that Korean, Japanese, Taiwanese and Singaporean exports to China have been shrinking at an annual rate of 10%, while their shipments to the U.S. have been growing. China’s aggregate imports have also been contracting. This entails that from the perspective of the rest of the world, China has been and remains in recession. U.S. manufacturing is the least exposed to China, which is the main reason why it has been the last shoe to drop. Hence, the U.S. has lagged in this downturn, and one should not be looking to the U.S. for clues about a potential global recovery. We need to gauge what will turn Chinese demand around. In this regard, the rising credit and fiscal spending impulse is positive, but it has so far failed to kick start a recovery (Chart 8). The key reason has been a declining marginal propensity to spend among households and companies. Notably, the marginal propensity to spend of mainland companies leads industrial metals prices by a few months, and it currently continues to point south (Chart 8, bottom panel). The lack of willingness among Chinese consumers and enterprises to spend is due to several factors: (1) the U.S.-China confrontation; (2) high levels of indebtedness among both enterprises and households (Chart 9); (3) ongoing regulatory scrutiny over banks and shadow banking as well as local government debt; and (4) a lack of outright government subsidies for purchases of autos and housing. Chart 8 (ARTHUR)Stimulus Versus Marginal Propensity To Spend
Stimulus Versus Marginal Propensity To Spend
Stimulus Versus Marginal Propensity To Spend
Chart 9 (ARTHUR)Chinese Households Are More Leveraged Than U.S. Ones
Chinese Households Are Leveraged Than U.S. Ones
Chinese Households Are Leveraged Than U.S. Ones
On the whole, the falling marginal propensity to spend will all but ensure that any recovery in mainland household and corporate spending is delayed. Mathieu: Meanwhile, Peter, you have a much more optimistic stance. Why do you differ so profoundly with Arthur’s view? Peter: China’s deleveraging campaign began more than a year before global manufacturing peaked. I have no doubt that slower Chinese credit growth weighed on global capex, but we should not lose sight of the fact there are natural ebbs and flows at work. Most manufactured goods retain some value for a while after they are purchased. If spending on, say, consumer durable goods or business equipment rises to a high level for an extended period, a glut will form, requiring a period of lower production. Chart 10 (PETER)The Global Manufacturing Cycle Has Likely Reached A Bottom
The Global Manufacturing Cycle Has Likely Reached A Bottom
The Global Manufacturing Cycle Has Likely Reached A Bottom
These demand cycles typically last about three years; roughly 18 months on the way up, 18 months on the way down (Chart 10). The last downleg in the global manufacturing cycle began in early 2018, so if history is any guide, we are nearing a trough. The fact that U.S. manufacturing output rose in both May and June, followed by this week’s sharp rebound in the July Philly Fed Manufacturing survey, supports this view. Of course, extraneous forces could complicate matters. If trade tensions ratchet higher, this would weaken my bullish thesis. Nevertheless, with China stimulating its economy again, it would probably take a severe trade war to push the global economy into recession. Mathieu: Dhaval, you are not as negative as Arthur, but nonetheless expect a slowdown in the second half of the year. What is your rationale? Dhaval: To be clear, I am not forecasting a recession or major downturn – unless, as per my previous answer, the global 10-year bond yield approaches 2.5% and triggers a severe dislocation in global risk-assets. In fact, many people get the relationship between recession and financial market dislocation back-to-front: they think that the recession causes the financial market dislocation when, in most cases, the financial market dislocation causes the recession! Nevertheless, I do believe that European and global growth is entering a regular down-oscillation based on the following compelling evidence: From a low last summer, quarter-on-quarter GDP growth rates in the developed economies have already rebounded to the upper end of multi-year ranges. Short-term credit impulses in Europe, the U.S., and China are entering down-oscillations (Chart 11). The best current activity indicators, specifically the ZEW economic sentiment indicators, have rolled over. The outperformance of industrials – the equity sector most exposed to global growth – has also rolled over. Why expect a down-oscillation? Because it is the rate of decline in the bond yield that drove the rebound in growth after its low last summer. Furthermore, it is impossible for the rate of decline in the bond yield to keep increasing, or even stay where it is. Counterintuitively, if bond yields decline, but at a reduced pace, the effect is to slow economic growth. Mathieu: A positive and a negative view of the world logically result in bifurcated outlooks for interest rates and the dollar. Rob, how do you see U.S., German, and Japanese yields evolving over the coming 12 months? Rob: If global growth rebounds, U.S. Treasury yields will have far more upside than Bund or JGB yields. Inflation expectations should recover faster in the U.S., with the Fed taking inflationary risks by cutting rates with a 3.7% unemployment rate and core CPI inflation at 2.1%. The Fed is also likely to disappoint by delivering fewer rate cuts than are currently discounted by markets (90bps over the next 12 months). Treasury yields can therefore increase more than German and Japanese yields, with the ECB and BoJ more likely to deliver the modest rate cuts currently discounted in their yield curves (Chart 12). Chart 11 (DHAVAL)Short-Term Impulses Rebounded... But Are Now Rolling Over
Short-Term Impulses Rebounded... But Are Now Rolling Over
Short-Term Impulses Rebounded... But Are Now Rolling Over
Chart 12 (ROB)U.S. Treasuries Will Underperform Bunds & JGBs
U.S. Treasuries Will Underperform Bunds & JGBs
U.S. Treasuries Will Underperform Bunds & JGBs
Japanese yields will remain mired at or below zero over the next 6-12 months, as wage growth and core inflation remain too anemic for the BoJ to alter its 0% target on 10-year JGB yields. German yields have a bit more potential to rise if European growth begins to recover, but will lag any move higher in Treasury yields. That means that the Treasury-Bund and Treasury-JGB spreads will move higher over the next year. Negative German and Japanese yields may look completely unappetizing compared to +2% U.S. Treasury yields, but this handicap vanishes when all three yields are expressed in U.S. dollar terms. Hedging a 10-year German Bund or JGB into higher-yielding U.S. dollars creates yields that are 50-60bps higher than a 10-year U.S. Treasury. It is abundantly clear that German and Japanese bonds will outperform Treasuries over the next year if global growth recovers. Mathieu: Peter, your positive view on global growth means that the Fed will cut rates less than what is currently priced into the OIS curve. So why do you expect the dollar to weaken in the second half of 2019? Peter: What the Fed does affects interest rate differentials, but just as important is what other central banks do. The ECB is not going to raise rates over the next 12 months. However, if euro area growth surprises on the upside later this year, investors will begin to question the need for the ECB to keep policy rates in negative territory until mid-2024. The market’s expectation of where policy rates will be five years out tends to correlate well with today’s exchange rate. By that measure, there is scope for interest rate differentials to narrow against the U.S. dollar (Chart 13). Chart 13A (PETER)Interest Rate Expectations Against The U.S. Should Narrow (I)
Interest Rate Expectations Against The U.S. Should Narrow (I)
Interest Rate Expectations Against The U.S. Should Narrow (I)
Chart 13B (PETER)Interest Rate Expectations Against The U.S. Should Narrow (II)
Interest Rate Expectations Against The U.S. Should Narrow (II)
Interest Rate Expectations Against The U.S. Should Narrow (II)
Keep in mind that the U.S. dollar is a countercyclical currency, meaning that it moves in the opposite direction of global growth (Chart 14). This countercyclicality stems from the fact that the U.S. economy is more geared towards services than manufacturing compared with the rest of the world. Chart 14 (PETER)The Dollar Is A Countercyclical Currency
The Dollar Is A Countercyclical Currency
The Dollar Is A Countercyclical Currency
As such, when global growth accelerates, capital tends to flow from the U.S. to the rest of the world, translating into more demand for foreign currency and less demand for dollars. If global growth picks up in the remainder of the year, as I expect, the dollar will weaken. Mathieu: Arthur, as you are significantly more negative on growth than either Rob or Peter, how do you see the dollar and global yields evolving over the coming six to 12 months? Arthur: I am positive on the trade-weighted U.S. dollar for the following reasons: The U.S. dollar is a countercyclical currency – it exhibits a negative correlation with the global business cycle. Persistent weakness in the global economy emanating from China/EM is positive for the dollar because the U.S. economy is the major economic block least exposed to a China/EM slowdown. Meanwhile, the greenback is only loosely correlated with U.S. interest rates. Thereby, the argument that lower U.S. rates will drive the value of the U.S. currency much lower is overemphasized. The Federal Reserve will cut rates by more than what is currently priced into the market only in a scenario of a complete collapse in global growth. Yet this scenario would be dollar bullish. In this case, the dollar’s strong inverse relationship with global growth will outweigh its weak positive relationship with interest rates. Contrary to consensus views, the U.S. dollar is not very expensive. According to unit labor costs based on the real effective exchange rate – the best currency valuation measure – the greenback is only one standard deviation above its fair value. Often, financial markets tend to overshoot to 1.5 or 2 standard deviations below or above their historical mean before reversing their trend. One of the oft-cited headwinds facing the dollar is positioning, yet there is a major discrepancy between positioning in DM and EM currencies versus the U.S. dollar. In aggregate, investors – asset managers and leveraged funds – have neutral exposure to DM currencies, but they are very long liquid EM exchange rates such as the BRL, MXN, ZAR and RUB versus the greenback. The dollar strength will occur mostly versus EM and commodities currencies. In other words, the euro, other European currencies and the yen will outperform EM exchange rates. I have less conviction on global bond yields. While global growth will disappoint, yields have already fallen a lot and the U.S. economy is currently not weak enough to justify around 90 basis points of rate cuts over the next 12 months. Mathieu: Before we move on to investment recommendations, Anastasios, you have done a lot of interesting work on the outlook for U.S. profits. What is the message of your analysis? Chart 15 (ANASTASIOS)Gravitational Pull
Gravitational Pull
Gravitational Pull
Anastasios: While markets cheered the trade truce following the recent G-20 meeting, no tariff rollback was agreed. Since the tariff rate on $200bn of Chinese imports went up from 10% to 25% on May 10, odds are high that manufacturing will remain in the doldrums. This will likely continue to weigh on profits for the remainder of the year. Profit growth should weaken further in the coming six months. Periods of falling manufacturing PMIs result in larger negative earnings growth surprises as market forecasters rarely anticipate the full breadth and depth of slowdowns. Absent profit growth, equity markets lack the necessary ‘oxygen’ for a durable high-quality rally. Until global growth momentum turns, investors should fade rallies. Our four-factor SPX EPS growth model is flirting with the contraction zone. In addition, our corporate pricing power proxy and Goldman Sachs’ Current Activity Indicator both send a distress signal for SPX profits (Chart 15). Already, more than half of the S&P 500 GICS1 sectors’ profits are estimated to have contracted in Q2, and three sectors could see declining revenues on a year-over-year basis, according to I/B/E/S data. Q3 depicts an equally grim profit picture that will also spill over to Q4. Adding it all up, profits will underwhelm into year-end. Mathieu: Doug, you do not share Anastasios’s anxiety. What offsets do you foresee? Moreover, you are not concerned by the U.S. corporate balance sheets. Can you share why? Doug Peta: As it relates to earnings, we foresee offsets from a revival in the rest of the world. Increasingly accommodative global monetary policy and reviving Chinese growth will give global ex-U.S. economies a boost. That inflection may go largely unnoticed in U.S. GDP, but it will help the S&P 500, as U.S.-based multinationals’ earnings benefit from increased overseas demand and a weaker dollar. When it comes to corporate balance sheets, shifting some of the funding burden to debt from equity when interest rates are at generational lows is a no-brainer. Even so, non-financial corporates have not added all that much leverage (Chart 16). Low interest rates, wide profit margins and conservative capex have left them with ample free cash flow to service their obligations (Chart 17). Chart 16 (DOUG)Corporations Have Not Added Much Leverage ...
Corporations Have Not Added Much Leverage ...
Corporations Have Not Added Much Leverage ...
Chart 17 (DOUG)...Though They Have Ample Cash Flow To Service It
...Though They Have Ample Cash Flow To Service It
...Though They Have Ample Cash Flow To Service It
Every single viable corporate entity with an effective federal tax rate above 21% became a better credit when the top marginal rate was cut from 35% to 21%. Every such corporation now has more net income with which to service debt, and will have that income unless the tax code is revised. You can’t see it in EBITDA multiples, but it will show up in reduced defaults. Mathieu: The last, and most important question. What are each of your main investment recommendations to capitalize on the economic trends you anticipate over the coming 6-12 months? Let’s start with the pessimists: Arthur: First, the rally in global cyclicals and China plays since December has been premature and is at risk of unwinding as global growth and cyclical profits disappoint. Historical evidence suggests that global share prices have not led but have actually been coincident with the global manufacturing PMI (Chart 18). The recent divergence is unprecedented. Chart 18 (ARTHUR)Global Stocks Historically Did Not Lead PMIs
Global Stocks Historically Did Not Lead PMIs
Global Stocks Historically Did Not Lead PMIs
Second, EM risk assets and currencies remain vulnerable. EM and Chinese earnings per share are shrinking. The leading indicators signal that the rate of contraction will deepen, at least the end of this year (Chart 19). Asset allocators should continue underweighting EM versus DM equities. Finally, my strongest-conviction, market-neutral trade is to short EM or Chinese banks and go long U.S. banks. The latter are much healthier than EM/Chinese ones, as we discussed in our recent report.6 Anastasios: The U.S. Equity Strategy team is shifting away from a cyclical and toward a more defensive portfolio bent. Our highest conviction view is to overweight mega caps versus small caps. Small caps are saddled with debt and are suffering a margin squeeze. Moreover, approximately 600 constituents of the Russell 2000 have no forward profits. Only one S&P 500 company has negative forward EPS. Given that both the S&P and the Russell omit these figures from the forward P/E calculation, this is masking the small cap expensiveness. When adjusted for this discrepancy, small caps are trading at a hefty premium versus large caps (Chart 20). Chart 19 (ARTHUR)China And EM Profits Are Contracting
China And EM Profits Are Contracting
China And EM Profits Are Contracting
Chart 20 (ANASTASIOS)Continue To Avoid Small Caps
Continue To Avoid Small Caps
Continue To Avoid Small Caps
We have also upgraded the S&P managed health care and the S&P hypermarkets groups. If the economic slowdown persists into early 2020, both of these defensive subgroups will fare well. In mid-April, we lifted the S&P managed health care group to an above benchmark allocation and posited that the selloff in this group was overdone as the odds of “Medicare For All” becoming law were slim. Moreover, a tight labor market along with melting medical cost inflation would boost the industry’s margins and profits (Chart 21). This week, we upgraded the defensive S&P hypermarkets index to overweight arguing that the souring macro landscape coupled with a firming industry demand outlook will support relative share prices (Chart 22). Chart 21 (ANASTASIOS)Buy Hypermarkets
Buy Hypermarkets
Buy Hypermarkets
Chart 22 (ANASTASIOS)Stick With Managed Health Care
Stick With Managed Health Care
Stick With Managed Health Care
Dhaval: To be fair, I am not a pessimist. Provided the global bond yield stays well below 2.5 percent, the support to risk-asset valuations will prevent a major dislocation. But in a growth down-oscillation, the big game in town will be sector rotation into pro-defensive investment plays, especially into those defensives that have underperformed (Chart 23). Chart 23 (DHAVAL)Switch Out Of Growth-Sensitives Into Healthcare
Switch Out Of Growth-Sensitives Into Healthcare
Switch Out Of Growth-Sensitives Into Healthcare
On this basis: Overweight Healthcare versus Industrials. Overweight the Eurostoxx 50 versus the Shanghai Composite and the Nikkei 225. Overweight U.S. T-bonds versus German bunds. Overweight the JPY in a portfolio of G10 currencies. Mathieu: And now, the optimists: Doug: So What? is the overriding question that guides all of BCA’s research: What is the practical investment application of this macro observation? But Why Now? is a critical corollary for anyone allocating investment capital: Why is the imbalance you’ve observed about to become a problem? As Herbert Stein said, “If something cannot go on forever, it will stop.” Imbalances matter, but Dornbusch’s Law counsels patience in repositioning portfolios on their account: “Crises take longer to arrive than you can possibly imagine, but when they do come, they happen faster than you can possibly imagine.” Look at Chart 24, which shows a vast white sky (bull markets) with intermittent clusters of gray (recessions) and light red (bear markets) clouds. Market inflections are severe, but uncommon. When the default condition of an economy is to grow, and equity prices to rise, it is not enough for an investor to identify an imbalance, s/he also has to identify why it’s on the cusp of reversing. Right now, as it relates to the U.S., there aren’t meaningful imbalances in either markets or the real economy. Chart 24 (DOUG)Recessions And Bear Markets Travel Together
Recessions And Bear Markets Travel Together
Recessions And Bear Markets Travel Together
Even if we had perfect knowledge that a recession would arrive in 18 months, now would be way too early to sell. The S&P 500 has historically peaked an average of six months before the onset of a recession, and it has delivered juicy returns in the year preceding that peak (Table 1). Bull markets tend to sprint to the finish line (Chart 25). If this one is like its predecessors, an investor risks significant relative underperformance if s/he fails to participate in its go-go latter stages. Table 1 (DOUG)The S&P 500 Doesn’t Peak Until Six Months Before A Recession …
What Goes On Between Those Walls? BCA’s Diverging Views In The Open
What Goes On Between Those Walls? BCA’s Diverging Views In The Open
Chart 25
We are bullish on the outlook for the next six to twelve months, and recommend overweighting equities and spread product in balanced U.S. portfolios while significantly underweighting Treasuries. Peter: I agree with Doug. Equity bear markets seldom occur outside of recessions and recessions rarely occur when monetary policy is accommodative. Policy is currently easy, and will get even more stimulative if the Fed and several other central banks cut rates. Global equities are not super cheap, but they are not particularly expensive either. They currently trade at about 15-times forward earnings. Given the ultra-low level of global bond yields, this generates an equity risk premium (ERP) that is well above its historical average (Chart 26). One should favor stocks over bonds when the ERP is high. Chart 26A (PETER)Equity Risk Premia Remain Elevated (I)
Equity Risk Premia Remain Elevated (I)
Equity Risk Premia Remain Elevated (I)
Chart 26B (PETER)Equity Risk Premia Remain Elevated (II)
Equity Risk Premia Remain Elevated (II)
Equity Risk Premia Remain Elevated (II)
The ERP is especially elevated outside the United States. This is partly because non-U.S. stocks trade at a meager 13-times forward earnings, but it also reflects the fact that bond yields are lower overseas. Chart 27 (PETER)EM And Euro Area Equities Outperform When Global Growth Improves
EM And Euro Area Equities Outperform When Global Growth Improves
EM And Euro Area Equities Outperform When Global Growth Improves
As global growth accelerates, the dollar will weaken. Equity sectors and regions with a more cyclical bent will benefit (Chart 27). We expect to upgrade EM and European stocks later this summer. A softer dollar will also benefit gold. Bullion will get a further boost early next decade when inflation begins to accelerate. We went long gold on April 17, 2019 and continue to believe in this trade. Rob: For fixed income investors, the most obvious way to play a combination of monetary easing and recovering global growth is to overweight corporate debt versus government bonds (Chart 28). Within the U.S., corporate bond valuations look more attractive in high-yield over investment grade. Assuming a benign outlook for default risk in a reaccelerating U.S. economy, with the Fed easing, going for the carry in high-yield looks interesting. Emerging market credit should also do well if we see a bit of U.S. dollar weakness and additional stimulus measures in China. Chart 28 (ROB)Best Bond Bets: Overweight Global Corporates & Inflation-Linked Bonds
Best Bond Bets: Overweight Global Corporates & Inflation-Linked Bonds
Best Bond Bets: Overweight Global Corporates & Inflation-Linked Bonds
European corporates, however, may end up being the big winner if the ECB chooses to restart its Asset Purchase Program and ramps up its buying of European company debt. There are fewer restrictions for the ECB to buy corporates compared to the self-imposed limits on government bond purchases. The ECB would be entering a political minefield if it chose to buy more Italian debt and less German debt, but nobody would mind if the ECB helped finance European companies by buying their bonds. If one expects reflation to be successful, a below-benchmark stance on portfolio duration also makes sense given the current depressed level of government bond yields worldwide. Yields are more likely to grind upward than spike higher, and will be led first by increasing inflation expectations. Inflation-linked bonds should feature prominently in fixed income portfolios, especially in the U.S. where TIPS will outperform nominal yielding Treasuries. Mathieu: Thank you very much to all of you. Below is a comparative summary of the main arguments and investment recommendations of each camp. Summary Of Views And Recommendations
What Goes On Between Those Walls? BCA’s Diverging Views In The Open
What Goes On Between Those Walls? BCA’s Diverging Views In The Open
What Goes On Between Those Walls? BCA’s Diverging Views In The Open
What Goes On Between Those Walls? BCA’s Diverging Views In The Open
Anastasios Avgeriou U.S. Equity Strategist anastasios@bcaresearch.com Peter Berezin Chief Global Strategist peterb@bcaresearch.com Arthur Budaghyan Chief Emerging Markets Strategist arthurb@bcaresearch.com Dhaval Joshi Chief European Investment Strategist dhaval@bcaresearch.com Doug Peta Chief U.S. Investment Strategist dougp@bcaresearch.com Robert Robis Chief Fixed Income Strategist rrobis@bcaresearch.com Mathieu Savary The Bank Credit Analyst mathieu@bcaresearch.com Footnotes 1 To be fair to each individual involved, this is simplifying their views. Even within each camp, the negativity or positivity ranges on a spectrum, as you will be able to tell from the debate itself. 2 Please see BCA U.S. Equity Strategy Weekly Report, “Signal Vs. Noise,” dated December 17, 2018, available at uses.bcaresearch.com. 3 Please see BCA U.S. Equity Strategy Weekly Report, “A Recession Thought Experiment,” dated June 10, 2019, available at uses.bcaresearch.com. 4 Please see the European Investment Strategy Weekly Report “Risk: The Great Misunderstanding Of Finance,” October 25, 2018 available at eis.bcaresearch.com. 5 France is a good proxy for the euro area. 6 Please see Emerging Markets Strategy Weekly Report, “On Chinese Banks And Brazil,” available at ems.bcaresearch.com. Strategy & Market Trends* MacroQuant Model And Current Subjective Scores
Image
Tactical Trades Strategic Recommendations Closed Trades
BCA takes pride in its independence. Strategists publish what they really believe, informed by their framework and analysis. Occasionally, this independence results in strongly diverging views and we currently are in one of those times. Within BCA, two views on the cyclical (six to 12-months) outlook for assets have emerged. One camp expects global growth to rebound in the second half of the year. Along with accelerating growth, they anticipate stock prices and risk assets to remain firm, cyclical equities to outperform defensive ones, safe-haven yields to move up, and the dollar to weaken. Meanwhile, another group foresees a further deterioration in activity or a delayed recovery, additional downside in stocks and risk assets, outperformance of defensives relative to cyclicals, low safe-haven yields, and a generally stronger dollar. For the sake of transparency, we have asked representatives of each camp to make their case in a round-table discussion, allowing our clients to decide for themselves which view is more appealing to them. Global Investment Strategy’s Peter Berezin, U.S. Investment Strategy’s Doug Peta, and Global Fixed Income Strategy’s Rob Robis take the mantle for the bullish camp. U.S. Equity Strategy’s Anastasios Avgeriou, Emerging Market Strategy’s Arthur Budaghyan, and European Investment Strategy’s Dhaval Joshi represent the bearish group.1 The round-table discussion below focuses on the cyclical outlook. For longer investment horizons, most strategists agree that a recession is highly likely by 2022. Moreover, on a long-term basis, valuations in both risk assets and safe-haven bonds are very demanding. In this context, a significant back up in yields could hammer risk assets. The BCA Round Table Mathieu Savary: Yield curve inversions have often been harbingers of recessions. Anastasios, you are amongst those investors troubled by this inversion. Do you not worry that this episode might prove similar to 1998, when the curve only inverted temporarily and did not foreshadow a recession? Moreover, how do you account for the highly variable time lags between the inversion of the yield curve and the occurrence of a recession? Anastasios Avgeriou: The yield curve inverts at or near the peak of the business cycle and it eventually forewarns of upcoming recessions. This past December, parts of the yield curve inverted and now, BCA’s U.S. Equity Strategy service is heeding the signal from this simple indicator, especially given that the SPX has subsequently made all-time highs as our research predicted.2 Chart 1 (ANASTASIOS)The 1998 Episode Revisited
The 1998 Episode Revisited
The 1998 Episode Revisited
The yield curve inversion forecasts a Fed rate cut, and it has never been wrong on that front. It served well investors that heeded the message in June of 1998 as the market soon thereafter fell 20% in a heartbeat. If investors got out at the 1998 peak near 1200 and forwent about 350 points of gains until the March 2000 SPX cycle peak, they still benefited if they held tight as the market ultimately troughed near 777 in October 2002 (Chart 1). With regard to timing the previous seven recessions using the yield curve, if we accept that mid-1998 is the starting point of the inversion, it took 33 months before the recession commenced. Last cycle, the recession began 24 months after the inversion. Consequently, December 2020 is the earliest possible onset of recession and September 2021, the latest. Our forecast calls for SPX EPS to fall 20% in 2021 to $140 with the multiple dropping between 13.5x and 16.5x for an SPX end-2020 target range of 1,890-2,310.3 In other words we are not willing to play a 100-200 point advance for a potential 1,000 point drawdown. The risk/reward tradeoff is to the downside, and we choose to sit this one out. Mathieu: Rob, you take a much more sanguine view of the current curve inversion. Why? Rob Robis: While the four most dangerous words in investing are “this time is different,” this time really does appear to be different. Never before have negative term premia on longer-term Treasury yields and a curve inversion coexisted (Chart 2). Longer-term Treasury yields have therefore been pushed down to extremely low levels by factors beyond just expectations of a lower fed funds rate. The negative Treasury term premium is distorting the economic message of the U.S. yield curve inversion. Chart 2 (ROB)Negative Term Premium Distorting The Economic Message Of An Inverted Yield Curve
Negative Term Premium Distorting The Economic Message Of An Inverted Yield Curve
Negative Term Premium Distorting The Economic Message Of An Inverted Yield Curve
Term premia are depressed everywhere, as seen in German, Japanese and other yields, reflecting the intense demand for safe assets like government bonds during a period of heightened uncertainty. Global bond markets may also be discounting a higher probability of the ECB restarting its Asset Purchase Program, as term premia typically fall sharply when central banks embark on quantitative easing. This has global spillovers. Prior to previous recessions, U.S. Treasury curve inversions occurred when the Fed was running an unequivocally tight monetary policy. That is not the case today. The real fed funds rate still is not above the Fed’s estimate of the neutral real rate, a.k.a. “r-star,” which was the necessary ingredient for all previous Treasury curve inversions since 1960 (Chart 3). Chart 3 (ROB)Fed Policy Is Not Tight Enough For Sustained Curve Inversion
Fed Policy Is Not Tight Enough For Sustained Curve Inversion
Fed Policy Is Not Tight Enough For Sustained Curve Inversion
Mathieu: The level of policy accommodation will most likely determine whether Anastasios or Rob is proven right. Peter, you have been steadfastly arguing that policy, in the U.S. at least, remains easy. Can you elaborate why? Peter Berezin: Remember that the neutral rate of interest is the rate that equalizes the level of aggregate demand with the economy’s supply-side potential. Loose fiscal policy and fading deleveraging headwinds are boosting demand in the United States. So is rising wage growth, especially at the bottom of the income distribution. Given that the U.S. does not currently suffer from any major imbalances, I believe that the economy can tolerate higher rates without significant ill-effects. In other words, monetary policy is currently quite easy. Of course, we cannot observe the neutral rate directly. Like a black hole, one can only detect it based on the effect that it has on its surroundings. Housing is by far the most interest rate-sensitive sector of the economy. If history is any guide, the recent decline in mortgage rates will boost housing activity in the remainder of the year (Chart 4). If that relationship breaks down, as it did during the Great Recession, it would suggest that the neutral rate is quite low. Chart 4 (PETER)Declining Mortgage Rates Bode Well For Housing
Declining Mortgage Rates Bode Well For Housing
Declining Mortgage Rates Bode Well For Housing
Given that mortgage underwriting standards have been quite strong and the homeowner vacancy is presently very low, our guess is that housing will hold up well. We should know better in the next few months. Mathieu: Dhaval, you do not agree. Why do you think global rates are not accommodative? Dhaval Joshi: Actually, I think that global rates are accommodative, but that the global bond yield can rise by just 70 bps before conditions become perilously un-accommodative. Here’s where I disagree with Peter: for me, the danger doesn’t come from economics, it comes from the mathematics of ultra-low bond yields. The unprecedented and experimental panacea of our era has been ‘universal QE’ – which has led to ultra-low bond yields everywhere. But what is not understood is that when bond yields reach and remain close to their lower bound, weird things happen to the financial markets.
Chart 5
I refer you to other reports for the details, but in a nutshell, the proximity of the lower bound to yields increases the risk of owning supposedly ‘safe’ bonds to the risk of owning so-called ‘risk-assets’. The result is that the valuation of risk-assets rises exponentially (Chart 5). Because when the riskiness of the asset-classes converges, investors price risk-assets to deliver the same ultra-low nominal return as bonds.4 Comparisons with previous economic cycles miss the current danger. The post-2000 policy easing distorted the global economy by engineering a credit boom – so the subsequent danger emanated from the most credit-sensitive sectors in the economy such as mortgage lending. In contrast, the post-2008 ‘universal QE’ has severely distorted the valuation relationship between bonds and global risk-assets – so this is where the current danger lies. Higher bond yields can suddenly undermine the valuation support of global risk-assets whose $400 trillion worth dwarfs the global economy by five to one. Where is this tipping point? It is when the global 10-year yield – defined as the average of the U.S., euro area,5 and China – approaches 2.5%. Through the past five years, the inability of this yield to remain above 2.5% confirms the hyper-sensitivity of financial conditions to this tipping point (Chart 6). Right now, I agree that bond yields are accommodative. But the scope for yields to move higher is quite limited. Chart 6 (DHAVAL)Since 2015, the Global Long Bond Yield Has Struggled To Surpass 2.5 Percent
Since 2015, the Global Long Bond Yield Has Struggled To Surpass 2.5 Percent
Since 2015, the Global Long Bond Yield Has Struggled To Surpass 2.5 Percent
Mathieu: Monetary policy is important to the outlook, but so is the global manufacturing cycle. The global growth slowdown has been concentrated in the manufacturing sector, tradeable goods in particular. Across advanced economies, the service and consumer sectors have been surprisingly resilient, but this will not last if the industrial sector decelerates further. Arthur, you still do not anticipate any major improvement in global trade and industrial production. Can you elaborate why? Chart 7 (ARTHUR)Global Trade Is Down Due To China Not U.S.
Global Trade Is Down Due To China Not U.S.
Global Trade Is Down Due To China Not U.S.
Arthur Budaghyan: To properly assess the economic outlook, one needs to understand what has caused the ongoing global trade/manufacturing downturn. One thing we know for certain: It originated in China, not the U.S. Chart 7 illustrates that Korean, Japanese, Taiwanese and Singaporean exports to China have been shrinking at an annual rate of 10%, while their shipments to the U.S. have been growing. China’s aggregate imports have also been contracting. This entails that from the perspective of the rest of the world, China has been and remains in recession. U.S. manufacturing is the least exposed to China, which is the main reason why it has been the last shoe to drop. Hence, the U.S. has lagged in this downturn, and one should not be looking to the U.S. for clues about a potential global recovery. We need to gauge what will turn Chinese demand around. In this regard, the rising credit and fiscal spending impulse is positive, but it has so far failed to kick start a recovery (Chart 8). The key reason has been a declining marginal propensity to spend among households and companies. Notably, the marginal propensity to spend of mainland companies leads industrial metals prices by a few months, and it currently continues to point south (Chart 8, bottom panel). The lack of willingness among Chinese consumers and enterprises to spend is due to several factors: (1) the U.S.-China confrontation; (2) high levels of indebtedness among both enterprises and households (Chart 9); (3) ongoing regulatory scrutiny over banks and shadow banking as well as local government debt; and (4) a lack of outright government subsidies for purchases of autos and housing. Chart 8 (ARTHUR)Stimulus Versus Marginal Propensity To Spend
Stimulus Versus Marginal Propensity To Spend
Stimulus Versus Marginal Propensity To Spend
Chart 9 (ARTHUR)Chinese Households Are More Leveraged Than U.S. Ones
Chinese Households Are Leveraged Than U.S. Ones
Chinese Households Are Leveraged Than U.S. Ones
On the whole, the falling marginal propensity to spend will all but ensure that any recovery in mainland household and corporate spending is delayed. Mathieu: Meanwhile, Peter, you have a much more optimistic stance. Why do you differ so profoundly with Arthur’s view? Peter: China’s deleveraging campaign began more than a year before global manufacturing peaked. I have no doubt that slower Chinese credit growth weighed on global capex, but we should not lose sight of the fact there are natural ebbs and flows at work. Most manufactured goods retain some value for a while after they are purchased. If spending on, say, consumer durable goods or business equipment rises to a high level for an extended period, a glut will form, requiring a period of lower production. Chart 10 (PETER)The Global Manufacturing Cycle Has Likely Reached A Bottom
The Global Manufacturing Cycle Has Likely Reached A Bottom
The Global Manufacturing Cycle Has Likely Reached A Bottom
These demand cycles typically last about three years; roughly 18 months on the way up, 18 months on the way down (Chart 10). The last downleg in the global manufacturing cycle began in early 2018, so if history is any guide, we are nearing a trough. The fact that U.S. manufacturing output rose in both May and June, followed by this week’s sharp rebound in the July Philly Fed Manufacturing survey, supports this view. Of course, extraneous forces could complicate matters. If trade tensions ratchet higher, this would weaken my bullish thesis. Nevertheless, with China stimulating its economy again, it would probably take a severe trade war to push the global economy into recession. Mathieu: Dhaval, you are not as negative as Arthur, but nonetheless expect a slowdown in the second half of the year. What is your rationale? Dhaval: To be clear, I am not forecasting a recession or major downturn – unless, as per my previous answer, the global 10-year bond yield approaches 2.5% and triggers a severe dislocation in global risk-assets. In fact, many people get the relationship between recession and financial market dislocation back-to-front: they think that the recession causes the financial market dislocation when, in most cases, the financial market dislocation causes the recession! Nevertheless, I do believe that European and global growth is entering a regular down-oscillation based on the following compelling evidence: From a low last summer, quarter-on-quarter GDP growth rates in the developed economies have already rebounded to the upper end of multi-year ranges. Short-term credit impulses in Europe, the U.S., and China are entering down-oscillations (Chart 11). The best current activity indicators, specifically the ZEW economic sentiment indicators, have rolled over. The outperformance of industrials – the equity sector most exposed to global growth – has also rolled over. Why expect a down-oscillation? Because it is the rate of decline in the bond yield that drove the rebound in growth after its low last summer. Furthermore, it is impossible for the rate of decline in the bond yield to keep increasing, or even stay where it is. Counterintuitively, if bond yields decline, but at a reduced pace, the effect is to slow economic growth. Mathieu: A positive and a negative view of the world logically result in bifurcated outlooks for interest rates and the dollar. Rob, how do you see U.S., German, and Japanese yields evolving over the coming 12 months? Rob: If global growth rebounds, U.S. Treasury yields will have far more upside than Bund or JGB yields. Inflation expectations should recover faster in the U.S., with the Fed taking inflationary risks by cutting rates with a 3.7% unemployment rate and core CPI inflation at 2.1%. The Fed is also likely to disappoint by delivering fewer rate cuts than are currently discounted by markets (90bps over the next 12 months). Treasury yields can therefore increase more than German and Japanese yields, with the ECB and BoJ more likely to deliver the modest rate cuts currently discounted in their yield curves (Chart 12). Chart 11 (DHAVAL)Short-Term Impulses Rebounded... But Are Now Rolling Over
Short-Term Impulses Rebounded... But Are Now Rolling Over
Short-Term Impulses Rebounded... But Are Now Rolling Over
Chart 12 (ROB)U.S. Treasuries Will Underperform Bunds & JGBs
U.S. Treasuries Will Underperform Bunds & JGBs
U.S. Treasuries Will Underperform Bunds & JGBs
Japanese yields will remain mired at or below zero over the next 6-12 months, as wage growth and core inflation remain too anemic for the BoJ to alter its 0% target on 10-year JGB yields. German yields have a bit more potential to rise if European growth begins to recover, but will lag any move higher in Treasury yields. That means that the Treasury-Bund and Treasury-JGB spreads will move higher over the next year. Negative German and Japanese yields may look completely unappetizing compared to +2% U.S. Treasury yields, but this handicap vanishes when all three yields are expressed in U.S. dollar terms. Hedging a 10-year German Bund or JGB into higher-yielding U.S. dollars creates yields that are 50-60bps higher than a 10-year U.S. Treasury. It is abundantly clear that German and Japanese bonds will outperform Treasuries over the next year if global growth recovers. Mathieu: Peter, your positive view on global growth means that the Fed will cut rates less than what is currently priced into the OIS curve. So why do you expect the dollar to weaken in the second half of 2019? Peter: What the Fed does affects interest rate differentials, but just as important is what other central banks do. The ECB is not going to raise rates over the next 12 months. However, if euro area growth surprises on the upside later this year, investors will begin to question the need for the ECB to keep policy rates in negative territory until mid-2024. The market’s expectation of where policy rates will be five years out tends to correlate well with today’s exchange rate. By that measure, there is scope for interest rate differentials to narrow against the U.S. dollar (Chart 13). Chart 13A (PETER)Interest Rate Expectations Against The U.S. Should Narrow (I)
Interest Rate Expectations Against The U.S. Should Narrow (I)
Interest Rate Expectations Against The U.S. Should Narrow (I)
Chart 13B (PETER)Interest Rate Expectations Against The U.S. Should Narrow (II)
Interest Rate Expectations Against The U.S. Should Narrow (II)
Interest Rate Expectations Against The U.S. Should Narrow (II)
Keep in mind that the U.S. dollar is a countercyclical currency, meaning that it moves in the opposite direction of global growth (Chart 14). This countercyclicality stems from the fact that the U.S. economy is more geared towards services than manufacturing compared with the rest of the world. Chart 14 (PETER)The Dollar Is A Countercyclical Currency
The Dollar Is A Countercyclical Currency
The Dollar Is A Countercyclical Currency
As such, when global growth accelerates, capital tends to flow from the U.S. to the rest of the world, translating into more demand for foreign currency and less demand for dollars. If global growth picks up in the remainder of the year, as I expect, the dollar will weaken. Mathieu: Arthur, as you are significantly more negative on growth than either Rob or Peter, how do you see the dollar and global yields evolving over the coming six to 12 months? Arthur: I am positive on the trade-weighted U.S. dollar for the following reasons: The U.S. dollar is a countercyclical currency – it exhibits a negative correlation with the global business cycle. Persistent weakness in the global economy emanating from China/EM is positive for the dollar because the U.S. economy is the major economic block least exposed to a China/EM slowdown. Meanwhile, the greenback is only loosely correlated with U.S. interest rates. Thereby, the argument that lower U.S. rates will drive the value of the U.S. currency much lower is overemphasized. The Federal Reserve will cut rates by more than what is currently priced into the market only in a scenario of a complete collapse in global growth. Yet this scenario would be dollar bullish. In this case, the dollar’s strong inverse relationship with global growth will outweigh its weak positive relationship with interest rates. Contrary to consensus views, the U.S. dollar is not very expensive. According to unit labor costs based on the real effective exchange rate – the best currency valuation measure – the greenback is only one standard deviation above its fair value. Often, financial markets tend to overshoot to 1.5 or 2 standard deviations below or above their historical mean before reversing their trend. One of the oft-cited headwinds facing the dollar is positioning, yet there is a major discrepancy between positioning in DM and EM currencies versus the U.S. dollar. In aggregate, investors – asset managers and leveraged funds – have neutral exposure to DM currencies, but they are very long liquid EM exchange rates such as the BRL, MXN, ZAR and RUB versus the greenback. The dollar strength will occur mostly versus EM and commodities currencies. In other words, the euro, other European currencies and the yen will outperform EM exchange rates. I have less conviction on global bond yields. While global growth will disappoint, yields have already fallen a lot and the U.S. economy is currently not weak enough to justify around 90 basis points of rate cuts over the next 12 months. Mathieu: Before we move on to investment recommendations, Anastasios, you have done a lot of interesting work on the outlook for U.S. profits. What is the message of your analysis? Chart 15 (ANASTASIOS)Gravitational Pull
Gravitational Pull
Gravitational Pull
Anastasios: While markets cheered the trade truce following the recent G-20 meeting, no tariff rollback was agreed. Since the tariff rate on $200bn of Chinese imports went up from 10% to 25% on May 10, odds are high that manufacturing will remain in the doldrums. This will likely continue to weigh on profits for the remainder of the year. Profit growth should weaken further in the coming six months. Periods of falling manufacturing PMIs result in larger negative earnings growth surprises as market forecasters rarely anticipate the full breadth and depth of slowdowns. Absent profit growth, equity markets lack the necessary ‘oxygen’ for a durable high-quality rally. Until global growth momentum turns, investors should fade rallies. Our four-factor SPX EPS growth model is flirting with the contraction zone. In addition, our corporate pricing power proxy and Goldman Sachs’ Current Activity Indicator both send a distress signal for SPX profits (Chart 15). Already, more than half of the S&P 500 GICS1 sectors’ profits are estimated to have contracted in Q2, and three sectors could see declining revenues on a year-over-year basis, according to I/B/E/S data. Q3 depicts an equally grim profit picture that will also spill over to Q4. Adding it all up, profits will underwhelm into year-end. Mathieu: Doug, you do not share Anastasios’s anxiety. What offsets do you foresee? Moreover, you are not concerned by the U.S. corporate balance sheets. Can you share why? Doug Peta: As it relates to earnings, we foresee offsets from a revival in the rest of the world. Increasingly accommodative global monetary policy and reviving Chinese growth will give global ex-U.S. economies a boost. That inflection may go largely unnoticed in U.S. GDP, but it will help the S&P 500, as U.S.-based multinationals’ earnings benefit from increased overseas demand and a weaker dollar. When it comes to corporate balance sheets, shifting some of the funding burden to debt from equity when interest rates are at generational lows is a no-brainer. Even so, non-financial corporates have not added all that much leverage (Chart 16). Low interest rates, wide profit margins and conservative capex have left them with ample free cash flow to service their obligations (Chart 17). Chart 16 (DOUG)Corporations Have Not Added Much Leverage ...
Corporations Have Not Added Much Leverage ...
Corporations Have Not Added Much Leverage ...
Chart 17 (DOUG)...Though They Have Ample Cash Flow To Service It
...Though They Have Ample Cash Flow To Service It
...Though They Have Ample Cash Flow To Service It
Every single viable corporate entity with an effective federal tax rate above 21% became a better credit when the top marginal rate was cut from 35% to 21%. Every such corporation now has more net income with which to service debt, and will have that income unless the tax code is revised. You can’t see it in EBITDA multiples, but it will show up in reduced defaults. Mathieu: The last, and most important question. What are each of your main investment recommendations to capitalize on the economic trends you anticipate over the coming 6-12 months? Let’s start with the pessimists: Arthur: First, the rally in global cyclicals and China plays since December has been premature and is at risk of unwinding as global growth and cyclical profits disappoint. Historical evidence suggests that global share prices have not led but have actually been coincident with the global manufacturing PMI (Chart 18). The recent divergence is unprecedented. Chart 18 (ARTHUR)Global Stocks Historically Did Not Lead PMIs
Global Stocks Historically Did Not Lead PMIs
Global Stocks Historically Did Not Lead PMIs
Second, EM risk assets and currencies remain vulnerable. EM and Chinese earnings per share are shrinking. The leading indicators signal that the rate of contraction will deepen, at least the end of this year (Chart 19). Asset allocators should continue underweighting EM versus DM equities. Finally, my strongest-conviction, market-neutral trade is to short EM or Chinese banks and go long U.S. banks. The latter are much healthier than EM/Chinese ones, as we discussed in our recent report.6 Anastasios: The U.S. Equity Strategy team is shifting away from a cyclical and toward a more defensive portfolio bent. Our highest conviction view is to overweight mega caps versus small caps. Small caps are saddled with debt and are suffering a margin squeeze. Moreover, approximately 600 constituents of the Russell 2000 have no forward profits. Only one S&P 500 company has negative forward EPS. Given that both the S&P and the Russell omit these figures from the forward P/E calculation, this is masking the small cap expensiveness. When adjusted for this discrepancy, small caps are trading at a hefty premium versus large caps (Chart 20). Chart 19 (ARTHUR)China And EM Profits Are Contracting
China And EM Profits Are Contracting
China And EM Profits Are Contracting
Chart 20 (ANASTASIOS)Continue To Avoid Small Caps
Continue To Avoid Small Caps
Continue To Avoid Small Caps
We have also upgraded the S&P managed health care and the S&P hypermarkets groups. If the economic slowdown persists into early 2020, both of these defensive subgroups will fare well. In mid-April, we lifted the S&P managed health care group to an above benchmark allocation and posited that the selloff in this group was overdone as the odds of “Medicare For All” becoming law were slim. Moreover, a tight labor market along with melting medical cost inflation would boost the industry’s margins and profits (Chart 21). This week, we upgraded the defensive S&P hypermarkets index to overweight arguing that the souring macro landscape coupled with a firming industry demand outlook will support relative share prices (Chart 22). Chart 21 (ANASTASIOS)Buy Hypermarkets
Buy Hypermarkets
Buy Hypermarkets
Chart 22 (ANASTASIOS)Stick With Managed Health Care
Stick With Managed Health Care
Stick With Managed Health Care
Dhaval: To be fair, I am not a pessimist. Provided the global bond yield stays well below 2.5 percent, the support to risk-asset valuations will prevent a major dislocation. But in a growth down-oscillation, the big game in town will be sector rotation into pro-defensive investment plays, especially into those defensives that have underperformed (Chart 23). Chart 23 (DHAVAL)Switch Out Of Growth-Sensitives Into Healthcare
Switch Out Of Growth-Sensitives Into Healthcare
Switch Out Of Growth-Sensitives Into Healthcare
On this basis: Overweight Healthcare versus Industrials. Overweight the Eurostoxx 50 versus the Shanghai Composite and the Nikkei 225. Overweight U.S. T-bonds versus German bunds. Overweight the JPY in a portfolio of G10 currencies. Mathieu: And now, the optimists: Doug: So What? is the overriding question that guides all of BCA’s research: What is the practical investment application of this macro observation? But Why Now? is a critical corollary for anyone allocating investment capital: Why is the imbalance you’ve observed about to become a problem? As Herbert Stein said, “If something cannot go on forever, it will stop.” Imbalances matter, but Dornbusch’s Law counsels patience in repositioning portfolios on their account: “Crises take longer to arrive than you can possibly imagine, but when they do come, they happen faster than you can possibly imagine.” Look at Chart 24, which shows a vast white sky (bull markets) with intermittent clusters of gray (recessions) and light red (bear markets) clouds. Market inflections are severe, but uncommon. When the default condition of an economy is to grow, and equity prices to rise, it is not enough for an investor to identify an imbalance, s/he also has to identify why it’s on the cusp of reversing. Right now, as it relates to the U.S., there aren’t meaningful imbalances in either markets or the real economy. Chart 24 (DOUG)Recessions And Bear Markets Travel Together
Recessions And Bear Markets Travel Together
Recessions And Bear Markets Travel Together
Even if we had perfect knowledge that a recession would arrive in 18 months, now would be way too early to sell. The S&P 500 has historically peaked an average of six months before the onset of a recession, and it has delivered juicy returns in the year preceding that peak (Table 1). Bull markets tend to sprint to the finish line (Chart 25). If this one is like its predecessors, an investor risks significant relative underperformance if s/he fails to participate in its go-go latter stages. Table 1 (DOUG)The S&P 500 Doesn’t Peak Until Six Months Before A Recession …
What Goes On Between Those Walls? BCA’s Diverging Views In The Open
What Goes On Between Those Walls? BCA’s Diverging Views In The Open
Chart 25
We are bullish on the outlook for the next six to twelve months, and recommend overweighting equities and spread product in balanced U.S. portfolios while significantly underweighting Treasuries. Peter: I agree with Doug. Equity bear markets seldom occur outside of recessions and recessions rarely occur when monetary policy is accommodative. Policy is currently easy, and will get even more stimulative if the Fed and several other central banks cut rates. Global equities are not super cheap, but they are not particularly expensive either. They currently trade at about 15-times forward earnings. Given the ultra-low level of global bond yields, this generates an equity risk premium (ERP) that is well above its historical average (Chart 26). One should favor stocks over bonds when the ERP is high. Chart 26A (PETER)Equity Risk Premia Remain Elevated (I)
Equity Risk Premia Remain Elevated (I)
Equity Risk Premia Remain Elevated (I)
Chart 26B (PETER)Equity Risk Premia Remain Elevated (II)
Equity Risk Premia Remain Elevated (II)
Equity Risk Premia Remain Elevated (II)
The ERP is especially elevated outside the United States. This is partly because non-U.S. stocks trade at a meager 13-times forward earnings, but it also reflects the fact that bond yields are lower overseas. Chart 27 (PETER)EM And Euro Area Equities Outperform When Global Growth Improves
EM And Euro Area Equities Outperform When Global Growth Improves
EM And Euro Area Equities Outperform When Global Growth Improves
As global growth accelerates, the dollar will weaken. Equity sectors and regions with a more cyclical bent will benefit (Chart 27). We expect to upgrade EM and European stocks later this summer. A softer dollar will also benefit gold. Bullion will get a further boost early next decade when inflation begins to accelerate. We went long gold on April 17, 2019 and continue to believe in this trade. Rob: For fixed income investors, the most obvious way to play a combination of monetary easing and recovering global growth is to overweight corporate debt versus government bonds (Chart 28). Within the U.S., corporate bond valuations look more attractive in high-yield over investment grade. Assuming a benign outlook for default risk in a reaccelerating U.S. economy, with the Fed easing, going for the carry in high-yield looks interesting. Emerging market credit should also do well if we see a bit of U.S. dollar weakness and additional stimulus measures in China. Chart 28 (ROB)Best Bond Bets: Overweight Global Corporates & Inflation-Linked Bonds
Best Bond Bets: Overweight Global Corporates & Inflation-Linked Bonds
Best Bond Bets: Overweight Global Corporates & Inflation-Linked Bonds
European corporates, however, may end up being the big winner if the ECB chooses to restart its Asset Purchase Program and ramps up its buying of European company debt. There are fewer restrictions for the ECB to buy corporates compared to the self-imposed limits on government bond purchases. The ECB would be entering a political minefield if it chose to buy more Italian debt and less German debt, but nobody would mind if the ECB helped finance European companies by buying their bonds. If one expects reflation to be successful, a below-benchmark stance on portfolio duration also makes sense given the current depressed level of government bond yields worldwide. Yields are more likely to grind upward than spike higher, and will be led first by increasing inflation expectations. Inflation-linked bonds should feature prominently in fixed income portfolios, especially in the U.S. where TIPS will outperform nominal yielding Treasuries. Mathieu: Thank you very much to all of you. Below is a comparative summary of the main arguments and investment recommendations of each camp. Summary Of Views And Recommendations
What Goes On Between Those Walls? BCA’s Diverging Views In The Open
What Goes On Between Those Walls? BCA’s Diverging Views In The Open
What Goes On Between Those Walls? BCA’s Diverging Views In The Open
What Goes On Between Those Walls? BCA’s Diverging Views In The Open
Anastasios Avgeriou U.S. Equity Strategist anastasios@bcaresearch.com Peter Berezin Chief Global Strategist peterb@bcaresearch.com Arthur Budaghyan Chief Emerging Markets Strategist arthurb@bcaresearch.com Dhaval Joshi Chief European Investment Strategist dhaval@bcaresearch.com Doug Peta Chief U.S. Investment Strategist dougp@bcaresearch.com Robert Robis Chief Fixed Income Strategist rrobis@bcaresearch.com Mathieu Savary The Bank Credit Analyst mathieu@bcaresearch.com Footnotes 1 To be fair to each individual involved, this is simplifying their views. Even within each camp, the negativity or positivity ranges on a spectrum, as you will be able to tell from the debate itself. 2 Please see BCA U.S. Equity Strategy Weekly Report, “Signal Vs. Noise,” dated December 17, 2018, available at uses.bcaresearch.com. 3 Please see BCA U.S. Equity Strategy Weekly Report, “A Recession Thought Experiment,” dated June 10, 2019, available at uses.bcaresearch.com. 4 Please see the European Investment Strategy Weekly Report “Risk: The Great Misunderstanding Of Finance,” October 25, 2018 available at eis.bcaresearch.com. 5 France is a good proxy for the euro area. 6 Please see Emerging Markets Strategy Weekly Report, “On Chinese Banks And Brazil,” available at ems.bcaresearch.com.