Policy

BCA takes pride in its independence. Strategists publish what they really believe, informed by their framework and analysis. Occasionally, this independence results in strongly diverging views and we currently are in one of those times. Within BCA, two views on the cyclical (six to 12-months) outlook for assets have emerged. One camp expects global growth to rebound in the second half of the year. Along with accelerating growth, they anticipate stock prices and risk assets to remain firm, cyclical equities to outperform defensive ones, safe-haven yields to move up, and the dollar to weaken. Meanwhile, another group foresees a further deterioration in activity or a delayed recovery, additional downside in stocks and risk assets, outperformance of defensives relative to cyclicals, low safe-haven yields, and a generally stronger dollar. For the sake of transparency, we have asked representatives of each camp to make their case in a round-table discussion, allowing our clients to decide for themselves which view is more appealing to them. Global Investment Strategy’s Peter Berezin, U.S. Investment Strategy’s Doug Peta, and Global Fixed Income Strategy’s Rob Robis take the mantle for the bullish camp. U.S. Equity Strategy’s Anastasios Avgeriou, Emerging Market Strategy’s Arthur Budaghyan, and European Investment Strategy’s Dhaval Joshi represent the bearish group.1 The round-table discussion below focuses on the cyclical outlook. For longer investment horizons, most strategists agree that a recession is highly likely by 2022. Moreover, on a long-term basis, valuations in both risk assets and safe-haven bonds are very demanding. In this context, a significant back up in yields could hammer risk assets. The BCA Round Table Mathieu Savary: Yield curve inversions have often been harbingers of recessions. Anastasios, you are amongst those investors troubled by this inversion. Do you not worry that this episode might prove similar to 1998, when the curve only inverted temporarily and did not foreshadow a recession? Moreover, how do you account for the highly variable time lags between the inversion of the yield curve and the occurrence of a recession? Anastasios Avgeriou: The yield curve inverts at or near the peak of the business cycle and it eventually forewarns of upcoming recessions. This past December, parts of the yield curve inverted and now, BCA’s U.S. Equity Strategy service is heeding the signal from this simple indicator, especially given that the SPX has subsequently made all-time highs as our research predicted.2 Chart 1 (ANASTASIOS)The 1998 Episode Revisited
The 1998 Episode Revisited
The 1998 Episode Revisited
The yield curve inversion forecasts a Fed rate cut, and it has never been wrong on that front. It served well investors that heeded the message in June of 1998 as the market soon thereafter fell 20% in a heartbeat. If investors got out at the 1998 peak near 1200 and forwent about 350 points of gains until the March 2000 SPX cycle peak, they still benefited if they held tight as the market ultimately troughed near 777 in October 2002 (Chart 1). With regard to timing the previous seven recessions using the yield curve, if we accept that mid-1998 is the starting point of the inversion, it took 33 months before the recession commenced. Last cycle, the recession began 24 months after the inversion. Consequently, December 2020 is the earliest possible onset of recession and September 2021, the latest. Our forecast calls for SPX EPS to fall 20% in 2021 to $140 with the multiple dropping between 13.5x and 16.5x for an SPX end-2020 target range of 1,890-2,310.3 In other words we are not willing to play a 100-200 point advance for a potential 1,000 point drawdown. The risk/reward tradeoff is to the downside, and we choose to sit this one out. Mathieu: Rob, you take a much more sanguine view of the current curve inversion. Why? Rob Robis: While the four most dangerous words in investing are “this time is different,” this time really does appear to be different. Never before have negative term premia on longer-term Treasury yields and a curve inversion coexisted (Chart 2). Longer-term Treasury yields have therefore been pushed down to extremely low levels by factors beyond just expectations of a lower fed funds rate. The negative Treasury term premium is distorting the economic message of the U.S. yield curve inversion. Chart 2 (ROB)Negative Term Premium Distorting The Economic Message Of An Inverted Yield Curve
Negative Term Premium Distorting The Economic Message Of An Inverted Yield Curve
Negative Term Premium Distorting The Economic Message Of An Inverted Yield Curve
Term premia are depressed everywhere, as seen in German, Japanese and other yields, reflecting the intense demand for safe assets like government bonds during a period of heightened uncertainty. Global bond markets may also be discounting a higher probability of the ECB restarting its Asset Purchase Program, as term premia typically fall sharply when central banks embark on quantitative easing. This has global spillovers. Prior to previous recessions, U.S. Treasury curve inversions occurred when the Fed was running an unequivocally tight monetary policy. That is not the case today. The real fed funds rate still is not above the Fed’s estimate of the neutral real rate, a.k.a. “r-star,” which was the necessary ingredient for all previous Treasury curve inversions since 1960 (Chart 3). Chart 3 (ROB)Fed Policy Is Not Tight Enough For Sustained Curve Inversion
Fed Policy Is Not Tight Enough For Sustained Curve Inversion
Fed Policy Is Not Tight Enough For Sustained Curve Inversion
Mathieu: The level of policy accommodation will most likely determine whether Anastasios or Rob is proven right. Peter, you have been steadfastly arguing that policy, in the U.S. at least, remains easy. Can you elaborate why? Peter Berezin: Remember that the neutral rate of interest is the rate that equalizes the level of aggregate demand with the economy’s supply-side potential. Loose fiscal policy and fading deleveraging headwinds are boosting demand in the United States. So is rising wage growth, especially at the bottom of the income distribution. Given that the U.S. does not currently suffer from any major imbalances, I believe that the economy can tolerate higher rates without significant ill-effects. In other words, monetary policy is currently quite easy. Of course, we cannot observe the neutral rate directly. Like a black hole, one can only detect it based on the effect that it has on its surroundings. Housing is by far the most interest rate-sensitive sector of the economy. If history is any guide, the recent decline in mortgage rates will boost housing activity in the remainder of the year (Chart 4). If that relationship breaks down, as it did during the Great Recession, it would suggest that the neutral rate is quite low. Chart 4 (PETER)Declining Mortgage Rates Bode Well For Housing
Declining Mortgage Rates Bode Well For Housing
Declining Mortgage Rates Bode Well For Housing
Given that mortgage underwriting standards have been quite strong and the homeowner vacancy is presently very low, our guess is that housing will hold up well. We should know better in the next few months. Mathieu: Dhaval, you do not agree. Why do you think global rates are not accommodative? Dhaval Joshi: Actually, I think that global rates are accommodative, but that the global bond yield can rise by just 70 bps before conditions become perilously un-accommodative. Here’s where I disagree with Peter: for me, the danger doesn’t come from economics, it comes from the mathematics of ultra-low bond yields. The unprecedented and experimental panacea of our era has been ‘universal QE’ – which has led to ultra-low bond yields everywhere. But what is not understood is that when bond yields reach and remain close to their lower bound, weird things happen to the financial markets.
Chart 5
I refer you to other reports for the details, but in a nutshell, the proximity of the lower bound to yields increases the risk of owning supposedly ‘safe’ bonds to the risk of owning so-called ‘risk-assets’. The result is that the valuation of risk-assets rises exponentially (Chart 5). Because when the riskiness of the asset-classes converges, investors price risk-assets to deliver the same ultra-low nominal return as bonds.4 Comparisons with previous economic cycles miss the current danger. The post-2000 policy easing distorted the global economy by engineering a credit boom – so the subsequent danger emanated from the most credit-sensitive sectors in the economy such as mortgage lending. In contrast, the post-2008 ‘universal QE’ has severely distorted the valuation relationship between bonds and global risk-assets – so this is where the current danger lies. Higher bond yields can suddenly undermine the valuation support of global risk-assets whose $400 trillion worth dwarfs the global economy by five to one. Where is this tipping point? It is when the global 10-year yield – defined as the average of the U.S., euro area,5 and China – approaches 2.5%. Through the past five years, the inability of this yield to remain above 2.5% confirms the hyper-sensitivity of financial conditions to this tipping point (Chart 6). Right now, I agree that bond yields are accommodative. But the scope for yields to move higher is quite limited. Chart 6 (DHAVAL)Since 2015, the Global Long Bond Yield Has Struggled To Surpass 2.5 Percent
Since 2015, the Global Long Bond Yield Has Struggled To Surpass 2.5 Percent
Since 2015, the Global Long Bond Yield Has Struggled To Surpass 2.5 Percent
Mathieu: Monetary policy is important to the outlook, but so is the global manufacturing cycle. The global growth slowdown has been concentrated in the manufacturing sector, tradeable goods in particular. Across advanced economies, the service and consumer sectors have been surprisingly resilient, but this will not last if the industrial sector decelerates further. Arthur, you still do not anticipate any major improvement in global trade and industrial production. Can you elaborate why? Chart 7 (ARTHUR)Global Trade Is Down Due To China Not U.S.
Global Trade Is Down Due To China Not U.S.
Global Trade Is Down Due To China Not U.S.
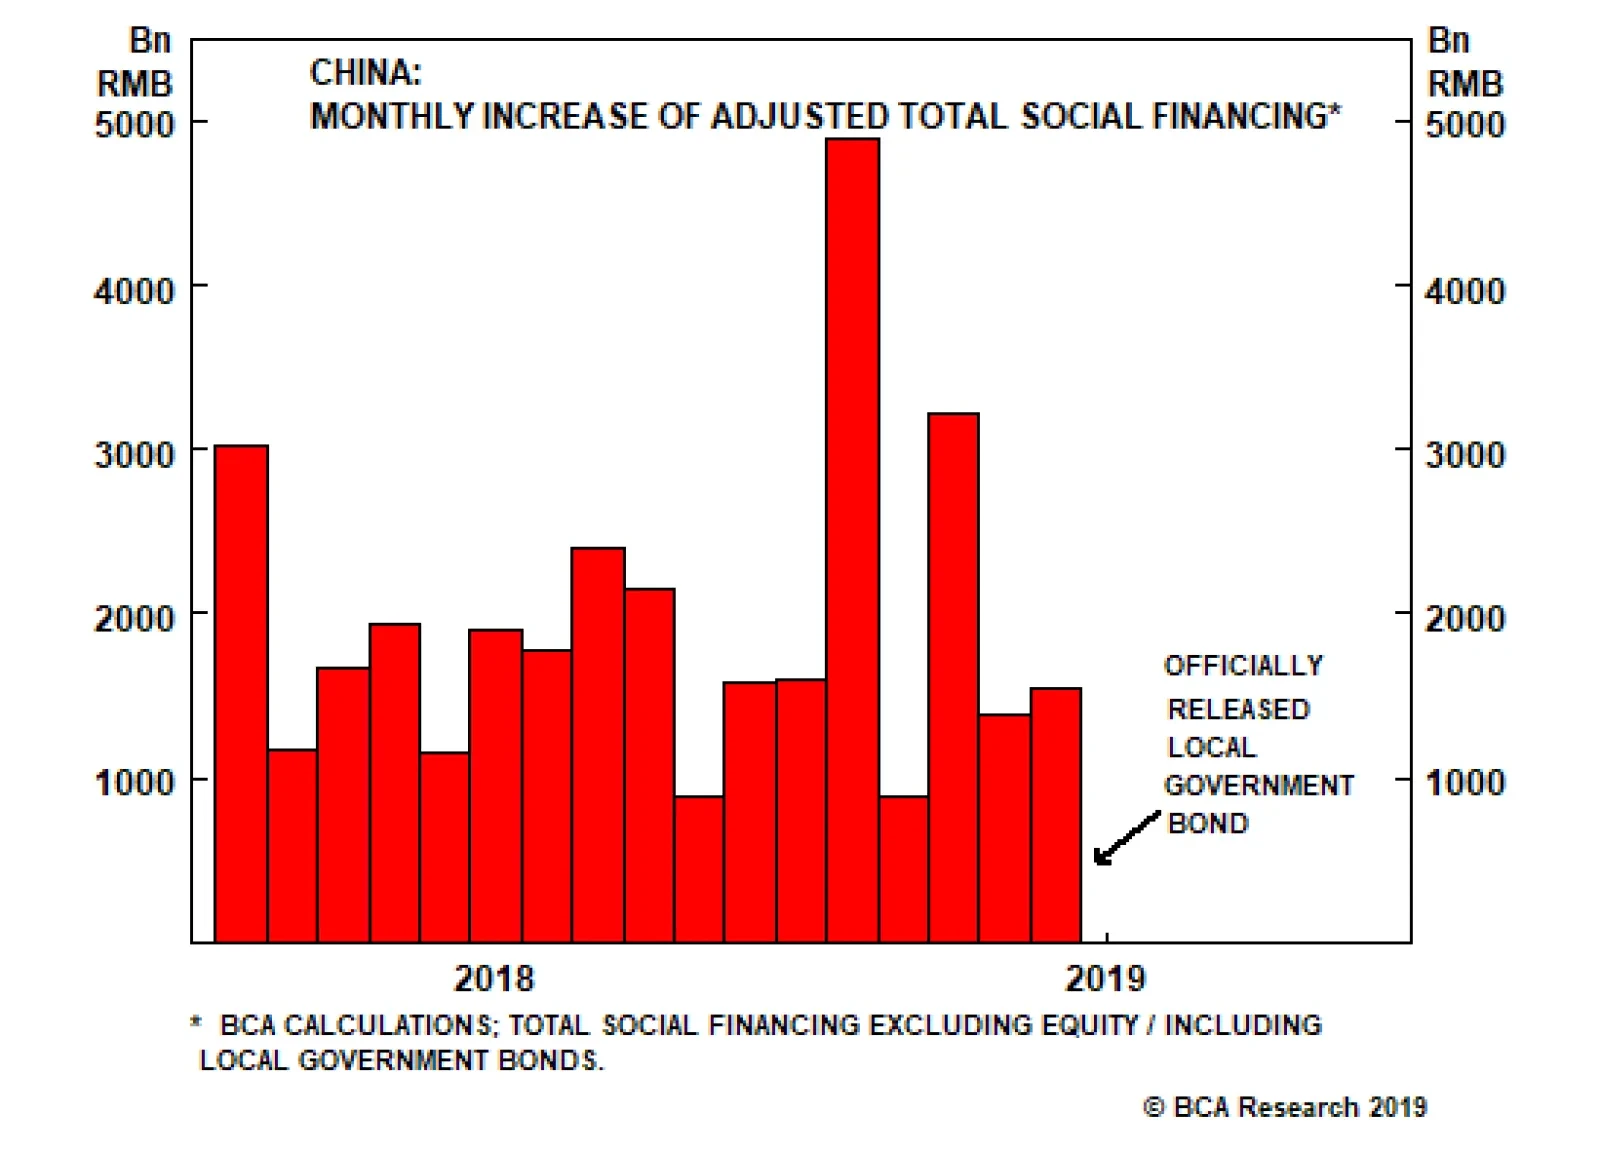
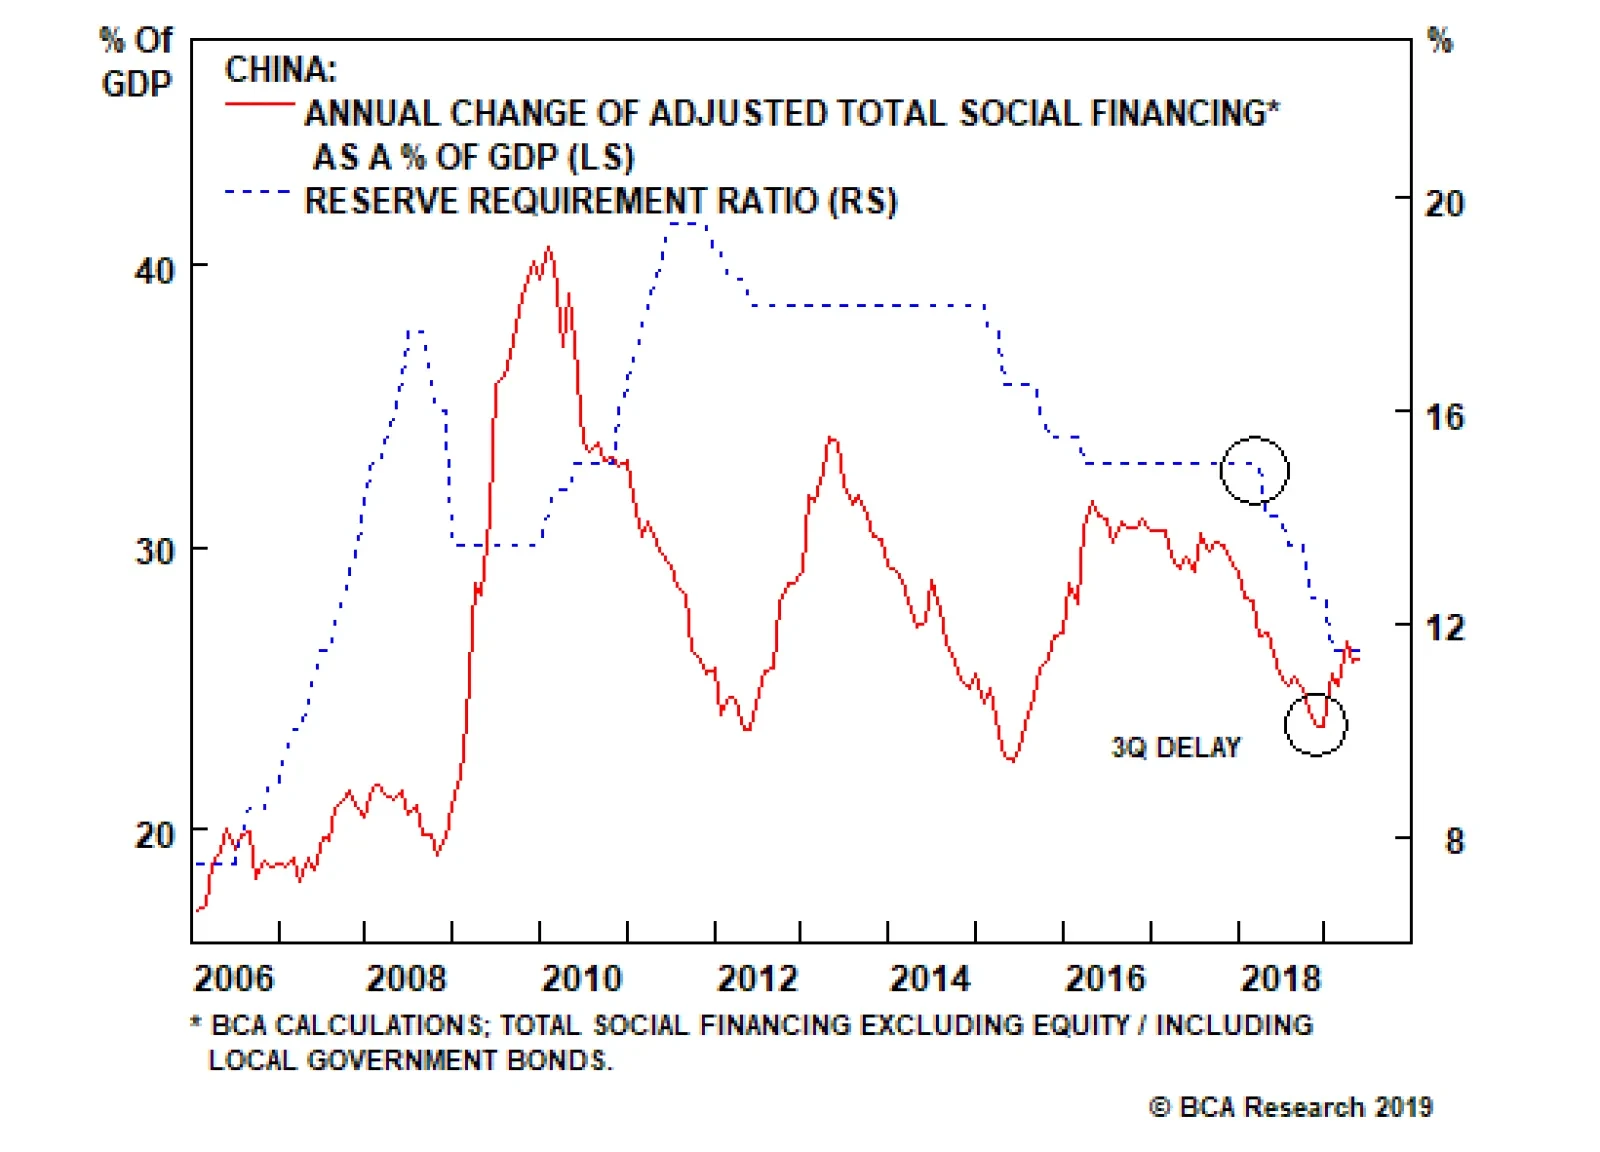
Arthur Budaghyan: To properly assess the economic outlook, one needs to understand what has caused the ongoing global trade/manufacturing downturn. One thing we know for certain: It originated in China, not the U.S. Chart 7 illustrates that Korean, Japanese, Taiwanese and Singaporean exports to China have been shrinking at an annual rate of 10%, while their shipments to the U.S. have been growing. China’s aggregate imports have also been contracting. This entails that from the perspective of the rest of the world, China has been and remains in recession. U.S. manufacturing is the least exposed to China, which is the main reason why it has been the last shoe to drop. Hence, the U.S. has lagged in this downturn, and one should not be looking to the U.S. for clues about a potential global recovery. We need to gauge what will turn Chinese demand around. In this regard, the rising credit and fiscal spending impulse is positive, but it has so far failed to kick start a recovery (Chart 8). The key reason has been a declining marginal propensity to spend among households and companies. Notably, the marginal propensity to spend of mainland companies leads industrial metals prices by a few months, and it currently continues to point south (Chart 8, bottom panel). The lack of willingness among Chinese consumers and enterprises to spend is due to several factors: (1) the U.S.-China confrontation; (2) high levels of indebtedness among both enterprises and households (Chart 9); (3) ongoing regulatory scrutiny over banks and shadow banking as well as local government debt; and (4) a lack of outright government subsidies for purchases of autos and housing. Chart 8 (ARTHUR)Stimulus Versus Marginal Propensity To Spend
Stimulus Versus Marginal Propensity To Spend
Stimulus Versus Marginal Propensity To Spend
Chart 9 (ARTHUR)Chinese Households Are More Leveraged Than U.S. Ones
Chinese Households Are Leveraged Than U.S. Ones
Chinese Households Are Leveraged Than U.S. Ones
On the whole, the falling marginal propensity to spend will all but ensure that any recovery in mainland household and corporate spending is delayed. Mathieu: Meanwhile, Peter, you have a much more optimistic stance. Why do you differ so profoundly with Arthur’s view? Peter: China’s deleveraging campaign began more than a year before global manufacturing peaked. I have no doubt that slower Chinese credit growth weighed on global capex, but we should not lose sight of the fact there are natural ebbs and flows at work. Most manufactured goods retain some value for a while after they are purchased. If spending on, say, consumer durable goods or business equipment rises to a high level for an extended period, a glut will form, requiring a period of lower production. Chart 10 (PETER)The Global Manufacturing Cycle Has Likely Reached A Bottom
The Global Manufacturing Cycle Has Likely Reached A Bottom
The Global Manufacturing Cycle Has Likely Reached A Bottom
These demand cycles typically last about three years; roughly 18 months on the way up, 18 months on the way down (Chart 10). The last downleg in the global manufacturing cycle began in early 2018, so if history is any guide, we are nearing a trough. The fact that U.S. manufacturing output rose in both May and June, followed by this week’s sharp rebound in the July Philly Fed Manufacturing survey, supports this view. Of course, extraneous forces could complicate matters. If trade tensions ratchet higher, this would weaken my bullish thesis. Nevertheless, with China stimulating its economy again, it would probably take a severe trade war to push the global economy into recession. Mathieu: Dhaval, you are not as negative as Arthur, but nonetheless expect a slowdown in the second half of the year. What is your rationale? Dhaval: To be clear, I am not forecasting a recession or major downturn – unless, as per my previous answer, the global 10-year bond yield approaches 2.5% and triggers a severe dislocation in global risk-assets. In fact, many people get the relationship between recession and financial market dislocation back-to-front: they think that the recession causes the financial market dislocation when, in most cases, the financial market dislocation causes the recession! Nevertheless, I do believe that European and global growth is entering a regular down-oscillation based on the following compelling evidence: From a low last summer, quarter-on-quarter GDP growth rates in the developed economies have already rebounded to the upper end of multi-year ranges. Short-term credit impulses in Europe, the U.S., and China are entering down-oscillations (Chart 11). The best current activity indicators, specifically the ZEW economic sentiment indicators, have rolled over. The outperformance of industrials – the equity sector most exposed to global growth – has also rolled over. Why expect a down-oscillation? Because it is the rate of decline in the bond yield that drove the rebound in growth after its low last summer. Furthermore, it is impossible for the rate of decline in the bond yield to keep increasing, or even stay where it is. Counterintuitively, if bond yields decline, but at a reduced pace, the effect is to slow economic growth. Mathieu: A positive and a negative view of the world logically result in bifurcated outlooks for interest rates and the dollar. Rob, how do you see U.S., German, and Japanese yields evolving over the coming 12 months? Rob: If global growth rebounds, U.S. Treasury yields will have far more upside than Bund or JGB yields. Inflation expectations should recover faster in the U.S., with the Fed taking inflationary risks by cutting rates with a 3.7% unemployment rate and core CPI inflation at 2.1%. The Fed is also likely to disappoint by delivering fewer rate cuts than are currently discounted by markets (90bps over the next 12 months). Treasury yields can therefore increase more than German and Japanese yields, with the ECB and BoJ more likely to deliver the modest rate cuts currently discounted in their yield curves (Chart 12). Chart 11 (DHAVAL)Short-Term Impulses Rebounded... But Are Now Rolling Over
Short-Term Impulses Rebounded... But Are Now Rolling Over
Short-Term Impulses Rebounded... But Are Now Rolling Over
Chart 12 (ROB)U.S. Treasuries Will Underperform Bunds & JGBs
U.S. Treasuries Will Underperform Bunds & JGBs
U.S. Treasuries Will Underperform Bunds & JGBs
Japanese yields will remain mired at or below zero over the next 6-12 months, as wage growth and core inflation remain too anemic for the BoJ to alter its 0% target on 10-year JGB yields. German yields have a bit more potential to rise if European growth begins to recover, but will lag any move higher in Treasury yields. That means that the Treasury-Bund and Treasury-JGB spreads will move higher over the next year. Negative German and Japanese yields may look completely unappetizing compared to +2% U.S. Treasury yields, but this handicap vanishes when all three yields are expressed in U.S. dollar terms. Hedging a 10-year German Bund or JGB into higher-yielding U.S. dollars creates yields that are 50-60bps higher than a 10-year U.S. Treasury. It is abundantly clear that German and Japanese bonds will outperform Treasuries over the next year if global growth recovers. Mathieu: Peter, your positive view on global growth means that the Fed will cut rates less than what is currently priced into the OIS curve. So why do you expect the dollar to weaken in the second half of 2019? Peter: What the Fed does affects interest rate differentials, but just as important is what other central banks do. The ECB is not going to raise rates over the next 12 months. However, if euro area growth surprises on the upside later this year, investors will begin to question the need for the ECB to keep policy rates in negative territory until mid-2024. The market’s expectation of where policy rates will be five years out tends to correlate well with today’s exchange rate. By that measure, there is scope for interest rate differentials to narrow against the U.S. dollar (Chart 13). Chart 13A (PETER)Interest Rate Expectations Against The U.S. Should Narrow (I)
Interest Rate Expectations Against The U.S. Should Narrow (I)
Interest Rate Expectations Against The U.S. Should Narrow (I)
Chart 13B (PETER)Interest Rate Expectations Against The U.S. Should Narrow (II)
Interest Rate Expectations Against The U.S. Should Narrow (II)
Interest Rate Expectations Against The U.S. Should Narrow (II)
Keep in mind that the U.S. dollar is a countercyclical currency, meaning that it moves in the opposite direction of global growth (Chart 14). This countercyclicality stems from the fact that the U.S. economy is more geared towards services than manufacturing compared with the rest of the world. Chart 14 (PETER)The Dollar Is A Countercyclical Currency
The Dollar Is A Countercyclical Currency
The Dollar Is A Countercyclical Currency
As such, when global growth accelerates, capital tends to flow from the U.S. to the rest of the world, translating into more demand for foreign currency and less demand for dollars. If global growth picks up in the remainder of the year, as I expect, the dollar will weaken. Mathieu: Arthur, as you are significantly more negative on growth than either Rob or Peter, how do you see the dollar and global yields evolving over the coming six to 12 months? Arthur: I am positive on the trade-weighted U.S. dollar for the following reasons: The U.S. dollar is a countercyclical currency – it exhibits a negative correlation with the global business cycle. Persistent weakness in the global economy emanating from China/EM is positive for the dollar because the U.S. economy is the major economic block least exposed to a China/EM slowdown. Meanwhile, the greenback is only loosely correlated with U.S. interest rates. Thereby, the argument that lower U.S. rates will drive the value of the U.S. currency much lower is overemphasized. The Federal Reserve will cut rates by more than what is currently priced into the market only in a scenario of a complete collapse in global growth. Yet this scenario would be dollar bullish. In this case, the dollar’s strong inverse relationship with global growth will outweigh its weak positive relationship with interest rates. Contrary to consensus views, the U.S. dollar is not very expensive. According to unit labor costs based on the real effective exchange rate – the best currency valuation measure – the greenback is only one standard deviation above its fair value. Often, financial markets tend to overshoot to 1.5 or 2 standard deviations below or above their historical mean before reversing their trend. One of the oft-cited headwinds facing the dollar is positioning, yet there is a major discrepancy between positioning in DM and EM currencies versus the U.S. dollar. In aggregate, investors – asset managers and leveraged funds – have neutral exposure to DM currencies, but they are very long liquid EM exchange rates such as the BRL, MXN, ZAR and RUB versus the greenback. The dollar strength will occur mostly versus EM and commodities currencies. In other words, the euro, other European currencies and the yen will outperform EM exchange rates. I have less conviction on global bond yields. While global growth will disappoint, yields have already fallen a lot and the U.S. economy is currently not weak enough to justify around 90 basis points of rate cuts over the next 12 months. Mathieu: Before we move on to investment recommendations, Anastasios, you have done a lot of interesting work on the outlook for U.S. profits. What is the message of your analysis? Chart 15 (ANASTASIOS)Gravitational Pull
Gravitational Pull
Gravitational Pull
Anastasios: While markets cheered the trade truce following the recent G-20 meeting, no tariff rollback was agreed. Since the tariff rate on $200bn of Chinese imports went up from 10% to 25% on May 10, odds are high that manufacturing will remain in the doldrums. This will likely continue to weigh on profits for the remainder of the year. Profit growth should weaken further in the coming six months. Periods of falling manufacturing PMIs result in larger negative earnings growth surprises as market forecasters rarely anticipate the full breadth and depth of slowdowns. Absent profit growth, equity markets lack the necessary ‘oxygen’ for a durable high-quality rally. Until global growth momentum turns, investors should fade rallies. Our four-factor SPX EPS growth model is flirting with the contraction zone. In addition, our corporate pricing power proxy and Goldman Sachs’ Current Activity Indicator both send a distress signal for SPX profits (Chart 15). Already, more than half of the S&P 500 GICS1 sectors’ profits are estimated to have contracted in Q2, and three sectors could see declining revenues on a year-over-year basis, according to I/B/E/S data. Q3 depicts an equally grim profit picture that will also spill over to Q4. Adding it all up, profits will underwhelm into year-end. Mathieu: Doug, you do not share Anastasios’s anxiety. What offsets do you foresee? Moreover, you are not concerned by the U.S. corporate balance sheets. Can you share why? Doug Peta: As it relates to earnings, we foresee offsets from a revival in the rest of the world. Increasingly accommodative global monetary policy and reviving Chinese growth will give global ex-U.S. economies a boost. That inflection may go largely unnoticed in U.S. GDP, but it will help the S&P 500, as U.S.-based multinationals’ earnings benefit from increased overseas demand and a weaker dollar. When it comes to corporate balance sheets, shifting some of the funding burden to debt from equity when interest rates are at generational lows is a no-brainer. Even so, non-financial corporates have not added all that much leverage (Chart 16). Low interest rates, wide profit margins and conservative capex have left them with ample free cash flow to service their obligations (Chart 17). Chart 16 (DOUG)Corporations Have Not Added Much Leverage ...
Corporations Have Not Added Much Leverage ...
Corporations Have Not Added Much Leverage ...
Chart 17 (DOUG)...Though They Have Ample Cash Flow To Service It
...Though They Have Ample Cash Flow To Service It
...Though They Have Ample Cash Flow To Service It
Every single viable corporate entity with an effective federal tax rate above 21% became a better credit when the top marginal rate was cut from 35% to 21%. Every such corporation now has more net income with which to service debt, and will have that income unless the tax code is revised. You can’t see it in EBITDA multiples, but it will show up in reduced defaults. Mathieu: The last, and most important question. What are each of your main investment recommendations to capitalize on the economic trends you anticipate over the coming 6-12 months? Let’s start with the pessimists: Arthur: First, the rally in global cyclicals and China plays since December has been premature and is at risk of unwinding as global growth and cyclical profits disappoint. Historical evidence suggests that global share prices have not led but have actually been coincident with the global manufacturing PMI (Chart 18). The recent divergence is unprecedented. Chart 18 (ARTHUR)Global Stocks Historically Did Not Lead PMIs
Global Stocks Historically Did Not Lead PMIs
Global Stocks Historically Did Not Lead PMIs
Second, EM risk assets and currencies remain vulnerable. EM and Chinese earnings per share are shrinking. The leading indicators signal that the rate of contraction will deepen, at least the end of this year (Chart 19). Asset allocators should continue underweighting EM versus DM equities. Finally, my strongest-conviction, market-neutral trade is to short EM or Chinese banks and go long U.S. banks. The latter are much healthier than EM/Chinese ones, as we discussed in our recent report.6 Anastasios: The U.S. Equity Strategy team is shifting away from a cyclical and toward a more defensive portfolio bent. Our highest conviction view is to overweight mega caps versus small caps. Small caps are saddled with debt and are suffering a margin squeeze. Moreover, approximately 600 constituents of the Russell 2000 have no forward profits. Only one S&P 500 company has negative forward EPS. Given that both the S&P and the Russell omit these figures from the forward P/E calculation, this is masking the small cap expensiveness. When adjusted for this discrepancy, small caps are trading at a hefty premium versus large caps (Chart 20). Chart 19 (ARTHUR)China And EM Profits Are Contracting
China And EM Profits Are Contracting
China And EM Profits Are Contracting
Chart 20 (ANASTASIOS)Continue To Avoid Small Caps
Continue To Avoid Small Caps
Continue To Avoid Small Caps
We have also upgraded the S&P managed health care and the S&P hypermarkets groups. If the economic slowdown persists into early 2020, both of these defensive subgroups will fare well. In mid-April, we lifted the S&P managed health care group to an above benchmark allocation and posited that the selloff in this group was overdone as the odds of “Medicare For All” becoming law were slim. Moreover, a tight labor market along with melting medical cost inflation would boost the industry’s margins and profits (Chart 21). This week, we upgraded the defensive S&P hypermarkets index to overweight arguing that the souring macro landscape coupled with a firming industry demand outlook will support relative share prices (Chart 22). Chart 21 (ANASTASIOS)Buy Hypermarkets
Buy Hypermarkets
Buy Hypermarkets
Chart 22 (ANASTASIOS)Stick With Managed Health Care
Stick With Managed Health Care
Stick With Managed Health Care
Dhaval: To be fair, I am not a pessimist. Provided the global bond yield stays well below 2.5 percent, the support to risk-asset valuations will prevent a major dislocation. But in a growth down-oscillation, the big game in town will be sector rotation into pro-defensive investment plays, especially into those defensives that have underperformed (Chart 23). Chart 23 (DHAVAL)Switch Out Of Growth-Sensitives Into Healthcare
Switch Out Of Growth-Sensitives Into Healthcare
Switch Out Of Growth-Sensitives Into Healthcare
On this basis: Overweight Healthcare versus Industrials. Overweight the Eurostoxx 50 versus the Shanghai Composite and the Nikkei 225. Overweight U.S. T-bonds versus German bunds. Overweight the JPY in a portfolio of G10 currencies. Mathieu: And now, the optimists: Doug: So What? is the overriding question that guides all of BCA’s research: What is the practical investment application of this macro observation? But Why Now? is a critical corollary for anyone allocating investment capital: Why is the imbalance you’ve observed about to become a problem? As Herbert Stein said, “If something cannot go on forever, it will stop.” Imbalances matter, but Dornbusch’s Law counsels patience in repositioning portfolios on their account: “Crises take longer to arrive than you can possibly imagine, but when they do come, they happen faster than you can possibly imagine.” Look at Chart 24, which shows a vast white sky (bull markets) with intermittent clusters of gray (recessions) and light red (bear markets) clouds. Market inflections are severe, but uncommon. When the default condition of an economy is to grow, and equity prices to rise, it is not enough for an investor to identify an imbalance, s/he also has to identify why it’s on the cusp of reversing. Right now, as it relates to the U.S., there aren’t meaningful imbalances in either markets or the real economy. Chart 24 (DOUG)Recessions And Bear Markets Travel Together
Recessions And Bear Markets Travel Together
Recessions And Bear Markets Travel Together
Even if we had perfect knowledge that a recession would arrive in 18 months, now would be way too early to sell. The S&P 500 has historically peaked an average of six months before the onset of a recession, and it has delivered juicy returns in the year preceding that peak (Table 1). Bull markets tend to sprint to the finish line (Chart 25). If this one is like its predecessors, an investor risks significant relative underperformance if s/he fails to participate in its go-go latter stages. Table 1 (DOUG)The S&P 500 Doesn’t Peak Until Six Months Before A Recession …
What Goes On Between Those Walls? BCA’s Diverging Views In The Open
What Goes On Between Those Walls? BCA’s Diverging Views In The Open
Chart 25
We are bullish on the outlook for the next six to twelve months, and recommend overweighting equities and spread product in balanced U.S. portfolios while significantly underweighting Treasuries. Peter: I agree with Doug. Equity bear markets seldom occur outside of recessions and recessions rarely occur when monetary policy is accommodative. Policy is currently easy, and will get even more stimulative if the Fed and several other central banks cut rates. Global equities are not super cheap, but they are not particularly expensive either. They currently trade at about 15-times forward earnings. Given the ultra-low level of global bond yields, this generates an equity risk premium (ERP) that is well above its historical average (Chart 26). One should favor stocks over bonds when the ERP is high. Chart 26A (PETER)Equity Risk Premia Remain Elevated (I)
Equity Risk Premia Remain Elevated (I)
Equity Risk Premia Remain Elevated (I)
Chart 26B (PETER)Equity Risk Premia Remain Elevated (II)
Equity Risk Premia Remain Elevated (II)
Equity Risk Premia Remain Elevated (II)
The ERP is especially elevated outside the United States. This is partly because non-U.S. stocks trade at a meager 13-times forward earnings, but it also reflects the fact that bond yields are lower overseas. Chart 27 (PETER)EM And Euro Area Equities Outperform When Global Growth Improves
EM And Euro Area Equities Outperform When Global Growth Improves
EM And Euro Area Equities Outperform When Global Growth Improves
As global growth accelerates, the dollar will weaken. Equity sectors and regions with a more cyclical bent will benefit (Chart 27). We expect to upgrade EM and European stocks later this summer. A softer dollar will also benefit gold. Bullion will get a further boost early next decade when inflation begins to accelerate. We went long gold on April 17, 2019 and continue to believe in this trade. Rob: For fixed income investors, the most obvious way to play a combination of monetary easing and recovering global growth is to overweight corporate debt versus government bonds (Chart 28). Within the U.S., corporate bond valuations look more attractive in high-yield over investment grade. Assuming a benign outlook for default risk in a reaccelerating U.S. economy, with the Fed easing, going for the carry in high-yield looks interesting. Emerging market credit should also do well if we see a bit of U.S. dollar weakness and additional stimulus measures in China. Chart 28 (ROB)Best Bond Bets: Overweight Global Corporates & Inflation-Linked Bonds
Best Bond Bets: Overweight Global Corporates & Inflation-Linked Bonds
Best Bond Bets: Overweight Global Corporates & Inflation-Linked Bonds
European corporates, however, may end up being the big winner if the ECB chooses to restart its Asset Purchase Program and ramps up its buying of European company debt. There are fewer restrictions for the ECB to buy corporates compared to the self-imposed limits on government bond purchases. The ECB would be entering a political minefield if it chose to buy more Italian debt and less German debt, but nobody would mind if the ECB helped finance European companies by buying their bonds. If one expects reflation to be successful, a below-benchmark stance on portfolio duration also makes sense given the current depressed level of government bond yields worldwide. Yields are more likely to grind upward than spike higher, and will be led first by increasing inflation expectations. Inflation-linked bonds should feature prominently in fixed income portfolios, especially in the U.S. where TIPS will outperform nominal yielding Treasuries. Mathieu: Thank you very much to all of you. Below is a comparative summary of the main arguments and investment recommendations of each camp. Summary Of Views And Recommendations
What Goes On Between Those Walls? BCA’s Diverging Views In The Open
What Goes On Between Those Walls? BCA’s Diverging Views In The Open
What Goes On Between Those Walls? BCA’s Diverging Views In The Open
What Goes On Between Those Walls? BCA’s Diverging Views In The Open
Anastasios Avgeriou U.S. Equity Strategist anastasios@bcaresearch.com Peter Berezin Chief Global Strategist peterb@bcaresearch.com Arthur Budaghyan Chief Emerging Markets Strategist arthurb@bcaresearch.com Dhaval Joshi Chief European Investment Strategist dhaval@bcaresearch.com Doug Peta Chief U.S. Investment Strategist dougp@bcaresearch.com Robert Robis Chief Fixed Income Strategist rrobis@bcaresearch.com Mathieu Savary The Bank Credit Analyst mathieu@bcaresearch.com Footnotes 1 To be fair to each individual involved, this is simplifying their views. Even within each camp, the negativity or positivity ranges on a spectrum, as you will be able to tell from the debate itself. 2 Please see BCA U.S. Equity Strategy Weekly Report, “Signal Vs. Noise,” dated December 17, 2018, available at uses.bcaresearch.com. 3 Please see BCA U.S. Equity Strategy Weekly Report, “A Recession Thought Experiment,” dated June 10, 2019, available at uses.bcaresearch.com. 4 Please see the European Investment Strategy Weekly Report “Risk: The Great Misunderstanding Of Finance,” October 25, 2018 available at eis.bcaresearch.com. 5 France is a good proxy for the euro area. 6 Please see Emerging Markets Strategy Weekly Report, “On Chinese Banks And Brazil,” available at ems.bcaresearch.com.
Highlights So What? U.S. policy uncertainty adds to a slew of geopolitical reasons to remain tactically cautious on risk assets. Why? U.S. fiscal policy should ultimately bring market-positive developments – though the budget negotiation process could induce volatility in the near-term. We expect spending to go up and do not expect a default due to the debt ceiling or another prolonged government shutdown. Former Vice President Joe Biden remains the frontrunner for the Democratic Party’s presidential nomination in 2020. But left-wing progressive candidates are gaining on him and their success will trouble financial markets. With Persian Gulf tensions still elevated, go long Q1 2020 Brent crude relative to Q1 2021. Feature Chart 1U.S. Politics Poses Risks Through Next November
U.S. Politics Poses Risks Through Next November
U.S. Politics Poses Risks Through Next November
Economic policy uncertainty is rising in the United States even as it falls around the world (Chart 1). Ongoing budget negotiations and the Democratic primary election give equity investors another reason to remain cautious in the near term. We expect more volatility. There also remain several persistent global threats to markets posed by unresolved geopolitical risks – rising Brexit risks with Boris Johnson likely to take the helm in the United Kingdom; oil supply threats amid Iran’s latest rejection of U.S. offers to negotiate its missile program; and a major confirmation of our theme of geopolitical risk rotation to East Asia, with Japan, South Korea, Hong Kong, Taiwan, and the South China Sea all heating up at once. In sum, political and geopolitical risks are showing investors a yellow light, even though the macroeconomic outlook still supports BCA’s cyclical (12-month) equity overweight. U.S. Fiscal Policy Will Remain Accommodative While U.S. monetary policy has taken a dovish turn – supported by other central banks – fiscal spending is now coming into focus for investors. We expect the budget battle to be market-relevant this year, injecting greater economic policy uncertainty, but the end-game should be market-positive. Brinkmanship will not get as bad as during the debt ceiling crises of 2011 and 2013, though market jitters will be frontloaded if Pelosi and the White House fail to conclude a deal immediately. Chart 2The 'Stimulus Cliff' Awaits President Trump
The 'Stimulus Cliff' Awaits President Trump
The 'Stimulus Cliff' Awaits President Trump
The U.S. budget process is always rocky and is usually concluded well into the fiscal year under discussion. This year the fight will be more important than over the past few years because, as the two-year bipartisan agreement of 2018 lapses, the so-called “stimulus cliff” looms over the U.S. economy and will get caught up in the epic battle over the 2020 election. The stimulus cliff is the automatic imposition of fiscal spending cuts (“sequestration”) in FY2020 that would take effect as a result of the Budget Control Act of 2011. Standard estimates of the U.S. budget deficit expect that the deficit will shrink in 2020 if the spending caps are not raised, resulting in a negative fiscal thrust (Chart 2). The result would be to decrease aggregate demand at a time when the risk of recession is relatively high (Chart 3). Chart 3Recession Odds Still High Over Next 12 Months
Recession Odds Still High Over Next 12 Months
Recession Odds Still High Over Next 12 Months
This is clearly not in President Trump’s interest, since a recession would devastate his reelection odds. Hence, Treasury Secretary Steve Mnuchin and other White House officials are pushing for a budget deal before the House of Representatives goes on recess on July 26 and the Senate on August 2. Ideally, an agreement would raise the spending caps, appropriate funds for the rest of the budget, and lift the “debt ceiling,” the statutory limit on U.S. debt. But it would be surprising if a deal came together as early as next week. A failure to agree on a budget deal before Congress goes on recess will make the market increasingly jittery. Congress can cancel the August recess, or wait until September 9 when they reconvene, but a failure to agree on something between now and then will make the market increasingly jittery. The U.S. has already surpassed the current debt limit and the latest estimates suggest that the Treasury Department’s “extraordinary measures” to meet U.S. debt payments could be exhausted by early-to-mid September.1 This would give Congress only a week in September to raise the debt limit. There are three main reasons to expect that the debt ceiling fight will not get out of hand: Chart 4Americans Stopped Worrying And Love Debt
Americans Stopped Worrying And Love Debt
Americans Stopped Worrying And Love Debt
First, a technical default on U.S. debt could result in a failure to meet politically explosive obligations, such as sending social security checks to seniors. No one in Washington would benefit from such a failure and President Trump would suffer the most. Second, the public is not as worried about national deficits and debt today as it was in the aftermath of the financial crisis (Chart 4). Democrats, as the pro-government party, do not have an incentive to stage a showdown over the debt like Tea Party Republicans did under the previous administration. To be fair, they did do so in January 2018, but backed off after merely two days due to high political costs. Third, the one budget conflict that could create a catastrophic impasse – funding for Trump’s border wall – can be assuaged by Trump’s use of executive action, as he demonstrated by declaring a national emergency and appropriating military funds for fencing. Trump is fighting a general election in 2020 and is unlikely to use the debt ceiling as leverage to the point that the U.S. defaults on its obligations. The risk to investors, however, is that he goes back to threatening a 25% tariff on Mexico if it fails to staunch the flow of immigrants from Central America. What if the Republicans and Democrats cannot agree on the budget and spending caps? Democrats say they will not raise the debt limit unless they get non-defense spending increases. House Democrats need to reward their constituents for voting for them in 2018 and want to increase non-defense spending at “parity” with increases to defense spending. They also want to reduce the defense increases that Republicans seek in order to pay for non-defense increases. President Trump and the Republicans have a higher defense target and a lower non-defense target. The truth is that the Republicans and Democrats have agreed three times to increase spending caps beyond the levels required under the 2011 law – and they have done so most emphatically under President Trump with the FY2018-19 agreement (Chart 5). This year the two parties stand about $17 billion apart on defense and $30 billion apart on non-defense spending.2 We would expect both sides to splurge on spending and get what they want, but they could also split the difference: the amounts are small but the acrimony between the two parties could extend the talks. Congress may have to pass one or more “continuing resolutions” (stopgap measures keeping spending levels constant) to negotiate further. A continuing resolution could at least raise the debt ceiling and leave the rest of the budget negotiation until later, removing the majority of the political risk under discussion.
Chart 5
Chart 6
Is another government shutdown possible? Yes, but not to the extent of early 2019. Trump saw a sharp drop in his approval ratings during the longest-ever government shutdown last year (Chart 6). Brinkmanship could lead to another shutdown, but he is likely to capitulate before it becomes prolonged. In early 2020, he wants to be lobbing grenades into the Democratic primary election rather than giving all of the Democrats an easy chance to criticize him for dysfunction in Washington. Ultimately, Trump can simply refrain from vetoing whatever the House and Senate agree – it is not in his interest to shrink the budget deficit in an election year. The Democrats’ spending increases would boost aggregate demand and are thus in President Trump’s personal interest. Trump is the self-professed “king of debt” – he is not afraid to agree to a deal that will be criticized by fiscal hawks. The latter have far less influence in Congress anyway since the 2018 midterm election. Why should House Democrats extend the economic expansion knowing that it would likely improve President Trump’s reelection chances? Because Trump will capitulate to most of their spending demands; voters would punish them if they are seen deliberately engineering “austerity”; and they need to show voters that they can govern. As for the 2020 race, they will focus on other issues: they will attack Trump on trade and immigration and focus on social policy: health care, the minimum wage, taxes and inequality, climate change, and student debt. What will be the fiscal and economic impact of a budget deal? The budget deal under negotiation ($750 billion in defense discretionary spending, $639 billion in non-defense discretionary spending) would raise the spending cap by about $145 billion – this is slightly above the $112 billion negative fiscal thrust expected in 2020.3 The result is that the U.S. fiscal drag expected in 2020 will at least be eliminated (if not turned into a fiscal boost), helping to prolong the cycle. The removal of fiscal drag will coincide with monetary easing, which is positive for markets since inflation is subdued. The Federal Reserve abandoned rate hikes this year (after four last year) because of the asymmetric risk of deflation relative to inflation (Chart 7). The FOMC believes that they can always jack up interest rates to combat an inflation overshoot, as their predecessors did in the 1980s, but that they are constrained by the zero lower-bound in interest rates. They may never recover from a loss of credibility and collapse of inflation expectations, so an insurance policy is necessary. The result is likely to be one or two rate cuts this year, which has already improved financial conditions. Chart 7The Fed Fears The Asymmetric Threat Of Deflation
The Fed Fears The Asymmetric Threat Of Deflation
The Fed Fears The Asymmetric Threat Of Deflation
Bottom Line: Budget brinkmanship could become a near-term source of volatility but it is ultimately likely to be resolved with the pro-market outcome of less fiscal drag in 2020. The debt ceiling debate is unlikely to result in a U.S. default and any government shutdown is likely to resemble the short one of 2018 more than the long one of 2019. We expect U.S. equities to grind higher over the 12-month cyclical horizon, but we remain exceedingly cautious on a three-month tactical horizon. The price of Trump’s capitulation on border funding could be a renewed threat of tariffs against Mexico. The Budget Deal, Geopolitics, And The Dollar Chart 8China Shifts From Reform To Stimulus
China Shifts From Reform To Stimulus
China Shifts From Reform To Stimulus
What does this fiscal outlook imply for the U.S. dollar? Near-term moves will probably be negative, since the fiscal boost outlined above will not be comparable to 2018-19, and meanwhile our view on China’s stimulus is bearing out reasonably well (Chart 8). Improvements in global growth, Fed cuts, and rising oil prices will weigh on the greenback even though later we expect the dollar to recover on the back of renewed U.S.-China conflict and global recession in 2021 or thereafter. Beyond the recession, two of our major political and geopolitical themes continue to point to large downside risk to the dollar: populist politics and multipolarity, or geopolitical competition among the world’s great powers. Beyond the recession, two of our major political and geopolitical themes continue to point to large downside risk to the dollar: populist politics and multipolarity. Populism and the Fed: Domestically, the United States is seeing a rise in populism that is continuing across administrations and political parties. This is conducive to easier monetary policy. Left-wing firebrand Alexandria Ocasio-Cortez’s (AOC) recent exchange with Fed Chairman Jay Powell highlights the trend. AOC asked one of the most frequent questions that BCA’s clients ask: Does the Phillips Curve still work? Powell answered that in recent years it has not. President Trump’s Economic Director Larry Kudlow applauded AOC, saying “she kind of nailed that” (obviously the administration is pushing for lower rates). If inflation is not a risk, monetary policy need not guard against it. This interchange should be taken in the context of President Trump’s attempts to jawbone Powell into rate cuts and the notable monetary promiscuousness of his ostensibly “hard money” Federal Reserve nominees. The extremely different ideological and institutional profiles of these various policymakers suggests that a new consensus is forming that is conducive to more dovish monetary policy than otherwise expected over the long run. Populists of any stripe, from Trump to AOC, would like to see lower interest rates, higher nominal GDP growth, and a lower real debt burden on households. We are reminded of an oft-overlooked point about the stagflation of the 1970s. Fed Chair Arthur Burns is usually depicted as a lackey of President Richard Nixon who succumbed to political influence and failed to raise interest rates adequately to fight inflation. But this is only part of the story. Leaving aside that the Fed only had a single mandate of minimizing unemployment at that time, Burns was conflicted. He saw the need to fight inflation, but he had more than Nixon’s wrath to fear. He also dreaded the impact on the Fed’s credibility and popular support as an institution if he hiked rates too aggressively and stoked unemployment (Chart 9).4 Chart 9Rate Hikes Are Hard To Defend Amid High Unemployment
Rate Hikes Are Hard To Defend Amid High Unemployment
Rate Hikes Are Hard To Defend Amid High Unemployment
In other words, populism can constrain the Fed from the bottom up as well as from the top down in a context of rising unemployment.5 Multipolarity and Currency War: Since President Trump’s election we have highlighted that dollar depreciation is likely to be the administration’s ultimate aim if President Trump’s overall economic strategy is truly to stimulate growth, reduce the trade deficit, and repatriate manufacturing. Jacking up growth rates relative to the rest of the world while disrupting global trade via tariffs is a recipe for a strong dollar that undermines the attempt to bring jobs back from overseas. We have always argued that China would not grant the U.S. “shock therapy” liberalization and market opening – and that neither China, nor Europe, nor Japan would or could engage in currency appreciation along the lines of a new Smithsonian or Plaza Accord. The U.S. does not have as much geopolitical clout as it had in the 1970s-80s when it forced major currency deals on its allies and partners. The remaining option is for the U.S. to attempt unilateral depreciation. The combination of profligate spending, easy monetary policy, and populism may do the trick. But it is also possible that President Trump will attempt to engineer depreciation through Treasury Department intervention. If a slide toward recession threatens his reelection – or he is reelected and hence gets rid of the first-term reelection constraint – his unorthodox policies pose a significant risk to the dollar. Bottom Line: The U.S. dollar faces near-term risks as growth rebalances towards rest of the world, but will probably resume its rise in the impending recessionary environment and expected re-escalation of tensions with China. Over the long run, it faces severe risks due to fiscal mismanagement, domestic populism, and geopolitical struggle. A Progressive Overshoot Will Hurt Democrats … And Equities Chart 10A Democratic Win Will Weigh On Animal Spirits
A Democratic Win Will Weigh On Animal Spirits
A Democratic Win Will Weigh On Animal Spirits
The Democratic Party’s primary election is also a risk to the equity rally. We see a 45% risk that President Trump will be unseated in November 2020 and hence that the U.S. will once again experience a dramatic policy reversal (as in 2000, 2008, and 2016). The risks are to the downside because the market is at all-time highs and Democratic proposals include raising taxes on corporations and re-regulating the economy (Chart 10). Whether you accept our 55% odds of Trump reelection, the race will be a continual source of uncertainty for investors going forward. How extreme is the uncertainty? Former Vice President Joe Biden remains the frontrunner in the race, though he has lost his initial bump in opinion polls (Chart 11). Biden’s success is market-positive relative to the other Democratic candidates since he is an establishment politician and a known quantity. Given his age, a Biden presidency would likely last for one term and focus on repudiating Trumpism and consolidating the Obama administration’s signature achievements (the Affordable Care Act, Dodd-Frank, the Joint Comprehensive Plan of Action, environmental regulation, etc). Greater predictability in the health care sector and a return to lower-level tensions with Iran would be market-positive. The financial sector would be consoled by the fact that nothing worse than Dodd-Frank would be in the offing.
Chart 11
A Biden victory would be more likely to yield Democratic control of the senate than a progressive candidate’s victory.6 This means that the risk of Democrats taking full control of government and passing more than one major piece of legislation after 2020 increases with Biden. Yet any candidate capable of defeating Trump is likely to take the senate in our view; and Biden’s legislative initiatives are likely to be more centrist.7 So as long as Biden remains in the lead in primary polling, he increases his chances of winning the nomination, maximizes the 45% chance of Democrats winning the White House, and decreases the intensity of the relative policy uncertainty facing markets. The risk to the Democrats is … a left-wing or progressive overshoot that knocks out Biden in the primary, replacing him with a progressive candidate who may not be as electable in the general election.
Chart 12
The risk to the Democrats is that the leftward policy shift within the party (Chart 12) may lead to a left-wing or progressive overshoot that knocks out Biden in the primary, replacing him with a progressive candidate who may not be as electable in the general election. This would give President Trump the ability to capitalize on his advantage as the incumbent by inveighing against socialism. Most of the major progressive candidates are electable – they have a popular and electoral path to the White House – as revealed by their successful head-to-head polling against Trump in battleground state opinion polling (Chart 13). But these pathways are narrower than Biden’s. Biden is the only candidate whose name has been on the ballot in two presidential elections carrying the critical Rust Belt swing states Michigan, Pennsylvania, and Wisconsin (not to mention Ohio and Florida). He is from Pennsylvania. And he is more competitive than most of his rivals in the American south and southwest, giving him the potential to pick up Florida or Arizona in the general election. But none of this matters if Biden cannot win the Democratic nomination first.
Chart 13
The risk of a progressive overshoot is growing at present. Biden is losing his lead in the primary polling, as mentioned. Progressive candidates taken together are polling better than centrists, contrary to previous Democratic primaries (Chart 14). This is true even if we define centrists broadly, for instance to include Buttigieg (Chart 15). Biden is in a weaker position than Hillary Clinton in 2007 – and the more progressive candidate Obama ultimately defeated her (Chart 16). Biden has now slipped to second place in one national poll and some state polls.
Chart 14
The second round of Democratic debates on July 30-31 will be a critical testing period for whether Biden can maintain frontrunner status. The first round fulfilled our expectation of boosting the progressives at his expense, especially Elizabeth Warren. It surprised us in dealing a blow to the campaign of Bernie Sanders, the independent Senator from Vermont who initiated the progressive left’s surge with his hard-fought race against Hillary Clinton in 2016.
Chart 15
Chart 16
Sanders is more competitive than the other progressives in the Rust Belt, and in the general election, based on his head-to-head polling against Trump. Yet he has fallen behind in recent Democratic primary polling, ceding ground to Warren, Harris, and Buttigieg, who are all his followers in some sense. The second debate is a critical opportunity for him to arrest the loss of momentum. Otherwise he is likely to be fatally wounded: a collapse in polling beneath his floor of about 15%, and relative to other progressives, despite extensive name recognition, will make it very difficult for him to recover in the third round of debates in September. His votes will go toward other progressives, particularly Buttigieg – the other white male progressive-leaning candidate who is competitive in the Midwest.8 Our 55% base case that Trump is reelected rests on the high historical reelection rate for incumbents, particularly in the event of no recession during the first term – yet discounted due to Trump’s relatively low nationwide popularity, as it is reminiscent of a president in a recessionary environment (Chart 17). Trump has his ideological base more fired up than Obama did (Chart 18), which helps drive voter turnout, although as a result he risks losing support from the rest of the population. Still, Trump’s approval rating is in line with Obama’s at this stage in his first term. As long as the economy holds up and Trump does not suffer a foreign policy humiliation, he should be seen as a slight favorite.
Chart 17
Chart 18
A Trump victory is not positive for risk assets, aside from a relief rally on policy continuity. This is because in a second term he cannot reproduce the same magnitude of pro-market effects (huge tax cuts and deregulation) yet, freed from the need for reelection, he has fewer political constraints in producing higher magnitude anti-market effects (tariffs and/or sanctions on China, Iran, Russia, and possibly the EU and Mexico). This view dovetails with the BCA House View which remains overweight equities relative to bonds and cash over a cyclical (12 month) horizon but underweight over the longer run with the expectation that a recession will loom. Bottom Line: The Democratic Primary election should start having an impact on markets – the general election is likely to be too close for market participants to have a high conviction, driving up uncertainty. Uncertainty will be especially pronounced if, and as, leftwing or progressive candidates outperform in the primary races and poll well against Trump in the general election. This dynamic is negative for business sentiment and the profit outlook, especially if Biden’s polling falls further in the wake of the second debate. Investment Conclusions We recommend staying long JPY-USD, long gold, and short CNY-USD. We remain overweight Thai equities within emerging markets, a defensive play. And we would not close our tactical overweight in health care sector and health care equipment sub-sector relative to the S&P 500. The rally in Chinese equities – despite China’s Q2 GDP growth rate of 6.2%, the worst in 27 years – brings full circle the view we initiated in April 2017 that Chinese President Xi Jinping’s consolidation of power would result in a major deleveraging drive that would drag on the global economy. Since February we have argued that the U.S. trade war has pushed Chinese policymakers to favor stimulus over reform – but we have also maintained that the effectiveness of stimulus is declining, especially as a result of the trade war hit to sentiment. Nevertheless, as a result of this turn in Chinese policy – along with the turn in U.S. monetary and fiscal policy – we see the global macroeconomic outlook improving. Combining this view with ongoing tensions in the Persian Gulf and the expectation that oil markets will tighten, we recommend our Commodity & Energy Strategy’s trade of going long Brent crude Q1 2020 versus Q1 2021. Matt Gertken, Vice President Geopolitical Strategist mattg@bcaresearch.com Footnotes 1 See U.S. Department of Treasury, “Secretary Mnuchin Sends Debt Limit Letter to Congress,” July 12, 2019, home.treasury.gov. Jordan LaPier, “New Projection: Debt Limit “X Date” Could Arrive in September,” July 8, 2019, bipartisanpolicy.org. 2 See Jordain Carney and Niv Elis, White House, Congress inch toward debt, budget deal,” July 17, 2019, thehill.com. 3 See the Congressional Budget Office, “The Budget and Economic Outlook: 2019 to 2029,” January 2019; “Final Sequestration Report for Fiscal Year 2019,” February 2019; and Theresa Gullo, “Discretionary Appropriations Under the Budget Control Act,” Testimony before the Committee on the Budget, United States Senate, February 27, 2019, www.cbo.gov. 4 See James L. Pierce, “The Political Economy of Arthur Burns,” The Journal of Finance 34: 2 (1979), pp. 485-96, esp p. 489 regarding a congressional testimony: “Interestingly, no questions were raised or innuendo offered that monetary expansion would be excessive to support Richard Nixon’s reelection efforts. Instead, Burns was urged by the Democrats to follow an expansionary monetary policy in order to reduce the level of unemployment.” See also Athanasios Orphanides and John C. Williams, “Monetary Policy Mistakes and the Evolution of Inflation Expectations,” Federal Reserve Bank of San Francisco, Working Paper 2010-12 (2011), www.frbsf.org. 5 An analogy might be drawn with the Supreme Court, whose independence as one of three constitutional branches is much more firmly grounded in U.S. law than the Fed’s, but nevertheless cannot make decisions in an ivory tower. It must consider the effects of its judgments on popular opinion, since universally deplored decisions would reduce the court’s credibility and legitimacy in the eyes of the public over time and ultimately the other government branches’ adherence to those decisions. 6 This is both because Biden is more electable (thus more likely to bring a vice president who can break a tie vote in the senate) and because his candidacy can help Democrats in all of the senate swing races – for example, Arizona as well as Colorado and Maine. Harris is not as helpful in Maine while Warren and Sanders are not as helpful in Arizona. 7 Biden would return to the 39.6% top marginal individual tax rate and double the capital gains tax on those earning incomes of more than $1 million. See Biden For President, “Health Care,” joebiden.com. 8 Conversely, if Biden somehow collapses, Buttigieg unlike Sanders has the option of moving toward the political center to absorb Biden’s large reservoir of support.
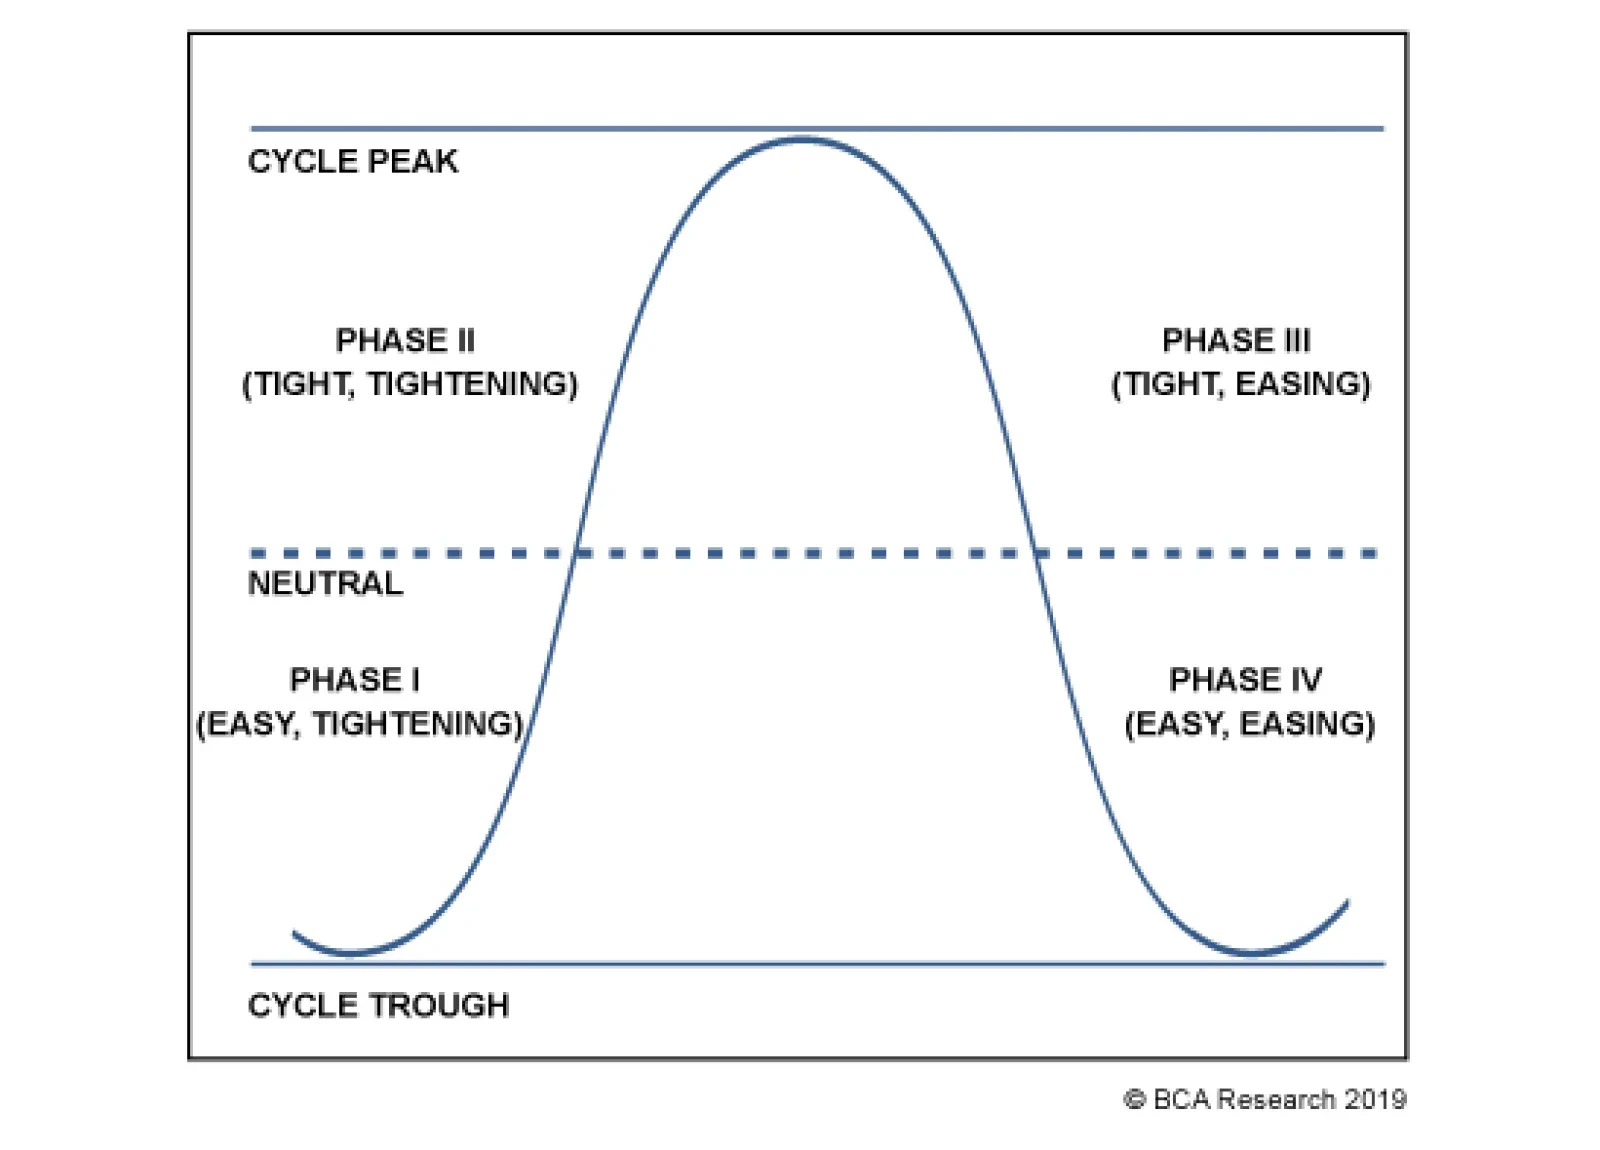
We decompose the fed funds rate cycle into four phases based on the interaction between the level of rates and their direction, as follows: Phase I represents the early stage of the withdrawal of monetary stimulus. This phase begins with the first rate…
Highlights A lower fed funds rate will not necessarily boost equities, … : A chorus of Wall Street strategists has recently advised investors to curb their enthusiasm about looming rate cuts. … because stocks are more sensitive to the relative level of the fed funds rate than they are to its direction: The Street strategists’ advice is sound, even if they haven’t homed in on its true rationale. Monetary policy’s influence on equity returns is primarily a function of the fed funds rate’s relationship to the equilibrium rate, not the direction in which it’s moving. Monetary policy settings remain accommodative, in our view, … : We estimate that the equilibrium fed funds rate remains well above the target fed funds rate. One or two rate cuts will push monetary policy even further into accommodative territory. ... and investors should therefore remain at least equal weight equities: Over the last 60 years, investors would have done exceptionally well if they had simply owned stocks when monetary policy settings were easy, and avoided them when they were tight. Feature Dear Client, We are in the midst of collaborating with several of our colleagues on a roundtable Special Report outlining the view differences between BCA’s most bullish and bearish strategists, scheduled to be published on Friday, July 19th. In the absence of a major event between now and then, the July 19th roundtable report will replace the July 22nd U.S. Investment Strategy. We will return to our usual format on Monday, July 29th. Best regards, Doug Peta U.S. equities have rallied smartly since Fed officials began hinting at rate cuts in early June. The S&P 500 advanced nearly 7% last month on rate cut hopes, and tacked on close to another 2% by making new highs in each of July’s first three sessions. As the gains grew, however, so too did the admonitions from equity strategists at leading broker-dealers that they were getting out of hand. Over the last month, no less than four shops wrote reports warning that rate cuts will not necessarily boost equities. From the financial media’s summaries of the reports, the curb-your-enthusiasm conclusion stems from a straightforward analysis of rate-cut impacts over the last 35 years. According to Goldman Sachs by way of Barron’s, the S&P 500 posted double-digit returns in the year following the start of all five of the rate-cutting cycles that occurred from the mid-eighties to the end of the nineties, before performing terribly following the cuts that began in 2001 and 2007.1 The Street-wide takeaway was that rate cuts worked wonders for stocks when the Greenspan put was still a fresh concept, but the inverse relationship between interest rates and equity multiples that initially prevailed has since been supplanted by a direct relationship. It is surely true that rate cuts are not a magic bullet for equities, but we find the flipped-correlation hypothesis wanting. There is more to the question of how monetary policy impacts equities than just the direction of rates. The state of monetary policy – accommodative or restrictive – matters, too. Even though assessments of the state of policy are necessarily uncertain, they allow for a much more sophisticated analysis of policy impacts. Without estimating the equilibrium fed funds rate, an investor cannot go beyond simple observations of the correlation between policy rates and equity returns to the causal interactions that drive the observed correlations. Numerators And Denominators When an investor buys a stock, s/he is buying a pro rata claim on the future earnings of the company that issued it. The value of that claim is a function of the company’s estimated future earnings and the interest rate used to discount them. Expressed as an equation, the fundamental value of a share of stock is as follows, where r is the reference interest rate: Year 1 Earnings + Year 2 Earnings + Year 3 Earnings + … + Year n Earnings (1+r) (1+r)2 (1+r)3 (1+r)n That equation can be simplified and rewritten as: Fundamental Value = ∑nt=1(Year t Earnings) (1+r)t It’s a stretch to think that equities’ reaction to rate cuts reversed after the year 2000. The final form of the equation shows that the underlying value of a share of stock is directly related to its future earnings and inversely related to interest rates. When the broker-dealer analyses conclude that the ‘80s-‘90s inverse relationship between stock prices and rate cuts has flipped since the turn of the millennium, they’re asserting that the relative sensitivities of stock prices to changes in the numerator (earnings) and the denominator (interest rates) have changed. That’s a mouthful, but the effect can be seen clearly by holding the numerator constant: if earnings don’t change, stock prices are inversely related to changes in interest rates. Relaxing the constant earnings assumption, the inverse relationship between rate cuts and stock prices in the ‘80s and ‘90s could only have occurred if earnings rose when the Fed cut, or if earnings fell when the Fed cut rates, but not so much that they offset the beneficial impact of the reduction in the discount rate. An Empirical Curveball When investors think about the impact of changes in interest rates on stock prices, they tend to assume that earnings remain constant. They therefore conclude that lower rates are good for stocks and higher rates are bad for them. The underlying assumption is flawed, however, because it ignores the fact that earnings are themselves a function of the macro backdrop that influences interest rates. Rising real interest rates are most often a sign of gathering economic momentum; since the end of World War II, U.S. equities have performed markedly better when real long-term Treasury yields were rising than they have when they were falling (Chart 1). Chart 1Stocks Do Better When Real Rates Rise
Stocks Do Better When Real Rates Rise
Stocks Do Better When Real Rates Rise
Investors’ appetite for equities reinforces the direct relationship between earnings and rates, as long as rates are not at extremes. Trailing P/E multiples have risen with real interest rates except when rates are negative or above 4% (Chart 2). When real rates are negative, deflation is a real possibility and fearful investors value future earnings streams conservatively. When they’re above zero, investors have been willing to let multiples rise with real rates, until rates get high enough to squeeze profitability.
Chart 2
The key, then, is what is going to happen with real yields if the Fed does indeed cut rates. Will 50 basis points (“bps”) of incremental accommodation (we expect 25-bps cuts in July and September) help to extend the expansion, or will it be too little, too late to impede the course of a recession that’s already begun? In the former case, economic growth will get a boost, and real yields and corporate earnings will go along for the ride. In the latter, the economy will contract, drawing real yields and corporate earnings into its vortex. We believe monetary policy is still squarely accommodative, and therefore have both feet planted firmly in the bullish camp. The Fed Funds Rate Cycle Our fed funds rate cycle framework helps us to assess the line of demarcation between accommodative and restrictive policy settings and thereby project the direction of corporate earnings following rate cuts. To refresh, we decompose the fed funds rate cycle into four phases based on the interaction between the level of rates and their direction (Diagram 1), as follows: Diagram 1The Fed Funds Rate Cycle
How Will Equities Respond To Rate Cuts?
How Will Equities Respond To Rate Cuts?
Phase I represents the early stage of the withdrawal of monetary stimulus. This phase begins with the first rate hike of a new tightening cycle and ends when the fed funds rate crosses above our estimate of the equilibrium rate. Phase II represents the latter stages of the tightening cycle, when the Fed hikes its target rate above equilibrium in a deliberate effort to cool an overheating economy. Phase III represents the early stage of the easing cycle. It begins with the first rate cut from the peak and lasts until the Fed cuts its target rate below equilibrium. Phase IV represents the late stage of the easing cycle. It encompasses both the period when the fed funds rate falls from below its equilibrium level to its cycle trough and the subsequent adjustment period when the Fed remains on hold in an effort to kick start an economic recovery. Plotting the course of the fed funds rate is a simple matter; the challenge in Diagram 1 comes in deciding where to draw the dashed line. That decision requires estimating the policy rate that neither encourages nor discourages economic activity. Our equilibrium estimate, which uses potential GDP growth to adjust a smoothed and filtered long-run series of the actual fed funds rate, can be viewed as a line in the sand separating the point where monetary policy goes from encouraging activity to discouraging it. When the funds rate is above our estimate of equilibrium, we consider policy to be tight; when it’s below our estimate of equilibrium, we consider policy to be easy. Since equilibrium is a concept, rather than an observable objective data point, we have to look at the broad sweep of economic activity to infer whether or not our equilibrium estimate is accurate. As we’ve repeatedly written, we interpret the economic data received so far this year as indicating that the U.S. economy is decelerating from its stimulus-fueled 2018 surge, but is on track to meet or exceed its long-term potential growth pace of 2 - 2.25%. We therefore do not believe that policy is tight, and that a recession has already begun, or is in the offing. Recession? What About Stock Prices? We didn’t forget about stock prices. Markets are always our primary focus, and we study the economy for insight into how it might impact their direction. The business cycle is a robust link connecting the state of monetary policy with equity performance. In the 60 years covered by our equilibrium fed funds rate estimate, recessions have only occurred when the funds rate has exceeded our estimate of equilibrium (Chart 3). Equity bear markets typically coincide with recessions – Black Monday in October 1987 is the only instance of a bear market occurring independently of a recession in the last half-century. Chart 3Recessions Only Occur When Policy Is Tight
Recessions Only Occur When Policy Is Tight
Recessions Only Occur When Policy Is Tight
For 60 years, stocks have thrived when monetary policy is easy and staggered when it is tight. S&P 500 performance across the four phases of the fed funds rate cycle reveals that it has been the level of rates vis-à-vis the equilibrium rate that has mattered for equity returns, not the direction. Annualized nominal S&P 500 price returns have been nine percentage points higher when policy is easy than when it is tight (Table 1), and the disparity widens to ten-and-a-half percentage points after adjusting for inflation (Table 2). The disparity is even more pronounced when the Fed is cutting rates – annualized Phase IV price returns beat Phase III by eleven percentage points on a nominal basis, and by thirteen-and-a-half percentage points on a real basis. Table 1Stocks Love Easy Policy, ...
How Will Equities Respond To Rate Cuts?
How Will Equities Respond To Rate Cuts?
Table 2… Especially After Adjusting For Inflation
How Will Equities Respond To Rate Cuts?
How Will Equities Respond To Rate Cuts?
Our base case is that the FOMC will cut the fed funds rate by 25 bps at its July and September meetings. The investment strategy question arising from our base-case scenario is what will that mean for equities? With reference to the dot-com bust and the financial crisis, the broker-dealers say, “nothing much.” We posit that a more sophisticated answer would consider the monetary-policy climate in which the cuts occur. Reduce equity exposure if you believe the Fed went too far hiking rates last year, but maintain/increase it if you think monetary policy has always remained accommodative. 60 years of history say that incremental accommodation will boost equities if it occurs against a backdrop of already easy policy. The S&P 500 will decline, on the other hand, if the monetary policy starting point is restrictive.2 In terms of our fed funds rate cycle framework, the equity market outcome turns on whether the cuts occur in Phase III or Phase IV. We estimate that the equilibrium rate is currently in the neighborhood of 3¼%, so we have a high level of conviction that equities will spend the rest of the year in Phase IV, the rate cycle phase that has been most conducive to equity outperformance. Investment Implications From the perspective of our monetary policy cycle framework, positioning a balanced portfolio for impending rate cuts boils down to one’s take on current monetary policy settings. If one thinks the Fed’s already tightened policy enough to squeeze the economy, s/he should sell stocks. (Some of our BCA colleagues advocate that course, and we will share the stage with them in next week’s roundtable Special Report). If one thinks, like we and the overall BCA consensus do, that the Fed hasn’t yet crossed the easy/tight Rubicon and is on a course to push the date when it will out to 2021 or beyond, one should maintain his/her equity positions and consider adding to them. Doug Peta, CFA Chief U.S. Investment Strategist dougp@bcaresearch.com Footnotes 1 Hough, Jack, “The ‘Fed Put’ Is Kaput and Interest Rate Cuts Might Hurt Stocks,” Barron’s, July 1, 2019. 2 Remember that monetary policy impacts the economy with a lag. Cuts ameliorating too-tight policy don’t have an effect until after the initial overtightening makes its way through the system.
Incredibly, the tone shifted again in February, when Premier Li Keqiang and the PBoC publicly disputed whether the January credit spike represented “flood irrigation-style” stimulus, something Premier Li made clear was to be avoided. These shifts impacted…
The events of the past year have also demonstrated that the effectiveness of Chinese monetary policy has declined relative to past economic cycles. This, in conjunction with the reluctant/reactive nature of the monetary authorities, has clear implications for…
Canadian data has been firing on all cylinders of late, so it was no surprise that Governor Stephen Poloz decided to keep interest rates on hold today. That said, details in its monetary policy report were notably cautious: Risks from the slowdown in…
NOTE: There will be no report on Wednesday, July 17 due to our regular summer break. Highlights Chinese policymakers as well as the People’s Bank of China (PBoC) have historically been reactive, meaning they have typically waited for economic pain to become entrenched before accelerating reflationary measures. The agreement reached at the June G20 Summit to renew trade negotiations with the U.S., while temporary, takes the pressure off the immediate need to further stimulate the economy. While China has the ability to juice the economy, the pain threshold has been raised higher during this cycle, and the country’s leadership has been reluctant to let go of its financial deleveraging campaign. This approach has resulted in a “half measure” stimulus over the past 12 months. The outlook for Chinese stocks is negative over the next three months, as a flip-flop policy approach will increase market volatility. However, over a cyclical (i.e. six- to 12-month) time horizon, we are maintaining a bullish stance toward Chinese stocks in hedged currency terms. Feature Last week marked the first anniversary of the imposition of tariffs on imports from China by the U.S. – an event that has clearly had a lasting and meaningful impact on global economic activity. Last week was also the first anniversary of a significant monetary easing measure: China’s 3-month interbank repo rate fell 90 basis points on July 3, 2018, 3 days before the first tranche of import tariffs took effect. This decline was just under half of what would ultimately occur (the 3-month repo rate fell from 4.5% in early July to 2.4% in early August), and was taken as a sign by many investors that the PBoC had shifted to a maximum reflationary stance (Chart 1). Chart 1Indecisively Falling Interbank Rate
Indecisively Falling Interbank Rate
Indecisively Falling Interbank Rate
However, several facts underscore that either the PBoC did not, in retrospect, move completely toward a pro-growth stance, or that China’s monetary transmission mechanism is seriously impaired. In our view, it is a combination of both: Despite evidence suggesting it should, the PBoC did not cut its benchmark lending rate. The repo rate declined in the third quarter last year on the back of increased liquidity supply in the interbank market. The weighted average lending rate also fell, but not massively, and not by as much as our model had predicted (Chart 2). A pickup in credit expansion has significantly lagged easing. Excluding local government bonds, the general pickup in credit has been modest. Based on this measure of Total Social Financing, new credit to GDP still remains lower today than at any point during the 2015-2016 downturn (Chart 3). Chart 2Lending Rate: Not Much Easing
Lending Rate: Not Much Easing
Lending Rate: Not Much Easing
Chart 3No Strong Re-Leveraging
No Strong Re-leveraging
No Strong Re-leveraging
With the conclusion of the G20 Summit temporarily halting the trade war escalation and implementation of additional tariffs, these observations raise important questions: Will the PBoC be proactive in easing policy? What does this mean for investors over the coming year? The PBoC Will Be Reactive Rather Than Proactive Chart 4Shadow-Banking Crackdown Continues
Shadow-Banking Crackdown Continues
Shadow-Banking Crackdown Continues
In our view, the PBoC’s policy actions last year can at best be described as half-measures, despite the fact that the central bank was quick to reduce interbank interest rates in last July by cutting the reserve requirement ratio (RRR). The reason is that the PBoC clearly maintained macro-prudential/administrative restrictions on shadow banking activity, despite significantly easing liquidity in the interbank market. Chart 4 shows that shadow-banking credit as a share of total adjusted social financing continued to decelerate rapidly throughout 2018. It now accounts for a mere 12% of the stock of total adjusted social financing, by far the lowest point since 2009. This underscores that the PBoC and policymakers more generally have a deep-seated desire to avoid (further) inflating China’s substantial money and credit excesses – a dynamic that we have discussed in previous reports.1 Looking forward, there are three reasons why the PBoC’s reactive nature is unlikely to change in the near term, in addition to policymakers’ concerns about financial system’s excesses. First, the PBoC has historically been a reactive central bank, in a way that goes beyond the now-typical “data dependent” approach of its developed-market peers. Chart 5 provides a close look at China’s previous economic growth cycles and their corresponding credit expansions. The chart highlights that Chinese policymakers tend to stay behind the curve when it comes to monetary easing: In the previous three growth cycles, the first sign of monetary easing (defined as an RRR and/or benchmark lending rate cut) lagged the peak of nominal GDP growth by an average of four quarters. Rate cuts took place not when economic growth peaked, but once economic activity had already weakened considerably (Chart 6). Chart 5Chinese Policymakers Tend To Stay 'Behind The Curve'
Chinese Policymakers Tend To Stay 'Behind The Curve'
Chinese Policymakers Tend To Stay 'Behind The Curve'
Chart 6More 'Pain' Needed For Massive Easing
More 'Pain' Needed for Massive Easing
More 'Pain' Needed for Massive Easing
The same pattern has applied to other monetary easing tools that the PBoC has deployed in the past, including the Medium Lending Facility (MLF), the Targeted Medium-term Lending Facility (TMLF), the standing Lending Facility (SLF), and the Pledged Supplementary Lending program (PSL) – all of which only took shape after the economy had already shown across-the-board weakness. It will take more widespread and entrenched economic weakness for the PBoC to meaningfully ease further. The local government debt-to-bond swap program was also launched well into the 2015 growth downturn. When widespread and sustained weakness in activity emerged, Chinese policymakers responded by “throwing the kitchen sink” at the economy – by moving forward with multiple rate cuts and often creating new forms of easing in an attempt to catalyze a quick rebound. Since the PBoC has already implemented a series of easing measures, we believe it will take more widespread and entrenched weakness in the real economy for the PBoC to meaningfully ease further. Chart 7Chinese Currency Is Under Pressure
Chinese Currency Is Under Pressure
Chinese Currency Is Under Pressure
Second, the PBoC is likely to be reactive because of the potentially negative effects that proactive rate cuts could cause on sentiment towards the RMB. Chart 7 highlights the close historical correlation between the RRR, interest rate differentials and the USD/CNY. USD/CNY was trading at 7.8 the last time the weighted average RRR was at 11%, which was back in 2007. At the current juncture, interest rate differentials already point to a weaker currency. The PBoC has signaled that USD/CNY at 7 is no longer a line in the sand that must be defended, meaning this level is not a hard constraint that would prevent the central bank from cutting either the RRR or the benchmark lending rates if warranted. In fact, a measured depreciation in the RMB would help mitigate some of the blow from increased tariffs. Nevertheless, in an environment where the currency has already weakened significantly, cutting the RRR or the benchmark lending rates quickly or by a large amount could create self-reinforcing expectations of further depreciation. China has implemented a better counter-cyclical mechanism to defend the RMB than it had in 2015-‘16,2 but the potential for capital outflows remains a serious concern.3 Third, the Trump-Xi meeting at the June G20 Summit in Osaka temporarily averted a further escalation of the trade war and additional tariffs. The agreement to continue trade negotiations lacks tangible progress from either side, and thus the “truce” is likely to be short-lived. Chart 8Markets So Far Unimpressed By Stimulus
Markets So Far Unimpressed By Stimulus
Markets So Far Unimpressed By Stimulus
However, as we pointed out in last week’s report,4 the existence of talks is likely to take some pressure off Chinese policymakers’ immediate need to floor the reflation accelerator. Readouts from recent PBoC leadership meetings indicate that speculative excesses in the financial system remain a top concern for Chinese policymakers. China’s onshore market, after rallying by 2% following the good news from the G20 meeting, has given back all its gain (Chart 8). Given that the onshore equity market is extremely sensitive to China’s credit growth, the short-lived rally since the G20 meeting suggests markets have been unimpressed by the authorities’ reflationary efforts so far. Bottom Line: Chinese policymakers have not fully abandoned their financial deleveraging campaign, which President Xi Jinping initiated two years ago. This implies China’s central bank is likely to maintain its reactive approach in further easing monetary policy, and will likely try to avoid going “all-in” on stimulus for as long as possible. The Reduced Effectiveness Of Monetary Policy The events of the past year have also demonstrated that the effectiveness of Chinese monetary policy has declined relative to past economic cycles. This, in conjunction with the reluctant/reactive nature of the monetary authorities, has clear implications for investors over the coming year. When there is lack of clarity in policy interpretation, Chinese banks tend to stay on the sidelines. Chart 9A Long Delayed Credit Response To Monetary Easing
A Long Delayed Credit Response To Monetary Easing
A Long Delayed Credit Response To Monetary Easing
The PBoC has cut the RRR five times since the second quarter of last year, which has freed up a total of 3.35 trillion yuan of liquidity for the banking system5 and has helped spur significant easing in overall monetary conditions. Yet, as we noted earlier, overall credit growth did not pick up until January of this year, lagging the first rate cut by three quarters (Chart 9). Prior to the economic slowdown in 2015-2016, credit growth used to respond to cuts in the RRR almost immediately. In other words, when banking system liquidity was ample, banks historically lent without hesitation. Post-2015, however, this relationship has changed. The PBoC has increasingly been having trouble channeling new liquidity into actual financing for the real economy. A sharp deterioration in reported bank asset quality that began in 2014 is likely part of the explanation,6 but we suspect that more recent extreme policy contradiction – in particular, repeated flip-flopping among authorities between their desire to support growth and their focus on financial stability – has caused economic agents to wait on the sidelines. While monetary conditions eased and the government urged banks to lend (particularly to the private sector) in the second half of 2018, the “prudent” stance coming from Chinese top leaders was little changed, and tight regulations on financial institutions remained in place. This combination did not give banks the confidence to lend. This changed in the first quarter of this year, when new credit creation-to-GDP surged from 23.6% to 25.6%. The surge occurred shortly after the late-December Central Economic Work Conference (CEWC), which sent a clear message that the central government’s policy focus had shifted to “stabilizing aggregate demand.” Incredibly, the tone shifted again in February, when Premier Li Keqiang and the PBoC publicly disputed whether the January credit spike represented “flood irrigation-style” stimulus, something Premier Li made clear was to be avoided.7 Charts 10 and 11 highlight how these shifts impacted credit growth: The first quarter was clearly on track for a 2015-2016-magnitude outcome, whereas April and May saw the path of credit growth return back to a moderate re-leveraging scenario.
Chart 10
Chart 11
To get back on track for a 2015-2016 magnitude reflation, we will need to see June’s credit creation at or above 5 trillion yuan – equivalent to January’s credit numbers (Chart 12). Chart 12'Credit Binge' In June Unlikely
Credit Binge' in June Unlikely
Credit Binge' in June Unlikely
As we go to press, the number for June’s total social financing has not been officially released yet. But the official reading from the total local government bond issuance in June (including both general bond and special-purpose bond issuance), a key component of our adjusted total social financing series, came in at 900 billion yuan. This is three times more than local government bonds issued in May and twice the size of January’s. Nevertheless, January’s bank lending, particularly short-term lending, was unusually large; an episode highly criticized by Chinese leadership as we mentioned above. As PBoC stated in its defense to this criticism, January is “traditionally the biggest month of the year for bank loans due to seasonal factors”. Therefore, without a clear shift in policy signal from China’s top leadership, we do not expect June’s bank lending number to be a repeat of January’s. Instead, June’s total credit impulse will likely put the cumulative progress in credit growth closer to our 27% of nominal GDP assumption (assuming an 8% nominal GDP growth for the remainder of 2019). This would fall into our “half-strength” credit cycle scenario relative to past reflationary episodes. Bottom Line: Ultimately, we do not doubt that Chinese policymakers will be able to engineer a significant re-acceleration in economic activity should they choose to do so. But in order for policymakers to achieve this goal, policy ambiguity and inconsistency will have to be meaningfully reduced. Investment Implications Over a cyclical time horizon, we recommend staying long/overweight Chinese stocks in hedged currency terms. From our perspective, neither policymakers’ bias towards reluctance nor the reduced effectiveness of monetary policy convincingly argue against our bullish stance towards Chinese stocks over a cyclical (i.e. six- to twelve-month) time horizon, but the tactical implications are clearly negative. Over a cyclical horizon, one of two scenarios is likely to unfold: Either downside risk brought on by current tariffs and weakness in domestic demand is contained enough such that Chinese economic activity does not materially decelerate, or the trade dispute escalates into a full-tariff scenario of 25% on all U.S. imports from China that dramatically impacts Chinese growth. In the first scenario, policymakers will likely to continue providing half-measured responses, and unconstrained “across-the-board” easing will not occur. But Chart 13 highlights that Chinese stocks, particularly the investable market, are priced for a much worse economic outcome, suggesting Chinese relative equity performance would trend higher in these circumstances. Chart 13Chinese Stocks Priced In For A Worse Economic Outlook
Chinese Stocks Priced In For A Worse Economic Outlook
Chinese Stocks Priced In For A Worse Economic Outlook
Chart 14Bullish On A Cyclical Horizon, Bearish In The Near Term
Bullish On A Cyclical Horizon, Bearish In The Near Term
Bullish On A Cyclical Horizon, Bearish In The Near Term
In the second scenario, Chinese business and consumer sentiment is likely to collapse and policymakers will be facing high odds of a substantial slowdown in economic activity. This will create the political will necessary for unconstrained “across-the-board” easing, similar to what occurred in 2015-2016. The sharp re-acceleration in economic activity that would result from broad-based stimulus would clearly be positive for listed Chinese earnings per share (Chart 14), meaning the cyclical outlook for Chinese stocks would likely be even more positive than in the first scenario. However, the near-term equity market outlook of the second scenario would be extremely negative, as a financial market meltdown in of itself would likely be required to build the political will necessary to ultimately ease. Bottom Line: For investors with a time horizon of less than three months, we would not recommend a long position in Chinese stocks, neither in absolute terms nor relative to the global benchmark. However, over a strictly cyclical (i.e. six- to 12-month) time horizon, we recommend staying long/overweight Chinese stocks in hedged currency terms. Jing Sima China Strategist JingS@bcaresearch.com Footnotes 1 Please see Geopolitical Strategy Special Report, “China: How Stimulating is The Stimulus?”, dated August 8, 2018, available at cis.bcaresearch.com 2 A series of countercyclical measures China implemented in 2016-2017 includes: tightening controls on capital outflows, reducing offshore RMB liquidity supply, raising offshore RMB borrowing costs, and setting a firmer daily reference point for the RMB’s trading band. 3 Please see China Investment Strategy Special Report, “Monitoring Chinese Capital Outflows”, dated March 20, 2019, available at cis.bcaresearch.com 4 Please see China Investment Strategy Weekly Report, “China Macro and Market Review”, dated July 4, 2019, available at cis.bcaresearch.com 5 According to PBoC announcements. 6 Please see China Investment Strategy Weekly Report, “Trade Is Not China’s Only Problem”, dated November 21, 2018, available at cis.bcaresearch.com 7 Please see “Chinese Premier In Rare Spat With Central Bank”, Financial Times. Cyclical Investment Stance Equity Sector Recommendations
Highlights So What? U.S.-Iran risk is front-loaded, but U.S.-China is the greater risk overall. In the medium-to-long run the trade war with China should reaccelerate while the U.S. should back away from war with Iran. But for now the opposite is happening. A full-fledged cold war with China will put a cap on American political polarization, putting China at a disadvantage. By contrast, a U.S. war with Iran would exacerbate polarization, giving China a huge strategic opportunity. War with Iran or trade war escalation with China are both ultimately dollar bullish – even though tactically the dollar may fall. Feature Two significant geopolitical events occurred over the past week. First, U.S. President Donald Trump declared his third pause to the trade war with China. The terms of the truce are vague and indefinite, but it has given support to the equity rally temporarily. Second, Iran edged past the limits on uranium stockpiling, uranium enrichment, and the Arak nuclear reactor imposed by the 2015 nuclear pact. Trump instigated this move by walking away from the pact and re-imposing oil sanctions. If these events foreshadow things to come, global financial markets should position for lower odds of a deflationary trade shock and higher odds of an inflationary oil shock in the coming six-to-18 months. But is this conclusion warranted? Is the American “Pivot to Asia” about to shift into reverse? If the White House pursued a consistent strategy to contain China, it would bring Americans together and require forming alliances. In the short run, perhaps – but the conflict with China is ultimately the greater of the two geopolitical risks. We expect it to intensify again, likely in H2, but at latest by Q3 of 2020, ahead of the U.S. presidential election. Our highest conviction call on this matter, however, is that any trade deal before that date will be limited in scope. It will fall far short of a “Grand Compromise” that ushers in a new era of U.S.-China engagement – and hence it will be a disappointment to global equities. Our trade war probabilities, updated on June 14 to account for the expected resumption of negotiations at the G20, can be found in Diagram 1. The combined risk of further escalation is 68%. Diagram 1Trade War Decision Tree (Updated June 13, 2019 To Include G20 Tariff Pause)
The Polybius Solution
The Polybius Solution
The risk to the view? The U.S.-Iran conflict could spiral out of control and the Trump administration could get entangled in the Middle East. This would create a very different outlook for global politics, economy, and markets over the next decade than a concentrated conflict with China. The Missing Corollary Of The “Thucydides Trap” The idea of the “Thucydides Trap” has gone viral in recent years – for good reason. The term, coined by Harvard political scientist Graham Allison, refers to the ancient Greek historian Thucydides (460-400 BC), author of the seminal History of the Peloponnesian War. The “trap” is the armed conflict that most often develops when a dominant nation that presides over a particular world order (e.g. Sparta, the U.S.) faces a young and ambitious rival that seeks fundamental change to that order (e.g. Athens, China).1 This conflict between an “established” and “revisionist” power was highlighted by the political philosopher Thomas Hobbes in his translation of Thucydides in the seventeenth century; every student of international relations knows it. Allison’s contribution is the comparative analysis of various Thucydides-esque episodes in the modern era to show how today’s U.S.-China rivalry fits the pattern. The implication is that war (not merely trade war) is a major risk. We have long held a similar assessment of the U.S.-China conflict. It is substantiated by hard data showing that China is gaining on America in various dimensions of power (Chart 1). Assuming that the U.S. does not want to be replaced, the current trade conflict will metastasize to other areas. There is an important but overlooked corollary to the Thucydides Trap: if the U.S. and China really engage in an epic conflict, American political polarization should fall. Polarization fell dramatically during the Great Depression and World War II and remained subdued throughout the Cold War. It only began to rise again when the Soviet threat faded and income inequality spiked circa 1980. Americans were less divided when they shared a common enemy that posed an existential threat; they grew more divided when their triumph proved to benefit some disproportionately to others (Chart 2). Chart 1China Is Gaining On The U.S.
China Is Gaining On The U.S.
China Is Gaining On The U.S.
Chart 2U.S. Polarization Falls During Crisis
U.S. Polarization Falls During Crisis
U.S. Polarization Falls During Crisis
If the U.S. and China continue down the path of confrontation, a similar pattern is likely to emerge in the coming years – polarization is likely to decline. China possesses the raw ability to rival or even supplant the United States as the premier superpower over the very long run. Its mixed economy is more sustainable than the Soviet command economy was, and it is highly integrated into the global system, unlike the isolated Soviet bloc. As long as China’s domestic demand holds up and Beijing does not suppress its own country’s technological and military ambitions, Trump and the next president will face a persistent need to respond with measures to limit or restrict China’s capabilities. Eventually this will involve mobilizing public opinion more actively. Further, if the U.S.-China conflict escalates, it will clarify U.S. relations with the rest of the world. For instance, Trump’s handling of trade suggests that he could refrain from trade wars with American allies to concentrate attention on China, particularly sanctions on its technology companies. Meanwhile a future Democratic president would preserve some of these technological tactics while reinstituting the multilateral approach of the Barack Obama administration, which launched the “Pivot to Asia,” the Trans-Pacific Partnership, and intensive freedom of navigation operations in the South China Sea. These are all aspects of a containment strategy that would reinforce China’s rejection of the western order. Bottom Line: If the White House, any White House, were to pursue a consistent strategy to contain China, the result would be a major escalation of the trade conflict that would bring Americans together in the face of a common enemy. It would also encourage the U.S. to form alliances in pursuit of this objective. So far these things have not occurred, but they are logical corollaries of the Thucydides Trap and they will occur if the Thucydides thesis is validated. How Would China Fare In The Thucydides Trap? China would be in trouble in this scenario. The United States, if the public unifies, would have a greater geopolitical impact than it currently does in its divided state. And a western alliance would command still greater coercive power than the United States acting alone (Chart 3). External pressure would also exacerbate China’s internal imbalances – excessive leverage, pollution, inefficient state involvement in the economy, poor quality of life, and poor governance (Chart 4). China has managed to stave off these problems so far because it has operated under relative American and western toleration of its violations of global norms (e.g. a closed financial system, state backing of national champions, arbitrary law, censorship). This would change under concerted American, European, and Japanese efforts. Chart 3China Fears A Western 'Grand Alliance'
China Fears A Western 'Grand Alliance'
China Fears A Western 'Grand Alliance'
Chart 4China's Domestic Risks Underrated
China's Domestic Risks Underrated
China's Domestic Risks Underrated
How would the Communist Party respond? First, it could launch long-delayed and badly needed structural reforms and parlay these as concessions to the West. The ramifications would be negative for Chinese growth on a cyclical basis but positive on a structural basis since the reforms would lift productivity over the long run – a dynamic that our Emerging Markets Strategy has illustrated, in a macroeconomic context, in Diagram 2. This is already an option in the current trade war, but China has not yet clearly chosen it – likely because of the danger that the U.S. would exploit the slowdown. Diagram 2Foreign Pressure And Structural Reform = Short-Term Pain For Long-Term Gain
The Polybius Solution
The Polybius Solution
Alternatively the Communist Party could double down on confrontation with the West, as Russia has done. This would strengthen the party’s grip but would be negative for growth on both a cyclical and structural basis. The effectiveness of China’s fiscal-and-credit stimulus would likely decline because of a drop in private sector activity and sentiment – already a nascent tendency – while the lack of “reform and opening up” would reduce long-term growth potential. This option makes structural reforms look more palatable – but again, China has not yet been forced to make this choice. None of the above is to say that the West is destined to win a cold war with China, but rather that the burden of revolutionizing the global order necessarily falls on the country attempting to revolutionize it. Bottom Line: If the Thucydides Trap fully takes effect, western pressure on China’s economy will force China into a destabilizing economic transition. China could lie low and avoid conflict in order to undertake reforms, or it could amplify its aggressive foreign policy. This is where the risk of armed conflict rises. Introducing … The Polybius Solution The problem with the above is that there is no sign of polarization abating anytime soon in the United States. Extreme partisanship makes this plain (Chart 5). Rising polarization could prevent the U.S. from responding coherently to China. The Thucydides Trap could be avoided, or delayed, simply because the U.S. is distracted elsewhere. The most likely candidate is Iran.
Chart 5
A lesser known Greek historian – who was arguably more influential than Thucydides – helps to illustrate this alternative vision for the future. This is Polybius (208-125 BC), a Greek who wrote under Roman rule. He described the rise of the Roman Empire as a result of Rome’s superior constitutional system. Polybius explains domestic polarization whereas Thucydides explains international conflict. Polybius took the traditional view that there were three primary virtues or powers governing human society: the One (the king), the Few (the nobles), and the Many (the commons). These powers normally ran the country one at a time: a dictator would die; a group of elites would take over; this oligarchy would devolve into democracy or mob-rule; and from the chaos would spring a new dictator. His singular insight – his “solution” to political decay – was that if a mixture or balance of the three powers could be maintained, as in the Roman republic, then the natural cycle of growth and decay could be short-circuited, enabling a regime to live much longer than its peers (Diagram 3). Diagram 3Polybius: A Balanced Political System Breaks The Natural Cycle Of Tyranny And Chaos
The Polybius Solution
The Polybius Solution
In short, just as post-WWII economic institutions have enabled countries to reduce the frequency and intensity of recessions (Chart 6), so Polybius believed that political institutions could reduce the frequency and intensity of revolutions. Eventually all governments would decay and collapse, but a domestic system of checks and balances could delay the inevitable. Needless to say, Polybius was hugely influential on English and French constitutional thinkers and the founders of the American republic. Chart 6Orthodox Economic Policy Has Made Recessions Less Frequent And Less Acute
Orthodox Economic Policy Has Made Recessions Less Frequent And Less Acute
Orthodox Economic Policy Has Made Recessions Less Frequent And Less Acute
What is the cause of constitutional decay, according to Polybius? Wealth, inequality, and corruption, which always follow from stable and prosperous times. “Avarice and unscrupulous money-making” drive the masses to encroach upon the elite and demand a greater share of the wealth. The result is a vicious cycle of conflict between the commons and the nobles until either the constitutional system is restored or a democratic revolution occurs. Compared to Thucydides, Polybius had less to say about the international balance of power. Domestic balance was his “solution” to unpredictable outside events. However, states with decaying political systems were off-balance and more likely to be conquered, or to overreach in trying to conquer others. Bottom Line: The “Polybius solution” equates with domestic political balance. Balanced states do not allow the nation’s leader, the elite, or the general population to become excessively powerful. But even the most balanced states will eventually decline. As they accumulate wealth, inequality and corruption emerge and cause conflict among the three powers. Why Polybius Matters Today It does not take a stretch of the imagination to apply the Polybius model to the United States today. Just as Rome grew fat with its winnings from the Punic Wars and decayed from a virtuous republic into a luxurious empire, as Polybius foresaw, so the United States lurched from victory over the Soviet Union to internal division and unforced errors. For instance, the budget surplus of 2% of GDP in the year 2000 became a budget deficit of 9% of GDP after a decade of gratuitous wars, profligate social spending and tax cuts, and financial excesses. It is on track to balloon again when the next recession hits – and this is true even without any historic crisis event to justify it. The rise in polarization has coincided with a rise in wealth inequality, much as Polybius would expect (Chart 7). In all likelihood the Trump tax cuts will exacerbate both of these trends (Chart 8). Even worse, any attempts by “the people” to take more wealth from the “nobles” will worsen polarization first, long before any improvements in equality translate to a drop in polarization. Chart 7Polarization Unlikely To Drop While Inequality Rises
Polarization Unlikely To Drop While Inequality Rises
Polarization Unlikely To Drop While Inequality Rises
Chart 8Trump Tax Cuts Fuel Inequality
Trump Tax Cuts Fuel Inequality
Trump Tax Cuts Fuel Inequality
Most importantly, from a global point of view, U.S. polarization is contaminating foreign policy. Just as the George W. Bush administration launched a preemptive war in Iraq, destabilizing the region, so the Obama administration precipitously withdrew from Iraq, destabilizing the region. And just as the Obama administration initiated a hurried détente with Iran in order to leave Iraq, the Trump administration precipitously withdrew from this détente, provoking a new conflict with Iran and potentially destabilizing Iraq. Major foreign policy initiatives have been conducted, and revoked, on a partisan basis under three administrations. And a Democratic victory in 2020 would result in a reversal of Trump’s initiatives. In the meantime Trump’s policy could easily entangle him in armed conflict with Iran – as nearly occurred on June 21. Iranian domestic politics make it very difficult, if not impossible, to go back to the 2015 setting. Despite Trump’s recent backpedaling, his administration runs a high risk of getting sucked into another Middle Eastern quagmire as long as it enforces the sanctions on Iranian oil stringently. Persian Gulf risks are coming to the fore. But over the next six-to-18 months, U.S.-China conflict will be the dominant market-mover. China would be the big winner if such a war occurred, just as it was one of the greatest beneficiaries of the long American distraction in Afghanistan and Iraq. It would benefit from another 5-10 years of American losses of blood and treasure. It would be able to pursue regional interests with less Interference and could trade limited cooperation with the U.S. on Iran for larger concessions elsewhere. And a nuclear-armed Iran – which is a long-term concern for the U.S. – is not in China’s national interest anyway. Chart 9Will The Pivot To Asia Reverse?
Will The Pivot To Asia Reverse?
Will The Pivot To Asia Reverse?
Bottom Line: The U.S. is missing the “Polybius solution” of balanced government; polarization is on the rise. As a result, the grand strategy of “pivoting to Asia” could go into reverse (Chart 9). If that occurs, the conflict with China will be postponed or ineffective. Iran Is The Wild Card A war with Iran manifestly runs afoul of the Trump administration’s and America’s national interests, whereas a trade war with China does not. First, although an Iranian or Iranian-backed attack on American troops would give Trump initial support in conducting air strikes, the consequences of war would likely be an oil price shock that would sink his approval rating over time and reduce his chances of reelection (Chart 10). We have shown that such a shock could come from sabotage in Iraq as well as from attacks on shipping in the Strait of Hormuz. Iran could be driven to attack if it believes the U.S. is about to attack. Second, not only would Democrats oppose a war with Iran, but Americans in general are war-weary, especially with regard to the Middle East (Chart 11). President Trump capitalized on this sentiment during his election campaign, especially in relation to Secretary Hillary Clinton who supported the war in Iraq. Over the past two weeks, he has downplayed the Iranian-backed tanker attacks, emphasized that he does not want war, and has ruled out “boots on the ground.” Chart 10Carter Gained Then Lost From Iran Oil Shock
Carter Gained Then Lost From Iran Oil Shock
Carter Gained Then Lost From Iran Oil Shock
Chart 11
Third, it follows from the above that, in the event of war, the United States would lack the political will necessary to achieve its core strategic objectives, such as eliminating Iran’s nuclear program or its power projection capabilities. And these are nearly impossible to accomplish from the air alone. And U.S. strategic planners are well aware that conflict with Iran will exact an opportunity cost by helping Russia and China consolidate spheres of influence. The wild card is Iran. President Hassan Rouhani has an incentive to look tough and push the limits, given that he was betrayed on the 2015 deal. And the regime itself is probably confident that it can survive American air strikes. American military strikes are still a serious constraint, but until the U.S. demonstrates that it is willing to go that far, Iran can test the boundaries. In doing so it also sends a message to its regional rivals – Saudi Arabia, the Gulf Arab monarchies, and Israel – that the U.S. is all bark, no bite, and thus unable to protect them from Iran. This may lead to a miscalculation that forces Trump to respond despite his inclinations. The China trade war, by contrast, is less difficult for the Trump administration to pursue. There is not a clear path from tariffs to economic recession, as with an oil shock: the U.S. economy has repeatedly shrugged off counter-tariffs and the Fed has been cowed. While Americans generally oppose the trade war, Trump’s base does not, and the health of the overall economy is far more important for most voters. And a majority of voters do believe that China’s trade practices are unfair. Strategic planners also favor confronting China – unlike Trump they are not concerned with reelection, but they recognize that China’s advantages grow over time, including in critical technologies. Bottom Line: While short-term events are pushing toward truce with China and war with Iran, the Trump administration is likely to downgrade the conflict with Iran and upgrade the conflict with China over the next six-to-18 months. Neither politics nor grand strategy support a war with Iran, whereas politics might support a trade war with China and grand strategy almost certainly does. China Could Learn From Polybius Too China also lacks the Polybius solution. It suffers from severe inequality and social immobility, just like the Latin American states and the U.S., U.K., and Italy (Chart 12). But unlike the developed markets, it lacks a robust constitutional system. Political risks are understated given the emergence of the middle class, systemic economic weaknesses, and poor governance. Over the long run, Xi Jinping will need to step down, but having removed the formal system for power transition, a succession crisis is likely.
Chart 12
China’s imbalances could cause domestic instability even if the U.S. becomes distracted by conflict in the Middle East. But China has unique tools for alleviating crises and smoothing out its economic slowdown, so the absence of outside pressure will probably determine its ability to avoid a painful economic slump. This helps to explain China’s interest in dealing with the U.S. on North Korea. President Xi Jinping’s first trip to Pyongyang late last month helped pave the way for President Trump to resume negotiations with the North’s leader Kim Jong Un at the first-ever visit of an American president north of the demilitarized zone (DMZ). China does not want an unbridled nuclear North Korea or an American preventative war on the peninsula. If Beijing could do a short-term deal with the U.S. on the basis of assistance in reining in North Korea’s nuclear and missile programs, it could divert U.S. animus away from itself and encourage the U.S. to turn its attention toward the next rogue nuclear aspirant, Iran. It would also avoid structural economic concessions. Of course, a smooth transition today means short-term gain but long-term pain for Chinese and global growth. Productivity and potential GDP will decline if China does not reform (Diagram 4). But this kind of transition is the regime’s preferred option since Beijing seeks to minimize immediate threats and maintain overall stability. Diagram 4Stimulus And Delayed Reforms = Socialist Put = Stagflation
The Polybius Solution
The Polybius Solution
If Chinese internal divisions do flare up, China’s leaders will take a more aggressive posture toward its neighbors and the United States in order to divert public attention and stir up patriotic support. Bottom Line: China suffers from understated internal political risk. While U.S. political divisions could lead to a lack of coherent strategy toward China, a rift in China could lead to Chinese aggression in its neighborhood, accelerating the Thucydides Trap. Investment Conclusions Chart 13An Iran War Will Bust The Budget
An Iran War Will Bust The Budget
An Iran War Will Bust The Budget
If the U.S. reverses the pivot to Asia, attacks Iran, antagonizes European allies, and exhausts its resources in policy vacillation, its budget deficit will balloon (Chart 13), oil prices will rise, and China will be left to manage its economic transition without a western coalition against it. The implication is a weakening dollar, at least initially. But the U.S. is nearing the end of its longest-ever business expansion and an oil price spike would bring forward the next recession, both of which will push up the greenback. Much will depend on the extent of any oil shock – whether and how long the Strait of Hormuz is blocked. Beyond the next recession, the dollar could suffer severe consequences for the U.S.’s wild policies. If the U.S. continues the pivot to Asia, and the U.S. and China proceed with tariffs, tech sanctions, saber-rattling, diplomatic crises, and possibly even military skirmishes, China will be forced into an abrupt and destabilizing economic transition. The U.S. dollar will strengthen as global growth decelerates. Developed market equities will outperform emerging market equities, but equities as a whole will underperform sovereign bonds and other safe-haven assets. Over the past week, developments point toward the former scenario, meaning that Persian Gulf risks are coming to the fore. But over the next six-to-18 months, we think the latter scenario will prevail. We are maintaining our risk-off trades: long JPY/USD, long gold, long Swiss bonds, and long USD/CNY. Matt Gertken, Vice President Geopolitical Strategist mattg@bcaresearch.com Footnotes 1 See Graham Allison, “The Thucydides Trap: Are The U.S. And China Headed For War?” The Atlantic, September 24, 2015, and Destined For War: Can America and China Escape Thucydides’s Trap? (New York: Houghton Mifflin Harcourt, 2017).
Oil prices will remain volatile as markets work through the lingering effects of tighter financial conditions prevailing last year, which, along with extended angst over Sino-U.S. trade tensions, slowed commodity demand growth (Chart of the Week). In 2H19, globally accommodative monetary policy and fiscal stimulus will revive demand for industrial commodities, particularly in EM economies. This will be most apparent in oil markets, where we continue to expect demand growth to strengthen going into 2020, aided in part by a weaker USD. On the supply side, this week’s extension of OPEC 2.0’s production cuts into 1Q20 means growth will remain constrained. Prices will rise, and forward curves, particularly for Brent, will steepen as refiners are forced to draw inventories to meet product demand.1 We continue to expect Brent to average $73/bbl this year and $75/bbl next, respectively. We expect WTI to trade $7/bbl and $5/bbl below that this year and next. Chart of the WeekEasing Financial Conditions Will Spur Oil Demand
Easing Financial Conditions Will Spur Oil Demand
Easing Financial Conditions Will Spur Oil Demand
Highlights Energy: Overweight. Venezuela’s oil production reportedly recovered to 1.1mm b/d in June. Most of the increased production found its way to China, which accounted for just under 60% of crude and product exports.2 Given its modus operandi, we believe OPEC 2.0 likely will accommodate higher production in Venezuela by reducing production in other member states, keeping overall output relatively constant. Base Metals: Neutral. Copper treatment and refining charges fell to new lows at the end of last week, with Fastmarkets MB’s Asia – Pacific TC/RC index recording its lowest level on record at $52.40/MT ($0.0524/lb).3 TC/RC levels fall when supplies are low, as refiners have to discount their services to attract concentrate supplies. Elsewhere, workers at Codelco’s Chuquicamata copper mine agreed to a new contract last week, ending a brief strike. Precious Metals: Neutral. Gold’s rally resumed this week, reflecting investors’ expectations for expanded central-bank accommodation globally, which, all else equal, will keep interest rates lower for longer. The Fed's dovish turn, in particular, will weaken the USD later this year, which will be positive for EM commodity demand, the engine for commodity demand growth globally. Ags/Softs: Underweight. The USDA reported 56% of corn in the ground was in good to excellent condition last week, vs. 76% of the crop last year. For soybeans, 54% of the U.S. crop was in good or excellent condition, vs. 71% last year. The USDA’s Crop Progress reports cover 92% and 95% of total acreage planted in the U.S., respectively. Feature Oil prices will remain volatile over the short term, as markets transition from tighter monetary conditions to a more accommodative global backdrop (Chart 2). Based on our research into the drivers of oil-price volatility, this should translate into a less stressful pricing environment for industrial commodities generally, base metals and oil in particular (Chart 3).4 Chart 2Volatility Indicators Are Moderating
Volatility Indicators Are Moderating
Volatility Indicators Are Moderating
Chart 3Signaling Oil Price Volatility Will Fall
Signaling Oil Price Volatility Will Fall
Signaling Oil Price Volatility Will Fall
Much of the current oil-price volatility is being driven by worries over damage to aggregate global demand and growth expectations in the wake of the Sino-U.S. trade war, and by what now appears to be a too-aggressive posture by central banks implementing rates-normalization policies last year. Both of these can affect consumption and investment locally and globally.5 Fear That Real Demand Will Weaken At present, any indication real demand is faltering – e.g., weaker manufacturing PMIs – gives industrial commodities an excuse to sell off (Chart 4). In the case of the Sino-U.S. trade war, presidents Xi and Trump appear to have agreed to re-start trade negotiations. Markets are not going to be terribly concerned with the specifics of a trade deal between the U.S. and China, but it does appear some rollback in U.S. tariffs will be necessary for a trade deal – perhaps in exchange for greater access to Chinese markets. However, our geopolitical strategists make the odds of a trade deal by the time U.S. elections roll around 1:3. Our colleagues in BCA Research’s Global Investment Strategy note, “The specifics of the deal are less important than there being a deal – any deal – that avoids a major escalation. Ultimately, the distinction between a ‘small’ trade war and a ‘moderate’ trade war is a function of how high tariffs end up being. Tariffs are taxes, and while no one likes to pay taxes, they are a familiar part of the global capitalist system.”6 As for monetary policy, major central banks are embarked on a coordinated effort to reverse falling inflation expectations, and will be vigorously stimulating their money supply and credit growth over the balance of the year. In addition, fiscal stimulus globally – in the U.S. and China most prominently – will boost real demand for industrial commodities, particularly oil and base metals.7 Monetary and fiscal stimulus operates with a lag, which is why we continue to expect its more visible for commodity demand to become apparent in commodity prices later in 2H19 and next year. This lagged effect can be seen in our expectation for the evolution of EM import volumes to year end, which we estimate using data compiled the CPB World Trade Monitor (Chart 5). EM import volumes are closely tied to the evolution of EM income, which drives global commodity demand.8 Chart 4Globally, The Real Economy Has Slowed
Globally, The Real Economy Has Slowed
Globally, The Real Economy Has Slowed
Chart 5EM Imports and Income Will Rebound
EM Imports and Income Will Rebound
EM Imports and Income Will Rebound
In our modeling of supply-demand balances and prices, we accounted for the reduced EM GDP growth brought about by more restrictive monetary policy last year and the slowdown in global trade in our most recent forecast. In our base case, we took our expected global oil-demand growth this year down to 1.35mm b/d from 1.5mm b/d earlier, and to 1.55mm b/d next year from 1.6mm b/d previously. These adjustments reduced our price expectation for Brent crude oil slightly to $73/bbl this year and $75/bbl next year, with WTI trading $7/bbl and $5/bbl below those respective levels (Chart 6). Chart 6Our Forecasts Reflect Lower Demand, Tighter Supply
Our Forecasts Reflect Lower Demand, Tighter Supply
Our Forecasts Reflect Lower Demand, Tighter Supply
Oil Markets Will Get Tighter For all of the concern over real demand, prompt demand remains stout relative to available supply, as can be seen in the backwardations for global benchmark crude oil prices (Chart 7). This week’s extension of OPEC 2.0’s production cuts into 1Q20 means supply growth will remain constrained, which, given our demand expectation, will tighten balances globally (Chart 8).9 Chart 7Global Oil Benchmarks Remain Backwardated
Global Oil Benchmarks Remain Backwardated
Global Oil Benchmarks Remain Backwardated
Chart 8Oil Supply Demand Balances Will Tighten
Oil Supply Demand Balances Will Tighten
Oil Supply Demand Balances Will Tighten
Chart 9Oil Inventories Will Fall, As Supply Is Constrained
Oil Inventories Will Fall, As Supply Is Constrained
Oil Inventories Will Fall, As Supply Is Constrained
As balances tighten in the wake of global fiscal and monetary stimulus, oil prices will rise, and forward curves, particularly for Brent, will steepen as refiners are forced to draw inventories to meet product demand (Chart 9). For this reason we remain long September – December 2019 Brent vs. short September – December 2020 Brent, expecting backwardation to increase.10 Bottom Line: We remain constructive toward oil markets, as they transition to a more accommodative monetary backdrop globally. Combined with fiscal stimulus in the U.S. and China in particular, demand will remain supported in 2H19 and 2020. The extension of OPEC 2.0’s production-cutting deal will tighten markets, forcing refiners to draw down inventories. Robert P. Ryan, Chief Commodity & Energy Strategist rryan@bcaresearch.com Footnotes 1 OPEC 2.0 is a name we coined for the OPEC/non-OPEC oil-producing coalition led by the Kingdom of Saudi Arabia (KSA) and Russia. Their agreement to extend production cuts of 1.2mm b/d into 1Q19 was announced this week in Vienna. Please see OPEC/non-OPEC rolls over oil output cuts for 9 months published by S&P Global Platts on July 2, 2019. Compliance with these cuts has been higher by ~ 400k b/d in 1H19 by our reckoning. 2 Please see Venezuela's June oil exports recover to over 1 million bpd: data published July 2, 2019, by reuters.com. 3 Please see Copper concs TCs drop marginally on traders purchase; Cobre Panama’s fresh supply hits market published by Fastmarkets MB June 28, 2019. 4 We are using “volatility” in the technical sense here – i.e., the standard deviation of per-annum returns. We have shown this can be explained by different variables, including EM volatility; U.S. financial conditions – as seen in the St. Louis Fed’s financial-stress index; and by speculative positioning, which tends to follow the evolution of prices as news flows change. For discussions of our volatility modeling, including the construction of Working’s T index, please see Specs Back Up The Truck For Oil, published April 26, 2018, and Feedback Loop: Spec Positioning & Oil Price Volatility, published May 10, 2018, by BCA Research’s Commodity & Energy Strategy. Both are available at ces.bcaresearch.com. 5 Please see The economic implications of rising protectionism: a euro area and global perspective published by European Central Bank April 24, 2019. 6 Please see Third Quarter 2019 Strategy Outlook: The Long Hurrah, BCA Research’s global macro outlook for 3Q19, published June 28, 2019, by our Global Investment Strategy. It is available at gis.bcaresearch.com. The larger issues that will have to be addressed at some point in the future are non-tariff barriers to trade, exemplified by Huawei’s exclusion from access to U.S. technology on national security grounds. An expansion of such non-tariff barriers would strand huge amounts of capital globally, which likely would lead to a global recession. 7 Our chief global strategist, Peter Berezin, notes in the above-cited BCA Research third-quarter outlook that Fed policy is expected to remain ultra-accommodative into late 2021, which will push the USD lower later this year, and will support commodity demand generally. 8 We use an FX-based model to estimate EM import volumes to year end off the CPB data. 9 We will be updating our Venezuela and OPEC 2.0 production estimates to reflect this development in our July global oil market balance publication later this month. 10 We have been long 2H19 Brent vs. short 2H20 Brent since February 28, 2019. The July and August pieces of this position returned 222.7% and 273% since inception. We remain long the September – December exposure. Investment Views and Themes Recommendations Strategic Recommendations TRADE RECOMMENDATION PERFORMANCE IN 2019 Q2
Image
Commodity Prices and Plays Reference Table Trades Closed in 2019 Summary of Closed Trades
Image