Policy

Highlights We are searching for evidence of an imminent end to this business cycle, … : Investors who recognize the onset of the recession in a timely fashion will have a leg up on the competition all the way through the intermediate term. … but the data do not support the increasingly popular conclusion that it is nearly at hand, … : The U.S. economy is doing quite well and contradicts the message from the inverted yield curve, which may well be a less powerful signal than it has been in the past. … and it’s hard to see the end of the expansion when the Fed’s trying its utmost to sustain it: Restrictive monetary policy is a necessary, if not sufficient, condition for a recession. Last week’s FOMC meeting pushed that eventuality beyond the visible horizon. Maintain a pro-risk portfolio positioning. Feature What if you gave a party and nobody came? The U.S. economy is finding out as we speak. The expansion that began in July 2009 turns ten years old at the end of the week, and no one seems to care. An expansion and bull market that have been derided from the get-go as “artificial,” “manufactured,” and “propped up by money printing” continue to be unloved, yet manage to keep chugging along like the Energizer bunny. The expansion has been no more pleasing to the eye than the famous toy in the battery commercials, plodding along at an often sluggish pace, but that may be the secret to its longevity. It has never been able to achieve a high enough rate of speed to give rise to unsustainable activity in the most cyclical segments of the economy. Ditto the bull markets in equities and spread product. Held in check by a deficiency of animal spirits, they have failed to breed valuation excesses. In the absence of a clearly approaching catalyst for reversal, internal or external, there is no reason to expect that the U.S. economy cannot continue to expand at its meandering post-crisis pace. An increasing number of market participants, including some within BCA, cite the inverted yield curve, disappointing May employment report, and weakening manufacturing activity at home and abroad as ill portents for the economy. On the face of it, these factors are surely inauspicious. Upon further examination, though, they aren’t as bad as they’ve been made out to be. An investor who sniffs out the next recession, and shifts asset allocation aggressively in line with that recognition, will have a very good chance of outperforming over both the near and intermediate term. Timely recognition of inflection points is how macro analysis most clearly benefits money managers. Since equity bull markets tend to be highly potent in their final stages, however, crying wolf can be especially damaging to relative performance. In our view, the available evidence does not support the conclusion that the end of the cycle is at hand and that investors should de-risk their portfolios. The Yield Curve Isn’t What It Used To Be We do not know how many basis points can dance on the head of a pin, and neither do the battalions of central bank economists who have been unable to settle exactly how large-scale asset purchases hold down interest rates. Those purchases’ flow effect (the share of newly-issued bonds purchased by a central bank), stock effect (the share of outstanding bonds held by a central bank), and forward guidance’s muzzling of bond and inflation volatility may all play a role. At the end of the day, it appears quite likely that QE has depressed the term premium on the 10-year Treasury bond, which recently made 50-year lows. The term premium is the compensation investors receive for tying up their money in a longer-maturity instrument, and it is a whopping 250 basis points below its long-run mean (Chart 1). Chart 1The Bombed-Out Term Premium ...
The Bombed-Out Term Premium ...
The Bombed-Out Term Premium ...
Yield curve has been a reliable, if often early, leading indicator of recessions for the last 50 years. The unprecedentedly low 10-year term premium renders the definitive 3-month/10-year segment of the yield curve considerably more prone to invert. The only sustained yield-curve inversion that issued a false recession signal in the 57-year history of the Adrian, Crump and Moench term-premium estimate occurred in late 1966/early 1967,1 when the term premium skittered around both sides of the zero bound (Chart 2). If investors had received no additional compensation for holding the 10-year Treasury over the last five decades, an inverted curve would be a regular feature of the investment landscape (Chart 3). Chart 2... Is Distorting The Signal From The Yield Curve, ...
... Is Distorting The Signal From The Yield Curve, ...
... Is Distorting The Signal From The Yield Curve, ...
Chart 3... Which Wouldn't Slope Upward Without It
... Which Wouldn't Slope Upward Without It
... Which Wouldn't Slope Upward Without It
Leading Data Do Not Confirm The Yield Curve’s Signal Chart 4Only Manufacturing Looks Recession-ish
Only Manufacturing Looks Recession-ish
Only Manufacturing Looks Recession-ish
Investors ignore the yield curve at their own risk. It has been a reliable, if often early, leading indicator of recessions for the last 50 years. We view its current inversion as a yellow light, and it is making us more vigilant about seeking out evidence of a slowdown. Given that the negative term premium weighs heavily on long-dated yields, however, investors should not de-risk portfolios unless the flow of data corroborates its signal. Our Global Fixed Income Strategy colleagues sought that corroboration by performing a cycle-on-cycle analysis of a selection of data series with leading properties – the Conference Board’s LEI, initial unemployment claims, the manufacturing ISM’s new-orders-to-inventories ratio and the Conference Board’s consumer confidence index. The analysis compares the current position of each indicator with its average position in the run-up to the last five recessions (January-July ’80 through December ’07-June ’09). With the exception of the weak new-orders-to-inventories ratio (Chart 4, third panel), none of the indicators are in a position that suggests trouble lies ahead (Chart 4). For the time being, the incoming data flow only confirms the concerns about the weak manufacturing outlook. Is Economic Activity Really Slowing? The course of GDP growth makes it appear as if the U.S. is slowing pretty quickly. After the first quarter’s surprisingly strong 3.1% growth, consensus second-quarter estimates are hovering around 1.75%. Viewed alongside the sizable shortfall in May payroll gains, uninspiring housing activity and a sharp global manufacturing downturn, the deceleration in GDP growth seems to confirm the notion that the U.S. economy is weakening fast. We are not overly concerned about the labor market, housing or manufacturing, however, and the GDP trend is not what it appears to be at first blush. Real final domestic demand growth at 3% is well above the economy’s long-run potential and is hardly the sign of an economy that’s gasping for air, or staggering under the weight of an overly high fed funds rate. To get the best read on the underlying state of the domestic economy, we adjust GDP data to back out net exports and inventory adjustments. Backing out net exports puts the focus on domestic conditions, while removing inventory adjustments isolates sales to end consumers. The result is real final domestic demand, and according to the Atlanta Fed’s GDPNow model, it accelerated sharply between the first and second quarters. The first quarter was flattered by a 60-basis-point (“bps”) inventory build and a highly-unlikely-to-be-repeated 100-bps contribution from net exports. After backing those components out of the headline 3.1% gain, first quarter growth slips to 1.5%. That may not look like much against 2-2.25% trend growth, but it was not at all bad given the body blows the economy sustained in the first quarter: the federal government shutdown that stretched across nearly all of January, and the severe tightening in financial conditions resulting from the fourth quarter’s sharp sell-offs in equities and risky bonds. Following last week’s stronger-than-expected May retail sales report (and upwardly revised April data), the GDPNow model is projecting 2% growth in the second quarter. Per the model’s detailed projections, the headline gain is being held back by a 100-bps inventory runoff. Removing the inventory adjustment, real final domestic demand is projected to grow at 3% (net exports are projected to make zero contribution). 3% growth is well above the economy’s long-run potential and is hardly the sign of an economy that’s gasping for air, or staggering under the weight of an overly high fed funds rate. Per the current GDPNow projections, real final domestic demand growth is above the expansion’s mean growth rate, casting some doubt on whether the yield curve’s signal has been overwhelmed by a pickup in risk aversion and the factors that have flipped the term premium on its head. 3% real final domestic demand represents a quickening in the pace of growth that has prevailed across the 40 quarters of the expansion (Chart 5), and is incompatible with the message from the New York Fed’s yield curve-based recession probability indicator (“RPI”). To evaluate the current warning, we compared the standardized value of real final domestic demand growth during the previous quarters of the expansion when the New York Fed’s RPI was above the 33% level that has accurately foretold every recession over the last 50 years (Chart 6). When all of the previous RPI warning signals were issued, real final domestic demand growth was slower than its expansion average (z-score less than zero), and in all but one case considerably slower, clustering around one standard deviation below the mean (Table 1). Per the current GDPNow projections, real final domestic demand growth is above the expansion’s mean growth rate, casting some doubt on whether the yield curve’s signal has been overwhelmed by a pickup in risk aversion and the factors that have flipped the term premium on its head. Chart 5Real Final Domestic Demand Is Still Vigorous
Real Final Domestic Demand Is Still Vigorous
Real Final Domestic Demand Is Still Vigorous
Chart 6The New York Fed's Yield-Curve-Based Recession Model Is Flashing Red
The New York Fed's Yield-Curve-Based Recession Model Is Flashing Red
The New York Fed's Yield-Curve-Based Recession Model Is Flashing Red
The Labor Market Is Still Roaring Table 1New York Fed Recession Warnings And Economic Conditions
Everybody Into The Pool!
Everybody Into The Pool!
Consumption plays an outsized role in the U.S. economy, accounting for over two-thirds of GDP. As macro analysts are well aware, if you have an accurate read on consumption, you’ll know where the U.S. economy is headed. Extending the relationship to encompass household income’s impact on spending, and employment’s impact on income, the expression can be rewritten as: If you get the labor market right, you’ll get consumption right. The May employment situation report was roundly disappointing, as May net hirings fell short of expectations by about 100,000 and March and April gains were revised down by 75,000. Chart 7Employees Are Gaining The Upper Hand
Employees Are Gaining The Upper Hand
Employees Are Gaining The Upper Hand
The three-month moving average of net payroll additions slipped to just over 150,000. 110,000 monthly net additions is all it takes to keep the unemployment rate at a steady state, however, and there is some evidence that Midwestern flooding held down the May figure. With the job openings rate at a series high well above the 2006-07 peak and (most likely) above the peak in 1999-2000 (Chart 7, top panel), there is quite a lot of demand for new workers, as confirmed by the sizable margin of consumers who report that jobs are plentiful over those who report they’re hard to get (Chart 7, middle panel). The elevated quits rate (Chart 7, bottom panel) indicates that employers are competing fiercely to fill that demand. Given that almost no one quits a job unless s/he already has another one lined up, the quits rate reveals that employers are poaching employees from each other. When Employer A, after losing an employee to Employer B, plucks a replacement away from Employer C or Employer D, a self-reinforcing cycle quickly springs up that endows employees with some bargaining power. The budding dynamic is good for household income and good for consumption. Manufacturing’s Softness Isn’t Such A Big Deal The weakness in manufacturing PMI surveys around the world reveals that there has clearly been a significant global manufacturing slowdown, if not a full-on global manufacturing recession. The steep slide in the U.S. manufacturing PMI shows that it has not been immune. Manufacturing only accounts for about one-sixth of U.S. output and employment, however, and the level of the PMI series, which has simply returned to its mean level across the last three complete cycles, is not a cause for concern (Chart 8). The trend is worrisome, though, and we are watching to see if it breaks through the 50 boom-bust line. Manufacturing is weakening, but it’s not in dire straits yet. Chart 8Manufacturing Is Weakening, But It's Not In Dire Straits Yet
Manufacturing Is Weakening, But It's Not In Dire Straits Yet
Manufacturing Is Weakening, But It's Not In Dire Straits Yet
Refilling The Punch Bowl This week’s FOMC meeting delivered on the change in tone intimated by Fed speakers at the beginning of the month. It appears that a couple of rate cuts may be forthcoming, whether the economy needs them or not. We had advised clients that the chances of a July rate cut were slightly more than fifty-fifty, but the probability now appears to be much higher. A follow-up cut in September also seems likely. The Fed’s move to insure against an economic shock pushes out our recession timetable yet again. If the fed funds rate is headed to 2% from its current 2.5%, the road to a restrictive policy setting in the mid-3s just got longer. The good news for our recommendations is that they were already decidedly risk friendly, on the grounds that there’s no need to de-risk until a recession is around six months away. Assuming no exogenous event intrudes on U.S. economic activity, neither the expansion nor the bull markets in risk assets will end until the Fed takes away the punch bowl. Right now, it seems intent on refilling it. As a client in Western Canada put it in a meeting with us last week, “Game on!” Doug Peta, CFA Chief U.S. Investment Strategist dougp@bcaresearch.com Footnotes 1 On the basis of monthly rate/yield data, the 1998 false positive comprised just one observation (September).
The highlight of next week will be the highly anticipated Xi-Trump meeting at the G20 in Osaka on Friday or Saturday. BCA does not anticipate a deal that will end the trade to come out of this get-together, but an agreement for China and the U.S. to start…
Freedom of navigation on the open seas is sine qua non for a well-functioning oil market – everything from getting supplies to refiners to getting products to consumers depends on it. Oil is a globally traded, waterborne commodity: ~ 60% of all crude…

The Yield Curve Control (YCC) strategy is the only real remaining arrow in the BoJ’s quiver. Via YCC, the BoJ targets a 10-year JGB yield close to 0% and manages purchases to sustain the yield target. In our view, any upward adjustment of that yield target…
JGBs outperform their developed market peers when global yields rise, and underperform when global yields fall. In other words, JGBs are a low-beta sovereign bond market, making them a useful way to manage duration risk in a global bond portfolio –…
Highlights This week’s FOMC statement, together with the accompanying press conference, signaled a clear change in tone from the Fed. Despite the fact that underlying growth remains well above trend, a rate cut in July is now more likely than not. An additional “insurance cut” is also probable in September. Right now, rising inflation is not much of a risk. However, the Fed’s dovish turn almost guarantees that the U.S. economy will overheat. This reinforces our view that Fed policy will unfold in a two-stage process: A period of excessively easy monetary policy stretching past the next presidential election, followed by a burst of inflation that ultimately forces the Fed to hike rates. While stocks will perform well during the first stage, they will suffer during the second. We turned positive on global equities last December, but initiated a tactical hedge in May of this year. We are now extinguishing this hedge. The dollar is likely to weaken over the coming months. Cyclical equity sectors will start outperforming defensives, while international stocks will outperform their U.S. peers. We went long gold on April 17th. The trade is up 9.2% since then. Stick with it. Feature Redefining Dovish I have had the pleasure of meeting clients in the U.S. southeast this week. Unsurprisingly, the Fed has been a hot topic of discussion. Had one been told two months ago that the Federal Reserve would drop the word “patient” from the FOMC statement, one would have plausibly concluded that the Fed was about to hike rates. Little would one have known that what constitutes dovishness would change so much so quickly. Today, a dovish Fed means one that is about to cut rates. In a complete inversion of the original connotation of the term, patient is now considered hawkish. This change in tone was not immediately evident in the median 2019 interest rate dot in the June Summary of Economic Projections released this week. Just as in March, it remains stuck at 2.4%, implying a flat profile for rates over the remainder of the year. However, underneath the surface, there was a whirlwind of change. We are inclined to believe that if the Fed cuts rates in July, it will also cut rates again in September. In March, not a single FOMC member expected rates to fall this year. In the June statement, eight members penciled in rate cuts, seven of whom now expect 50 basis points of easing in the remainder of 2019 (Chart 1). The only reason the median dot did not budge was because eight members continued to cling to the expectation that the Fed would be able to keep rates at current levels throughout this year, with an additional member predicting a rate hike (down from six members who expected at least one rate hike in March).
Chart 1
Tellingly, a slim majority (9 out of 17) FOMC members now expect rates to be lower in 2020 than they are currently. This tells us that some of the members who elected not to show cuts in the dot plot for 2019 have a very low bar for cutting rates. Most likely, they are looking to see how the trade talks play out before pulling the trigger on rate cuts. Our baseline expectation is that there will be enough progress in the trade negotiations at the G20 summit to keep the U.S. from imposing a further $300 billion in tariffs on Chinese imports. However, an all-encompassing deal, which rolls back existing tariffs, is not in the cards. In such a muddle-through scenario, we think a rate cut in July is still more likely than not. The fact that Jay Powell did little to push back against market expectations of rate cuts this year during his press conference this week indicates that the Fed is preparing to cut rates. How Much More Easing?
Chart 2
Now that a July cut is looking increasingly like a done deal, the question is how low will rates go? Historically, when the Fed has cut rates, it has done so multiple times. Thus, it is not surprising that the market is currently assigning a 97% chance of two or more rate cuts this year and a 75% chance of three or more cuts (Chart 2). The entire futures curve is pointing to a fed funds rate of only 1.25% at end-2020 (Chart 3).
Chart 3
We are inclined to believe that if the Fed cuts rates in July, it will also cut rates again in September. However, we doubt that the Fed will deliver as much easing as is currently priced in. For one thing, it is not clear that the economy needs it. According to the Atlanta Fed’s GDPNow model, real final domestic demand is on course to accelerate from 1.5% in Q1 to 3.1% in Q2 (Chart 4). Real consumer spending is on track to rise by a whopping 3.9% in Q2.
Chart 4
Chart 5Declining Yields Bode Well For Housing
Declining Yields Bode Well For Housing
Declining Yields Bode Well For Housing
The only reason that headline GDP growth is set to decline in Q2 is because inventory destocking will detract from growth, having contributed to it in Q1. Keep in mind that inventory destocking is a positive indicator for future output growth because it means that final sales are running above current production levels. As we get into the second half of the year, inventories will start making a positive contribution to growth. The lagged effects from the substantial decline in bond yields will also be hitting the economy with full force. Housing, in particular, stands to benefit (Chart 5). Meanwhile, Chinese stimulus will be working its way through the global economy, likely lifting global growth in the process. Take Out Some Insurance? Chart 6Inflation Expectations Have Dropped
Inflation Expectations Have Dropped
Inflation Expectations Have Dropped
Some monetary easing could still be justified on precautionary grounds, even if growth does seem to be holding up. The zero bound constraint remains a formidable threat. It does make sense to try to raise inflation expectations in order to allow real rates to fall deeper into negative territory in the event that a recession occurs. The fact that market-based inflation expectations have dropped sharply since last autumn has clearly influenced the Fed’s thinking (Chart 6). Right now, inflation is not a significant risk. An escalation of the trade war would push up import prices, but this is unlikely to have a lasting effect on inflation, given that Chinese imports account for only 2.5% of U.S. GDP. Indeed, a severe trade war could actually reduce U.S. inflation by causing global growth to slow which would push down commodity prices and push up the dollar. Still, we would not push the “insurance” argument too hard. Current policy rates are close to neutral according to the widely-cited Laubach Williams model, and somewhat below the “longer run” range of 2.4%-to-3.3% in the Fed's latest projections. In 1995 and 1998, the last two episodes in which the Fed engaged in precautionary easing, real rates reached 4% (Chart 7). This was well above their equilibrium level. Chart 7The Fed Embarked On Precautionary Easing In The 1990s Amid Restrictive Real Rates
The Fed Embarked On Precautionary Easing In The 1990s Amid Restrictive Real Rates
The Fed Embarked On Precautionary Easing In The 1990s Amid Restrictive Real Rates
Of course, if it turns out that the Fed’s estimate of the real neutral rate of interest, low as it is at 0%, is still too high, continued rate cuts will be necessary. However, as we discussed last week,1 the evidence, if anything, suggests that the neutral rate is higher than what the Fed thinks. This implies that monetary policy is currently very expansionary and will only become more so if the Fed cuts rates. A Two-Stage Cycle The discussion above suggests that Fed policy will unfold as a two-stage process: A period of excessively easy monetary policy stretching past the next presidential election, followed by a burst of inflation that ultimately forces the Fed to hike rates. Chart 8No Imminent Threat Of A Wage-Price Inflationary Spiral
No Imminent Threat Of A Wage-Price Inflationary Spiral
No Imminent Threat Of A Wage-Price Inflationary Spiral
It is difficult to be precise about when inflation will reach a level that starts to worry the Fed. Wage growth has picked up, but so far, this has been more than offset by a cyclical revival in productivity growth. In fact, unit labor cost inflation, which leads core inflation by around 12 months, has decelerated sharply (Chart 8). However, if the unemployment rate continues to drop, wage growth will begin to outstrip productivity gains. A wage-price spiral could develop. This is not a major risk for the next 12 months, but could become an issue in late-2020 or early-2021. Implications For Investment Strategy The Fed determines rates in the short run, but it is the economy that dictates rates in the long run. If the Fed keeps rates too low for too long, as we expect will be the case, inflation will eventually rise, forcing the Fed to hike rates. Ironically, the Fed’s decision to cut rates over the coming months means that the terminal rate during this cycle will be higher than if they had just stood pat. The longer-term investment implications for bonds are clear: Treasury yields will rise much more than expected over a horizon of two-to-three years. Investors should reduce duration risk and favor inflation-protected securities over nominal bonds. Gold should also be bought as a hedge. We went long gold on April 17th. The trade is up 9.2% since then. Stick with it. The picture for bonds is more nuanced over a shorter-term horizon of six-to-nine months. Now that the Fed has decided to cut rates, it will be difficult for yields to rise anywhere close to last year’s highs. Still, given our expectation of accelerating U.S. and global growth, the Fed is likely to cut rates by less than what is currently discounted. A modest short duration stance is thus still warranted. We turned bullish on global equities in December following the steep market sell off and have remained structurally overweight stocks throughout this entire year. We did, however, initiate a tactical hedge to short the S&P 500 on May 10 following what we regarded as an overly complacent reaction by investors to President Trump’s decision to further raise tariffs on Chinese imports. While our decision to put on the hedge initially looked prescient, the combination of the Fed’s dovish turn, a shift toward easier monetary policy by other central banks (such as the ECB this week), and growing optimism over a resolution to the trade war have caused stocks to rally above our entry point. We are thus closing this hedge for a loss of 3.8%. Ultimately, if our view that the neutral rate of interest in the U.S. is higher than widely believed turns out to be correct, equities will perform well. This is simply because a higher neutral rate implies that monetary policy is currently expansionary. Recessions rarely occur when monetary policy is accommodative, while equity bear markets rarely happen outside of recessionary periods (Chart 9). Ergo, stocks are more likely to rise than fall until interest rates increase significantly (which is unlikely to happen anytime soon). Chart 9Recessions And Bear Markets Usually Overlap
Recessions And Bear Markets Usually Overlap
Recessions And Bear Markets Usually Overlap
Chart 10The Dollar Is A Countercyclical Currency
The Dollar Is A Countercyclical Currency
The Dollar Is A Countercyclical Currency
As a countercyclical currency, the dollar will probably weaken over the coming months as global growth picks up (Chart 10). Cyclical equity sectors will start outperforming defensives, while international stocks will outperform their U.S. peers. Peter Berezin, Chief Global Strategist Global Investment Strategy peterb@bcaresearch.com Footnotes 1 Please see Global Investment Strategy Weekly Report, “A Two-Stage Fed Cycle,” dated June 14, 2019. Strategy & Market Trends MacroQuant Model And Current Subjective Scores
Chart 11
Tactical Trades Strategic Recommendations Closed Trades
Highlights The unifying chorus among global central banks is currently for more monetary stimulus. In the race towards lower interest rates, the ultimate winners will be pro-cyclical currencies. Italian 10-year real government bond yields are rapidly joining those in Spain and Portugal in being below the neutral rate of interest for the entire euro zone. This is hugely reflationary. That said, growth barometers remain in freefall, suggesting some patience is still warranted. We are watching like hawks a few key crosses that are sitting at critical technical levels. A break below will signal we are entering a deflationary bust. A bounce could be a prologue to a reflationary rally. Watch the bond-to-gold ratio to gauge where the balance of forces are shifting for the U.S. dollar. Tepid action by the BoJ this week reinforces our view that the path towards additional stimulus will be lined by a stronger yen. Stay short USD/JPY. We were a few pips away from our stop loss on long GBP/USD this week. Stand aside if triggered. The Norges Bank has emerged as the most hawkish G10 central bank. Hold long NOK/SEK and short CAD/NOK positions. Feature As early as 1625, Hugo De Groot, then a Dutch philosopher, saw the act of pre-emptively striking an enemy as a move of self-defense. With a mandate of self-preservation, it made sense for a country to wage war for injury not yet done, if sufficient evidence pointed to colossal damage from no action. So faced with some important central bank meetings this week, and European manufacturing data well into freefall, the European Central Bank pulled a trick out of an old playbook. At an ECB forum in Sintra, Portugal, President Mario Draghi highlighted that if the inflation outlook failed to improve, the central bank had considerable headroom to launch a fresh expansion of its balance sheet. With its next policy meeting not until July 25th, it sure did feel like the ECB was cornered. What followed was as expected, a more dovish Federal Reserve, Bank Of Japan and Bank of England. Paradoxically, those two words might have opened a reflationary window and triggered one of the necessary catalysts for a sharp selloff in the U.S. dollar (Chart I-1). Time Lags The key question today is whether central banks have sufficiently eased policy to stem the decline in manufacturing data. Obviously, the trade war remains a key risk to whatever direction indicators might be pointing to today, but a few key observations are in order. Chart I-1A Countertrend Rally Underway
A Countertrend Rally Underway
A Countertrend Rally Underway
Chart I-2Dovish Central Banks Should Help Growth
Dovish Central Banks Should Help Growth
Dovish Central Banks Should Help Growth
Our global monetary policy barometer tends to lead the PMI by about six months. It tracks 29 central banks, gauging which have tightened policy over the last three months and which have not. Since the global financial crisis, whenever the measure has hit the critical threshold of 15-20%, it has correctly signaled that the pace of manufacturing activity is likely to slow. It is entirely another debate whether or not the world we live in today can tolerate higher interest rates, but our barometer has clearly plunged into reflationary territory – below the 20% threshold. This has usually been followed by a pick-up in manufacturing activity (Chart I-2). Data out of Singapore has been a timely tracker of global trade and warrants monitoring. Most real-time measures of economic activity remain weak, especially in the export sector, but it appears shipping activity may have been picking up pace over the past few months. Both the Harpex Shipping Index and the Baltic Dry Index have been perking up. Similarly, vessel arrivals into Singapore that tend to lead exports have stopped their pace of deceleration. It is still too early to read much into this data, since it could be a reflection of re-stocking ahead of possible tariffs. That said, data out of Singapore has been a timely tracker of global trade and warrants monitoring (Chart I-3). Chart I-3ASigns Of Life Along Shipping Lanes
Signs Of Life Along Shipping Lanes
Signs Of Life Along Shipping Lanes
Chart I-3BWatch Activity At Singaporean Ports
Watch Activity At Singaporean Ports
Watch Activity At Singaporean Ports
Chinese money growth, especially forward-looking liquidity indicators such as M2 relative to GDP, has bottomed. Historically, this has lit a fire under cyclical stocks, and by extension pro-cyclical currencies. This is also consistent with the fall in Chinese bond yields that has historically tended to be supportive for money growth in the ensuing months (Chart I-4). Overall industrial production remains weak, but the production of electricity and steel, inputs into the overall manufacturing value chain, are inflecting higher. Intuitively, these tend to lead overall industrial production. In recent weeks, both steel and iron ore prices have been soaring. Many commentators have attributed these increases to supply bottlenecks and/or seasonal demand. However, it is evident from both the manufacturing data and the trend in prices that demand is also playing a role. Overall residential property sales remain soft, but the evidence from tier-1 and even tier-2 cities is that this may be behind us. A revival in the property market will support construction activity, investment and imports (Chart I-5). Chart I-4A Bullish Signal For Chinese Liquidity
A Bullish Signal For Chinese Liquidity
A Bullish Signal For Chinese Liquidity
Chart I-5
Finally, high-beta currencies such as the RUB/USD, ZAR/USD and BRL/USD have stopped falling and are off their lows of the year. These currencies are usually good at sniffing out a change in the investment landscape, specifically one becoming more favorable to carry trades. The message so far is that the drop in U.S. bond yields may have been sufficient to make these currencies attractive again (Chart I-6). On a similar note, if currencies in emerging Asia that sit closer to the epicenter of Chinese stimulus can rally from here, it would indicate that policy stimulus is sufficient, and that the transmission mechanism is working. Chart I-6High-Beta Currencies Have Stopped Falling
High-Beta Currencies Have Stopped Falling
High-Beta Currencies Have Stopped Falling
Chart I-7AUD/JPY Near A Critical Level
AUD/JPY Near A Critical Level
AUD/JPY Near A Critical Level
Importantly, the AUD/JPY cross is sitting at an important technical level. Ever since the financial crisis, 72.5 has proven to be formidable intra-day resistance, with the cross failing to break below both during the euro area debt crisis in 2011-2012 and the China slowdown of 2015-2016. Speculators are neutral on the cross, suggesting any move in either direction could be powerful and significant. A break below will signal we are entering a deflationary bust. A bounce could be a prologue to a reflationary rally (Chart I-7). Bottom Line: We are watching a few key reflationary indicators to gauge whether it pays to be contrarian. The message is tipping in favor of pro-cyclical currencies, and further improvement will give us the green light to adopt a more pro-cyclical stance. The Message From The U.S. Dollar The market interpreted the Fed’s latest monetary policy announcement as dovish, even though the central bank kept rates on hold. What transpired during the conference was the market increasing its bets for more aggressive rate cuts. The swaps market is currently pricing in 94 basis points of rate cuts over the next 12 months, versus 76 basis points a fortnight ago. This shift has pushed down the dollar, lifting other currencies and gold in the process. U.S. bond yields have also punched below 2%. Interest rate differentials are moving against the dollar, but our important takeaway – that gold continues to outperform Treasurys – is an ominous sign. Even before the financial crisis, a long-standing benchmark for gauging ultimate downside in the dollar was the bond-to-gold ratio. This is because gold has stood as a viable threat to dollar liabilities, capturing the ebbs and flows of investor confidence in the greenback tick for tick. Any sign that the balance of forces are moving away from the U.S. dollar will favor a breakout in the bond-to-gold ratio. Chart I-8Major Peak In The Bond-To-Gold Ratio?
Major Peak In The Bond-To-Gold Ratio?
Major Peak In The Bond-To-Gold Ratio?
The rationale is pretty simple. Investors who are worried about U.S. twin deficits and the crowded trade of being long Treasurys will shift into gold, since pretty much every other major bond market (Germany, Switzerland, Japan) have negative yields. That favors gold at the expense of the dollar. The reverse is true if investors consider Treasurys more of a safe haven. The bond-to-gold ratio and dollar tend to move tick for tick, so a breakout in one can be a signal for what will happen to the other. This is why we are watching this ratio like hawks, and the breakdown this week is a bad omen for the U.S. dollar (Chart I-8). The euro might be the biggest beneficiary from the fall in the dollar. The standard dilemma for the euro zone is that interest rates have always been too low for the most productive nation, Germany, but too expensive for others such as Spain and Italy.1 As such, the euro has typically been caught in a tug-of-war between a rising equilibrium rate of interest for Germany, but a very low neutral rate for the peripheral countries. The silver lining is that the ECB may now have finally lowered domestic interest rates and eased policy to the point where they are accommodative for almost all euro zone countries: 10-year government bond yields in France, Spain, Portugal and even Italy now sit close to or below the neutral rate (Chart I-9). The ECB may now have finally lowered domestic interest rates and eased policy to the point where they are accommodative for almost all euro zone countries. Chart I-9The ECB May Have Won The Euro Battle
The ECB May Have Won The Euro Battle
The ECB May Have Won The Euro Battle
The drop in the euro since 2018 has also eased financial conditions and made euro zone companies more competitive. This is a tailwind for European stocks. Fortunately for investors, European equities, especially those in the periphery, remain unloved, given they are trading at some of the cheapest cyclically adjusted price-to-earnings multiples in the developed world. Analysts began aggressively revising up their earnings estimates for euro zone equities earlier this year, relative to the U.S. If they are right, this could lead into powerful inflows into the euro over the next nine to 12 months (Chart I-10). Chart I-10The Euro May Be On The Verge Of A Major Pop
The Euro May Be On The Verge Of A Major Pop
The Euro May Be On The Verge Of A Major Pop
Bottom Line: Falling rate expectations relative to policy action have historically been bearish for the dollar with a lag of about nine to 12 months. The dollar has been relatively resilient, despite interest rate differentials are moving against it, but has started to converge towards lower rates. One winner will be EUR/USD. Stay Short USD/JPY The BoJ kept monetary policy on hold this week, but the message was cautious, even encouraging fiscal support. It looks like the end of the Heisei era2 has brought forward a well-known quandary for the central bank, which is that additional monetary policy options are hard to come by, since there have been diminishing economic returns to additional stimulus. This puts short USD/JPY bets in an enviable “heads I win, tails I do not lose too much” position. Chart I-11Stealth Tapering By The BoJ
Stealth Tapering By The BoJ
Stealth Tapering By The BoJ
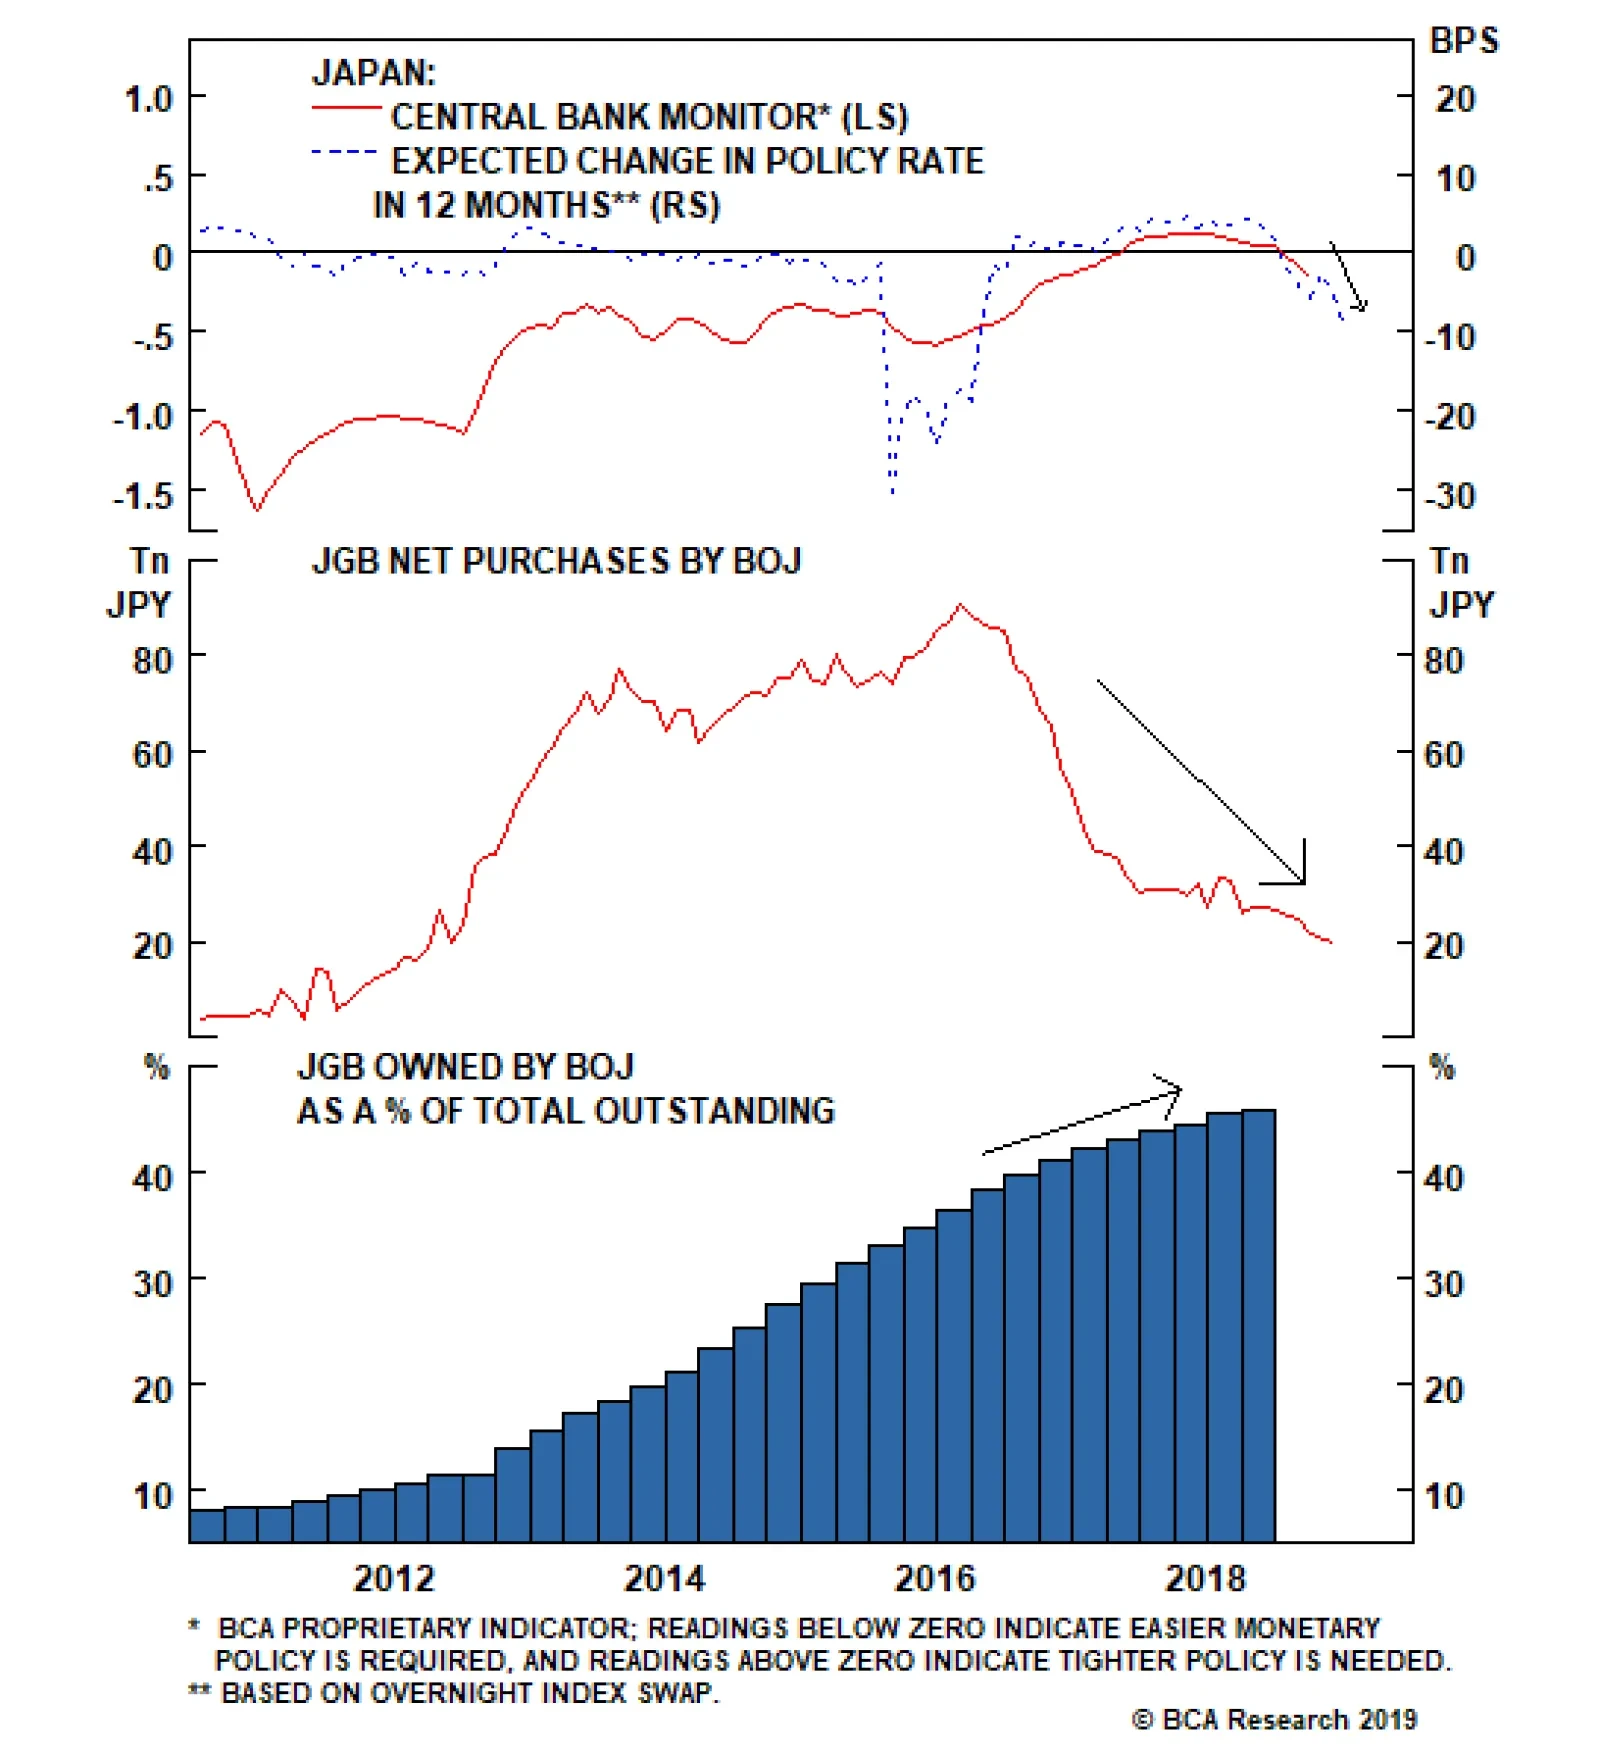
The BoJ maintained Yield Curve Control (YCC), stating it will continue to “conduct purchases of JGBs in a flexible manner so that their amount outstanding will increase at an annual pace of about 80 trillion yen.”3 But with the BoJ owning 46% of outstanding JGBs, about 75% of ETFs and almost 5% of JREITs, this will be a tall order (Chart I-11). The supply side obviously puts a serious limitation on how much more stimulus the central bank can provide. Total annual asset purchases by the BoJ are currently running at about ¥27 trillion, while JGBs purchases are running at ¥20 trillion. This is a far cry from the central bank’s soft target of ¥80 trillion, and unlikely to change anytime soon, given bond yields closing in on the -20 basis-point floor. This means interest rate differentials are likely to move in favor of a stronger yen short term (Chart I-12). The BoJ targets an inflation rate of 2%, but it is an open question as to whether it can actually achieve this. The overarching theme for prices in Japan is a rapidly falling (and ageing) population leading to deficient demand. More importantly, almost 40% of the Japanese consumption basket is in tradeable goods, meaning domestic inflation is as much driven by the influence of the BoJ as it is by globalization. Even for prices within the BoJ’s control, an ageing demographic that has a strong preference for falling prices is a powerful conflicting force. For example, transportation and telecommunications make up 17% of the core consumption basket in Japan, a non-negligible weight. This is and will remain a powerful drag on CPI, making it very difficult for the BoJ to re-anchor inflation expectations upward. The risk to short USD/JPY positions is that the BoJ will eventually act, but it may first require a riot point. On the other side of the coin, YCC and negative interest rates have been an anathema for Japanese net interest margins and share prices. This, together with QE, has pushed banks to search for yield down the credit spectrum. Any policy shift that is increasingly negative for banks could easily tip them over. Chart I-12Can Japan Drop Rates Further?
Can Japan Drop Rates Further?
Can Japan Drop Rates Further?
Chart I-13MMT Might Be What The Doctor Ordered
MMT Might Be What The Doctor Ordered
MMT Might Be What The Doctor Ordered
Bottom Line: Inflation expectations remain at rock-bottom levels in Japan, at a time when the BoJ may be running out of policy bullets. Meanwhile, the margin of error for the BoJ is non-trivial, since a small external shock could tip the economy back into deflation. The risk to short USD/JPY positions is that the BoJ will eventually act, but it may first require a riot point (Chart I-13). A Final Note On The Pound A new conservative leadership is at the margin more negative for the pound (the assessment of our geopolitical strategists is that the odds of a hard Brexit have risen from 14% to 21%). However, our simple observation is that the pound is below where it was after the 2016 referendum results, yet more people are now in favor of staying in the union (Chart I-14). Chart I-14Support For Brexit Is Low, But Has Risen
Support For Brexit Is Low, But Has Risen
Support For Brexit Is Low, But Has Risen
Chart I-15Low Rates Could Help British Capex
Low Rates Could Help British Capex
Low Rates Could Help British Capex
The BoE kept rates on hold following its latest policy meeting and will continue to err on the side of caution until the Brexit imbroglio is resolved. The reality is that the pound and U.K. gilt yields should be much higher solely on the basis of hard incoming data. Yes, the data has softened, but employment growth has been holding up very well, wages are inflecting higher and the average U.K. consumer appears in decent shape. Investment and construction have been the weak spot in the U.K. economy but may marginally improve on low rates (Chart I-15). We remain long the pound, given lower overall odds of a no-deal Brexit. That said, our long GBP/USD position was a few pips from being stopped out this week. Stand aside if triggered. Housekeeping Our stop-loss on long EUR/CHF was triggered at 1.11 yesterday. Stand aside for now, but we will be looking for opportunities to put this trade back on. Chester Ntonifor, Foreign Exchange Strategist chestern@bcaresearch.com Footnotes 1 Please see Foreign Exchange Strategy Weekly Report, titled “EUR/USD And The Neutral Rate Of Interest,” dated June 14, 2019, available at fes.bcaresearch.com. 2 The Heisei era refers to the period of Japanese history corresponding to the reign of Emperor Akihito from 8 January 1989 until his abdication on 30 April 2019. 3 Please refer to the Bank of Japan “Minutes of The Monetary Policy Meeting,” dated June 20, 2019, page 1. Currencies U.S. Dollar Chart II-1USD Technicals 1
USD Technicals 1
USD Technicals 1
Chart II-2USD Technicals 2
USD Technicals 2
USD Technicals 2
Recent data in the U.S. have been mostly negative: Retail sales grew by 0.5% month-on-month in May. University of Michigan consumer sentiment and expectation indices both fell to 97.9 and 88.6 in June. However, current conditions index increased to 112.5. NY empire state manufacturing index came in at -8.6 in June, falling below 0 for the first time since October 2016. NAHB housing market index fell to 64 in June. Housing starts contracted by 0.9% month-on-month in May, while building permits increased by 0.3% month-on-month. Current account deficit decreased to $130.4 billion in Q1. Philadelphia Fed Business Outlook survey index fell to 0.3 in June. DXY index fell by 1% this week. This Wednesday, the Fed has kept interest rates steady at 2.5%, but left the door open for rate cuts in the future as Powell stated that “Many participants now see the case for somewhat more accommodative policy has strengthened.” The dollar has weakened in response to the dovish pivot. Report Links: EUR/USD And The Neutral Rate Of Interest - June 14, 2019 Where To Next For The U.S. Dollar? - June 7, 2019 President Trump And The Dollar - May 9, 2019 The Euro Chart II-3EUR Technicals 1
EUR Technicals 1
EUR Technicals 1
Chart II-4EUR Technicals 2
EUR Technicals 2
EUR Technicals 2
Recent data in the euro area have been negative with muted inflation: Trade surplus narrowed to €15.3 billion in April. Headline and core inflation fell to 1.2% and 0.8% year-on-year respectively in May. ZEW survey expectations index fell to -20.2 in June. Current account surplus decreased to €20.9 billion in April. Construction output growth fell to 3.9% year-on-year in April. Consumer confidence fell further to -7.2 in June. EUR/USD increased by 0.7% this week. The cross fell initially on Draghi’s dovish message that ECB would ease policy again should inflation fail to accelerate, then rebounded on broad dollar weakness this Wednesday following the Fed’s dovish pivot. However, the euro has weakened further against other currency pairs. Our EUR/CHF trade was stopped out at 1.11 on Thursday morning. Report Links: EUR/USD And The Neutral Rate Of Interest - June 14, 2019 Take Out Some Insurance - May 3, 2019 Reading The Tea Leaves From China - April 12, 2019 The Yen Chart II-5JPY Technicals 1
JPY Technicals 1
JPY Technicals 1
Chart II-6JPY Technicals 2
JPY Technicals 2
JPY Technicals 2
Recent data in Japan have been mostly negative: Industrial production was unchanged at -1.1% year-on-year in April. Total adjusted trade balance decreased to -¥609.1 billion in May. Imports fell by 1.5% year-on-year, while exports contracted by 7.8% year-on-year. All industry activity index increased by 0.9% month-on-month in April. Machine tool orders continued to contract by 27.3% year-on-year in May. USD/JPY fell by 1.1% this week. BoJ kept the interest rate unchanged at -0.1% this week. In the monetary statement, the BoJ stated that the Japanese economy would likely continue expanding at a moderate rate, despite exogenous shocks. The current policy rates will be maintained at least through the spring of 2020. Report Links: Short USD/JPY: Heads I Win, Tails I Don’t Lose Too Much - May 31, 2019 Beware Of Diminishing Marginal Returns - April 19, 2019 Tug OF War, With Gold As Umpire - March 29, 2019 British Pound Chart II-7GBP Technicals 1
GBP Technicals 1
GBP Technicals 1
Chart II-8GBP Technicals 2
GBP Technicals 2
GBP Technicals 2
Recent data in the U.K. have been mixed: Retail price index increased by 3% year-on-year in May. Headline and core inflation fell to 2% and 1.7% year-on-year respectively in May. Total retail sales growth fell to 2.3% year-on-year in May. GBP/USD increased by 0.9% this week. The MPC voted unanimously to keep the interest rate unchanged at 0.75% this week. However, some policymakers have suggested that borrowing costs should be higher. The BoE however cut its growth forecast in the second quarter of 2019 amid rising global trade tensions and a fear of “no-deal” Brexit. Report Links: A Contrarian View On The Australian Dollar - May 24, 2019 Take Out Some Insurance - May 3, 2019 Not Out Of The Woods Yet - April 5, 2019 Australian Dollar Chart II-9AUD Technicals 1
AUD Technicals 1
AUD Technicals 1
Chart II-10AUD Technicals 2
AUD Technicals 2
AUD Technicals 2
There is little data from Australia this week: House price index contracted by 7.4% year-on-year in Q1. Westpac leading index fell by 0.08% month-on-month in May. AUD/USD rose by 0.7% this week. Our long AUD/USD came close to the stop-loss at 0.68 this Tuesday, then rebounded on dollar weakness and is now trading around 0.69. RBA governor Philip Lowe said that it was unrealistic to think that the single quarter-point cut to 1.25% would work to achieve its growth target, signaling more rate cuts and fiscal stimulus in the future. We are holding on to the long AUD/USD position from a contrarian perspective, and believe that the Aussie dollar will benefit as a pro-cyclical currency if the global growth outlook turns positive. Report Links: A Contrarian View On The Australian Dollar - May 24, 2019 Beware Of Diminishing Marginal Returns - April 19, 2019 Not Out Of The Woods Yet - April 5, 2019 New Zealand Dollar Chart II-11NZD Technicals 1
NZD Technicals 1
NZD Technicals 1
Chart II-12NZD Technicals 2
NZD Technicals 2
NZD Technicals 2
Recent data in New Zealand have been mixed: REINZ house sales keep contracting by 7.8% year-on-year in May. Business Manufacturing PMI fell to 50.2 in May. Westpac consumer confidence fell to 103.5 in Q2. Current account surplus widened to N$0.675 billion in Q1. GDP growth was unchanged at 0.6% in Q1 on a quarter-on-quarter basis. However, it increased to 2.5% on a year-on-year basis. NZD/USD increased by 1.1% this week. Our bias remains that the New Zealand dollar has less room to rise compared to other pro-cyclical currencies if global growth picks up. Our SEK/NZD position is 1.3% in the money since initiated. Report Links: Where To Next For The U.S. Dollar? - June 7, 2019 Not Out Of The Woods Yet - April 5, 2019 Balance Of Payments Across The G10 - February 15, 2019 Canadian Dollar Chart II-13CAD Technicals 1
CAD Technicals 1
CAD Technicals 1
Chart II-14CAD Technicals 2
CAD Technicals 2
CAD Technicals 2
Recent data in Canada have been mixed: Foreign portfolio investment in Canadian securities fell by C$12.8 billion in April. Bloomberg Nanos confidence increased to 56.9 in June. Manufacturing sales fell by 0.6% month-on-month in April. Headline and core inflation both increased to 2.4% and 2.1% year-on-year respectively in May, surprising to the upside. USD/CAD fell by 1.6% this week. The surprising Canadian inflation print, and oil price recovery are all underpinning the Canadian dollar in the short term. This Thursday, Iran shot down a the U.S. drone in Gulf, and fears have been rising of a military confrontation between the U.S. and Iran, which is bullish for oil prices and the Canadian dollar. Report Links: Currency Complacency Amid A Global Dovish Shift - April 26, 2019 A Shifting Landscape For Petrocurrencies - March 22, 2019 Into A Transition Phase - March 8, 2019 Swiss Franc Chart II-15CHF Technicals 1
CHF Technicals 1
CHF Technicals 1
Chart II-16CHF Technicals 2
CHF Technicals 2
CHF Technicals 2
Recent data in Switzerland have been positive: Exports and imports increased to CHF 21.5 billion and CHF 18.1 billion respectively in May, resulting in a higher trade surplus of CHF 3.4 billion. USD/CHF fell by 1.7% this week. The Swiss franc has strengthened significantly against the U.S. dollar and the euro following the more-than-expected dovish shifts by the ECB and the Fed this week. Our bias remains that the SNB will use the currency as a weapon to defend the economy. Report Links: What To Do About The Swiss Franc? - May 17, 2019 Beware Of Diminishing Marginal Returns - April 19, 2019 Balance Of Payments Across The G10 - February 15, 2019 Norwegian Krone Chart II-17NOK Technicals 1
NOK Technicals 1
NOK Technicals 1
Chart II-18NOK Technicals 2
NOK Technicals 2
NOK Technicals 2
Recent data in Norway have been negative: The trade surplus narrowed to 11.3 billion NOK in May. USD/NOK fell by 1.6% this week. The Norges bank raised interest rates from 1% to 1.25%, the third rate hike during the past 12 months, and the Bank is also signaling more to come in the future. The Norges Bank remains the only hawkish central bank among all the G10 countries at this moment. The widening interest rate differentials and bullish oil outlook have been pushing the Norwegian krone higher. Our long NOK/SEK position is now 4.5% in the money. Report Links: Currency Complacency Amid A Global Dovish Shift - April 26, 2019 A Shifting Landscape For Petrocurrencies - March 22, 2019 Balance Of Payments Across The G10 - February 15, 2019 Swedish Krona Chart II-19SEK Technicals 1
SEK Technicals 1
SEK Technicals 1
Chart II-20SEK Technicals 2
SEK Technicals 2
SEK Technicals 2
Recent data in Sweden have been neutral: Headline and core inflation increased to 2.2% and 2.1 year-on-year respectively in May. Consumer confidence increased to 93.8 in June, while manufacturing confidence fell to 100.2. Unemployment rate increased to 6.8% in May. USD/SEK fell by 0.7% this week. Easing financial conditions worldwide remain a tailwind for global growth. Risk assets are rebounding with higher hopes of a trade deal as Trump will meet Xi at the G20 summit. We believe that the Swedish krona will benefit if global growth picks up in the second half of this year. Report Links: Where To Next For The U.S. Dollar? - June 7, 2019 Balance Of Payments Across The G10 - February 15, 2019 A Simple Attractiveness Ranking For Currencies - February 8, 2019 Trades & Forecasts Forecast Summary Core Portfolio Tactical Trades Closed Trades
Highlights So What? Geopolitical risks are not about to ease. Why? Fiscal policy becomes less accommodative next year unless politicians act. Financial conditions give President Trump room to expand his tariff onslaught. Our Iran view is confirmed by rapid escalation of tensions – war risk is high. The odds of a no-deal Brexit have risen. Feature The AUD-JPY cross and copper-to-gold ratio – two market indicators that flag global growth and risk-on sentiment – are hovering over critical points at which a further breakdown would catalyze a renewed flight to quality (Chart 1). Chart 1Risk-On Indicators Breaking Down?
Risk-On Indicators Breaking Down?
Risk-On Indicators Breaking Down?
Global sentiment remains depressed amid a rash of negative economic surprises and bonds continue to rally despite a more dovish outlook from the Fed (Chart 2). Chart 2Global Sentiment Remains Depressed
Global Sentiment Remains Depressed
Global Sentiment Remains Depressed
The cavalry is on the way: European Central Bank President Mario Draghi oversaw a dramatic easing of monetary policy on June 18, driving the Italian-German sovereign bond spread down to levels not seen since before the populist election outcome of March 2018 (Chart 2, bottom panel). The Federal Reserve adjusted its policy rate projections to countenance an interest rate cut in the not-too-distant future. More needs to be done, however, to sustain the optimism that has propelled the S&P 500 and global equities upward since the volatility catalyzed by President Donald Trump’s announcement of a tariff rate hike on May 6. Political and geopolitical risks are higher, not lower, since that time as market-negative scenarios are playing out with U.S. policy, Iran, and Brexit, while we take a dim view of the end-game of the U.S.-China negotiations despite recent improvements. Fiscal And Trade Uncertainties This year’s growth wobbles have occurred in the context of expansive fiscal policy in the developed markets. Next year, however, the fiscal thrust (the change in the cyclically adjusted budget balance) is projected to decline in the U.S. and Japan and nearly to do so in Europe (Chart 3). We expect President Trump and the House Democrats to raise spending caps (or at least keep spending at current levels) and thus prevent the budget deficit from contracting in FY2020 – this is their only substantial point of agreement. But this at best neutralizes what would otherwise be a negative fiscal backdrop. Meanwhile it is not at all clear that Brussels will relax its scrutiny of member states seeking to cut taxes and boost spending, such as Italy. Japanese Prime Minister Abe Shinzo would need to arrange for the Diet to pass a new law to avoid the consumption tax hike from 8% to 10% on October 1. He can pull this off, especially if the U.S. trade war escalates – or if he decides to turn next month’s upper house election into a general election and needs to boost his popularity. But as things currently stand in law, the world’s third biggest economy will face a deep fiscal pullback next year (Chart 3, bottom panel). In short, DM fiscal policy will not really become contractionary in 2020, but this is a view and not yet a reality (Chart 4). Chart 3Fiscal Pullback Likely Next Year
Fiscal Pullback Likely Next Year
Fiscal Pullback Likely Next Year
Chart 4Only The U.S. Is Profligate
Only The U.S. Is Profligate
Only The U.S. Is Profligate
Meanwhile China’s stimulus is still in question – in fact it remains the major macro question this year. The efficacy of China’s stimulus is declining ... An escalating trade war will bring greater stimulus but also greater transmission problems. Since February we have argued that the Xi administration has shifted to sweeping fiscal-and-credit stimulus in the face of the unprecedented external threat posed by the Trump administration (Charts 5A and 5B). We expect China’s credit growth to continue its upturn in June and in H2. Ultimately, we think the whole package will be comparable to 2015-16 – and anything even close to that will prolong the global economic expansion. We do not see a massive 2008-style stimulus occurring unless relations with the U.S. completely collapse and a global recession occurs. Chart 5AStimulus Amid The Trade War
Stimulus Amid The Trade War
Stimulus Amid The Trade War
Chart 5
The catch – as we have shown – is that the efficacy of China’s stimulus is declining over time because of over-indebtedness and bearish sentiment in China’s private sector. These tepid animal spirits stem from epochal changes: Xi’s reassertion of communism and America’s withdrawal of strategic support for China’s rise. An escalating trade war will bring greater stimulus but also greater transmission problems. The magnitude of the tariffs that President Trump is threatening to impose on China, Mexico, the EU, and Japan is mind-boggling. We illustrate this with a simple simulation of duties collected as a share of total imports under different scenarios (Chart 6).
Chart 6
China and Mexico are fundamentally different from the EU and Japan and hence the threat of tariffs will continue to weigh on markets for Trump’s time in office – China because of a national security consensus and Mexico because of the Trump administration’s existential emphasis on curbing illegal immigration. But we still put the risk of auto tariffs (or other punitive measures) on Europe at 45% if Trump seals a China deal. The odds are lower for Japan but it is still at risk. Global supply chains are shifting – a new source of costs and uncertainty for companies – as a slew of recent news has highlighted. Already 40% of companies surveyed by the American Chamber of Commerce in China say they are relocating to Southeast Asia, Mexico, and elsewhere (Chart 7). If the G20 is a flop – or results in nothing more than a pause in tariffs for another three-month dialogue – relocations will gain steam, forcing companies’ bottom lines to take a hit.
Chart 7
Even in the best case, in which the Trump-Xi summit produces a joint statement outlining a “deal in principle” accompanied by a rollback of the May 10 tariff hike, uncertainty will persist due to President Trump’s unpredictability, China’s incentive to wait until after the U.S. election, and Trump’s incentive to corner the “China hawk” platform prior to the election. We maintain that, by November 2020, there is a roughly 70% chance of further escalation. At least the U.S.-China conflict is nominally improving. The same cannot be said for other geopolitical risks discussed below: the U.S. and Iran are flirting with war; the U.S. presidential election is injecting a steady trickle of market-negative news; the chances of a no-deal Brexit are rising; and Trump may turn on Europe at a moment when it lacks leadership. This list assumes that Russia takes advantage of American distraction by improving domestic policy rather than launching into a new foreign adventure – say in Ukraine or Kaliningrad. If there is any doubt as to whether political risk can outweigh more accommodative monetary policy, remember that President Trump actually can remove Chairman Jerome Powell. Legally he is only allowed to do so “for cause” as opposed to “at will.” But the meaning of this term is a debate that would go to the Supreme Court in the event of a controversial decision. Meanwhile the stock market would dive. Now, this is precisely why Trump will not try. But the implication, as with Congress and the border wall, is that Trump is constrained on domestic policy and hence tariffs are his most effective tool to try to achieve policy victories. With an ebullient stock market and a Fed that is adjusting its position, Trump can try to kill two birds with one stone: wring concessions from trade partners while forcing the FOMC to keep responding to rising external risks. Bottom Line: Central banks are riding to the rescue, but there is only so much they can do if global leaders are tightening budgets and imposing barriers on immigration and trade. We remain tactically cautious. Oh Man, Oh Man, Oman Iran has swiftly responded to the Trump administration’s imposition of “maximum pressure” on oil exports. The shooting down of an American drone that Tehran claims violated its airspace on June 20 is the latest in a spate of incidents, including a Houthi first-ever cruise missile attack on Abha airport in Saudi Arabia. Two separate attacks on tankers near the Strait of Hormuz (Map 1) demonstrate that Iran is threatening to play its most devastating card in the renewed conflict with the U.S.
Chart
Chart 8
Hormuz ushers through a substantial share of global oil demand and liquefied natural gas demand (Chart 8). The amount of spare pipeline capacity that the Gulf Arab states could activate in the event of a disruption is merely 3.9 million barrels per day, or 6 million if questionable pipelines like the outdated Iraqi pipeline in Saudi Arabia prove functional (Table 1). Table 1No Sufficient Alternatives To Hormuz
Escalation ... Everywhere
Escalation ... Everywhere
A conflict with Iran could cause the biggest oil shock of all time. Even if this spare capacity were immediately utilized, a conflict could cause the biggest oil shock of all time – considerably bigger than that of the Iranian Revolution (Chart 9).
Chart 9
We have shown in the past that Iran has the military capability of interrupting the flow of traffic in Hormuz for anywhere from 10 days to four months. A preemptive strike by Iran would be most effective, whereas a preemptive American attack would include targets to reduce Iran’s ability to retaliate via Hormuz. The impact on oil prices ranges from significant to devastating. Needless to say, blocking the Strait of Hormuz would initiate a war so Iran is attempting to achieve diplomatic goals with the threats themselves – it will only block the strait as a last resort, say if it is convinced that the U.S. is about to attack anyway. As the experience of President Jimmy Carter shows, Americans may rally around the flag during a crisis but they will also kick a president out of office for higher prices and an economic slowdown. President Trump cannot be unaware of this precedent. The intention of his Iran policy is to negotiate a “better deal” than the 2015 one – a deal that includes Iran’s regional power projection and ballistic missile capabilities as well as its nuclear program. The problem is that Trump has already been forced to deploy a range of forces to the region, including additional troops (albeit so far symbolic at 2,500) (Chart 10). He is also sending Special Representative for Iran, Brian Hook, to the region to rally support among Gulf Cooperation Council. The week after Hook will court Britain, Germany, and France, three of the signatories of the 2015 deal. Trump ran on a campaign of eschewing gratuitous wars in the Middle East – a popular stance among war-weary Americans (Chart 11) – but there is a substantial risk that he could get entangled in the region. First, he is adopting a more aggressive foreign policy to attempt to compensate for the lack of payoff in public opinion from the strong economy. Second, Iran is not shrinking from the fight, which could draw him deeper into conflict. Third, there is always a high risk of miscalculation when nations engage in such brinkmanship. Chart 10Is The 'Pivot To Asia' About To Reverse?
Is The 'Pivot To Asia' About To Reverse?
Is The 'Pivot To Asia' About To Reverse?
Chart 11
The Iranian response has been, first, to reject negotiations. When Trump sent a letter to Rouhani via Japanese Prime Minister Abe Shinzo, Abe was rebuffed – and one of the tankers attacked near Oman was a Japanese flagged vessel, the Kokuka Courageous. This is a posture, not a permanent position, as the Iranian release of an American prisoner demonstrates. But the posture can and will be maintained in the near term – with escalation as the result. Second, Iran is increasing its own leverage in any future negotiation by demonstrating that it can sow instability across the region and bring the global economy grinding to a halt. Iran cannot assume that Trump means what he says about avoiding war but must focus on the United States’ actions and capabilities. Cutting off all oil exports is a recipe for extreme stress within the Iranian regime – it is an existential threat. Therefore, the Iranians have signaled that the cost of a total cutoff will be a war that will cause a global oil price shock. The Iranian leaders are also announcing that they are edging closer to walking away from the 2015 nuclear pact (Table 2). If so, they could quickly approach “breakout” capacity in the uranium enrichment – meaning that they could enrich to 20% and then in short order enrich to 90% and amass enough of this fuel to make a nuclear device one year thereafter. The Trump administration has reportedly reiterated that this one-year limit is the U.S. government’s “red line,” just as the Obama administration had done. Table 2Iran Threatens To Walk Away From 2015 Nuclear Deal
Escalation ... Everywhere
Escalation ... Everywhere
This Iranian threat is a direct reaction to Trump’s decision in May not to renew the oil sanction waivers. Previously the Iranians had sought to preserve the 2015 deal, along with the Europeans, in order to wait out Trump’s first term. These developments push us to the brink of war. Iran is retaliating with both military force and a nuclear restart. This comes very close to meeting our conditions for an American (and Israeli) retaliation that is military in nature. Diagram 1 is an update of our decision tree that we have published since last year when Trump reneged on the 2015 deal. The window to de-escalate is closing rapidly. The Appendix provides a checklist for air strikes and/or the closure of Hormuz. Diagram 1Iran-U.S. Tensions Decision Tree
Escalation ... Everywhere
Escalation ... Everywhere
At very least we expect to see the U.S. attempt to create a large international fleet to assert freedom of navigation in the Persian Gulf and Strait of Hormuz. While Iran may lay low during a large show of force, it will later want to demonstrate that it has not been cowed. And it has the capacity to retaliate elsewhere, including in Iraq, an area we have highlighted as a major geopolitical risk to oil supply. The U.S. government has already reacted to recent threats there from Iranian proxies by pulling non-essential personnel. Iran has several incentives to test the limits of conflict if the U.S. insists on the oil embargo. First, tactically, it seeks to deter President Trump, take advantage of American war-weariness, drive a wedge between the U.S. and Europe, and force a relaxation of the sanctions. This would also demonstrate to the region that Iran has greater resolve than the United States of America. This goal has not been achieved by the recent spate of actions, so there is likely more conflict to come. Second, President Hassan Rouhani’s government is also likely to maintain a belligerent posture – at least in the near term – to compensate for its loss of face upon the American betrayal of the 2015 nuclear deal. Rouhani negotiated the deal against the warnings of hardline revolutionaries. The 2020 majlis elections make this an important political goal for his more reform-oriented faction. Negotiations with Trump can only occur if Rouhani has resoundingly demonstrated his superiority in the clash of wills. Structurally, Iran faces tremendous regime pressures in the coming years and decades because of its large youth population, struggling economy, and impending power transition from the 80 year-old Supreme Leader Ali Khamanei. A patriotic war against America and its allies – while not desirable – is a risk that Khamenei can take, as an air war is less likely to trigger regime change than it is to galvanize a new generation in support of the Islamic revolution. For oil markets the outcome is volatility in the near term – reflecting the contrary winds of trade war and global growth fears with rising supply risks. Because we expect more Chinese stimulus, both as the trade talks extend and especially if they collapse, we ultimately share BCA’s Commodity & Energy Strategy view that the path of least resistance for oil prices is higher on a cyclical horizon, as demand exceeds supply (Chart 12). We remain long EM energy producers relative to EM ex-China. Chart 12Crude Oil Supply-Demand Balance Should Send Prices Higher
Crude Oil Supply-Demand Balance Should Send Prices Higher
Crude Oil Supply-Demand Balance Should Send Prices Higher
Bottom Line: The risk of military conflict has risen materially. This also drastically elevates the risk of a supply shock in oil prices that would kill global demand. The U.S. Election Adds To Geopolitical Risk The 2020 U.S. election poses another political risk for the rising equity market. The Democratic Party’s first debate will be held on June 26-27. The leftward shift in the party will be on full display, portending a possible 180-degree reversal in U.S. policy if the Democrats should win the election, with the prospect of a rollback of Trump’s tax cuts and deregulation of health, finance, and energy. The uncertainty and negative impact on animal spirits will be modest if current trends persist through the debates. Former Vice President Joe Biden remains the frontrunner despite having naturally lost the bump to his polling support after announcing his official candidacy (Chart 13). Biden is a known quantity and a centrist, especially compared to the farther left candidates ranked second and third in popular support– Vermont Senator Bernie Sanders and Massachusetts Senator Elizabeth Warren.
Chart 13
Chart 14
Biden is not only beating Sanders in South Carolina, which underscores the fact that he is competitive in the South and hence has a broader path to the White House, but also in New Hampshire, where the Vermont native should be ahead (Chart 14). These states hold the early primaries and caucuses and if Biden maintains his large lead then he will start to appear inevitable very early in the primary campaign next year. Hence a poor showing in the debate on June 27 is a major risk to Biden – he should be expected to be eschew the limelight and play the long game. Elizabeth Warren, by contrast, has the most to gain as she appears on the first night and does not share a stage with the other heavy hitters. If she or other progressive candidates outperform then the market will be spooked. The market could begin to trade off the polls. All of these candidates are beating Trump in current head-to-head polling – Biden is even ahead in Texas (Chart 15). This means that any weakness from Biden does not necessarily offer the promise of a Trump victory and policy continuity.
Chart 15
The Democrats also have a powerful demographic tailwind. The just-released projections from the U.S. Census Bureau reveal how Trump’s narrow margins of victory in the swing states in 2016 are in serious jeopardy in 2020 as a result of demographics if he does not improve his polling among the general public (Chart 16).
Chart 16
We still give Trump the benefit of the doubt as the incumbent president amid an expanding economy, but it is essential to recognize that his popular approval rating is reminiscent of a president during recession – i.e. one who is about to lose the White House for his party (Chart 17).
Chart 17
Even if there is not a recession, an increase in unemployment is likely to cost him the election – and even a further decrease in unemployment cannot guarantee victory (Chart 18). This is why we see Trump making a bid to become a foreign policy president and seek reelection on the basis that it is unwise to change leaders amid an international crisis.
Chart 18
We still give Trump the benefit of the doubt ... but his popular approval rating is reminiscent of a president during recession. The race for the U.S. senate is extremely important for the policy setting from 2021. If Republicans maintain control, they will be able to block sweeping Democratic legislation – which is particularly relevant if a progressive candidate should win the White House. However, if Democrats can muster enough votes to remove a sitting president with a strong economy – including a strong economy in the key senate swing races (Chart 19) – then they will likely win over the senate as well. Chart 19Hard To Win The Senate In 2020 While Key States Prosper
Hard To Win The Senate In 2020 While Key States Prosper
Hard To Win The Senate In 2020 While Key States Prosper
Bottom Line: The 2020 election poses a double risk to the bull market. First, the Democratic primary campaign threatens sharp policy discontinuity, especially if and when developments cause Biden to drop in the polls (dealing a blow to centrism or the political establishment). Second, Trump’s vulnerability makes him more likely to act aggressive on the international stage, whether on trade, immigration, or national security, reinforcing the risks outlined above with regard to China, Iran, Mexico, and even Europe. Rising Odds Of A No-Deal Brexit Former Mayor of London and former foreign secretary Boris Johnson looks increasingly likely to seal the Conservative Party leadership contest in the United Kingdom. It is not yet a done deal, but the shift within the party in favor of accepting a “no deal” exit is clear. None of the remaining candidates is willing to forgo that option. The newest development advances us along our decision tree in Diagram 2, altering the conditional probabilities for this year’s events. We expect the next prime minister to try to push a deal substantially similar to outgoing Prime Minister Theresa May before attempting any kamikaze run as the October 31 deadline approaches. The attempt to leverage the EU’s economic weakness will not produce a fundamental renegotiation of the exit deal, but some element of diplomatic accommodation is possible as the EU seeks to maintain overall stability and a smooth exit if that is what the U.K. is determined to accomplish. Diagram 2Brexit Decision Tree
Escalation ... Everywhere
Escalation ... Everywhere
Hence the prospect of passing a deal substantially similar to outgoing Prime Minister Theresa May’s deal is about 30%, roughly equal to the chance of a delay (28%). These options are believable as the new leader will have precious little time between taking the reins and Brexit day. The EU can accept a delay because it ultimately has an interest in keeping the U.K. bound into the union. Public opinion polling is not conducive to the new prime minister seeking a new election unless the change of face creates a massive shift in support for the Conservatives, both by swallowing the Brexit Party and outpacing Labour. If the purpose is to deliver Brexit, then the risk of a repeat of the June 2017 snap election would seem excessive. Nevertheless, the Tories’ working majority in parliament is vanishingly small, at five MPs, so a shift in polling could change the thinking on this front. The pursuit of a no-deal exit would create a backlash in parliament that we reckon has a 21% chance of ending in a no-confidence motion and new election. Bottom Line: The odds of a crash Brexit have moved up from 14% to 21% as a result of the leadership contest. The threat that the U.K. will crash out of the EU is not merely a negotiating ploy, although it will be a last resort even for the new hard-Brexit prime minister. Public opinion is against a no-deal Brexit, as is the majority of parliament, but the risk to the U.K. and EU economies will loom large over global risk assets in the coming months. Investment Conclusions Political and geopolitical risks to the late-cycle expansion are rising, not falling. U.S. foreign policy remains the dominant risk but U.S. domestic policy pre-2020 is an aggravating factor. Easing financial conditions give President Trump more ammunition to use tariffs and sanctions. Meanwhile our view that this summer will feature “fire and fury” between the U.S. and Iran has been confirmed by the tanker attacks in Oman. Tensions will likely escalate from here. Ultimately, we believe Trump is more likely to back off from the Iran conflict than the China conflict. This is part of our long-term theme that the U.S. really is pivoting to China and geopolitical risk will rotate from the Middle East to East Asia. But as highlighted above, the risk of entanglement is very high due to Trump’s approach and Iran’s incentives to raise the stakes. Oil prices will not resume their upward drift until Chinese stimulus is reconfirmed – and even then they will continue to be volatile. We remain cautious and are maintaining our safe-haven tactical trades of long gold and long JPY/USD. Matt Gertken, Vice President Geopolitical Strategist mattg@bcaresearch.com Appendix
Image
Highlights As long as the global long bond yield stays near 2 percent or below, European equities will end the year at broadly the same level as now… …but they will experience a dip of at least 4-5 percent along the way. All central banks have pivoted to dovish but the Fed has more easing armoury than the ECB. This means that the recent outperformance of 10-year U.S. T-bonds versus 10-year German bunds can continue. It also means that the euro has a sound structural underpinning versus the dollar. Feature At the start of this year we explained Why 2019 Is A Pivotal Year For Monetary Policy. Today we want to elaborate on that report, and its key observations: Since 2008, no developed economy central bank has been able to hike interest rates sequentially by more than 2 percent before needing to take a breather… and then reverse course. The current vulnerability to tightening emanates from the hyper-sensitivity of financial conditions to rate hikes, rather than from the direct impact on rate-sensitive sectors in the economy. Since October 2017, no stock market rally or sell-off has lasted more than three months or so (Chart Of The Week). These observations are as relevant – or more relevant – now, as they were at the time of our original report.1 Since the Global Financial Crisis, no developed economy central bank has been able to hike interest rates sequentially by more than 2 percent. Chart Of The WeekSince October 2017, No Rally Or Sell-Off Has Lasted More Than Three Months
Since October 2017, No Rally Or Sell-Off Has Lasted More Than Three Months
Since October 2017, No Rally Or Sell-Off Has Lasted More Than Three Months
A 2 Percent Tightening Is The Post-2008 Limit Since the Global Financial Crisis, no developed economy central bank has been able to hike interest rates sequentially by more than 2 percent before having to reverse course (Chart I-2 and Chart I-3). Chart I-2A 2 Percent Sequential Tightening Is The Post-2008 Limit
A 2 Percent Sequential Tightening Is The Post-2008 Limit
A 2 Percent Sequential Tightening Is The Post-2008 Limit
Chart I-3A 2 Percent Sequential Tightening Is The Post-2008 Limit
A 2 Percent Sequential Tightening Is The Post-2008 Limit
A 2 Percent Sequential Tightening Is The Post-2008 Limit
In 2008, Swedish interest rates peaked near 5 percent before collapsing to the zero bound in the financial crisis. But when the Riksbank started its so-called ‘policy normalisation’ in 2010, the interest rate could only reach 2 percent before the central bank had to backtrack; Norway could manage just 1 percent of tightening before its volte-face. Though admittedly, both Sweden and Norway were caught in the maelstrom of the euro debt crisis in 2011-12. However, on the other side of the world and relatively immune to the crisis in Europe, New Zealand could achieve a tightening also of only 1 percent; Korea could manage just 1.25 percent; the Reserve Bank of Australia marched interest rates up by 1.75 percent before taking a breather… and then marched them down again. The consensus was taking far too rosy a view on the global financial system’s capacity to tolerate further tightening. The Federal Reserve raised interest rates sequentially by 2 percent through December 2016 to December 2018, and guess what – it is now on the cusp of reversing course. The ultimate course will have a huge bearing on investment strategy for European equities, bonds and currencies. The Neutral Real Rate Of Interest Is Zero Many economists and strategists expected the Fed to continue hiking through 2019, but this publication pushed back hard. The consensus was taking far too rosy a view on the global financial system’s capacity to tolerate further tightening. Central to this publication’s resistance was, and is, a high-conviction view that the so-called ‘neutral’ real rate of interest – the real interest rate that is neither accommodative nor restrictive, the real interest rate consistent with an economy maintaining full employment while keeping inflation constant – is zero. The neutral rate of interest is very low. In our Special Report Why The Neutral Rate Of Interest Is Zero we proposed that the neutral rate is global rather than region-specific, that it refers to the bond yield rather than to the policy rate, and that it is extremely low. As it happens, the Fed broadly concurs. With the policy rate, bond yield, and inflation all at around 2 percent, the real policy rate and real bond yield are both near zero. At this level the central bank claims that “the policy stance is now in the Committee’s estimates of neutral… and when you get to that range we have to let the data speak to us.”2
Chart I-4
However, the data that is speaking most loudly is not necessarily the economic data, it is the financial market data. Jay Powell has said that if there is a sustained change in financial conditions through any one or more of its components then “that has to play into our thinking.” We think it has (Chart I-4). Comparing Today’s Rich Valuations With 2007 In the aftermath of the dot com bubble burst in 2000, policy interest rates collapsed to very low levels but, crucially, long bond yields did not. This contrasts with the aftermath of the Global Financial Crisis in 2008, during which both policy interest rates and bond yields have plunged to all-time lows (Charts I-5 - I-7). Funny things happen when the long bond yield gets to, and remains, at ultra-low nominal levels. Chart I-5In The Aftermath Of 2000, Bond Yields Did Not Collapse; But In The Aftermath Of 2008, They Did
In The Aftermath Of 2000, Bond Yields Did Not Collapse; But In The Aftermath Of 2008, They Did
In The Aftermath Of 2000, Bond Yields Did Not Collapse; But In The Aftermath Of 2008, They Did
Chart I-6In The Aftermath Of 2000, Bond Yields Did Not Collapse; But In The Aftermath Of 2008, They Did
In The Aftermath Of 2000, Bond Yields Did Not Collapse; But In The Aftermath Of 2008, They Did
In The Aftermath Of 2000, Bond Yields Did Not Collapse; But In The Aftermath Of 2008, They Did
Chart I-7In The Aftermath Of 2000, Bond Yields Did Not Collapse; But In The Aftermath Of 2008, They Did
In The Aftermath Of 2000, Bond Yields Did Not Collapse; But In The Aftermath Of 2008, They Did
In The Aftermath Of 2000, Bond Yields Did Not Collapse; But In The Aftermath Of 2008, They Did
The difference between the post-2000 and post-2008 policy responses can be summarized in two letters: QE. For all its apparent complexity, QE is actually a very simple monetary policy tool. It is just a mechanism for signalling that the policy interest rate will remain low for an extended period. Thereby, QE pulls down the long-term interest rate, which is to say the long bond yield. The double-digit rally over the past six months is technically extended. But as we have consistently pointed out on these pages, funny things happen when the long bond yield gets to, and remains, at ultra-low nominal levels. We refer readers to our other reports for the details, but in a nutshell the risk of owning bonds converges to the risk of owning equities and other so-called ‘risk-assets’. The upshot of this risk convergence is that investors price these risk-assets to deliver the same ultra-low nominal return as bonds, meaning that the valuation of the risk-assets soars.3 Chart I-8Since 2015, The Global Long Bond Yield Has Been Unable To Remain Above 2.5 Percent
Since 2015, The Global Long Bond Yield Has Been Unable To Remain Above 2.5 Percent
Since 2015, The Global Long Bond Yield Has Been Unable To Remain Above 2.5 Percent
All of which brings us to the crucial point. The post-2000 extreme policy easing distorted the real economy. It engineered a credit boom. So the fragility to the subsequent policy tightening emanated from the real economy, and particularly the most rate-sensitive sectors in the economy such as mortgage lending and housing. In contrast, the post-2008 extreme policy easing – driven by QE – has distorted the valuation of risk-assets. Moreover, the value of global risk-assets, at $400 trillion dwarfs the $80 trillion global economy by five to one. So the current fragility to policy tightening does not emanate from the real economy, it emanates from the hyper-sensitivity of financial conditions to higher bond yields (Chart 8). Some European Investment Implications The integration of global capital markets means that the valuation anchor for European – and all regional – stock markets now comes from the global long bond yield, which we define as the simple average of the 10-year yields in the euro area, U.S., and China. Through the past five years, the inability of the global long bond yield to remain above 2.5 percent confirms the hyper-sensitivity of financial conditions to higher interest rates. And it suggests that the ‘neutral’ rate on this measure is around 2 percent. The good news is that this measure now stands slightly below neutral at 1.9 percent. The euro has a sound structural underpinning versus the dollar. At around this level of the global long bond yield, the rich valuation of European equities has some support. That said, the double-digit rally over the past six months is technically extended, as most of the things that could go right did go right – central banks pivoted to dovish, euro area growth rebounded, and, until recently, geopolitical risks were easing. Hence, as long as the global long bond yield stays near 2 percent or below, we expect European equities to end the year at broadly the same level as now, though our technical signals do strongly suggest a dip of at least 4-5 percent along the way (Chart I-9). Chart I-9The Double-Digit Rally In Stock Markets Over The Past Six Months Is Technically Extended
The Double-Digit Rally In Stock Markets Over The Past Six Months Is Technically Extended
The Double-Digit Rally In Stock Markets Over The Past Six Months Is Technically Extended
Chart I-10The Fed Has More Easing Armoury Than The ECB
The Fed Has More Easing Armoury Than The ECB
The Fed Has More Easing Armoury Than The ECB
As regards bonds and currencies, all central banks have pivoted to dovish but the Fed has more easing armoury than the ECB (Chart I-10). This means that the recent outperformance of 10-year U.S. T-bonds versus 10-year German bunds can continue. It also means that the euro has a sound structural underpinning versus the dollar. However, this structural underpinning also applies to the yen, and until we get some clarity on Brexit we prefer the yen over the euro. Fractal Trading System* In line with the main body of this report and Chart 9, we see evidence that the double-digit rally in stock markets over the past six months is technically extended. Accordingly, this week’s recommended trade is to short the MSCI All-Country World index, setting the profit target at 4 percent with a symmetrical stop-loss. This leaves us with four open positions. For any investment, excessive trend following and groupthink can reach a natural point of instability, at which point the established trend is highly likely to break down with or without an external catalyst. An early warning sign is the investment’s fractal dimension approaching its natural lower bound. Encouragingly, this trigger has consistently identified countertrend moves of various magnitudes across all asset classes.
Global Financial Services Vs. Market
Global Financial Services Vs. Market
* For more details please see the European Investment Strategy Special Report “Fractals, Liquidity & A Trading Model,” dated December 11, 2014, available at eis.bcaresearch.com. Dhaval Joshi, Chief European Investment Strategist dhaval@bcaresearch.com Footnotes 1 Please see the European Investment Strategy Weekly Report ‘Why 2019 Is A Pivotal Year For Monetary Policy’ February 7, 2019 available at eis.bcaresearch.com. 2 Please see the European Investment Strategy Special Report ‘Why The Neutral Rate Of Interest Is Zero’ June 6, 2019 available at eis.bcaresearch.com. 3 Please see the European Investment Strategy Weekly Report ‘Risk: The Great Misunderstanding Of Finance’ October 25, 2018 available at eis.bcaresearch.com. Fractal Trading System
Image
Recommendations Asset Allocation Equity Regional and Country Allocation Equity Sector Allocation Bond and Interest Rate Allocation Currency and Other Allocation Closed Fractal Trades Trades Closed Trades Asset Performance Currency & Bond Equity Sector Country Equity Indicators Bond Yields Chart II-1Indicators To Watch - Bond Yields
Indicators To Watch - Bond Yields
Indicators To Watch - Bond Yields
Chart II-2Indicators To Watch - Bond Yields
Indicators To Watch - Bond Yields
Indicators To Watch - Bond Yields
Chart II-3Indicators To Watch - Bond Yields
Indicators To Watch - Bond Yields
Indicators To Watch - Bond Yields
Chart II-4Indicators To Watch - Bond Yields
Indicators To Watch - Bond Yields
Indicators To Watch - Bond Yields
Interest Rate Chart II-5Indicators To Watch - Interest Rate Expectations
Indicators To Watch - Interest Rate Expectations
Indicators To Watch - Interest Rate Expectations
Chart II-6Indicators To Watch - Interest Rate Expectations
Indicators To Watch - Interest Rate Expectations
Indicators To Watch - Interest Rate Expectations
Chart II-7Indicators To Watch - Interest Rate Expectations
Indicators To Watch - Interest Rate Expectations
Indicators To Watch - Interest Rate Expectations
Chart II-8Indicators To Watch - Interest Rate Expectations
Indicators To Watch - Interest Rate Expectations
Indicators To Watch - Interest Rate Expectations
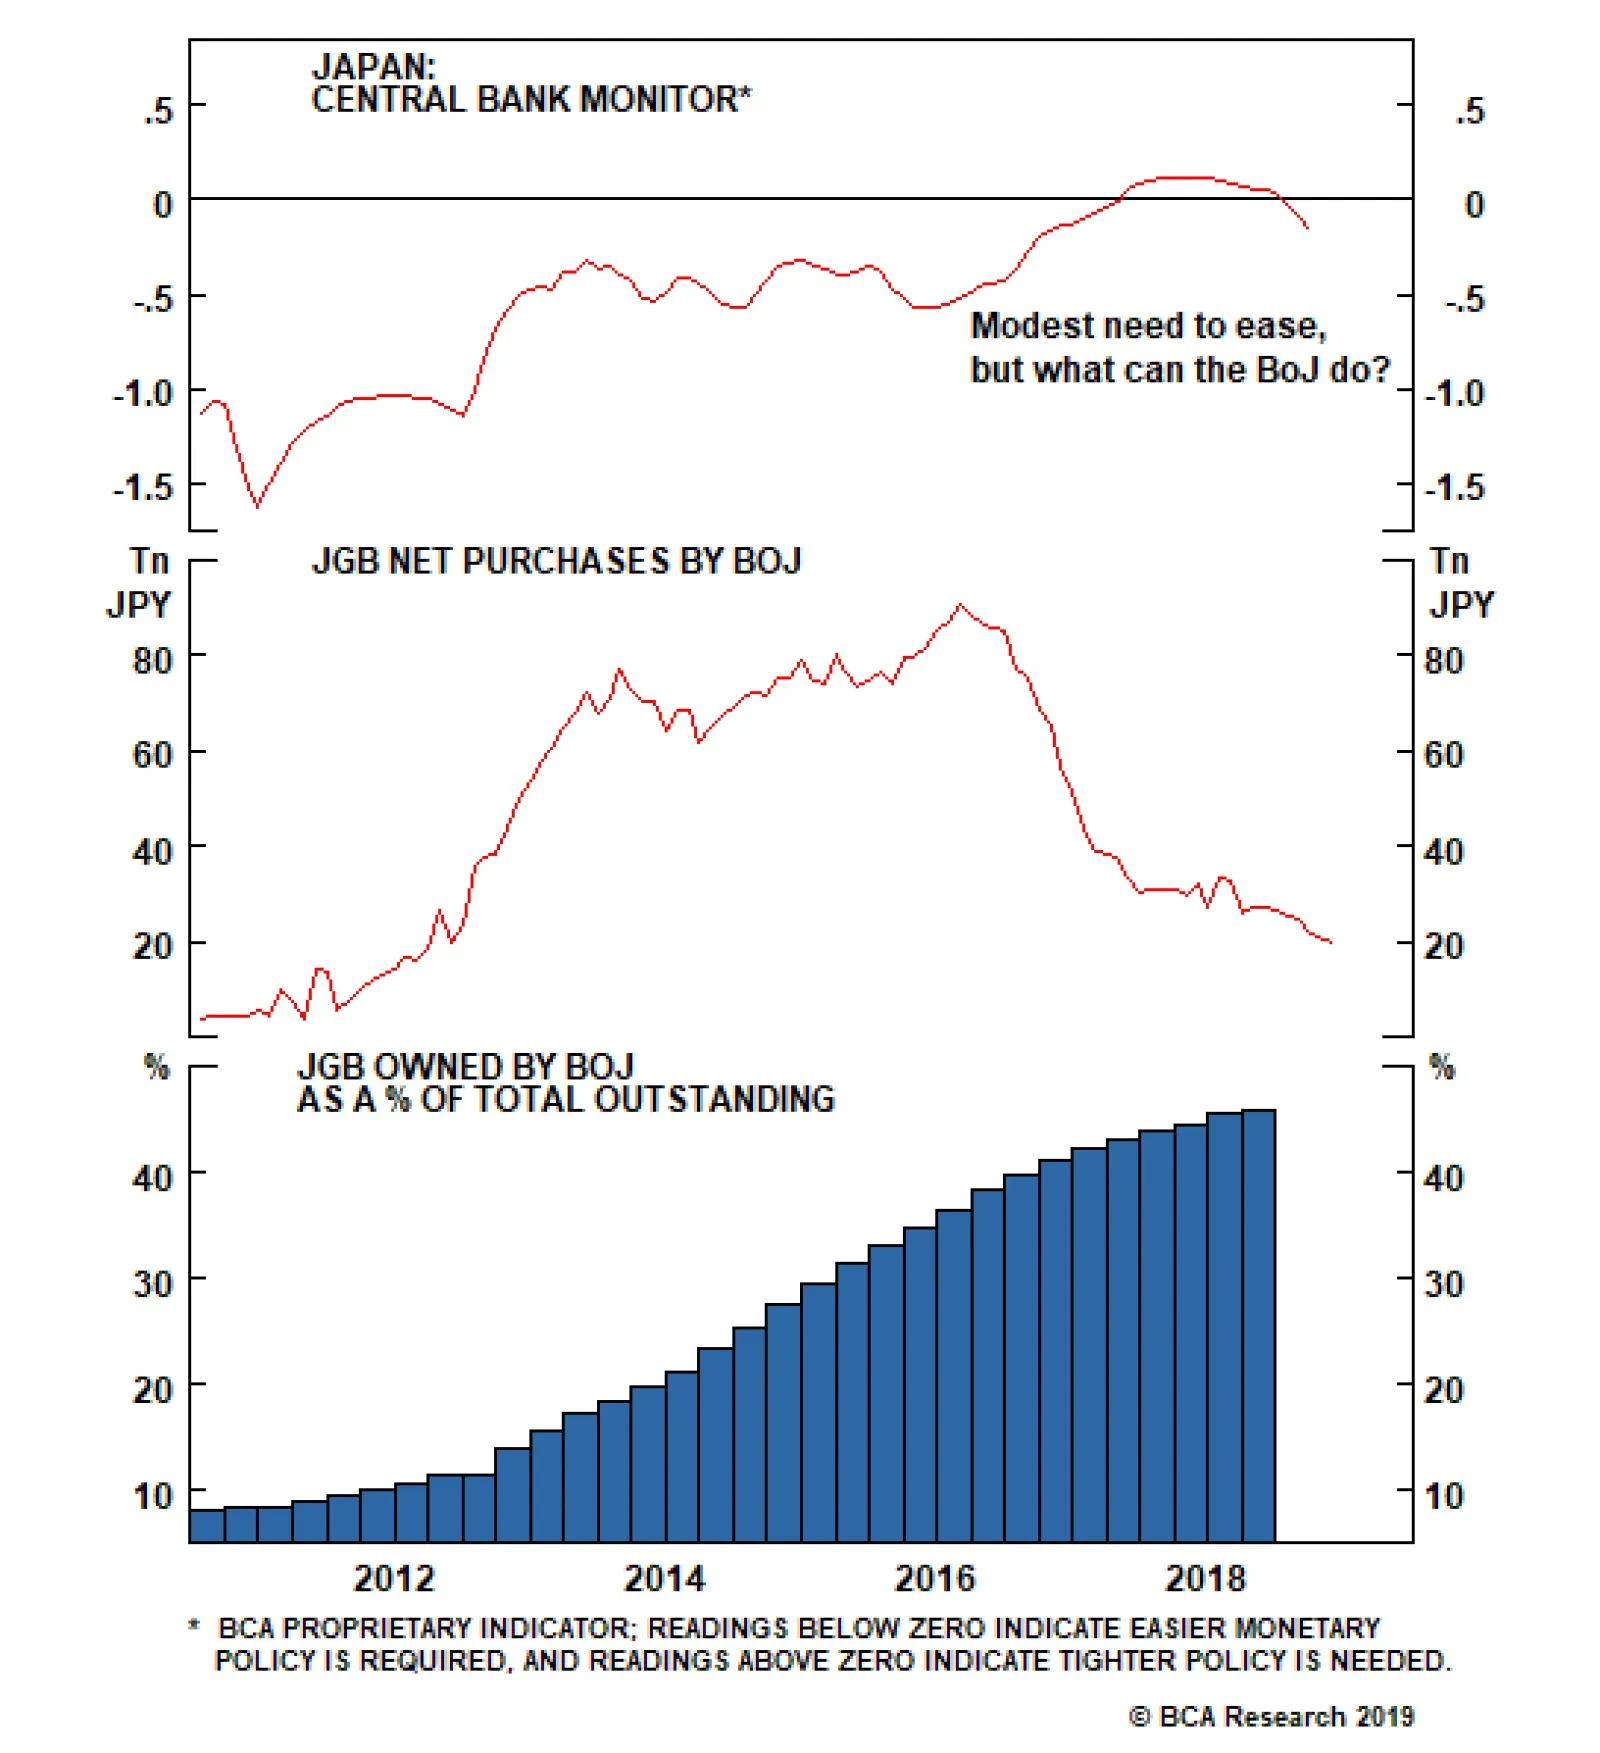
The Bank of Japan did little to feed expectations of a monetary policy easing. Governor Kuroda acknowledged that risks surrounding global trade are elevated, but nonetheless also mentioned that he expects Chinese growth to accelerate in the second half of…