Policy

We continue to recommend being overweight global equities and other risk assets over a horizon of 12 months. However, the apparent failure of trade talks between China and the U.S. to gain much traction poses near-term downside risks to our bullish thesis. At this point, our geopolitical team feels that the conclusion of an actual trade agreement this year is a 50/50 prospect. It is easy to envision a scenario where the Trump Administration pursues its “maximum pressure” doctrine in the hopes of wrangling out more concessions. For their part, the Chinese, rather than making sweeping reforms to their legal system as the Trump Administration is insisting, could simply choose to bide their time in the hopes that Joe Biden, an avowed free trader, becomes the next U.S. president. Ultimately, as discussed in this week’s Global Investment Strategy report, in a worst-case scenario where the trade talks break down completely, the combination of aggressive Chinese stimulus and a still-dovish Fed will likely preclude a major global economic downturn. Nevertheless, a 5% correction in global equities from current levels is entirely possible, especially in light of the strong rally since the start of the year. With this in mind, we are putting on a hedge to short the S&P 500 index. We will remove the hedge if stocks fall 5% or trade talks shift in a more positive direction. Peter Berezin, Chief Global Strategist Global Investment Strategy peterb@bcaresearch.com
We continue to recommend being overweight global equities and other risk assets over a horizon of 12 months. However, the apparent failure of trade talks between China and the U.S. to gain much traction poses near-term downside risks to our bullish thesis. At this point, our geopolitical team feels that the conclusion of an actual trade agreement this year is a 50/50 prospect. It is easy to envision a scenario where the Trump Administration pursues its “maximum pressure” doctrine in the hopes of wrangling out more concessions. For their part, the Chinese, rather than making sweeping reforms to their legal system as the Trump Administration is insisting, could simply choose to bide their time in the hopes that Joe Biden, an avowed free trader, becomes the next U.S. president. Ultimately, as discussed in this week’s Global Investment Strategy report, in a worst-case scenario where the trade talks break down completely, the combination of aggressive Chinese stimulus and a still-dovish Fed will likely preclude a major global economic downturn. Nevertheless, a 5% correction in global equities from current levels is entirely possible, especially in light of the strong rally since the start of the year. With this in mind, we are putting on a hedge to short the S&P 500 index. We will remove the hedge if stocks fall 5% or trade talks shift in a more positive direction. Peter Berezin, Chief Global Strategist Global Investment Strategy peterb@bcaresearch.com
Highlights The clear and present deterioration in Sino-U.S. trade negotiations suggests the dollar will remain bid in the near term. While the probability of a trade deal has fallen, the situation remains highly fluid, and the odds could shift either way rather dramatically. Ultimately, it is beneficial for both parties to come to an agreement. We highlighted last week that in an environment where volatility was low and falling, it paid to have insurance in place. The yen and Swiss franc remain attractive from this standpoint. Our thesis remains that the path of least resistance for the dollar is down, but gauging how high the dollar can catapult before ultimately reversing course is paramount for strategy. Our estimation is that the trade-weighted dollar could rise 2-3% before ultimately cresting. Expect more pronounced USD moves vis-à-vis growth-sensitive currencies. We were stopped out of our short USD/SEK position with a 1.9% loss. If global growth rebounds, this will be a high-conviction trade, but we are standing aside for risk-management purposes. Feature Markets received a dose of volatility this week. First, evidence has emerged that China is retracting on previous commitments toward a Sino-U.S. trade deal. A systematic volte face to core pledges such as legally addressing the theft of U.S. intellectual property and trade secrets, fair competition policy, and removing foreign caps on financial services, aggravated the Trump administration and prompted a new round of tariffs. As we go to press, the final details have not been revealed, but the proposal is to raise tariffs on $200 billion worth of Chinese goods from 10% to 25%, while slapping an additional 25% tariff on the remaining $325 billion of Chinese goods “shortly” after (Chart I-1). Almost simultaneously, tensions between the U.S. and Iran are flaring up following President Trump’s decision not to extend sanction waivers to Iranian oil exports beyond May. The Iranian response has been to threaten to claw back some of the commitments it made in the landmark 2015 nuclear deal, mainly a halt to its uranium enrichment program. The risk of miscalculation and escalation is high. With an aircraft carrier strike group departing from U.S. shores, Tehran could be forced into a corner and begin striking key pipelines in the Iraqi region of Basra, which is home to significant oil traffic. Meanwhile, investor exuberance towards green shoots in the global economy continues to be watered down with incoming data. Chinese export data has weakened anew, both in April and on a rolling three-month basis, following weak PMI numbers last week. Money and credit numbers were soft. Swedish manufacturing data, a strong proxy for global growth, continue to disappoint, with industrial new orders contracting by 8.1% in March – the worst pace since November 2016. And after a brisk rise since the start of the year, many China plays including commodity prices, the yuan, emerging market stocks and even A-shares are rolling over (Chart I-2). Chart I-1Back To The Firing Lines
Back To The Firing Lines
Back To The Firing Lines
Chart 1-2Reflation Indicators Are Topping Out
Reflation Indicators Are Topping Out
Reflation Indicators Are Topping Out
These developments have unsurprisingly put a bid under the dollar against pro-cyclical currencies. However, the euro is up versus the dollar this week, while the DXY marginally down. The lack of more pronounced volatility in currency markets despite a ramp-up in trade-war rhetoric is eery. Our thesis remains that the path of least resistance for the dollar is down, but gauging how high the dollar can catapult before ultimately reversing course is paramount for strategy. Tariffs And Exchange Rates Standard theory suggests that exchange rates should move to equalize prices across any two countries. This is simply because if prices rise significantly higher in country B versus Country A, it pays to buy the goods from A and resell them to B for a profit, assuming other costs are minimal. Country A’s currency rises following increased demand, while that of Country B falls, until the price differential is arbitraged away. This very simple concept originated from the School Of Salamanca in 16th century Spain, and still applies to this day in the form of Purchasing Power Parity (PPP). The question that naturally follows is by how much should the currency increase? The answer is that the exchange rate will move by exactly the same percentage point as the price increase, everything else equal. If both countries produce homogeneous goods, then it is easy to see why, since there is perfect substitution. But assuming they produce heterogeneous goods, then the loss of purchasing power in Country A will lead to less demand for Country B’s goods. This means Country B’s currency will have to adjust downwards for the markets to clear. The decrease has to match the magnitude of the price increase, since there are no other outlets to liquidate Country A’s goods. If, say, Country A moves to hike prices as well, then both currencies remain at par. This is obviously a very simplified version of the real world economy, but it highlights an important point that is central to the discussion: The currency move necessary to realign competitiveness will always be equal to, or less, in percentage point terms to the price increase. In the case where the entire production base is tradeable, it will be the former. But with a rise in the number of trading partners, a more complex export basket, import substitution, shipping costs and many other factors that influence tradeable prices, the currency adjustment should be a fraction of the price increase. Since the onset of 2018, the U.S. has slapped various tariffs on China, the most important of which was 10% on $200 billion worth of Chinese goods. Assume for the sake of argument that only China and the U.S. were trading partners. The U.S. currently imports $522 billion worth of goods from China, about 17% of its total imports. However, as a percentage of overall U.S. demand, this only represents 2.5% (Chart I-3). This suggests that at best, a 25% increase on all Chinese imports will only lift import prices by 4.3% and consumer prices by much less. On the Chinese side of the equation, exports to the U.S. account for 20% of total exports, so a tariff of 25% should only lift export prices by 5%. The conclusion is that the yuan and dollar only need to adjust by 4-5% to negate the impact of a 25% tariff. Chart 1-3Sino-U.S. Trade Is Small Relative To Domestic Demand
Sino-U.S. Trade Is Small Relative To Domestic Demand
Sino-U.S. Trade Is Small Relative To Domestic Demand
Chart 1-4No Disorderly Rise In ##br##The Dollar
No Disorderly Rise In The Dollar
No Disorderly Rise In The Dollar
The DXY index is up 10% since the 2018 trough (Chart I-4), and the dollar was up an average of 74 basis points versus the Chinese Yuan from the day major tariffs were announced until the peak in trade-war rhetoric (Table I-1). This would be in line with economic theory. But there is a caveat: With no corresponding export subsidy for U.S. goods, the rise in the dollar makes exporters worse off. And with over 40% of S&P 500 sales coming from outside the U.S., this would have a meaningful dent on corporate profits. A paper by the Peterson Institute for International Economics showed that imposing a border adjustment tax caused the real effective exchange rate (REER) of the country to rise, hurting competitiveness.1 In quantity terms, the IMF estimated that a 20% import tariff from East Asia would lift the U.S. dollar’s REER by 5% over five years, while dropping output by 0.6% over the same timeframe.2 With the dollar not currently overvalued on a REER basis, this does not bode well for future competitiveness (Chart I-5).
Chart I-
Finally, trade wars are usually synonymous with recessions. As such, there are acute political constraints inching both sides toward an agreement. For President Trump, a deteriorating U.S. manufacturing sector in the Midwestern battleground states is a thorn in his side. The U.S. agricultural sector has continued to bleed from falling grain prices (Chart I-6). For President Xi, rising unemployment is a key constraint. April manufacturing and credit numbers out of China show that the economy is relapsing anew. So, either China compromises and inches towards a trade deal or launches another round of stimulus. Chart I-5The Dollar Is Not Undervalued On A REER Basis
The Dollar Is Not Undervalued On A REER Basis
The Dollar Is Not Undervalued On A REER Basis
Chart I-6A Drought In Cash Flows For ##br##U.S. Farmers
A Drought In Cash Flows For U.S. Farmers
A Drought In Cash Flows For U.S. Farmers
Bottom Line: Standard theory suggests the dollar’s bid should be capped at 2-3% on the imposition of new tariffs. Getting the global growth picture right will be more important in dictating the dollar’s trend. Of course, a full-blown trade war puts the entire thesis in jeopardy. Questions From The Road We were on the road this week, talking to clients and teaching the BCA Academy. Most clients agreed that the dollar is in a transition phase, given the presence of emerging green shoots in the global economy (Chart I-7). However, most were also concerned to what degree this view could be offside. The concerns centered around the fact that the growth differential between the U.S. and the rest of the world remains wide, yield differentials still favor the U.S., profit leadership also continues to favor the U.S. and it is unclear to what degree the world is short of U.S. dollars. U.S. profit leadership in the world continues, but one prescient indicator for the dollar is whether banks are easing lending standards for large firms relative to smaller ones. We continue to lean towards the narrative that most of the factors driving the dollar higher are behind us. U.S. growth tends to be low-beta relative to the world, so a rebound in the global economy will be negative for the dollar. An end to the Federal Reserve’s balance sheet runoff will steer growth in the U.S. monetary base from deeply negative to zero. Meanwhile, a rising external profit environment will lead to an increase in foreign central bank reserves. The yield differential between the U.S. and the rest of the world remains wide, but this has a natural limit since global bond yields tend to converge towards each other over time. Chart I-7Global Growth Should##br## Rebound
Global Growth Should Rebound
Global Growth Should Rebound
Chart I-8Positive Earnings Revisions Bodes Well For Growth
Positive Earnings Revisions Bodes Well For Growth
Positive Earnings Revisions Bodes Well For Growth
U.S. profit leadership in the world continues (Chart I-8), but one prescient indicator for the dollar is whether banks are easing lending standards for large firms relative to smaller ones. A better external environment will suggest banks will allow credit to flow to larger firms relative to smaller ones, since the latter tend to be more domestic. This is also an environment where global equities tend to outperform. The latest Fed Senior Official Loan survey showed that on the margin, lending standards are easing for large relative to small firms. This may suggest that return on capital is starting to improve outside the U.S., which will be a headwind for the dollar (Chart I-9). Chart I-9S&P 500 Foreign Earnings Need A Weak Dollar
S&P 500 Foreign Earnings Need A Weak Dollar
S&P 500 Foreign Earnings Need A Weak Dollar
From a technical standpoint, almost all currencies are already falling versus the U.S. dollar – a trend that has been in place for several months now. This means most of the factors putting upward pressure on the dollar are well understood by the market. For example, global growth has been slowing for well over a year, based on the global PMI. Putting on fresh U.S. dollar long positions is at risk of a washout from stale investors, just as it was back in 2015, a year after growth had peaked (Chart I-10). It will be difficult for the dollar to act as both a safe-haven and carry currency, because the forces that drive both move in opposite directions. Dollar technicals are also very unfavorable. Speculators are holding near-record long positions, sentiment is stretched, and our intermediate-term indicator is also flagging yellow. Over the past five years, confirmation from all three indicators has been followed by some period of U.S. dollar indigestion (Chart I-11). This may help explain relative stability in the broad trade-weighted dollar, despite a flare up in global risk aversion. Chart I-10Dollar Bull Case Is Well Known
Dollar Bull Case Is Well Known
Dollar Bull Case Is Well Known
Chart I-11Dollar Technicals Are Unfavorable
Dollar Technicals Are Unfavorable
Dollar Technicals Are Unfavorable
Finally, with U.S. interest rates having risen significantly versus almost all G10 countries in recent years, the dollar has itself become the object of carry trades. This has also come with a good number of unhedged trades, as the rising exchange rate has lifted hedging costs. It will be difficult for the dollar to act as both a safe-haven and carry currency, because the forces that drive both move in opposite directions. The strength in EUR/USD this week despite the rise in global risk aversion is testament to this thesis. Bottom Line: Aside from the renewed specter of a trade war, most of the factors driving the dollar higher are behind us. House Keeping Chart I-12Buy Some Insurance
Buy Some Insurance
Buy Some Insurance
Rising market volatility suggests some trades could be at risk from being stopped out. First, our long AUD/USD sits right at the epicenter of any growth slowdown in China. Maintain stops of 68 cents. Second, in an environment where volatility is low and falling, it pays to have insurance in place. We continue to favour CHF/NZD (Chart I-12). Third, we were stopped out of our short USD/SEK position for a 1.9% loss. If global growth rebounds, this will be a high-conviction trade. However, we are standing aside for risk-management purposes. Finally, the Reserve Bank Of Australia kept rates on hold this week, while the Reserve Bank Of New Zealand cut rates. This bodes well for our strategic AUD/NZD position. Chester Ntonifor, Foreign Exchange Strategist chestern@bcaresearch.com Footnotes 1 Caroline Freund and Joseph E. Gagnon, “Effects of Consumption Taxes on Real Exchange Rates and Trade Balances,” Peterson Institute for International Economics, April 2017. 2 Maurice Obstfeld, “Tariffs Do More Harm Than Good At Home,” IMFBlog, September 8, 2016. Currencies U.S. Dollar Chart II-1USD Technicals 1
USD Technicals 1
USD Technicals 1
Chart II-2USD Technicals 2
USD Technicals 2
USD Technicals 2
Recent data in the U.S. have been mostly positive: To begin with the labor market, the unemployment rate fell to a 50-year low of 3.6% in April, despite a slight fall in the participation rate to 62.8%. Change in nonfarm payrolls came in above expectations at 263K in April, while average hourly earnings was unchanged at 3.2%. Moreover, JOLTS job openings came in at 7.5 million, above expectations. On the PMI front, the Markit composite PMI fell to 53 in April. ISM non-manufacturing PMI fell below expectations to 55.5. On the housing market front, mortgage applications increased by 2.7%, an improvement from the last reading of -4.3%. This nudged the MBA Purchase Index from 259.4 to 270.2. DXY index fell by 0.2% this week. On Sunday, Trump tweeted that tariffs on $200 billion worth of Chinese imports will increase from 10% to 25%, which again toppled the market. The ongoing trade disputes increase uncertainty in the global growth outlook. Report Links: Take Out Some Insurance - May 3, 2019 Currency Complacency Amid A Global Dovish Shift - April 26, 2019 Beware Of Diminishing Marginal Returns - April 19, 2019 The Euro Chart II-3EUR Technicals 1
EUR Technicals 1
EUR Technicals 1
Chart II-4EUR Technicals 2
EUR Technicals 2
EUR Technicals 2
Recent data in the euro area are improving: Headline and core inflation in the euro area rose to 1.7% and 1.2% year-on-year, respectively in April. Markit composite and services PMI came in at 51.5 and 52.8, respectively, both surprising to the upside. The French composite and services PMI increased to 50.1 and 50.5. The German composite and services PMI increased to 52.2 and 55.7. Sentix investor confidence rose to 5.3 in May, well above consensus. Retail sales increased by 1.9% year-on-year in March. EUR/USD appreciated by 0.3% this week. The European Commission (EU) released the spring 2019 Economic Growth Forecasts this week, citing that “growth continues at a more moderate pace.” While the global growth slowdown and trade policy uncertainties could weigh on the European economy, domestic dynamics are set to support the economy. According to the forecast, growth will continue to pick up in all EU member states next year. Report Links: Take Out Some Insurance - May 3, 2019 Reading The Tea Leaves From China - April 12, 2019 Into A Transition Phase - March 8, 2019 The Japanese Yen Chart II-5JPY Technicals 1
JPY Technicals 1
JPY Technicals 1
Chart II-6JPY Technicals 2
JPY Technicals 2
JPY Technicals 2
Recent data in Japan have been neutral: Nikkei composite PMI increased to 50.8 in April. The manufacturing PMI increased to 50.2, while the services PMI fell slightly to 51.8. Vehicle sales increased by 2.5% year-on-year in April. Consumer confidence index fell to 40.4 in April. USD/JPY fell by 0.9% this week. Volatility caused by the ongoing trade disputes has reduced risk appetite, enhancing the outperformance of the safe-haven yen. According to the BoJ minutes released this Wednesday, Japanese financial conditions remain highly accommodative, and the domestic demand is likely to bounce, despite the drag from external growth. Report Links: Beware Of Diminishing Marginal Returns - April 19, 2019 Tug OF War, With Gold As Umpire - March 29, 2019 A Trader’s Guide To The Yen - March 15, 2019 British Pound Chart II-7GBP Technicals 1
GBP Technicals 1
GBP Technicals 1
Chart II-8GBP Technicals 2
GBP Technicals 2
GBP Technicals 2
Recent data in the U.K. have been solid: Markit composite PMI increased to 50.9 in April. Services PMI also came in above expectations at 50.4 in April, an improvement from the last reading of 48.9. The British Retail Consortium (BRC) like-for-like retail sales increased by 3.7% year-on-year in April, outperforming expectations. Halifax house prices increased by 1.1% month-on-month in April and 5% year-on-year. GBP/USD fell by 0.9% this week, erasing the gains from last Friday after positive PMI data. We continue to favor the pound given its cheap valuation and healthy domestic fundamentals. However, the window for pound upside will rapidly close as we approach Brexit 2.0. Report Links: Take Out Some Insurance - May 3, 2019 Not Out Of The Woods Yet - April 5, 2019 A Trader’s Guide To The Yen - March 15, 2019 Australian Dollar Chart II-9AUD Technicals 1
AUD Technicals 1
AUD Technicals 1
Chart II-10AUD Technicals 2
AUD Technicals 2
AUD Technicals 2
Recent data in Australia have been mostly positive: CBA Australia composite and services PMI both outperformed, increasing to 50 and 50.1, respectively. Building permits contracted by 27.3% year-on-year in March. However, this looks like a volatile bottoming process on a chart. Retail sales increased by 0.3% month-on-month in March. The trade balance came in at a surplus of A$4.95 million in March. AUD/USD has been flat this week. The Reserve Bank of Australia kept interest rate on hold at 1.5% this week, which disappointed the bears. Moreover, in the monetary policy statement, the RBA estimates the economy will grow around 2.75% in 2019 and 2020, supported by increased investment and a pickup in the resources sector. Report Links: Beware Of Diminishing Marginal Returns- April 19, 2019 Not Out Of The Woods Yet - April 5, 2019 Into A Transition Phase - March 8, 2019 New Zealand Dollar Chart II-11NZD Technicals 1
NZD Technicals 1
NZD Technicals 1
Chart II-12NZD Technicals 2
NZD Technicals 2
NZD Technicals 2
Recent data in New Zealand have been mixed: ANZ commodity prices increased by 2.5% in April, higher than expected. 2-year inflation expectations remain at 2%. Dairy price index increased by 0.4% in April, above the estimated -1.1%. NZD/USD fell by 0.5% this week. On Tuesday, the RBNZ lowered its interest rate by 25 bps to 1.5%. Our long AUD/NZD position, which is currently 0.8% in the money, is likely to profit from the widened interest rate differential. In the monetary policy statement, the RBNZ stated that a lower rate is mostly consistent with the current employment and inflation outlook in New Zealand. Moreover, global uncertainties, coupled with domestic housing market softness and reduced immigration remain a headwind to the economy. Report Links: Not Out Of The Woods Yet - April 5, 2019 Balance Of Payments Across The G10 - February 15, 2019 A Simple Attractiveness Ranking For Currencies - February 8, 2019 Canadian Dollar Chart II-13CAD Technicals 1
CAD Technicals 1
CAD Technicals 1
Chart II-14CAD Technicals 2
CAD Technicals 2
CAD Technicals 2
Recent data in Canada have been positive: Ivey Purchasing Managers’ Index increased to 55.9 in April, well above estimates. Housing starts increased by 236K year-on-year in April. Imports and exports increased to C$52 billion and C$49 billion respectively in March, resulting in a small deficit of C$3 billion. New housing price index increased by 0.1% year-on-year in March. USD/CAD has been flat this week. On Monday, Governor Poloz gave a speech focusing on the Canadian housing sector. He aims to provide more flexible mortgage choices for Canadian consumers, which could help the housing market to stabilize. The possible measures include diversifying mortgage terms, developing an MBS market, and encouraging different mortgage designs. Report Links: Currency Complacency Amid A Global Dovish Shift - April 26, 2019 A Shifting Landscape For Petrocurrencies - March 22, 2019 Into A Transition Phase - March 8, 2019 Swiss Franc Chart II-15CHF Technicals 1
CHF Technicals 1
CHF Technicals 1
Chart II-16CHF Technicals 2
CHF Technicals 2
CHF Technicals 2
Recent data in Switzerland have been neutral: Headline inflation fell to 0.2% in April on a month-on-month basis, while unchanged at 0.7% on a year-on-year basis. Core inflation was unchanged at 0.5% year-on-year. Foreign currency reserves increased to 772 billion CHF in April. Unemployment rate was unchanged at 2.4% month-on-month in April. The SECO consumer climate fell to -6 in Q2. USD/CHF fell by 0.2% this week. While the trade disputes and increased global growth uncertainties could support the Swiss franc in the near term, we continue to favor the euro over the franc on a cyclical basis. Report Links: Beware Of Diminishing Marginal Returns - April 19, 2019 Balance Of Payments Across The G10 - February 15, 2019 A Simple Attractiveness Ranking For Currencies - February 8, 2019 Norwegian Krone Chart II-17NOK Technicals 1
NOK Technicals 1
NOK Technicals 1
Chart II-18NOK Technicals 2
NOK Technicals 2
NOK Technicals 2
Recent data in Norway have been mixed: Registered unemployment fell to 2.3% in April. Manufacturing output contracted by 0.8% in March. House prices rose by 2.2% year-on-year in April, below March’s 3.2% annual growth. USD/NOK increased by 0.2% this week. On Thursday, the Norges Bank kept interest rates on hold at 1%, in line with expectations. The monetary policy continues to be accommodative, which is a tailwind for the Norwegian economy. Report Links: Currency Complacency Amid A Global Dovish Shift - April 26, 2019 A Shifting Landscape For Petrocurrencies - March 22, 2019 Balance Of Payments Across The G10 - February 15, 2019 Swedish Krona Chart II-19SEK Technicals 1
SEK Technicals 1
SEK Technicals 1
Chart II-20SEK Technicals 2
SEK Technicals 2
SEK Technicals 2
Recent data in Sweden have been negative: Industrial production contracted by 1.3% year-on-year in March. Manufacturing new orders decreased by 8.1% year-on-year in March, the worst since November 2016. USD/SEK increased by 0.8% this week. Our short USD/SEK position was stopped out at 9.6, due to the weaker-than- expected Swedish data and unexpected U.S. dollar resilience. We will look to put the trade back on when we see more clear signs of a global growth bottom. Report Links: Balance Of Payments Across The G10 - February 15, 2019 A Simple Attractiveness Ranking For Currencies - February 8, 2019 Global Liquidity Trends Support The Dollar, But... - January 25, 2019 Trades & Forecasts Forecast Summary Core Portfolio Tactical Trades Closed Trades
Highlights Even if higher tariffs are imposed tonight, there is a good chance that China and the U.S. will reach a temporary trade truce over the coming weeks. Contrary to President Trump’s assertion, U.S. companies and consumers have borne all of the costs of the tariffs. With the next U.S. presidential campaign less than one year away, the self-described “master negotiator” will actually need to prove that he can negotiate a trade deal. If trade talks do collapse, the Chinese will ramp up credit/fiscal stimulus “MMT style,” thus providing a cushion under global growth and risk assets. In fact, there is a very high probability that the Chinese will overreact to the risks to growth, much like they did in 2009 and 2016. Investors should remain overweight global equities for the next 12 months, while positioning for a modestly weaker U.S. dollar and somewhat higher global bond yields. Feature Tariff Man Strikes Again Hopes for a quick end to the trade war were dashed last Sunday. President Trump threatened to hike tariffs on $200 billion of Chinese goods and begin proceedings to tax the remaining $325 billion of imports currently not subject to tariffs. Although details remain sketchy, U.S. Trade Representative Robert Lighthizer apparently informed the president that the Chinese were backtracking on prior commitments to change laws dealing with issues such as market access, forced technology transfers, and IP theft.1 This infuriated Trump. Trump’s announcement came just as Vice Premier Liu He and a 100-person Chinese trade delegation were set to depart for Washington. As BCA’s Chief Geopolitical Strategist Matt Gertken has noted, the relationship between the two sides was deteriorating even before Trump fired his latest salvo.2 The Chinese government was incensed by the U.S. request that Canada detain and extradite a senior official at Huawei, a top Chinese telecom firm. For its part, the Trump Administration was irked by China’s questionable enforcement of Iranian oil imports, the escalation of Chinese military drills around Taiwan, and the perception that China had not done enough to keep North Korea in check following the failed summit with Kim Jong-Un in Hanoi. It would be naïve to expect these ongoing geopolitical issues to fade anytime soon. The world is shifting from a unipolar to a multipolar one (Chart 1). In an environment where there are overlapping spheres of influence, geopolitical tensions will rise. Chart 1The Era Of Unipolarity Is Over
The Era Of Unipolarity Is Over
The Era Of Unipolarity Is Over
That said, stocks still managed to advance during the first four decades of the post-war era even though the U.S. and the Soviet Union were at each other’s throats. What investors need today is some reassurance that the current trade spat will not degenerate into a full-out trade war that undermines global commerce. Ultimately, we think they will get this reassurance for the same reason that the Soviets and Americans never ended up lobbing missiles at each other: It would have been a lose-lose proposition to do so. Yet, the path from here to there will be a bumpy one. Investors should expect heightened volatility over the coming weeks. As It Turns Out, Trade Wars Are Neither Good Nor Easy To Win There was never any doubt that Wall Street would suffer from a trade war. What was less clear at the outset was the impact that higher tariffs would have on Main Street. Despite President Trump’s claim that the tariffs paid to the U.S. Treasury were “mostly borne by China,” the evidence suggests that close to 100% of the tariffs were, in fact, borne by U.S. companies and consumers. What investors need today is some reassurance that the current trade spat will not degenerate into a full-out trade war that undermines global commerce. A recent NBER paper compared the prices of Chinese imports that were subject to tariffs and similar goods that were not.3 Had Chinese producers been forced to bear the cost of the tariffs, one would have expected pre-tariff import prices to decline. In fact, they didn’t. The tariffs were simply absorbed by U.S. importers in the form of lower profit margins and by U.S. consumers in the form of higher selling prices. This does not mean that Chinese producers escaped unscathed. The paper showed that imports of tariffed goods dropped sharply as U.S. demand shifted away from China and towards domestically-produced goods and imports from other countries. Chart 2Support For Protectionism Rises When Unemployment Is High
Support For Protectionism Rises When Unemployment Is High
Support For Protectionism Rises When Unemployment Is High
One might think that the decision to divert spending from Chinese goods to, say, Korean goods would be irrelevant for U.S. welfare. However, a simple thought experiment reveals that this is not the case. Suppose that a 10% tariff raises the price of an imported good from $100 to $110. If the consumer buys this good from China, the consumer will lose $10 while the U.S. government will gain $10, implying no loss in welfare. However, suppose the consumer buys the same good, tariff-free, from Korea for $105. Then the consumer loses $5 while the government gets no additional revenue, implying a net loss in national welfare of $5. Things get trickier when we consider the case where the consumer buys an identical domestically-produced good for say, $107, in order to avoid the tariff. If the economy is suffering from high unemployment, the additional demand will boost GDP by $107. The consumer who bought the domestically-produced good will be worse off by $7, but wages and profits will rise by $107, leaving a net gain of $100 for the economy. When unemployment is high, beggar-thy-neighbor policies make more sense. This is a key reason why support for protectionism tends to rise when unemployment increases (Chart 2). Today, however, the U.S. unemployment rate is at a 49-year low. To the extent that tariffs shift demand towards locally sourced goods, this is likely to require that workers and capital be diverted from other uses. When this occurs, there is no change in overall GDP. Within the context of the example above, all that would happen is that consumers would lose $7, reducing national welfare by the same amount. In fact, it is even worse than that. The example above does not include the impact on welfare from any resources that would need to be squandered from having to shift workers and capital equipment from sectors of the economy that lose from higher tariffs to those that gain from them. Nor does the example include the adverse impact on national welfare from any retaliatory policies. Ironically, while the evidence suggests that U.S. tariffs did not have much effect on Chinese import prices, it does appear that Chinese tariffs had an effect on U.S. export prices. Agricultural prices are highly sensitive to market conditions. Chart 3 shows that grain and soybean prices fell noticeably in 2018 on days when trade tensions intensified. This pattern has continued into the present. It is not surprising that Senators Chuck Grassley and Joni Ernst, along with other senior Iowa politicians, penned a letter to President Trump imploring him to reach a trade deal in order to help the state’s farming communities.4
Chart 3
China’s Secret Weapon: MMT To be fair, the arguments above do not account for the strategic possibility that the threat of punitive tariffs forces the Chinese to open their markets and refrain from corporate espionage and IP theft. If Trump is able to wrangle these concessions from the Chinese, then he could remove the tariffs, creating an environment more favorable to American corporate interests. The problem is that China will resist conceding so much ground. True, a trade war would hurt Chinese exporters much more than it would hurt U.S. firms. However, China is no longer as dependent on trade as it once was. Chinese exports to the U.S. account for only 3.6% of GDP, down from 7.3% of GDP in 2006 (Chart 4). China also has plenty of tools to support the economy in the event of a trade war. Chief among these is credit/fiscal stimulus. As we discussed three weeks ago, investors are underestimating China’s ability to ramp up credit growth in order to support spending throughout the economy.5 High levels of household savings have kept interest rates below the growth rate of the economy (Chart 5). When GDP growth exceeds the interest rate at which the government can borrow, even a persistently large budget deficit will produce a stable debt-to-GDP ratio in the long run. Chart 4China Is No Longer As Dependent On Trade With The U.S. As It Once Was
China Is No Longer As Dependent On Trade With The U.S. As It Once Was
China Is No Longer As Dependent On Trade With The U.S. As It Once Was
Chart 5China: High Levels Of Household Savings Have Kept Interest Rates Below The Growth Rate Of The Economy
China: High Levels Of Household Savings Have Kept Interest Rates Below The Growth Rate Of The Economy
China: High Levels Of Household Savings Have Kept Interest Rates Below The Growth Rate Of The Economy
The standard counterargument is that governments cannot control the interest rate at which they borrow. This means that they run the risk of experiencing a vicious circle where high debt levels cause bond yields to rise, making it more difficult for the government to service its debt. This could lead to even higher bond yields and, eventually, default. However, this argument applies only to countries that do not issue their own currencies. Since a sovereign government can always print cash to pay for the goods and services, it can never run out of money. Chinese exports to the U.S. account for only 3.6% of GDP, down from 7.3% of GDP in 2006. The main reason a sovereign central bank would wish to raise rates is to prevent the economy from overheating. If a rising fiscal deficit is the consequence of a decline in private-sector spending (which is something that would likely happen during a trade war), there is no risk of overheating, and hence, there is no need to raise interest rates. We are not big fans of Modern Monetary Theory, but at least on this point, the MMT crowd is right while most analysts are wrong. Investment Conclusions It is impossible to say with any confidence what the next few days will bring on the trade front. If the Trump Administration’s allegation that the Chinese backtracked on prior commitments turns out to be true, it is possible that some of them will be reinstated, thus allowing the negotiations to resume. This could prompt Trump to offer a “grace period” to the Chinese of one or two weeks later tonight before scheduled tariff hikes are set to occur. If tariffs do go up, what should investors do? The answer depends on how much stocks fall in response to the news. If global equities were to decline by more than five percent, our inclination would be to get more bullish. There are two reasons for this. First, the failure to reach a deal this week does not mean that the talks will irrevocably break down. The point of Trump’s tariffs was never to raise revenue. It was to force the Chinese into a trade agreement that served America’s interests. With less than a year to go before the presidential campaign kicks into high gear, the self-described “master negotiator” needs to prove to the American public that he can actually negotiate a trade deal. This means some sort of an agreement is more likely than not. Second, as noted above, China will respond aggressively with fresh stimulus if the U.S. slaps tariffs on its exports. This will help cushion global growth and risk assets. Infrastructure spending tends to be more commodity intensive than manufacturing production. Thus, even if the Chinese government exactly offsets the loss of manufacturing exports with additional infrastructure spending, the net effect on global growth will probably be positive. China will respond aggressively with fresh stimulus if the U.S. slaps tariffs on its exports. In reality, there is a very high probability that the Chinese will do more than that. As the 2009 and 2016 episodes illustrate, when faced with a clear downside shock to growth, the government calibrates the policy response based on the worst-case scenario. Not only would a bout of hyperstimulus provide downside protection to the Chinese economy against a growth shock, it would also give the government more negotiating leverage with Trump. After all, it is much easier to brush away threats of punitive tariffs if you have an economy that is humming along. Investors should remain overweight global equities for the next 12 months, while positioning for a modestly weaker U.S. dollar and somewhat higher global bond yields. Peter Berezin, Chief Global Strategist Global Investment Strategy peterb@bcaresearch.com Footnotes 1 David Lawder, Jeff Mason, and Michael Martina, “Exclusive: China backtracked on almost all aspects of U.S. trade deal – sources,” Reuters, May 8, 2019. 2 Please see Geopolitical Strategy Special Alert, “U.S. And China Get Cold Feet,” dated May 6, 2019. 3 Mary Amiti, Stephen J. Redding, and David E. Weinstein, “The Impact of the 2018 Trade War on U.S. Prices and Welfare,” NBER Working Paper No. 25672, (March 2019). 4 “Young, Ernst Lead Iowa Delegation in Letter Urging President Not to Impose Tariffs,” Joni Ernst United States Senator For Iowa, March 7, 2018. 5 Please see Global Investment Strategy Weekly Report, “Chinese Debt: A Contrarian View,” dated April 19, 2019. Strategy & Market Trends MacroQuant Model And Current Subjective Scores
Chart 6
Tactical Trades Strategic Recommendations Closed Trades
Highlights Coming up on the deadline for President Trump’s China – U.S. tariff ultimatum, tariffs on $200 billion of Chinese imports could go to 25% from 10% on Friday – the outlook for base metals remains complicated, particularly for aluminum and copper.1 Of course, the U.S. and China could have a meeting of the minds and agree to resolve the outstanding issues in the trade negotiations. This would be supportive of continued global supply-chain expansion, EM income growth and base metals prices generally. On the downside, an escalation of the Sino – U.S. trade war could retard investment in global supply chains, as firms hunker down for an extended and contentious contraction in global trade.2 This would be bearish for EM income growth, which would translate directly into lower base metals demand and, all else equal, depress prices. Still, a breakdown in trade talks could be bullish for base metals, as China likely would increase its fiscal, monetary and credit stimulus, in an attempt to offset the income-suppressing effects of reduced global trade and investment. As we said, it’s complicated. Two of the three outcomes above are supportive of base metals prices – i.e., a deal is agreed, and increased Chinese stimulus in the event of a breakdown in negotiations. Against this backdrop, we are closing our long tactical trading recommendations in copper and aluminum at tonight’s close, and replacing them with a call spread on July CME COMEX copper, in which we will get long $3.00/lb calls vs. short $3.30/lb calls. The call spreads are a low-risk way of positioning in a volatile market for a likely price-supportive outcome in these talks – the max loss on this position is the net premium paid to get long the spread. Highlights Energy: Overweight. Supply-side fundamentals continue to dominate oil price formation. An unplanned outage in Russia that took ~ 1mm b/d of oil off the market this week, following the contamination of exports with organic chloride left in shipments via Transneft’s European pipeline system. Russia’s Energy Ministry is guiding markets to expect the contamination will be cleared up toward the end of this month.3 Base Metals: Neutral. We are closing our tactical aluminum and copper trade recommendations at tonight’s close. We do see the potential for higher base metals prices – particularly copper – if China expands fiscal and monetary stimulus in the wake of a breakdown in trade talks with the U.S., or both sides can resolve their differences. We expect copper will benefit most from such outcomes. However, we believe a call spread – long July $3.00/lb CME COMEX calls vs. short $3.30/lb calls expiring in July – is a lower-risk way of expressing this view. Precious Metals: Neutral. Gold could rally in the wake of an expanded trade war, if the Fed and the PBOC – along with other systemically important central banks – adopt more accommodative monetary policies in anticipation of a widening trade conflict. Greater fiscal, credit and monetary stimulus by China in response to a breakdown in trade talks also could boost safe-haven demand for gold. Ags/Softs: Underweight. The risk of a wider Sino – U.S. trade war – particularly the likely retaliation by China if U.S. tariffs are raised to 25% on already-targeted exports of $200 billion – would be especially bearish for soybeans and grain exports from the U.S. We remain underweight. Feature In the wake of President Donald Trump’s ultimatum to China to resolve trade talks by tomorrow, BCA Research’s geopolitical strategists give 50% odds to a successful trade deal being concluded by end-June. The odds of an extension of trade talks are 10%; and the odds of no deal on trade, 40% (Table 1). Table 1Updated Trade War Probabilities (May 2019)
Expanded Sino – U.S. Trade War Could Be Bullish For Base Metals
Expanded Sino – U.S. Trade War Could Be Bullish For Base Metals
Of these possible outcomes, the no-deal scenario – i.e., an escalation in the trade war including raising tariffs on imports from China to 25% on the $200 billion of goods now carrying a 10% duty – would be the most volatile, and likely would push base metals’ prices lower in the short-term. A trade deal would set markets to estimating the extent of supply-chain investment and trade-flow revival, as the drawn-out uncertainty around the outcome of the Sino – U.S. trade war fades. Given the slim wedge our geopolitical strategists see between the deal and no-deal outcomes to these trade talks, we believe the implications of the latter need to be sorted. An agreement to extend trade talks likely would be welcomed with the same aplomb shown by markets prior to this current level of high drama. In this scenario, markets likely would price in an economically rational outcome to the U.S. – China trade negotiations, which resolves the uncertainty around tariffs and other investment-retarding policies. Given the slim wedge our geopolitical strategists see between the deal and no-deal outcomes to these trade talks, we believe the implications of the latter need to be sorted. In the short term – i.e., following a breakdown in the talks – market sentiment likely would become more negative, as traders priced in the implications for reduced global supply-chain investment and trade flows, particularly re China and EM exporters. In addition, base metals markets would discount the income hit to EM these effects would feed into, raising the likelihood commodity demand growth would slow. News flow would then dictate price action for the metals over the short term. As markets discount these expectations, we believe Chinese policymakers would act to increase the levels of fiscal, credit and monetary stimulus domestically, to counter the hit to domestic income. The lagged effects of this stimulus will have a strong influence on base metals’ price formation, and, depending on the level of stimulus, could be bullish for metals prices. China’s Influence on Base Metals Higher Post-GFC In previous research, we found copper, and to lesser extent aluminum and the LMEX index, which is heavily weighted to both, benefit most from monetary, credit and fiscal stimulus in China.4 Other metals also experience a lift when the level of these Chinese policy variables rises; however, their relationship with EM and China’s industrial production cycle is weaker and time varying (Chart of the Week).
Chart 1
In Table 2, we show how different policy and macro factors affect various base metal prices and the LMEX; these models generate the output for the curves in the Chart of the Week. The table show the coefficients of determination for single-variable regressions for each metal on the EM- or China-focused factor shown in the columns for the period 2000 to now, and 2010 to now. Within the base metals complex, copper, the LMEX index and aluminum exhibit the strongest and most reliable relationships with the explanatory variables shown at the top of each column. Table 2Coefficients Of Determination: Base Metals Prices (yoy) Vs. Key Factors
Expanded Sino – U.S. Trade War Could Be Bullish For Base Metals
Expanded Sino – U.S. Trade War Could Be Bullish For Base Metals
The biggest takeaway from this analysis is that, for each individual metal, Chinese economic activity in particular, and EM income dynamics generally dominate price determination. The importance of these factors increased considerably post-Global Financial Crisis (GFC). As was the case with our correlation analysis, this is best captured by our Global Industrial Activity (GIA) Index (Chart 2, panel 1). This is clearly seen in the co-movement of our GIA index and copper prices (Chart 2, panel 2), and EM GDP.5 Chart 3 shows the GIA index disaggregated in its four main components. Chart 2BCA's GIA Index Vs. EM GDP, Copper Prices
BCA's GIA Index Vs. EM GDP, Copper Prices
BCA's GIA Index Vs. EM GDP, Copper Prices
Chart 3BCA GIA Index Components' Performance
BCA GIA Index Components' Performance
BCA GIA Index Components' Performance
Our analytical framework for base metals in China holds the nonferrous “pillar industries” behave as vertically integrated conglomerates. The influence of China’s economy on base metals prices is not unexpected: As China’s relative share of base metals supply and demand versus the rest of the world has grown, the marginal impact of its fiscal, credit, monetary and trade policies increased (Chart 4). The principal effect would be visible in China’s demand-side effects, to which the supply side would respond. That is to say, China’s monetary, credit and fiscal policies post-GFC lifted domestic incomes, which lifted demand domestically. In addition, aggressive export-oriented trade policy contributed to income growth, as well. This prompted increased base metals and bulk (e.g., steel) output on the supply side.
Chart 4
A large part of this dynamic likely is explained by the role of state-owned enterprises (SOEs) in the base-metals markets in China. It is important to note these SOEs are strategic government holdings, responding to and directing government policy, as was recently noted in a University of Alberta study on SOEs: … the government maintains control over a number of economically significant industries, such as the automobile, equipment manufacturing, information technology, construction, iron and steel, and nonferrous metals sectors, which are all considered to be ‘pillar industries’ of the Chinese economy. The government, as a matter of official policy, intends to maintain sole ownership or apply absolute control over only what it considers to be strategic industries, but also maintains relatively strong control over the pillar industries.6 Our analytical framework for base metals in China holds the nonferrous “pillar industries” behave as vertically integrated conglomerates – ranging from firms refining of raw ore to those producing finished products used in infrastructure, construction, etc. In this framework, nonferrous metals in China are not commodity markets per se, but vertically integrated policy-driven industries responding to directives from the Chinese Communist Party’s (CCP) Politburo through to the State Council and the various ministries directing production and consumption.7 At the heart of this is the CCP’s efforts to direct economic growth. Investment Implications The implication of our policy-focused research is investors should focus on metals for which a large share of the variance in y/y prices can be explained by movements in Chinese economic activity. The no-deal outcome could be positive for base metals prices. To get a handle on this, we looked at the variance decomposition of each metal’s price in response to exogenous shocks originating from (1) Chinese economic activity, (2) EM (ex-China) and Complex Economies industrial activity, (3) U.S. industrial activity, and (4) the U.S. trade weighted dollar (Table 3).8 Using this approach, we found that: Copper, aluminum and the LMEX’s variances are mostly explained by China’s economic activity (~ 25%); specifically, shocks to the state’s industrial activity and credit cycle. This corroborates our earlier research, in which we focused on correlations between base metals and these factors. Idiosyncratic factors seem to account for a large part of nickel, lead and zinc’s price formation. This is seen by the large proportion of their variances that is unexplained by our selected explanatory variables. Given the opacity of fundamental data in these markets, we tend to avoid positioning in them. On average, EM ex-China and U.S. industrial activity account for a similar proportion of the variance in metal’s prices (~ 8%). While the U.S. dollar appears to be the second most important variable (~ 14%). Table 3China’s Economic Activity Drives Metals’ Return Variability
Expanded Sino – U.S. Trade War Could Be Bullish For Base Metals
Expanded Sino – U.S. Trade War Could Be Bullish For Base Metals
Our analysis indicates that, as a group, base metals will be supported by the ongoing credit stimulus in China. Each metal is positively correlated with China’s credit cycle and industrial activity. Nonetheless, from our correlation, regression and variance-decomposition analysis, we believe copper and aluminum provide a better and more reliable exposure, as does exposure to the LMEX index, because of its high aluminum and copper weightings. Bottom Line: Approaching the ultimatum set by U.S. President Trump for a resolution to the Sino – U.S. trade war, markets are understandably taut. The odds of a deal vs. no-deal outcome by end-June are close, while the odds trade talks are extended account for the difference. In our estimation, the no-deal outcome could be positive for base metals prices, given our expectation Chinese policymakers will lift the amount of stimulus to the domestic economy to offset the negative effects of an expanded trade war. A deal would remove a lot of the uncertainty currently holding back global supply-chain capex and trade flows, which also would be bullish for base metals. Robert P. Ryan, Chief Commodity & Energy Strategist rryan@bcaresearch.com Hugo Bélanger, Senior Analyst Commodity & Energy Strategy HugoB@bcaresearch.com Footnotes 1 For further discussion, please see “U.S. And China Get Cold Feet,” a Special Alert published by BCA Research’s Geopolitical Strategy May 6, 2019. It is available at gps.bcaresearch.com. Our geopolitical strategists give the odds of a successful trade deal being concluded by end-June 50%; that trade talks continue, 10%; and the odds of no deal on trade, 40%. 2 Please see “Global market structures and the high price of protectionism,” delivered at the Jackson Hole central bank conference August 25, 2018, by Agustín Carstens, General Manager, Bank for International Settlements. 3 Please see “Russia sees oil quality normalizing in late May after contamination, output drops,” published May 7, 2019, by reuters.com. 4 Please see our Weekly Report of April 25, 2019, entitled “Copper Will Benefit Most From Chinese Stimulus.” It is available at ces.bcaresearch.com. 5 BCA’s GIA index is heavily weighted toward EM industrial-commodity demand. Please see “Oil, Copper Demand Worries Are Overdone,” where we introduce and discuss the GIA index, published February 14, 2019, in BCA Research’s Commodity & Energy Strategy. It is available at ces.bcaresearch.com. 6 Please see “State-Owned Enterprises in the Chinese Economy Today: Role, Reform, and Evolution,” China Institute, University of Alberta, May 2018. 7 Something approximating a pure commodity market is crude oil – the supply and demand curves of many globally distributed sellers and buyers meet and clear the market. As such, a reasonable explanatory model for the evolution of prices can be generated using fundamental inputs (i.e., supply, demand and inventories). Fitting such models to base metals has proved difficult. We have better success explaining base metals prices using macro economic policy variables we believe are important to CCP policymakers – trade, credit, domestic GDP, etc. This is a new avenue of research, which we hope to use to hone in on a good explanatory model to account for ~ 50% of global base metal demand, and, in some instances (e.g., copper and steel, respectively) close to 40% - 50% of supply, as seen in Chart 4. Our current base metals research is focused on trying to disprove the hypothesis these are policy-directed markets within China. This aligns with Karl Popper’s falsifiability condition, which states a theory must be subject to independent, disinterested testing capable of refuting it, to be considered scientific. Please see “Popper, The Logic of Scientific Discovery,” (reprinted 2008), Routledge Classics, particularly Chapter 4. 8 Complex economies are countries ranking at the top of MIT’s Economic Complexity Index (ECI), and which export industrial goods to EM and China. The EM (ex-China) and Complex Economies variable is the first principal component extracted from a group of ~60 series related to industrial production in these countries. Investment Views and Themes Recommendations Strategic Recommendations Tactical Trades TRADE RECOMMENDATION PERFORMANCE IN 2019 Q1
Image
Commodity Prices and Plays Reference Table Trades Closed in 2019 Summary of Closed Trades
Image
The BoC places a lot of weight on the Business Outlook Survey (BoS) in determining its economic forecasts, and in setting monetary policy. Thus, it is no surprise that in the official statement following the April 24 monetary policy meeting, the BoC…
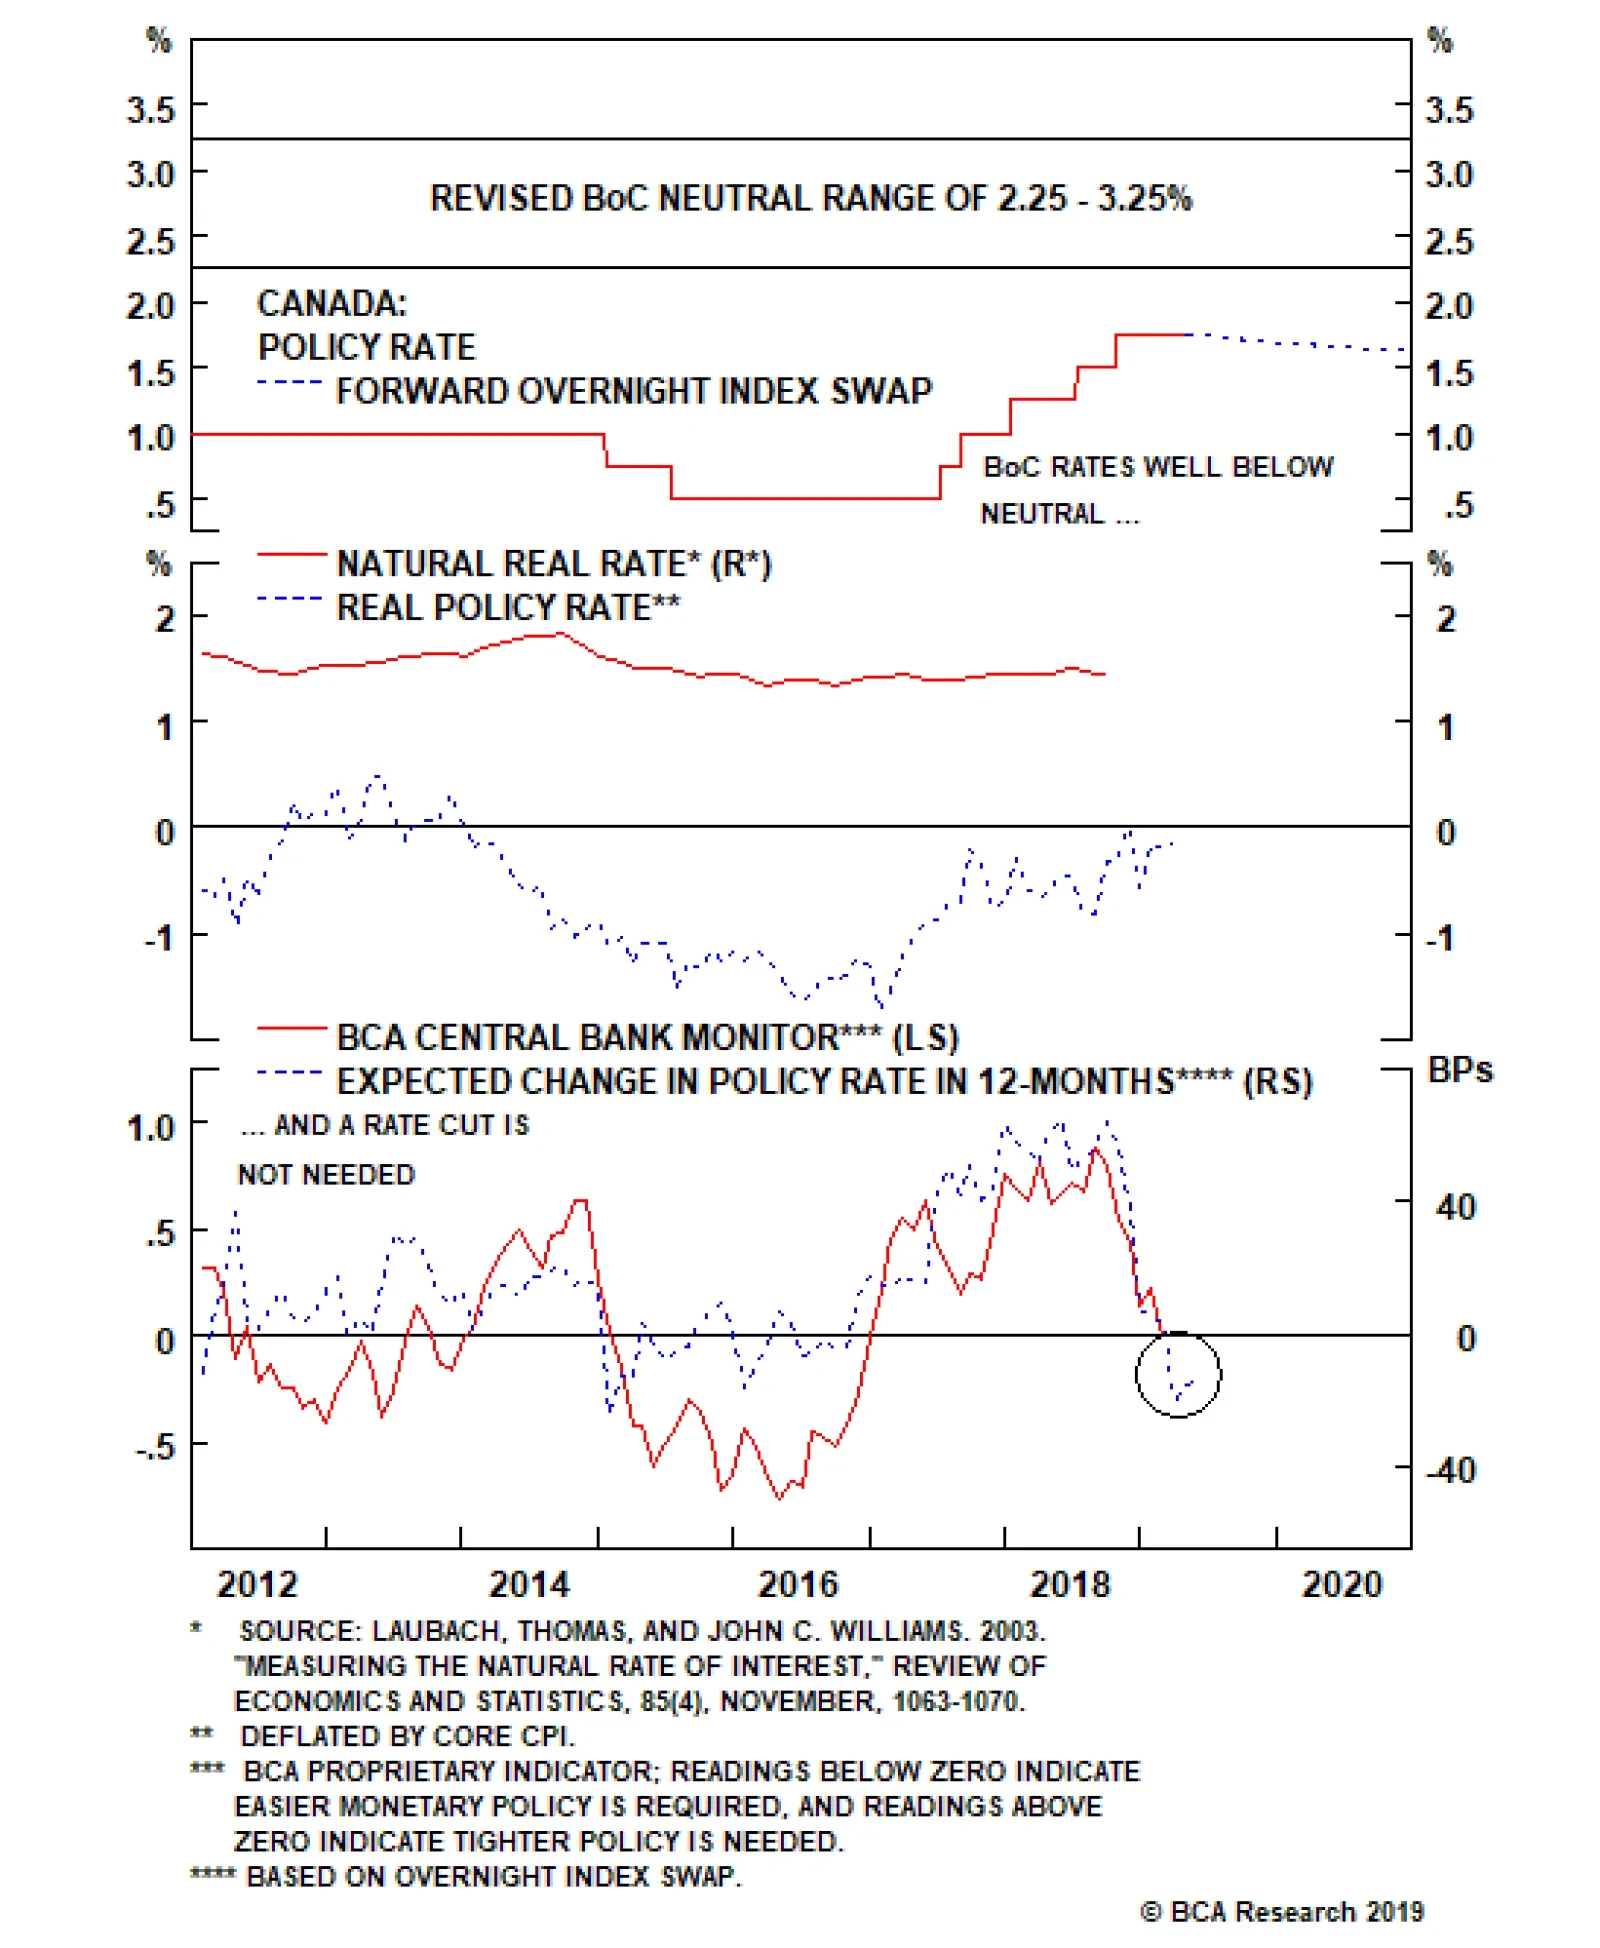
The problem for the BoC is that its policy rate of 1.75% remains well below its own estimated neutral range, which is now 2.25%-3.25%. A similar message comes when looking at the neutral real rate (“r-star”) estimate for Canada produced by the New York Fed,…
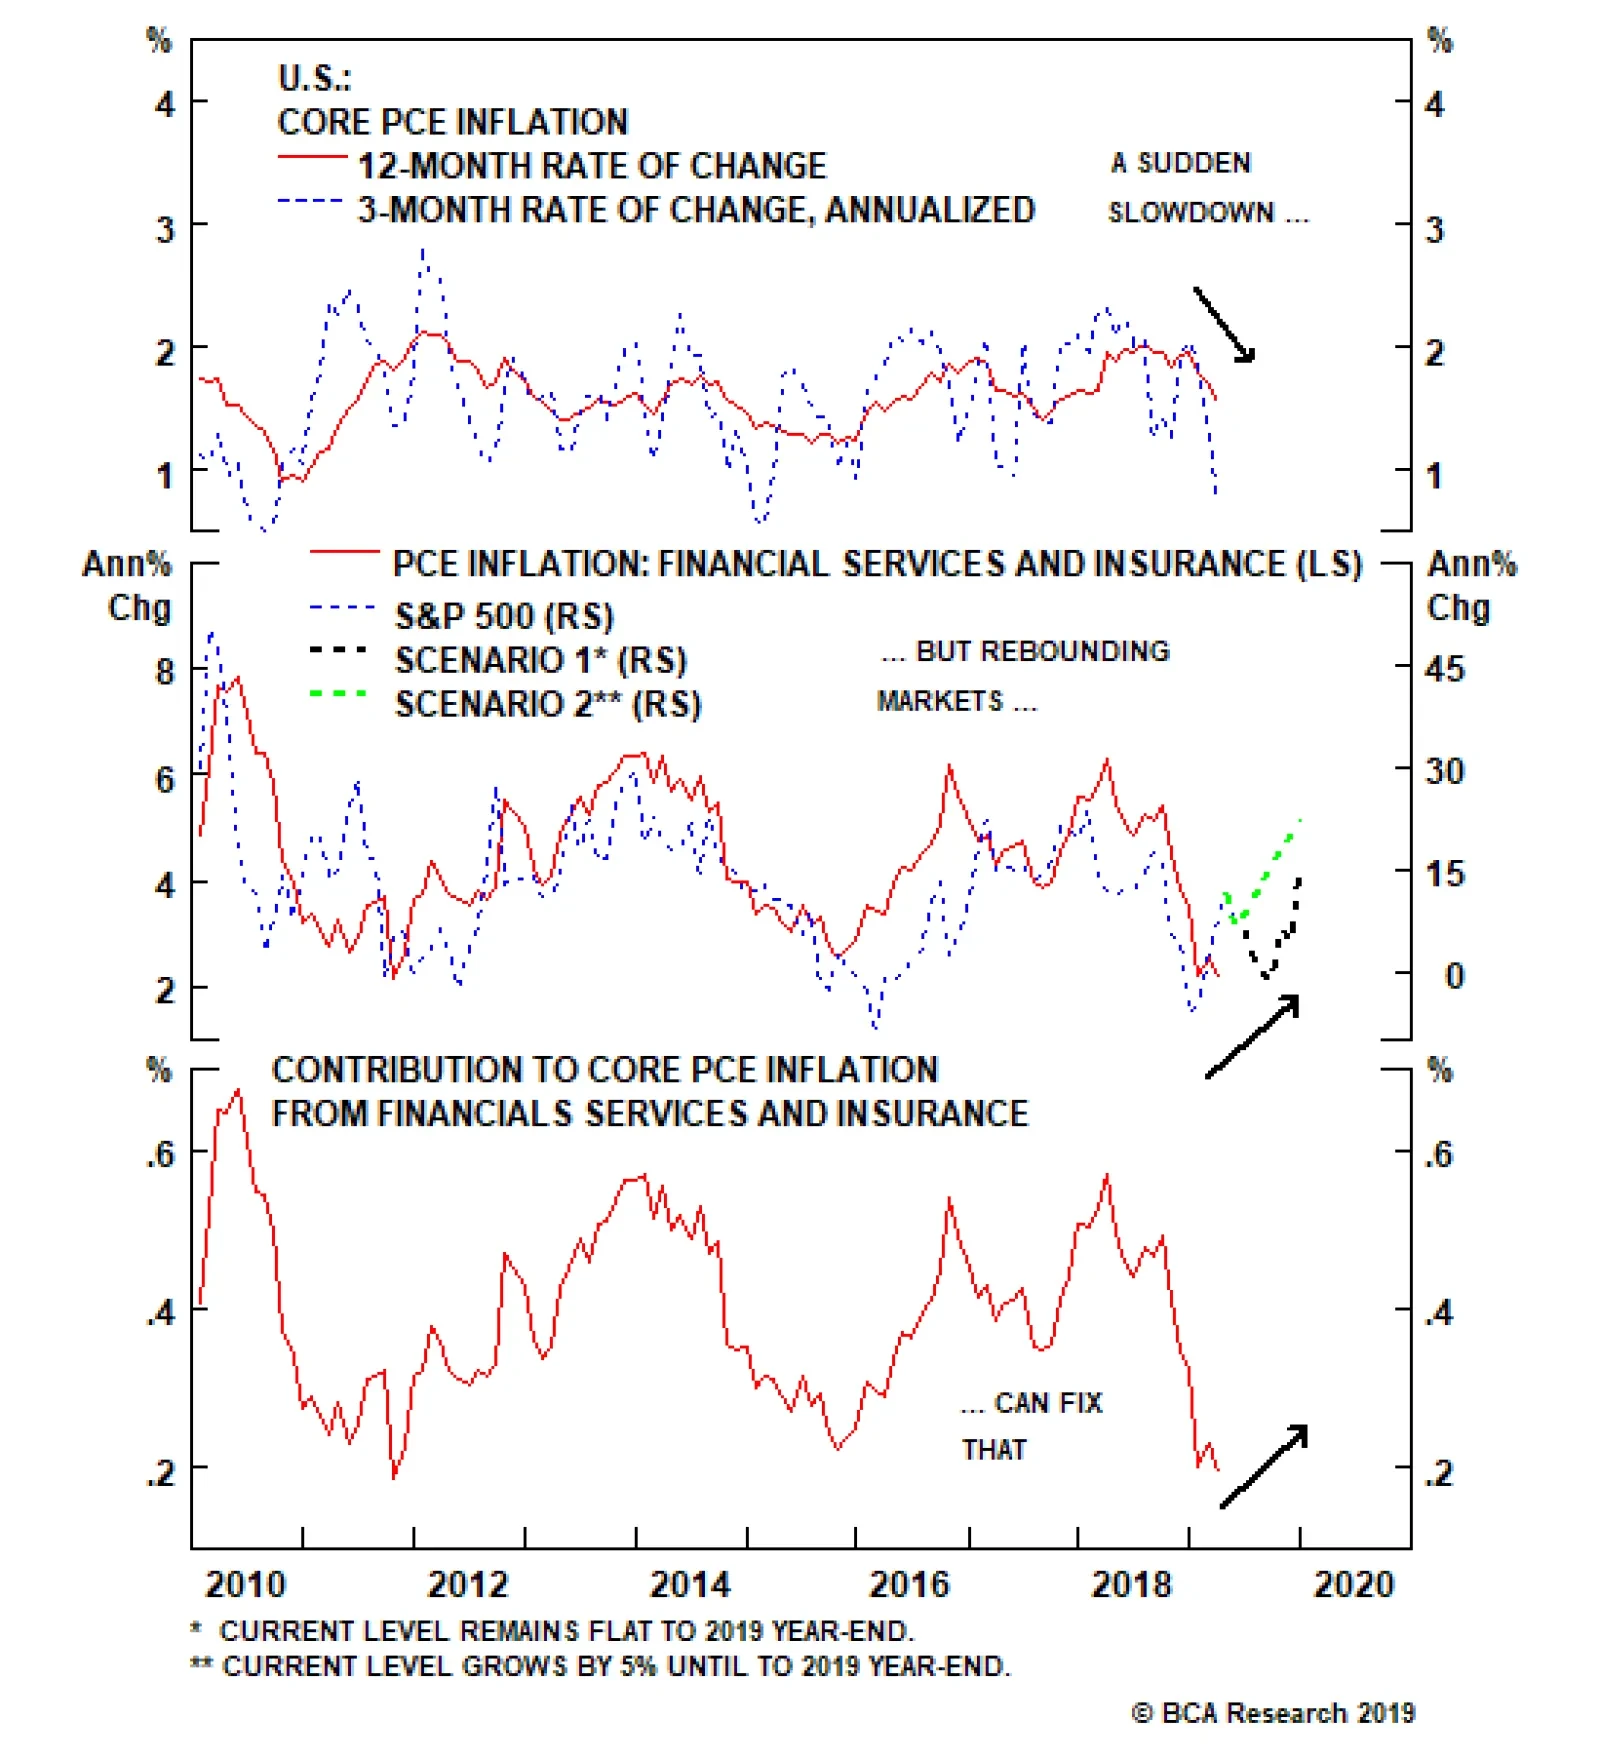
In 2018, prior to the year-end correction in U.S. equity markets, the contribution to core PCE inflation from the Financial Services category was a steady 0.5-0.6 percentage points. After the market rout, that contribution has fallen to 0.2 percentage points,…
The official statement acknowledged that U.S. inflation was running below the 2% target, but Fed Chair Jerome Powell later described that inflation shortfall as “transitory” and expected to reverse. Powell standing his ground so firmly was a sharp rebuke…
Highlights U.S.: The Fed remains decidedly neutral, despite market expectations (and White House pressure) for lower U.S. interest rates. Treasury yields are mispriced and should grind higher over the next 6-12 months, led first by inflation expectations and later by a more hawkish Fed. Canada: The Bank of Canada’s latest reports and commentary indicate that monetary policy will stay on hold over at least the balance of 2019. Bond markets are already priced for that outcome. Maintain a neutral stance on Canadian government bonds in global hedged fixed income portfolios. Sweden: The Riksbank’s recent dovish turn, calling for a flatter trajectory for interest rates and extending asset purchases, will keep Swedish bond yields lower for longer. Thus, we are closing our recommended tactical trades in Sweden that were positioned for rate hikes. Feature Global bond yields remain stuck in a range, seeking a new directional narrative. The downside is limited by green shoots of improving global growth (mostly from China stimulus), some commodity price reflation through higher oil prices and robust returns in most risk asset markets (i.e. an easing of financial conditions). At the same time, the upside for yields is capped by dovish forward guidance from data-dependent central banks who see below-trend economic growth and below-target inflation in the rearview mirror. Chart of the WeekForward MIS-guidance
Forward MIS-guidance
Forward MIS-guidance
We expect these opposing forces to be resolved through faster global growth and higher realized inflation over the next 6-12 months. Major central banks will not need to turn even more dovish and begin a monetary policy easing cycle to boost growth, despite current market pricing suggesting otherwise. Global bond yields will grind upward, first through higher inflation expectations and, later, from a shift away from discounting rate cuts and, in some countries, pricing in rate hikes. The pressure for higher yields will be strongest in the U.S., where the Treasury market now discounts that the current 2.5% fed funds rate will be the cyclical peak, below the median FOMC projection, even as inflation expectations have been moving higher (Chart of the Week). We continue to recommend pro-growth, pro-risk allocations in global fixed income markets: below-benchmark overall duration exposure, favoring global corporates over government bonds, focusing government bond exposure to countries where policymakers will be relatively less hawkish (Japan, U.K., Australia, Canada, New Zealand), and positioning for faster inflation expectations and bearish steepening of yield curves (most notably in the U.S. and core Europe). May FOMC Meeting: Sorry, Mr. President The Fed kept rates unchanged at last week’s FOMC meeting, dashing market hopes of a potential shift in language toward a future rate cut. The official statement acknowledged that U.S. inflation was running below the 2% target, but Fed Chair Jerome Powell later described that inflation shortfall as “transitory” and expected to reverse. Treasury yields got whipsawed by the mixed messaging, with the 2-year yield falling -6bps after the statement but then climbing +11bps during Powell’s press conference. Powell standing his ground so firmly was a sharp rebuke to U.S. money markets, which remain priced for rate cuts over the next year. It was also a strong sign of the Fed maintaining its political independence in the face of U.S. President Trump calling for aggressive rate cuts. From a growth perspective, the Fed is right to not panic. The employment backdrop remains solid, with the U.S. unemployment rate hitting a 50-year low in April of 3.6%. While cyclical growth indicators like the ISM Manufacturing index have trended lower, the headline index remains above the expansionary 50 level (Chart 2). The rally in U.S. equity and credit markets seen so far in 2019 has eased financial conditions, signaling an imminent rebound in the U.S. leading economic indicator (second panel). Furthermore, core measures of retail sales and capital goods orders have begun to reaccelerate after the Q1 slump impacted by the U.S. government shutdown. From a growth perspective, the Fed is right to not panic. On the inflation side, the story is more nuanced. Higher oil prices will boost headline inflation measures over the next six months. At the same time, the lagged impact of the surprising pickup in U.S. productivity growth (+2.4% year-over-year in Q1) will help dampen core inflation rates (Chart 3) via lower unit labor costs (flat year-over-year in Q1). Further complicating the issue for the Fed is the impact of lower inflation in the components that Fed Chair Powell deemed “transitory”, such as airfares, apparel and, most interestingly, the cost of financial services. Chart 2A Blossoming U.S. ##br##Rebound
A Blossoming U.S. Rebound
A Blossoming U.S. Rebound
Chart 3Blame Equities For The Cooling Of ##br##U.S. Core Inflation
Blame Equities For The Cooling Of U.S. Core Inflation
Blame Equities For The Cooling Of U.S. Core Inflation
The broad Financial Services and Inflation grouping, which includes market-related costs such as wealth management fees, now represents 9% of the overall U.S. core PCE deflator. The inflation rate of the Financial Services index is highly correlated to the performance of U.S. equity markets (Chart 4). This makes sense, as the costs of professional portfolio management are often tied to the size of assets under management. At a minimum, the market should be priced for the same neutral (unchanged) stance that the Fed is currently signaling, which is appropriate given signs of U.S. growth perking up. Chart 4Faster Productivity Means The Fed Can Be Patient
Faster Productivity Means The Fed Can Be Patient
Faster Productivity Means The Fed Can Be Patient
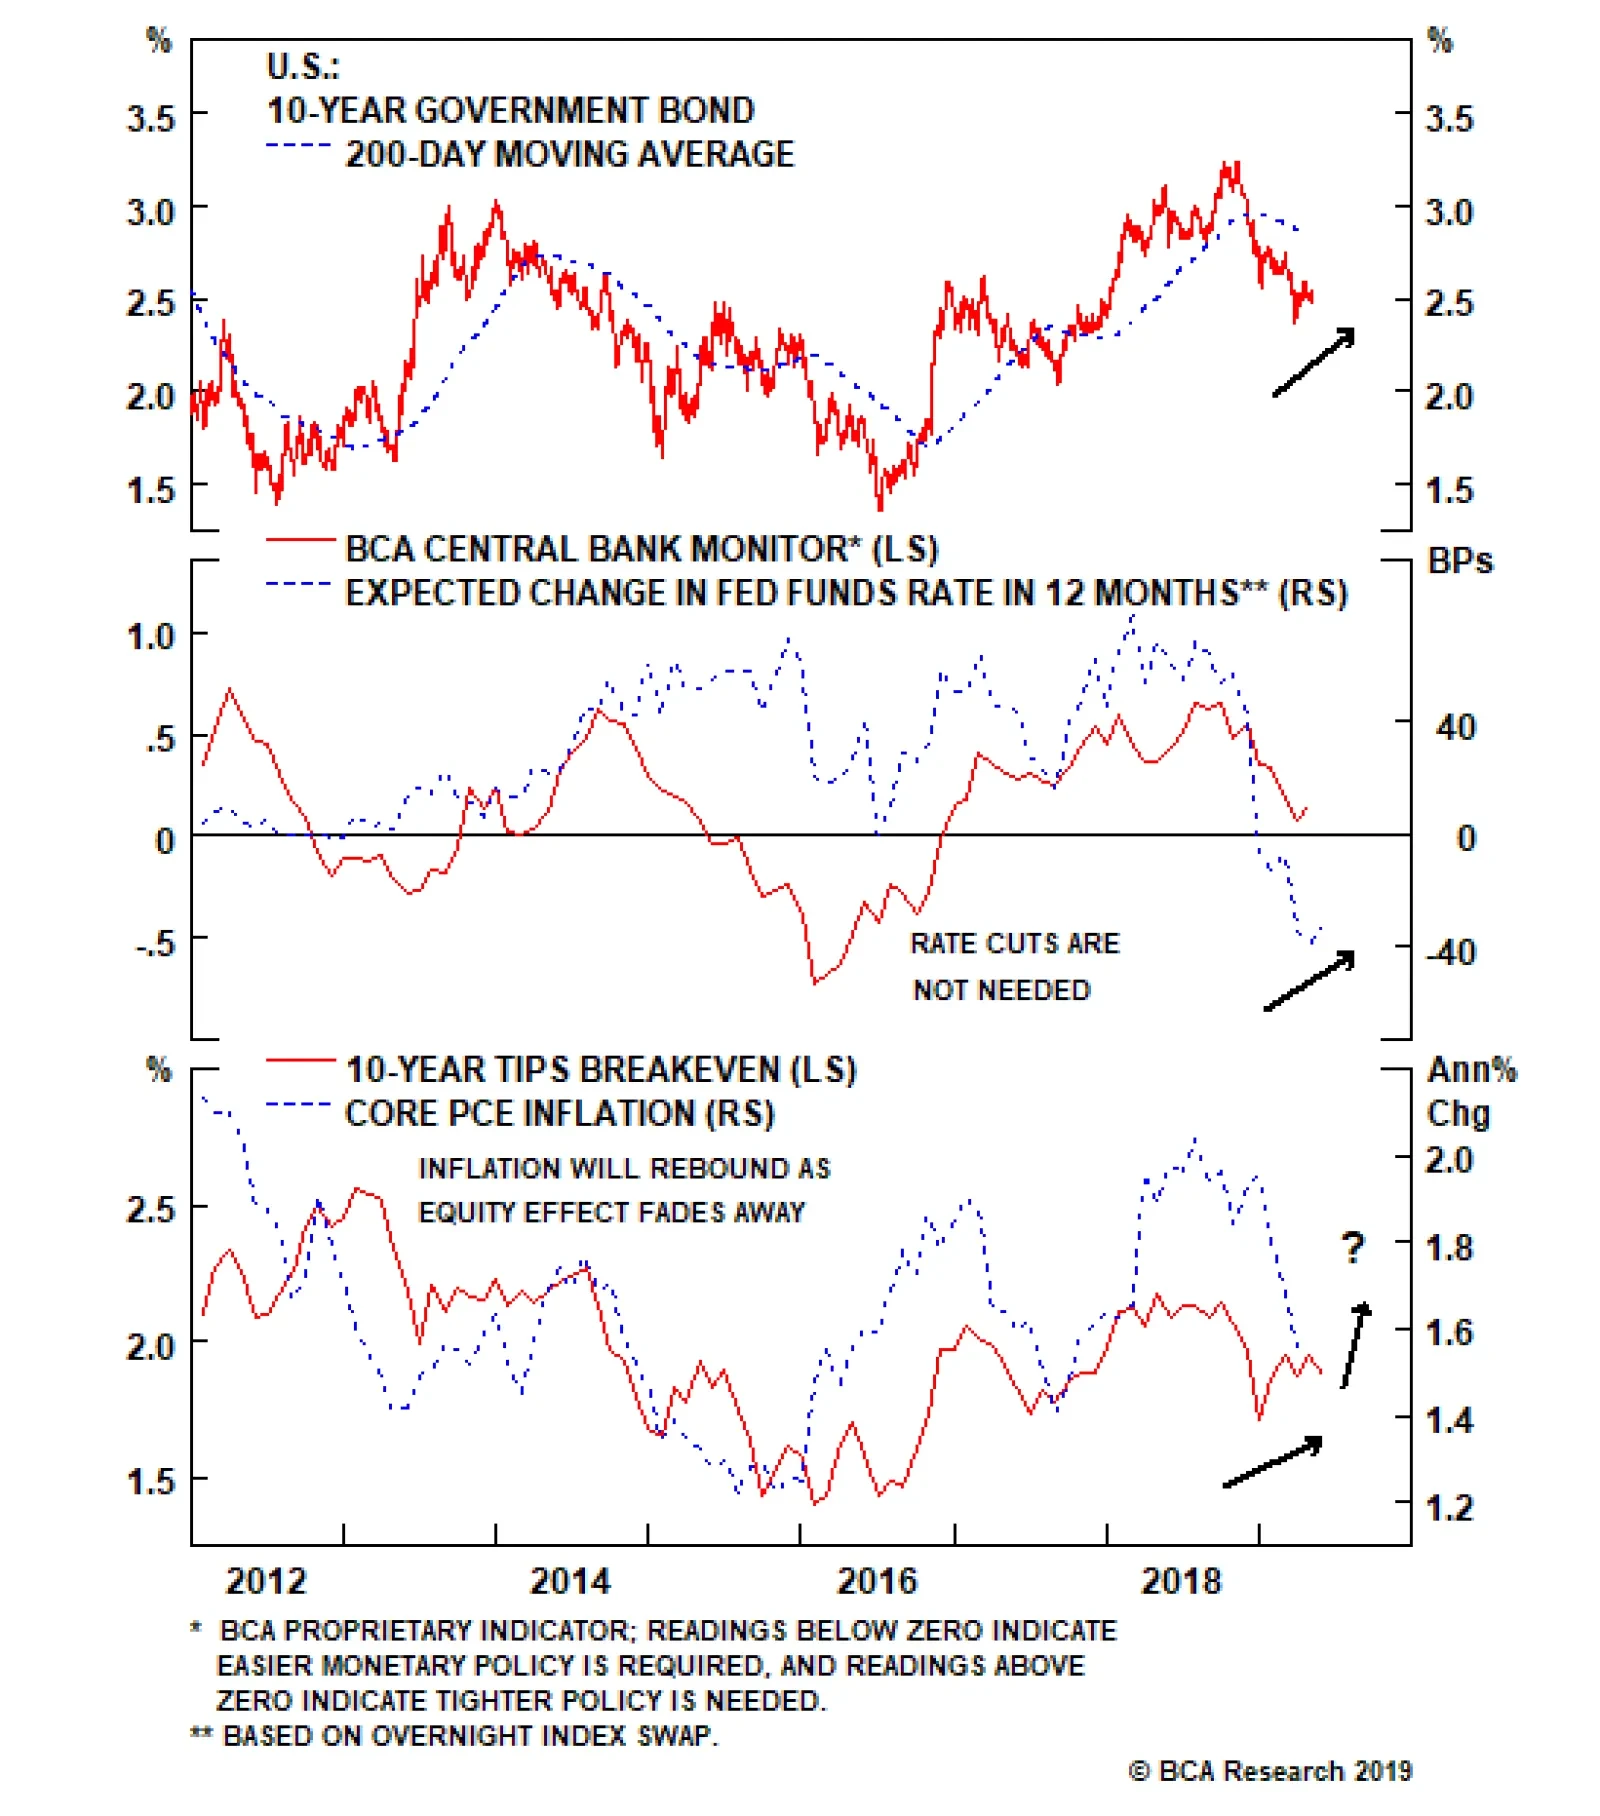
In 2018, prior to the year-end correction in U.S. equity markets, the contribution to core PCE inflation from the Financial Services category was a steady 0.5-0.6 percentage points. After the market rout, that contribution has fallen to 0.2 percentage points, accounting for nearly all of the 40bp decline in core PCE inflation since U.S. equities peaked last September. With equity markets having now regained all the late-2018 losses, Financial Services inflation should boost core PCE inflation by at least 20-30bps by year-end – and perhaps more if stocks continue to appreciate, per the BCA House View. With our Fed Monitor now sitting just above the zero line, indicating no pressure on the Fed to hike rates, the -30bps of rate cuts now discounted over the next year is too aggressive (Chart 5). At a minimum, the market should be priced for the same neutral (unchanged) stance that the Fed is currently signaling, which is appropriate given signs of U.S. growth perking up. The Fed will remain cautious on returning to a more hawkish stance until actual U.S. inflation turns higher, which will take some time given the competing forces of falling unit labor costs and fading “transitory” disinflationary effects. Chart 5Stay Underweight USTs & Below-Benchmark UST Duration
Stay Underweight USTs & Below-Benchmark UST Duration
Stay Underweight USTs & Below-Benchmark UST Duration
We think the 2017 experience will be useful to think about in the coming months. Then, the Fed paused its rate hiking cycle for a few months, primarily due to softer inflation readings related to unusual forces temporarily dampening core inflation (most notably, a one-time collapse in wireless phone prices related to a change in how those costs were measured). Once those “transitory” forces faded out of the data, the Fed resumed lifting the funds rate. It will likely take longer in 2019 before the Fed would feel confident enough to begin raising rates again, especially with the funds rate now much closer to neutral than two years ago. Nonetheless, we expect a similar story of rebounding inflation driving Treasury yields higher to unfold over the latter half of this year. A moderate below-benchmark U.S. duration stance, favoring shorter maturities, combined with a long position in inflation-protected TIPS over nominal Treasuries, remains appropriate. Bottom Line: The Fed remains decidedly neutral, despite market expectations (and White House pressure) for lower U.S. interest rates. Treasury yields are mispriced and should grind higher over the next 6-12 months, led first by inflation expectations and later by a more hawkish Fed. Canada Update: Stay Neutral Back in March, we upgraded our recommended Canadian government bond exposure to neutral after spending a long time at underweight.1 The rationale for our move was that the stunning loss of momentum in the Canadian economy at the end of 2018 would force the Bank of Canada (BoC) to not only stop raising rates, but stay on hold for longer than expected. After our upgrade, we noted that we would consider additional changes to our Canadian allocation after the releases of the latest BoC Business Outlook Survey (BoS) and the updated economic projections at the April 24 monetary policy meeting. None of those events makes us want to move away from the current neutral recommendation. The problem for the BoC is that its policy rate of 1.75% remains well below its own estimated neutral range, which is now 2.25%-3.25% (Chart 6). A similar message comes when looking at the neutral real rate (“r-star”) estimate for Canada produced by the New York Fed, with an r-star of 1.5% versus a current real policy rate around 0%.2 This suggests that Canadian monetary policy remains accommodative and that the BoC should be looking for opportunities to continue moving interest rates toward “neutral” when the economy is accelerating. Yet our own BoC Monitor suggests that an unchanged policy stance is currently appropriate, while -11bps of rate cuts are now discounted in the Canadian Overnight Index Swap (OIS) curve. In other words, the BoC is torn between a fundamental interest rate framework that says the hiking cycle is not done yet, and a sluggish economy that demands a dovish bias. The BoC is torn between a fundamental interest rate framework that says the hiking cycle is not done yet, and a sluggish economy that demands a dovish bias. In the press conference following the April 24 BoC policy meeting, BoC Governor Steve Poloz noted that any reference to the need for interest rates to return to the BoC’s neutral range was deliberately omitted from the official policy statement. This is a clear signal that the central bank has shifted its focus from “normalizing” rates to preventing a deeper downturn in Canadian growth. The latest BoS showed that business confidence, expected sales and future investment intentions all fell sharply in the first quarter of 2019 (Chart 7). There was a huge drop in the number of firms reporting capacity pressures and labor shortages, with more firms now expecting their prices to fall than rise over the next year. The main headwinds to the diminished outlook for future sales were related to “a more uncertain outlook in the Western Canadian energy sector, continued weakness in housing-related activity in some regions, and tangible impacts from global trade tensions”.3 Chart 6A Long Way From BoC ##br##Rate Cuts
A Long Way From BoC Rate Cuts
A Long Way From BoC Rate Cuts
Chart 7Negative Messages From The BoC Business Outlook Survey
Negative Messages From The BoC Business Outlook Survey
Negative Messages From The BoC Business Outlook Survey
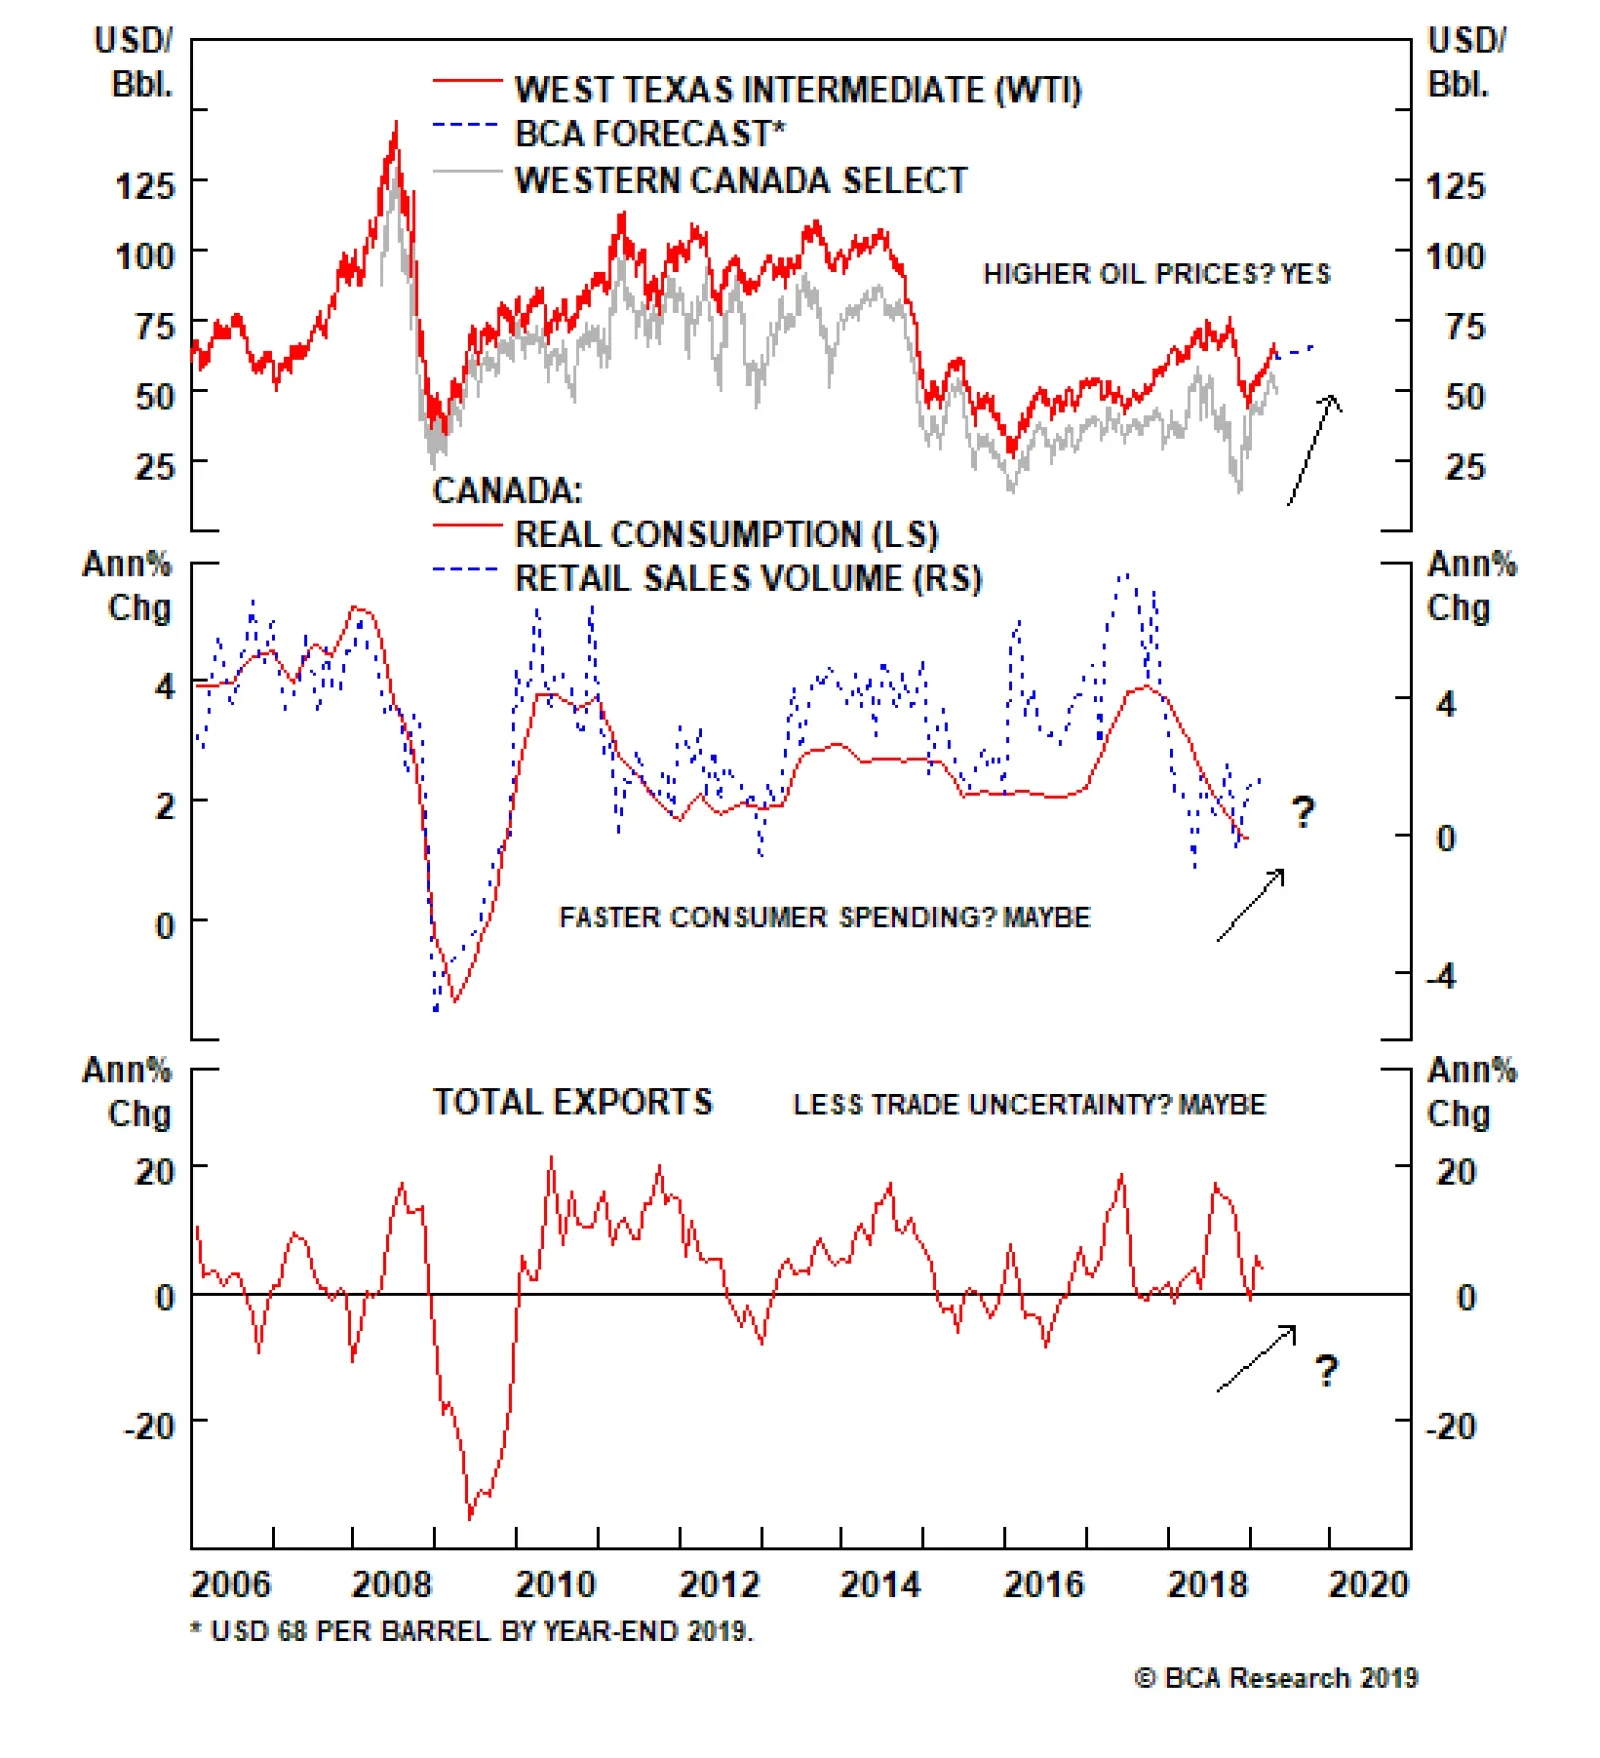
The BoC places a lot of weight on the BoS in determining its economic forecasts, and in setting monetary policy. Thus, it is no surprise that in the official statement following the April 24 monetary policy meeting, the BoC Governing Council noted that they were “monitoring developments in household spending, oil markets and global trade policy to gauge the extent to which the factors weighing on growth and the inflation outlook were dissipating”.4 Those were the same three concerns of businesses highlighted in the BoS, assuming that “weakness in the Canadian housing market” is related to “developments in household spending” – a logical link given the high level of Canadian household and mortgage debt. Looking at those three factors, there is nothing suggesting that the BoC needs to adjust policy anytime soon (Chart 8). Oil prices are rising, but household spending remains weak and global trade uncertainties have not completely diminished and Canadian export growth has stagnated. Given the mixed picture from the economic data, the BoC will likely remain on hold until there is a clear signal from the data. From a bond investment strategy perspective, staying at neutral also makes sense. A move to overweight Canadian bonds would require an even deeper economic downturn into recessionary territory that would push Canadian unemployment higher (Chart 9). Downgrading back to underweight, however, would require signs of a sustainable rebound in Canadian domestic demand and stronger global growth that would boost Canadian exports – an outcome that would not be visible in the data until at least the third quarter of 2019. Chart 8Watch What The BoC ##br##Is Watching
Watch What The BoC Is Watching
Watch What The BoC Is Watching
Chart 9A Neutral Weight On Canada Is Still Justified
A Neutral Weight On Canada Is Still Justified
A Neutral Weight On Canada Is Still Justified
One final point on staying neutral on Canada comes from looking at cross-country spread levels between government bonds in Canada and other major developed economies. The spread levels look historically wide versus sovereign debt from Germany, the U.K., and Australia; wide versus recent history in Japan; but very narrow versus the U.S. (Chart 9). Those spreads are shown without hedging out the currency risk of going long Canadian bonds – and, by association, the Canadian dollar. Once the currency risk is hedged out of those cross-country spreads using 3-month currency forwards, the spread differentials are all far less interesting both in absolute terms and relative to history (Chart 10 & 11). Chart 10Big Differences In Canadian Bond Spreads Vs Other Major DM...
Big Differences In Canadian Bond Spreads Vs Other Major DM...
Big Differences In Canadian Bond Spreads Vs Other Major DM...
Chart 11… But Those Spreads Disappear Once The C$ Exposure Is Hedged
...But Those Spreads Disappear Once The C$ Exposure Is Hedged
...But Those Spreads Disappear Once The C$ Exposure Is Hedged
So even on an individual country basis, there is no compelling case to be anything but neutral Canadian government bonds versus global currency-hedged benchmarks – which is how we present all our fixed income recommendations in Global Fixed Income Strategy. Bottom Line: The Bank of Canada’s latest reports and commentary indicate that monetary policy will stay on hold over at least the balance of 2019. Bond markets are already priced for that outcome. Maintain a neutral stance on Canadian government bonds in global hedged fixed income portfolios. Sweden Trade Update – Time To Retreat & Regroup Exactly one year ago (May 8, 2018), we initiated trades in our Tactical Overlay portfolio to position for tighter monetary policy, and higher bond yields, in Sweden.5 Specifically, we have been recommending shorting 2-year Swedish government bonds versus German equivalents (hedging the currency exposure back into krona), while also selling 2-year Swedish bonds and buying 10-year Swedish debt in a yield curve flattening trade. The positions were chosen to benefit from an expected bearish repricing of the short-end of the Swedish curve. At this time last year, the positive upward momentum of Swedish growth and inflation had reached a point where the Riksbank was clearly – and credibly – signaling that the long process of normalizing its highly accommodative crisis-era monetary policies would begin. That meant lifting policy rates away from negative territory, as well as shutting down the bond-buying quantitative easing (QE) program. One year later, the economic backdrop has done a 180-degree turn against our original thesis (Chart 12): Swedish growth has slowed, with both the manufacturing PMI and leading economic indicator at the lowest levels since 2013. Unemployment has increased and nominal wage growth has rolled over. Headline CPIF inflation has fallen back below the Riksbank 2% target, while core CPIF inflation remains stuck near 1.5%. The Riksbank changed its forward guidance at last month’s monetary policy meeting, signaling that the benchmark interest rate will remain at -0.25% for “somewhat longer” than was indicated as recently as February (when a rate hike around the end of 2019 or in early 2020 was signaled). The Riksbank also pledged to maintain the size of its QE bond purchases from July 2019 to December 2020, a dovish surprise. Swedish money markets are still discounting 13bps of rate hikes over the next twelve months. Yet our Riksbank Monitor, on the other hand, is now indicating a need for rate cuts, driven by both softer inflation and weaker growth. The minutes from last month’s policy meeting revealed that the forward guidance was adjusted simply because headline inflation had temporarily dipped back below the 2% Riksbank target. The implication is that a return to 2% inflation would prompt the Riksbank to hike. Swedish money markets are still discounting 13bps of rate hikes over the next twelve months. Yet our Riksbank Monitor, on the other hand, is now indicating a need for rate cuts, driven by both softer inflation and weaker growth. A useful rule for investment risk management is: when the underlying rationale for a position is clearly not unfolding as expected, the best thing to do is simply close that position and look for new opportunities better aligned to the current reality. Chart 12No More Pressure On Riksbank ##br##To Hike
No More Pressure On Riksbank To Hike
No More Pressure On Riksbank To Hike
Chart 13Time To Exit Our Recommended "Hawkish" Trades In Sweden
Time To Exit Our Recommended "Hawkish" Trades In Sweden
Time To Exit Our Recommended "Hawkish" Trades In Sweden
With that in mind, we are choosing to close our tactical trades in Sweden (Chart 13). The 2-year Sweden-Germany spread trade generated a loss of -52bps (including the return from hedging the euro exposure in Germany back into Swedish krona). We were more fortunate with the curve flattening trade, which generated a return of +61bps as the Swedish curve bullishly flattened through falling 10-year yields rather than bearishly flattening through rising 2-year yields (our original expectation). Thus, we are closing out our Sweden trades at a small net gain of +9bps. We will do a deeper analysis on Sweden in an upcoming Global Fixed Income Strategy report to search for new potential trade ideas. Bottom Line: The Riksbank’s recent dovish turn, calling for a flatter trajectory for interest rates and extending asset purchases, will keep Swedish bond yields lower for longer. Thus, we are closing our recommended tactical trades in Sweden that were positioned for a faster path of rate hikes. Robert Robis, CFA, Chief Fixed Income Strategist rrobis@bcaresearch.com Ray Park, CFA, Research Analyst ray@bcaresearch.com Footnotes 1 Please see BCA Global Fixed Income Strategy Weekly Report, “March Calmness”, dated March 19, 2019, available at gfis.bcaresearch.com. 2 The NY Fed’s estimates for non-U.S. r-star rates for the euro area, Canada, and the U.K. can be found on the NY Fed website. https://www.newyorkfed.org/research/policy/rstar 3https://www.bankofcanada.ca/2019/04/business-outlook-survey-spring-2019/ 4https://www.bankofcanada.ca/2019/04/fad-press-release-2019-04-24/ 5 Please see BCA Global Fixed Income Strategy Special Report, “Sweden: The Riksbank Cannot Kick The Can Down The Road Anymore”, dated May 8, 2018, available at gfis.bcaresearch.com. Recommendations
Reconcilable Differences
Reconcilable Differences
Duration Regional Allocation Spread Product Tactical Trades Yields & Returns Global Bond Yields Historical Returns