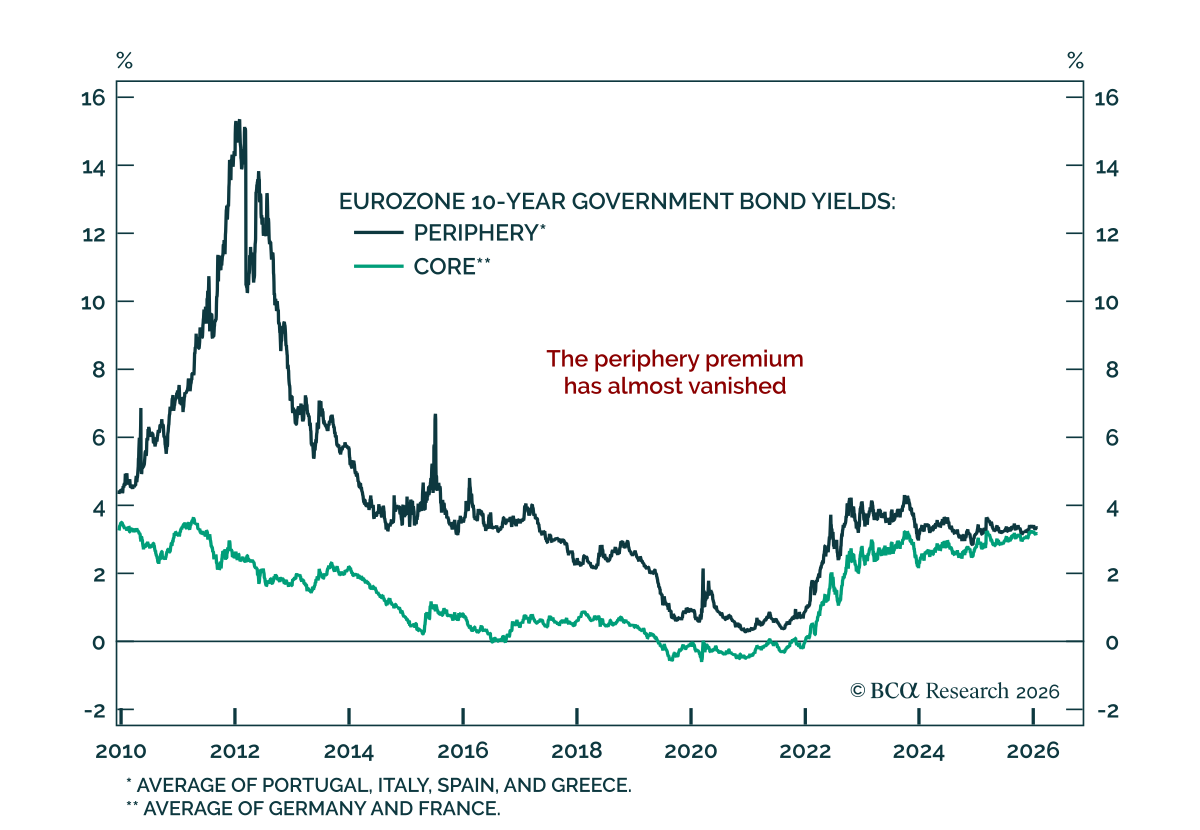
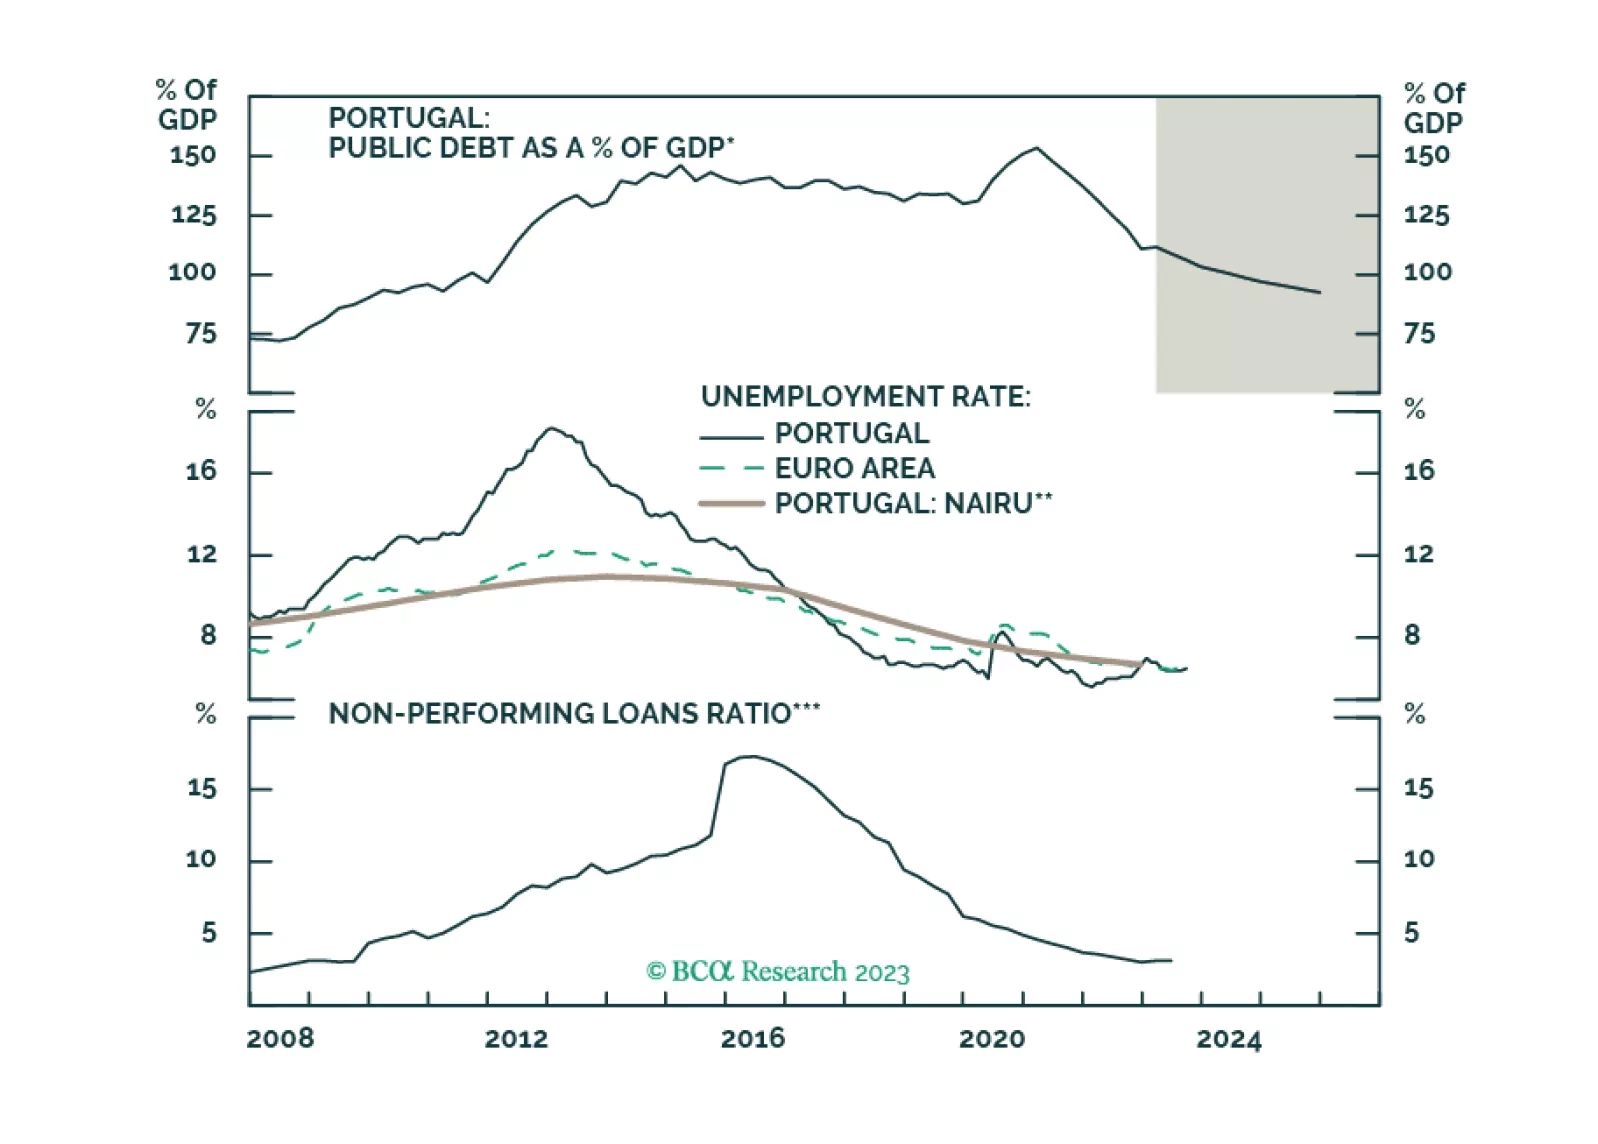
Highlights Duration: The opposing forces currently pulling on global bonds - softer growth and core inflation readings vs. tightening labor markets - are keeping yields locked into narrow trading ranges. We expect the strength of the global upturn to reassert itself, leading to higher government bond yields and corporate credit outperformance over the balance of 2017. U.K./Canada/Australia: Economic data, as well as our bond market indicators, are giving conflicting signals for the outlook for yields in the U.K., Canada & Australia. Our analysis of the relative growth and inflation dynamics in the three countries leads us to recommend a 2-year/30-year yield curve box trade, positioning for a relatively flatter curve in Canada and a relatively steeper curve in the U.K. Portugal Trade Update: Improving growth indicators, and declining measures of banking sector risk, in Portugal have resulted in a sharp narrowing of government spreads versus Germany. We are exiting our short 10-year Portugal/long 10-year Germany Tactical Overlay trade this week, at a loss of -1.6%. Feature Chart of the WeekMarket Volatility Is Low For A Good Reason What was once a fairly straightforward narrative for global bond markets earlier this year is now being challenged. Growth data has cooled a bit in the U.S. and China, while commodity prices have fallen, suggesting that the global economy may be losing steam even with leading indicators still rising and the European economy looking robust. At the same time, core inflation measures have ticked lower despite the signs of tighter labor markets throughout the developed world. These moves on the margin have stalled the upturn in global bond yields, resulting in lower fixed income market volatility that is likely playing a role in keeping realized equity market volatility at depressed levels (Chart of the Week). We continue to see the recent pullback in U.S. data as being temporary in nature. The economy should improve in the coming months given the still-solid trends in U.S. corporate profits and household income and the still-low level of interest rates. The signs of a building China slowdown are potentially more worrisome, especially on the inflation front given how much Chinese demand has boosted commodities and overall traded goods prices over the past year. Although we are not expecting a major Chinese downturn that could spill over more broadly to the world economy, it is likely that the next leg up in inflation in the developed economies will come from diminished spare capacity and rising core inflation, rather than a commodity-driven reacceleration of headline inflation. We continue to recommend a strategic underweight overall portfolio duration stance, as we expect the Fed to deliver on its planned rate hikes before year-end and the European Central Bank (ECB) to soon begin signaling a tapering of its asset purchases next year. We continue to favor corporate credit over sovereign debt, particularly in the U.S., given the strength of the current global upturn, but staying up in credit quality (i.e. focusing on Investment Grade and higher-rated credit tiers in High-Yield). Stuck On Neutral: Considering Trades Between Canada, Australia & The U.K. Over the past few months, we have upgraded our stance on government bond exposure in the U.K., Canada and Australia - all to neutral and all for essentially the same reason. There was not a compelling enough case to expect any of the central banks in those countries to move interest rates before year-end, in either direction, given the lack of sustainable inflation pressures and mixed messages on growth. With policymakers stuck on hold for the foreseeable future, keeping our recommended bond weightings at benchmark was the logical (albeit unexciting) choice. Even the mixed messages sent by our own bond indicators highlight the difficulty in making a decisive market call at the moment. Our Central Bank Monitors for Canada and Australia have recently flipped into the "tighter policy required" zone, joining the U.K. Monitor which has been there for some time (Chart 2).1 This would suggest moving to an underweight stance in anticipation of tighter monetary policy in those countries that is currently not priced into money market curves (bottom panel). Yet the best performing bond market of the three over the past two years has been the U.K. - a trend that started before last year's Brexit vote when the U.K. economy was in relatively good shape and the Bank of England (BoE) was starting to send hawkish messages. Gilts now look the most overvalued judging by the current negative real yields on offer (Chart 3), yet our U.K. Central Bank Monitor is showing signs of topping out, further adding to the confusion. Chart 2Markets Don't Expect Anything From BoE/BoC/RBA Chart 3Gilts Look Most Expensive Having mixed directional signals, however, does not imply that there are not trade opportunities within these markets. Even if the BoE, the Bank of Canada (BoC) and the Reserve Bank of Australia (RBA) are not in a hurry to begin hiking interest rates, domestic growth and inflation pressures are building at a different pace within these economies, creating potential cross-market trade opportunities. Economic Growth: Canada has the strongest leading economic indicator, manufacturing PMI and consumer sentiment, but the softest business confidence (Chart 4) - perhaps because of concerns over the future protectionist trade policies of U.S. President Donald Trump. In the U.K., a combination of falling real wage growth and persistently high levels of political uncertainty after Brexit are weighing on consumer sentiment, yet business confidence is the strongest of the three countries. Meanwhile, overall confidence in Australia is the weakest, even with manufacturing in a strong upturn. Most worryingly, real consumer spending is slowing rapidly in all three countries, although it is holding up relatively better in Canada. Inflation: The differences in price pressures are less pronounced (Chart 5). Inflation rates are similar among the three economies as Australian core CPI inflation appears to have finally bottomed out in the first quarter of this year after falling steadily since 2014. All three countries are witnessing decelerating wage growth, however, even with solid job growth in Canada over the past year. Spare capacity measures like the output gap and unemployment gap show the U.K. economy being closest to full employment (Chart 6). Spare capacity is steadily being absorbed in Canada, although the BoC attributes this to a slower pace of potential GDP growth, according to last month's BoC Monetary Policy Report (MPR).2 Chart 4Canadian Economic Data Looks Strongest Chart 5No Major Inflation Differences Home Prices & Debt: The housing markets remain an issue in Canada and Australia, where home prices look severely overvalued with household debt at elevated levels (Chart 7). The governments in both countries are trying to use regulatory and macro-prudential solutions to cool red-hot housing demand, but rapid growth in housing wealth remains a source of stimulus for consumers at the moment. The situation is different in the U.K., where home valuations and debt levels are nowhere near as elevated as in the other two countries (although London homeowners may disagree). Chart 6No Spare Capacity In The U.K. Chart 7Household Debt A Concern In Canada & Australia Exports: Each country is also exposed to a different major economy via the export channel. The OECD leading economic indicators for the U.S., Euro Area and China (the largest export markets for Canada, the U.K. and Australia, respectively) are all ticking higher, suggesting that export demand should pick up for Canada, the U.K. and Australia in the near term (Chart 8). However, Australian exports to China have already expanded at a 60% annual rate and our Emerging Market and China strategists are expecting some cooling of Chinese growth in the latter half of this year; slower export growth should be expected. Chart 8An Unsustainable Surge In Aussie##BR##Export Demand From China After adding up all the pieces, it is still difficult to select one government bond market over the others in absolute terms. The U.K. would appear to have the least bond-friendly backdrop, with higher inflation and very low real interest rates. Yet the BoE is worried about many factors - Brexit uncertainties on trade and business confidence, declining real household income growth - that should prevent them from shifting to a less accommodative monetary stance before year-end that would involve reduced Gilt purchases and/or outright interest rate hikes. Conversely, Australia seems to have the most bond-bullish climate - a still-negative output gap, plunging consumer confidence, very low inflation and the heaviest exposure to a Chinese economy that is set to cool off. Yet while core inflation remains low at 1.5%, it appears to be bottoming out and the RBA is currently forecasting that its preferred measure of underlying inflation will move up to 2% - the low end of its 2-3% target range - by early 2018, according to their just-released Statement on Monetary Policy.3 In Canada, the BoC continues to take a very cautious view on Canadian growth, despite the robust 4% real GDP growth seen in the first quarter of this year. Sluggish growth in exports and capital spending is expected to be a drag on growth this year, according to the April BoC MPR. Yet the central bank is now "decidedly neutral" and is no longer considering a rate cut as it was earlier this year according to BoC Governor (and BCA alumnus) Stephen Poloz.4 Given all the various factors pushing and pulling on these three economies and central banks, it is perhaps no surprise that yield moves have been highly correlated across these bond markets over the past several months (Chart 9). The most attractive near-term risk/reward opportunities now appear to be in relative yield curve trades rather than directional allocations or cross-country spread trades. Specifically, we see an opportunity to play for a steeper Gilt curve, and a relatively flatter Canadian government bond curve, via a 2-year/30-year box trade. Given the strong readings on current and leading economic indicators in Canada, combined with our view that the recent patch of slower U.S. growth will prove to be temporary, we see the greatest potential for upside growth surprises in Canada. The BoC is likely to wait before delivering rate hikes until there is decisive evidence of accelerating inflation, especially given the potential economic risks deriving from the Canadian housing bubble. However, better-than-expected growth will exert more flattening pressure on the Canadian yield curve than the U.K. or Australian curves, where downside growth risks are greater. Already, the very front end of the Canadian curve is starting to disengage from the U.K. and Australian curves, with the 2-year/5-year flattening modestly in Canada and the other markets showing steepening curves at similar maturities (Chart 10, top panel). We expect that relative flattening pressure to exert itself further out the yield curve for Canadian government debt over the latter half of 2017. Chart 9Yields Are Highly Correlated... Chart 10...Curve Slopes, Slightly Less Correlated In the U.K., the long end of the Gilt curve has rallied to very rich levels, with the 10-year/30-year slope now trading near the bottom of the range that has prevailed since 2014 (bottom panel). Much of that has been driven by a decline in longer-term inflation expectations that has accompanied the more stable British Pound. While the uncertainty surrounding the upcoming Brexit negotiations with the European Union will likely weigh on business confidence and investment spending in the U.K., the immediate impact of the robust Euro Area economy on U.K. exports should provide a boost to U.K. economic growth. Coming at a time when the U.K. is at, or even beyond, full employment, this should put some mild upward pressure on inflation expectations further out the curve, leading to steepening pressures on a relative basis to Canada. This can already be seen in looking at the 2-year/30-year yield curve box between the Canada and the U.K. in Chart 11. In all three panels, we show the steepness of the Canadian bond curve minus that of the Gilt curve, alongside the differentials in actual inflation, and market-based inflation expectations from the index-linked markets, between Canada and the U.K. As can be seen in the top two panels, the Canadian curve looks too steep relative to the U.K. curve given the higher rates of headline and core inflation in the U.K. The bottom panel shows that the 2-year/30-year box is in line with the relative inflation expectations within the two countries. We see this as a sign that U.K. inflation expectations are too low relative to actual U.K. inflation, leaving the Gilt curve too flat relative to the Canadian curve. While this would appear to argue for a relative trade between inflation-linked bonds in Canada and the U.K., the poor liquidity of the small Canadian linker market makes this a difficult trade for most investors to put on. We prefer to express the view via yield curves, particularly with the 2-year/30-year Canada-U.K. box currently priced in the bond forwards to move sideways over the rest of the year (Chart 12). This means that betting on a steeper Gilt curve relative to Canada does not incur negative carry - important for a trade with a more medium-term horizon like this. Chart 11Gilt 2/30 Curve Too Flat Relative To Canada Chart 12Enter A 2/30 Canada-U.K. Box Trade This week, we are adding this 2-year/30-year Canada-U.K. position to our strategic model portfolio at -7bps. The initial target is for the box to return to -50bps - the bottom of the range that has prevailed since 2015. A deeper decline would occur if the BoC begins to signal a rate hike in Canada at some point that puts even more flattening pressure on the Canadian curve, although that is not our base case expectation over the rest of 2017. The risk to the trade would come from a deceleration of U.K. inflation that eliminates the current divergence between realized and expected inflation. What about Australia? We anticipate that there will be an opportunity to move to an eventual overweight position in Australian bonds in the coming months to position for the slowing of Chinese growth, and the related demand for Australian exports, that we expect. We are choosing to stay neutral for now, however, given the current uptick in Australian inflation that muddies the water on any call on RBA monetary policy. Bottom Line: Economic data, as well as our bond market indicators, are giving conflicting signals for the outlook for yields in the U.K., Canada & Australia. Our analysis of the relative growth and inflation dynamics in the three countries leads us to recommend a 2-year/30-year yield curve box trade, positioning for a flatter curve in Canada and a steeper curve in the U.K. Tactical Overlay Housekeeping: Cutting Losses On Portugal Shorts One of our long-held positions in our Tactical Overlay trade portfolio has been a short position in Portugal 10-year government bonds versus a long position in 10-year German Bunds. We put the trade on last summer as part of a broader allocation at the time out of Peripheral European sovereign debt into core European debt. The logic was straightforward - the combined stress of decelerating economic growth and struggling banking systems in the Periphery (made worse by the ECB's negative interest rate policies) would result in some spread widening in Italy, Spain and Portugal. While that story remains true in Italy, both leading economic indicators and measures of financial sector risk like credit default swap (CDS) spreads for senior banks have a decline in Spain and Portugal. While we have already upgraded our recommended allocation to Spanish debt in our model portfolio, we had been reluctant to consider a similar move in Portugal given our concerns about its economy and, more importantly, its banking system. But with leading economic indicators starting to perk up and bank CDS spreads in Portugal falling sharply, and with German Bund yields rising alongside growing market nervousness of a potential ECB taper, Portugal-Germany spreads have tightened sharply. We are belatedly cutting our losses on this position this week and closing out the position at a loss of -1.6%. We plan on publishing a deeper dive on Portugal in the coming weeks to update our views on the country and its bond markets. Bottom Line: Improving growth indicators, and declining measures of banking sector risk, in Portugal have resulted in a sharp narrowing of government spreads versus Germany. We are exiting our short 10-year Portugal/long 10-year Germany Tactical Overlay trade this week, at a loss of -1.6%. Robert Robis, Senior Vice President Global Fixed Income Strategy rrobis@bcaresearch.com Ray Park, Research Analyst ray@bcaresearch.com 1 Please see BCA Global Fixed Income Strategy Special Report, "BCA Central Bank Monitor Chartbook", dated March 28 2017, available at gfis.bcaresearch.com. 2 http://www.bankofcanada.ca/wp-content/uploads/2017/04/mpr-2017-04-12.pdf 3 http://www.rba.gov.au/publications/smp/2017/may/pdf/statement-on-monetary-policy-2017-05.pdf 4 https://www.bloomberg.com/news/articles/2017-04-12/poloz-sees-faster-canada-return-to-full-capacity-key-takeaways The GFIS Recommended Portfolio Vs. The Custom Benchmark Index Recommendations Duration Regional Allocation Spread Product Tactical Trades Yields & Returns Global Bond Yields Historical Returns