Productivity
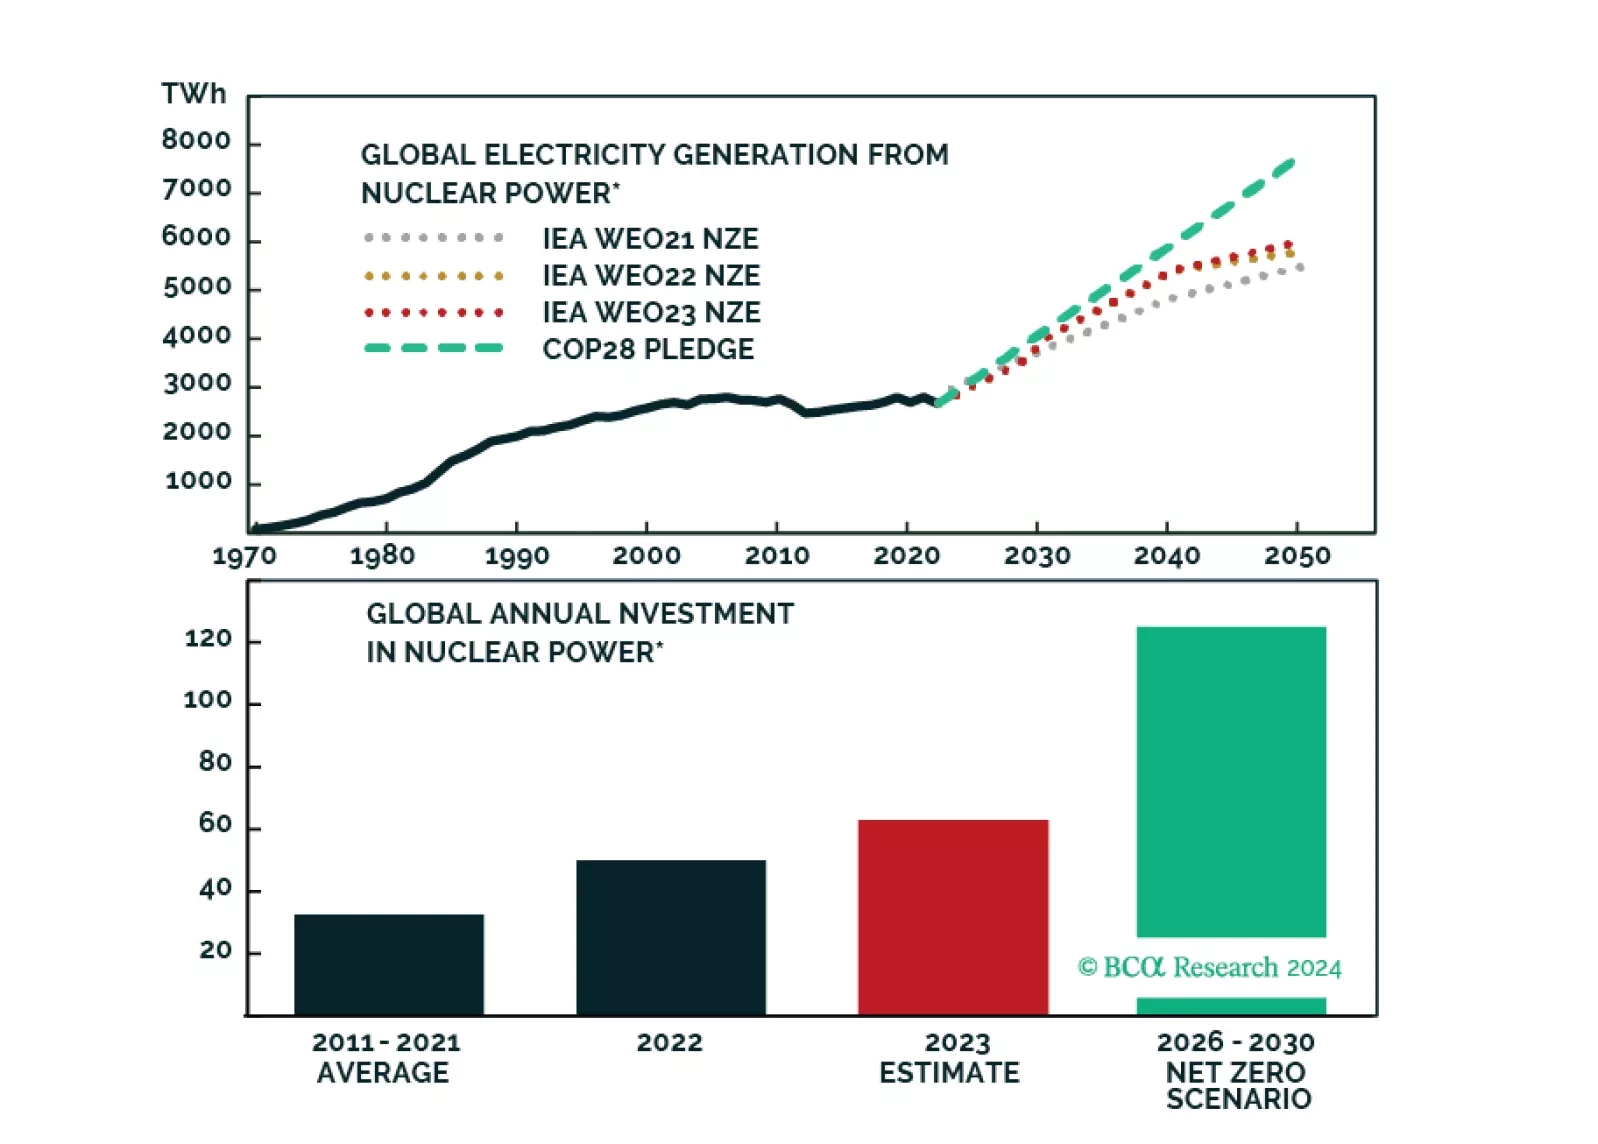
BCA Research presents a limited monthly special series about the Nuclear Renaissance.
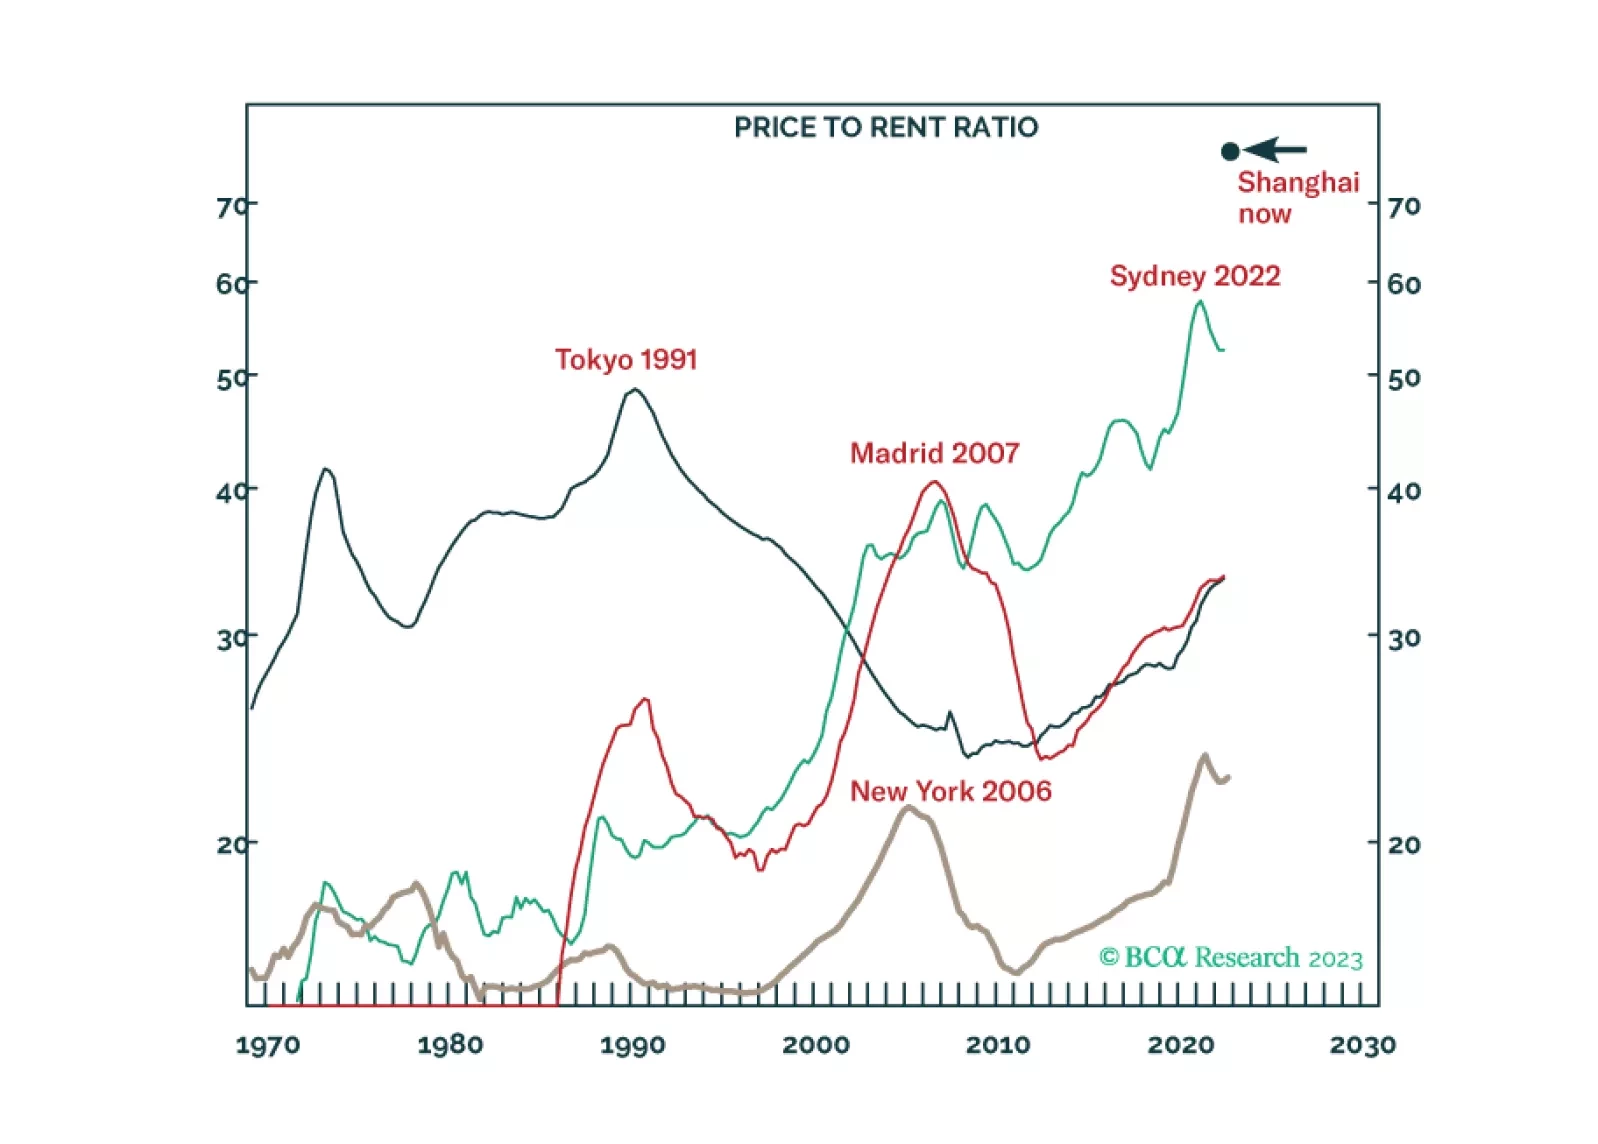
Our 2024 outlook can be encapsulated into just 39 words and three key views. Key view 1: The end of China’s housing boom means the end of the world’s main growth engine. Key view 2: If the Fed and ECB don’t kill the economy, they won’t kill inflation. Key view 3: The AI gold rush will struggle to find any gold. We go through the investment implications for the year ahead.
Today, we are sending you the BCA annual outlook for 2024. The report is an edited transcript of our recent conversation with Mr. X and his daughter, Ms. X, who are long-time BCA clients with whom we discuss the economic and financial market outlook for the next twelve months toward the end of each year.
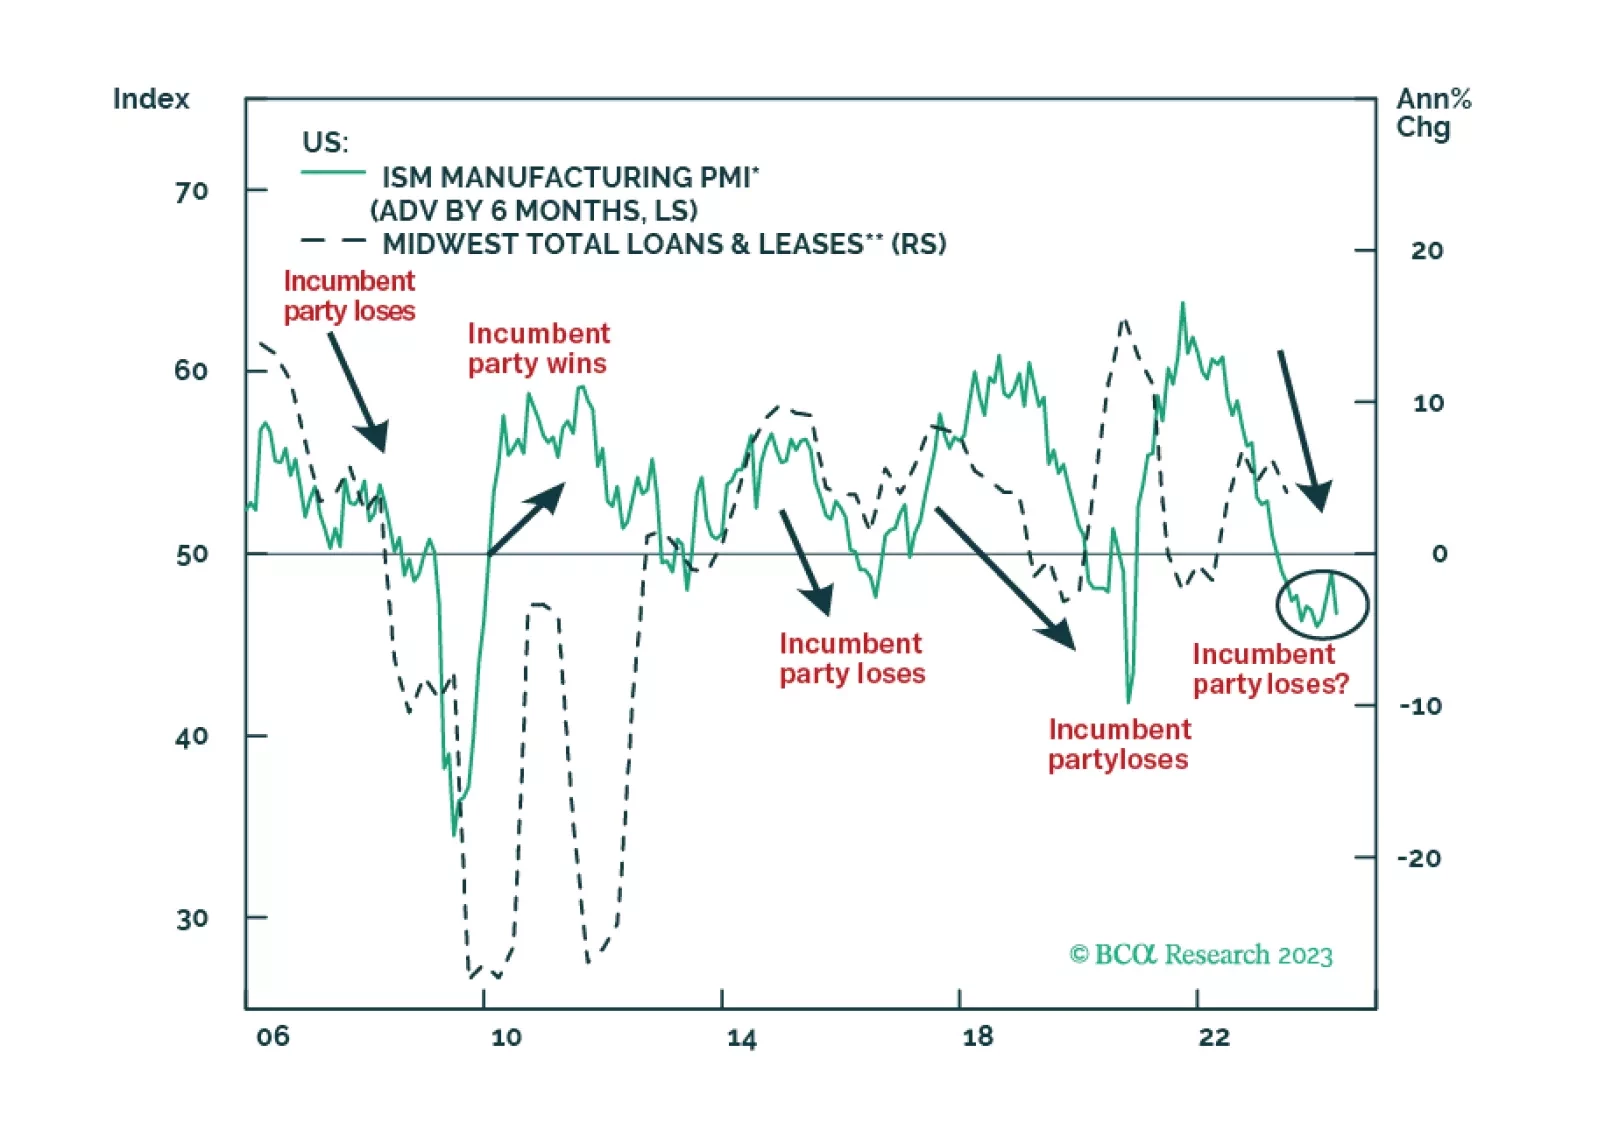
President Biden is facing foreign challenges on three fronts and these challenges are coalescing around the critical states of the Midwest. Take risks off the table and stay defensive in 2024.

In part 2 of this series, we discuss mainstream EM equity valuations and present the results of our cross-country analysis. The goal is to identify overweights and underweights within an EM equity portfolio.
The stratospheric valuation of this year’s AI mania is likely to deflate, just as it did after the Web 1.0 mania of the late 90s. We go through some long-term and short-term investment implications.
The conventional economic thinking about the likely impact of AI is misguided because it extrapolates linearly from what AI can do today to what it can do tomorrow. Just as the investment community and the broader public were blindsided by the exponential rise in Covid cases during the early days of the pandemic, they will be blindsided by how quickly AI transforms society and the economy.
Innovative Tech will face macroeconomic headwinds in a new “higher for longer” interest regime. Yet, the long-term opportunity of the cohort is tremendous. Investors need to be judicious with the timing of adding new capital to these themes to bolster long-term returns.
China’s labor market is polarized between high unemployment among university graduates and an acute shortage of blue-collar labor. The high jobless rate among young workers is structural and will not decline a lot even during an economic recovery. Given the structural scarcities of blue-collar workers, the authorities will be less inclined to resort to their old playbook of stimulating infrastructure, construction, and manufacturing.
This week’s Special Report goes over the structural problems facing the UK economy and our outlook for UK gilts and the sterling following turbulent moves in 2022.