Railroads
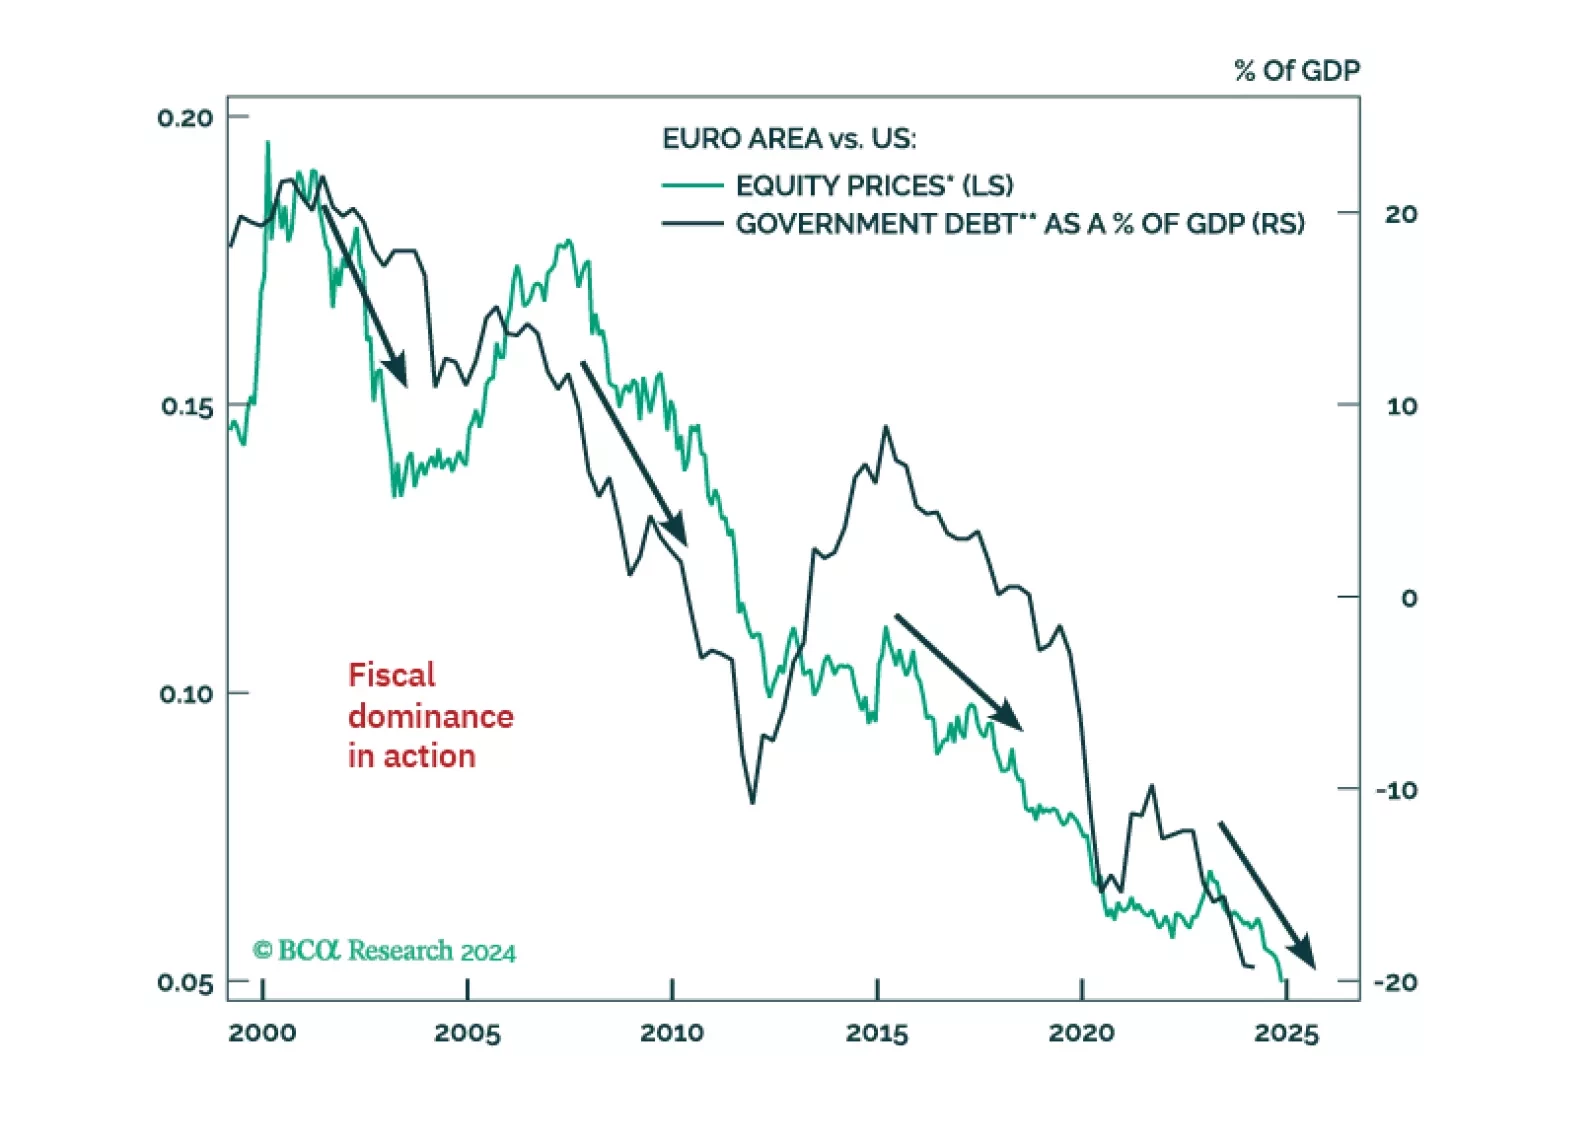
Investors have given up on European assets, which now suffer exceptional discounts to US ones. However, tighter US fiscal policy, the end of Europe’s austerity and deleveraging, the LNG Tsunami about to hit European shores, and the global capex fueled by the Impossible Geopolitical Trinity mean that Europe’s time to shine will soon come back.
Investors have given up on European assets, which now suffer exceptional discounts to US ones. However, tighter US fiscal policy, the end of Europe’s austerity and deleveraging, the LNG Tsunami about to hit European shores, and the global capex fueled by the Impossible Geopolitical Trinity mean that Europe’s time to shine will soon come back.

The 10-year Treasury yield rose in the aftermath of the Fed’s jumbo rate cut on Wednesday. Our US Bond strategists noted that this move reflects the fact that the downward revisions to the dots still fall short of the magnitude of cuts embedded in the…

Overweight We are currently overweight the S&P railroads index in anticipation of financial sector liquidity morphing into real economic growth and thus propelling domestic oriented railroad stocks. There is also another way easy monetary policy is boosting this transportation sub-industry's already high monopolistic stature: by providing cheap capital incentivizing mergers as is evident in the recent bidding war for KSU that pushed the stock higher by 35% in a month. Switching to macro data, and the message is equally upbeat. Both our macro earnings model and margin proxy – constructed using industry-level data – are sending a bullish message and corroborate that investors should remain overweight rails (see chart). Bottom Line: We reiterate our March 15 boost to overweight in the S&P railroads index. The ticker symbols for the stocks in this index are: BLBG: S5RAIL – CSX, KSU, NSC, UNP.
Overweight The inevitable economic reopening due to the population’s inoculation along with President Biden's freshly signed fiscal spending bill will pump fresh blood into the US economy that railroads – which are the arteries of the economy – will be in charge of distributing. Already, the business sales-to-inventories ratio is picking up steam and demand for all the key rail freight categories is slated to remain robust for the rest of the year (middle panel). Tack on the broader positive macro dynamics that our earnings model does an excellent job at sniffing out, and the odds of a durable outperformance period in rails inch higher (bottom panel). Bottom Line: Boost the S&P rails index to overweight. For additional details please refer to this week’s Strategy Report. The ticker symbols for the stocks in this index are: BLBG: S5RAIL – CSX, KSU, NSC, UNP.
Highlights Portfolio Strategy Firming leading rail freight indicators signal that intermodal, coal and commodity (ex-coal) carloads are in high demand. Tack on the global economic reopening in the back half of the year and rising commodity prices, and factors are falling into place for a durable outperformance phase in rails. Boost exposure in the S&P rails index to overweight. Recovering lodging demand coupled with restrained industry capacity should restore hoteliers’ pricing power and boost profitability. The S&P hotels, resorts and cruises index remains a high-conviction overweight. Recent Changes Boost the S&P railroads index to overweight, today. On March 9, our 5% rolling stop on the S&P autos & components index was triggered and we lifted exposure to neutral that netted our portfolio 29% in relative gains since the January 25, 2021 inception. This move also augmented the S&P consumer discretionary sector back to a benchmark allocation resulting in a 7.5% gain. Table 1 Feature While President Biden signed a new $1.9tn fiscal package into law last week, valid concerns surrounding the path of the 10-year US Treasury yield added choppiness to the stock market’s consolidation phase (Chart 1). Junk bond spreads stayed calm despite the ongoing Treasury bond market selloff and related MOVE index (bond market volatility) jump and remain a key indicator to monitor in order to gauge if a garden variety equity market pullback can morph into something more significant. Recent empirical evidence suggests that the deviation between the MOVE index and junk spreads will likely return to equilibrium via a settling down of the former, as occurred in the May 2013 taper tantrum episode (Chart 2). Chart 1Choppiness Galore Chart 2A Taper Tantrum Repeat? Importantly, delving deeper in the relationship between bonds and stocks and putting it in historical context is instructive. Our sister Emerging Markets Strategy service recently posited that in the coming years the current negative correlation between stock and bond prices will revert to positive as it prevailed prior to the Asian Crisis (Chart 3). The post-1997 era is largely characterized as disinflationary, while the period from the 1960s to the mid-1990s as primarily inflationary. As a reminder core PCE price inflation was last above the Fed’s 2.5% target in the early 1990s (please see grey zone, top panel, Chart 3). Chart 3From Inflation To Disinflation And Back To Inflation? Importantly, what will cement the correlation between stock prices and bond prices becoming definitively positive anew will be a shift upward of core PCE price inflation. Chart 4 shows that core PCE inflation leads the stock-to-bond correlation by 45 months and can serve as a confirming signpost that bonds will no longer offer downward protection to stocks and likely render risk parity useless. Chart 4Joined At The Hip, Albeit With A Lag If this paradigm shift is indeed taking root, this raises two questions: First, how will the broad equity market perform during a more persistent bond market selloff phase? Second, what equity sectors will likely outperform under such a scenario and which ones should equity investors avoid/underweight in their portfolios? Our analysis centered on historically significant bond market selloffs, which we clearly depict in the shaded areas in Chart 5. Chart 5Don’t Fear The Bond Bear Table 2 shows the results of our analysis broken down in two separate eras. Between the 1960s and the early-1990s, “the inflation era”, we use monthly data, whereas from the early-1990s onward, “the disinflation era”, we use high quality daily data. In the seven inflationary iterations the SPX median fall was 3%,1 whereas in the nine disinflationary episodes the SPX median rise was 18%.2 Impressively, since the LTCM debacle every single bond market selloff has been cheered by the stock market (Table 2). Table 2SPX Returns During Bond Bear Markets Table 3 delves deeper into GICS1 sectors and compares relative returns to the SPX during sizable bond market selloffs. Table 3US Equity Sector Returns During Bond Bear Markets During “the inflationary era” deep cyclicals outperformed the broad market, whereas early cyclicals trailed the SPX. The defensives’ performance is split down the middle with telecom and utilities faring poorly, while health care and staples outshining the SPX. One surprising result is that during “the inflationary era” relative tech performance was very resilient compared with what one would expect. There is an accentuation of relative returns in “the disinflationary era”, with all the defensives significantly underperforming and the deep cyclicals broadly outshining the SPX. Early cyclicals make a U-turn and are clear outperformers. One surprising result is the energy sector’s negative median return. Finally, the real estate sector’s significant underperformance really stands out in “the disinflationary era”. Netting it all out, the broad equity market has historically risen consistently in tandem with a bond market sell off primarily in “the disinflationary era”. Impressively, the SPX has been resilient on average even in “the inflationary era”; granted there have also been some notable drawdowns (Table 2). The implication is that at the current juncture the SPX may have some trouble digesting the bond market’s rapid selloff, but will recover smartly especially as the bond market selloff eventually proves more reflective of growth rather than restrictive. (For inclusion purposes, the appendix on page 16 shows the GICS1 sector performance since the 1960s with shaded areas depicting periods of significant bond market selloffs, and similar to Chart 3 the appendix on page 19 plots the relative share price monthly returns correlation to bond price monthly returns.) This week, we update our high-conviction overweight view on an early-cyclical sub-group with a reopening tailwind, and lift a deep cyclical transportation index to an above benchmark allocation. Hop Back On The Rails The Dow Theory is in full force and serves as a confirmation of the breakout in the Dow Industrials recently, as transports have been firing on all cylinders of late, and is also a harbinger of new all-time relative share price highs in railroads (Chart 6). Today we recommend investors get back on board the rails, a key transportation sub group, and lift exposure from neutral to overweight. Chart 6Dow Theory Green Light Leading indicators in all three key rail freight categories suggests that the railroad rebound is still in the early innings. The V-shaped recovery in the ISM manufacturing and services surveys is underpinning total rail shipments and signals that our rail diffusion indicator has more upside (Chart 7). Chart 7All Aboard… The Cass Freight Index shipments and expenditures components are also on a tear and corroborate that demand for rail freight services is robust. The upshot is that still beaten down sell-side analysts’ relative revenue growth estimates will likely surprise to the upside (Chart 8). Importantly, our Railroad Indicator does an excellent job in capturing this firming rail demand backdrop and signals that relative share price momentum has more room to rise (second panel, Chart 9). Chart 8...The Rails Chart 9Intermodal Is On Fire On the intermodal front, the back half of the year economic reopening due to the population’s inoculation along with President Biden's freshly signed fiscal spending bill suggest that retail related hauling services will pick up steam. The overall business sales-to-inventories (S/I) ratio in general and the retail S/I ratio in particular corroborate the upbeat demand outlook for intermodal carloads (third panel, Chart 9). Similarly, the LA port is as busy as ever as containerships are arriving non-stop full of cargo from China (bottom panel, Chart 9). On the commodity front, coal shipments are staging a comeback from extremely depressed levels and there is scope for a jump to expansionary territory especially given the soaring natural gas prices (second & middle panels, Chart 10). With regard to the broad commodity complex (excluding the historically large coal carload category) the demand profile for rail services is as upbeat as ever. Not only are commodity prices galloping higher, but also BCA’s Global Leading Economic Indicator is steeply accelerating painting a bright picture for rail hauling (fourth & bottom panels, Chart 10). Moreover, the surging global PMI signals that the global economic recovery is also on the ascent, which bodes well for relative profit growth (middle panel, Chart 11). Chart 10Commodity Carloads Set To Surge Chart 11Global Recovery Is A Tailwind Importantly, on the operating front our railroad industry profit margin proxy is at an historically wide level and underscores that the path of least resistance is higher for margins (Chart 11). Thus, rail profits are highly levered to industry pricing power that is on the cusp of spiking higher, especially if our thesis of the firming rail demand backdrop is accurate. The implication is that a rerating phase is in the cards for the S&P railroads index (middle panel, Chart 12). Finally, our EPS macro model has slingshot higher and suggests that rail earnings have a long runway ahead (bottom panel, Chart 12). Netting it all out, firming leading rail freight indicators signal that intermodal, coal and commodity (ex-coal) carloads are in high demand. Tack on the global economic reopening and rising commodity prices, and factors are falling into place for a durable outperformance phase in rails. Bottom Line: Boost the S&P rails index to overweight, today. The ticker symbols for the stocks in this index are: BLBG: S5RAIL – CSX, KSU, NSC, UNP. Chart 12Pricing Power Holds The Key Stay Checked In To Hotels In late-November we boosted the S&P hotels, resorts & cruises index to overweight and got some eyebrows raised from our diverse client base. Subsequently, we added this niche consumer discretionary sub-group to our high-conviction overweight list for 2021 and the client pushback intensified. Today, we reiterate our high-conviction call on the S&P hotels, resorts & cruises index that has already added alpha to our portfolio to the tune of 17% since inception. While relative share price momentum has climbed of late and relative valuations have troughed, our sense is that the re-rating phase is just getting under way (Chart 13). As the global push for COVID-19 vaccinations heats up, the semblance of normality will serve as a catalyst to unlock excellent value in hotels. True, lodging services demand is as downbeat as ever, but this index is a prime beneficiary of the reopening trade. Pent-up services demand will get unleashed with consumers likely indulging on more lavish vacationing starting this Memorial Day. Rising government transfers, a soaring savings rate and increasing incomes all augur well for lodging demand and is also corroborated by our hotels demand indicator (Chart 14). Tack on firming consumer sentiment and the ISM services index staying squarely above the 50 expansion line, and the industry’s demand outlook lifts further. Chart 13A Valuation Re-rating Phase Looms Chart 14Leading Demand Indicators Give The All-clear Given that hotel capacity has been restrained, there are high odds that upbeat demand will likely catch hoteliers unprepared to fulfil it, and thus causing a jump in selling prices (Chart 15). Business travel is also slated to return as a flexible work place environment becomes the norm and the need to meet clients and prospects in order to conduct business will come back with a vengeance. The implication is that beaten down industry profit margins will recover smartly and boost lodging profitability especially given the collapse in the industry’s wage bill (Chart 15). Finally, our S&P hotels, resorts & cruises macro sales model encapsulates all these moving parts and signals that the budding recovery in revenue growth will gain momentum in the back half of the year (Chart 16). Chart 15Widening Margins Will Restore Profitability Chart 16Macro-based Revenue Growth Model Points To A V-shaped RecoveryAdding it all up, recovering lodging demand coupled with restrained industry capacity should restore hoteliers’ pricing power and boost profitability. Bottom Line: We reiterate the high-conviction overweight status in the S&P hotels, resorts and cruises index. The ticker symbols for the stocks in this index are: BLBG: S5HOTL – MAR, HLT, CCL, RCL, NCLH. Anastasios Avgeriou US Equity Strategist anastasios@bcaresearch.com Appendix Chart A1 Chart A2 Chart A3 Chart A4 Chart A5 Chart A6 Footnotes 1 Given the different time frames of the bond market selloffs we decided to show annualized equity returns. 2 Ibid. Current Recommendations Current Trades Strategic (10-Year) Trade Recommendations Size And Style Views February 24, 2021 Stay neutral cyclicals over defensives January 12, 2021 Stay neutral small over large caps June 11, 2018 Long the BCA Millennial basket The ticker symbols are: (AAPL, AMZN, UBER, HD, LEN, MSFT, NFLX, SPOT, ABNB, V). January 22, 2018 Favor value over growth
This week we upgraded the S&P railroads index to neutral locking in 6.4% in relative gains since inception. The defensive nature of rails is most evident in industry pricing power (third panel). Railroad selling prices are holding their own despite a sizable drop in volumes. Moreover, CEOs exercised caution and refrained from adding to headcount. Taken together, they are boosting our profit margin proxy, which can serve as a catalyst to lift relative share price momentum out of its recent funk (second panel). Similarly, our three factor S&P rail EPS growth model is heralding a pickup in profits in the back half of the year (bottom panel). Bottom Line: Lift the S&P railroads index to neutral. Please refer to the most recent Weekly Report for the headwinds that prevent us from going overweight rail stocks.
Highlights Portfolio Strategy The Fed’s unorthodox monetary policy is aimed at quashing volatility, lifting asset prices and debasing the currency, all of which are equity market bullish. Grim, but backward looking, macro data are already reflected in the significant restaurant relative share price correction. Upgrade to neutral. Book profits in the underweight S&P rails portfolio position and lift exposure to neutral on the back of: a.) already reflected grim ISM services data, b.) resilient industry pricing power, c.) firming railroad profit margin backdrop and d.) encouraging signs from our EPS growth model. Recent Changes Augment the S&P restaurants index to neutral, today. Upgrade the S&P railroads index to a benchmark allocation, today. Table 1 Feature The SPX made a fresh run to recovery highs last week, cheering forward looking news of reopening of the economy and neglecting backward looking downbeat employment and PMI releases. Extremely easy fiscal and monetary policies remain the dominant macro themes, and underpin our sanguine equity market view for the coming 9-12 months. While Bill Martin’s infamous 1955 portrayal of the Fed as “the chaperone who ordered the punch bowl removed just when the party was really warming up”,1 the Jay Powell led Fed has done the opposite, and rightly so: it has ordered and delivered a bottomless punchbowl. The Fed’s unorthodox monetary policy is aimed at quashing volatility (Chart 1), lifting asset prices and debasing the currency, all of which are equity market bullish. According to Leo Krippner’s shadow short rates (SSR) estimate, the shadow fed funds rate is negative and should continue to support the SPX (SSR shown inverted, Chart 2). Chart 1Vol Will Melt Chart 2Crumbling Shadow Rates Underpin The SPX… In fact, there are two distinct avenues that declining interest rates underpin equities: First, falling interest rates are a boon to equities via a rising price-to-earnings multiple (SSR shown inverted, Chart 3). While the 12-month forward multiple is above a 20 handle, the highest point since the dotcom bubble era, using second and third fiscal year sell-side profit estimates – which better resemble trend EPS – results in a more tame forward P/E multiple with more upside (Chart 4). Second, while the Fed would never admit to it, it is trying to devalue the US dollar and reflate the global economy, which will indirectly boost S&P 500 revenues. As a reminder, 40% of SPX sales are internationally sourced and thus a falling greenback is a boon to S&P 500 turnover (bottom panel, Chart 5). Chart 3…Via Higher Valuations Keep in mind that most of global trade is conducted in USD and when trade collapses it creates a US dollar shortage (i.e. fewer US dollars are circulating around) that lifts the value of the reserve currency and vice versa. Cognizant of that, the Fed is trying to provide ample US dollar liquidity and aid in pushing the greenback lower (top panel, Chart 5). Chart 4Peer Across The EPS Valley, And Valuations Have Room To Rise Chart 5Depreciating USD Is A Boon For SPX Sales Drilling beneath the SPX’s surface, early-cyclical consumer discretionary equities are the primary beneficiaries of negative SSR. The top panel of Chart 6 shows that over the past three decades relative share prices are the mirror image of interest rates. This cycle, household finances are in order and coupled with generationally low interest rates signal that consumer spending will recover smartly as the economy opens up in coming quarters. Thus, consumer discretionary stocks should sustain their outperformance (middle & bottom panels, Chart 6). A small digression with regard to the reopening of the economy is in order. Pundits have been discussing and showing the three distinct waves of the Spanish flu as the closest parallel with the current pandemic. Chart 7 shows these three waves using UK data, but the UK equity market (and the DOW for that matter) did not really budge back then. Keep in mind this was in the midst of a recession as the Great War was about to end on November 11, 1918 (Remembrance Day). Chart 6Stick With Consumer Discretionary Exposure Chart 7The 1918 UK Parallel, Including Equities While no one really knows how in the long-term this pandemic will affect the economy, the stock market, society in general and consumer behavior in particular, our sense is that uncertainty will continue to recede in the coming months irrespective of the second and third likely waves. Why? Because not only do governments know more about this invisible enemy, but they (and hospitals) will also be more prepared to deal with any future outbreaks. Moreover, given that there is a race to get a novel coronavirus vaccine (and treatment) the world over, a breakthrough will soon materialize; MRNA’s recent FDA phase II clinical trial for their vaccine candidate is a case in point. Receding uncertainty is great news for stock investors. Meanwhile, in recent research we highlighted that early-cyclical interest rate-sensitive equities do in fact lead the GICS1 sector pack in recessionary recoveries based on empirical evidence.2 As a reminder, in mid-April we lifted the S&P consumer discretionary sector to overweight and this week we are updating our views on a hard hit subindex. We are also upgrading a deep cyclical services industry to neutral. Preparing To Dine Out It no longer pays to be underweight the S&P restaurants index; upgrade to neutral today. Not only the reopening of the economy will, at the margin, bring back diners (take out mostly) to restaurants, but the two heavyweights that comprise 80% of the market cap of the S&P restaurants group are anything but discretionary. In our view, MCD is defensive and SBUX has become a staple. Thus, as the economy slowly reopens and store traffic picks up, these bellwether stocks will lead this index higher. Relative share prices have corrected to the twenty-year uptrend line and hover near the previous two breakout points in 2011/12 and 2015/16 where they should find enough support (top panel, Chart 8). With regard to macro data, most of the restaurant-relevant releases are looking in the rear view mirror. In other words, the trouncing in restaurant retail sales and employment, food-away-from-home PCE and even the collapse in the Restaurant Performance Index were “known knowns” (Chart 8). Therefore, all of this grim news is already reflected in the 30% drubbing in relative performance from peak-to-trough. Chart 8Grim Data Priced In Chart 9Dollar The Reflator Domestic restaurant sales should stabilize in the coming months. If the Fed manages to devalue the US dollar (please see discussion above), then even international revenues in general and Chinese sourced sales in particular will rekindle overall industry turnover (Chart 9). Keep in mind that China’s economy reopening is leading the global economy by about six weeks. Importantly, construction spending on restaurants is falling like a stone and this decline in supply and industry capex will provide a much needed offset to free cash flow generation (middle panel, Chart 10). Nevertheless, three key concerns keep us at bay and prevent us from turning outright bullish. First, net debt-to-EBITDA has taken a steep turn for the worst of late, and while it is mostly driven by the shortfall in cash flow, it is still quite unnerving (bottom panel, Chart 11). Second, there is margin trouble that restauranteurs have yet to work out, and a rising wage bill will continue to weigh on profit growth (second panel, Chart 11). Finally, relative valuations are lofty for our liking. On a 12-month forward P/E basis the S&P restaurants index is trading at 53% premium to the SPX and 26% above the historical mean (third panel, Chart 11). Chart 10Supply Restraint Is Positive Chart 11Watch These Risks Netting it all out, grim but backward looking macro data are already reflected in the significant restaurant relative share price correction. Lift exposure to a benchmark allocation. Bottom Line: Lift the S&P restaurants index to neutral for a relative loss of 13.7% since inception. The ticker symbols for the stocks in this index are: BLBG: S5REST – MCD, SBUX, YUMB, CMG, DRI. Upgrade Rails To Neutral Over the past three years we have been mostly on the right side of rails both in bull and bear phases; today we recommend cementing relative gains of 6.4% since inception, and lifting exposure to neutral. Rails are the largest transports subgroup and this services industry is showcasing impressive resilience in times of adversity. True, the latest ISM non-manufacturing survey made for grim reading. Both the headline number and most of the key subcomponents of the survey were tough to digest: the overall survey fell near the GFC lows (bottom panel, Chart 12), the Business Activity Index collapsed to 26%, an all-time low. While this survey can fall anew next month, we deem that extreme pessimism reigns supreme, and as the US economy is slated to reopen some semblance of normality will return in coming months. Tack on the improving export data out of China, and we are cautiously optimistic that rail hauling services will soon stage a comeback (middle panel, Chart 12). Chart 12As Bad As It Gets Chart 13Green Shoots The defensive nature of rails is most evident in industry pricing power (third panel, Chart 13). Railroad selling prices are holding their own despite a sizable drop in volumes. Moreover, CEOs exercised caution and refrained from adding to headcount. Taken together, they are boosting our profit margin proxy, which can serve as a catalyst to lift relative share price momentum out of its recent funk (second panel, Chart 13). Similarly, our 3 factor S&P rail EPS growth model is heralding a pickup in profits in the back half of the year (bottom panel, Chart 13). Despite all these tailwinds, there are some powerful offsets that tame our optimism on railroards. Intermodal rail shipments are a major freight category and thus a key determinant of rail profitability. As consumer confidence remains in freefall, downbeat retail sales will cast a dark shadow on this essential rail freight category (Chart 14). Finally, the industry’s rising debt profile is still a primary concern. Rail executives neglected capex in recent years and instead raised debt in order to retire equity and enhance shareholder value. We continue to view this “investment” backdrop with skepticism and prior to further augmenting exposure to an overweight stance we would want to see an easing on the debt uptake directed at these shareholder friendly activities (Chart 15). Chart 14The Consumer Is A Sore Spot Chart 15Debt Burden Flashing Red In sum, we are compelled to take profits in our underweight S&P rails portfolio position and lift exposure to neutral on the back of: a.) already reflected grim ISM services data, b.) resilient industry pricing power, c.) firming railroad profit margin backdrop and d.) encouraging signs from our EPS growth model. Bottom Line: Lift the S&P railroads index to a benchmark allocation today booking a profit of 6.4% since inception. The ticker symbols for the stocks in this index are: BLBG: S5RAIL – UNP, NSC, CSX, KSU. Anastasios Avgeriou US Equity Strategist anastasios@bcaresearch.com Footnotes 1 https://fraser.stlouisfed.org/title/statements-speeches-william-mcchesney-martin-jr-448/address-new-york-group-investment-bankers-association-america-7800 2 Please see BCA US Equity Strategy Weekly Report, “Fight Central Banks At Your Own Peril” dated April 14, 2020, available at uses.bcaresearch.com. Current Recommendations Current Trades Strategic (10-Year) Trade Recommendations Size And Style Views June 3, 2019 Stay neutral cyclicals over defensives (downgrade alert) January 22, 2018 Favor value over growth April 28, 2020 Stay neutral large over small caps June 11, 2018 Long the BCA Millennial basket The ticker symbols are: (AAPL, AMZN, UBER, HD, LEN, MSFT, NFLX, SPOT, TSLA, V).
Underweight – Upgrade Alert Two recent positive developments in railroad operating metrics compel us to put rails on an upgrade alert. Specifically, our operating margin proxy is expanding at a healthy pace (second panel). Further, our core rail shipments diffusion indicator is also predicting that demand for rail freight services is primed to stage a comeback (middle panel). Despite improving operating metrics, the macro picture remains bleak. The ISM manufacturing survey, the CASS freight expenditures index and the most recent roundtable CEO survey are still firing warning shots (fourth panel). Meanwhile, the railroad debt profile remains worrisome, as CEOs have been shunning capex in favor of shareholder friendly activities (bottom panel). Bottom Line: We remain underweight the S&P railroads index, but it is now on our upgrade watch list. The ticker symbols for the stocks in this index are: BLBG: S5RAIL - UNP, CSX, NSC, KSU.
Underweight Transports have taken a beating recently with the heavyweight S&P railroads index leading the pack lower. Our underweight stance is paying handsome dividends and there are more gains in store in the coming months. The dour ISM manufacturing survey served as a catalyst this week to re-concentrate investors’ minds on the U.S. economy getting infected from international ails, and the trade war inflicting heavy wounds on transportation services including rail freight (second & third panels). The implication is that risk premia will continue to widen and relative railroad share prices will have to adjust lower. Tack on decelerating industry pricing power (bottom panel) and an earnings led selloff in the relative share price ratio is a rising probability outcome. Bottom Line: Continue to avoid the S&P railroads index. The ticker symbols for the stocks in this index are: BLBG: S5RAIL - UNP, CSX, NSC, KSU.