Recession-Hard/Soft Landing

Executive Summary The Fed, Bank of England (BoE) and Reserve Bank of Australia all hiked rates last week. The BoE, however, signaled a note of caution on future UK growth, given soaring energy prices and plunging consumer and business confidence. Interest rate markets are pricing in a peak in UK policy rates over the next year near 2.5%, above realistic estimates of neutral that are more in the 1.5-2% range. UK productivity and potential growth remain too weak to support a higher neutral rate than that. With the BoE forecasting near recessionary conditions over the next couple of years if those market-implied rate hikes come to fruition, the time is right to increase exposure to UK government bonds in global fixed income portfolios. UK Rate Expectations Are Too High
UK Rate Expectations Are Too High
UK Rate Expectations Are Too High
Bottom Line: Markets are overestimating how much additional tightening the Bank of England can deliver. We are upgrading our recommended strategic stance on UK Gilts from underweight (2 out of 5) to overweight (4 out of 5). Not All Central Bankers Can Credibly Restore Credibility Chart 1Developed Market Bond Yields Back To 2018 Highs
Developed Market Bond Yields Back To 2018 Highs
Developed Market Bond Yields Back To 2018 Highs
Three more central bank meetings, three more rate hikes. Last week brought a 50bp hike from the Fed, a 25bp hike – the first of this tightening cycle – by the Reserve Bank of Australia (RBA) and a 25bp rate increase from the Bank of England (BoE). The Fed and RBA moves did little to stabilize the government bond bear markets in the US and Australia, but the BoE was able to provide a temporary reprieve for the Gilt selloff by playing up potential UK recession (stagflation?) risks. Bond yields worldwide remains laser focused on high global inflation and the associated monetary policy response that will be needed to stabilize inflation expectations (Chart 1). That includes both interest rate hikes and reducing the size of bloated central bank balance sheets. The threat of such “double tightening” is weighing on global growth expectations and risk asset valuations. The MSCI World equity index is down -6.4% (in USD terms) so far in the Q2/2022 and down -14.5% since the mid-November/2021 peak. Although in a more mitigated way, credit markets are also being impacted, with the Bloomberg Global High-Yield index down -2.6% so far in Q2 on an excess return basis versus government bonds. Rate hike expectations have started to catch up to elevated inflation expectations, at least according to inflation linked bonds. The yield on 10-year US TIPS now sits at +0.29%, a huge swing from the -1% level seen just one month ago (Chart 2). The 10-year real yield is even higher in Canada (+0.81%) where the Bank of Canada just delivered its own 50bp rate hike in April. On the other hand, 10-year real yields remain deeply below 0% in Europe and the UK, where central bankers have been providing less explicit guidance on future rate hikes and asset purchase reductions compared to the Fed or Bank of Canada. Interest rate markets remain reluctant to price in significantly positive real policy interest rates at the peak of the current tightening cycle. Our proxy for the real terminal rate expectation, the 5-year/5-year overnight index swap rate (OIS) minus the 5-year/5-year CPI swap rate, is only +0.18% in the US. It is still deeply negative in Europe (-1.53%) and the UK (-0.97%). Our estimates of the term premium component of 10-year government bond yields in those three markets is rising alongside interest rate expectations yet remains deeply negative in Europe and the UK (Chart 3). Chart 2Real Rate Divergences In The Face Of A Global Inflation Shock
Real Rate Divergences In The Face Of A Global Inflation Shock
Real Rate Divergences In The Face Of A Global Inflation Shock
Chart 3Markets Still Pricing In Structurally Low Rates
Markets Still Pricing In Structurally Low Rates
Markets Still Pricing In Structurally Low Rates
Of those three major bond markets, we see the UK term premium as being the least likely to see additional upward repricing, with the BoE less likely than the Fed or ECB to push for an aggressively smaller balance sheet given domestic economic risks. UK Rate Expectations Are Too Hawkish Chart 4Our BoE Monitor Justifies Recent Tightening Moves
Our BoE Monitor Justifies Recent Tightening Moves
Our BoE Monitor Justifies Recent Tightening Moves
The Bank of England raised rates by 25bps last week, pushing Bank Rate to a 13-year high of 1.0%. The decision was a 6-3 majority, with three Monetary Policy Committee (MPC) members calling for a 50bp hike – matching recent moves by other G-10 central banks like the Fed and Bank of Canada – given tight UK capacity constraints (i.e. low unemployment) and high realized inflation. The MPC noted that additional rate increases would likely be necessary to tame very high UK inflation, a message confirmed by the elevated level of our UK Central Bank Monitor (Chart 4). However, the new economic forecasts presented by the BoE painted a gloomy picture on UK growth, raising the risks of a recession even as UK inflation is expected to continue climbing to a 10% peak in late 2022 on the back of high energy prices.1 Strictly looking at current inflation, the case for the BoE to continue hiking rates is obvious. Yet the BoE may now be placing more weight on the downside risks to growth from the energy shock, at a time when fiscal tightening is no longer providing stimulus. In the press conference following last week’s MPC meeting, BoE Governor Andrew Bailey noted the difficult situation policymakers are facing given the huge surge in energy prices that is fueling inflation while also weighing on household and business real incomes. So what is “neutral” anyway? Related Report Global Fixed Income StrategyThe UK Leads The Way The BoE is one of the least transparent major central banks when it comes to providing guidance on what it thinks the neutral policy rate is. Market participants are left to arrive at their own conclusions and those can vary substantially, as is currently the case. The UK OIS curve is discounting a peak in rates of 2.72% in 2023 and discounting rate cuts after that starting in 2024. Yet the respondents to the BoE’s new Market Participants Survey are calling for a much lower trajectory with rates peaking at 1.75% before falling to 1.5% in 2024 (Chart 5). Those rate levels are in the lower half of the range of longer-run neutral rate estimates from the same Market Participants Survey, between 1.5% and 2.0% (the shaded box in the chart). Chart 5UK Rate Expectations Are Too High
UK Rate Expectations Are Too High
UK Rate Expectations Are Too High
Chart 6Recessionary BoE Forecasts, Except For GDP
Recessionary BoE Forecasts, Except For GDP
Recessionary BoE Forecasts, Except For GDP
Combining the messages from the OIS curve and the Survey, markets are pricing in a path for the BoE Bank Rate that will become restrictive by mid-2023, with another 172bps of rate hikes. The BoE uses market pricing for future interest rates in its economic forecasts. The Bank’s models suggest that a move to raise rates to 2.5% in response to high UK inflation, as markets are discounting, would result in a severe UK downturn that would both push up unemployment from the current 3.7% to 5.4% by Q2/2025 (Chart 6). Headline inflation would plunge to 1.3% over the same period as the UK output gap widens to -2.25% of GDP from the current “excess demand” level of +0.5%. Oddly enough, the BoE is only forecasting a flat profile for real GDP growth over that entire three-year forecasting period, although there will clearly be some negative GDP prints during that period to generate such a massively disinflationary outcome. A mixed picture on UK growth Currently, the UK economy is flashing some warning signs on growth momentum. The UK manufacturing PMI was 55.8 in April, still well above the 50 level indicating growth but 9.8 pts below the cyclical peak in 2021 (Chart 7). The services PMI is in better shape at 58.9, but it did dip lower in the latest reading. The GfK consumer confidence index has fallen sharply in response to contacting real household income growth, reaching the second-lowest reading in the history of the series dating back to 1974 in April. This is a warning sign for consumer spending – retail sales fell in April for the first time in fifteen months (middle panel). Business confidence is also impacted by the high costs of both energy and labor that is squeezing profit margins. UK real investment spending is nearly contracting on a year-over-year basis, despite the robust readings on investment intentions from the BoEs’ Agents Survey of UK businesses (bottom panel).UK firms are facing higher wage costs at a time of very tight labor market and robust labor demand. The BoE estimates that UK private sector wage growth, after adjusting for compositional effects related to the pandemic, will accelerate to 5.1% by the end of Q2/2022 (Chart 8). Chart 7UK Growth Facing Inflationary Headwinds
UK Growth Facing Inflationary Headwinds
UK Growth Facing Inflationary Headwinds
Chart 8UK Labor Market Remains Healthy
UK Labor Market Remains Healthy
UK Labor Market Remains Healthy
Chart 9Will House Prices Signal The Peak In UK Inflation?
Will House Prices Signal The Peak In UK Inflation?
Will House Prices Signal The Peak In UK Inflation?
A robust labor market and quickening wage growth is forcing the BoE to maintain a relatively hawkish bias at a time of high energy inflation, even with the growth outlook darkening in the central bank’s own forecasts. Booming house prices are also making the central bank’s job more challenging. The annual growth rate of the Nationwide UK house price index reached 12.4%, a 17-year high, in March. However, rising mortgage rates and declining household real incomes will likely begin to eat into housing demand and, eventually, help slow the rapid pace of house price growth (Chart 9, bottom panel). Summing it all up, the overall UK inflation picture, including wages and housing costs in addition to energy prices and durable goods prices, will force the BoE to deliver a few more rate hikes before year-end before reaching a peak level that is lower than current market pricing. The neutral UK interest rate is likely very low Chart 10Structurally Weak UK Growth = A Low Neutral Rate
Structurally Weak UK Growth = A Low Neutral Rate
Structurally Weak UK Growth = A Low Neutral Rate
The UK economy has suffered from structurally low potential economic growth dating back to the Brexit referendum in 2016. UK businesses stopped investing in the face of the uncertainty over the UK’s relationship with Europe. There has basically been no growth in UK fixed investment over the past five years. In response, UK productivity has only grown an annualized 0.9% over that same period (Chart 10) and the OECD’s estimate of UK potential GDP growth has been cut from 2% to 1.1%. With such low potential growth, the neutral BoE policy interest rate is likely even lower than the 1.5-2% range of estimates from the BoE’s Market Participant Survey. Tighter fiscal policy also lowers the neutral UK interest rate, with the UK Office of Budget Responsibility forecasting a narrowing of the UK budget deficit of -13.6 percentage points between the 2021 peak and 2027 (bottom panel). A flat UK Gilt curve is also a sign that the neutral interest rate is quite low. The 2-year/10-year Gilt curve now sits at a mere -49bps with Bank Rate only at 1% (Chart 11). While this is modestly steeper from the near-inversion of the curve seen at the start of 2022, a very flat curve at a nominal policy rate of only 1% suggests that the neutral rate is not far from the current level. Sluggish UK equity market performance and widening UK corporate credit spreads also argue that Bank Rate may already be turning restrictive, although a lower trade-weighted pound is helping to mitigate the overall tightening of UK financial conditions. Chart 11UK Financial Conditions Are Not Restrictive (Yet)
UK Financial Conditions Are Not Restrictive (Yet)
UK Financial Conditions Are Not Restrictive (Yet)
Chart 12Pressure On The BoE Will Not Peak Until Inflation Does
Pressure On The BoE Will Not Peak Until Inflation Does
Pressure On The BoE Will Not Peak Until Inflation Does
In the end, the pressure on the BoE to tighten will not ease until UK inflation peaks. The BoE is suffering a severe credibility crisis, with its own public opinion survey showing the deepest level of public dissatisfaction with the bank since the Global Financial Crisis (Chart 12). Inflation expectations are at similar levels that prevailed during that period, although the unique nature of the current inflation upturn, fueled by global supply-chain squeezes and war-related boosts to commodity prices, will likely prevent a repeat of the relatively fast reversal of inflation expectations seen after the Global Financial Crisis. Investment Implications – Get Ready For Gilt Outperformance Chart 13Upgrade UK Gilts To Overweight
Upgrade UK Gilts To Overweight
Upgrade UK Gilts To Overweight
With the BoE already pushing Bank Rate towards a plausible neutral range, we do not expect many more rate hikes in the UK. Our base case is that the BoE hikes 2-3 more times by year-end, pushing Bank Rate to 1.5-1.75%, before pausing. This would represent a lower peak in policy rates than currently priced in the UK OIS curve. That is a relatively dovish outcome that typically leads to positive performance for a government bond market according to our “Global Golden Rule” framework, which we will revisit in next week’s Strategy Report. For now, however, we see a strong case to turn more positive on UK Gilts, with the BoE likely to deliver fewer rate hikes than discounted (Chart 13). The BoE is also far less likely to begin reducing its balance sheet by selling its Gilt holdings back to the market. BoE Governor Bailey strongly hinted last week that such aggressive quantitative tightening (QT) was not a given, even after the Bank research staff presents its proposals to the MPC in August. A delay in QT would also be a factor boosting UK Gilt performance versus other developed economy bond markets where more aggressive reductions in central bank balance sheets are more likely, like the US and potentially even the euro area. This week, we are upgrading our recommended strategic UK weighting from underweight to overweight. In next week’s report, we will consider the proper allocation for the UK within our model bond portfolio, after reviewing potential bond return forecasts stemming from our Global Golden Rule. Bottom Line: Markets are overestimating how much additional tightening the Bank of England can deliver. We are upgrading our recommended strategic stance on UK Gilts from underweight (2 out of 5) to overweight (4 out of 5). Robert Robis, CFA Chief Fixed Income Strategist rrobis@bcaresearch.com Footnotes 1 The mechanical way that the UK government’s energy price regulator, Ofgem, sets price caps on retail gas and electricity costs - based on changes in wholesale energy costs implied by futures curves – means that UK household energy prices will rise by 40% in October, according to BoE estimates. GFIS Model Bond Portfolio Recommended Positioning Active Duration Contribution: GFIS Recommended Portfolio Vs. Custom Performance Benchmark
It’s Time To Flip The Script - Upgrade UK Gilts
It’s Time To Flip The Script - Upgrade UK Gilts
The GFIS Recommended Portfolio Vs. The Custom Benchmark Index
It’s Time To Flip The Script - Upgrade UK Gilts
It’s Time To Flip The Script - Upgrade UK Gilts
Tactical Overlay Trades
In lieu of next week’s report, I will be presenting a webcast titled ‘The 5 Big Mispricings In The Markets Right Now, And How To Profit From Them’. I do hope you can join. Executive Summary Just as the railway timetables set in train the First World War, central bank timetables for aggressive rate hikes are setting in train a global recession. Demand is already cool, so aggressive rate hikes will take it to outright cold. The risk is elevated because central banks are desperate to repair their damaged credibility on fighting inflation, and it may be their last chance. Inflationary fears and hawkishness from central banks are weighing on bonds and stocks, and it may take some weeks, or months, for inflation fears to recede. But we could be approaching a turning point. By the summer, core inflation should be receding. Furthermore, the fractal structures of the sell-offs in both the 30-year T-bond and the tech-heavy NASDAQ index are approaching points of extreme fragility that have signalled inflection points. Fractal trading watchlist: 30-year T-bond, NASDAQ, FTSE 100 versus Euro Stoxx 50, Netherlands versus Switzerland, and Petcare (PAWZ). US Inflation Is Hot, But Demand Is Not
US Inflation Is Hot, But Demand Is Not
US Inflation Is Hot, But Demand Is Not
Bottom Line: Tactically cautious, but long-term investors who do not need to time the market bottom should overweight bonds and overweight long-duration defensive equities versus short-duration cyclical equities – for example, overweight US versus non-US equities. Feature The First World War, the historian AJP Taylor famously argued, was “imposed on the statesmen of Europe by railway timetables.” Taylor proposed that the railways and their timetables were so central to troop mobilisation – and specifically, the German Schlieffen Plan – that a plan once set in motion could not be stopped. “Once started the wagons and carriages must roll remorselessly and inevitably to their predestined goal.” Otherwise, the whole process would unravel, and an opportunity to demonstrate military credibility would be lost that might never come again. Today, could a global recession be imposed upon us by central bank timetables for aggressive rate hikes? Just as it was difficult to unwind the troop mobilisation that led to the Great War, it will be difficult to back down from the aggressive rate hikes that the central banks have timetabled, at least in the near term. Otherwise, an opportunity to demonstrate inflation fighting credibility would be lost that might never come again. Just as the railway timetables set in train the First World War, central bank timetables for aggressive rate hikes may set in train another global recession. Unfortunately, central banks do not have precision weapons. Quite the contrary, monetary tightening is a blunt instrument which works by cooling overall demand. But demand is already cool, as evidenced by the contraction of the US economy in the first quarter. In their zeal to repair their damaged credibility on fighting inflation, the danger is that central banks take the economy from cool to outright cold. Granted, the US economy was dragged down by a drop in inventories and net exports. But even US domestic demand – which strips out inventories and net exports – is barely on its pre-pandemic trend (Chart I-1). Meanwhile, the euro area economy is still 5 percent below its pre-pandemic trend (Chart I-2). To reiterate, by hiking rates aggressively into economies that are at best lukewarm, central banks are risking an outright recession. Chart I-1US Inflation Is Hot, But Demand Is Not
US Inflation Is Hot, But Demand Is Not
US Inflation Is Hot, But Demand Is Not
Chart I-2Euro Area Inflation Is Hot, But Demand Is Not
Euro Area Inflation Is Hot, But Demand Is Not
Euro Area Inflation Is Hot, But Demand Is Not
Our Three-Point Checklist For A Recession Has Three Ticks My colleague Peter Berezin has created a three-point checklist for a recession: The build-up of an imbalance makes the economy vulnerable to downturn. A catalyst exposes this imbalance. Amplifiers exacerbate the downturn. Is there a major imbalance? You bet there is. The post-pandemic 26 percent overspend on durable goods in the US constitutes one of the greatest imbalances in economic history. Other advanced economies also experienced unprecedented binges on durable goods. The catalyst that is exposing this major imbalance is the realisation that durable goods are, well, durable. So, if you overspent on durables in 2020/21, then the risk is that you symmetrically underspend in 2022/23 (Chart I-3). The post-pandemic 26 percent overspend on durable goods in the US constitutes one of the greatest imbalances in economic history. Meanwhile, a future underspend on goods cannot be countered by an overspend on services because the consumption of services is constrained by time, opportunity, and biology. There is a limit to how often you can eat out, go to the movies, or go to the doctor (Chart I-4). Indeed, for certain services, an underspend will persist, because we have made some permanent post-pandemic changes to our lifestyles: for example, hybrid office/home working and more online shopping and online medical care. Chart I-3An Overspend On Goods Can Be Corrected By A Subsequent Underspend...
An Overspend On Goods Can Be Corrected By A Subsequent Underspend...
An Overspend On Goods Can Be Corrected By A Subsequent Underspend...
Chart I-4...But An Underspend On Services Cannot Be Corrected By A Subsequent Overspend
...But An Underspend On Services Cannot Be Corrected By A Subsequent Overspend
...But An Underspend On Services Cannot Be Corrected By A Subsequent Overspend
Finally, the amplifier that will exacerbate the downturn is monetary tightening. If central banks follow their railway timetables for aggressive rate hikes, a goods downturn will magnify into an outright recession. So, in Peter’s three-point checklist, we now have tick, tick, and tick. Inflation Is Hot, But Demand Is Not If economic demand is at best lukewarm, then what caused the post-pandemic inflation that central banks are now fighting? The simple answer is massive fiscal stimulus combined with the equally massive shift in spending to durable goods. Locked at home and flush with government supplied cash, we couldn’t spend it on services, so we spent it on goods. This created a massive shock in the distribution of demand, out of services whose supply could easily adjust downwards, and into goods whose supply could not easily adjust upwards. For example, airlines could cut back their flights, but auto manufacturers couldn’t make more cars. So, airfares didn’t collapse but used car prices went vertical! The causality from stimulus payments to durable goods spending to core inflation is irrefutable. The causality from stimulus payments to durable goods spending to core inflation is irrefutable. The biggest surges in US durable goods spending all coincided with the government’s stimulus checks (Chart I-5). And the three separate surges in month-on-month core inflation all occurred after surges in durable goods demand (Chart I-6). As further proof, core inflation is highest in those economies where the stimulus checks and furlough schemes were the most generous – like the US and the UK. Chart I-5Stimulus Checks Caused The Surges in Durable Goods Spending
Stimulus Checks Caused The Surges in Durable Goods Spending
Stimulus Checks Caused The Surges in Durable Goods Spending
Chart I-6The Surges In Durable Goods Spending Caused The Surges In Core Inflation
The Surges In Durable Goods Spending Caused The Surges In Core Inflation
The Surges In Durable Goods Spending Caused The Surges In Core Inflation
What Does All This Mean For Investment Strategy? Our high conviction view is that the pandemic’s inflationary impulse combined with the Ukraine war will turn out to be demand-destructive, and thereby ultimately morph into a deflationary impulse. Yet central banks are all pumped up to demonstrate their inflation fighting credibility. Given that this credibility is badly damaged, it may be their last opportunity to repair it before it is shattered forever. To repeat, just as the railway timetables set in train the First World War, central bank timetables for aggressive rate hikes may set in train another global recession. That said, a recession is not inevitable. The interest rate that matters most for the economy and the markets is not the policy rate that central banks want to hike aggressively, it is the long-duration bond yield. A lower bond yield can underpin both the economy and the financial markets, just as it did during the pandemic in 2020. But to the extent that the bond market is following the real economic data, we are in a dangerous phase. Because, as is typical at an inflection point, the real data will be noisy and ambiguous. Meaning it may take some weeks, or months, for inflation fears to be trumped by growth fears. On March 10th, in Are We In A Slow-Motion Crash? we predicted: “On a tactical (3-month) horizon, the inflationary impulse from soaring energy and food prices combined with the choke on growth from sanctions will weigh on both the global economy and the global stock market. As such, bond yields could nudge higher, the global stock market has yet to reach its crisis bottom, and the US dollar will rally” That prediction proved to be spot on! Recession, or no recession, we are still in a difficult period for markets because inflationary fears and hawkishness from central banks are weighing on bonds and stocks, while buoying the US dollar. As such, tactical caution is still warranted. Fractal structures of the sell-offs in both the 30-year T-bond and the tech-heavy NASDAQ index are approaching points of extreme fragility. But we could be approaching a turning point. By the summer, core inflation should be receding. Furthermore, the fractal structures of the sell-offs in both the 30-year T-bond and the tech-heavy NASDAQ index are approaching points of extreme fragility that have reliably signalled previous inflection points (Chart I-7 and Chart I-8). Chart I-7The Sell-Off In The 30-Year T-Bond Is Approaching Fractal Fragility
The Sell-Off In The 30-Year T-Bond Is Approaching Fractal Fragility
The Sell-Off In The 30-Year T-Bond Is Approaching Fractal Fragility
Chart I-8The Sell-Off In The NASDAQ Is Approaching Fractal Fragility
The Sell-Off In The NASDAQ Is Approaching Fractal Fragility
The Sell-Off In The NASDAQ Is Approaching Fractal Fragility
The advice for long-term investors who do not need to time the market bottom is: Bonds will ultimately rally. Overweight the 30-year T-bond and the 30-year Chinese bond. Equities will be conflicted between slowing growth which will weigh on cyclical profits, and falling bond yields which will buoy long-duration valuations. Therefore, overweight long-duration defensive sectors and markets versus short-duration cyclical sectors and markets. For example, overweight US versus non-US equities. Fractal Trading Watchlist As just discussed, the sell-offs in the 30-year T-bond and the NASDAQ are approaching points of fractal fragility that have signalled previous turning points. Hence, we are adding both investments to our watchlist. Also added to our watchlist is the outperformance of the FTSE100 versus Euro Stoxx 50, and the underperformance of Netherlands versus Switzerland, both of which are approaching potential reversals. Our final addition is Petcare (PAWZ). After a stellar 2020, Petcare gave back most of its gains in 2021. But this underperformance is now approaching a point of fragility which might provide a new entry point. There are no new trades this week, but the full watchlist of investments at, or approaching, turning points is available on our website: cpt.bcaresearch.com Fractal Trading Watchlist: New Additions A Potential New Entry Point Into Petcare
A Potential New Entry Point Into Petcare
A Potential New Entry Point Into Petcare
FTSE100 Outperformance Vs. Euro Stoxx 50 Vulnerable To Reversal
FTSE100 Outperformance Vs. Euro Stoxx 50 Vulnerable To Reversal
FTSE100 Outperformance Vs. Euro Stoxx 50 Vulnerable To Reversal
Netherlands Underperformance Vs. Switzerland Close To Exhaustion
Netherlands Underperformance Vs. Switzerland Close To Exhaustion
Netherlands Underperformance Vs. Switzerland Close To Exhaustion
Chart 1The Strong Trend In The 18-Month-Out US Interest Rate Future Is Fragile
The Strong Trend In The 18-Month-Out US Interest Rate Future Is Fragile
The Strong Trend In The 18-Month-Out US Interest Rate Future Is Fragile
Chart 2The Strong Trend In The 3 Year T-Bond Is Fragile
The Strong Trend In The 3 Year T-Bond Is Fragile
The Strong Trend In The 3 Year T-Bond Is Fragile
Chart 3AUD/KRW Is Vulnerable To Reversal
AUD/KRW Is Vulnerable To Reversal
AUD/KRW Is Vulnerable To Reversal
Chart 4Canada Versus Japan Is Reversing
Canada Versus Japan Is Reversing
Canada Versus Japan Is Reversing
Chart 5Canada's TSX-60's Outperformance Might Be Over
Canada's TSX-60's Outperformance Might Be Over
Canada's TSX-60's Outperformance Might Be Over
Chart 6US Healthcare Providers Vs. Software At Risk of Reversal
US Healthcare Providers Vs. Software At Risk of Reversal
US Healthcare Providers Vs. Software At Risk of Reversal
Chart 7A Potential Switching Point From Tobacco Into Cannabis
A Potential Switching Point From Tobacco Into Cannabis
A Potential Switching Point From Tobacco Into Cannabis
Chart 8Biotech Is A Major Buy
Biotech Is A Major Buy
Biotech Is A Major Buy
Chart 9CAD/SEK Reversal Has Started
CAD/SEK Reversal Has Started
CAD/SEK Reversal Has Started
Chart 10Financials Versus Industrials To Reverse
Financials Versus Industrials To Reverse
Financials Versus Industrials To Reverse
Chart 11Norway's Outperformance Could End
Norway's Outperformance Could End
Norway's Outperformance Could End
Chart 12Greece's Brief Outperformance To End
Greece's Brief Outperformance To End
Greece's Brief Outperformance To End
Chart 13BRL/NZD At A Resistance Point
BRL/NZD At A Resistance Point
BRL/NZD At A Resistance Point
Chart 14The Outperformance Of Resources Versus Healthcare Is Vulnerable To Reversal
The Outperformance Of Resources Versus Healthcare Is Vulnerable To Reversal
The Outperformance Of Resources Versus Healthcare Is Vulnerable To Reversal
Chart 15The Outperformance Of Resources Versus Biotech Has Started To Reverse
The Outperformance Of Resources Versus Biotech Has Started To Reverse
The Outperformance Of Resources Versus Biotech Has Started To Reverse
Chart 16Cotton's Outperformance Is Vulnerable To Reversal
Cotton's Outperformance Is Vulnerable To Reversal
Cotton's Outperformance Is Vulnerable To Reversal
Chart 17US Homebuilders' Underperformance Has Reached A Potential Turning Point
US Homebuilders' Underperformance Has Reached A Potential Turning Point
US Homebuilders' Underperformance Has Reached A Potential Turning Point
Chart 18Switzerland's Outperformance Vs. Germany Has Started To End
Switzerland's Outperformance Vs. Germany Has Started To End
Switzerland's Outperformance Vs. Germany Has Started To End
Chart 19The Rally In USD/EUR Could End
The Rally In USD/EUR Could End
The Rally In USD/EUR Could End
Chart 20The Outperformance Of MSCI Hong Kong Versus China Is Vulnerable To Reversal
The Outperformance Of MSCI Hong Kong Versus China Is Vulnerable To Reversal
The Outperformance Of MSCI Hong Kong Versus China Is Vulnerable To Reversal
Chart 21A Potential New Entry Point Into Petcare
A Potential New Entry Point Into Petcare
A Potential New Entry Point Into Petcare
Chart 22FTSE100 Outperformance Vs. Euro Stoxx 50 Vulnerable To Reversal
FTSE100 Outperformance Vs. Euro Stoxx 50 Vulnerable To Reversal
FTSE100 Outperformance Vs. Euro Stoxx 50 Vulnerable To Reversal
Chart 23Netherlands Underperformance Vs. Switzerland Close To Exhaustion
Netherlands Underperformance Vs. Switzerland Close To Exhaustion
Netherlands Underperformance Vs. Switzerland Close To Exhaustion
Dhaval Joshi Chief Strategist dhaval@bcaresearch.com Fractal Trading System Fractal Trades
Central Bank ‘Railway Timetables’ Are Dragging Us Into Recession
Central Bank ‘Railway Timetables’ Are Dragging Us Into Recession
Central Bank ‘Railway Timetables’ Are Dragging Us Into Recession
Central Bank ‘Railway Timetables’ Are Dragging Us Into Recession
6-Month Recommendations Structural Recommendations Closed Fractal Trades Indicators To Watch - Bond Yields Chart II-1Indicators To Watch - Bond Yields - Euro Area
Indicators To Watch - Bond Yields - Euro Area
Indicators To Watch - Bond Yields - Euro Area
Chart II-2Indicators To Watch - Bond Yields - Europe Ex Euro Area
Indicators To Watch - Bond Yields - Europe Ex Euro Area
Indicators To Watch - Bond Yields - Europe Ex Euro Area
Chart II-3Indicators To Watch - Bond Yields - Asia
Indicators To Watch - Bond Yields - Asia
Indicators To Watch - Bond Yields - Asia
Chart II-4Indicators To Watch - Bond Yields - Other Developed
Indicators To Watch - Bond Yields - Other Developed
Indicators To Watch - Bond Yields - Other Developed
Indicators To Watch - Interest Rate Expectations Chart II-5Indicators To Watch - Interest Rate Expectations
Indicators To Watch - Interest Rate Expectations
Indicators To Watch - Interest Rate Expectations
Chart II-6Indicators To Watch - Interest Rate Expectations
Indicators To Watch - Interest Rate Expectations
Indicators To Watch - Interest Rate Expectations
Chart II-7Indicators To Watch - Interest Rate Expectations
Indicators To Watch - Interest Rate Expectations
Indicators To Watch - Interest Rate Expectations
Chart II-8Indicators To Watch - Interest Rate Expectations
Indicators To Watch - Interest Rate Expectations
Indicators To Watch - Interest Rate Expectations
Highlights Several factors point to both an improvement and a deterioration in economic and financial market conditions, underscoring that the 6- to 12-month investment outlook is unavoidably uncertain. On the one hand, the US will likely avoid a recession over the coming year, slowing headline inflation will boost real wages and lower the equity risk premium, bond yields will not move much higher this year, and US services spending will support consumption as the pandemic continues to recede in importance. These are positive factors that will work to support economic activity and risky asset prices. On the other hand, the US will likely experience a recession scare focused on the housing market, the European economy may contract, Omicron’s spread in China threatens a further rise in shipping costs and a trade shock for Europe, and US inflation expectations may unanchor despite a falling inflation rate. For now, investors should remain minimally-overweight stocks over a 6- to 12-month time horizon, although that assessment may change in either a bullish or bearish direction over the coming several months. Within a global equity allocation, we recommend that investors maintain a neutral regional stance. The larger risk of a recession in Europe than in the US would normally imply that investors should be overweight US stocks, but euro area stocks have already underperformed global stocks significantly since Russia’s invasion of Ukraine. Within a fixed-income portfolio, we recommend that investors maintain a modestly short duration stance despite our forecast that long-maturity bond yields will not increase much this year. More nimble investors should be neutral duration, and should test a long stance if US data releases begin to exhibit meaningfully negative surprises. The US dollar is likely to strengthen over the near term, but we expect it to be lower a year from today. The Scourge Of Harry Truman US President Truman famously lamented the need for “one-handed” economists. His complaint reflected how essential it is for economic policymakers to receive clear advice about the best path forward. Investors understandably have even less tolerance for ambiguity than Truman did about the macro landscape and the attendant investment implications. However, there are times when the economic and financial market outlook is unavoidably uncertain. The current economic and geopolitical environment easily qualifies as one of those instances. Several factors point to both an improvement and a deterioration in economic and financial market conditions, which we review in detail below. The likely avoidance of a recession in the US over the coming year suggests that investors should remain minimally-overweight stocks over a 6- to 12-month time horizon, although that assessment may change in either a bullish or bearish direction over the coming several months. What Could Go Right The US Will Likely Avoid A Recession Over The Coming Year Chart I-1The Odds Of A US Recession Are Currently Low
The Odds Of A US Recession Are Currently Low
The Odds Of A US Recession Are Currently Low
We downgraded our odds of an above-trend 2022 growth scenario in last month’s report,1 but noted that a stagflation-lite environment of below-trend growth and above-target inflation was a more likely outcome than recession. We based this assessment on our view that the US neutral rate of interest is likely higher than the Fed and investors expect, which we discussed at length in past reports.2 Chart I-1 highlights that our recession probability indicator also supports this view, as it does not yet signal that a recession is on the horizon.3 Table I-1 highlights the components of the model (which is significantly influenced by the Conference Board’s LEI), and shows that the model is not providing a meaningful warning signal. The Fed funds rate component of the model will likely flash red next month following the FOMC meeting, and we have listed it as providing a warning signal in Table I-1. But rising rates themselves have not proven to be a particularly timely indicator of a recession; this is similarly true with rising inflation expectations and oil prices. We noted in last month’s report that a surge in oil prices has not been an especially consistent indicator of a recession since 2000. Table I-1The Components Of Our Recession Model Are Not Yet Flashing A Warning Sign
May 2022
May 2022
The yield curve component of the model is based on the spread between the 10-year Treasury yield and the 3-month T-bill yield in order to minimize false recession signals, and we agree that the 10-year / 2-year spread has better leading properties. But even the latter curve measure has recently moved back into positive territory (Chart I-2), which will certainly qualify as a false yield curve signal if a recession is avoided over the coming 18 months. Within the components of the Conference Board’s LEI, Table I-1 highlights that there have been signs of weakness from the manufacturing sector, consumer expectations, and the credit market. Chart I-3 aggregates the deviation of six of these components from their trend, and shows that they have indeed been consistent with a significant slowdown in economic activity. Chart I-2The 2/10 Yield Curve Is No Longer Inverted
The 2/10 Yield Curve Is No Longer Inverted
The 2/10 Yield Curve Is No Longer Inverted
Chart I-3The Weakest Components Of The Conference Board's LEI Are Not Yet Signaling A Recession
The Weakest Components Of The Conference Board's LEI Are Not Yet Signaling A Recession
The Weakest Components Of The Conference Board's LEI Are Not Yet Signaling A Recession
However, two caveats are warranted. First, part of this weakness reflects the ongoing shift from goods to services spending, unraveling the massive surge in goods spending that occurred during the pandemic (Chart I-4). Second, Chart I-3 highlights that similar weaknesses occurred in the past outside of the context of a recession, most notably in 1995/1996, in the aftermath of the 1994 bond market crisis; in 1998/1999, following the Long-Term Capital Management (LTCM) crisis; in 2015, following the collapse in oil prices; and, finally, in 2018/2019, in response to the Trump administration’s trade war. None of these instances resulted in a contraction in output. Headline Inflation Is Likely To Come Down Headline consumer price inflation is currently extremely high in the US. Rising prices do not just reflect energy, food, or pandemic-related effects. Chart I-5 highlights that trimmed mean CPI and PCE inflation rates have accelerated significantly since last summer, and are currently running at 6% and 3.6% year-over-year rates, respectively. Chart I-4Part Of The Weakness In Manufacturing Activity Indicators Reflects A Shift In Spending From Goods To Services
Part Of The Weakness In Manufacturing Activity Indicators Reflects A Shift In Spending From Goods To Services
Part Of The Weakness In Manufacturing Activity Indicators Reflects A Shift In Spending From Goods To Services
Chart I-5There Is More To High Inflation Than Food, Energy, And Pandemic-Related Effects...
There Is More To High Inflation Than Food, Energy, And Pandemic-Related Effects...
There Is More To High Inflation Than Food, Energy, And Pandemic-Related Effects...
However, it seems likely that inflation has peaked in the US (or is about to do so), even abstracting from base effects.Chart I-6 highlights that the one-month rate of change in trimmed mean measures seemingly peaked in October and January, and shows that the level of used car prices also appears to be trending lower (panel 2). The ongoing shift away from goods to services spending noted above will also push core ex-COVID-related consumer prices lower. Finally, BCA’s Commodity & Energy strategy service is forecasting that Brent crude oil prices will average roughly $90/bbl for the remainder of the year, which would likely bring US gasoline prices back toward $3.50/gallon and will lower both headline inflation and energy passthrough effects to core prices (Chart I-7). Chart I-6... But The Rate Of Headline Inflation Has Likely Peaked
... But The Rate Of Headline Inflation Has Likely Peaked
... But The Rate Of Headline Inflation Has Likely Peaked
Chart I-7Our Forecast For Oil Implies US Gasoline Prices Will Fall
Our Forecast For Oil Implies US Gasoline Prices Will Fall
Our Forecast For Oil Implies US Gasoline Prices Will Fall
A meaningful deceleration in inflation will help reverse some of the recent decline in real wage growth that has occurred, and will likely lower the equity risk premium (see Section 2 of this month’s report). Long-Maturity Bond Yields Will Not Move Much Higher This Year Chart I-8Our Inflation Probability Model Is Signaling Core Inflation That Is Roughly In Line With The Fed's Latest Forecast
Our Inflation Probability Model Is Signaling Core Inflation That Is Roughly In Line With The Fed's Latest Forecast
Our Inflation Probability Model Is Signaling Core Inflation That Is Roughly In Line With The Fed's Latest Forecast
Chart I-8 highlights that our inflation probability model is currently signaling core PCE inflation of roughly 4.3% over the coming year. This is only moderately above the Fed’s forecast for this year, suggesting that a moderation in the rate of inflation makes it more likely that the Fed will raise rates in line with, or only moderately above, what was projected in the March Summary of Economic Projections (1.9% by the end of this year, and 2.8% by the end of 2023). By contrast, Chart I-9 highlights that the OIS curve is pricing the Fed funds rate at 80 basis points higher by the end of this year than what the Fed projected in March, suggesting that the bar for further hawkish surprises is quite high. We agree that the Fed will likely front-load a good portion of its planned tightening this year, and we agree that a 50 basis point hike is likely next month and also possibly in June. However, it is quite possible that the Fed will ultimately raise rates over the coming year at a slower pace than investors currently anticipate, which would lower yields at the front end of the curve. Chart I-9The Bar For Further Hawkish Surprises From The Fed Is Quite High
May 2022
May 2022
If short-maturity yields are flat or trend modestly lower over the coming year, then a significant further rise in long-maturity yields would likely necessitate a major shift in neutral rate expectations on the part of investors or the Fed. We believe that such a shift will eventually occur, as the economic justification for long-maturity bond yields well below trend rates of economic growth disappeared in the latter half of the last economic expansion. However, we noted in last month’s Special Report that a low neutral rate outlook has become entrenched in the minds of investors and the Fed, and is only likely to change once the Fed funds rate rises meaningfully and a recession does not materialize.4 BCA’s fixed-income team currently recommends that investors maintain a neutral duration stance; the Bank Credit Analyst service is more inclined to recommend a modestly short stance. However, the key point for investors is that another significant rise in long-maturity bond yields is unlikely over the coming year, which is positive for economic activity and investor sentiment. The Pandemic Will Recede In Importance, Supporting Services Spending Chart I-10COVID Hospitalizations And Deaths Remain Low In The DM World
COVID Hospitalizations And Deaths Remain Low In The DM World
COVID Hospitalizations And Deaths Remain Low In The DM World
While the pandemic is clearly not over in China (discussed below), it is likely to continue to recede in importance in the US and other highly vaccinated, and relatively highly exposed DM economies. Despite the fact that confirmed cases of COVID-19 have risen in the DM world in March and April, Chart I-10 highlights that there has been very little increase in ICU patients or deaths. A recent study from the US CDC suggests that 58% of the US population overall and more than 75% of younger children have been infected with the SARS-COV-2 virus since the start of the pandemic.5 When combined with a vaccination rate close to 70%, that signals an extraordinarily high national immunity to severe illness from the disease. Chart I-11 also highlights that deliveries of Pfizer’s Paxlovid continue to climb in the US, a drug that seemingly works against all known variants and has been found to reduce hospitalizations from COVID significantly if taken within the first five days of symptoms. Given that the decline in services spending that we showed in Chart I-4 has been clearly linked to the pandemic, we expect that a slowing pandemic will continue to support services spending. Goods spending is normally a more forceful driver of economic activity than is the case for services spending, but the magnitude of the recent contribution to growth from services spending has been absolutely unprecedented in the post-World War II economic environment (Chart I-12). This underscores that a continued recovery in services spending relative to its pre-pandemic trend will provide a ballast to overall consumer spending as goods spending continues to normalize. Chart I-11Paxlovid To The Rescue!
Paxlovid To The Rescue!
Paxlovid To The Rescue!
Chart I-12Real Services Spending Will Continue To Be A Forceful Driver Of US Economic Activity
Real Services Spending Will Continue To Be A Forceful Driver Of US Economic Activity
Real Services Spending Will Continue To Be A Forceful Driver Of US Economic Activity
What Could Go Wrong The US Will Likely Experience A Recession Scare Chart I-13US Housing Affordability Has Cratered, In Large Part Due To Surging House Prices
US Housing Affordability Has Cratered, In Large Part Due To Surging House Prices
US Housing Affordability Has Cratered, In Large Part Due To Surging House Prices
Despite our view that the US economy will avoid a recession over the coming year, it seems likely that investors will experience a recession scare at some point over the coming 6 to 12 months. Even though it has recently moved back into positive territory, the inversion of the 2-10 yield curve has set the scene for a recessionary overtone to any visible weakness in the US macro data over the coming months. We noted above that the manufacturing and goods-producing sectors of the US economy are likely to slow as spending returns to services. More importantly, the extremely sharp increase in mortgage rates will likely cause at least a temporary slowdown in US housing activity, even if that slowdown does not ultimately prove to be contractionary.Chart I-13 highlights that the recent increase in mortgage rates will cause US housing affordability to deteriorate back to 2007 levels. While rising mortgage rates will be the proximate cause of this deterioration in affordability, panel 2 highlights that the real culprit has been a significant increase in house prices relative to income. There is strong evidence pointing to the fact that US real residential investment has been too weak since the global financial crisis (GFC).6 We agree that high prices will likely spur additional housing construction (which will support growth). But over the nearer-term, the sharp deterioration in affordability may imply that house price appreciation will have to fall below the rate of income growth, which would represent a very sharp correction in house price gains that would almost assuredly appear recessionary for a time. The European Economy May Contract We have discussed the risk of a European recession in past reports, and noted that it would be almost certain to occur in a scenario in which Russia’s energy exports to Europe were to be completely cut off. We continue to see this as an unlikely scenario, although the odds have increased significantly of late in light of Russia’s halt of gas supplies to Bulgaria and Poland and Germany’s apparent acceptance of an oil embargo against Russia. However, Chart I-14 highlights that a recession, at least a technical one, may occur in Germany even if its imports of Russian natural gas are not interrupted. The chart shows that the German IFO business climate indicator for manufacturing has deteriorated more than the Markit PMI has, and panel 2 highlights that IFO-reported service sector sentiment is considerably worse than what was suggested by the Markit services PMI. Chart I-15 highlights that European stocks are not fully priced for a European recession, either in relative or absolute terms. This underscores the risk to global equities if real euro area growth falls meaningfully below current consensus expectations of 1.9% this year. Chart I-14German Business Sentiment Suggests A Possible Recession
German Business Sentiment Suggests A Possible Recession
German Business Sentiment Suggests A Possible Recession
Chart I-15Euro Area Stocks Are Not Fully Priced For A European Recession
Euro Area Stocks Are Not Fully Priced For A European Recession
Euro Area Stocks Are Not Fully Priced For A European Recession
Omicron Will Continue To Spread In China Table I-2The Ports Of Shanghai and Ningbo Are Quite Important To Chinese Trade Flows
May 2022
May 2022
Confirmed cases of COVID-19 have surged in China over the past two months, and it is now clear that the country’s zero-tolerance policy will fail to contain the spread of the disease. We initially downgraded the odds of our above-trend growth scenario in our January report specifically in response to the risk that the Omicron variant of the virus posed to China.7 That risk that is now manifesting itself most acutely in Shanghai, but also increasingly in other coastal and northeastern provinces. Chart I-16COVID Restrictions In China Are Causing Significant Delays In Suppliers' Delivery Times
COVID Restrictions In China Are Causing Significant Delays In Suppliers' Delivery Times
COVID Restrictions In China Are Causing Significant Delays In Suppliers' Delivery Times
China’s COVID surge has two implications for the global economic and financial market outlook. The first is that the surge has led to increased port congestion and shipping delays, which clearly threaten to cause a further rise in global shipping costs. We have noted in past reports that shipping costs from China to the West Coast of the US surged following the one month shutdown of the port of Yantian last year. Table I-2 highlights that the ports of Shanghai and nearby Ningbo handle nearly 30% of China’s total ocean shipping volume. Chart I-16 highlights that road traffic restrictions in the Yangtze River Delta have caused significant delays in suppliers’ delivery times, further raising the risk of bottlenecks that may take months to clear. Chart I-17China's Battle With Omicron Further Raises The Risk Of A Euro Area Recession
China's Battle With Omicron Further Raises The Risk Of A Euro Area Recession
China's Battle With Omicron Further Raises The Risk Of A Euro Area Recession
The second implication of China’s COVID surge is that China’s contribution to global growth is at risk of declining significantly further, at least for a time. If Chinese economic activity slows sharply in response to the lockdowns and a further spread of the disease, we fully expect Chinese policymakers to provide further stimulus to support household income in line with what occurred in DM countries two years ago. In addition, some investors have argued that reduced commodity demand from China is actually desirable in the current environment, as it would further reduce inflationary pressure in the US and other developed economies. However, Chart I-17 highlights that Chinese import growth has already slowed very significantly, which has clearly impacted euro area exports. European exports to China are not predominantly commodity-based, and it is yet unclear whether the form of stimulus that Chinese policymakers will introduce will be particularly import-intensive. As such, China’s failure to contain Omicron further adds to the risk of the European recession we noted above, and threatens our view that US headline inflation will trend lower this year. Inflation Expectations May Unanchor Despite Slowing Inflation We discussed above that US inflation will decelerate this year and that this may allow the Fed to raise interest rates at a slower pace than currently expected by market participants. One risk to this view is the possibility that inflation expectations may unanchor to the upside, despite an easing in inflation. Even though inflation expectations have not trended in a different direction than actual inflation since the GFC, Chart I-18 highlights that this has occurred in the past (from 2001-2006). In our view, the level of inflation that is likely to prevail over the coming two years will be an extremely important determinant of whether inflation expectations break above their post-2000 range. For now, Chart I-18 highlights that the Fed’s expectation for core inflation this year is reasonable, but it remains an open question whether core inflation will decelerate below 3% next year as the Fed is forecasting. This is notable, because US core PCE inflation peaked at a rate of 2.6% during the 2002-2007 economic expansion, which is the period when stable long-dated inflation expectations were prevalent. Chart I-19 highlights that market-based inflation expectations are currently challenging or have risen above their 2004-2014 average. We noted in last month’s report that long-dated household inflation expectations will be historically low, even if inflation decelerates in line with what near-dated CPI swaps are forecasting. Chart I-18Inflation Expectations May Still Unanchor Even If The Inflation Rate Comes Down
Inflation Expectations May Still Unanchor Even If The Inflation Rate Comes Down
Inflation Expectations May Still Unanchor Even If The Inflation Rate Comes Down
Chart I-19Market-Based Inflation Expectations May Soon Rise Above Pre-GFC Range
Market-Based Inflation Expectations May Soon Rise Above Pre-GFC Range
Market-Based Inflation Expectations May Soon Rise Above Pre-GFC Range
The bottom line for investors is that a slowing of inflation over the coming several months may not be enough to prevent long-term inflation expectations from rising. That raises the risk of an even more aggressive pace of interest rates than currently expected by investors, because the Fed is determined to avoid repeating the mistakes of the 1970s when rising inflation expectations led to a wage-price spiral that required years of comparatively tight monetary policy to correct. By contrast, the Fed will view a temporary income-statement recession stemming from a sharp rise in interest rates as the lesser of two evils. A recession to prevent a long-lasting wage-price spiral would also probably be better for investors over the longer run, but a recession would clearly imply a significant decline in risky asset prices at some point over the coming two years were it to occur. Investment Conclusions Chart I-20Despite The Risks Facing Europe, Euro Area Stocks Are Not A Clear Underweight Candidate
Despite The Risks Facing Europe, Euro Area Stocks Are Not A Clear Underweight Candidate
Despite The Risks Facing Europe, Euro Area Stocks Are Not A Clear Underweight Candidate
From the perspective of allocating to risky assets, the most important question for investors to answer is whether the US is likely to experience a recession over the coming year. As we noted above, in our view the answer is “no”, which implies that US earnings growth will remain positive and that investors should not be underweight stocks within a global multi-asset portfolio. It is true that earnings can decline outside of the context of a recession, but we discuss in Section 2 of our report that this has almost always been associated with a significant contraction in profit margins. The factors that have historically been associated with a nonrecessionary decline in profit margins may occur later this year, but our indicators so far point more to flat margins rather than a significant decline. For now, investors should remain minimally-overweight stocks over a 6 to 12 month time horizon, although that assessment may change in either a bullish or bearish direction over the coming several months. Within a global equity allocation, we recommend that investors maintain a neutral regional allocation. The larger risk of a recession in Europe than in the US would normally imply that investors should be overweight US stocks, but euro area stocks have already underperformed global stocks significantly since Russia’s invasion of Ukraine. Chart I-15 highlighted that they will underperform further if euro area growth turns negative. It is not clear, however, if that risk warrants an underweight stance today, especially considering the enormous valuation advantage offered by euro area stocks versus their US counterparts and the fact that the euro has already fallen to a five-year low (Chart I-20). Chart I-21Favor A Neutral Stance Towards Cyclical Stocks Versus Defensives
Favor A Neutral Stance Towards Cyclical Stocks Versus Defensives
Favor A Neutral Stance Towards Cyclical Stocks Versus Defensives
Within the dimensions of the equity market, Chart I-21 highlights that the outperformance of cyclicals versus defensives was already late at the onset of Russia’s invasion of Ukraine, and that the uptrend in relative performance has seemingly ended. Still, a moderately overweight stance toward stocks overall does not especially support an underweight stance toward cyclicals; therefore, we recommend a neutral stance over the coming year. We continue to recommend that investors (modestly) favor value stocks over growth stocks on the basis of better value and as a hedge against potentially higher long-maturity yields, although we acknowledge that most of the outsized outperformance of growth stocks during the pandemic has already reversed. Despite their recent underperformance, we continue to favor global small-cap stocks over their large-cap peers, as they are now unequivocally inexpensive and have seemingly already priced in a likely recession scare in the US later this year (Chart I-22). Within a fixed-income portfolio, we recommend that investors maintain a modestly short duration stance despite our forecast that long-maturity bond yields will not increase much this year. We are wary of recommending a neutral duration stance given the possibility that investors or the Fed may upwardly revise their neutral rate expectations earlier than we anticipate; however, investors are also likely to see long-maturity yields come down for a time in response to a housing market slowdown over the coming several months. More nimble investors should be neutral duration, and should test a long stance if US data releases begin to exhibit meaningfully negative surprises. Finally, while we are bearish toward the dollar on a 6- to 12-month time horizon, it is likely to strengthen over the near term. Chart I-23 highlights that our composite technical indicator for the US dollar is now clearly in overbought territory. We expect that a downtrend will begin once the war in Ukraine reaches a durable conclusion and clarity about the economic impact of the spread of Omicron in China – and the likely policy response – emerges. Chart I-22The Selloff In Small Caps Seems Overdone
The Selloff In Small Caps Seems Overdone
The Selloff In Small Caps Seems Overdone
Chart I-23US Dollar And Indicator The Dollar Is Ripe For A Major Pullback Beyond Likely Near-Term Strength
US Dollar And Indicator The Dollar Is Ripe For A Major Pullback Beyond Likely Near-Term Strength
US Dollar And Indicator The Dollar Is Ripe For A Major Pullback Beyond Likely Near-Term Strength
Jonathan LaBerge, CFA Vice President The Bank Credit Analyst April 28, 2022 Next Report: May 26, 2022 II. The US Equity Market: A Fundamental, Technical, And Value-Based Review All four of our US Equity indicators are currently pointing in a bearish direction. Our Monetary Indicator has fallen to a three decade low, our Technical Indicator has broken into negative territory, our Valuation Indicator still signals extreme equity pricing, and our Speculation Indicator does not yet support a contrarian buy signal. Still, we do not expect a US recession over the coming year, which implies that S&P 500 revenue growth will stay positive. Nonrecessionary earnings contractions are rare, and are almost always associated with a significant contraction in profit margins. Our new profit margin warning indicator currently suggests the odds of falling margins are low, although the risks may rise later this year. Stocks are extremely expensive, but rich valuations are being driven by extremely low real bond yields, rather than investor exuberance. Valuation is unlikely to impact US stock market performance significantly over the coming year unless long-maturity bond yields rise substantially further. Technical analysis of stock prices has a long and successful history at boosting investment performance, which ostensibly suggests that investors should be paying more attention to technical conditions in the current environment. However, technical trading rules have been less helpful in expansionary environments when inflation is above average and when stock prices and bond yields are less likely to be positively correlated (as is currently the case). As such, the recent technical breakdown of the US equity market may simply reflect a reduced signal-to-noise ratio associated with these economic and financial market regimes. For now, we see our indicators as supportive of a cautious, minimally-overweight stance toward stocks within a multi-asset portfolio over the coming 6 to 12 months. Rising odds of a recession, declining profit margins, and a large increase in investor or Fed expectations for the neutral rate of interest are the most significant threats to the equity market, the risks of which should be monitored closely by investors. In Section 1 of our report, we reviewed why a recession in the US is unlikely over the coming 6 to 12 months. However, we also highlighted that the risks to the economic outlook are meaningful and that an aggressively overweight stance toward risky assets is currently unwarranted. During times of significant uncertainty, investors should pay relatively more attention to long-term economic and financial market indicators with a reliable track record. In this report we begin by briefly reviewing the message from our US Equity Indicators, and then turn to a deeper examination of the top-down outlook for earnings, the determinants of rich valuation in the US stock market, and whether investors should rely on technical indicators in the current environment. We conclude that, while an indicator-based approach is providing mixed signals about the US equity market, we generally see our indicators as supportive of a cautious, minimally-overweight stance toward stocks within a multi-asset portfolio. Aside from tracking the risk of a recession, investors should be closely attuned to signs of a contraction in profit margins or shifting neutral rate expectations as a basis to reduce equity exposure to below-benchmark levels. A Brief Review Of Our US Equity Indicators Chart II-1Our Equity Indicators Are Pointing In A Bearish Direction
Our Equity Indicators Are Pointing In A Bearish Direction
Our Equity Indicators Are Pointing In A Bearish Direction
Chart II-1 presents our US Equity Indicators, which we update each month in Section 3 of our report. We highlight our observations below: Chart II-1 shows that our Monetary Indicator has fallen to its lowest level since 1995, when the Fed surprised investors and shifted rapidly in a hawkish direction. The indicator is most acutely impacted by the speed of the rise in 10-year Treasury yields and a massive surge in the BCA Short Rate Indicator to levels that have not prevailed since the late 1970s (Chart II-2). Our Technical Indicator has recently broken into negative territory, which we have traditionally interpreted as a sign to sell stocks. The indicator has been dragged lower by a deterioration in stock market breadth across several tracked measures and by weak sentiment (Chart II-3). The momentum component of the indicator is fractionally positive but is exhibiting clear weakness. Our Valuation Indicator continues to highlight that US equities are extremely overvalued relative to their history, despite the recent sell-off in stock prices. Our Speculation Indicator arguably provides the least negative signal of our four indicators, at least from a contrarian perspective. In Q1 2021, the indicator nearly reached the all-time high set in March 2000, but it has since retreated significantly and has exited extremely speculative territory. While this may eventually provide a positive signal for stocks, equity returns have historically been below average during months when the indicator declines. Thus, the downtrend in the Speculation Indicator still points to weakness in stock prices, at least over the nearer term. Chart II-2Our Monetary Indicator Is Falling In Part Because Of Surging Interest Rate Expectations
Our Monetary Indicator Is Falling In Part Because Of Surging Interest Rate Expectations
Our Monetary Indicator Is Falling In Part Because Of Surging Interest Rate Expectations
Chart II-3All Three Components Of Our Technical Indicator Are Falling
All Three Components Of Our Technical Indicator Are Falling
All Three Components Of Our Technical Indicator Are Falling
In summary, all four of our US Equity indicators are currently pointing in a bearish direction, which clearly argues against an aggressively overweight stance favoring equities within a multi-asset portfolio. At the same time, we reviewed the odds of a US recession over the coming year in Section 1 of our report and argued that a recession is not likely over the coming 12 months. Thus, one key question for investors is whether a nonrecessionary contraction in earnings is likely over the coming year. We address this question in the next section of our report, before turning to a deeper examination of the relative importance of equity valuation and technical indicators. Gauging The Risk Of A Nonrecessionary Earnings Contraction Chart II-4Nonrecessionary Earnings Declines Usually Occur Due To Falling Margins
Nonrecessionary Earnings Declines Usually Occur Due To Falling Margins
Nonrecessionary Earnings Declines Usually Occur Due To Falling Margins
Based on S&P data, there have been five cases since 1960 when 12-month trailing earnings per share fell year-over-year, while the economy continued to expand (Chart II-4). Sales per share growth remained positive in four of these cases (panel 2), underscoring that falling profit margins have been mostly responsible for these nonrecessionary earnings declines. We have noted our concern about how elevated US profit margins have become and have argued that a significant further expansion is not likely to occur over the coming 12-24 months.8 To gauge the risk of a sizeable decline in margins over the coming year, we construct a new indicator based on the seven instances when S&P 500 margins fell outside the context of a recession. This includes two cases when margins fell but earnings did not (because of buoyant revenue growth). We based the indicator on these five factors: Changes in unit labor cost growth to measure the impact of wage costs on firm profitability; Lagging changes in commodity prices as a proxy for material costs; The level of real short-term interest rates as a proxy for borrowing costs; Changes in a sales growth proxy to measure the impact of operating leverage on margins; And changes in the ISM manufacturing index to capture any residual impact on margins from the business cycle. Chart II-5The Odds Of A Nonrecessionary Profit Margin Contraction Are Currently Low
The Odds Of A Nonrecessionary Profit Margin Contraction Are Currently Low
The Odds Of A Nonrecessionary Profit Margin Contraction Are Currently Low
Chart II-5 presents the indicator, which is shaded both for recessionary periods and the seven nonrecessionary margin contraction episodes we identified. While the indicator does not perfectly predict margin contractions outside of recessions, it did signal 50% or greater odds of a margin contraction in four of the seven episodes we examined, and signals high odds of a contraction in margins during recessions. Among the three cases in which the indicator failed to indicate falling margins during an expansion, two of those failures were episodes when earnings growth did not ultimately contract. The inability to explain the 1997-1998 margin contraction is the most relevant failure of the indicator, in addition to two false signals in 1963 and 1988. Still, the approach provides a useful framework to gauge the risk of falling profit margins, and the results provide an interesting and somewhat surprising message about the relative importance of the factors we included. We would have expected that accelerating wages would have been the most significant factor explaining nonrecessionary profit margin declines. Wages were highly significant, but they were the second most important factor behind our sales growth proxy. Lagged commodity prices were the third most significant factor, followed by real short-term interest rates. Changes in the ISM manufacturing index were least significant, underscoring that our sales growth proxy already captures most of the effect of the business cycle on profit margins. This suggests that operating leverage is an important determinant of margins during economic expansions, and that investors should be most concerned about declining profit margins when both revenue growth is slowing significantly and wage growth is accelerating. The indicator currently points to low odds of a nonrecessionary margin contraction, but this is likely to change over the coming year. We expect that all five of the factors will evolve in a fashion that is negative for margins over the coming twelve months: While the pace of its increase is slowing, median wage growth continues to accelerate, even when adjusting for the fact that 1st quartile wage growth is growing at an above-average rate (Chart II-6). Combining the latter with higher odds of at or below-trend growth this year implies that unit labor costs may rise further over the coming twelve months. Analysts expect S&P 500 revenue growth to slow nontrivially over the coming year (Chart II-7). Current expectations point to growth slowing to a level that would still be quite strong relative to what has prevailed over the past decade; however, accelerating wage costs in lockstep with decelerating revenue growth is exactly the type of combination that has historically been associated with falling margins during economic expansions. Chart II-6Wage Growth Is Accelerating...
Wage Growth Is Accelerating...
Wage Growth Is Accelerating...
Chart II-7...And Revenue Growth Is Set To Slow
...And Revenue Growth Is Set To Slow
...And Revenue Growth Is Set To Slow
Although these are less impactful factors, the lagged effect of the recent surge in commodity prices will also weigh on margins over the coming year, as will rising real interest rates and a likely slowdown in manufacturing activity in response to slower goods spending. In addition to our new indicator, we have two other tools at our disposal to track the odds of a decline in profit margins over the coming year. First, Chart II-8 illustrates that an industry operating margin diffusion index does a decent job at leading turning points in S&P 500 profit margins, despite its volatility. And second, Chart II-9 highlights that changes in the sales and profit margin diffusion indexes sourced from the Atlanta Fed’s Business Inflation Expectations Survey have predicted turning points in operating sales per share and margins over the past decade. Chart II-9 does suggest that profit margins may not rise further, but flat margins are not likely to be a threat to earnings growth over the coming year if a recession is avoided (as we expect). Chart II-8Sector Diffusion Indexes Are Not Signaling A Major Warning Sign For Margins...
Sector Diffusion Indexes Are Not Signaling A Major Warning Sign For Margins...
Sector Diffusion Indexes Are Not Signaling A Major Warning Sign For Margins...
Chart II-9...Neither Are The Atlanta Fed Business Sales And Margin Diffusion Indexes
...Neither Are The Atlanta Fed Business Sales And Margin Diffusion Indexes
...Neither Are The Atlanta Fed Business Sales And Margin Diffusion Indexes
The conclusion for investors is that the odds of a decline in profit margins over the coming year are elevated and should be monitored, but are seemingly not yet imminent. In combination with expectations for slowing revenue growth, this implies, for now, that earnings growth over the coming year will be low but positive. Valuation, Interest Rates, And The Equity Risk Premium As noted above, our Valuation Indicator continues to highlight that US Equities are extremely overvalued relative to their history. Our Valuation Indicator is a composite of different valuation measures, and we sometimes receive questions from investors asking about the seemingly different messages provided by these different metrics. For example, Chart II-10 highlights that equity valuation has almost, but not fully, returned to late-1990 conditions based on the Price/Earnings (P/E) ratio, but is seemingly more expensive based on the Price/Book (P/B) and especially Price/Sales (P/S) ratios. In our view, this apparent discrepancy is easily resolved. Relative to the P/E ratio, both the P/B and especially P/S ratios are impacted by changes in aggregate profit margins, which have risen structurally over the past two decades because of the rising share of broadly-defined technology companies in the US equity index (Chart II-11). Barring a major shift in the profitability of US tech companies over the coming year, we do not see discrepancies between the P/E, P/B, or P/S ratios as being particularly informative for investors. As an additional point, we also do not see the Shiller P/E or other cyclically-adjusted P/E measures as providing any extra information about the richness or cheapness of US equities today, as these measures tend to move in line with the 12-month forward P/E ratio (Chart II-12). Chart II-10US Equities Are Extremely Overvalued, Based On Several Valuation Metrics
US Equities Are Extremely Overvalued, Based On Several Valuation Metrics
US Equities Are Extremely Overvalued, Based On Several Valuation Metrics
Chart II-11Tech Margins Have Caused Stocks To Look Especially Expensive On A Price/Sales Basis
Tech Margins Have Caused Stocks To Look Especially Expensive On A Price/Sales Basis
Tech Margins Have Caused Stocks To Look Especially Expensive On A Price/Sales Basis
In our view, rather than focusing on different measures of valuation, it is important for investors to understand the root cause of extreme US equity prices, as well as what factors are likely to drive equity multiples over the coming year. As we have noted in previous reports, the reason that US stocks are extremely overvalued today is very different from the reason for similar overvaluation in the late 1990s. Charts II-13 and II-14 present two different versions of the equity risk premium (ERP), one based on trailing as reported earnings (dating back to 1872), and one based on twelve-month forward earnings (dating back to 1979). Chart II-12The Shiller P/E Ratio Does Not Convey Any 'New' Information About Valuation
The Shiller P/E Ratio Does Not Convey Any 'New' Information About Valuation
The Shiller P/E Ratio Does Not Convey Any 'New' Information About Valuation
Chart II-13The Equity Risk Premium Is In Line With Its Historical Average…
The Equity Risk Premium Is In Line With Its Historical Average
The Equity Risk Premium Is In Line With Its Historical Average
The ERP accounts for the portion of equity market valuation that is unexplained by real interest rates, and the charts highlight that the US ERP is essentially in line with its historical average based on both measures, in sharp contrast to the stock market bubble of the late 1990s. This underscores that historically low interest rates well below the prevailing rate of economic growth are the root cause of extreme equity overvaluation in the US (Chart II-15), meaning that very rich pricing can be thought of as “rational exuberance.” Chart II-14…In Sharp Contrast To The Late 1990s
...In Sharp Contrast To The Late 1990s
...In Sharp Contrast To The Late 1990s
Chart II-15US Equities Are Extremely Expensive Because Bond Yields Are Extremely Low
US Equities Are Extremely Expensive Because Bond Yields Are Extremely Low
US Equities Are Extremely Expensive Because Bond Yields Are Extremely Low
Chart II-16The Equity Risk Premium Is Fairly Well Explained By The Misery Index
The Equity Risk Premium Is Fairly Well Explained By The Misery Index
The Equity Risk Premium Is Fairly Well Explained By The Misery Index
Over the longer term, the risks to US equity valuation are clearly to the downside, as we detailed in our October 2021 report.9 But over the coming 6 to 12 months, US equity multiples are likely to be flat or modestly up in the US. As we noted in Section 1 of our report, a significant further rise in long-maturity bond yields will likely necessitate a major shift in neutral rate expectations on the part of investors and the Fed, which we think is more likely a story for next year than this year. And Chart II-16 highlights that the ERP has historically been well explained by the sum of unemployment and inflation (the Misery Index), which should come down over the coming several months as inflation moderates and the unemployment rate remains low. To conclude, it is absolutely the case that US equities are extremely expensive, but this fact is unlikely to impact US stock market performance significantly unless long-maturity bond yields rise substantially further. Technical Analysis Amid A Shifting Economic Regime Technical analysis of financial markets, and especially stocks, has a long history. It has also provided disciplined investors with significant excess returns over time. A simple stock / bond switching rule based on whether stock prices were above their nine-month moving average at the end of the previous month has significantly outperformed since the 1960s, earning an average excess annual return of 1.3% relative to a 60/40 stock/bond benchmark portfolio (Chart II-17). This outsized performance has come at the cost of only a minor increase in portfolio volatility. Ostensibly, then, investors should be paying more attention to equity technical conditions in the current environment, which we noted above are not positive. Our Technical Indicator has recently broken into negative territory, and the S&P 500 has clearly fallen back below its 200-day moving average. However, Chart II-17 presented generalized results over long periods of time. Over the past two decades, investors have been able to rely on a durably negative correlation between stock prices and bond yields to help boost portfolio returns from technically-driven switching rule strategies. Chart II-18 highlights that this correlation has been much lower over the past two years than has been the case since the early 2000s, raising the question of whether similar switching strategies are viable today. In addition, there is the added question of whether technical analysis is helpful to investors during certain types of economic and financial market regimes, such as high inflation environments. Chart II-17Technically-Driven Trading Rules Have Historically Provided Investors With A Lot Of Alpha
Technically-Driven Trading Rules Have Historically Provided Investors With A Lot Of Alpha
Technically-Driven Trading Rules Have Historically Provided Investors With A Lot Of Alpha
Chart II-18Switching-Rule Strategies May Not Work As Well When Stock Prices And Bond Yields Are Not Positively Correlated
Switching-Rule Strategies May Not Work As Well When Stock Prices And Bond Yields Are Not Positively Correlated
Switching-Rule Strategies May Not Work As Well When Stock Prices And Bond Yields Are Not Positively Correlated
To test whether the message from technical indicators may be relied upon today, we examine the historical returns from a technically-driven portfolio switching strategy during nonrecessionary months under four conditions that reflect the economic and political realities currently facing investors: months when both stock and bond returns are negative; months of above-average inflation; months of above-average geopolitical risk; and the 1970s, when the Misery Index was very elevated. In all the cases we consider, the switching rule is simple: whether the S&P 500 index was above its nine-month moving average at the end of the previous month. If so, the rule overweights equities for the subsequent months; if not, the rule overweights a comparatively risk-free asset. We consider portfolios with either 10-year Treasurys or 3-month Treasury bills as the risk-free asset, as well as a counterfactual scenario in which cash always earns a 1% annual rate of return (to mimic the cash returns currently available to investors). Table II-1 presents the success and whipsaw rate of the trading rule. Table II-2 presents the annualized cumulative returns from the strategy. The tables provide three key observations: As reflected in Chart II-17, both Tables II-1 and II-2 highlight that simple technical trading rules have historically performed well, and that outperformance has occurred in both recessionary and nonrecessionary periods. Relative to nonrecessionary periods overall, technical trading rules have underperformed during the particular nonrecessionary regimes that we examined. It is the case not only that these strategies have performed in inferior ways during these regimes, but also that they were less consistent signals in that they generated significantly more “whipsaws” for investors. Among the four nonrecessionary regimes that we tested, technical indicators underperformed the least during periods of above-average geopolitical risk, and performed abysmally during nonrecessionary (but generally stagflationary) months in the 1970s. Table II-1During Expansions, Technically-Driven Switching Rules Underperform…
May 2022
May 2022
Table II-2…When Inflation Is High And When Stocks And Bonds Lose Money
May 2022
May 2022
The key takeaway for investors is that technical analysis is likely to be helpful for investors to improve portfolio performance as we approach a recession but may be less helpful in an expansionary environment in which inflation is above average and when stock prices and bond yields are less likely to be positively correlated. Investment Conclusions Echoing the murky economic outlook that we detailed in Section 1 of our report, our analysis highlights that an indicator-based approach is providing mixed signals about the US equity market. On the one hand, all four of our main equity indicators are currently providing a bearish signal, and the risk of a nonrecessionary contraction in S&P 500 profit margins over the coming year is elevated – albeit seemingly not imminent. On the other hand, our expectation that the US will not slip into recession over the coming year implies that revenue growth will stay positive, which has historically been associated with expanding earnings. In addition, US equity multiples are likely to be flat or modestly up, and the recent technical breakdown in the S&P 500 may simply reflect a reduced signal-to-noise ratio that appears to exist in expansionary environments in which inflation is high and the stock price / bond yield correlation is near-zero or negative. Netting these signals out, we see our equity indicators as supportive of a cautious, minimally-overweight stance toward stocks within a multi-asset portfolio. The emergence of a recession, declining profit margins, and a significant increase in investor or Fed expectations for the neutral rate of interest are the most significant threats to the equity market. We will continue to monitor these risks and adjust our investment recommendations as needed over the coming several months. Stay tuned! Jonathan LaBerge, CFA Vice President The Bank Credit Analyst Gabriel Di Lullo Research Associate III. Indicators And Reference Charts As discussed in this month’s Section 2, BCA’s equity indicators do not paint an optimistic picture for stock prices. Our monetary indicator is at its weakest point in almost three decades, our valuation indicator continues to highlight that stocks are overvalued, and both our sentiment and technical indicators have broken down. An eventual easing in the latter two measures will ultimately prove positive for equities, but this will likely happen only once they reach extremes. Investors should be at most modestly overweight stocks versus bonds over the coming year. Forward equity earnings are likely pricing in too much of an increase in earnings per share over the coming year. Net earnings revisions and net positive earnings surprises have rolled over considerably, although there is no meaningful sign yet of a decline in the level of forward earnings. Earnings growth is more likely than not to be positive over the coming year, but will be modest. Within a global equity portfolio, we recommend a neutral stance towards cyclicals versus defensives, as well as a neutral regional equity stance. Euro area stocks are not a clear underweight candidate despite the risk of a European recession. Within a fixed-income portfolio, the 10-Year Treasury Yield has very little further upside over the coming year, arguing for a modestly short duration stance. We do not believe that the Fed will end up raising rates to a level higher than investors are forecasting over the coming year. Commodity prices continue to rise in a broad-based fashion following Russia’s invasion of Ukraine, and our composite technical indicator highlights that they remain significantly overbought. We expect oil and food prices to come down over the coming year, but there is a risk to that assessment. Russia aggression has very likely sped up Europe’s decarbonization timeline, suggesting that investors should be tactically, cyclically, and structurally bullish on industrial metals prices. US and global LEIs have rolled over from very elevated levels. Our global LEI diffusion index has declined very significantly, but this likely reflects the outsized impact of a few emerging market countries. Leading and coincident indicators remain decently strong, and we do not expect a recession in the US over the coming year. However, the odds of a stagflationary-lite outcome of above-target inflation and at-or-below-trend growth have increased because of the war. EQUITIES: Chart III-1US Equity Indicators
US Equity Indicators
US Equity Indicators
Chart III-2Willingness To Pay For Risk
Willingness To Pay For Risk
Willingness To Pay For Risk
Chart III-3US Equity Sentiment Indicators
US Equity Sentiment Indicators
US Equity Sentiment Indicators
Chart III-4US Stock Market Breadth
US Stock Market Breadth
US Stock Market Breadth
Chart III-5US Stock Market Valuation
US Stock Market Valuation
US Stock Market Valuation
Chart III-6US Earnings
US Earnings
US Earnings
Chart III-7Global Stock Market And Earnings: Relative Performance
Global Stock Market And Earnings: Relative Performance
Global Stock Market And Earnings: Relative Performance
Chart III-8Global Stock Market And Earnings: Relative Performance
Global Stock Market And Earnings: Relative Performance
Global Stock Market And Earnings: Relative Performance
FIXED INCOME: Chart III-9US Treasurys And Valuations
US Treasurys And Valuations
US Treasurys And Valuations
Chart III-10Yield Curve Slopes
Yield Curve Slopes
Yield Curve Slopes
Chart III-11Selected US Bond Yields
Selected US Bond Yields
Selected US Bond Yields
Chart III-1210-Year Treasury Yield Components
10-Year Treasury Yield Components
10-Year Treasury Yield Components
Chart III-13US Corporate Bonds And Health Monitor
US Corporate Bonds And Health Monitor
US Corporate Bonds And Health Monitor
Chart III-14Global Bonds: Developed Markets
Global Bonds: Developed Markets
Global Bonds: Developed Markets
Chart III-15Global Bonds: Emerging Markets
Global Bonds: Emerging Markets
Global Bonds: Emerging Markets
CURRENCIES: Chart III-16US Dollar And PPP
US Dollar And PPP
US Dollar And PPP
Chart III-17US Dollar And Indicator
US Dollar And Indicator
US Dollar And Indicator
Chart III-18US Dollar Fundamentals
US Dollar Fundamentals
US Dollar Fundamentals
Chart III-19Japanese Yen Technicals
Japanese Yen Technicals
Japanese Yen Technicals
Chart III-20Euro Technicals
Euro Technicals
Euro Technicals
Chart III-21Euro/Yen Technicals
Euro/Yen Technicals
Euro/Yen Technicals
Chart III-22Euro/Pound Technicals
Euro/Pound Technicals
Euro/Pound Technicals
COMMODITIES: Chart III-23Broad Commodity Indicators
Broad Commodity Indicators
Broad Commodity Indicators
Chart III-24Commodity Prices
Commodity Prices
Commodity Prices
Chart III-25Commodity Prices
Commodity Prices
Commodity Prices
Chart III-26Commodity Sentiment
Commodity Sentiment
Commodity Sentiment
Chart III-27Speculative Positioning
Speculative Positioning
Speculative Positioning
ECONOMY: Chart III-28US And Global Macro Backdrop
US And Global Macro Backdrop
US And Global Macro Backdrop
Chart III-29US Macro Snapshot
US Macro Snapshot
US Macro Snapshot
Chart III-30US Growth Outlook
US Growth Outlook
US Growth Outlook
Chart III-31US Cyclical Spending
US Cyclical Spending
US Cyclical Spending
Chart III-32US Labor Market
US Labor Market
US Labor Market
Chart III-33US Consumption
US Consumption
US Consumption
Chart III-34US Housing
US Housing
US Housing
Chart III-35US Debt And Deleveraging
US Debt And Deleveraging
US Debt And Deleveraging
Chart III-36US Financial Conditions
US Financial Conditions
US Financial Conditions
Chart III-37Global Economic Snapshot: Europe
Global Economic Snapshot: Europe
Global Economic Snapshot: Europe
Chart III-38Global Economic Snapshot: China
Global Economic Snapshot: China
Global Economic Snapshot: China
Jonathan LaBerge, CFA Vice President The Bank Credit Analyst Gabriel Di Lullo Research Associate Footnotes 1 Please see The Bank Credit Analyst "April 2022," dated March 31, 2022, available at bca.bcaresearch.com 2 Please see The Bank Credit Analyst "Do Excess Savings Explain Low US Interest Rates?" dated March 31, 2022, and "R-star, And The Structural Risk To Stocks," dated March 31, 2021, available at bca.bcaresearch.com 3 Please see US Investment Strategy/ US Bond Strategy Special Report "Gauging The Risk Of Recession: Slowdown Or Double-Dip?" dated August 16, 2010, available at usbs.bcaresearch.com 4 Please see The Bank Credit Analyst "Do Excess Savings Explain Low US Interest Rates?" dated March 31, 2022, available at bca.bcaresearch.com 5 Clarke, KE, JM Jones, Y Deng, et al. Seroprevalence of Infection-Induced SARS-CoV-2 Antibodies — United States. September 2021–February 2022. 6 Please see The Bank Credit Analyst "Global House Prices: A New Threat For Policymakers," dated May 27, 2021, available at bca.bcaresearch.com 7 Please see The Bank Credit Analyst "January 2022," dated December 23, 2021, available at bca.bcaresearch.com 8 Please see The Bank Credit Analyst “OUTLOOK 2022: Peak Inflation – Or Just Getting Started?” dated December 1, 2021, available at bca.bcaresearch.com 9 Please see The Bank Credit Analyst “The “Invincible” US Equity Market: The Longer-Term Outlook For US Stocks In Relative And Absolute Terms,” dated September 30, 2021, available at bca.bcaresearch.com
Executive Summary An inverted yield curve is a reliable recession indicator. Inversions of the 3-month/10-year Treasury slope and the 3-month/3-month, 18-months forward slope both provide more timely recession signals than inversion of the 2-year/10-year Treasury slope. An inverted yield curve is a reliable equity bear market indicator. Even when it’s not signaling a recession, the yield curve’s movements offer some insight into equity returns as stocks have consistently performed better while it is flattening than they have when it is steepening. The 2-year/10-year Treasury slope embeds useful information for corporate bond excess returns. Corporates perform best when the slope is very steep and worst when it is very flat and/or inverted. Treasury securities generally outperform cash when the yield curve is either very steep or inverted. The one exception is the early-1980s when the Fed continued to tighten aggressively even after an inversion of the yield curve. Different Slopes Are Sending Different Signals
Different Slopes Are Sending Different Signals
Different Slopes Are Sending Different Signals
Bottom Line: The overall message from the yield curve is that, while the economic recovery is no longer in its early stages, it is premature to talk about a recession. On a 6-to-12 month investment horizon, investors should overweight equities in multi-asset portfolios. Within US bond portfolios, investors should maintain a neutral allocation to investment grade corporate bonds and keep portfolio duration close to benchmark. Feature It’s a well-known maxim in macro-finance that an inverted yield curve signals a recession. While that adage embeds a lot of truth, it is also sufficiently vague that it raises more questions than it answers. How far in advance does an inverted yield curve signal a recession? What specific yield curve segment sends the most helpful signal? And most importantly, does the yield curve tell us anything useful about the future performance of financial assets? These sorts of questions are particularly relevant today as we observe some sections of the yield curve approaching inversion while others make new highs (Chart 1). Chart 1Different Slopes Are Sending Different Signals
Different Slopes Are Sending Different Signals
Different Slopes Are Sending Different Signals
This Special Report explains how to think about the slope of the US Treasury curve as an indicator for the economy and financial markets. We first examine the yield curve’s empirical track record as a recession indicator. We then consider what the slope of the yield curve tells us about future equity, corporate bond and Treasury returns. The analysis presented in this report focuses on three different measures of the yield curve slope: The 2-year/10-year Treasury slope, the 3-month/10-year Treasury slope and the spread between the 3-month T-bill rate and the 3-month T-bill rate, 18 months forward. That last spread measure is less commonly cited, but Fed research has shown it to be a reliable predictor of recession.1 It was also recently highlighted by Fed Chair Jerome Powell.2 In the remainder of this report we will refer to the 3-month/3-month, 18-month forward spread as the “Fed Slope”. The Yield Curve & Recession Recession forecasting is a tricky business. It is often not so much a question of identifying “good” and “bad” recession indicators, but a question of balancing lead time and reliability. Recession indicators derived from financial market prices tend to offer greater advance warning of recession but also provide more false signals. On the flipside, indicators derived from macroeconomic data tend to give less lead time but with fewer false signals. Typically, the most useful recession indicators involve some combination of financial market and economic data. For example, a 2018 report from our US Investment Strategy service showed that a useful recession indicator can be created by combining the 3-month/10-year Treasury slope and the Conference Board’s Leading Economic Indicator.3 The Treasury slope’s reputation as an excellent recession indicator is justified because, despite it being derived from volatile financial market data, an inversion of the yield curve provides a very reliable recession signal. The 2-year/10-year Treasury slope has inverted in advance of 7 of the past 8 recessions and has not sent a false signal.4 The 3-month/10-year Treasury slope has done even better, calling 8 out of the past 8 recessions without a false signal. The Fed Slope, meanwhile, has also called 8 out of the past 8 recessions, but it sent one false signal in September 1998. There is room to quibble about the usefulness of the yield curve as a recession indicator in terms of lead time. The 2-year/10-year Treasury slope has, on average, inverted 15.9 months before the start of the next recession (Table 1). This inversion has always occurred before the first Fed rate cut of the cycle, and in all but one instance (1973-75), before the peak in the S&P 500. Table 1Lead Times For Yield Curve Segments, Equity Bear Markets And Fed Rate Cuts
The Yield Curve As An Indicator
The Yield Curve As An Indicator
But while some advance warning is good, the 2-year/10-year slope probably gives too much lead time. For example, the 2-year/10-year slope inverted a full 24 months before the 2007-09 recession, but it would have been unwise to act on that information since the S&P 500 didn’t peak for another 22 months! The historical record shows that the 3-month/10-year Treasury curve and the Fed Slope offer more useful signals than the 2-year/10-year curve. On average, these curves provide less lead time than the 2-year/10-year slope but still generally provide advance warning of recession and stock market peaks. The recession signal from the 3-month/10-year slope has only missed the peak in the S&P 500 twice. The signal from the Fed Slope has only missed the stock market’s peak once, but it also sent one false signal. Synthesizing all this information, we conclude that the 3-month/10-year Treasury curve and the Fed Slope are both highly reliable recession indicators that typically provide more than enough advance warning for equity investors to adjust their positions. The main value of the 2-year/10-year Treasury curve is that its inversion warns that we may soon get a timelier signal from the 3-month/10-year Treasury slope and the Fed Slope. Looking at the present situation, the 2-year/10-year Treasury slope has flattened dramatically during the past few months, but at 18 bps it remains un-inverted. Meanwhile, the 3-month/10-year Treasury slope and the Fed Slope are both elevated at 195 bps and 255 bps, respectively. We can conclude from this that recession warnings are premature. We will become more concerned about an upcoming recession when the 3-month/10-year slope and the Fed Slope approach inversion. The Yield Curve & Equity Returns Identifying a recession and demarcating its beginning and ending dates may seem like a trivial exercise that has little practical import. Celebrated mutual fund manager Peter Lynch has repeatedly offered the opinion that any time an equity investor spends thinking about the economy is wasted time. We beg to differ. Equity bear markets reliably coincide with recessions (Chart 2) – since the late 1960s, only one recession has occurred without a bear market (the first leg of the Volcker double dip from January to July 1980) and only one bear market has occurred without a recession (October 1987’s Black Monday bear market) – and an asset allocator who reduced equity exposure upon receiving advance notice of recessions would have been in a position to generate significant alpha. Chart 2Recessions And Bear Markets Tend To Coincide
Recessions And Bear Markets Tend To Coincide
Recessions And Bear Markets Tend To Coincide
The relationship between equity returns and the business cycle is not happenstance – variation in stock prices correlates closely with variation in corporate earnings and corporate earnings growth is a function of the business cycle. Equity prices, P, are simply the product of earnings per share, E, and the multiple investors are willing to pay for them, P/E: P = E x (P/E). If we hold somewhat fickle P/E multiples constant, stock prices will rise and fall with earnings. Given that earnings rarely decline outside of recessions (Chart 3), investors can expect equities to rise during expansions and decline during recessions. Chart 3Earnings Grow In Expansions And Fall In Recessions Earnings Declines Outside Of Recessions Are Rare
Earnings Grow In Expansions And Fall In Recessions Earnings Declines Outside Of Recessions Are Rare
Earnings Grow In Expansions And Fall In Recessions Earnings Declines Outside Of Recessions Are Rare
Digging a little more deeply into the empirical record since consensus S&P 500 earnings estimates began to be compiled reinforces the earnings/returns link. With the exception of the first leg of the Volcker double dip recession in 1980, forward four-quarter earnings estimates have fallen in every recession and have contracted in the aggregate at an annualized 16% rate (Table 2). Multiples have expanded at a hearty 9% clip from the beginning to the end of recessions but have always declined, sometimes sharply, during them. Conversely, earnings estimates always grow heartily during expansions, while multiples tend to observe a fairly tight range. Multiples and stocks move ahead of the business cycle, consistently troughing before the end of a recession, but the 20-percentage-point expansion/recession disparity in annualized returns testifies to the yield curve’s utility as an investment leading indicator. Table 2When Earnings Fall, So Do Stocks
The Yield Curve As An Indicator
The Yield Curve As An Indicator
The yield curve’s usefulness as a predictor of equity returns goes beyond recession signaling. Over the last half-century, the yield curve has tended to steepen and flatten in distinct phases. Defining a phase as a move of at least 200 basis points (bps) between the 3-month/10-year curve slope’s peak and trough, we count ten steepenings and nine flattenings since August 1969 (Chart 4). Chart 450 Years Of Steepening And Flattening
50 Years Of Steepening And Flattening
50 Years Of Steepening And Flattening
After segmenting performance by slope increments in steepening (Table 3, top panel) and flattening (Table 3, middle panel) phases, we find a clear distinction. S&P 500 total returns tend to be much stronger when the yield curve is in a flattening phase than when it is steepening. In general, a steeper curve is better than a flatter (or inverted) one for equity returns but flattening dominates steepening in every segment but the current one (150-200 bps). The cheery news for investors concerned about an inverted yield curve’s effect on stocks is that the upcoming flattening increments between now and inversion have historically been favorable. Though we are tactically neutral equities, we recommend overweighting them in multi-asset portfolios over a cyclical 6-to-12 month timeframe. Table 3Stocks Like A Flattening Yield Curve
The Yield Curve As An Indicator
The Yield Curve As An Indicator
The Yield Curve & Corporate Bond Returns This section of the report considers investment grade corporate bond returns in excess of a duration-matched position in US Treasuries and whether the slope of the Treasury curve can help us predict their magnitude. First, it’s important to point out that there is a lot of overlap between excess corporate bond returns and equity returns, but it is not complete (Chart 5). Corporates certainly tend to underperform duration-matched Treasuries during recessions and equity bear markets, but there have also been significant bouts of underperformance that fall outside of those periods. For example, corporate bond returns peaked well before equity returns in the late-1990s and corporates also underwent a severe selloff in 2014-15. Chart 5Investment Grade (IG) Corporate Bond Returns By Starting Slope Level And Trend
Investment Grade (IG) Corporate Bond Returns By Starting Slope Level And Trend
Investment Grade (IG) Corporate Bond Returns By Starting Slope Level And Trend
That said, Table 4 shows that, as is the case with stocks, a strategy of reducing corporate bond exposure during recessions will profit over time. Corporate bonds have underperformed Treasuries by a cumulative 3.1% (annualized) during recessions since 1979 and have outperformed by 1.2% (annualized) in non-recessionary periods. Table 4Corporate Bond Performance In And Out Of Recessions
The Yield Curve As An Indicator
The Yield Curve As An Indicator
The results in Table 4 suggest that investors should remain overweight corporate bonds versus Treasuries at least until the 3-month/10-year Treasury slope inverts. However, we think investors can perform even better if they pay attention to early warning signs from the 2-year/10-year Treasury slope. Table 5 shows historic 12-month corporate bond excess returns given different starting points for the 2-year/10-year slope. The starting points are also split depending on whether the 2-year/10-year slope was in a steepening or flattening trend at the time. Table 512-Month Investment Grade (IG) Corporate Bond Returns By Starting Slope Level And Trend
The Yield Curve As An Indicator
The Yield Curve As An Indicator
The results presented in Table 5 show that the level of the slope matters much more than whether the curve is in a steepening or flattening trend. They also show that, in general, excess returns tend to be much higher when the slope is steep than when it is flat. We also see that the odds of corporate bonds outperforming duration-matched Treasuries on a 12-month horizon decline markedly for periods when the 2-year/10-year slope starts below 25 bps. At present, the 2-year/10-year Treasury slope is 18 bps, just below the 25-bps cutoff. Though we take this negative signal from the yield curve seriously, we also anticipate that peaking inflation will prevent the Fed from raising rates by 245 bps during the next 12 months, the pace that is currently discounted in the yield curve. If this view pans out it will likely lead to some modest 2/10 curve steepening and a relief rally in corporate spreads. To square the difference between the current negative message from the yield curve and our more optimistic macro view, we recommend a neutral allocation to investment grade corporate bonds within US fixed income portfolios. Though we will likely downgrade our recommended allocation if the 2-year/10-year slope continues to flatten and approaches inversion. The Yield Curve & Treasury Returns This section of the report considers US Treasury index returns in excess of a position in cash, a metric designed to proxy for the returns earned by varying a US bond portfolio’s average duration. Treasury outperformance of cash indicates that long duration positions are profiting while Treasury underperformance of cash indicates that short duration positions are in the green. The historical relationship between Treasury returns and the slope of the yield curve is heavily influenced by the early-1980s period when the Fed plunged the economy into a double-dip recession to contain spiraling inflation. Chart 6 shows that this early-1980s episode is the only one where Treasuries sold off steeply even after all three of our yield curves had inverted. Chart 6A Repeat Of The Early 1980s Episode Remains Unlikely
A Repeat Of The Early 1980s Episode Remains Unlikely
A Repeat Of The Early 1980s Episode Remains Unlikely
In fact, if we look at the history of 12-month Treasury returns going back to 1973 split by the starting point for the slope (Tables 6A, 6B & 6C), we see that returns are worst after the curve is inverted and best when the curve is very steep. Table 6A12-Month Treasury Excess Returns* Given Different Starting Points For 2-Year / 10-Year Slope Since 1973
The Yield Curve As An Indicator
The Yield Curve As An Indicator
Table 6B12-Month Treasury Excess Returns* Given Different Starting Points For 3-Month / 10-Year Slope Since 1973
The Yield Curve As An Indicator
The Yield Curve As An Indicator
Table 6C12-Month Treasury Excess Returns* Given Different Starting Points For the Fed Slope** Since 1973
The Yield Curve As An Indicator
The Yield Curve As An Indicator
However, that picture changes if we start our historical sample in 1985 to exclude the early-1980s episode. Now, we see that Treasury returns tend to be high when the yield curve is very steep and when it is inverted (Tables 7A, 7B & 7C). The worst 12-month periods for Treasury returns are when the 2-year/10-year slope is between 75 bps and 100 bps, when the 3-month/10-year slope is between 50 bps and 75 bps and when the Fed Curve is between 0 bps and 25 bps. If we apply today’s situation to the post-1985 results shown in Tables 7A, 7B & 7C, we would conclude that the outlook for Treasury returns is very positive. The 3-month/10-year slope and Fed Curve are very steep, and the 2-year/10-year slope is in the 0 bps to 25 bps range. Of course, that message from the 2-year/10-year slope flips if viewed in the context of the post-1973 data shown in Table 6A. Table 7A12-Month Treasury Excess Returns* Given Different Starting Points For 2-Year / 10-Year Slope Since 1985
The Yield Curve As An Indicator
The Yield Curve As An Indicator
Table 7B12-Month Treasury Excess Returns* Given Different Starting Points For 3-Month / 10-Year Slope Since 1985
The Yield Curve As An Indicator
The Yield Curve As An Indicator
Table 7C12-Month Treasury Excess Returns* Given Different Starting Points For the Fed Slope** Since 1985
The Yield Curve As An Indicator
The Yield Curve As An Indicator
Our assessment is that the risk of a repeat of the early-1980s episode is still relatively small. Yes, inflation is extremely high, but it is likely to moderate naturally as we gain more distance from the pandemic. In that environment, the Fed will not feel the need to continue tightening aggressively even after all three segments of the yield curve have inverted. As such, we are inclined to view the message from the yield curve as positive for Treasury returns on a 12-month horizon, and we continue to advocate keeping average bond portfolio duration “at benchmark”. Ryan Swift US Bond Strategist rswift@bcaresearch.com Doug Peta, CFA Chief US Investment Strategist dougp@bcaresearch.com Footnotes 1 https://www.federalreserve.gov/econres/notes/feds-notes/dont-fear-the-yield-curve-20180628.htm 2 https://www.bloomberg.com/news/articles/2022-03-21/powell-says-look-at-short-term-yield-curve-for-recession-risk?sref=Ij5V3tFi 3 Please see US Investment Strategy Special Report, “How Much Longer Can The Bull Market Last?”, dated August 13, 2018. 4 We define an instance of “inversion” as a yield curve slope below zero for two consecutive months. Treasury Index Returns Spread Product Returns
Executive Summary Fed Chair Powell is attempting to steer the US economy between the Scylla of a recession and the Charybdis of entrenched high inflation. In the benign soft-landing outcome, the economy will continue to grow well above trend while inflation abates as spending transitions from goods to services, supply chains are untangled and base effects offer arithmetic relief. Entrenched high inflation would yield the most bearish outcome as it would leave the Fed with no choice but to squash the economy to stuff the inflation genie back into the bottle. We expect that rate hikes will eventually short-circuit the expansion and the equity bull market, but not for at least another year. Disruptions from the Ukraine conflict and China’s COVID surge place the most bullish case out of reach but the bearish end of the continuum is overly defeatist. The biggest threats to our constructive view are worsening Russia-Ukraine shortages, a conflict with Russia beyond Ukraine, new COVID obstacles and a consumer retreat. The Rates Market Thinks The Fed's Overly Ambitious
The Rates Market Thinks The Fed's Overly Ambitious
The Rates Market Thinks The Fed's Overly Ambitious
Bottom Line: We continue to recommend overweighting equities and credit over our cyclical 6-12-month timeframe, but risks are heightened and we will change course if conditions dictate. Feature As telegraphed, the Fed began its rate hiking campaign at last week’s FOMC meeting. It lifted its target range for the fed funds rate 25 basis points (bps) from 0 – 0.25% to 0.25 – 0.5%. In addition to making the nearly unanimously expected 25-bps hike, it indicated that the median FOMC participant expects the funds rate to rise by 25 bps at each of the year’s six remaining meetings and by 87.5 bps in 2023, though Chair Powell stressed the projections are merely a baseline expectation subject to change as economic conditions evolve. Both projections slightly exceeded market expectations going into the meeting. After it ended, the fed funds rate implied by the December 2022 futures contract rose 15 bps to align with the median FOMC voter and the rate implied by the December 2023 fed funds contract rose 18 bps, though it remains about a quarter-point hike shy of the median FOMC projection (Chart 1). Chart 1It Looks Like The Fed Can Only Surprise Hawkishly
It Looks Like The Fed Can Only Surprise Hawkishly
It Looks Like The Fed Can Only Surprise Hawkishly
Chart 2The Dots Turn More Hawkish
Between A Rock And A Hard Place
Between A Rock And A Hard Place
Widening the lens to consider the entire distribution of projected rate hikes (the Fed’s dots), and considering the mean value instead of the median, the dots get slightly more ambitious, revealing that disappointingly high inflation readings would prod the committee to ramp up the pace of its 2022 hikes. Seven of the sixteen FOMC participants expect at least 200 bps of hikes in 2022, with the mean funds rate projection nudging up to 2.05% (Chart 2, top panel). The rates market has the funds rate topping out between 2½ and 2⅝%, about one 25-bps hike below the average participant’s 2.81% and 2.75% year-end 2023 (Chart 2, middle panel) and 2024 (Chart 2, bottom panel) projections. With five FOMC voters expecting a terminal rate of 3% or above, there is scope for an upside surprise if inflation comes in hotter or lasts longer than anticipated. The other changes in the Summary of Economic Projections related to the committee’s GDP and inflation outlook. Participants marked down their median real 2022 GDP growth projection to 2.8% from 4% while increasing their headline and core PCE price index projections about one-and-a-half percentage points to 4.3% and 4.1%, respectively. 2023 and 2024 real GDP growth forecasts were unchanged while inflation expectations were bumped a little higher. The FOMC’s outlook has dimmed slightly, though it is still calling for a soft landing with the economy growing at an above-trend rate and supporting full employment while inflation eases to near its target level. You Can’t Get There From Here Any central bank’s long-run projections will show the economy moving toward its desired target conditions. One probably wouldn’t toil as a central banker if s/he didn’t think the bank’s tools would work and couldn’t say it out loud (even when voting anonymously) if s/he doubted that they might. An investor should therefore never place too much stock in the FOMC’s projections for key economic indicators two and three years out. “[A]ppropriate[ly] firming … monetary policy” is easier said than done, even in the best of times. Related Report US Investment StrategyThe Last Line Of Inflation Defense (Is Holding Fast) The combination of monetary and fiscal largesse almost certainly staved off a COVID recession, at the cost of fostering some asset-market excesses while quite possibly overstimulating aggregate demand over the intermediate term. The Fed is now left to confront the aftermath with blunt policy tools that work with long and variable lags. It is always a tall order to steer an economy smoothly through the ups and downs of the business cycle; sticking the landing after the pandemic’s emergency monetary and fiscal routines involves a much higher degree of difficulty. Chair Powell put on a brave face in his post-meeting press conference, but he and his colleagues are embarking on this rate hiking cycle under less-than-ideal conditions. “In hindsight, yes, it would have been appropriate to move [to hike rates] earlier. … No one wants to have to put really restrictive monetary policy on in order to get inflation back down. So, frankly, [we] need … [to] … get rates back up to more neutral levels as quickly as we practicably can and then mov[e] beyond [neutral], if [it] turns out to be appropriate.” Bottom Line: Having to move as quickly as is practicable implies that the committee and financial markets might be in for some white-knuckle moments in the months ahead. Soft landings are more common in theory than in practice and it will be especially hard to pull one off now. A Recession Is Not Likely … A narrow margin for error does not mean the Fed is walking a tightrope over two negative extremes, however, and we believe the risks of a growth shortfall are modest. We share Powell’s view that “the probability of a recession within the next year is not particularly elevated.” Aggregate demand is strong and will be supported by households’ and businesses’ fortified balance sheets while the labor market has strength to burn. We think the chair had it just right when he said, “all signs are that this is a strong economy and, indeed, one that will be able to flourish … in the face of less accommodative monetary policy.” Our simple recession indicator, built from components that have reliably provided advance warning, reinforces Powell’s conclusion. The 3-month/10-year segment of the yield curve is not yet close to inverting1 (Chart 3). The year-over-year change in the Conference Board’s Leading Economic Index is way above the zero line that has signaled past recessions (Chart 4). The fed funds rate is nowhere near its equilibrium/neutral level, which we judge to be north of 3%, and it is highly unlikely to get there by the end of the year (Chart 5). Ex-the pandemic, recessions over the last 50-plus years have only occurred when all three components sound the alarm; not one is flashing red now and not one is likely to do so during 2022. Chart 3Recessions Occur When The Yield Curve Inverts, ...
Recessions Occur When The Yield Curve Inverts, ...
Recessions Occur When The Yield Curve Inverts, ...
Chart 4... The Year-Over-Year Change In The LEI Turns Negative ...
... The Year-Over-Year Change In The LEI Turns Negative ...
... The Year-Over-Year Change In The LEI Turns Negative ...
Chart 5... And The Target Fed Funds Rate Is Above Its Equilibrium Level
... And The Target Fed Funds Rate Is Above Its Equilibrium Level
... And The Target Fed Funds Rate Is Above Its Equilibrium Level
… But Inflation Is A Pressing Concern The Fed is right to take action to try to stem inflation, which has found especially fertile soil. Extraordinary monetary and fiscal stimulus have given demand a persistent tailwind; social distancing funneled spending to goods while rolling global COVID surges slowed production and hampered transport, crimping supply; and domestic COVID infections limited labor force participation, tightening the labor market and exerting upward pressure on wages. Just when COVID was finally relaxing its grip, Russia invaded Ukraine, taking major sources of crude oil, natural gas, wheat, corn and several base metals offline while creating new cargo and shipping bottlenecks. The Omicron variant’s emergence in China could bring new supply disruptions. The upshot is that the Ukraine invasion and COVID’s Asian revival could keep inflation elevated, obscuring mitigating factors like a consumption shift from goods to services (Chart 6), diminishing shipping backlogs (Chart 7), increasing labor force participation and more forgiving year-over-year comparisons (base effects). Upside inflation surprises could open the door to a faster pace of rate hikes than markets have already discounted, especially if stubbornly high inflation begins to push up longer-run inflation expectations. Despite their recent rise, long-run expectations remain well anchored for now (Chart 8), while households’ sizable savings cushion better positions them to withstand higher prices. Chart 6A Transitory Inflation Catalyst
A Transitory Inflation Catalyst
A Transitory Inflation Catalyst
Chart 7Shipping Bottlenecks Had Been Easing
Shipping Bottlenecks Had Been Easing
Shipping Bottlenecks Had Been Easing
Chart 8Long-Run Inflation Expectations Are Still Manageable
Long-Run Inflation Expectations Are Still Manageable
Long-Run Inflation Expectations Are Still Manageable
Financial Market Impacts Equities took heart from Powell’s talk of the Fed’s commitment to prevent high inflation from becoming entrenched, but his comments were not uniformly reassuring. He specifically called out the red-hot labor market, a key pillar of the favorable growth outlook, as a source of concern. “[I]f you take a look … at today’s labor market, what you have is 1.7-plus job openings for every unemployed person (Chart 9). So that’s a very, very tight labor market, tight to an unhealthy level, I would say.” The Phillips Curve trade-off between growth and inflation still applies after all, but after a dozen years when policymakers and investors were able to ignore it, equity multiples, credit spreads and Treasury yields may no longer account for it. They seem to still be discounting a have-your-cake-and-eat-it-too environment in which growth, even when it’s above trend, is continuously goosed by accommodative policy. Chart 9Too Tight For The Fed Chair
Too Tight For The Fed Chair
Too Tight For The Fed Chair
There’s also the issue that the Fed’s tools are not suited to fine-tuning economic outcomes. One does not have to be a card-carrying Austrian to harbor some skepticism about central bankers' ability to make targeted tweaks. “[I]n principle, … the idea is we’re trying to better align demand and supply[.] [I]n the labor market, … if you were just moving down the number of job openings so that they were more like one to one, you would have less upward pressure on wages. You would have a lot less of a labor shortage. … And basically across the economy, we’d like to slow demand so that it’s better aligned with supply. … Of course, the plan is to restore price stability while also sustaining a strong labor market. That is our intention, and we believe we can do that. But we have to restore price stability.” It’s a happy circumstance when attaining a goal doesn’t involve a sacrifice, but no pain, no gain is adulthood’s default condition. To paraphrase Powell’s press conference guidance, price stability with full employment would be really nice, but if push comes to shove, price stability has to take precedence. The tight monetary policy needed to restore lost price stability would constitute a major headwind for risk assets and the economy. It would spell the end of the equity and credit bull markets while ushering in the next recession. It is our view that the perception that price stability sacrifices are inevitable is still far away enough that risk assets have roughly nine to twelve good months ahead of them, although we hold it with less conviction than we did before Russia attacked Ukraine and Omicron reached China. Both events have the potential to hasten the end of monetary accommodation and drive investors to reconsider their terminal (peak) fed funds rate expectations. We do not expect that investors will revisit their terminal rate expectations until they can glean some empirical evidence of how the economy behaves when the funds rate exceeds 2.25%. If it takes the FOMC at least a year to get to that level, we expect that any major repricing of longer-term Treasury yields is over a year away. The bottom line is that we remain constructive on financial markets and the US economy over our six-to-twelve-month cyclical timeframe, but the clock is ticking and European fighting and Asian COVID infections are threats to our view. We believe that the decline in equity prices and the widening of high-yield credit spreads adequately compensate investors for the increased potential pitfalls, but we remain vigilant and are maintaining our tactically cautious ETF portfolio positioning until some of the clouds lift. Doug Peta, CFA Chief US Investment Strategist dougp@bcaresearch.com Footnotes 1 We use the 3-month/10-year segment instead of the more common 2-year/10-year because the 3-month bill is a cleaner proxy for short rates than the 2-year note, which embeds estimates of the Fed’s future actions. 2s/10s also fail to measure up empirically, inverting even earlier than the habitually premature 3-month/10-year.
BCA Research is proud to announce a new feature to help clients get the most out of our research: an Executive Summary cover page on each of the BCA Research Reports. We created these summaries to help you quickly capture the main points of each report through an at-a-glance read of key insights, chart of the day, investment recommendations and a bottom line. For a deeper analysis, you may refer to the full BCA Research Report. Executive Summary China’s Property Bust To Dwarf Japan’s
China Geopolitical Outlook 2022
China Geopolitical Outlook 2022
China’s confluence of internal and external risks will continue to weigh on markets in 2022. Internally China’s property sector turmoil is one important indication of a challenging economic transition. The Xi administration will clinch another term but sociopolitical risks are underrated. Externally China faces economic and strategic pressure from the US and its allies. The US is distracted with other issues in 2022 but US-China confrontation will revive beyond that. China will strengthen relations with Russia and Iran, though it will not encourage belligerence. It needs their help to execute its Eurasian strategy to bypass US naval dominance and improve its supply security over the long run. China will ease monetary and fiscal policies in 2022 but it has no interest in a massive stimulus. Policy easing will be frontloaded in the first half of the year. Featured Trade: Strategically stay short the renminbi versus an equal-weighted basket of the dollar and the euro. Stay short TWD-USD as well. Recommendation INCEPTION Date Return SHORT TWD / USD 2020-06-11 0.5% SHORT CNY / EQUAL-WEIGHTED BASKET OF EURO AND USD 2021-06-21 -3.9% Bottom Line: Beijing is easing policy to secure the post-pandemic recovery, which is positive for global growth and cyclical financial assets. But structural headwinds will still weigh on Chinese assets in 2022. China’s Historic Confluence Of Risks Global investors continue to clash over China’s outlook. Ray Dalio, founder of Bridgewater Associates, recently praised China’s “Common Prosperity” plan and argued that the US and “a lot of other countries” need to launch similar campaigns of wealth redistribution. He warned about the US’s 2024 elections and dismissed accusations of human rights abuses by saying that China’s government is a “strict parent.”1 By contrast George Soros, founder of the Open Society Foundations, recently warned against investing in China’s autocratic government and troubled property market. He predicted that General Secretary Xi Jinping would fail to secure another ten years in power in the Communist Party’s upcoming political reshuffle.2 Geopolitics can bring perspective to the debate: China is experiencing a historic confluence of internal (political) and external (geopolitical) risk, unlike anything since its reform era began in 1979. At home it is struggling with the Covid-19 pandemic and a difficult economic transition that began with the Great Recession of 2008-09. Abroad it faces rising supply insecurity and an increase in strategic pressure from the United States and its allies. The implication is that the 2020s will be an even rockier decade than the 2010s. In the face of these risks the Chinese Communist Party is using the power of the state to increase support for the economy and then repress any other sources of instability. Strict “zero Covid” policies will be maintained for political reasons as much as public health reasons. Arbitrary punitive measures will put pressure on the business elite and foreigners. The geopolitical outlook is negative over the long run but it will not worsen dramatically in 2022 given America’s preoccupation with Russia, Iran, and midterm elections. Bottom Line: Global investor sentiment toward China will remain pessimistic for most of the year – but it will turn more optimistic toward foreign markets, especially emerging markets, that sell into China. China’s Internal Risks Chart 1China's Demographic Cliff
China's Demographic Cliff
China's Demographic Cliff
By the end of 2021, China accounted for 17.7% of global economic output and 12.1% of global imports. However, the secular slowdown in economic growth threatens to generate opposition to the single-party regime, forcing the Communist Party to seek a new base of political legitimacy. Most countries saw a drop in fertility rates in the third quarter of the twentieth century but China’s “one child policy” created a demographic cliff (Chart 1). At first this generated savings needed for national development. But now it leaves China with excess capacity and insufficient household demand. Across the region, falling fertility rates have led to falling potential growth and falling rates of inflation. Excess savings increased production relative to consumption and drove down the rate of interest. The shift toward debt monetization in the US and Japan, in the post-pandemic context, is now threatening this trend with a spike in inflation. China is also monetizing debt after a decade of deflationary fears. But it remains to be seen whether inflation is sustainable when fertility remains below the replacement rate over the long run, as is projected for China as well as its neighbors (Chart 2). China’s domestic situation is fundamentally deflationary as a result of chronic over-investment over the past 40 years. China’s gross fixed capital formation stands at 43% of GDP, well above the historic trend of other major countries for the past 30 years (Chart 3). Chart 2Will Inflation Decouple From Falling Fertility?
Will Inflation Decouple From Falling Fertility?
Will Inflation Decouple From Falling Fertility?
Chart 3Over-Investment Is Deflationary, Not Inflationary
China Geopolitical Outlook 2022
China Geopolitical Outlook 2022
Like other countries, China financed this buildup of fixed capital by means of debt, especially state-owned corporate debt. While building a vast infrastructure network and property sector, it also built a vast speculative bubble as investors lacked investment options outside of real estate. The growth in property prices has tracked the growth in private non-financial sector debt. The downside is that if property prices fall, debt holders will begin a long and painful process of deleveraging, just like Japan in the 1990s and 2000s. Japan only managed to reverse the drop in corporate investment in the 2010s via debt monetization (Chart 4). Chart 4Japan’s Property Bust Coincided With Debt Deleveraging
China Geopolitical Outlook 2022
China Geopolitical Outlook 2022
Chart 5China's Debt Growth Halts
China's Debt Growth Halts
China's Debt Growth Halts
Looking at the different measures of Chinese debt, it is likely that deleveraging has begun. Total debt, public and private, peaked and rolled over in 2020 at 290% of GDP. Corporate debt has peaked twice, in 2015 and again in 2020 at around 160% of GDP. Even households are taking on less debt, having gone on a binge over the past decade (Chart 5). In short China is following the Japanese and East Asian growth model: the stark drop in fertility and rise in savings created a huge manufacturing workshop and a highly valued property sector, albeit at the cost of enormous private and considerable public debt. If the private sector’s psychology continues to shift in favor of deleveraging, then the government will be forced to take on greater expenses and fund them through public borrowing to sustain aggregate demand, maximum employment, and social stability. The central bank will be forced to keep rates low to prevent interest rates from rising and stunting growth. China’s policymakers are stuck between a rock and a hard place. New regulations aimed at controlling the property bubble (the “three red lines”) precipitated distress across the sector, emblematized by the failure of the world’s most indebted property developer, Evergrande. Other property developers are looking to raise cash and stay solvent. Property prices peaked in 2015-16 and are now dropping, with third-tier cities on the verge of deflation (Chart 6). Chart 6China's Property Crisis Weighs On Construction
China's Property Crisis Weighs On Construction
China's Property Crisis Weighs On Construction
As the property bubble tops out, Chinese policymakers are looking for new sources of productivity and growth. Chart 7Productivity In Decline
China Geopolitical Outlook 2022
China Geopolitical Outlook 2022
Productivity growth is subsiding after the export and property boom earlier in the decade, in keeping with that of other Asian economies. And sporadic initiatives to improve governance, market pricing, science, and technology have not succeeded in lifting total factor productivity (Chart 7). The initial goal of the Xi administration’s reforms, to rebalance the economy away from manufacturing toward services, has stumbled and will continue to face headwinds from the financial and real estate sectors that powered much of the recent growth in services (Chart 8). Chart 8China’s Structural Transition Falters
China Geopolitical Outlook 2022
China Geopolitical Outlook 2022
Indeed the Communist Party is rediscovering the value of export-manufacturing in the wake of the pandemic, which led to a surge in durable goods orders as global consumers cut back on services and businesses initiated a new cycle of capital expenditures (Chart 9). The party encouraged the workforce to shift out of manufacturing over the past decade but is now rethinking that strategy in the face of the politically disruptive consequences of deindustrialization in the US and UK – such that the state can be expected to recommit to supporting manufacturing going forward (Chart 10). Policymakers are emphasizing economic self-sufficiency and “dual circulation” (import substitution) as solutions to the latent socioeconomic and political threat posed by disillusioned former manufacturing workers. Chart 9China Turns Back To Exports
China Turns Back To Exports
China Turns Back To Exports
Chart 10De-Industrialization Will Be Halted
De-Industrialization Will Be Halted
De-Industrialization Will Be Halted
Even beyond ex-manufacturing workers, the country’s economic transition risks generating social instability. The middle class, defined as those who consume from $10 to $50 per day in purchasing power parity terms, now stands at 55% of total population, comparable to where it stood when populist and anti-populist political transformations occurred in Turkey, Thailand, and Brazil (Chart 11). China’s middle class may not be willing or able to intervene into the political process, but the government is still concerned about the long-term potential for discontent. Otherwise it would not have launched anti-corruption, anti-pollution, and anti-industrial measures in recent years. These measures vary in effectiveness but they all share the intention to boost the government’s legitimacy through social improvements and thus fall in line with the new mantra of “common prosperity.” For decades the ruling party claimed that the “principle contradiction” in society arose from a failure to meet the people’s “material needs,” but beginning in 2021 it emphasized that the principle contradiction is the people’s need for a “better life.” Real wages continue to grow but the pace of growth has downshifted from previous decades. The bigger problem is the stark rise in inequality, here proxied by skyrocketing housing prices. Hong Kong’s inequality erupted into social unrest in recent years even though it has a much higher level of GDP per capita than mainland China (Chart 12). In major cities on the mainland, housing prices have outpaced disposable income over the past two decades. Youth unemployment also concerns the authorities. Chart 11Social Instability A Genuine Risk
China Geopolitical Outlook 2022
China Geopolitical Outlook 2022
Bottom Line: The Chinese regime faces historic social and political challenges as a result of a difficult structural economic transition. The ongoing emphasis on “common prosperity” reveals the regime’s fear of social instability. The underlying tendency is deflationary, though Beijing’s use of debt monetization introduces a long-term inflationary risk that should be monitored. Chart 12Causes Of Hong Kong Unrest Also Present In China
Causes Of Hong Kong Unrest Also Present In China
Causes Of Hong Kong Unrest Also Present In China
China’s External Risks Geopolitically speaking, China’s greatest challenge throughout history has been maintaining domestic stability. Because China is hemmed in by islands that superior foreign powers have often used as naval bases, it is isolated as if it is a landlocked state. A stark north-south division within its internal geography and society creates inherent political tension, while buffer regions are difficult to control. Hence foreign powers can meddle with internal affairs, undermine unity and territorial integrity, and exploit China’s large labor force and market. However, in the twenty-first century China has the potential to project power outward – as long as it can maintain internal stability. Power projection is increasingly necessary because China’s economy increasingly depends on imports of energy, leaving it vulnerable to western maritime powers (Chart 13). Beijing’s conversion of economic into military might has also created frictions with neighbors and aroused the antagonism of the United States, which increasingly seeks to maintain the strategic anchor in the western Pacific that it won in World War II. Chart 13Import Dependency A Strategic Security Threat
Import Dependency A Strategic Security Threat
Import Dependency A Strategic Security Threat
As China’s influence expands into East Asia and the rest of Asia, conflicts with the US and its allies are increasingly likely, especially over critical sea lines of communication, including the Taiwan Strait. China’s reinforcement of its manufacturing prowess will also provoke the United States, while the US’s erratic attempts to retain its strategic position in Asia Pacific will threaten to contain China. Yet the US cannot concentrate exclusively on countering China – it is distracted by internal politics and confrontations with Russia and Iran, especially in 2022. China will strengthen relations with Russia and Iran. As an energy importer, China would prefer that neither Russia nor Iran take belligerent actions that cause a global energy shock. But both Moscow and Tehran are essential to China’s Eurasian strategy of bypassing American naval dominance to reduce its supply insecurity. And yet, in 2022 specifically, the US and China are both concerned about maintaining positive domestic political dynamics due to the midterm elections and twentieth national party congress. This includes a desire to reduce inflation. Hence both would prefer diplomacy over trade war, with regard to each other, and over real war, with regard to Ukraine and Iran. So there is a temporary overlap in interests that will discourage immediate confrontation. China might offer limited cooperation on Iranian or North Korean nuclear and missile talks. But the same domestic political dynamics prevent a significant improvement in US-China relations, as neither side will grant trade concessions in 2022, and the underlying strategic tensions will revive over the medium and long run. Bottom Line: China faces historic external risks stemming from import dependency and conflict with the United States. In the short run, the US conflicts with Russia and Iran might lead to energy shocks that harm China’s economy. Japan never recovered its rapid growth rates after the 1973 Arab oil embargo. In the long run, while Washington has little interest in fighting a war with China, its strategic competition will focus on galvanizing allies to penalize China’s economy and to substitute away from China, in favor of India and ASEAN. China’s Macro Policy In 2022: Going “All In” For Stability In last year’s China Geopolitical Outlook, we maintained our underweight position on Chinese equities and warned that Beijing’s policy tightening posed a significant risk to global cyclical assets – and yet we concluded that policymakers would avoid overtightening policy to the extent of spoiling the global recovery. This view prevailed over the course of 2021. Policymakers tightened monetary and fiscal policy in the first half of the year, then started loosening up in the summer. Chinese equities crashed but global equities powered through the year. In December 2020, at the Central Economic Work Conference, policymakers stated that China would “maintain necessary policy support for economic recovery and avoid sharp turns in policy” in 2021. In the event they did the minimal necessary, though they did avoid sharp turns. For 2022, the key word is “stability.” At the Central Economic Work Conference last month, the final communique mentioned “stability” or “stabilize” 25 times (Table 1). Hence the main objective of Chinese policymakers this year is to prioritize both economic and social stability ahead of the twentieth national party congress. Authorities will avoid last year’s tight policies. Table 1Key Chinese Policy Guidance 2021-22
China Geopolitical Outlook 2022
China Geopolitical Outlook 2022
China’s quarterly GDP growth slipped to just 4% in Q4 2021, from rapid recovery growth of 18.3% in Q1 2021. Considering the low base effect of 2020, the average growth of 2020 and 2021 ranged from 5-5.5% (Chart 14). This growth rate is in line with the pre-pandemic trajectory of 2015-2019. In Jan 2022, the IMF cut China’s 2022 growth forecast to 4.8%, while the World Bank lowered its forecasts to 5.1%. Considering the two-year average growth and government’s goal of “all in for stability,” we see an implicit GDP target of 5-5.5%. Chart 14Breakdown Of China’s GDP Growth
China Geopolitical Outlook 2022
China Geopolitical Outlook 2022
Does this target matter? Although China stopped announcing explicit GDP growth targets, understanding the implicit target helps investors predict the turning point in macro policy. Due to robust global demand, net exports are now making a sizable contribution to GDP growth. However, due to the high base effect of 2021, there is limited room for exports to grow in 2022. Hence economic growth has to rely on final consumption expenditure and gross capital formation. Yet as a result of policy tightening, gross capital formation’s contribution to GDP has decreased significantly, from positive in H1 2021 to a rare negative contribution to GDP in the second half. At the same time, the contribution from final consumption expenditure also slipped over the course of 2021, due to worsening Covid conditions, one of the three pressures stated by the government. What does that mean? It means that loosening up macro policies is the pre-condition for stabilizing growth and the economy. Just like the officials said (see Table 1), the Chinese economy is “facing triple pressure from demand contraction, supply shocks, and weakening expectations,” so that “all sides need to take the initiative and launch policies conducive to economic stability.” Bottom Line: It is reasonable to expect accommodative fiscal and monetary policies in 2022, at least until the party congress ends. In fact, authorities have already started to make these adjustments since Q4 2021. China Avoids Monetary Overtightening Credit growth can be seen as an indicator for gross capital formation. In the second half of 2021, China’s total social financing (total private credit) growth plunged below 12% (Chart 15), the threshold we identified for determining whether authorities overtightened policy. Correspondingly, gross capital formation’s contribution to GDP dropped into the negative zone (see Chart 14 above). However, money growth did not dip below the threshold, and authorities are now trying to boost credit growth. Starting from December 2021, the market has seen marginally positive news out of the People’s Bank of China: December 15, 2021: The PBOC conducted its second reserve requirement ratio (RRR) cut in 2021. The 50 bps cut was expected to release $188 billion in liquidity to support the real economy. December 20, 2021: The PBOC conducted its first interest rate cut since April 2020 by cutting 1-Year LPR by 5 bps on December 20 (Chart 16). Chart 15China's Money And Credit Growth Hits Pain Threshold
China's Money And Credit Growth Hits Pain Threshold
China's Money And Credit Growth Hits Pain Threshold
Chart 16China Monetary Policy Easing
China Monetary Policy Easing
China Monetary Policy Easing
January 17, 2022: The PBOC cut the interest rate on medium-term lending facility (MLF) loans and 7-day reverse repurchase (repos) rate both by 10 bps. January 20, 2022: The PBOC further lowered the 1-year LPR by 10 basis points and cut the 5-year LPR by 5 basis points, the first cut since April 2020. Chart 17China Policy Easing Will Boost Import Volumes
China Policy Easing Will Boost Import Volumes
China Policy Easing Will Boost Import Volumes
The timing and size of the last two rate cuts came as a surprise to the market, signaling more comprehensive easing than was expected (confirming our expectations).3 The market saw a clear turning point: Chinese authorities are now fully aware of the need to loosen up monetary policy to counter intensifying downward pressure on the economy. Incidentally, the fine-tuning of the different lending facilities suggests the government aims to lower borrowing costs and stimulate the market without over-heating the property sector again. PBOC officials claim there is still some space for further cuts, though narrower now, when asked about if there is any room to further cut the RRR and interest rates in Q1. They added that the PBOC should “stay ahead of the market curve” and “not procrastinate.”4 Recent movements have validated this point. Going forward, M2 growth should stay above 8%. Total social financing growth should move up above our “too tight” threshold, although weak sentiment among private borrowers could force authorities to ease further to ensure that credit growth picks up. If the government is still committed to fighting housing speculation, as before, then we could see a smaller adjustment to the 5-Year LPR in the future. Otherwise the government is taking its foot off the brake for stability reasons, at least temporarily. Bottom Line: China will keep easing monetary policy in 2022, at least in the first half. This will result in an improvement in Chinese import volumes and ultimately emerging market corporate earnings, albeit with a six-to-12-month lag (Chart 17). China Avoids Fiscal Overtightening China will also avoid over-tightening fiscal policy in 2022. In December the government stressed the need to “maintain the intensity of fiscal spending, accelerate the pace, and moderately advance infrastructure investment.” In 2021, local government bond issuance did not pick up until the second half of the year. Considering the time lag of construction projects, it was too late for local government investment to stimulate the economy. By Q3 2021, local government bond issuance had just completed roughly 70% of the annual quota. By comparison, in 2018-2020, local governments all completed more than 95% of the annual quota by the end of September each year (Chart 18A). Chart 18AChina: No Pause In Local Bond Issuance In H1 2022
China Geopolitical Outlook 2022
China Geopolitical Outlook 2022
Chart 18BChina: No Pause In Local Bond Issuance In H1 2022
China Geopolitical Outlook 2022
China Geopolitical Outlook 2022
There are several reasons behind the slow pace last year. The central government refused to pre-approve and pre-authorize the quota for bond issuance at the beginning of the year in 2021, in order to restore discipline after the massive 2020 stimulus measures. The quota was not released until after the Two Sessions in March, which means local government bond issuance did not pick up until April 2021, causing a 3-month vacuum in local government fiscal support (see Chart 18B). In contrast, for 2019 and 2020, the central government pre-authorized the bond issuance quota ahead of time to try to provide fiscal support evenly throughout the year. Starting from 2020, the central government strengthened supervision and evaluation of local government investment projects, again to instill discipline. Previously local governments could easily issue general-purpose bonds and the funds were theirs to spend. But now local governments are required to increase the transparency of their investment projects and mainly finance these projects via special-purpose bonds, i.e. targeted money for authorized projects (Table 2). In 2021 local governments were less willing to issue bonds. At the April 2021 Politburo meeting, the central government vowed to “establish a disposal mechanism that will hold local government officials accountable for fiscal and financial risks.” This triggered risk-aversion. Beijing wanted to prevent a growth “splurge” in the wake of its emergency stimulus, like what happened in 2008-11. The fiscal turning point came in the second half of the year. The central government called for accelerating local government bond issuance several times from July to October. The pace significantly picked up in the second half of 2021 and Q4 accounted for a significant portion of annual issuance (Chart 18). As a result, fixed asset investment and fiscal impulse should pick up in Q1 2022. Thus, unlike last year, authorities are trying to avoid a sharp drop in the fiscal impulse. The Ministry of Finance has already frontloaded 1.46 trillion yuan ($229 billion) from the 2022 special purpose bonds quota. This amount is part of the 2022 annual local government bond issuance quota, with the rest to be released at the Two Sessions in March. Pulling these funds forward indicates the rising pressure to stabilize economic growth in Q1 this year. That being said, investors should differentiate easing up fiscal policy and “flood-like” stimulus in the past. The government still claims it will “contain increases in implicit local government debts.” In fact, pilot programs to clean up implicit debts have already started in Shanghai and Guangdong. This means, China will not reverse past efforts on curbing hidden debts. Hence fiscal support will be more tightly controlled in future, like water taps in the hands of the central government. The risk of fiscal tightening is backloaded in 2022. The tremendous amount of local government bonds issued in Q4 2021 will start to kick in early 2022. These will combine with the frontloaded special purposed bonds. Fiscal impulse should tick up in Q1. However, fiscal impulse might decelerate in the second half. A total of $2.7 trillion yuan worth of local government bonds will reach maturity this year, with $2.2 trillion yuan reaching maturity after June 2022 (Table 3). This means that in the second half, local governments will need to issue more re-financing bonds to prevent insolvency risk, thus undermining fiscal support for the economy. And this last point underscores the threat of economic and financial instability that China faces over the long run. Table 2Breakdown Of China Local Government Bond Issuance
China Geopolitical Outlook 2022
China Geopolitical Outlook 2022
Bottom Line: Stability is the top priority in 2022. China will continue to easy up monetary and fiscal policy in H1, to combat the economic downward pressure ahead of the twentieth national party congress (Chart 19). Policy tightening risk is backloaded. Structural reforms will likely subside for now until the Xi administration re-consolidates power for the next ten years. Table 3China: Local Government Debt Maturity Schedule
China Geopolitical Outlook 2022
China Geopolitical Outlook 2022
Chart 19Policy Support Expected For 20th Party Congress
Policy Support Expected For 20th Party Congress
Policy Support Expected For 20th Party Congress
Note: An error in an earlier version of this report has been corrected. Chinese fixed asset investment in Chart 19 is growing at 0.1%, not 57.6% as originally shown. The chart has been adjusted. Matt Gertken Chief Geopolitical Strategist mattg@bcaresearch.com Yushu Ma Research Associate yushu.ma@bcaresearch.com Footnotes 1 See Bei Hu and Bloomberg, “Ray Dalio thinks the U.S. needs more of China’s common prosperity drive to create a ‘fairer system,’” Fortune, January 10, 2022, fortune.com. 2 See George Soros, “China’s Challenges,” Project Syndicate, January 31, 2022, project-syndicate.org. 3 The 5-year LPR had remained unchanged after the December 2021 cut. At that time, only the 1-Year LPR was cut by 5bps. Furthermore, the different magnitudes of the January 20 LPR cut also have some implications. The 1-Year LPR mostly affects new and outstanding loans, short-term liquidity loans of firms, and consumer loans of households. In comparison, the 5-Year LPR has a larger impact, affecting the borrowing costs of total social financing, including mortgage loans, medium- to long-term investment loans, etc. The MLF rate was cut by 10 basis points on January 17; in theory the LPR should also be cut by the same size. However, the 5-Year LPR adjustments was very cautious and was only cut by 5 bps, smaller than the MLF cut and the 1-Year LPR cut. The 5-year LPR serves as the benchmark lending rate for mortgage loans. 4 To combat the negative shock caused by the initial outburst of COVID-19, altogether China lowered the MLF and 1-year LPR by 30 bps and 5-year LPR by 15 bps in H1 2020. This also suggests that there is still room for future interest rate cuts or RRR cuts in the coming months. Strategic Themes Open Tactical Positions (0-6 Months) Open Cyclical Recommendations (6-18 Months)
Highlights Our top five “black swan” risks for 2022: Social unrest in China; Russian invasion of all of Ukraine; unilateral Israeli strikes on Iran; a cyber attack that goes kinetic; and a failure of OPEC 2.0. Too early to buy the dip on Russian assets: President Biden says Putin will probably “move in” and re-invade Ukraine, Russian embassy staff have been evacuating Ukraine, the US and UK have been providing more arms to Ukraine, and the US is warning of a semiconductor embargo against Russia. Talks resume in Geneva on Friday. Tactically investors should take some risk off the table, especially if linked to Russia and Europe. Stay short the Russian ruble and EM Europe; stay short the Chinese renminbi and Taiwanese dollar; stay long cyber security stocks; and be prepared for oil volatility. Convert tactical long equity trades to relative trades: long large caps versus small caps, long defensives versus cyclicals, and long Japanese industrials versus German industrials. Feature Chart 1Recession Probability And Yield Curve
Recession Probability And Yield Curve
Recession Probability And Yield Curve
The 2/10-year yield curve is flattening and now stands at 79 bps, while the implied probability of a recession over the next 12 months troughed at 5.9% in April 2021, and as of December 2021 stood at 7.7% (Chart 1). Apparently stagflation and recession are too high of a probability to constitute a “black swan” risk for this year. Black swans are not only high impact but also low probability. In this year’s annual “Five Black Swan” report, the last of our 2022 outlook series, we concentrate on impactful but unlikely events. These black swans emerge directly from the existing themes and trends in our research – they are not plucked at random. The key regions are highlighted in Map 1.
Chart
Black Swan #1: Major Social Unrest Erupts In China China’s financial problems are front and center risks for investors this year. They qualify as a “Gray Rhino” rather than “Black Swan” risk.1 It is entirely probable that China’s financial and property sector distress will negatively impact Chinese and global financial markets in 2022. What investors are not expecting is an eruption of social unrest in China that fouls up the twentieth national party congress this fall and calls into question the Communist Party’s official narrative that it is handling the pandemic and the underlying economic transition smoothly. Social unrest is a major risk around the world in the face of the new bout of inflation. Most of the democracies have already changed governments since the pandemic began, recapitalizing their political systems, but major emerging markets – Russia, India, Turkey, Brazil – have not done so. They have seen steep losses of popular support for both political leaders and ruling parties. There is little opinion polling from China and people who are surveyed cannot speak openly. It is possible that the government’s support has risen given its minimization of deaths from the pandemic. But it is also possible that it has not. Beijing’s policies over the past few years have had a negative impact on the country’s business elite and foreign relations. There are disgruntled factions within China, though the current administration has a tight grip over the main organs of power. Since President Xi is trying to clinch his personal rule this fall, sending China down a path of autocracy that proved disastrous under Chairman Mao Zedong, it is possible he will face surprise resistance. China’s economic growth is decelerating, clocking in at a 4.0% quarter-on-quarter growth rate at the end of last year. While authorities are easing policy to secure the recovery, there is a danger of insufficient support. Private sentiment will remain gloomy, as reflected by weak money velocity and a low propensity to spend among both businesses and households (Chart 2). The government will continue to be repressive in the lead up to the political reshuffle. At least for the first half of the year the economy will remain troubled. Structurally China is ripe for social unrest. It suffers from high income inequality and low social mobility, comparable to the US and Brazil, which are both struggling with political upheaval (Chart 3). Chart 2China's Private Sector Still Depressed
China's Private Sector Still Depressed
China's Private Sector Still Depressed
Chart 3
In addition China is keeping a stranglehold over Covid-19. This “Zero Covid” policy minimizes deaths but suppresses economic activity. Strict policy has also left the population with a very low level of natural immunity and the new Omicron variant is even more contagious than other variants. Hence the regime is highly likely to double down to prevent an explosive outbreak. The service side of the economy will continue to suffer if strict lockdowns are maintained, exacerbating household and business financial difficulties (Chart 4). Yet in other countries around the world, government decisions to return to lockdowns have sparked unrest. Chart 4Zero Covid Policy: Not Sustainable Beyond 2022
Zero Covid Policy: Not Sustainable Beyond 2022
Zero Covid Policy: Not Sustainable Beyond 2022
China’s “Misery Index” (unemployment plus inflation) is rising sharply. While misery is ostensibly lower than that of other emerging markets, China’s unemployment data is widely known to be unreliable. If we take a worst-case scenario, looking at youth unemployment and fuel prices, misery is a lot higher (Chart 5). The youth, who are having the hardest time finding jobs, are also the most likely to protest if conditions become intolerable (Chart 6). Of course, if social unrest is limited to students, it will lack support among the wider populace. But it is inflation, not youth activism, that is the reason for China’s authorities to be concerned, as inflation is a generalized problem that affects workers as well as students. Chart 5China's Misery Index Is Higher Than It Looks
China's Misery Index Is Higher Than It Looks
China's Misery Index Is Higher Than It Looks
Chart 6China's Troubled Youth
China's Troubled Youth
China's Troubled Youth
Why would protesters stick their necks out knowing that the Communist Party will react ferociously to any sign of instability during President Xi Jinping’s political reshuffle? True, mainland Chinese do not have the propensity to political activism that flared up in protests in Hong Kong in recent years. Also the police state will move rapidly to repress any unrest. Yet the entire focus of Xi Jinping’s administration, since 2012, has been the restoration of political legitimacy and prevention of popular discontent. Xi has cracked down on corruption, pollution, housing prices, education prices, and has announced his “Common Prosperity” agenda to placate the low and middle classes.2 The regime has also cracked down on the media, social media, civil society, and ideological dissent to prevent political opposition from taking root. If the government were not concerned about social instability, it would not have been adopting these policies. Disease, often accompanied by famines or riots, has played a role in the downfall of six out of ten dynasties, so Beijing will not be taking risks for granted (Table 1). Table 1Disease And Downfall Of Chinese Dynasties
Five Black Swans For 2022
Five Black Swans For 2022
Social instability would have a major impact as it would affect China’s stability and global investor sentiment toward China. Western democracies would penalize China for violations of human rights, leaving China even more isolated. Bottom Line: Investors should stay short the renminbi and neutral Chinese equities. Foreign investors should steer clear of Chinese bonds in the event of US sanctions. After the party congress this fall there will be an opportunity to reassess whether Xi Jinping will “let a hundred flowers bloom,” thus improving the internal and external political and investment environment, but this is not at all clear today. Black Swan #2: Russia Invades All (Not Just Part) Of Ukraine US-Russia relations are on the verge of total collapse and Russian equities have sold off, in line with our bearish recommendations in reports over the past two years. Russia’s threat of re-invading Ukraine is credible. Western nations are still wishy-washy about the counter-threat of economic sanctions, judging by German Chancellor Olaf Scholz’s latest comments, and none are claiming they will go to war to defend Ukraine.3 Russia is looking to remove the threat of Ukraine integrating militarily and economically with the West. The US and UK are providing Ukraine with defense weaponry even as Russia specifically demands that they cease to do so. President Putin may choose short-term economic pain for long-term security gain. The consensus view is that if Russia does invade, it will undertake a limited invasion. But what if Russia invades all of Ukraine? To be clear, a full invasion is unlikely because it would be far more difficult and costly for Russia. It would go against Putin’s strategy of calculated risk and limited conflict. Table 2 compares Russia and Ukraine in size and strength, alongside a comparison of the US and Iraq in 2002. This is not a bad comparison given that Ukraine’s and Iraq’s land area and active military personnel are comparable. Table 2Russia-Ukraine Balance Of Power 2022 Compared To US-Iraq 2002
Five Black Swans For 2022
Five Black Swans For 2022
Russia would be biting off a much bigger challenge than the US did. Ukraine’s prime age population is 2.5 times larger than Iraq’s in 2002, and its military expenditure is three times bigger. The US GDP and military spending were 150 and 250 times bigger than Iraq’s, while Russia’s GDP and military spending are about ten times bigger than Ukraine’s today. Iraq was not vital to American national security, whereas Ukraine is vital to Russia; Russia has more at stake and is willing to take greater risks. But Ukraine is in better shape to resist Russian occupation than Iraq was to resist American. The point is that the US invasion went smoothly at first, then got bogged down in insurgency, and ultimately backfired both in political and geopolitical terms. Russia would be undertaking a massive expense of blood and treasure that seems out of proportion with its goal, which is to neutralize Ukraine’s potential to become a western defense ally and host of “military infrastructure.” However, there are drawbacks to partial invasion. The remainder of the Ukrainian state would be unified and mobilized, capable of integrating with the western world, and willing to support a permanent insurgency against Russian troops in eastern Ukraine. Russia has forces in Belarus, Crimea, and the Black Sea, as well as on Ukraine’s eastern border, giving rise to fears that Russia could attempt a three-pronged invasion of the whole country. In short, it is conceivable that Russian leaders could make the Soviet mistake of overreaching in the military aims, or that a war in eastern Ukraine could inadvertently expand into the west. If Russia tries to conquer all of Ukraine, the global impact will be massive. A war of this size on the European continent for the first time since World War II would shake governments and populations to their bones. The borders with Poland, Romania, the Baltic states, Slovakia, Hungary, Finland and the Black Sea area would become militarized (Map 2).
Chart
NATO actions to secure its members and fortify their borders would exacerbate tensions with Russia and fan fears of a wider war. Trade flows would become subject to commerce destruction, affecting even neutral nations, including in the Black Sea. Energy supplies would tighten further, sending Russia and probably Europe into recession. The disruption to business and travel across eastern Europe would be deep and lasting, not only due to sanctions but also due to a deep risk-aversion that would affect foreign investors in the former Soviet Union and former Warsaw Pact. Germany would be forced to quit sitting on the fence, as it would be pressured by the US and the rest of Europe to stand shoulder to shoulder in the face of such aggression. Finland and Sweden would be much more likely to join NATO, exacerbating Russia’s security fears. Russia would suffer a drastic loss of trade, resulting in recession, and its currency collapse would feed inflation (Chart 7). Chart 7Inflation Poses Long-Term Threat To Putin Regime
Inflation Poses Long-Term Threat To Putin Regime
Inflation Poses Long-Term Threat To Putin Regime
Ultimately the consequences would be negative for the Putin regime and Russia as a result of recession and international isolation. But in the short run the Russian people would rally around the flag and support a war designed to prevent NATO from stationing missiles on their doorstep. And their isolation would not be total, as they would strengthen ties with China and conduct trade via proxy states in the former Soviet Union. Bottom Line: A full-scale invasion of all of Ukraine is highly unlikely because it would be so costly for Russia in military, economic, and political terms. But the probability is not zero, especially because a partial re-invasion could lead to a larger war. While global investors would react in a moderate risk-off matter to a limited war in eastern Ukraine, a full-scale war would trigger a massive global flight to safety as it would call into question the entire post-WWII peace regime in Europe. Black Swan #3: Israel Attacks Iran The “bull market in Iran tensions” continues as there is not yet a replacement for the 2015 nuclear deal that the US abrogated. Our 2022 forecast that the UAE would get caught in the crossfire was confirmed on January 17 when Iran-backed Houthi rebels expanded their range of operations and struck Abu Dhabi (Map 3). The secret war is escalating and US-led diplomacy is faltering.
Chart
Iran is not going to give up its nuclear program. North Korea achieved nuclear arms and greater military security and is now developing first and second strike capabilities. Meanwhile Ukraine, which faces another Russian invasion, exemplifies what happens to regimes that give up nuclear arms (as do Libya and Iraq). Iran appears to be choosing the North Korean route. While we cannot rule out a minor agreement between President Biden and Iranian President Ebrahim Raisi, we can rule out a substantial deal that halts Iran’s nuclear and missile progress. Here’s why: Any day now Iran could reach nuclear “breakout capacity,” with enough highly enriched uranium to construct a nuclear device (Table 3).4 Table 3Iran’s Violations Of 2015 Nuclear Deal Since US Exit
Five Black Swans For 2022
Five Black Swans For 2022
Within Iran’s government, the foreign policy doves have been humiliated and kicked out of office while the hawks are fully in control. No meaningful agreement can be reached before 2024 because of the risk that the US will change ruling parties again and renege on any promises. Iran is highly incentivized to make rapid progress on its nuclear program now. The US will not be able to lead the P5+1 coalition to force Iran to halt its program because of its ongoing struggles with Russia and China. China is striking long-term cooperation deals with Iran. Israel has a well-established record of taking unilateral action, specifically against regional nuclear programs, known as the “Begin Doctrine.”5 Israel’s threats are credible on this front, although Iran is a much greater operational challenge than Iraq or Syria. Iran’s timeline from nuclear breakout to deliverable nuclear weapon is 12-24 months.6 Iran’s missile program is advanced. Missile programs cannot be monitored as easily as nuclear activity, so foreign powers base the threshold on nuclear capability rather than missile capability. Iran had a strong incentive to move slowly on its nuclear and missile programs in earlier years, to prevent US and Israeli military interference. But as it approaches breakout capacity it has an incentive to accelerate its tempo to a mad dash to achieve nuclear weaponization before the US or Israel can stop it. Now that time may have come. The Biden administration is afraid of higher oil prices and Israeli domestic politics are more divided and risk-averse than before. And yet Iran’s window might close in 2025, as the US could turn aggressive again depending on the outcome of the 2024 election. Hence Iran has an incentive to make its dash now. The US and Israel will restate their red lines against Iranian nuclear weaponization and brandish their military options this year. But the Biden administration will be risk-averse since it does not want to instigate an oil shock in an election year. Israel is more likely than the US to react quickly and forcefully since it is in greatest danger if Iran surprises the world with rapid weaponization. Here are the known constraints on unilateral Israeli military action: Limited Israeli military capability: Israel would have to commit a large number of aircraft, leaving its home front exposed, and even with US “bunker buster” bombs it may not penetrate the underground Fordow nuclear facility.7 Limited Israeli domestic support: The Israeli public is divided on whether to attack Iran. The post-Netanyahu government recently came around to endorsing the US’s attempt to renegotiate the nuclear deal. Limited US support: Washington opposes Israeli unilateralism that could entangle the US into a war. Israel cannot afford to alienate the US, which is its primary security guarantor. Iranian instability: The Iranian regime is under economic distress due to “maximum pressure” sanctions. It is vulnerable to social unrest, not least because of its large youth population. These constraints have been vitiated in various ways, which is why we raise this Israeli unilateralism as a black swan risk: Where there’s a will, there’s a way: If Israel believes its existence will be threatened, it will be willing to take much greater operational risks. It has already shown some ability to set back Iran's centrifuge program beyond the expected.8 Israeli opinion will harden if Iran breaks out: If Iran reaches nuclear breakout or tests a nuclear device, Israeli opinion will harden in favor of military strikes. Prime Minister Naftali Bennett has an incentive to take hawkish actions before he hands the reins of government over to a partner in his ruling coalition as part of a power-sharing agreement. The ruling coalition is so weak that a collapse cannot be ruled out. US opposition could weaken: Biden will have to explore military options if talks fail and Iran reaches nuclear breakout capacity. Once the midterms are over, Israel may have even more freedom to act, while a gridlocked Biden may be looking to shift his focus to foreign policy. Iranian stability: Iran’s social instability has not resulted in massive unrest or regime fracture despite years of western sanctions and a global recession/pandemic. Yet now energy prices are rising and Iran has less reason to believe sanction regimes will be watertight. From Israeli’s point of view, even regime change in Iran would not remove the nuclear threat once nuclear weapons are obtained. Finally, while Israel cannot guarantee that military strikes would successfully cripple Iran’s nuclear program and prevent weaponization, Israel cannot afford not to try. It would be a worse outcome to stand idly by while Iran gets a nuclear weapon than to attack and fail to set that program back. Hence the likeliest outcome over the long run is that Iran pursues a nuclear weapon and Israel attacks to try to stop it, even if that attack is likely to fail (Diagram 1). Diagram 1Game Theory: Will Israel Attack Iran?
Five Black Swans For 2022
Five Black Swans For 2022
Bottom Line: A unilateral Israeli strike is unlikely but would have a massive impact, as 21% of global oil and 26% of natural gas flows through the Strait of Hormuz, and conflict could disrupt regional energy production and/or block passage through the strait itself. Black Swan #4: Cyber Attacks Spill Into Real World Investors are very aware of cyber security risks – it holds a respectable though not commanding position in the ranks of likely crisis events (Table 4). Our concern is that a cyber attack could spill over into the real world, impairing critical infrastructure, supply chains, and/or prompting military retaliation. Table 4Cyber Events Underrated In Consensus View Of Global Risks
Five Black Swans For 2022
Five Black Swans For 2022
Russian attacks on US critical infrastructure by means of ransomware gangs disrupted a US fuel pipeline, meat-packing plant, and other critical infrastructure in 2021. Since then the two countries have engaged in negotiations over cyber security. The Russian Federal Security Bureau has cracked down on one of the most prominent gangs, REvil, in a sign that the US and Russia are still negotiating despite the showdown over Ukraine.9 Yet a re-invasion of Ukraine would shatter any hope of cooperation in the cyber realm or elsewhere. Russia is already using cyberattacks against Ukraine and these activities could expand to Ukraine’s partners if the military conflict expands. Should the US and EU impose sweeping sanctions that damage Russia’s economy, Russia could retaliate, not only by tightening energy supply but also by cyber attacks. Any NATO partners or allies would be vulnerable, though some states will be more reactive than others. Interference in the French election, for example, would be incendiary. The key question is: if Russia strikes NATO states with damaging cyber attacks, at what point would it trigger Article V, the mutual defense clause? There are no established codes of conduct or red lines in cyber space, so the world will have to learn each nation’s limits via confrontation and retaliation. Similar cyber risks could emerge from other conflicts. China is probably not ready to invade Taiwan but it has an interest in imposing economic costs on the island ahead of this fall’s midterm elections. Taiwan’s critical role in the semiconductor supply chain means that disruptions to production would have a global impact. Israel and the US have already used cyber capabilities to attack Iran and set back its nuclear program. These capabilities will be necessary as Iran approaches breakout capacity. Yet Iran could retaliate in a way that disrupts oil supplies. North Korea began a new cycle of provocations last September, accelerated missile tests over the past four months, and is dissatisfied with the unfinished diplomatic business of the Trump administration. In the wake of the last global crisis, 2010, it staged multiple military attacks against South Korea. South Korea may be vulnerable due to its presidential elections in May. The semiconductor or electronics supply chain could be interrupted here as well as in Taiwan. Bottom Line: There is no code of conduct in cyber space. As geopolitical tensions rise, and nations test the limits of their cyber capabilities, there is potential for critical infrastructure to be impaired. This could exacerbate supply chain kinks or provoke kinetic responses from victim nations. Black Swan #5: OPEC 2.0 Falls Apart The basis of the OPEC 2.0 cartel is Russian cooperation with Saudi Arabia to control oil supply and manage the forward price curve. Backwardation, when short-term prices are higher than long-term, is ideal for these countries since they fear that long-term prices will fall. In a world where Moscow and Riyadh both face competition from US shale producers as well as the green energy revolution, cooperation makes sense. Yet the two sides do not trust each other. Cooperation broke down both in 2014 and 2020, sending oil prices plunging. Falling global demand ignited a scramble for market share. Interestingly, Russian military invasions have signaled peak oil price in 1979, 2008, and 2014. Russia, like other petro-states, has greater room for maneuver when oil revenues are pouring in. But high prices also incentivize production, disincentivize cartel discipline, and trigger reductions in global demand (Chart 8). Chart 8Russian Invasions And Oil Price Crashes
Russian Invasions And Oil Price Crashes
Russian Invasions And Oil Price Crashes
Broadly speaking, Saudi oil production rose modestly during times of Russian military adventures, while overall OPEC production was flat or down, and Russian/Soviet production went up (Chart 9). Chart 9Saudi And OPEC Oil Production During Russian Military Adventures
Saudi And OPEC Oil Production During Russian Military Adventures
Saudi And OPEC Oil Production During Russian Military Adventures
Since 2020, we have held that OPEC 2.0 would continue operating but that the biggest risk would come in the form of a renewed US-Iran nuclear deal that freed up Iranian oil exports. In 2014, the Saudis increased production in the face of the US shale threat as well as the Iranian threat. This scenario is still possible in 2022 but it has become a low-probability outcome. Even aside from the Iran dynamic, there is some probability that Russo-Saudi cooperation breaks down as global growth decelerates and new oil supply comes online. Bottom Line: The world’s inflation expectations are elevated and closely linked to oil prices. Yet oil prices hinge on an uneasy political agreement between Russia and Saudi Arabia that has fallen apart twice before. If Russia invades Ukraine, or if US withdraws sanctions on Iran, for example, then Saudi Arabia could make a bid to expand its market share and trigger price declines in the process. Two Bonus Black Swans: Turkey And Venezuela Turkey lashes out: Our Turkish Political Capital Index shows deterioration for President Recep Erdogan’s political capital across a range of variables (Table 5). With geopolitical pressures increasing, and domestic politics heating up ahead of the 2023 elections, Erdogan’s behavior will become even more erratic. His foreign policy could become aggressive, keeping the lira under pressure and/or weighing on European assets. Table 5Turkey: Erdogan’s Political Capital Wearing Thin
Five Black Swans For 2022
Five Black Swans For 2022
Venezuela’s Maduro falls from power: Venezuelan regime changes often follow from military coups. These coups do not only happen when oil prices collapse – sometimes the army officers wait to be sure prices have recovered. Coup-throwers want strong oil revenues to support their new rule. An unexpected change of regimes would affect the oil market due to this country’s giant reserves. Bottom Line: Turkey’s political instability could result in foreign aggression, while Venezuela’s regime could collapse despite the oil price recovery. Investment Takeaways We are booking profits on our tactical long trades on large caps and defensive sectors. We will convert these to relative trades: long large caps over small caps, and long defensives over cyclicals. We also recommend converting our tactical long Japan trade into long Japanese industrials / short German industrials equities. If US-Russia diplomacy averts a war we will reconsider. Matt Gertken Vice President Geopolitical Strategy mattg@bcaresearch.com Footnotes 1 “Gray Rhino” is a term coined by author Michele Wucker to describe large and probable risks that people neglect or avoid. For more, see thegrayrhino.com. 2 Xi Jinping recently characterized the “common prosperity” agenda as follows: “China has made it clear that we strive for more visible and substantive progress in the well-rounded development of individuals and the common prosperity of the entire population. We are working hard on all fronts to deliver this goal. The common prosperity we desire is not egalitarianism. To use an analogy, we will first make the pie bigger, and then divide it properly through reasonable institutional arrangements. As a rising tide lifts all boats, everyone will get a fair share from development, and development gains will benefit all our people in a more substantial and equitable way.” See World Economic Forum, “President Xi Jinping’s message to The Davos Agenda in full,” January 17, 2022, weforum.org. 3 Chancellor Scholz, when asked whether Germany would avoid using the Nord Stream II pipeline if Russia re-invaded Ukraine, said, "it is clear that there will be a high cost and that all this will have to be discussed if there is a military intervention against Ukraine.” He was speaking with NATO Secretary-General Jens Stoltenberg. See Hans Von Der Burchard, “Scholz: Germany will discuss Nord Stream 2 penalties if Russia attacks Ukraine,” Politico, January 18, 2022, politico.eu. 4 For the Begin Doctrine, see Meir Y. Soloveichik, “The Miracle of Osirak,” Commentary, April 2021, commentary.org. 5 The estimate of 12-24 months to mount a nuclear warhead on a missile has been cited by various credible sources, including David Albright and Sarah Burkhard, “Highlights of Iran’s Perilous Pursuit of Nuclear Weapons,” Institute for Science and International Security, August 24, 2021, isis-online.org, and Eric Brewer and Nicholas L. Miller, “A Redline for Iran?” Foreign Affairs, December 23, 2021, foreignaffairs.com. 6 See Edieal J. Pinker, Joseph Szmerekovsky, and Vera Tilson, “Technical Note – Managing a Secret Project,” Operations Research, February 5, 2013, pubsonline.informs.org, as well as “What Can Game Theory Tell Us About Iran’s Nuclear Intentions?” Yale Insights, March 17, 2015, insights.som.yale.edu. 7 See Josef Joffe, “Increasingly Isolated, Israel Must Rely On Nuclear Deterrence,” Strategika 35 (September 2016), Hoover Institution, hoover.org. 8 The sabotage of the Iran Centrifuge Assembly Center at the Natanz nuclear facility in July 2020 “set back Iran’s centrifuge program significantly and continues to do so,” according to David Albright, Sarah Burkhard, and John Hannah, “Iran’s Natanz Tunnel Complex: Deeper, Larger Than Expected,” Institute for Science and International Security, January 13, 2022, isis-online.org. For a recent positive case regarding Israel’s capabilities, see Mitchell Bard, “Military Options Against Iran,” Jewish Virtual Library, American-Israeli Cooperative Enterprise, January 2022, jewishvirtuallibrary.org. 9 For the FSB and REvil, see Chris Galford, “Russian FSB arrests members of REvil ransomware gang following attacks on U.S. infrastructure,” Homeland Preparedness News, January 18, 2022, homelandprepnews.com. For the Colonial Pipeline and JBS attacks, and other ransomware attacks, see Jonathan W. Welburn and Quentin E. Hodgson, “How the United States Can Deter Ransomware Attacks,” RAND Blog, August 9, 2021, rand.org. Strategic Themes Open Tactical Positions (0-6 Months) Open Cyclical Recommendations (6-18 Months)
Highlights Global equities are poised to deliver mid-to-high single-digit returns this year, with the outlook turning bleaker in 2023 and beyond. Non-US markets are likely to outperform. We examine the four pillars that have historically underpinned stock market performance. Pillar 1: Technically, the outlook for equities is modestly bullish, as investor sentiment is nowhere near as optimistic as it usually gets near market tops. Pillar 2: The outlook for economic growth and corporate earnings is modestly bullish as well. While global growth is slowing, it will remain solidly above trend in 2022. Pillar 3: Monetary and financial conditions are neutral. The Fed and a number of other central banks are set to raise rates and begin unwinding asset purchases this year. However, monetary policy will remain highly accommodative well into 2023. Pillar 4: Valuations are bearish in the US and neutral elsewhere. Investors should avoid tech stocks in 2022, focusing instead on banks and deep cyclicals, which are more attractively priced. The Bedrock For Equities In assessing the outlook for the stock market, our research has focused on four pillars: 1) Sentiment and other technical factors, which are most pertinent for stocks over short-term horizons of about three months; 2) cyclical fluctuations in economic growth and corporate earnings, which tend to dictate the path for stocks over medium-term horizons of about 12 months; 3) monetary and financial conditions, which are also most relevant over medium-term horizons; and finally 4) valuations, which tend to drive stocks over the long run. In this report, we examine all four pillars, concluding that global equities are likely to deliver mid-to-high single-digit returns this year, with the outlook turning bleaker in 2023 and beyond. Pillar 1: Sentiment And Other Technical Factors (Modestly Bullish) Chart 1US Equities: Breadth Is A Concern
US Equities: Breadth Is A Concern
US Equities: Breadth Is A Concern
Scaling The Wall Of Worry Stocks started the year on a high note, before tumbling on Wednesday following the release of the Fed minutes. Market breadth going into the year was quite poor. Even as the S&P 500 hit a record high on Tuesday, only 57% of NYSE stocks and 38% of NASDAQ stocks were trading above their 200-day moving averages compared to over 90% at the start of 2021 (Chart 1). The US stock market had become increasingly supported by a handful of mega-cap tech stocks, a potentially dangerous situation in an environment where bond yields are rising and stay-at-home restrictions are apt to ease (more on this later). That said, market tops often occur when sentiment reaches euphoric levels. That was not the case going into 2022 and it is certainly not the case after this week's sell-off. The number of bears exceeded the number of bulls in the AAII survey this week and in six of the past seven weeks (Chart 2). The share of financial advisors registering a bullish bias declined by 25 percentage points over the course of 2021 in the Investors Intelligence poll. Option pricing is far from complacent. The VIX stands at 19.6, above its post-GFC median of 16.7. According to the Minneapolis Fed’s market-based probabilities model, the market was discounting a slightly negative 12-month return for the S&P 500 as of end-2021, with a 3.6 percentage-point larger chance of a 20% decline in the index than a 20% increase (Chart 3). Chart 3Option Pricing Is Not Pointing To Elevated Complacency
Option Pricing Is Not Pointing To Elevated Complacency
Option Pricing Is Not Pointing To Elevated Complacency
Chart 2Sentiment Is Not Exceptionally Bullish, Despite The S&P 500 Trading Close To All-Time Highs
Sentiment Is Not Exceptionally Bullish, Despite The S&P 500 Trading Close To All-Time Highs
Sentiment Is Not Exceptionally Bullish, Despite The S&P 500 Trading Close To All-Time Highs
Equities do best when sentiment is bearish but improving (Chart 4). With bulls in short supply, stocks can continue to climb the proverbial wall of worry. Whither The January Effect? Historically, stocks have fared better between October and April than between May and September (Chart 5). One caveat is that the January effect, which often saw stocks rally at the start of the year, has disappeared. In fact, the S&P 500 has fallen in January by an average annualized rate of 5.2% since 2000 (Table 1). Other less well-known calendar effects – such as the tendency for stocks to underperform on Mondays but outperform on the first trading day of each month – have persisted, however.
Chart 4
Chart 5
Table 1Calendar Effects
The Four Pillars Of The Stock Market
The Four Pillars Of The Stock Market
Bottom Line: January trading may be choppy, but stocks should rise over the next few months as more bears join the bullish camp. Last year’s losers are likely to outperform last year’s winners. Pillar 2: Economic Growth And Corporate Earnings (Modestly Bullish) Economic Growth And Earnings: Joined At The Hip The business cycle is the most important driver of stocks over medium-term horizons of about 12 months. The reason is evident in Chart 6: Corporate earnings tend to track key business cycle indicators such as the ISM manufacturing index, industrial production, business sales, and global trade. Chart 6The Business Cycle Is The Most Important Driver Of Stocks Over Medium-Term Horizons
The Business Cycle Is The Most Important Driver Of Stocks Over Medium-Term Horizons
The Business Cycle Is The Most Important Driver Of Stocks Over Medium-Term Horizons
Chart 7PMIs Signaling Above-Trend Growth
PMIs Signaling Above-Trend Growth
PMIs Signaling Above-Trend Growth
Global growth peaked in 2021 but should stay solidly above trend in 2022. Both the service and manufacturing PMIs remain in expansionary territory (Chart 7). The forward-looking new orders component of the ISM exceeded 60 for the second straight month in December. The Bloomberg consensus is for real GDP to rise by 3.9% in the G7 in 2022, well above the OECD’s estimate of trend G7 growth of 1.4% (Chart 8). Global earnings are expected to increase by 7.1%, rising 7.5% in the US and 6.7% abroad (Chart 9). Our sense is that both economic growth and earnings will surprise to the upside in 2022. Chart 9Analysts Expect Single-Digit Earnings Growth
Analysts Expect Single-Digit Earnings Growth
Analysts Expect Single-Digit Earnings Growth
Chart 8
Plenty Of Pent-Up Demand For Both Consumer And Capital Goods US households are sitting on $2.3 trillion in excess savings (Chart 10). Around half of these savings will be spent over the next few years, helping to drive demand. Households in the other major advanced economies have also buttressed their balance sheets. Chart 10Plenty Of Pent-Up Demand
Plenty Of Pent-Up Demand
Plenty Of Pent-Up Demand
After two decades of subdued corporate investment, capital goods orders have soared. This bodes well for capex in 2022. Inventories remain at rock-bottom levels, which implies that output will need to exceed spending for the foreseeable future (Chart 11). On the residential housing side, both the US homeowner vacancy rate and the inventory of homes for sale are near multi-decade lows. Building permits are 11% above pre-pandemic levels (Chart 12). Chart 11Business Investment Should Be Strong In 2022
Business Investment Should Be Strong In 2022
Business Investment Should Be Strong In 2022
Chart 12Residential Construction Will Remain Well Supported
Residential Construction Will Remain Well Supported
Residential Construction Will Remain Well Supported
Chart 13China's Credit Impulse Has Bottomed
China's Credit Impulse Has Bottomed
China's Credit Impulse Has Bottomed
Chinese Growth To Rebound, Europe To Benefit From Lower Natural Gas Prices Chinese credit growth decelerated last year. However, the 6-month credit impulse has bottomed, and the 12-month impulse is sure to follow (Chart 13). Chinese coal prices have collapsed following the government’s decision to instruct 170 mines to expand capacity (Chart 14). China generates 63% of its electricity from coal. Lower energy prices and increased stimulus should support Chinese industrial activity in 2022. Like China, Europe will benefit from lower energy costs. Natural gas prices have fallen by nearly 50% from their peak on December 21st. A shrinking energy bill will support the euro (Chart 15). Chart 14Coal Prices Are Renormalizing In China
Coal Prices Are Renormalizing In China
Coal Prices Are Renormalizing In China
Chart 15A Shrinking Energy Bill Will Support The Euro
A Shrinking Energy Bill Will Support The Euro
A Shrinking Energy Bill Will Support The Euro
Chart 16
Omicron Or Omicold? While the Omicron wave has led to an unprecedented spike in new cases across many countries, the economic fallout will be limited. The new variant is more contagious but significantly less lethal than previous ones. In South Africa, it blew through the population without triggering a major increase in mortality (Chart 16). Preliminary data suggest that exposure to Omicron confers at least partial immunity against Delta. The general tendency is for viral strains to become less lethal over time. After all, a virus that kills its host also kills itself. Given that Omicron is crowding out more dangerous strains such as Delta, any future variant is likely to emanate from Omicron; and odds are this new variant will be even milder than Omicron. Meanwhile, new antiviral drugs are starting to hit the market. Pfizer claims that its new drug, Paxlovid, cuts the risk of hospitalization by almost 90% if taken within five days from the onset of symptoms. Bottom Line: While global growth has peaked and the pandemic remains a risk, growth should stay well above trend in the major economies in 2022, fueling further gains in corporate earnings and equity prices. Pillar 3: Monetary And Financial Factors (Neutral) Chart 17The Overall Stance Of Monetary Policy Will Not Return To Pre-Pandemic Levels For At Least Another 12 Months
The Overall Stance Of Monetary Policy Will Not Return To Pre-Pandemic Levels For At Least Another 12 Months
The Overall Stance Of Monetary Policy Will Not Return To Pre-Pandemic Levels For At Least Another 12 Months
Tighter But Not Tight Monetary and financial factors help govern the direction of equity prices both because they influence economic growth and also because they affect the earnings multiple at which stocks trade. There is little doubt that a number of central banks, including the Federal Reserve, are looking to dial back monetary stimulus. However, there is a big difference between tighter monetary policy and tight policy. Even if the FOMC were to raise rates three times in 2022, as the market is currently discounting, the fed funds rate would still be half of what it was on the eve of the pandemic (Chart 17). Likewise, even if the Fed were to allow maturing assets to run off in the middle of this year, as the minutes of the December FOMC meeting suggest is likely, the size of the Fed’s balance sheet will probably not return to pre-pandemic levels until the second half of this decade. A Higher Neutral Rate We have argued in the past that the neutral rate of interest in the US is higher than widely believed. This implies that the overall stance of monetary policy remains exceptionally stimulative. Historically, stocks have shrugged off rising bond yields, as long as yields did not increase to prohibitively high levels (Table 2). Table 2As Long As Bond Yields Don’t Rise Into Restrictive Territory, Stocks Will Recover
The Four Pillars Of The Stock Market
The Four Pillars Of The Stock Market
If the neutral rate ends up being higher than the Fed supposes, the danger is that monetary policy will stay too loose for too long. The question is one of timing. The good news is that inflation should recede in the US in 2022, as supply-chain bottlenecks ease and spending shifts back from goods to services. The bad news is that the respite from inflation will not last. As discussed in Section II of our recently-published 2022 Strategy Outlook, inflation will resume its upward trajectory in mid-2023 on the back of a tightening labor market and a budding price-wage spiral. This second inflationary wave could force the Fed to turn much more aggressive, spelling the end of the equity bull market. Bottom Line: While the Fed is gearing up to raise rates and trim the size of its balance sheet, monetary policy in the US and in other major economies will remain highly accommodative in 2022. US policy could turn more restrictive in 2023 as a second wave of inflation forces a more aggressive response from the Fed. Pillar 4: Valuations (Bearish In The US; Neutral Elsewhere) US Stocks Are Looking Pricey… While valuations are a poor timing tool in the short run, they are an excellent forecaster of stock prices in the long run. Chart 18 shows that the Shiller PE ratio has reliably predicted the 10-year return on equities. Today, the Shiller PE is consistent with total real returns of close to zero over the next decade.
Chart 18
Investors’ allocation to stocks has also predicted the direction of equity prices (Chart 19). According to the Federal Reserve, US households held a record high 41% of their financial assets in equities as of the third quarter of 2021. If history is any guide, this would also correspond to near-zero long-term returns on stocks. Chart 19Valuations Matter For Long-Term Returns (II)
Valuations Matter For Long-Term Returns (II)
Valuations Matter For Long-Term Returns (II)
… But There Is More Value Abroad Valuations outside the US are more reasonable. Whereas US stocks trade at a Shiller PE ratio of 37, non-US stocks trade at 20-times their 10-year average earnings. Other valuation measures such as price-to-book, price-to-sales, and dividend yield tell a similar story (Chart 20). Chart 20AUS Stocks Are Trading At A Significant Premium To Their Non-US Peers (I)
US Stocks Are Trading At A Significant Premium To Their Non-US Peers (I)
US Stocks Are Trading At A Significant Premium To Their Non-US Peers (I)
Chart 20BUS Stocks Are Trading At A Significant Premium To Their Non-US Peers (II)
US Stocks Are Trading At A Significant Premium To Their Non-US Peers (II)
US Stocks Are Trading At A Significant Premium To Their Non-US Peers (II)
Cyclicals And Banks Overrepresented Abroad Our preferred sector skew for 2022 favors non-US equities. Increased capital spending in developed economies and incremental Chinese stimulus should boost industrial stocks and other deep cyclicals, which are overrepresented outside the US (Table 3). Banks are also heavily weighted in overseas markets; they should also do well in response to faster-than-expected growth and rising bond yields (Chart 21). Table 3Deep Cyclicals And Financials Are Overrepresented Outside The US
The Four Pillars Of The Stock Market
The Four Pillars Of The Stock Market
Chart 21Rising Bond Yields Will Help Bank Shares
Rising Bond Yields Will Help Bank Shares
Rising Bond Yields Will Help Bank Shares
Bottom Line: Valuations are more appealing outside the US, and with deep cyclicals and banks set to outperform tech over the coming months, overseas markets are the place to be in 2022. Peter Berezin Chief Global Strategist peterb@bcaresearch.com Global Investment Strategy View Matrix
Image
Special Trade Recommendations
Image
Current MacroQuant Model Scores
Image
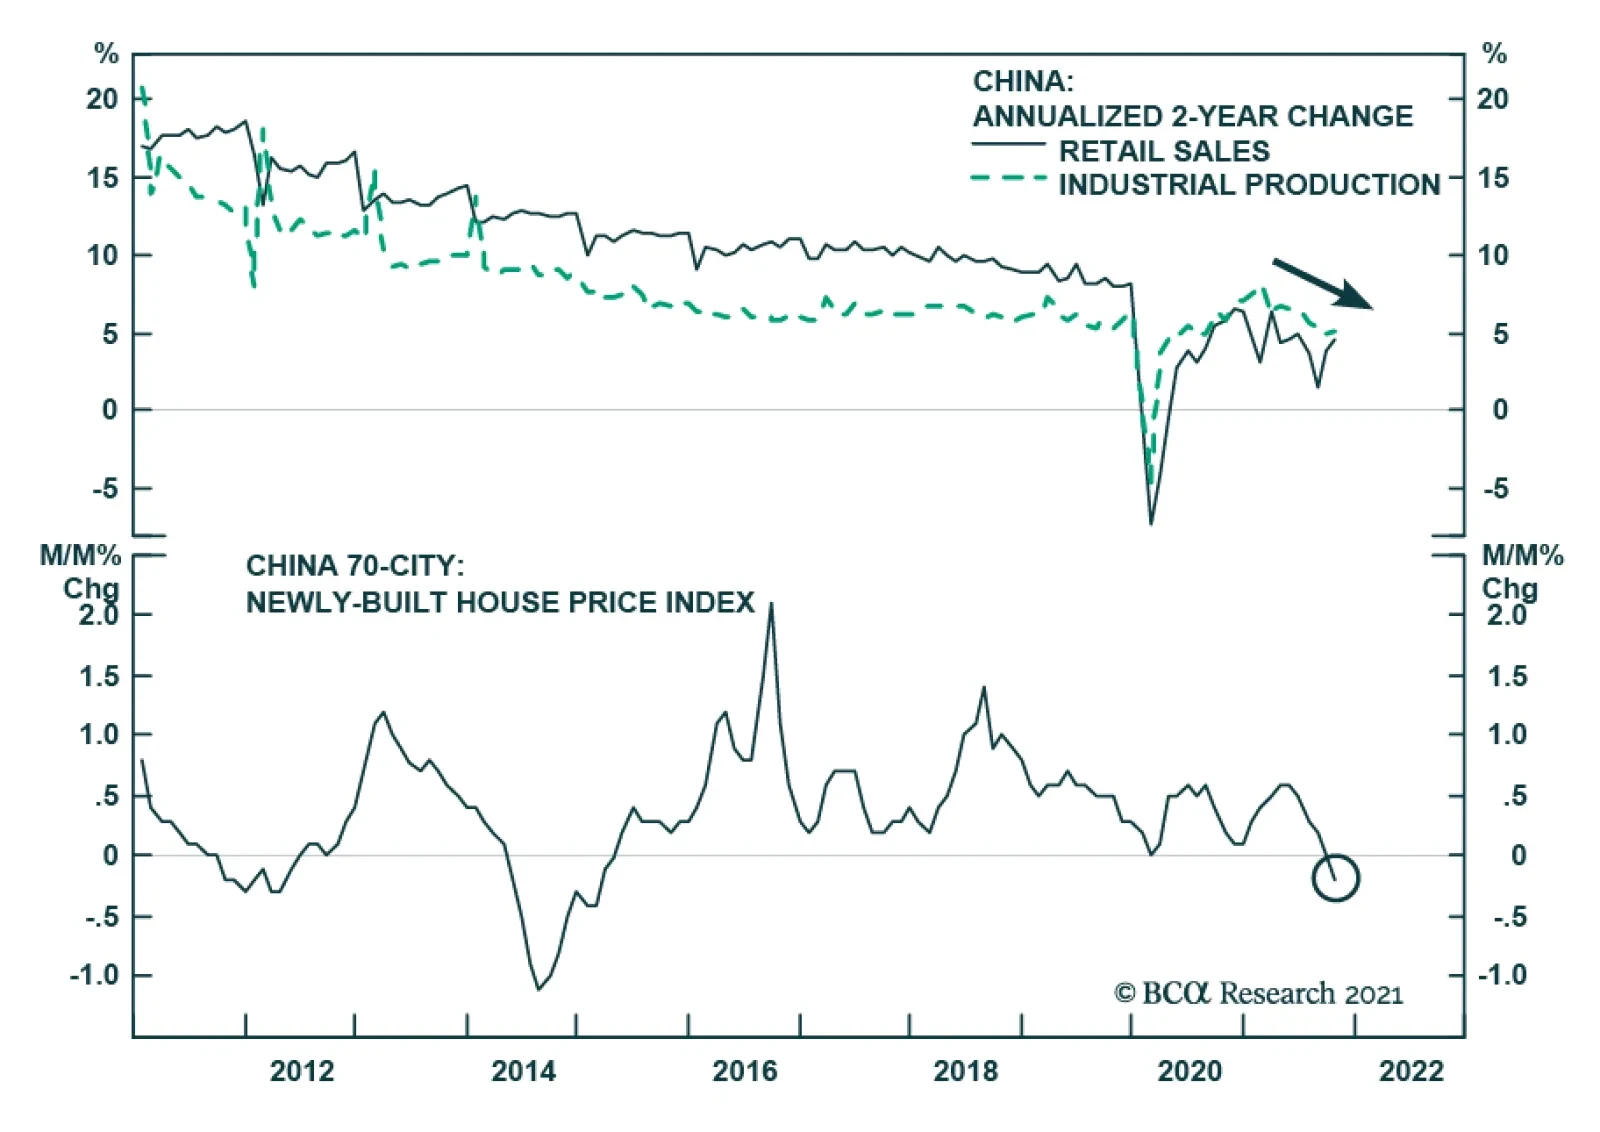
Chinese retail sales and industrial production data for October surprised to the upside. Retail sales growth accelerated slightly from 4.4% to 4.9% y/y and beat expectations of a slowdown to 3.7%. Similarly, industrial production expanded by 3.5% y/y versus…
In this report we examine the risk of stagflation by comparing the current environment to that of the late-1960s and 1970s. Today, investors cannot rule out the possibility of a stagflationary outcome, for four reasons: long-term household inflation expectations have risen significantly over the past year; fiscal policy has been expansionary; monetary policy will remain expansionary at the Fed’s projected terminal Fed funds rate; and component shortages and price increases linked to energy market and supply chain disruptions may persist or worsen over the coming year. However, the strong demand-pull inflationary dynamics that existed in the late-1960s were mostly absent in the lead-up to the pandemic, supply-chain issues are in part due to strong goods demand and supply disruptions that will eventually dissipate, and economic agents do not expect severe price pressures to persist beyond the pandemic. On balance, this points to a stagflationary outcome over the coming 6-24 months as a risk, but not a likely event. Investors should use the Misery Index, which is the sum of the unemployment rate and headline PCE inflation, as a real-time stagflation indicator. The Misery Index underscores that the US economy is unlikely to experience true stagflation unless the unemployment rate rises. A portfolio of the US dollar, the Swiss Franc, and industrial commodities may serve as a useful hedge for investors who are concerned about absolute return prospects in a world in which long-maturity bond yields are rising and risks of stagflationary dynamics are present. Chart II-1The Misery Index Reflects The Risk Of Stagflation
The Misery Index Reflects The Risk Of Stagflation
The Misery Index Reflects The Risk Of Stagflation
Over the past several weeks, concerns about a possible return to 1970s-style stagflation have re-emerged significantly in the minds of many investors. These investors have pointed toward similarities between the current environment and that of the 1970s, including shortages limiting output, a snarled global trade and logistical system, and rising energy prices. Chart II-1 highlights that the US “Misery Index” – the sum of the unemployment rate and headline PCE inflation – rose again over the past several months to high single-digit territory, after having fallen dramatically from April 2020 to February of this year. Panel 2 of Chart II-1 highlights that last year's rise in the Misery Index was driven almost entirely by the unemployment rate, whereas the current level is due to a combination of a modestly elevated unemployment rate and a pronounced acceleration in inflation. The headline PCE deflator has risen above 4%, a level that has not been reached since 1991 during the First Gulf War. In this report, we examine the risk of stagflation by comparing the current environment to that of the late 1960s and 1970s. We conclude that while investors cannot rule out the possibility of a stagflationary outcome, there are important differences that point toward a stagflation outcome over the coming 6-24 months as a risk, not a likely event. We conclude by highlighting assets that may produce absolute returns in a world in which long-maturity bond yields are rising and risks of stagflationary dynamics are present. Revisiting The 1960s And 70s Chart II-2The 1960s Laid The Groundwork For Elevated Inflation
The 1960s Laid The Groundwork For Elevated Inflation
The 1960s Laid The Groundwork For Elevated Inflation
The first step in judging the risk of a return to 1970s-style stagflation is to review, in a detailed way, what caused those conditions. Investors are well aware of the role that two separate energy price shocks played in raising prices and damaging output during this period, but they are less cognizant of the impact that a persistent period of above-trend output and significant labor market tightness had in setting up the conditions for sharply higher inflation. This focus of investors on energy prices partially reflects the fact that the Misery Index increased most visibly in the 1970s and that policymakers in the 1960s may not have realized how extensively economic output was running above its potential. With the benefit of hindsight, Chart II-2 illustrates the extent to which inflationary pressures built up in the 1960s, well before the first oil price shock in 1973. The chart shows that the unemployment rate was below NAIRU – the non-accelerating inflation rate of unemployment – for 70% of the time during the 1960s, and that inflation had already responded to this in the latter half of the decade. Annual headline PCE inflation was running just shy of 5% at the onset of the 1970 recession; it fell to 3% in the aftermath of the recession, but had already begun to reaccelerate in the first half of 1973. Following the 1973/1974 recession, inflation did decelerate significantly, falling from 11-12% to 5% in headline terms, and from 10% to 6% in core terms. But the pace of price appreciation did not fall below 5-6% in the second half of the 1970s, despite a significant and sustained rise in the unemployment rate above its natural rate. The 1975 to 1978 period is especially important for investors to understand, because it is arguably the clearest period of true stagflation in the 1970s. The fact that the Misery Index rose sharply during two major oil price shocks is not particularly surprising in and of itself, given the direct impact of energy prices on headline consumer prices; it is the fact that the index remained so elevated between these shocks, the result of persistently high inflation in the face of significant labor market slack, that is most relevant to investors. There are two reasons that both inflation and unemployment remained high during this period. First, labor market slack was sizeable during these years because the US economy was more energy-intensive in the 1970s than it is today. Chart II-3 highlights that goods-producing employment lagged overall employment growth from late 1973 to late 1977, underscoring that the rise in oil prices significantly impacted jobs growth in energy-intensive industries.
Chart II-3
Second, it is clear that the combination of demand-pull inflation in the late 1960s and the predominantly cost-push inflation of the 1970s led to expectations of persistent inflation among households and firms. The original Phillips Curve, as formulated by New Zealand economist William Phillips in the late 1950s, described a negative relationship between the unemployment rate and the pace of wage growth. Given the close correlation between wage and overall price growth at the time, the Phillips Curve was soon extended and generalized to describe an inverse relationship between labor market slack and overall price inflation. But the experience of the 1970s highlighted that inflation expectations are also an important determinant of inflation, a realization that gave birth to the expectations-augmented (i.e. “modern-day”) Phillips Curve (more on this below). The Stagflation Era Versus Today
Chart II-
Table II-1 presents a stagflation “threat matrix,” representing the Bank Credit Analyst service’s assessment of the various factors that could potentially contribute to a stagflationary environment today, relative to what occurred in the 1960s and 1970s. While we acknowledge that there are some similarities today to what occurred five decades ago, the most threatening factors have been present for a shorter period of time and appear to have a smaller magnitude than what occurred during the stagflationary era. In addition, key factors, such as the visibility available to policymakers and investors about household inflation expectations and the potential output of the economy, would appear to reduce significantly the risk of a stagflationary outcome today. We discuss each of the factors presented in Table II-1 below: Fiscal & Monetary Policy Chart II-4Government Spending Last Cycle Looked Nothing Like The 1960s
Government Spending Last Cycle Looked Nothing Like The 1960s
Government Spending Last Cycle Looked Nothing Like The 1960s
The persistently tight labor market that contributed to the inflationary buildup in the 1960s occurred as a result of easy fiscal and monetary policy. Chart II-4 highlights that the contribution to real GDP growth from government expenditure and investment was very elevated in the 1960s. Chart II-5 shows that a positive output gap in the late 1960s and the first half of the 1970s is well explained by the fact that 10-year US government bond yields were persistently below nominal GDP growth. The relationship between the stance of monetary policy and the output gap only meaningfully diverged in the latter half of the 1970s, during the true stagflationary era that we noted above. Chart II-5Easy Monetary Policy Juiced Aggregate Demand In The 60s And Early 70s
Easy Monetary Policy Juiced Aggregate Demand In The 60s And Early 70s
Easy Monetary Policy Juiced Aggregate Demand In The 60s And Early 70s
Chart II-6Monetary Policy Today Is Extremely Easy
Monetary Policy Today Is Extremely Easy
Monetary Policy Today Is Extremely Easy
Today, it is clear that the stance of fiscal policy has recently been extraordinarily easy, and 10-year US government bond yields have remained well below nominal GDP growth for the better part of the last decade. Relative to estimates of potential nominal GDP growth, 10-year Treasury yields are the lowest they have been since the 1970s (Chart II-6). Ostensibly, this supports concerns that policy might contribute to a stagflationary outcome. These concerns were raised by Larry Summers in March, when he described the Biden administration’s fiscal policy as the “least responsible” that the US has experienced in four decades and warned of the potential inflationary consequences of overheating the economy.1 But there are two important counterpoints to these concerns. First, easy fiscal policy this cycle has followed a period during the last economic cycle in which government spending contributed to the most sustained drag on economic activity since the 1950s. Unlike the 1960s, the unemployment rate has been below NAIRU for only a third of the time over the past decade. In addition, Chart II-7 highlights that fiscal thrust will turn to fiscal drag next year, underscoring the temporary nature of the massive burst in fiscal spending that has occurred in response to the pandemic. Under normal circumstances, the fiscal drag implied by Chart II-7 would substantially raise the risks of a recession next year, but we have noted in previous reports that a significant amount of excess savings remain to support spending and employment. The net impact of these two factors results in a reasonable expectation that the US economy will return to maximum employment next year, but this is a far cry from the 1960s when the unemployment rate was below its natural rate for 70% of the decade.
Chart II-7
Based on conventional measures, US monetary policy has been easy for a decade, but easy monetary policy did not begin to contribute positively to a rise in household sector credit growth last cycle until 2014/2015. This underscores that the natural rate of interest (“R-star”) did fall during the early phase of the last economic expansion. However, we argued in an April report that R-star was likely rising in the latter half of the last expansion,2 and we believe that the terminal Fed funds rate is likely higher than what the Fed is currently projecting, barring any additional negative policy shocks. Thus, while we do not believe that the duration of easy monetary policy over the past decade has laid the groundwork for a major rise in prices, it is now clearly positively contributing to aggregate demand and does risk a future overshoot in prices if long maturity bond yields remain well below the pace of economic growth for a sustained period of time. The Impact Of Shortages Chart II-8Gasoline Shortages Plagued The US Economy In The 1970s
Gasoline Shortages Plagued The US Economy In The 1970s
Gasoline Shortages Plagued The US Economy In The 1970s
Gasoline shortages occurred during the oil shocks of the 1970s and are a key similarity that some investors point toward when comparing the situation today with the stagflationary era. Chart II-8 highlights that the annual growth in real personal consumption expenditures on energy goods and services fell into negative territory on six occasions in the 1970s, although it was most pronounced during the two oil price shocks and their resulting recessions. Today, the impact of shortages appears to be broader than what occurred in the 1970s, but less impactful and not likely to be as long-lasting. Chart II-9 highlights that the OPEC oil embargo of 1973 raised the global oil bill by 2.4% of global GDP and permanently raised the price of oil. The global oil bill will only be fractionally above its pre-pandemic level in 2022, with oil prices at $80/bbl, and, while it is true that US gasoline prices have risen significantly, they are not higher than they were from 2011-2014 (Chart II-10). Chart II-9$80/bbl Oil Is Not Onerous
$80/bbl Oil Is Not Onerous
$80/bbl Oil Is Not Onerous
Chart II-10US Gasoline Prices Are High, But They Have Been Higher
US Gasoline Prices Are High, But They Have Been Higher
US Gasoline Prices Are High, But They Have Been Higher
It is certainly true that global shipping costs have skyrocketed and that this is contributing to the increase in US consumer prices. We estimate, however, that this increase in shipping costs as a share of GDP is no more than a quarter of the impact of the 1973 increase in oil prices, without the attendant negative effects on US goods-producing employment that occurred in the 1970s. If anything, surging shipping costs create an incentive to re-shore manufacturing production, which would contribute positively to US goods-producing employment. We also do not expect the rise in shipping costs to be meaningfully permanent, i.e., shipping costs may ultimately settle at a higher level than they were in late-2019, but at a much lower level than what prevails today. Chart II-11A Tight Labor Market Is Causing Wage Growth To Pick Up
A Tight Labor Market Is Causing Wage Growth To Pick Up
A Tight Labor Market Is Causing Wage Growth To Pick Up
Semiconductor and labor shortages would appear to represent a more salient threat of stagflation in the US, as the domestic production of motor vehicles cannot occur without key inputs and a tight labor market is already contributing to an acceleration in wage growth (Chart II-11). As we noted in Section 1 of our report, auto production significantly impacted growth in the third quarter. However, Chart II-12 highlights that, for now, the breadth of impact of these shortages appears to be limited: the production component of the ISM manufacturing index remains in expansionary territory, industrial production of durable manufacturing excluding motor vehicles and parts has not broken down, and both housing starts and building permits remain above pre-pandemic levels despite this year’s downtrend in permits. Chart II-12Shortages Do Not Yet Seem To Be Broad-Based
Shortages Do Not Yet Seem To Be Broad-Based
Shortages Do Not Yet Seem To Be Broad-Based
A physical shortage of components is a less relevant factor for the services side of the economy, which appears to have re-accelerated meaningfully in October. The services sector is more considerably impacted by shortages in the labor market, which seem to be linked to a still-low labor force participation rate. We noted in our September report that the decline in the participation rate has significantly overshot what would be implied by the ongoing pace of retirements. Chart II-13 highlights that this has occurred not just because of a significant retirement effect, but also because of the shadow labor force (people who want a job but are not currently looking for work) and family responsibilities. We expect that the recent expiry of expanded unemployment insurance benefits, a steady rise in the immunity of the US population, an abating Delta wave of COVID-19, and a likely upcoming reduction in school/classroom closures once the Pfizer/BioNTech vaccine is approved for school-age children will likely ease the labor shortage issue over the coming several months.
Chart II-13
Output Gap Uncertainty It remains a debate among economists why policymakers maintained such easy monetary policy in the 1960s and 1970s, but Chart II-14 highlights that uncertainty about the size of the output gap may have contributed to too-low interest rates. The chart shows the unemployment rate compared with today's estimate of NAIRU, alongside a simple proxy for policymakers’ real time estimate of the natural rate of employment: the cumulative average unemployment rate in the post-war environment. To the extent that policymakers used past averages of the unemployment rate as their guide for NAIRU, Chart II-14 highlights how they may have underestimated the degree to which output was running above its potential level in the 1960s, and would not have even concluded that output was above potential in the early 1970s. Chart II-14Policymakers Overestimated Labor Market Slack In The 60s And 70s
Policymakers Overestimated Labor Market Slack In The 60s And 70s
Policymakers Overestimated Labor Market Slack In The 60s And 70s
Chart II-15Policymakers Know That NAIRU Is Likely At Or Below 4%
Policymakers Know That NAIRU Is Likely At Or Below 4%
Policymakers Know That NAIRU Is Likely At Or Below 4%
Today, the environment is quite different, because the acceleration in wage growth at the tail end of the last expansion gives policymakers and investors a good estimate of where NAIRU is. Chart II-15 highlights that wage growth accelerated in 2018/2019 in response to a sub-4% unemployment rate, which is consistent with both the Fed’s NAIRU estimate of 3.5-4.5% and Fed Vice Chair Richard Clarida’s expressed view that a 3.8% unemployment rate likely constitutes maximum employment (barring any issues with the breadth and inclusivity of the labor market recovery). It is possible that the pandemic has structurally lowered potential output, which could mean that policymakers may no longer rely on the wage growth / unemployment relationship that existed in the latter phase of the last expansion. However, we do not find any credible arguments that would support the notion of a structurally lower level of potential output: the pandemic is likely to end at some point in the not-too-distant future, the negative impact of working-from-home policies on office properties and employment in central business districts is not sizeable,3 and productivity may have permanently increased in some industries because of the likely stickiness of a hybrid work culture. The Behavior Of Inflation Expectations Chart II-16Rising Long-Term Expectations Have Merely Normalized (For Now)
Rising Long-Term Expectations Have Merely Normalized (For Now)
Rising Long-Term Expectations Have Merely Normalized (For Now)
One parallel to the argument that policymakers may have underestimated the degree of labor market tightness in the 1960s and early 1970s is the fact that they did not yet understand that inflation expectations are an important determinant of actual inflation, nor were they able to monitor them even if they did. Most credible surveys of inflation expectations began in the 1980s, and policymakers in the 1960s and 1970s were guided by the original Phillips Curve that solely related inflation to unemployment. Today, policymakers have the experience of the stagflationary episode to serve as a warning not to allow inflation expectations to get out of control, and both policymakers and investors have reliable measures of inflation expectations for households and market-participants. Chart II-16 highlights that households expect significant inflation over the coming year, but also expect prices over the longer term to rise at a pace that is almost exactly in line with their average from 2000-2014. The Rudd Controversy: (Adaptive) Inflation Expectations Do Matter One potential criticism of the idea that inflation expectations are signaling a low risk of higher future inflation has emerged through arguments made by Jeremy Rudd, a Federal Reserve economist. In a recent paper, Rudd questioned the view that households’ and firms’ expectations of future inflation are a key determinant of actual inflation; he suggested instead that relatively stable inflation since the mid-1990s might reflect a situation in which inflation simply does not enter workers’ employment decisions and expectations are irrelevant. Rudd’s paper was primarily addressed to policymakers who view inflation dynamics in a highly quantitative light. A full response to the paper would be mostly academic and thus not especially relevant to investors; however, we would like to highlight three points related to the Rudd piece that we feel are important.4 First, we disagree with Rudd’s argument that the trend in inflation has not responded to changes in economic conditions since the mid-1990s. Chart II-17 highlights that while the magnitude of the relationship has shifted, the trend in inflation relative to a measure of long-term expectations based on prior actual inflation has mimicked that of the output gap. The fact that inflation was (ironically) too high during the early phase of the last economic cycle provides some support for Rudd’s inflation responsiveness view, although we would still point toward the Fed’s strong record of maintaining low and stable inflation, its active communication with the public in the years following the global financial crisis, and the fact that a recovery began and the output gap began to (slowly) close as the best explanation for the avoidance of deflation during that period. Second, we agree with Rudd’s point that regime shifts in inflation’s responsiveness to economic conditions can occur, and that adaptive measures of inflation expectations, and even surveys of inflation, may not capture such a shift in real time. Chart II-18 shows that the 2014-2016 period was a good example of this, when adaptive expectations as well as household survey measures of long-term inflation expectations both lagged the actual decline in inflation that was caused by a collapse in the price of oil. Chart II-17The Trend In Inflation Continues To Respond To Economic Conditions
The Trend In Inflation Continues To Respond To Economic Conditions
The Trend In Inflation Continues To Respond To Economic Conditions
Chart II-18Surveyed Inflation Expectations Can Lag, But This Time They Led
Surveyed Inflation Expectations Can Lag, But This Time They Led
Surveyed Inflation Expectations Can Lag, But This Time They Led
But Chart II-18 also shows that long-term household survey measures of inflation led the rise in actual inflation (and thus our adaptive expectations measure) last year, underscoring that these measures are likely more reliable indicators today of whether a major regime shift is occurring. As noted above, long-term expectations have risen significantly relative to what prevailed prior to the pandemic, but this has merely raised expectations from extraordinarily depressed levels back to the average that prevailed prior to (and immediately after) the global financial crisis. Therefore, household expectations are not yet at dangerous levels. Chart II-19Unit Labor Costs Modestly Lead Inflation, But Are Far From Extreme
Unit Labor Costs Modestly Lead Inflation, But Are Far From Extreme
Unit Labor Costs Modestly Lead Inflation, But Are Far From Extreme
Third, one of the core observations in Rudd’s paper is that unit labor cost (ULC) growth leads the trend in inflation, which he argued was evidence against the idea that expectations of future inflation are a key determinant of actual inflation. Chart II-19 highlights that Rudd is correct that ULC growth modestly leads inflation (especially core inflation), but we disagree with his conclusion that it argues against the importance of expectations. As we noted in Section 2 of our January 2021 Bank Credit Analyst,5 one crucial aspect of the expectations-augmented, or “modern-day” Phillips Curve is that, if inflation expectations are largely formed based on the experience of past inflation, then inflation is ultimately determined by three dimensions of the output gap: whether it is rising or falling, whether it is above or below zero, and how long it has been above or below zero. Our view is that ULC growth is fundamentally linked to slack in the labor market, which is directly incorporated in output gap measures. As we noted above, investors currently have a good estimate of the magnitude of the output/employment gap, meaning that it is possible to track the inflationary consequences of prevailing aggregate demand. As a final point about ULC growth, Chart II-19 highlights that while the five-year CAGR of unit labor costs is currently running at its strongest pace since the global financial crisis, investors should note that it remains well below the levels that prevailed in the late-1960s when persistently above-potential output laid the groundwork for a massive inflationary overshoot. Conclusions And Investment Strategy Our review of the 1960s and 1970s highlights that stagflation is a phenomenon in which supply-side shocks raise prices of key inputs to production, which lowers output and raises unemployment. Energy price shocks in the 1970s occurred after a long period of policy-driven above-trend growth in the 1960s, meaning that both demand-pull and cost-push inflation contributed to stagflation in the 1970s. Today, investors cannot rule out the possibility of a stagflationary outcome, for four reasons: long-term household inflation expectations have risen significantly over the past year; fiscal policy has been very expansionary; monetary policy will remain expansionary at the Fed’s projected terminal Fed funds rate; and component shortages and price increases linked to energy market and supply chain disruptions may persist or worsen over the coming year. Chart II-20It Is Not Stagflation If The Unemployment Rate Continues To Fall
It Is Not Stagflation If The Unemployment Rate Continues To Fall
It Is Not Stagflation If The Unemployment Rate Continues To Fall
However, the strong demand-pull inflationary dynamics that existed in the late-1960s were mostly absent in the lead-up to the pandemic, supply-chain issues are in part the result of strong goods demand and disruptions that are clearly linked to the pandemic (and thus will eventually dissipate), and long-term inflation expectations are behaving differently than short-term expectations, signaling that economic agents do not expect severe price pressures to persist beyond the pandemic. Policymakers also have more visibility about the magnitude of economic / labor market slack than they did during the stagflationary era and better tools to track inflation expectations. On balance, this points to a stagflationary outcome over the coming 6-24 months as a risk, but not as a likely event. Using the Misery Index as real-time stagflation indicator, investors should note that the US economy is not likely experiencing true stagflation unless the unemployment rate rises. Chart II-20 highlights that there is no evidence yet of a contraction in goods-producing or service-producing jobs. Even if goods-producing employment slows meaningfully over the coming few months as a result of component shortages, the unemployment rate is still likely to fall if services spending normalizes, as it would imply that the gap in services-producing employment, which is currently 20% of the level of pre-pandemic goods-producing employment, will continue to close. Investors have been focused on the issue of stagflation because its occurrence would imply a sharply negative correlation between stock prices and bond yields. This is not our base case view, but we have highlighted that months with negative returns from both stocks and long-maturity bonds tend to be associated with periods of monetary policy tightening (or in anticipation of such periods). As we discussed in Section 1 of our report, we do expect the Fed to raise interest rates next year. We do not see a rise in bond yields to levels implied by the Fed’s interest rates projections as being seriously threatening to economic activity, corporate earnings growth, or equity multiples. But the adjustment to higher long-maturity bond yields may unnerve equity investors for a time, implying temporary periods of a negative stock price / bond yield correlation. Table II-2 highlights that, since 1980, commodities, the US dollar, and the Swiss franc have typically earned positive returns during non-recessionary months in which stock and long-maturity bond returns are negative. While the dollar is not likely to perform well in a stagflationary scenario, Chart II-21 highlights that CHF-USD and industrial commodities performed quite well in the late-1970s. As such, a portfolio of these three assets might serve as a useful hedge for investors who are concerned about absolute return prospects in a world in which long-maturity bond yields are rising and risks of stagflationary dynamics are present.
Chart II-
Chart II-21The Swiss Franc and Raw Industrials Did Well During The Stagflationary Era
The Swiss Franc and Raw Industrials Did Well During The Stagflationary Era
The Swiss Franc and Raw Industrials Did Well During The Stagflationary Era
Jonathan LaBerge, CFA Vice President The Bank Credit Analyst Footnotes 1 “Summers Sees ‘Least Responsible’ Fiscal Policy in 40 Years,” Bloomberg News, March 20, 2021. 2 Please see The Bank Credit Analyst “R-star, And The Structural Risk To Stocks,” dated March 31, 2021, available at bca.bcaresearch.com 3 Please see The Bank Credit Analyst “Work From Home “Stickiness” And The Outlook For Monetary Policy,” dated June 24, 2021, available at bca.bcaresearch.com 4 Rudd, Jeremy B. (2021). “Why Do We Think That Inflation Expectations Matter for Inflation? (And Should We?),” Finance and Economics Discussion Series 2021-062. Washington: Board of Governors of the Federal Reserve System. 5 Please see The Bank Credit Analyst “The Modern-Day Phillips Curve, Future Inflation, And What To Do About It,” dated December 18, 2021, available at bca.bcaresearch.com